Embed Size (px)
Citation preview
Bexhill Stage 1 Surface Water Management Plan
Final
June 2016
East Sussex County Council
County Hall
St Anne's Crescent
LEWES
East Sussex
BN7 1UE
2015s3262 Bexhill Stage 1 SWMP (v2 June 2016).docx i
JBA Project Manager Jennifer Hill JBA Consulting 35 Perrymount Road Haywards Heath West Sussex RH16 3BW
Revision History
Revision Ref / Date Issued Amendments Issued to
Draft v1 / December 2015 Nick Claxton
Final v2 / June 2016 Address comments by ESCC Nick Claxton and Revai Kinsella
Contract This report describes work commissioned by Nick Claxton, on behalf of East Sussex County Council, by an email dated 1st September 2015. East Sussex County Council’s representative for the contract was Nick Claxton. Jenny Hill and Zoë Parsons of JBA Consulting carried out this work.
Prepared by .................................................. Jennifer Hill BSc MSc
Senior Analyst
Reviewed by ................................................. Rachel Huitson-Little MSc CEnv MCIWEM C.WEM
Director
Purpose This document has been prepared as a Final Report for East Sussex County Council. JBA Consulting accepts no responsibility or liability for any use that is made of this document other than by the Client for the purposes for which it was originally commissioned and prepared.
JBA Consulting has no liability regarding the use of this report except to East Sussex County Council.
Acknowledgements JBA would like to acknowledge and thank Rother District Council, Southern Water, the Environment Agency and East Sussex County Council for all their assistance during this project.
2015s3262 Bexhill Stage 1 SWMP (v2 June 2016).docx ii
Executive Summary A Surface Water Management Plan (SWMP) is a study to understand the flood risk that arises from local flooding, which is defined by the Flood and Water Management Act 2010 as flooding from surface runoff, groundwater and ordinary watercourses.
SWMPs are led by a partnership of flood risk management authorities who have responsibilities for aspects of local flood risk, including the County Council, Local Authority, the Environment Agency, Sewerage Undertaker, Internal Drainage Boards and other relevant authorities.
East Sussex County Council as the Lead Local Flood Authority (LLFA) has led the production of the Bexhill Stage 1 SWMP in partnership with Rother District Council, the Environment Agency and Southern Water. These organisations are members of a steering group which was established as part of the SWMP process. Monitoring and reporting of the implementation of the SWMP action plan will be undertaken locally, and it is expected that partners will take forward actions independently, and convene as and when appropriate.
Bexhill-on-Sea (also known as Bexhill) is a historic town in East Sussex, on the south coast of England, the largest within the Rother District. The estimated population in 2014 was 43,714 people1 in an area of 32km2. The surrounding area is predominantly rural arable land with dispersed settlements and the Pevensey Levels border Bexhill on both the east and west fringes of the town.
The project partners supplied all the available data on recorded incidents of flooding together with any modelling of flood risk.
To better understand the flood risk in Bexhill, a Source-Pathway-Receptor model was applied. The application of such a model facilitates flood risk mitigation by potentially addressing the source (often very difficult), blocking or altering the pathway and even removing the receptor e.g. navigate development away.
Hotspots have been identified where there are repeated flood incidents and/or multiple flood mechanisms along with areas of predicted flood risk. The hotspots identified are
Collington Wood;
Bexhill Down;
Greenleigh Park;
Picknell Green Stream;
Sidley;
Pebsham; and
Egerton Stream.
Within these hotspots, a number of drainage assets have been identified. These have been partially mapped as part of the SWMP, however, as many of these are culverts, the exact route is difficult to determine without specialist survey. Flood risk assets include the drainage ditches on Turkey Road and potentially two culverted watercourses where historically open channels flowed, one near Collington Wood and the other on Bexhill Down.
The flood history and risk data has been used to draw up three action plans to manage the local flood risk. Each of these action plans operate at a different scale, with the generic action plan relevant to all of Bexhill, the hotspot action plan relevant to the identified hotspots, and the incident specific action plan relating to individual flood incidents reported.
Prioritised actions in Bexhill include
asset inspection and documentation of flood risk assets;
maintenance of drainage ditches on Turkey Road; and
detailed flood risk mapping and options appraisal for Westcourt Drive, Sutherland Avenue and Turkey Road hotspots.
1 Rother District Council (2014) Rother Local Plan: Core Strategy.
Contents
2015s3262 Bexhill Stage 1 SWMP (v2 June 2016).docx
Executive Summary .......................................................................................................... ii
1 Introduction .......................................................................................................... 1
1.1 What is a Surface Water Management Plan? ....................................................... 1 1.2 Summary of aim and objectives ............................................................................ 1 1.3 Stages of SWMP development .............................................................................. 2 1.4 Sources of flood risk .............................................................................................. 2 1.5 Study area ............................................................................................................. 6
2 Preparation ........................................................................................................... 9
2.1 Partnership approach ............................................................................................ 9 2.2 Data collation and review....................................................................................... 9
3 Strategic Assessment ......................................................................................... 12
3.1 Flood history .......................................................................................................... 12 3.2 Flood risk ............................................................................................................... 16 3.3 Hotspots ................................................................................................................. 19
4 Planning ................................................................................................................ 34
4.1 Using SuDS .......................................................................................................... 34 4.2 Local development framework ............................................................................... 35 4.3 Development areas in hotspots ............................................................................. 36 4.4 Constraints on future developments ...................................................................... 37
5 SWMP action plan ................................................................................................ 38
5.1 Monitoring the action plan...................................................................................... 38 5.2 Communicating the action plan ............................................................................. 38 5.3 Generic action plan ................................................................................................ 38 5.4 Hotspots action plan .............................................................................................. 39 5.5 Incident specific actions ......................................................................................... 41 5.6 Way forward ........................................................................................................... 41
A Appendix A - Data Quality Score ....................................................................... i
B Appendix B - Flood History Table ...................................................................... ii
C Appendix C - Quantifying Surface Water Flood Risk ....................................... xii
D Appendix D - Incident specific action plan ....................................................... xiv
2015s3262 Bexhill Stage 1 SWMP (v2 June 2016).docx
List of Figures Figure 1-1 A map to identify the watercourses in Bexhill. .................................................. 3
Figure 1-2: A map to identify topographic catchments in Bexhill ....................................... 4
Figure 1-3: Conceptualisation of the integration of flooding mechanisms. ........................ 6
Figure 1-4: A map of the underlying Geology of Bexhill .................................................... 7
Figure 3-1: Recorded flood incidents in Bexhill ................................................................. 15
Figure 3-2: Main River flood risk ........................................................................................ 16
Figure 3-3: uFMfSW in Bexhill. .......................................................................................... 17
Figure 3-4: Frism output for the number of residential receptors affected by surface water flooding at a 1 in 1000 year return period. .............................................. 18
Figure 3-5: Groundwater flood risk in Bexhill..................................................................... 19
Figure 3-6: Hotspots identified in Bexhill ........................................................................... 21
Figure 3-7: Tukey Road hotspot ........................................................................................ 22
Figure 3-8: Photography of blocked culvert inlet at Turkey Road ..................................... 23
Figure 3-9: De La Warr Hotspot ........................................................................................ 24
Figure 3-10: Peartree Lane hotspot ................................................................................... 25
Figure 3-11: Buxton Drive hotspot ..................................................................................... 26
Figure 3-12: Westcourt Drive hotspot ................................................................................ 27
Figure 3-13: Sutherland Avenue hotspot ........................................................................... 28
Figure 3-14: Hastings Road hotspot .................................................................................. 29
Figure 3-15: Richmond Road hotspot ................................................................................ 30
Figure 3-16: Long Avenue hotspot .................................................................................... 31
Figure 3-17: Bexhill Hospital hotspot ................................................................................. 32
Figure 3-18: Downlands Avenue ....................................................................................... 33
Figure 4-1: Strategic development sites in Bexhill ............................................................ 35
Figure 4-2: Areas of constraints to developments ............................................................. 37
Figure 5-1: Hotspot action plan ......................................................................................... 39
List of Tables Table 2-1: Catchment data and data supplier. .................................................................. 9
Table 2-2: Flood risk modelling data and supplier ............................................................. 10
Table 2-3: Flood history data and supplier ........................................................................ 10
Table 2-4: Data quality scoring system ............................................................................. 11
Table 2-5: Received data and allocated quality score ....................................................... 11
Table 3-1: Reported flood sources .................................................................................... 12
Table 3-2: Number of receptors in Bexhill at risk from surface water flooding .................. 18
Table 3-3: Flooding hotspots in Bexhill .............................................................................. 20
Table 4-1: Strategic development areas allocated in Bexhill ............................................. 36
Table 4-2: Flood risk to development sites ........................................................................ 36
Table 5-1: List of action plans ............................................................................................ 38
2015s3262 Bexhill Stage 1 SWMP (v2 June 2016).docx
Abbreviations AStGWF .......................... Areas Susceptible to Groundwater Flooding
AStSWF .......................... Areas Susceptible to Surface Water Flooding
BGS ................................ British Geological Society
CCTV .............................. Close Circuit Television
DRN ................................ Detailed River Network
ESCC .............................. East Sussex County Council
ESI .................................. Environmental Simulations International Limited
FMfSW ............................ Flood Map for Surface Water
GIS .................................. Geographical Information Systems
IAS .................................. Impermeable Area Survey
IDB .................................. Internal Drainage Board
IDD .................................. Internal Drainage District
JBA ................................. Jeremy Benn Associates
LFRMS ............................ Local Flood Risk Management Strategy
LLFA ............................... Lead Local Flood Authority
NRD ................................ National Receptor Database
PEM ................................ Public Enquiry Manager
RMA ................................ Risk Management Authority
SFRA .............................. Strategic Flood Risk Assessment
SHLAA ............................ Strategic Housing Land Availability Assessment
SIRF ................................ Sewer Incident Report Form
SSSI ................................ Site of Special Scientific Interest
SuDS ............................... Sustainable Drainage Systems
SWMP ............................. Surface Water Management Plan
uFMfSW .......................... updated Flood Map for Surface Water
2015s3262 Bexhill Stage 1 SWMP (v2 June 2016).docx 1
1 Introduction
1.1 What is a Surface Water Management Plan?
A Surface Water Management Plan (SWMP) is a study to understand the flood risk that arises from local flood risk, which is defined by the Flood and Water Management Act 2010 as flooding from surface runoff, groundwater, and ordinary watercourses.
SWMPs are led by a partnership of flood risk management authorities who have responsibilities for aspects of local flooding, including the County Council, District Council, Sewerage Undertaker, Internal Drainage Boards and other relevant authorities.
The purpose of a SWMP is to identify what the local flood risk issues are, the potential options to manage the flood risk or the damage caused and who should take these options forward. This is presented in an action plan which lists the partners who are responsible for taking the various actions forward. The action plan, which will be reviewed periodically, should be agreed by all project partners to manage the flood risk identified.
Bexhill has been identified as an area potentially at risk of local flooding in the East Sussex Local Flood Risk Management Strategy (LFRMS). Therefore, this SWMP was commissioned by East Sussex County Council (ESCC) to investigate the local flood risks across the urban centre of Bexhill as part of its remit for strategic oversight of local flood risk management in East Sussex, under the Flood and Water Management Act 2010. It builds on an initial assessment completed by Atkins in 2013.
1.2 Summary of aim and objectives
The aims and objectives of the Bexhill Stage 1 SWMP are as follows:
1. Establishment of a local partnership
2. The consolidation of a comprehensive flood history for all relevant local flood risk sources
3. The identification, collation and mapping of all available flood data and its availability for future use, including an assessment of the reliability of the data
4. The identification, where possible from the available data, of flood-prone areas
5. The identification of areas where existing data may be missing, compromised or unreliable as a consequence of inappropriate local assumptions, additional local features (such as flood barriers) or for any other reason together with options to improve confidence in the overall outcome
6. The identification of areas where flood risk originates from a combination of sources (for example from rivers and highway run-off)
7. Identification of any proposed or allocated developments within the study area together with the likely impact on flood risk that they may have
8. The preparation of source pathway receptor models for all known incidents, risks, sources and flood-prone areas that have been identified
9. Where appropriate, the identification of any “easy win” opportunities that may become apparent without further detailed risk assessment
10. To provide the relevant local planning authorities with data in a form to support the review of strategic flood risk assessments
11. To provide a clear plan for further work that may be considered necessary to manage or improve clarity of the flood risks identified in the report. These should include, but are not limited to, ownership of the actions required for risk mitigation, a timescale for these actions together with indicative capital costs
2015s3262 Bexhill Stage 1 SWMP (v2 June 2016).docx 2
1.3 Stages of SWMP development
The SWMP has been prepared across a series of three phases, as follows:
Preparation: Building a partnership approach to local flood risk management through integrated working between the risk management authorities (RMAs). Gathering evidence of and information about flooding.
Risk Assessment: An initial assessment to determine the highest risk locations and the key issues upon which the action plan should focus. We will be using publicly available datasets in combination with local records of flooding to inform this assessment.
Action Plan: Preparation of an action plan that recommends a range of actions for the management of flood risk across the SWMP area. The action plan will
o outline the actions required and where and how they should be undertaken;
o set out which partner(s) or stakeholder(s) is/are responsible for implementing the actions and who will support them; and
o identify priorities.
1.4 Sources of flood risk
One of the purposes of a SWMP is to identify what the local flood risk issues are, and to summarise the flood history and predicted flood risk to the area. Flood risk can arise from a number of sources, as listed within this section.
1.4.1 Watercourses
Main river
A main river is any watercourse which is designated as such on the Environment Agency's main river map, and for which the Environment Agency has responsibilities and powers. Main rivers are generally the larger arterial watercourses but smaller watercourses can be designated if they pose a significant flood risk. Where fluvial or tidal flooding from main rivers is the sole source of flooding, it is the responsibility of the Environment Agency. Actions to mitigate fluvial flooding from main rivers are outside the scope of a SWMP, and are addressed in a Catchment Flood Management Plan and Flood Risk Management Plan, or other local more detailed studies. However, consideration of main river flooding should be made in SWMPs to examine how fluvial flooding interacts with other, local flood sources.
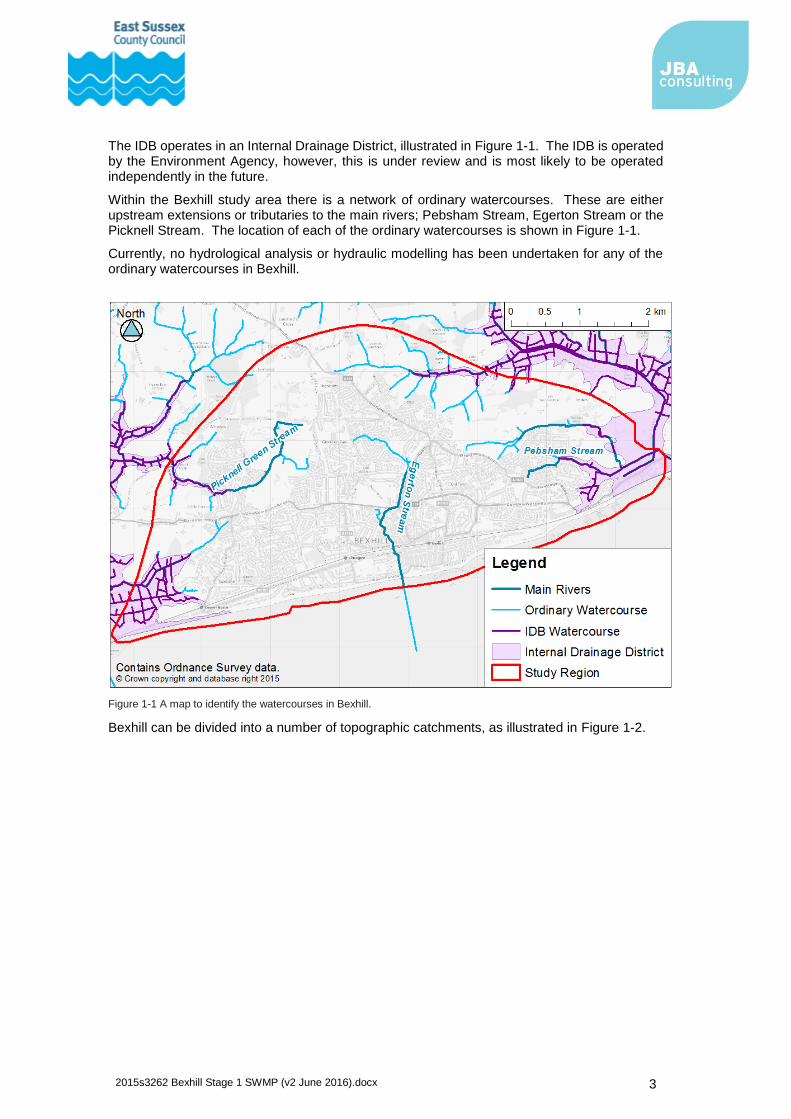
There are three main rivers in Bexhill; Pebsham Stream, Egerton Stream and Picknell Green Stream. The Pebsham Stream flows from west to east around the eastern extent of Bexhill and on towards Combe Haven. The Picknell Green Stream flows east to west though a residential estate in Bexhill and on to the Pevensey Levels. Egerton Stream flows north to south through the centre of Bexhill. A map showing the location of these watercourses is illustrated in Figure 1-1.
As Bexhill is a seaside town, the tide would naturally impact fluvial water levels. However, the Egerton Stream discharges to the sea via a flap valve from a culvert. This prevents tidal ingress to the fluvial system but it does mean that the Egerton Stream can become tide locked, preventing fluvial discharge and causing some backing up.
The Pebsham Stream and Picknell Green Stream both discharge to the sea outside of the study area and via tidal flats.
Ordinary watercourse
An ordinary watercourse is a statutory type of watercourse in England and Wales. They include rivers, streams, ditches and drains which do not form part of a main river. Rother District Council and the Internal Drainage Board (IDB) have permissive powers to carry out works on ordinary watercourses. However only ESCC and the IDB are responsible for consenting and enforcing works on ordinary watercourses
2015s3262 Bexhill Stage 1 SWMP (v2 June 2016).docx 3
The IDB operates in an Internal Drainage District, illustrated in Figure 1-1. The IDB is operated by the Environment Agency, however, this is under review and is most likely to be operated independently in the future.
Within the Bexhill study area there is a network of ordinary watercourses. These are either upstream extensions or tributaries to the main rivers; Pebsham Stream, Egerton Stream or the Picknell Stream. The location of each of the ordinary watercourses is shown in Figure 1-1.
Currently, no hydrological analysis or hydraulic modelling has been undertaken for any of the ordinary watercourses in Bexhill.
Figure 1-1 A map to identify the watercourses in Bexhill.
Bexhill can be divided into a number of topographic catchments, as illustrated in Figure 1-2.
2015s3262 Bexhill Stage 1 SWMP (v2 June 2016).docx 4
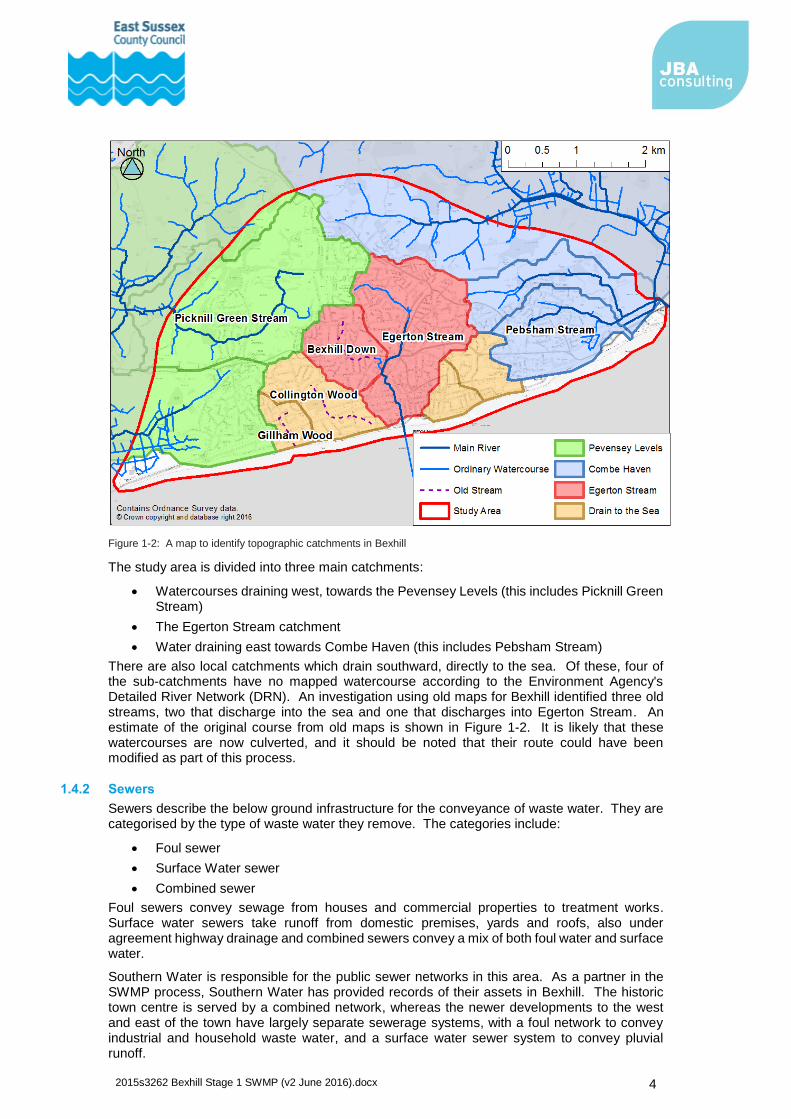
Figure 1-2: A map to identify topographic catchments in Bexhill
The study area is divided into three main catchments:
Watercourses draining west, towards the Pevensey Levels (this includes Picknill Green Stream)
The Egerton Stream catchment
Water draining east towards Combe Haven (this includes Pebsham Stream)
There are also local catchments which drain southward, directly to the sea. Of these, four of the sub-catchments have no mapped watercourse according to the Environment Agency's Detailed River Network (DRN). An investigation using old maps for Bexhill identified three old streams, two that discharge into the sea and one that discharges into Egerton Stream. An estimate of the original course from old maps is shown in Figure 1-2. It is likely that these watercourses are now culverted, and it should be noted that their route could have been modified as part of this process.
1.4.2 Sewers
Sewers describe the below ground infrastructure for the conveyance of waste water. They are categorised by the type of waste water they remove. The categories include:
Foul sewer
Surface Water sewer
Combined sewer
Foul sewers convey sewage from houses and commercial properties to treatment works. Surface water sewers take runoff from domestic premises, yards and roofs, also under agreement highway drainage and combined sewers convey a mix of both foul water and surface water.
Southern Water is responsible for the public sewer networks in this area. As a partner in the SWMP process, Southern Water has provided records of their assets in Bexhill. The historic town centre is served by a combined network, whereas the newer developments to the west and east of the town have largely separate sewerage systems, with a foul network to convey industrial and household waste water, and a surface water sewer system to convey pluvial runoff.
2015s3262 Bexhill Stage 1 SWMP (v2 June 2016).docx 5
In addition, there are a number of private surface water sewerage systems in Bexhill. Particularly in and around the town centre. The maintenance of these assets falls to the land owner.
This study concentrates mainly on surface water and combined sewer networks. The performance of these drainage networks relates directly to the proportion of rainfall which forms pluvial runoff and the inflow into ordinary watercourses from the surface water drainage network.
Sewer flooding from the foul water network is the sole responsibility of Southern Water. However, foul water flooding has been considered in the SWMP to examine interactions between foul sewer surcharge and other, local flood sources. A storm response on a foul water sewer network is often caused by misconnections of surface water to foul sewers. Therefore, addressing the surface water issues in the catchment can, in some cases, help relieve problems on the foul water network.
Overloaded foul and combined sewer networks can result in sewer overflows which can present potential water quality and public health issues. Although water quality is not the principal driver for this project, a SWMP should provide a framework for improving the quality of water within the area. As a result, some actions resulting from this SWMP are likely to improve the water quality in Bexhill.
1.4.3 Surface water
Surface water flooding occurs when rainfall fails to infiltrate to the ground or enter the drainage system. Ponding generally occurs at low points in the topography. The likelihood of flooding is dependent on not only the rate of runoff but also saturation of the receiving soils, the groundwater levels and the condition of the surface water drainage system (i.e. surface water sewers, ESCC highway authority drains and gullies, open channels, ordinary watercourses and SuDS).
1.4.4 Climate change
There is still considerable uncertainty regarding the localised impact of climate change, but it is likely that the risk of flooding will increase under a climate change scenario. This increased risk could manifest itself as more frequent flooding, increase in flood extent and an increase in flood depth.
Climate change is predicted to increase rainfall intensity in the future by up to 40%2 under the range of allowances published by the Environment Agency. This will increase the likelihood and frequency of surface water flooding, particularly in impermeable urban areas such as Bexhill.
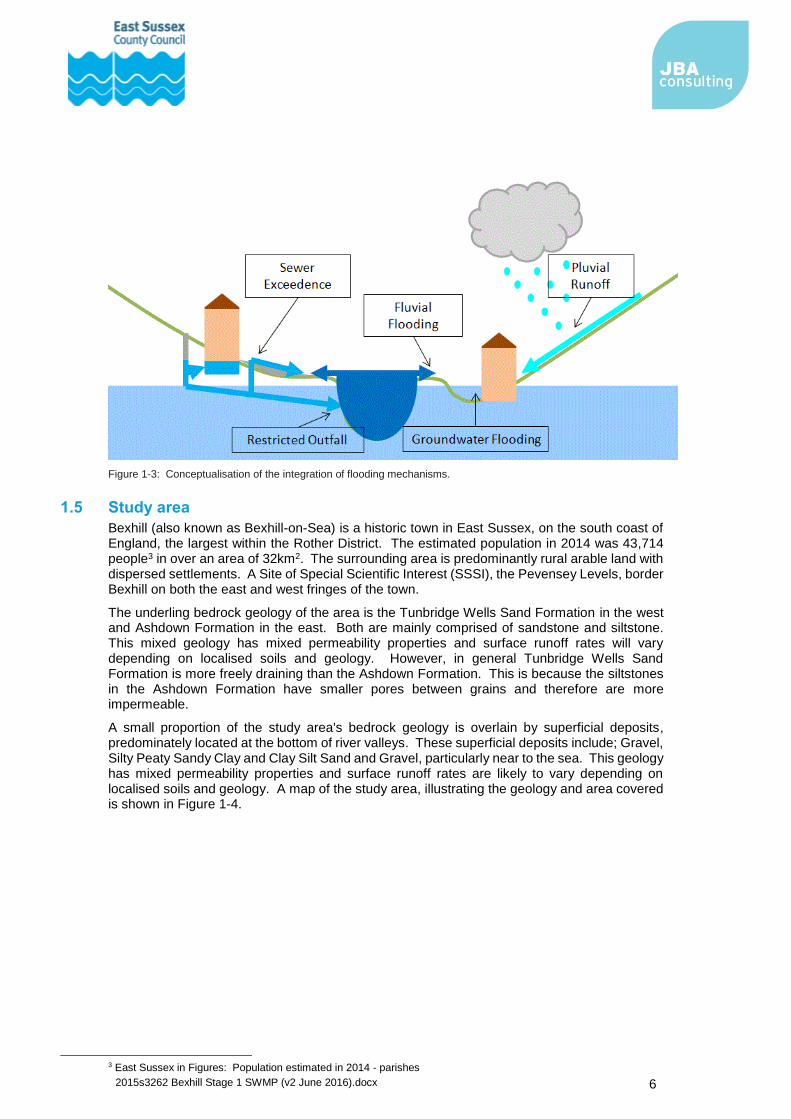
1.4.5 Integrated flood risk
In an urban environment such as Bexhill, flooding mechanisms are often closely integrated. The flood mechanisms that operate in Bexhill and how they interact has been conceptualised in Figure 1-3.
2 https://www.gov.uk/guidance/flood-risk-assessments-climate-change-allowances
2015s3262 Bexhill Stage 1 SWMP (v2 June 2016).docx 6
Figure 1-3: Conceptualisation of the integration of flooding mechanisms.
1.5 Study area
Bexhill (also known as Bexhill-on-Sea) is a historic town in East Sussex, on the south coast of England, the largest within the Rother District. The estimated population in 2014 was 43,714 people3 in over an area of 32km2. The surrounding area is predominantly rural arable land with dispersed settlements. A Site of Special Scientific Interest (SSSI), the Pevensey Levels, border Bexhill on both the east and west fringes of the town.
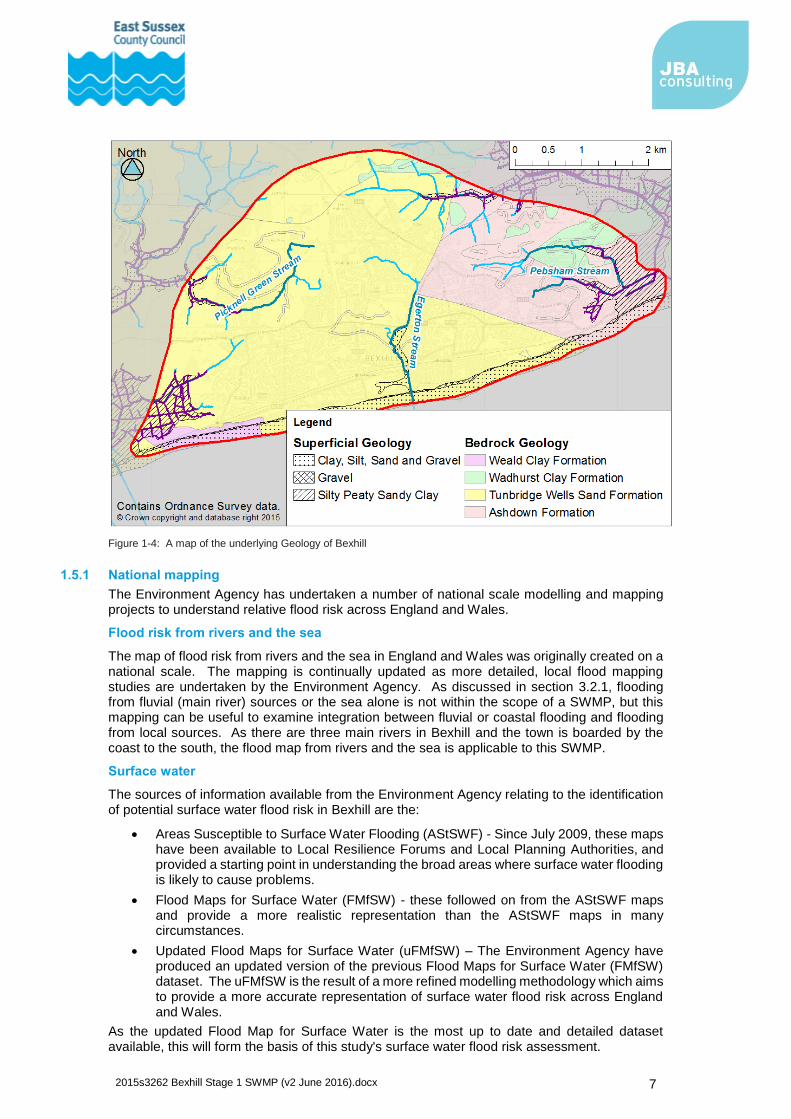
The underling bedrock geology of the area is the Tunbridge Wells Sand Formation in the west and Ashdown Formation in the east. Both are mainly comprised of sandstone and siltstone. This mixed geology has mixed permeability properties and surface runoff rates will vary depending on localised soils and geology. However, in general Tunbridge Wells Sand Formation is more freely draining than the Ashdown Formation. This is because the siltstones in the Ashdown Formation have smaller pores between grains and therefore are more impermeable.
A small proportion of the study area's bedrock geology is overlain by superficial deposits, predominately located at the bottom of river valleys. These superficial deposits include; Gravel, Silty Peaty Sandy Clay and Clay Silt Sand and Gravel, particularly near to the sea. This geology has mixed permeability properties and surface runoff rates are likely to vary depending on localised soils and geology. A map of the study area, illustrating the geology and area covered is shown in Figure 1-4.
3 East Sussex in Figures: Population estimated in 2014 - parishes
2015s3262 Bexhill Stage 1 SWMP (v2 June 2016).docx 7
Figure 1-4: A map of the underlying Geology of Bexhill
1.5.1 National mapping
The Environment Agency has undertaken a number of national scale modelling and mapping projects to understand relative flood risk across England and Wales.
Flood risk from rivers and the sea
The map of flood risk from rivers and the sea in England and Wales was originally created on a national scale. The mapping is continually updated as more detailed, local flood mapping studies are undertaken by the Environment Agency. As discussed in section 3.2.1, flooding from fluvial (main river) sources or the sea alone is not within the scope of a SWMP, but this mapping can be useful to examine integration between fluvial or coastal flooding and flooding from local sources. As there are three main rivers in Bexhill and the town is boarded by the coast to the south, the flood map from rivers and the sea is applicable to this SWMP.
Surface water
The sources of information available from the Environment Agency relating to the identification of potential surface water flood risk in Bexhill are the:
Areas Susceptible to Surface Water Flooding (AStSWF) - Since July 2009, these maps have been available to Local Resilience Forums and Local Planning Authorities, and provided a starting point in understanding the broad areas where surface water flooding is likely to cause problems.
Flood Maps for Surface Water (FMfSW) - these followed on from the AStSWF maps and provide a more realistic representation than the AStSWF maps in many circumstances.
Updated Flood Maps for Surface Water (uFMfSW) – The Environment Agency have produced an updated version of the previous Flood Maps for Surface Water (FMfSW) dataset. The uFMfSW is the result of a more refined modelling methodology which aims to provide a more accurate representation of surface water flood risk across England and Wales.
As the updated Flood Map for Surface Water is the most up to date and detailed dataset available, this will form the basis of this study's surface water flood risk assessment.
2015s3262 Bexhill Stage 1 SWMP (v2 June 2016).docx 8
Groundwater
Two sources of data were provided by ESCC relating to the identification of potential groundwater flood risk in Bexhill. This included data from Areas Susceptible to Ground Water Flooding (AStGWF) and Environmental Simulations International Limited (ESI) Groundwater Flood Risk Map.
AStGWF are identified in a 1 kilometre square grid of England and Wales. It shows the proportion of each grid square where the geological and hydrogeological conditions show that groundwater might emerge4.
The ESI Groundwater Flood Risk Map provides classification of groundwater flooding risk in four categories in a 50 metre grid of England and Wales. The risk classifications of negligible, low, moderate and high represent the likelihood and severity of flooding resulting from extreme groundwater levels within an estimated 1 in 200 year return period.
The ESI Groundwater Flood Risk Map has been used in this SWMP as it the most detailed dataset available. In addition, East Sussex County Council have access to an areas susceptible to groundwater flooding dataset produced by the British Geological Society (BGS). This data has been referred to during the strategic assessment but cannot be reproduced in this report due to the licencing agreement with BGS.
2015s3262 Bexhill Stage 1 SWMP (v2 June 2016).docx 9
2 Preparation
2.1 Partnership approach
Within Bexhill, flood risk is managed by multiple agencies, including the County Council, the District Council, the Environment Agency and Southern Water. Often, urban flooding is caused by multiple mechanisms, which is the responsibility of different organisations. Therefore, a holistic approach is required to manage a flooding issue. As such, partnership working is a key emphasis in East Sussex's SWMP process.
To fully understand flood risk in Bexhill the SWMP collated all the available records of flood history and modelling of flood risk. This data has been collected from the project partners. The strategic assessment has been in part informed by this data. The assessment culminated with an action plan of next steps. This action plan attributes specific project partners as owners of the action. Again, the importance of partner engagement is crucial here so that agreed actions are followed through to completion.
The partnership approach also enables effective resource allocation and efficiencies to be achieved by sharing common duties between co-operating agencies.
2.1.1 Project partners
For the purpose of this project, partners are defined as organisations with responsibility for the decision that needs to be taken to manage flood risk. The partners involved in the Bexhill SWMP are:
East Sussex County Council
Rother District Council
Environment Agency
Southern Water
Internal Drainage Board (operated by the EA)
The project partners have supplied the data to inform this SWMP and have been attributed as action owners in Section 5; the SWMP action plan.
2.2 Data collation and review
Collectively, ESCC and JBA Consulting received data from each key partner in various forms.
The majority of the data was supplied as GIS points with associated attributes. As mapping is an effective method for communicating the risk, it was decided to keep the data in this format and add to the records with new data collected from other sources. The geo-spatial element of the data allowed for sensibility checking; for example, if fluvial flooding points are located near a watercourse.
The quality of the data was assessed and is summarised according to a scoring system which is based on the scoring from the SWMP technical guidance5. A full list of data and its associated score is located in Appendix A. In summary, catchment data has been provided by East Sussex County Council and the Environment Agency. A list of catchment data is displayed in Table 2-1.
East Sussex County Council Environment Agency
Bedrock and superficial deposits geology (under licence from BGS)
National Receptors Database (NRD)
Main river centreline
Gully point locations Detailed River Network (DRN)
Aquifer designation
Table 2-1: Catchment data and data supplier.
5 Defra (2010) Surface Water Management Plan Technical Guidance
2015s3262 Bexhill Stage 1 SWMP (v2 June 2016).docx 10
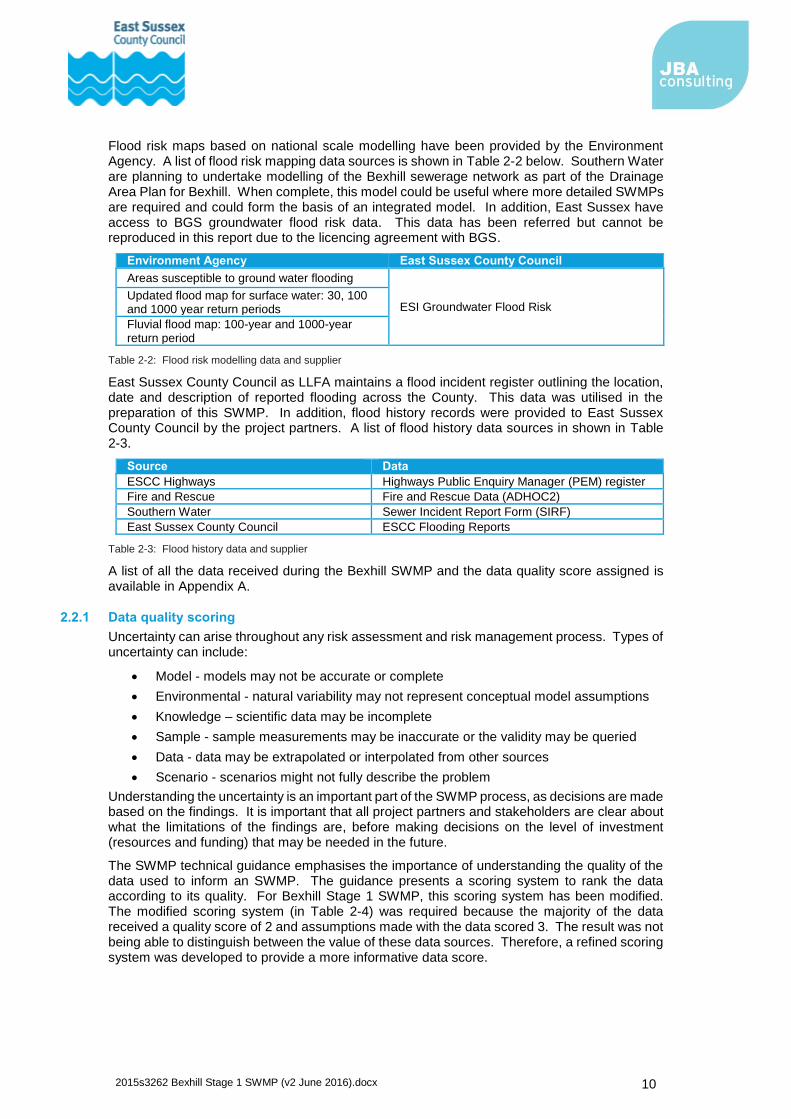
Flood risk maps based on national scale modelling have been provided by the Environment Agency. A list of flood risk mapping data sources is shown in Table 2-2 below. Southern Water are planning to undertake modelling of the Bexhill sewerage network as part of the Drainage Area Plan for Bexhill. When complete, this model could be useful where more detailed SWMPs are required and could form the basis of an integrated model. In addition, East Sussex have access to BGS groundwater flood risk data. This data has been referred but cannot be reproduced in this report due to the licencing agreement with BGS.
Environment Agency East Sussex County Council
Areas susceptible to ground water flooding
ESI Groundwater Flood Risk Updated flood map for surface water: 30, 100 and 1000 year return periods
Fluvial flood map: 100-year and 1000-year return period
Table 2-2: Flood risk modelling data and supplier
East Sussex County Council as LLFA maintains a flood incident register outlining the location, date and description of reported flooding across the County. This data was utilised in the preparation of this SWMP. In addition, flood history records were provided to East Sussex County Council by the project partners. A list of flood history data sources in shown in Table 2-3.
Source Data
ESCC Highways Highways Public Enquiry Manager (PEM) register
Fire and Rescue Fire and Rescue Data (ADHOC2)
Southern Water Sewer Incident Report Form (SIRF)
East Sussex County Council ESCC Flooding Reports
Table 2-3: Flood history data and supplier
A list of all the data received during the Bexhill SWMP and the data quality score assigned is available in Appendix A.
2.2.1 Data quality scoring
Uncertainty can arise throughout any risk assessment and risk management process. Types of uncertainty can include:
Model - models may not be accurate or complete
Environmental - natural variability may not represent conceptual model assumptions
Knowledge – scientific data may be incomplete
Sample - sample measurements may be inaccurate or the validity may be queried
Data - data may be extrapolated or interpolated from other sources
Scenario - scenarios might not fully describe the problem
Understanding the uncertainty is an important part of the SWMP process, as decisions are made based on the findings. It is important that all project partners and stakeholders are clear about what the limitations of the findings are, before making decisions on the level of investment (resources and funding) that may be needed in the future.
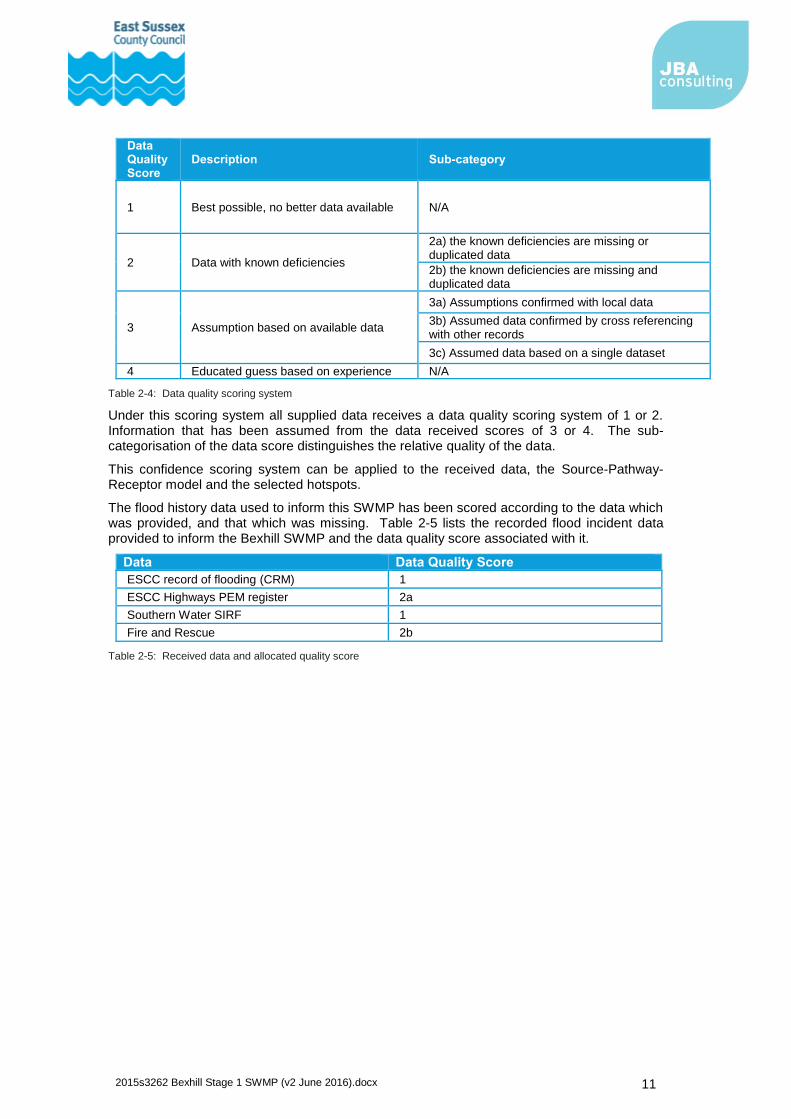
The SWMP technical guidance emphasises the importance of understanding the quality of the data used to inform an SWMP. The guidance presents a scoring system to rank the data according to its quality. For Bexhill Stage 1 SWMP, this scoring system has been modified. The modified scoring system (in Table 2-4) was required because the majority of the data received a quality score of 2 and assumptions made with the data scored 3. The result was not being able to distinguish between the value of these data sources. Therefore, a refined scoring system was developed to provide a more informative data score.
2015s3262 Bexhill Stage 1 SWMP (v2 June 2016).docx 11
Data Quality Score
Description Sub-category
1 Best possible, no better data available N/A
2 Data with known deficiencies
2a) the known deficiencies are missing or duplicated data
2b) the known deficiencies are missing and duplicated data
3 Assumption based on available data
3a) Assumptions confirmed with local data
3b) Assumed data confirmed by cross referencing with other records
3c) Assumed data based on a single dataset
4 Educated guess based on experience N/A
Table 2-4: Data quality scoring system
Under this scoring system all supplied data receives a data quality scoring system of 1 or 2. Information that has been assumed from the data received scores of 3 or 4. The sub-categorisation of the data score distinguishes the relative quality of the data.
This confidence scoring system can be applied to the received data, the Source-Pathway-Receptor model and the selected hotspots.
The flood history data used to inform this SWMP has been scored according to the data which was provided, and that which was missing. Table 2-5 lists the recorded flood incident data provided to inform the Bexhill SWMP and the data quality score associated with it.
Data Data Quality Score
ESCC record of flooding (CRM) 1
ESCC Highways PEM register 2a
Southern Water SIRF 1
Fire and Rescue 2b
Table 2-5: Received data and allocated quality score
2015s3262 Bexhill Stage 1 SWMP (v2 June 2016).docx 12
3 Strategic Assessment The Stage 1 SWMP for Bexhill provides a high level assessment of the local flood risk within the study area. This risk assessment details the level of risk across the study area, allowing for the identification of areas most susceptible and vulnerable to flooding. The assessment utilises flood incident records, together with flood risk maps.
3.1 Flood history
Flood incident data provided geographical information on where flooding had been recorded. The data provided by the partners was standardised using the Source-Pathway-Receptor model. A full list of the collated flood history, including a map to illustrate locations is available in Appendix B.
3.1.1 Source-Pathway-Receptor model
The Source-Pathway-Receptor model is a concept that can provide an understanding of all sources of flood hazard. It is particularly useful in this context as it can be used to generalise the data gathered from numerous sources.
Source - the origin of flood water
Pathway - a route or means by which a receptor can be affected by flooding
Receptor - something that can be adversely affected by flooding
Having applied the Source-Pathway-Receptor model it is possible to mitigate the flood risk by addressing the source (often very difficult), block or alter the pathway and even remove the receptor e.g. steer development away.
3.1.2 Applying the Source-Pathway-Receptor model
The information contained within each flood history table varies between sources of data. Data collected by East Sussex County Council and Southern Water contain specifics on the flood source, the pathway and the receptor. In these instances, applying the Source-Pathway-Receptor model can be informed completely from recorded data and requires no assumptions.
Data from ESCC Highway Authority PEMs reports always document the receptor and includes a description which often (but not always) explains the flood source and pathway. Whereas data from the emergency services lists the receptor and occasionally the flood source but not the flood pathway. Applying the Source-Pathway-Receptor model to this data requires an element of professional judgment which can be made based on the location of the flood point and by cross referencing missing data with local, complete data.
3.1.3 Historic flood sources
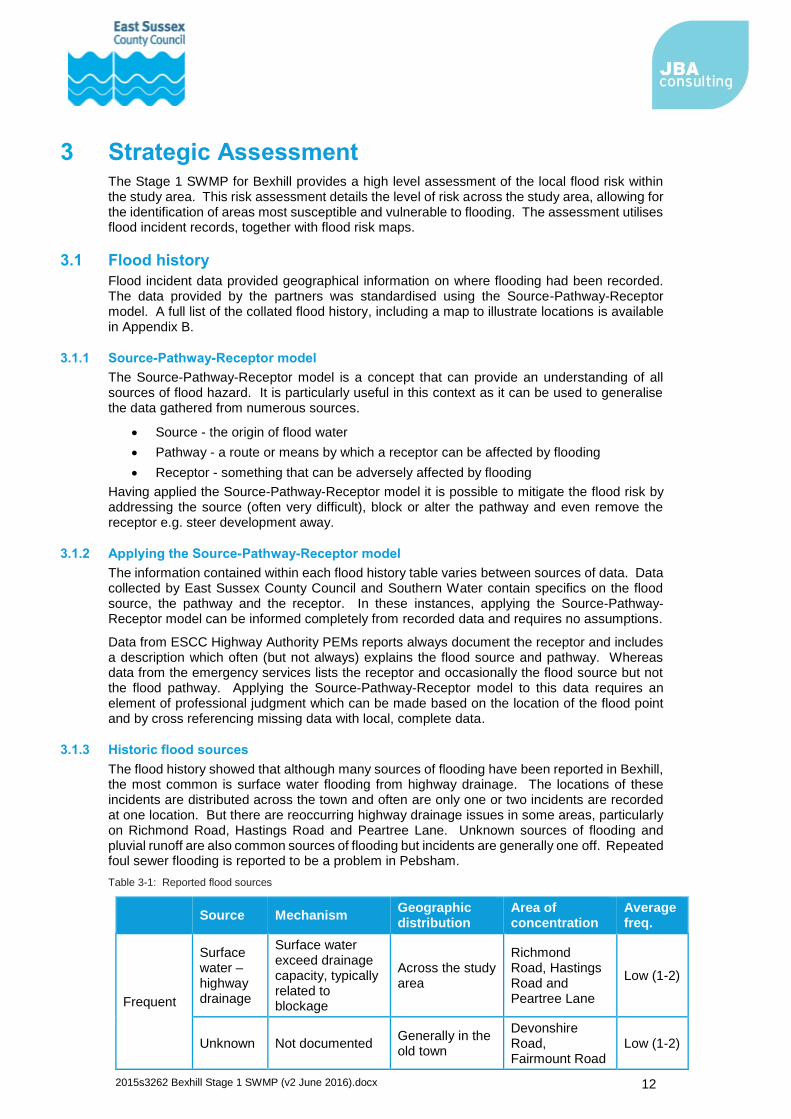
The flood history showed that although many sources of flooding have been reported in Bexhill, the most common is surface water flooding from highway drainage. The locations of these incidents are distributed across the town and often are only one or two incidents are recorded at one location. But there are reoccurring highway drainage issues in some areas, particularly on Richmond Road, Hastings Road and Peartree Lane. Unknown sources of flooding and pluvial runoff are also common sources of flooding but incidents are generally one off. Repeated foul sewer flooding is reported to be a problem in Pebsham.
Table 3-1: Reported flood sources
Source Mechanism Geographic distribution
Area of concentration
Average freq.
Frequent
Surface water – highway drainage
Surface water exceed drainage capacity, typically related to blockage
Across the study area
Richmond Road, Hastings Road and Peartree Lane
Low (1-2)
Unknown Not documented Generally in the old town
Devonshire Road, Fairmount Road
Low (1-2)
2015s3262 Bexhill Stage 1 SWMP (v2 June 2016).docx 13
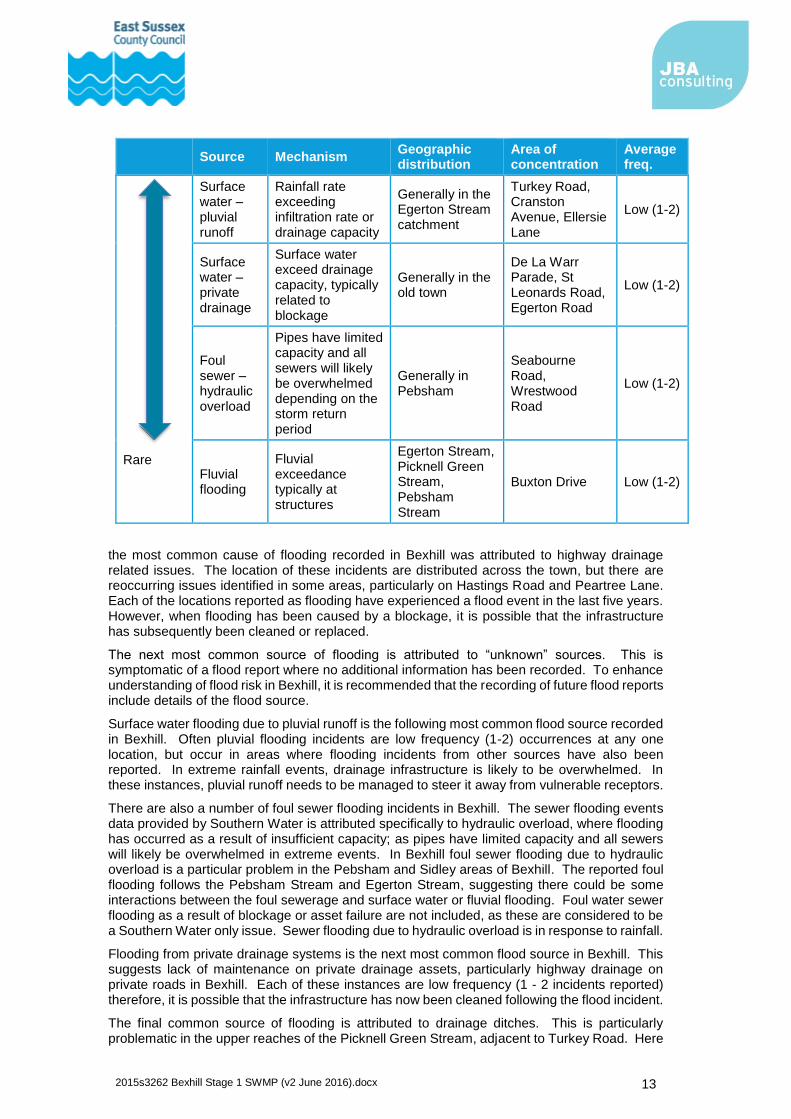
Source Mechanism Geographic distribution
Area of concentration
Average freq.
Rare
Surface water – pluvial runoff
Rainfall rate exceeding infiltration rate or drainage capacity
Generally in the Egerton Stream catchment
Turkey Road, Cranston Avenue, Ellersie Lane
Low (1-2)
Surface water – private drainage
Surface water exceed drainage capacity, typically related to blockage
Generally in the old town
De La Warr Parade, St Leonards Road, Egerton Road
Low (1-2)
Foul sewer – hydraulic overload
Pipes have limited capacity and all sewers will likely be overwhelmed depending on the storm return period
Generally in Pebsham
Seabourne Road, Wrestwood Road
Low (1-2)
Fluvial flooding
Fluvial exceedance typically at structures
Egerton Stream, Picknell Green Stream, Pebsham Stream
Buxton Drive Low (1-2)
the most common cause of flooding recorded in Bexhill was attributed to highway drainage related issues. The location of these incidents are distributed across the town, but there are reoccurring issues identified in some areas, particularly on Hastings Road and Peartree Lane. Each of the locations reported as flooding have experienced a flood event in the last five years. However, when flooding has been caused by a blockage, it is possible that the infrastructure has subsequently been cleaned or replaced.
The next most common source of flooding is attributed to “unknown” sources. This is symptomatic of a flood report where no additional information has been recorded. To enhance understanding of flood risk in Bexhill, it is recommended that the recording of future flood reports include details of the flood source.
Surface water flooding due to pluvial runoff is the following most common flood source recorded in Bexhill. Often pluvial flooding incidents are low frequency (1-2) occurrences at any one location, but occur in areas where flooding incidents from other sources have also been reported. In extreme rainfall events, drainage infrastructure is likely to be overwhelmed. In these instances, pluvial runoff needs to be managed to steer it away from vulnerable receptors.
There are also a number of foul sewer flooding incidents in Bexhill. The sewer flooding events data provided by Southern Water is attributed specifically to hydraulic overload, where flooding has occurred as a result of insufficient capacity; as pipes have limited capacity and all sewers will likely be overwhelmed in extreme events. In Bexhill foul sewer flooding due to hydraulic overload is a particular problem in the Pebsham and Sidley areas of Bexhill. The reported foul flooding follows the Pebsham Stream and Egerton Stream, suggesting there could be some interactions between the foul sewerage and surface water or fluvial flooding. Foul water sewer flooding as a result of blockage or asset failure are not included, as these are considered to be a Southern Water only issue. Sewer flooding due to hydraulic overload is in response to rainfall.
Flooding from private drainage systems is the next most common flood source in Bexhill. This suggests lack of maintenance on private drainage assets, particularly highway drainage on private roads in Bexhill. Each of these instances are low frequency (1 - 2 incidents reported) therefore, it is possible that the infrastructure has now been cleaned following the flood incident.
The final common source of flooding is attributed to drainage ditches. This is particularly problematic in the upper reaches of the Picknell Green Stream, adjacent to Turkey Road. Here
2015s3262 Bexhill Stage 1 SWMP (v2 June 2016).docx 14
the capacity of the drainage ditches is thought to be exceeded in heavy rain, this is also linked to blockage of the culverts and sedimentation of the ditches.
3.1.4 Mapping the flood history
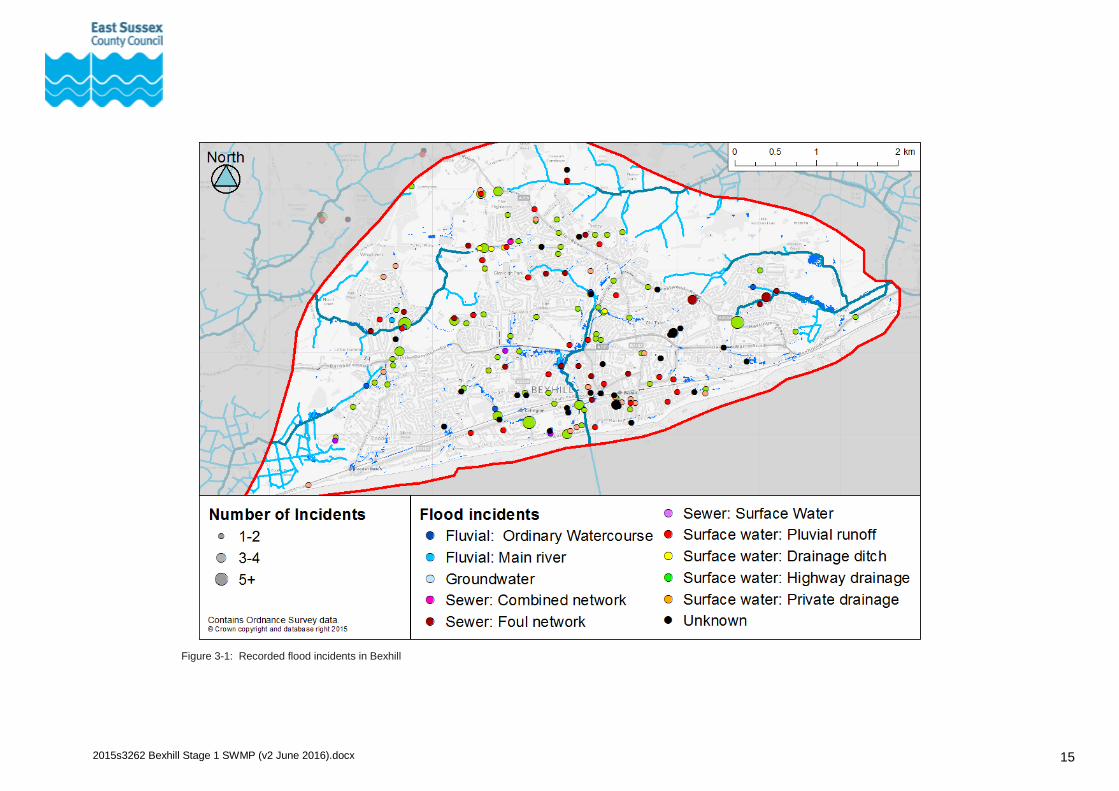
Records of each recorded flood incident are depicted by coloured points in Figure 3-1. The Source-Pathway-Receptor model was applied to each point and the total number of repeated flood incidents was tallied. This enabled the points to be thematically mapped. The colour of the flood point depicts the flood source and asset affected, whereas the size of the flood point depicts the frequency of the flood incidents recorded at that location, from the same source.
2015s3262 Bexhill Stage 1 SWMP (v2 June 2016).docx 15
Figure 3-1: Recorded flood incidents in Bexhill
2015s3262 Bexhill Stage 1 SWMP (v2 June 2016).docx 16
The recorded flooding is scattered across the study region. There are clusters of flood history on Egerton Stream, Pebsham Stream and Picknell Green Stream and in all locations flooding appears to be the result of a number of sources, which highlights the integrated nature of flooding in Bexhill.
3.2 Flood risk
The assessment of flood risk utilised the Environment Agency’s existing risk mapping as local flood risk modelling was beyond the scope of this Stage 1 Surface Water Management Plan. The flood risk considered includes flooding from main rivers, surface water and groundwater.
3.2.1 Main river
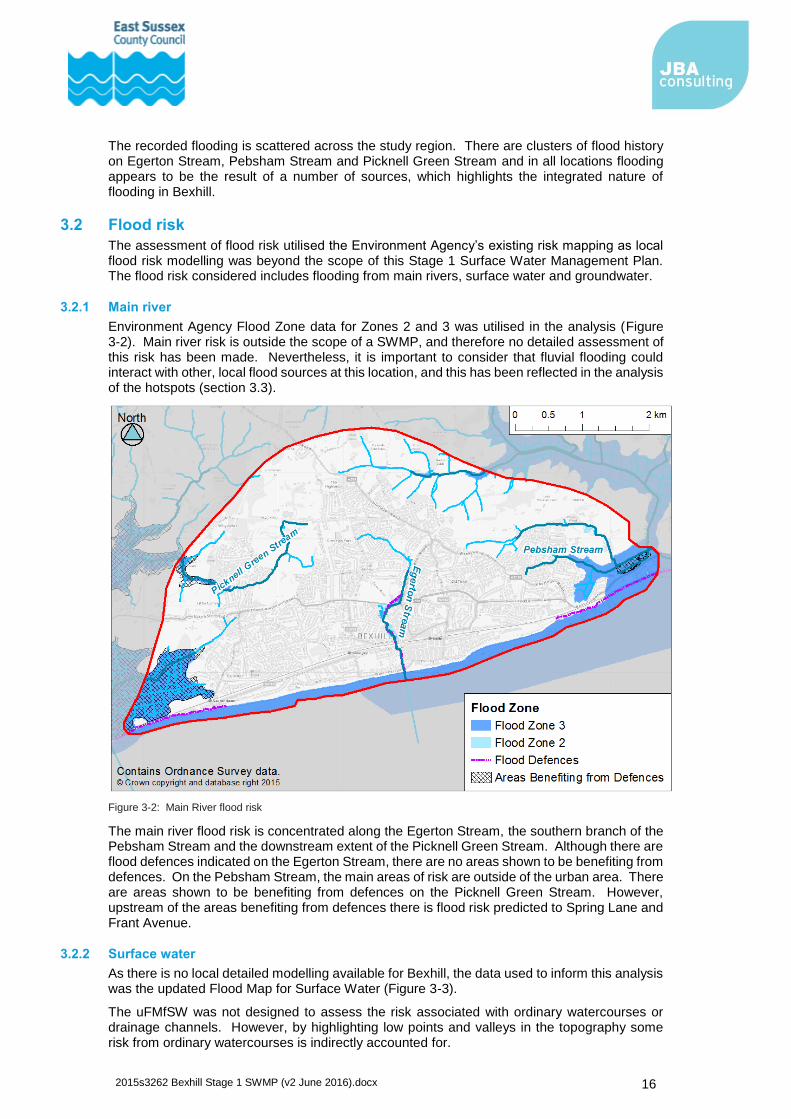
Environment Agency Flood Zone data for Zones 2 and 3 was utilised in the analysis (Figure 3-2). Main river risk is outside the scope of a SWMP, and therefore no detailed assessment of this risk has been made. Nevertheless, it is important to consider that fluvial flooding could interact with other, local flood sources at this location, and this has been reflected in the analysis of the hotspots (section 3.3).
Figure 3-2: Main River flood risk
The main river flood risk is concentrated along the Egerton Stream, the southern branch of the Pebsham Stream and the downstream extent of the Picknell Green Stream. Although there are flood defences indicated on the Egerton Stream, there are no areas shown to be benefiting from defences. On the Pebsham Stream, the main areas of risk are outside of the urban area. There are areas shown to be benefiting from defences on the Picknell Green Stream. However, upstream of the areas benefiting from defences there is flood risk predicted to Spring Lane and Frant Avenue.
3.2.2 Surface water
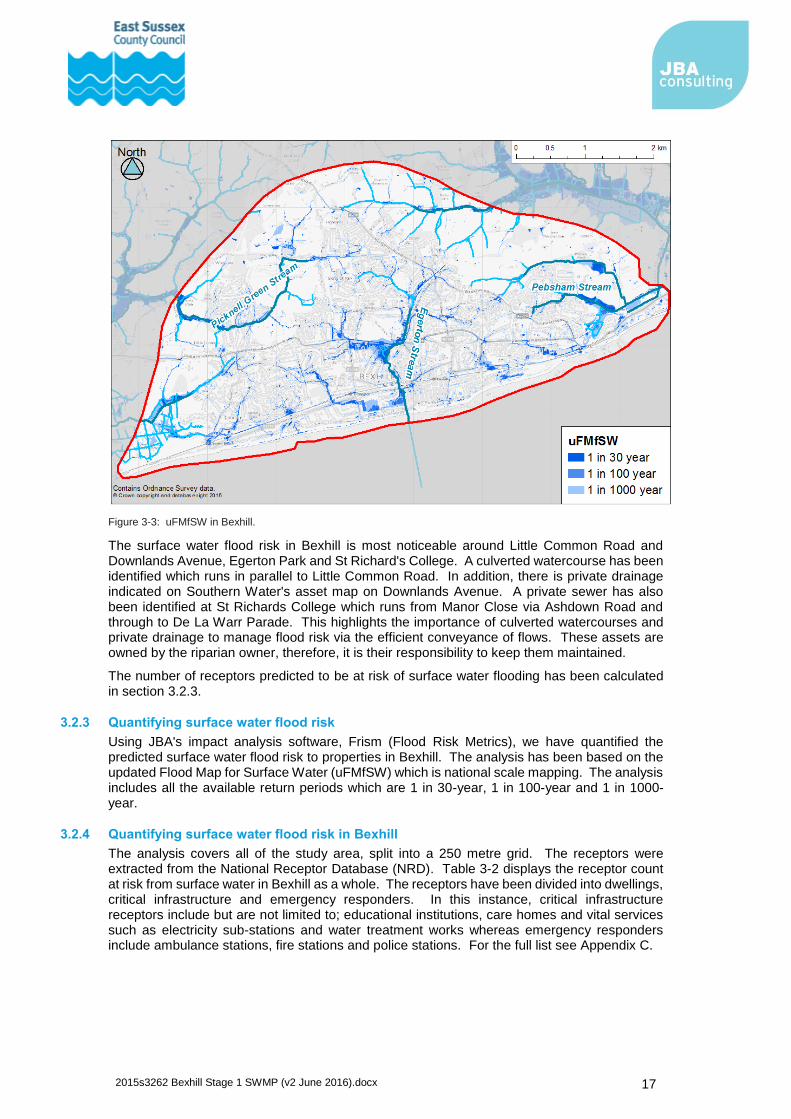
As there is no local detailed modelling available for Bexhill, the data used to inform this analysis was the updated Flood Map for Surface Water (Figure 3-3).
The uFMfSW was not designed to assess the risk associated with ordinary watercourses or drainage channels. However, by highlighting low points and valleys in the topography some risk from ordinary watercourses is indirectly accounted for.
2015s3262 Bexhill Stage 1 SWMP (v2 June 2016).docx 17
Figure 3-3: uFMfSW in Bexhill.
The surface water flood risk in Bexhill is most noticeable around Little Common Road and Downlands Avenue, Egerton Park and St Richard's College. A culverted watercourse has been identified which runs in parallel to Little Common Road. In addition, there is private drainage indicated on Southern Water's asset map on Downlands Avenue. A private sewer has also been identified at St Richards College which runs from Manor Close via Ashdown Road and through to De La Warr Parade. This highlights the importance of culverted watercourses and private drainage to manage flood risk via the efficient conveyance of flows. These assets are owned by the riparian owner, therefore, it is their responsibility to keep them maintained.
The number of receptors predicted to be at risk of surface water flooding has been calculated in section 3.2.3.
3.2.3 Quantifying surface water flood risk
Using JBA's impact analysis software, Frism (Flood Risk Metrics), we have quantified the predicted surface water flood risk to properties in Bexhill. The analysis has been based on the updated Flood Map for Surface Water (uFMfSW) which is national scale mapping. The analysis includes all the available return periods which are 1 in 30-year, 1 in 100-year and 1 in 1000-year.
3.2.4 Quantifying surface water flood risk in Bexhill
The analysis covers all of the study area, split into a 250 metre grid. The receptors were extracted from the National Receptor Database (NRD). Table 3-2 displays the receptor count at risk from surface water in Bexhill as a whole. The receptors have been divided into dwellings, critical infrastructure and emergency responders. In this instance, critical infrastructure receptors include but are not limited to; educational institutions, care homes and vital services such as electricity sub-stations and water treatment works whereas emergency responders include ambulance stations, fire stations and police stations. For the full list see Appendix C.
2015s3262 Bexhill Stage 1 SWMP (v2 June 2016).docx 18
Return Period Critical Infrastructure
(NRD)
Dwellings (NRD)
Emergency responders
(NRD)
Total
30 2 45 0 47
100 13 111 0 124
1000 25 441 0 466
Table 3-2: Number of receptors in Bexhill at risk from surface water flooding
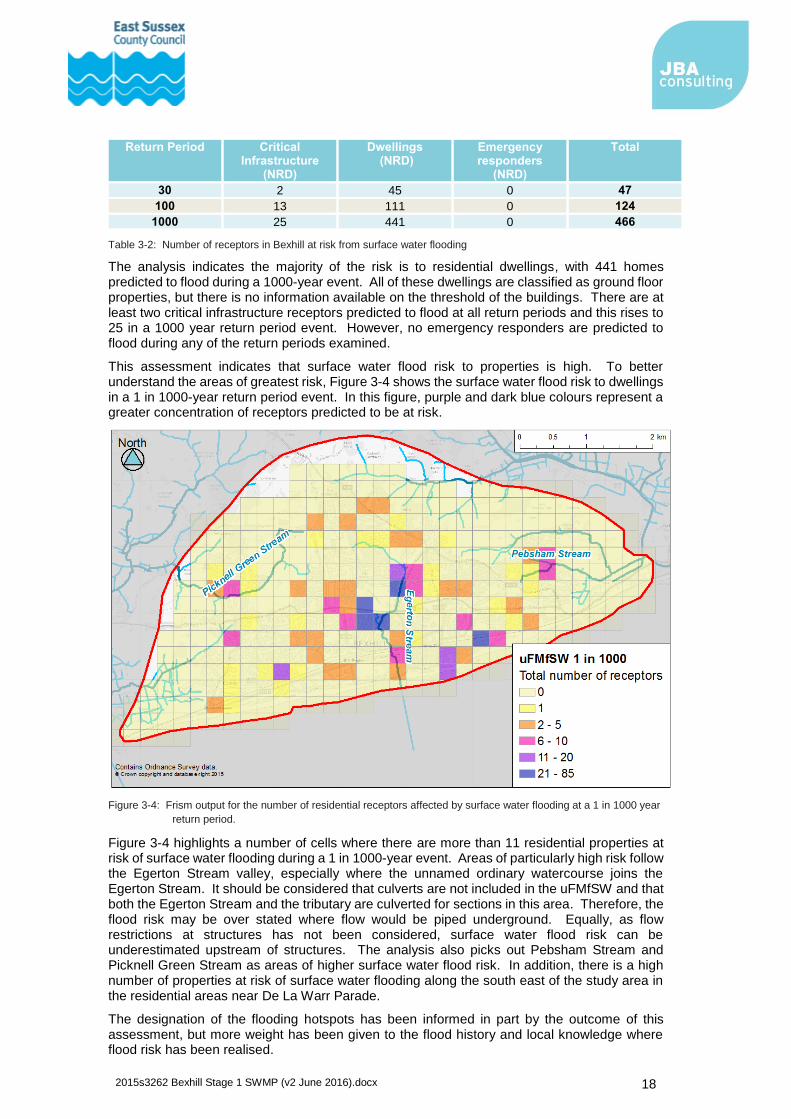
The analysis indicates the majority of the risk is to residential dwellings, with 441 homes predicted to flood during a 1000-year event. All of these dwellings are classified as ground floor properties, but there is no information available on the threshold of the buildings. There are at least two critical infrastructure receptors predicted to flood at all return periods and this rises to 25 in a 1000 year return period event. However, no emergency responders are predicted to flood during any of the return periods examined.
This assessment indicates that surface water flood risk to properties is high. To better understand the areas of greatest risk, Figure 3-4 shows the surface water flood risk to dwellings in a 1 in 1000-year return period event. In this figure, purple and dark blue colours represent a greater concentration of receptors predicted to be at risk.
Figure 3-4: Frism output for the number of residential receptors affected by surface water flooding at a 1 in 1000 year
return period.
Figure 3-4 highlights a number of cells where there are more than 11 residential properties at risk of surface water flooding during a 1 in 1000-year event. Areas of particularly high risk follow the Egerton Stream valley, especially where the unnamed ordinary watercourse joins the Egerton Stream. It should be considered that culverts are not included in the uFMfSW and that both the Egerton Stream and the tributary are culverted for sections in this area. Therefore, the flood risk may be over stated where flow would be piped underground. Equally, as flow restrictions at structures has not been considered, surface water flood risk can be underestimated upstream of structures. The analysis also picks out Pebsham Stream and Picknell Green Stream as areas of higher surface water flood risk. In addition, there is a high number of properties at risk of surface water flooding along the south east of the study area in the residential areas near De La Warr Parade.
The designation of the flooding hotspots has been informed in part by the outcome of this assessment, but more weight has been given to the flood history and local knowledge where flood risk has been realised.
2015s3262 Bexhill Stage 1 SWMP (v2 June 2016).docx 19
3.2.5 Groundwater
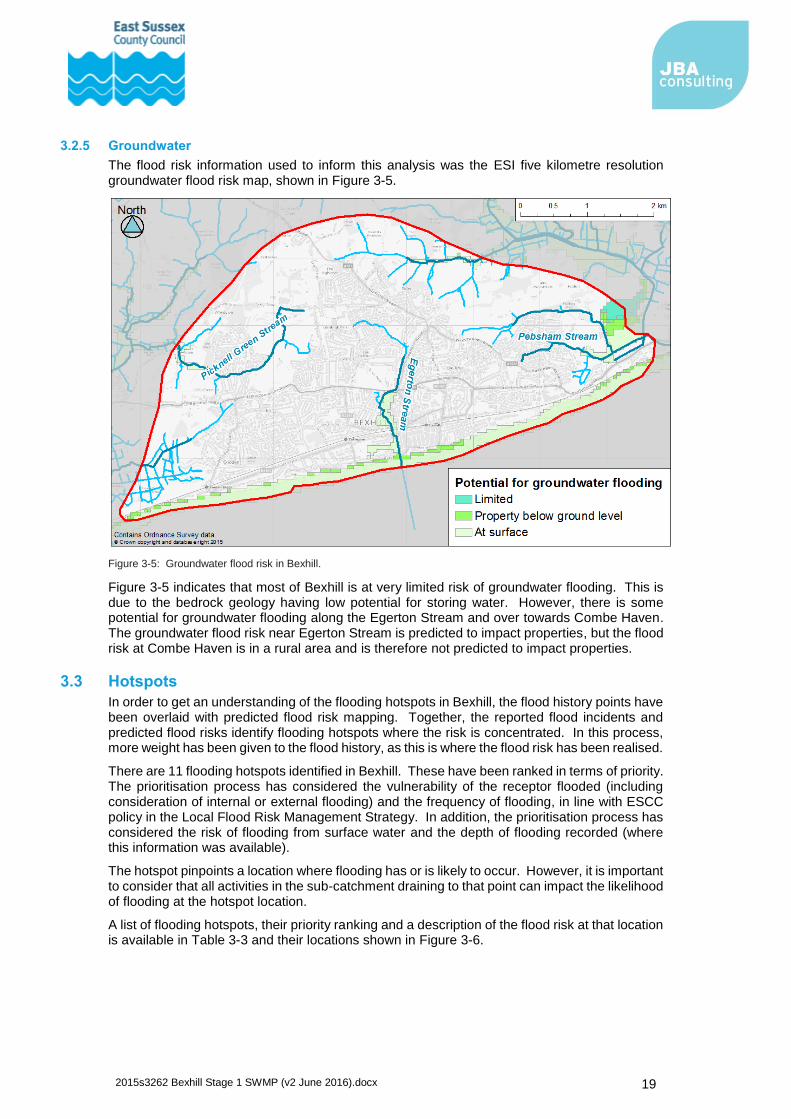
The flood risk information used to inform this analysis was the ESI five kilometre resolution groundwater flood risk map, shown in Figure 3-5.
Figure 3-5: Groundwater flood risk in Bexhill.
Figure 3-5 indicates that most of Bexhill is at very limited risk of groundwater flooding. This is due to the bedrock geology having low potential for storing water. However, there is some potential for groundwater flooding along the Egerton Stream and over towards Combe Haven. The groundwater flood risk near Egerton Stream is predicted to impact properties, but the flood risk at Combe Haven is in a rural area and is therefore not predicted to impact properties.
3.3 Hotspots
In order to get an understanding of the flooding hotspots in Bexhill, the flood history points have been overlaid with predicted flood risk mapping. Together, the reported flood incidents and predicted flood risks identify flooding hotspots where the risk is concentrated. In this process, more weight has been given to the flood history, as this is where the flood risk has been realised.
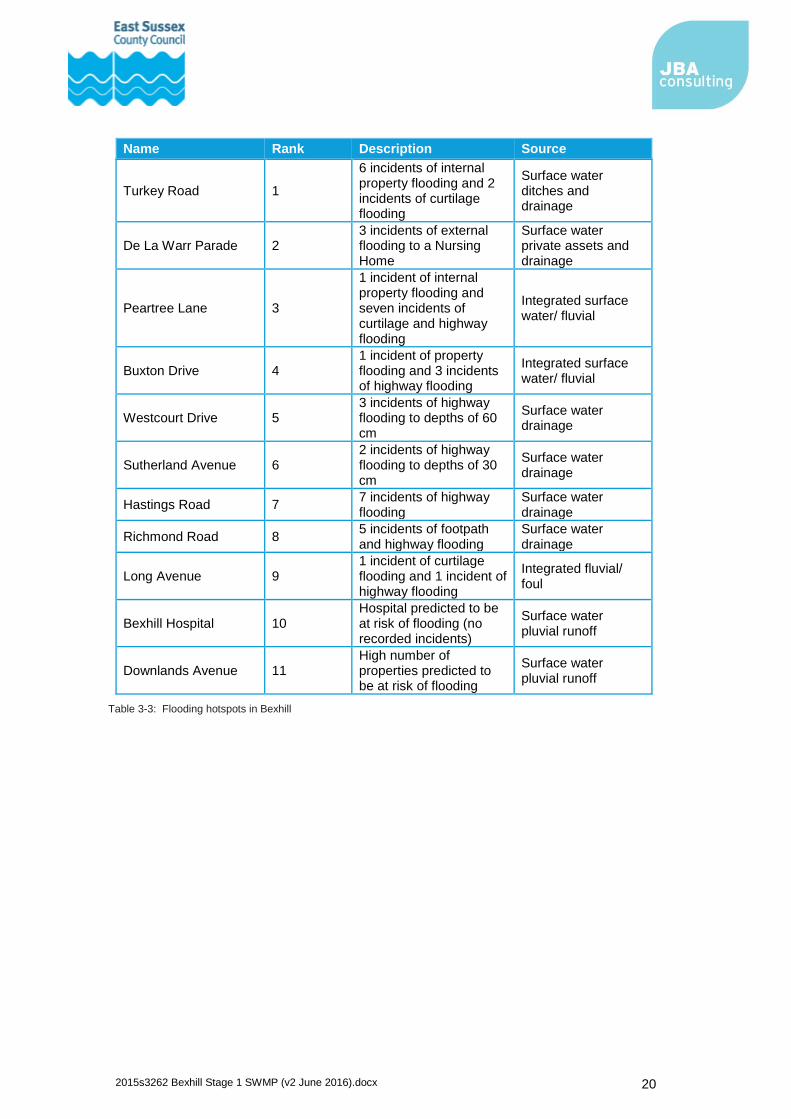
There are 11 flooding hotspots identified in Bexhill. These have been ranked in terms of priority. The prioritisation process has considered the vulnerability of the receptor flooded (including consideration of internal or external flooding) and the frequency of flooding, in line with ESCC policy in the Local Flood Risk Management Strategy. In addition, the prioritisation process has considered the risk of flooding from surface water and the depth of flooding recorded (where this information was available).
The hotspot pinpoints a location where flooding has or is likely to occur. However, it is important to consider that all activities in the sub-catchment draining to that point can impact the likelihood of flooding at the hotspot location.
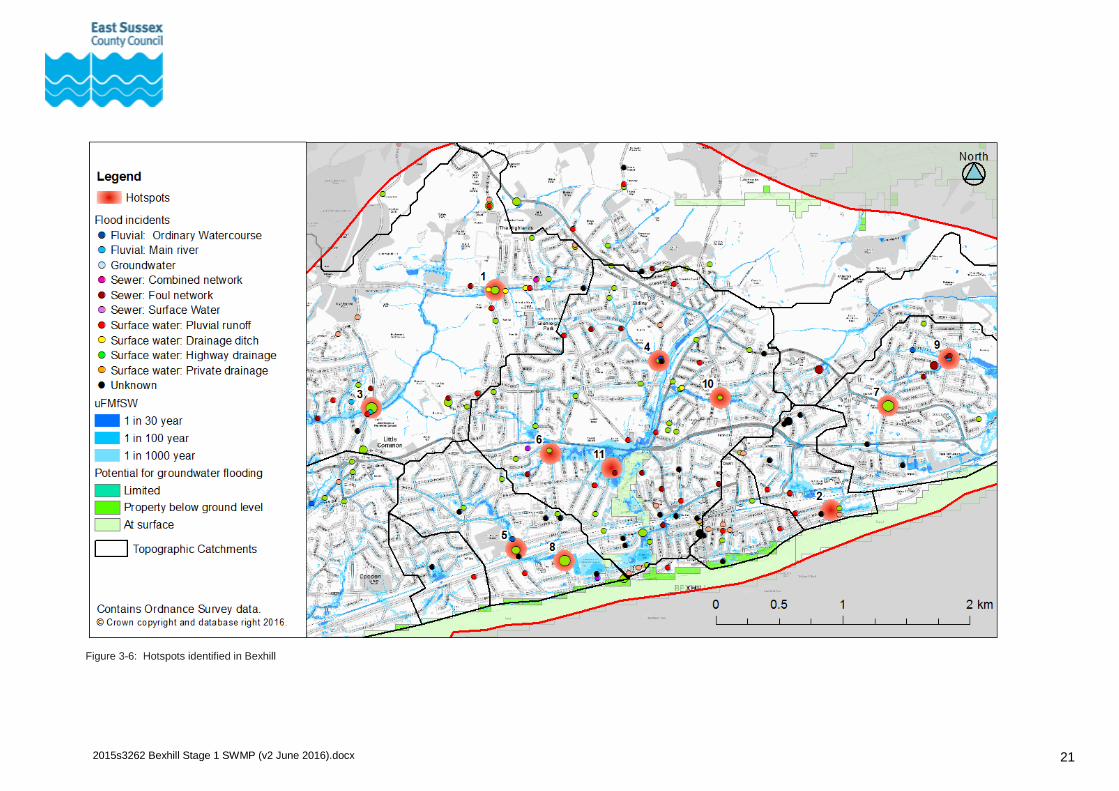
A list of flooding hotspots, their priority ranking and a description of the flood risk at that location is available in Table 3-3 and their locations shown in Figure 3-6.
2015s3262 Bexhill Stage 1 SWMP (v2 June 2016).docx 20
Name Rank Description Source
Turkey Road 1
6 incidents of internal property flooding and 2 incidents of curtilage flooding
Surface water ditches and drainage
De La Warr Parade 2 3 incidents of external flooding to a Nursing Home
Surface water private assets and drainage
Peartree Lane 3
1 incident of internal property flooding and seven incidents of curtilage and highway flooding
Integrated surface water/ fluvial
Buxton Drive 4 1 incident of property flooding and 3 incidents of highway flooding
Integrated surface water/ fluvial
Westcourt Drive 5 3 incidents of highway flooding to depths of 60 cm
Surface water drainage
Sutherland Avenue 6 2 incidents of highway flooding to depths of 30 cm
Surface water drainage
Hastings Road 7 7 incidents of highway flooding
Surface water drainage
Richmond Road 8 5 incidents of footpath and highway flooding
Surface water drainage
Long Avenue 9 1 incident of curtilage flooding and 1 incident of highway flooding
Integrated fluvial/ foul
Bexhill Hospital 10 Hospital predicted to be at risk of flooding (no recorded incidents)
Surface water pluvial runoff
Downlands Avenue 11 High number of properties predicted to be at risk of flooding
Surface water pluvial runoff
Table 3-3: Flooding hotspots in Bexhill
2015s3262 Bexhill Stage 1 SWMP (v2 June 2016).docx 21
Figure 3-6: Hotspots identified in Bexhill
2015s3262 Bexhill Stage 1 SWMP (v2 June 2016).docx 22
In Bexhill, the hotspots highlight where there are culverted watercourses or private sewerage which is in poor condition due to a lack of maintenance. This has been shown to increase flood risk as culverts have become blocked, reducing their capacity. Both private sewers and culverted watercourses are the responsibility of riparian owners, and no one risk management authority is liable for their maintenance. Therefore, there is a need for partnership working to support riparian owners in meeting their responsibilities.
Three of the hotspots listed above are caused by integrated flood sources, particularly as surface water combines with fluvial or foul sewer flood risk. This demonstrates the importance of considering how flood pathways interact and that considering one flood mechanism in isolation may result in a limited understanding of the cause of flooding .
Despite there being a number of flood incidents reported within the town centre, this area has not been included as a hotspot. The reason for this is that the analysis has found that the flooding has not occurred at the same location on more than two occasions. The town centre has a very high proportion of paved area. Therefore, rain is likely to runoff rather than infiltrate into the soil. As a result, flood risk management is dependent on effective drainage from urban drainage systems. These urban drainage systems are a mixture of private assets and highway drainage assets. Flooding has been reported when the drainage systems have been overwhelmed due to the severity of the rainfall or when drainage systems are blocked or broken. This highlights the importance of asset maintenance across the town centre by both private land owners and East Sussex Highway department and has been recognised in the Action Plan in section 7.
3.3.1 Turkey Road
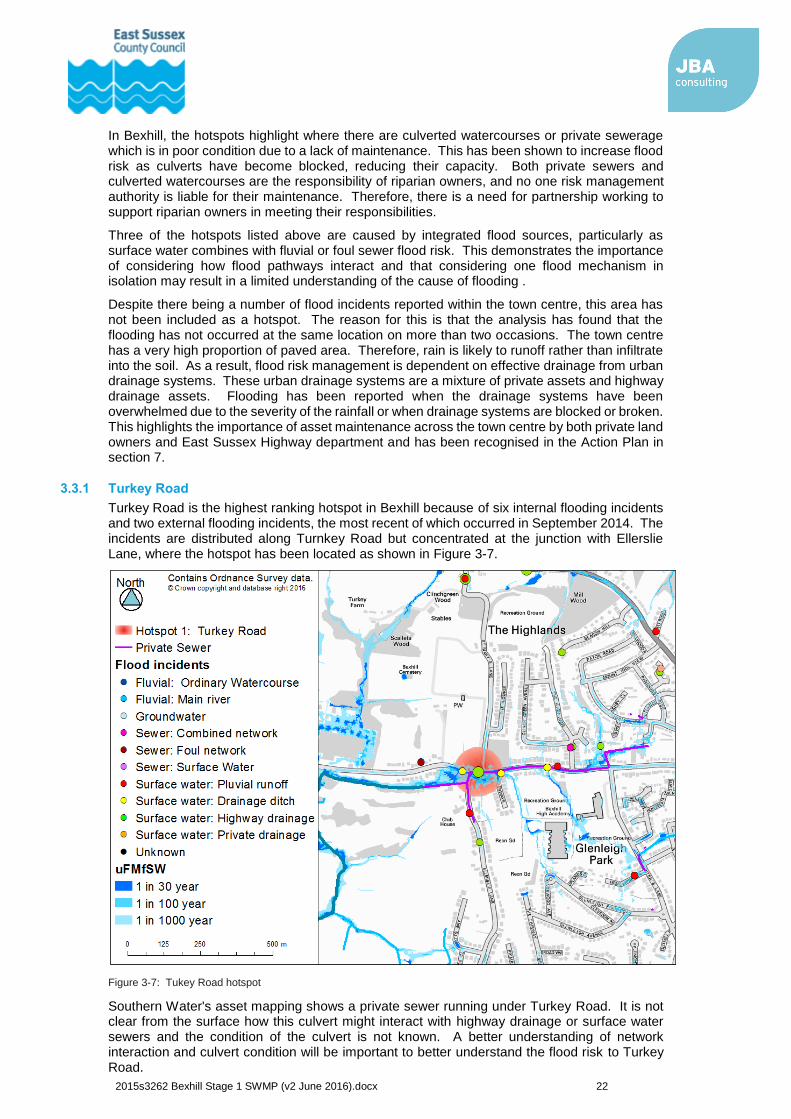
Turkey Road is the highest ranking hotspot in Bexhill because of six internal flooding incidents and two external flooding incidents, the most recent of which occurred in September 2014. The incidents are distributed along Turnkey Road but concentrated at the junction with Ellerslie Lane, where the hotspot has been located as shown in Figure 3-7.
Figure 3-7: Tukey Road hotspot
Southern Water's asset mapping shows a private sewer running under Turkey Road. It is not clear from the surface how this culvert might interact with highway drainage or surface water sewers and the condition of the culvert is not known. A better understanding of network interaction and culvert condition will be important to better understand the flood risk to Turkey Road.
2015s3262 Bexhill Stage 1 SWMP (v2 June 2016).docx 23
During the site inspection, it was noted that the highway drainage gullies on The Highlands have recently been replaced. It is assumed that this action was undertaken to increase capacity of the drainage network, and to better manage surface water flood risk.
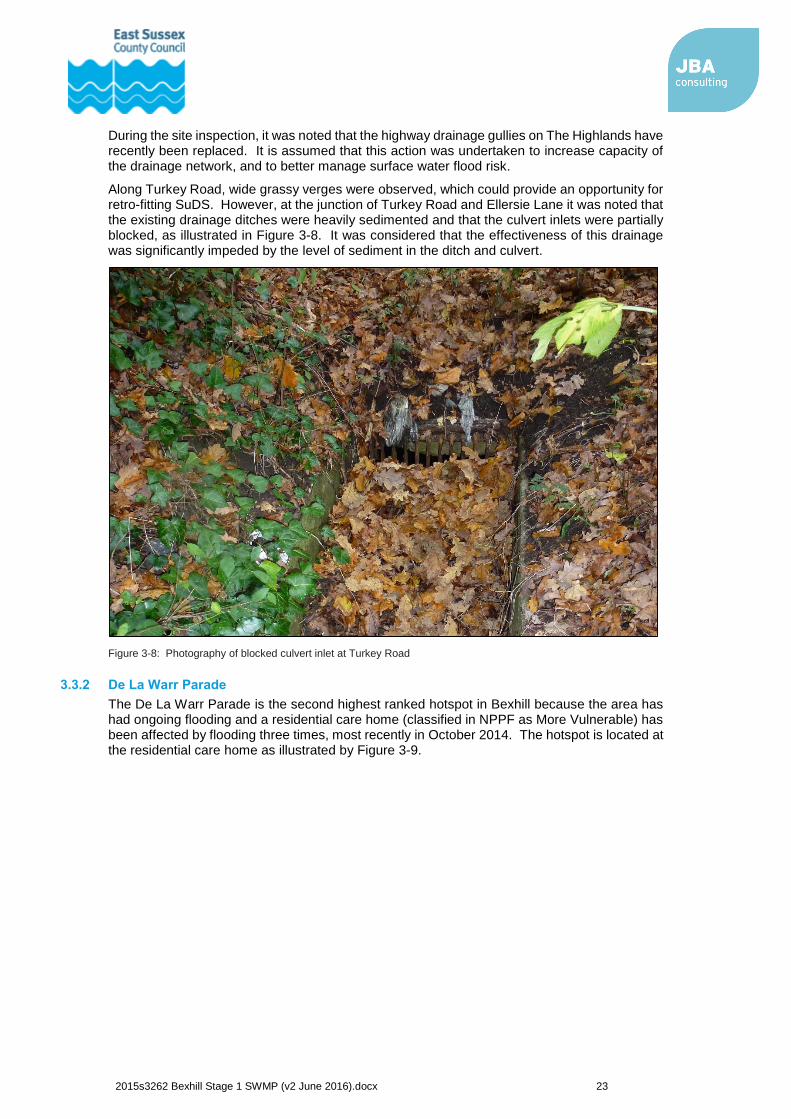
Along Turkey Road, wide grassy verges were observed, which could provide an opportunity for retro-fitting SuDS. However, at the junction of Turkey Road and Ellersie Lane it was noted that the existing drainage ditches were heavily sedimented and that the culvert inlets were partially blocked, as illustrated in Figure 3-8. It was considered that the effectiveness of this drainage was significantly impeded by the level of sediment in the ditch and culvert.
Figure 3-8: Photography of blocked culvert inlet at Turkey Road
3.3.2 De La Warr Parade
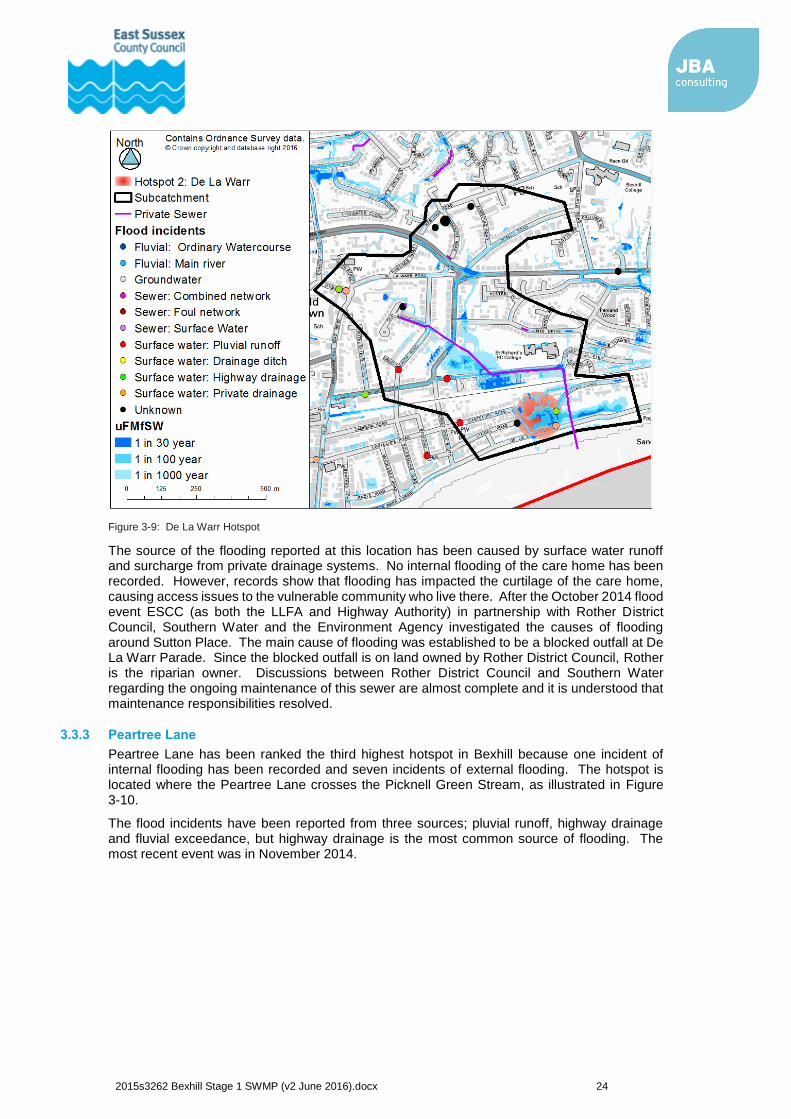
The De La Warr Parade is the second highest ranked hotspot in Bexhill because the area has had ongoing flooding and a residential care home (classified in NPPF as More Vulnerable) has been affected by flooding three times, most recently in October 2014. The hotspot is located at the residential care home as illustrated by Figure 3-9.
2015s3262 Bexhill Stage 1 SWMP (v2 June 2016).docx 24
Figure 3-9: De La Warr Hotspot
The source of the flooding reported at this location has been caused by surface water runoff and surcharge from private drainage systems. No internal flooding of the care home has been recorded. However, records show that flooding has impacted the curtilage of the care home, causing access issues to the vulnerable community who live there. After the October 2014 flood event ESCC (as both the LLFA and Highway Authority) in partnership with Rother District Council, Southern Water and the Environment Agency investigated the causes of flooding around Sutton Place. The main cause of flooding was established to be a blocked outfall at De La Warr Parade. Since the blocked outfall is on land owned by Rother District Council, Rother is the riparian owner. Discussions between Rother District Council and Southern Water regarding the ongoing maintenance of this sewer are almost complete and it is understood that maintenance responsibilities resolved.
3.3.3 Peartree Lane
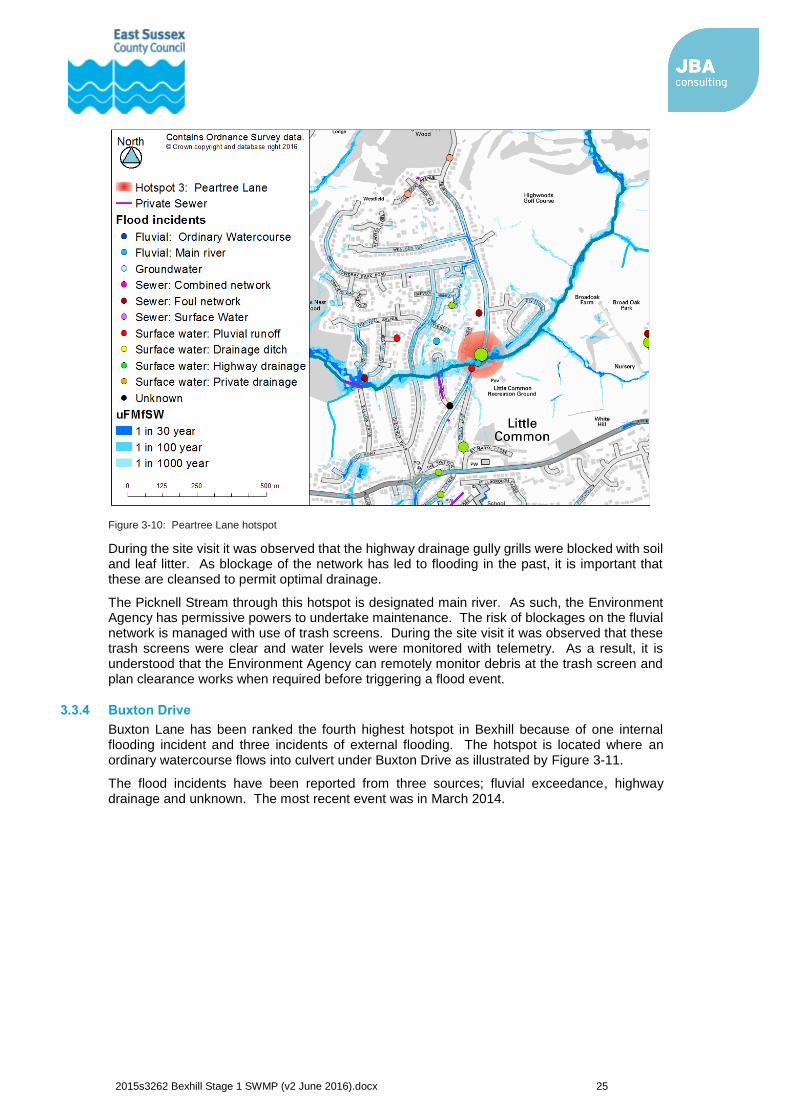
Peartree Lane has been ranked the third highest hotspot in Bexhill because one incident of internal flooding has been recorded and seven incidents of external flooding. The hotspot is located where the Peartree Lane crosses the Picknell Green Stream, as illustrated in Figure 3-10.
The flood incidents have been reported from three sources; pluvial runoff, highway drainage and fluvial exceedance, but highway drainage is the most common source of flooding. The most recent event was in November 2014.
2015s3262 Bexhill Stage 1 SWMP (v2 June 2016).docx 25
Figure 3-10: Peartree Lane hotspot
During the site visit it was observed that the highway drainage gully grills were blocked with soil and leaf litter. As blockage of the network has led to flooding in the past, it is important that these are cleansed to permit optimal drainage.
The Picknell Stream through this hotspot is designated main river. As such, the Environment Agency has permissive powers to undertake maintenance. The risk of blockages on the fluvial network is managed with use of trash screens. During the site visit it was observed that these trash screens were clear and water levels were monitored with telemetry. As a result, it is understood that the Environment Agency can remotely monitor debris at the trash screen and plan clearance works when required before triggering a flood event.
3.3.4 Buxton Drive
Buxton Lane has been ranked the fourth highest hotspot in Bexhill because of one internal flooding incident and three incidents of external flooding. The hotspot is located where an ordinary watercourse flows into culvert under Buxton Drive as illustrated by Figure 3-11.
The flood incidents have been reported from three sources; fluvial exceedance, highway drainage and unknown. The most recent event was in March 2014.
2015s3262 Bexhill Stage 1 SWMP (v2 June 2016).docx 26
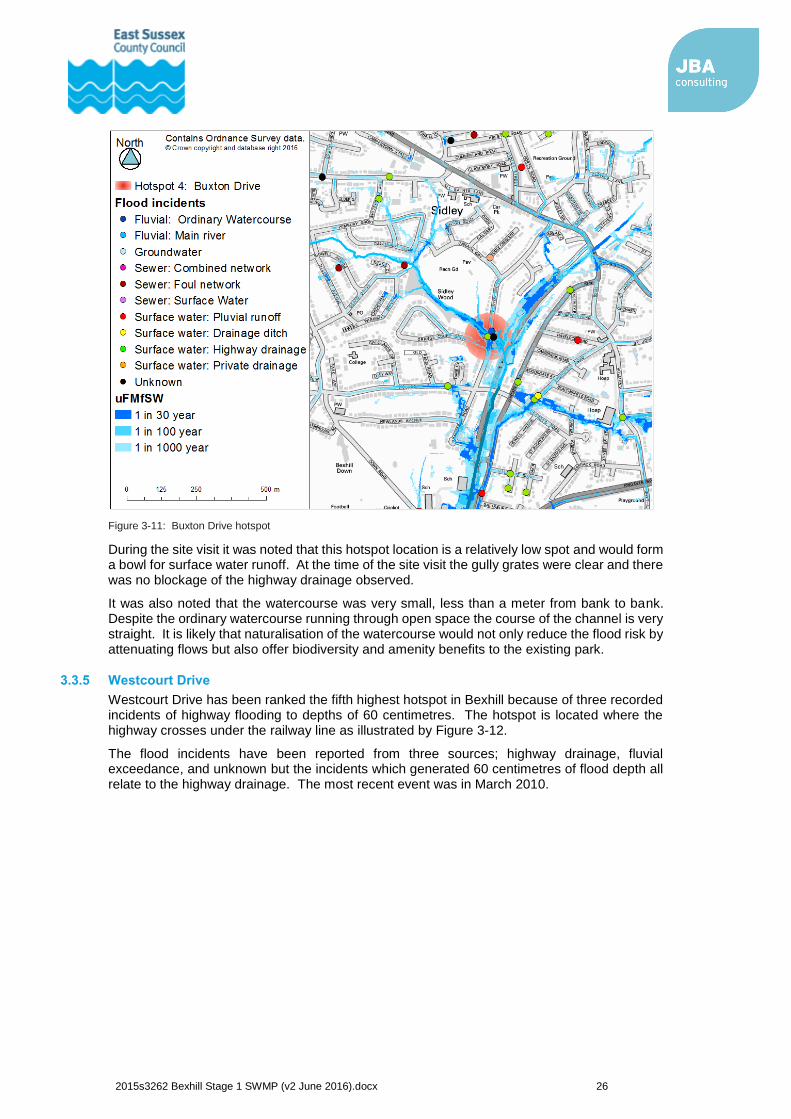
Figure 3-11: Buxton Drive hotspot
During the site visit it was noted that this hotspot location is a relatively low spot and would form a bowl for surface water runoff. At the time of the site visit the gully grates were clear and there was no blockage of the highway drainage observed.
It was also noted that the watercourse was very small, less than a meter from bank to bank. Despite the ordinary watercourse running through open space the course of the channel is very straight. It is likely that naturalisation of the watercourse would not only reduce the flood risk by attenuating flows but also offer biodiversity and amenity benefits to the existing park.
3.3.5 Westcourt Drive
Westcourt Drive has been ranked the fifth highest hotspot in Bexhill because of three recorded incidents of highway flooding to depths of 60 centimetres. The hotspot is located where the highway crosses under the railway line as illustrated by Figure 3-12.
The flood incidents have been reported from three sources; highway drainage, fluvial exceedance, and unknown but the incidents which generated 60 centimetres of flood depth all relate to the highway drainage. The most recent event was in March 2010.
2015s3262 Bexhill Stage 1 SWMP (v2 June 2016).docx 27
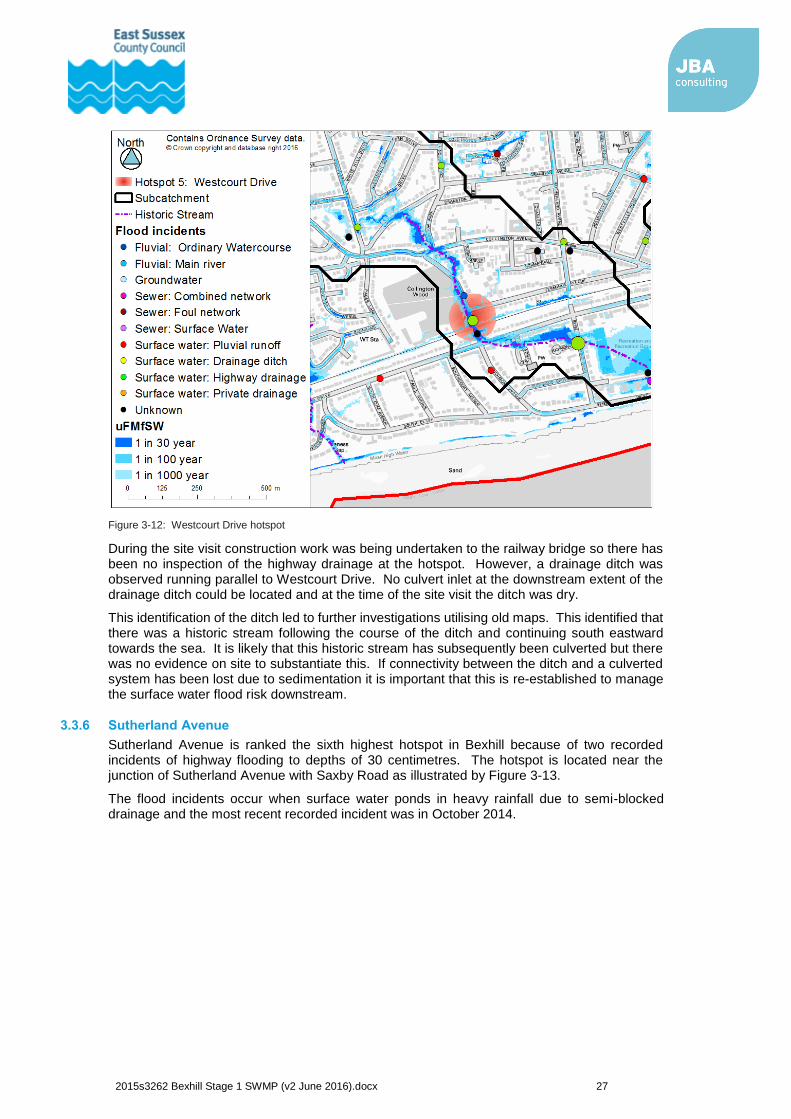
Figure 3-12: Westcourt Drive hotspot
During the site visit construction work was being undertaken to the railway bridge so there has been no inspection of the highway drainage at the hotspot. However, a drainage ditch was observed running parallel to Westcourt Drive. No culvert inlet at the downstream extent of the drainage ditch could be located and at the time of the site visit the ditch was dry.
This identification of the ditch led to further investigations utilising old maps. This identified that there was a historic stream following the course of the ditch and continuing south eastward towards the sea. It is likely that this historic stream has subsequently been culverted but there was no evidence on site to substantiate this. If connectivity between the ditch and a culverted system has been lost due to sedimentation it is important that this is re-established to manage the surface water flood risk downstream.
3.3.6 Sutherland Avenue
Sutherland Avenue is ranked the sixth highest hotspot in Bexhill because of two recorded incidents of highway flooding to depths of 30 centimetres. The hotspot is located near the junction of Sutherland Avenue with Saxby Road as illustrated by Figure 3-13.
The flood incidents occur when surface water ponds in heavy rainfall due to semi-blocked drainage and the most recent recorded incident was in October 2014.
2015s3262 Bexhill Stage 1 SWMP (v2 June 2016).docx 28
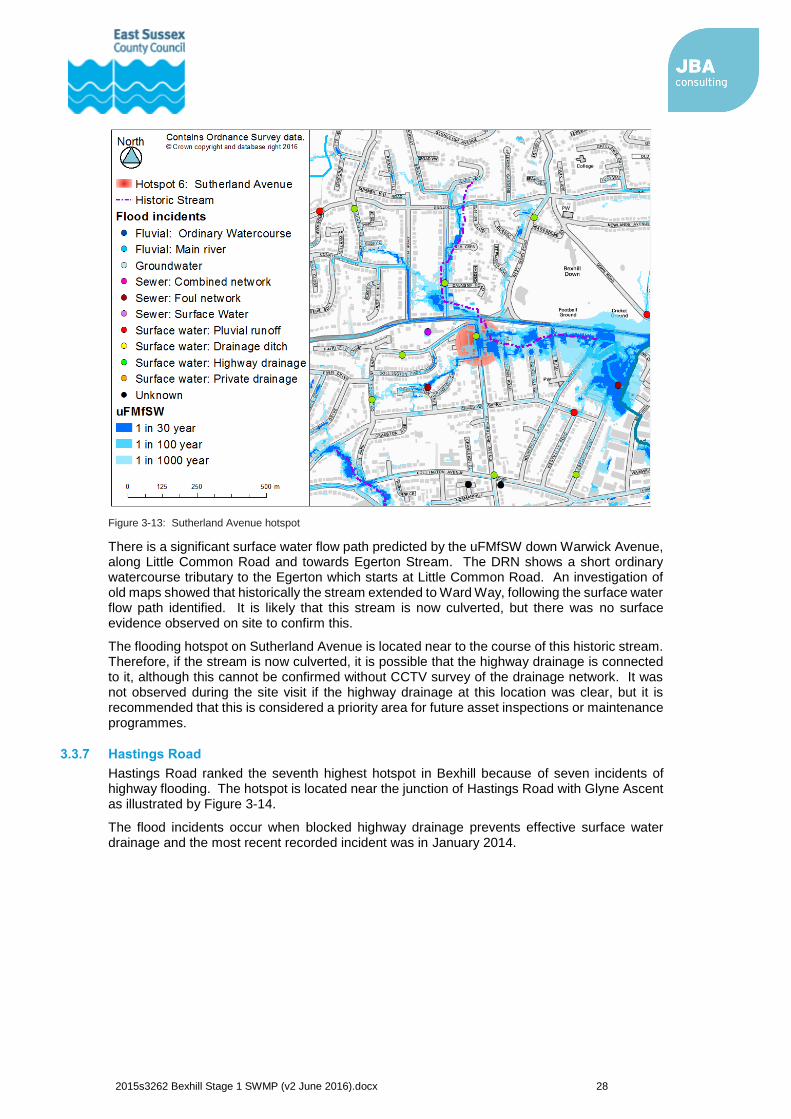
Figure 3-13: Sutherland Avenue hotspot
There is a significant surface water flow path predicted by the uFMfSW down Warwick Avenue, along Little Common Road and towards Egerton Stream. The DRN shows a short ordinary watercourse tributary to the Egerton which starts at Little Common Road. An investigation of old maps showed that historically the stream extended to Ward Way, following the surface water flow path identified. It is likely that this stream is now culverted, but there was no surface evidence observed on site to confirm this.
The flooding hotspot on Sutherland Avenue is located near to the course of this historic stream. Therefore, if the stream is now culverted, it is possible that the highway drainage is connected to it, although this cannot be confirmed without CCTV survey of the drainage network. It was not observed during the site visit if the highway drainage at this location was clear, but it is recommended that this is considered a priority area for future asset inspections or maintenance programmes.
3.3.7 Hastings Road
Hastings Road ranked the seventh highest hotspot in Bexhill because of seven incidents of highway flooding. The hotspot is located near the junction of Hastings Road with Glyne Ascent as illustrated by Figure 3-14.
The flood incidents occur when blocked highway drainage prevents effective surface water drainage and the most recent recorded incident was in January 2014.
2015s3262 Bexhill Stage 1 SWMP (v2 June 2016).docx 29
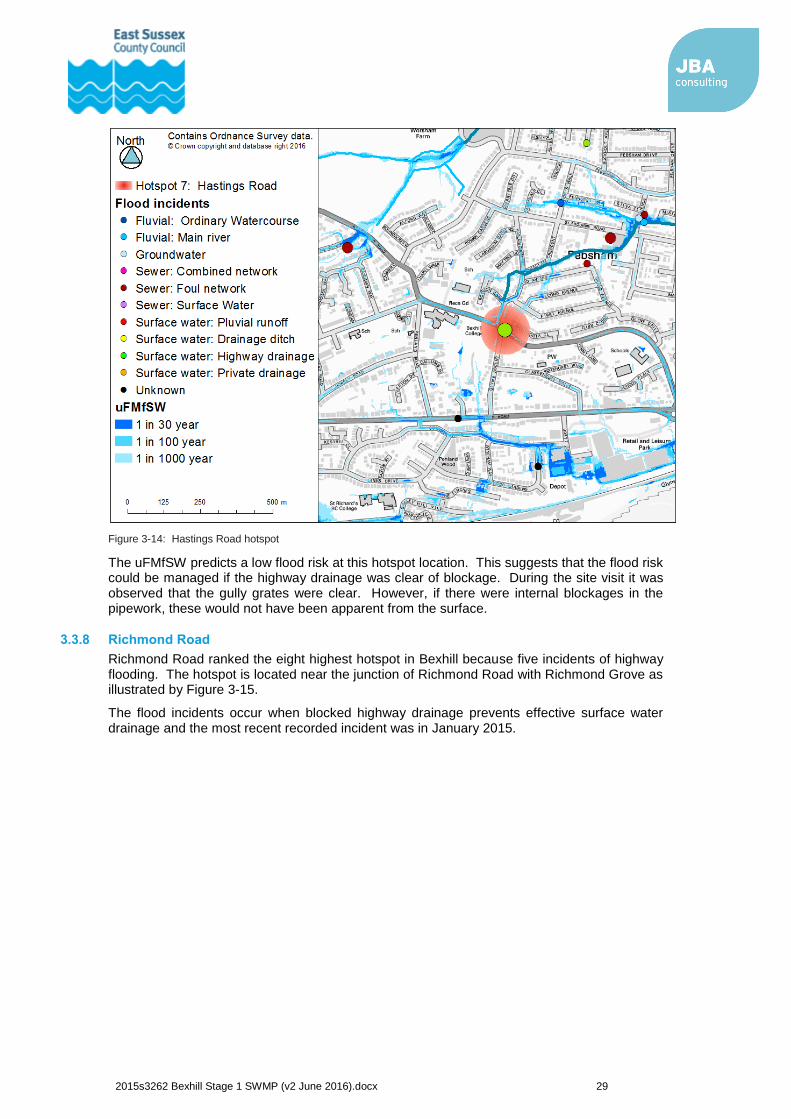
Figure 3-14: Hastings Road hotspot
The uFMfSW predicts a low flood risk at this hotspot location. This suggests that the flood risk could be managed if the highway drainage was clear of blockage. During the site visit it was observed that the gully grates were clear. However, if there were internal blockages in the pipework, these would not have been apparent from the surface.
3.3.8 Richmond Road
Richmond Road ranked the eight highest hotspot in Bexhill because five incidents of highway flooding. The hotspot is located near the junction of Richmond Road with Richmond Grove as illustrated by Figure 3-15.
The flood incidents occur when blocked highway drainage prevents effective surface water drainage and the most recent recorded incident was in January 2015.
2015s3262 Bexhill Stage 1 SWMP (v2 June 2016).docx 30
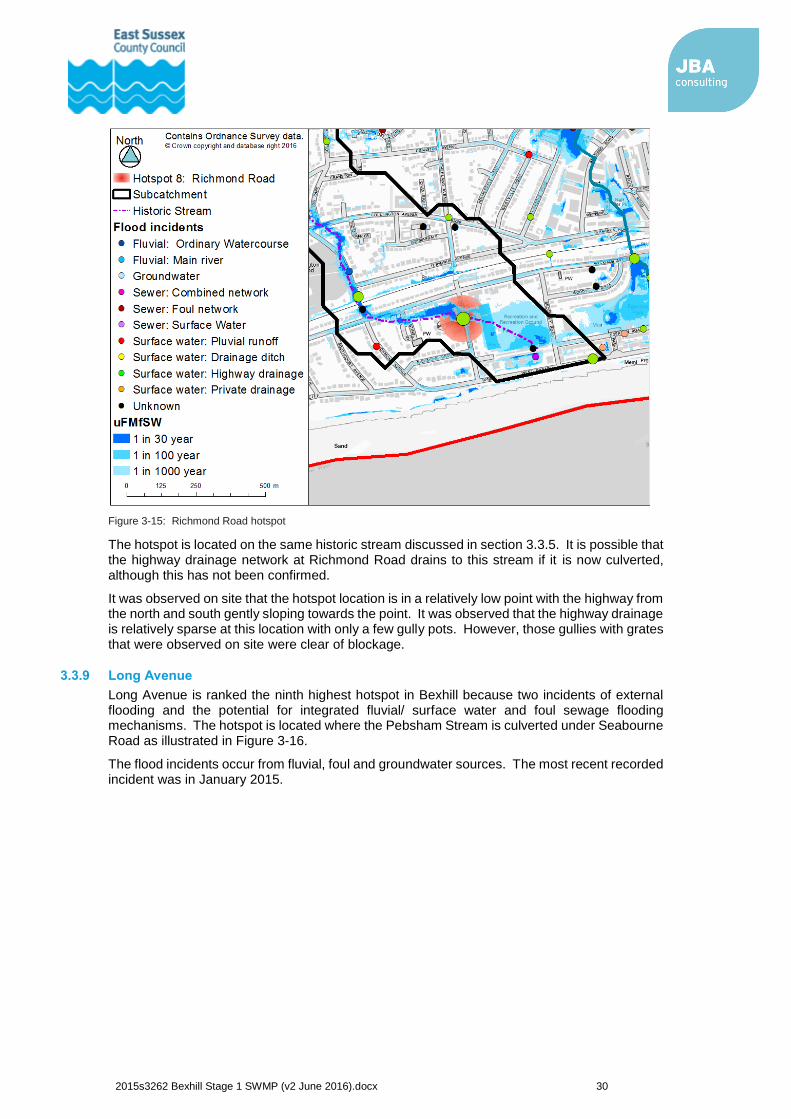
Figure 3-15: Richmond Road hotspot
The hotspot is located on the same historic stream discussed in section 3.3.5. It is possible that the highway drainage network at Richmond Road drains to this stream if it is now culverted, although this has not been confirmed.
It was observed on site that the hotspot location is in a relatively low point with the highway from the north and south gently sloping towards the point. It was observed that the highway drainage is relatively sparse at this location with only a few gully pots. However, those gullies with grates that were observed on site were clear of blockage.
3.3.9 Long Avenue
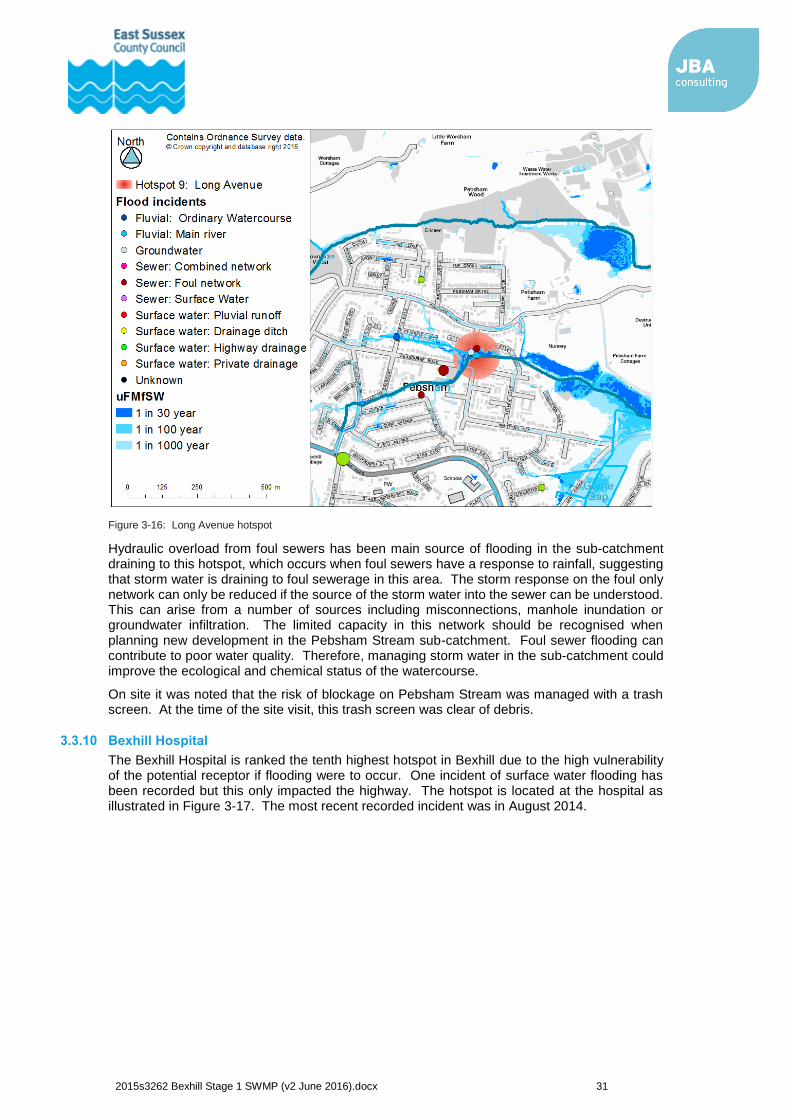
Long Avenue is ranked the ninth highest hotspot in Bexhill because two incidents of external flooding and the potential for integrated fluvial/ surface water and foul sewage flooding mechanisms. The hotspot is located where the Pebsham Stream is culverted under Seabourne Road as illustrated in Figure 3-16.
The flood incidents occur from fluvial, foul and groundwater sources. The most recent recorded incident was in January 2015.
2015s3262 Bexhill Stage 1 SWMP (v2 June 2016).docx 31
Figure 3-16: Long Avenue hotspot
Hydraulic overload from foul sewers has been main source of flooding in the sub-catchment draining to this hotspot, which occurs when foul sewers have a response to rainfall, suggesting that storm water is draining to foul sewerage in this area. The storm response on the foul only network can only be reduced if the source of the storm water into the sewer can be understood. This can arise from a number of sources including misconnections, manhole inundation or groundwater infiltration. The limited capacity in this network should be recognised when planning new development in the Pebsham Stream sub-catchment. Foul sewer flooding can contribute to poor water quality. Therefore, managing storm water in the sub-catchment could improve the ecological and chemical status of the watercourse.
On site it was noted that the risk of blockage on Pebsham Stream was managed with a trash screen. At the time of the site visit, this trash screen was clear of debris.
3.3.10 Bexhill Hospital
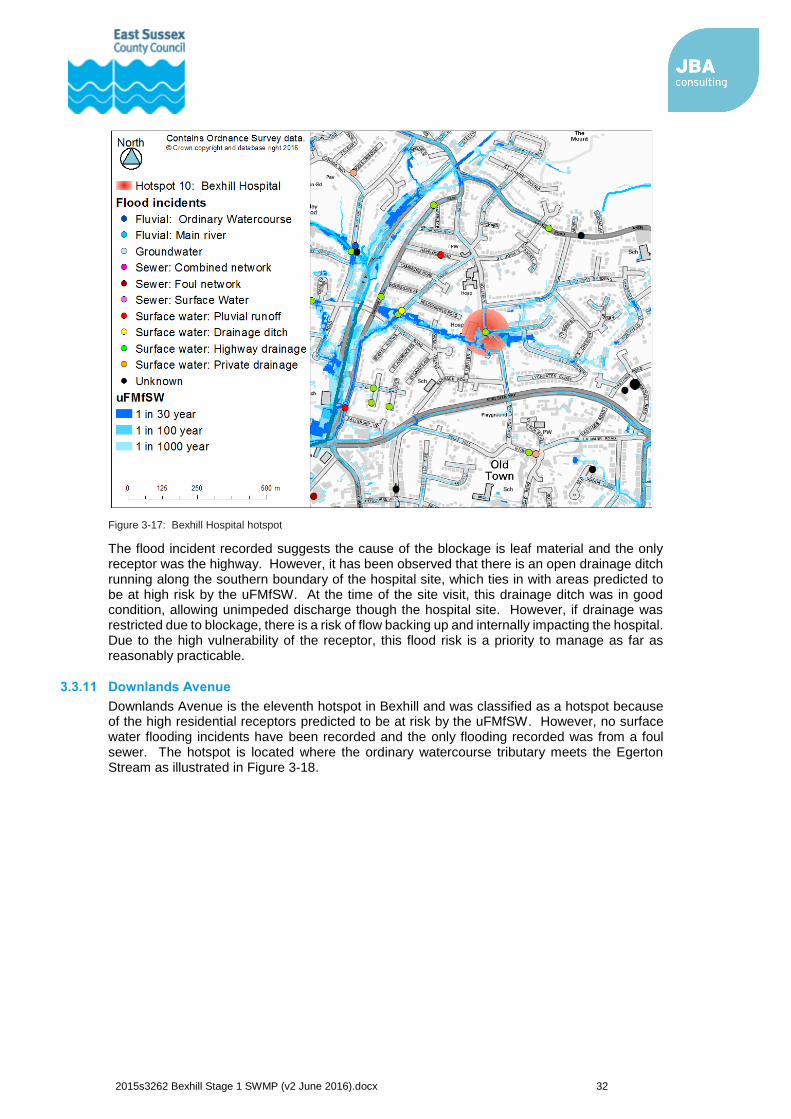
The Bexhill Hospital is ranked the tenth highest hotspot in Bexhill due to the high vulnerability of the potential receptor if flooding were to occur. One incident of surface water flooding has been recorded but this only impacted the highway. The hotspot is located at the hospital as illustrated in Figure 3-17. The most recent recorded incident was in August 2014.
2015s3262 Bexhill Stage 1 SWMP (v2 June 2016).docx 32
Figure 3-17: Bexhill Hospital hotspot
The flood incident recorded suggests the cause of the blockage is leaf material and the only receptor was the highway. However, it has been observed that there is an open drainage ditch running along the southern boundary of the hospital site, which ties in with areas predicted to be at high risk by the uFMfSW. At the time of the site visit, this drainage ditch was in good condition, allowing unimpeded discharge though the hospital site. However, if drainage was restricted due to blockage, there is a risk of flow backing up and internally impacting the hospital. Due to the high vulnerability of the receptor, this flood risk is a priority to manage as far as reasonably practicable.
3.3.11 Downlands Avenue
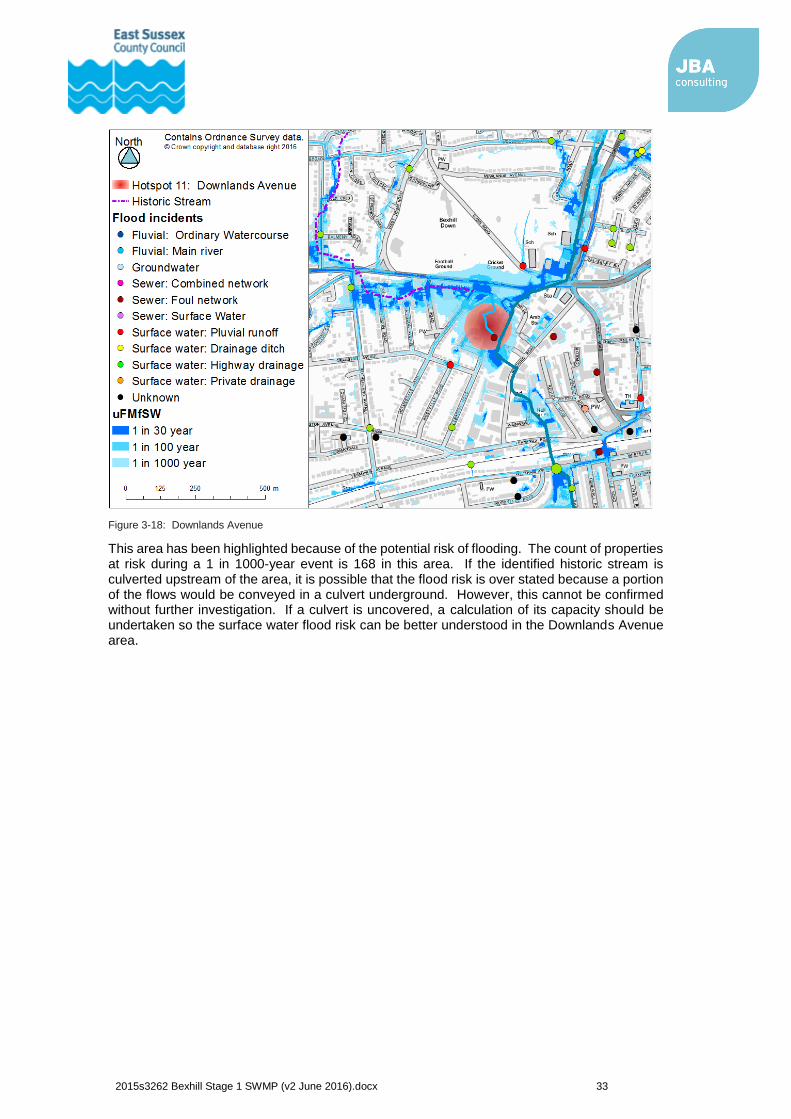
Downlands Avenue is the eleventh hotspot in Bexhill and was classified as a hotspot because of the high residential receptors predicted to be at risk by the uFMfSW. However, no surface water flooding incidents have been recorded and the only flooding recorded was from a foul sewer. The hotspot is located where the ordinary watercourse tributary meets the Egerton Stream as illustrated in Figure 3-18.
2015s3262 Bexhill Stage 1 SWMP (v2 June 2016).docx 33
Figure 3-18: Downlands Avenue
This area has been highlighted because of the potential risk of flooding. The count of properties at risk during a 1 in 1000-year event is 168 in this area. If the identified historic stream is culverted upstream of the area, it is possible that the flood risk is over stated because a portion of the flows would be conveyed in a culvert underground. However, this cannot be confirmed without further investigation. If a culvert is uncovered, a calculation of its capacity should be undertaken so the surface water flood risk can be better understood in the Downlands Avenue area.
2015s3262 Bexhill Stage 1 SWMP (v2 June 2016).docx 34
4 Planning Rother District Council is the planning authority in Bexhill. As such, the council has a strategic role in allocating areas of growth in Bexhill and in partnership with statutory consultees, is responsible for reviewing the suitability of development proposals.
The purpose of this section is to assess the risk of flooding (from local sources) to allocated development sites. This information can then be used by project partners and the local planning authority so that strategic planning decisions can take account of flood risk. It should be noted that areas identified for development could be subject to change as the planning process progresses.
4.1 The impact of climate change
Flood Risk Assessments (FRAs) are required as part of a planning application to demonstrate future implications of climate change have been considered, and risks managed where possible, for the lifetime of the proposed development. Updated guidance for climate change allowances for FRAs was released by the Environment Agency in February 20166. This provided predictions of anticipated change for
peak river flow;
peak rainfall intensity;
sea level rise; and
offshore wind speed and extreme wave height.
This guidance should be referred to when considering the future flood risk to proposed developments and although areas may not have been highlighted within this Stage 1 SWMP as hotspots currently, they may be at risk of increased flooding in the future.
4.2 Using SuDS
Surface water flooding is exacerbated by urbanisation. This is because natural, permeable land uses are replaced with impermeable surfaces. Sustainable drainage systems (SuDS) mimic natural systems and provide solutions to surface water runoff and pollution. As such, using SuDS in Bexhill could help mitigate the surface water flooding.
SuDS is an overarching term for various surface water management devices. The devices perform tasks such as capturing rain water, retaining surface water or filtering pollutants and some SuDS techniques are multipurpose. More information on the philosophy of SuDS, including technical information on design, construction and maintenance is available in CIRIA's SuDS Manual7 (2015).
In April 2015, new legislation established SuDS as part of the planning process. SuDS are now a planning requirement for major developments and it is the local planning authorities who control if a planning application is passed. To support the planning authority in their decision making, the Lead Local Flood Authority is now a statutory consultee with a role of reviewing the drainage component of a major planning applications.
In preparation for this role, ESCC partnered with other Lead Local Flood Authorities in 2013 to prepare the SuDS guidance document - 'Water. People. Places'8, which encourages the integration of SuDS into the development layout. In 2015, East Sussex County Council prepared an additional local guidance document, setting SuDS into an East Sussex context9. The documents are both available on the East Sussex website at https://new.eastsussex.gov.uk/environment/flooding/sustainabledrainagesystems/. Together these two guidance documents have been adopted as County Council policy on SuDS, supporting and assisting the delivery of the Local Flood Risk Management Strategy.
6 https://www.gov.uk/guidance/flood-risk-assessments-climate-change-allowances 7 CIRIA (2015) The SuDS Manual (C753) http://www.ciria.org/Memberships/The_SuDs_Manual_C753_Chapters.aspx 8 South East Seven (2013) Water. People. Places. A guide for master planning sustainable drainage into
developments. https://eastsussexgovuk.blob.core.windows.net/media/1994/se7-suds-masterplanning_low_res_reduced.pdf
9 East Sussex County Council (2015) Guide to Sustainable Drainage Systems in East Sussex. https://eastsussexgovuk.blob.core.windows.net/media/1995/guide-to-sustainable-drainage-systems-in-east-sussex2.pdf
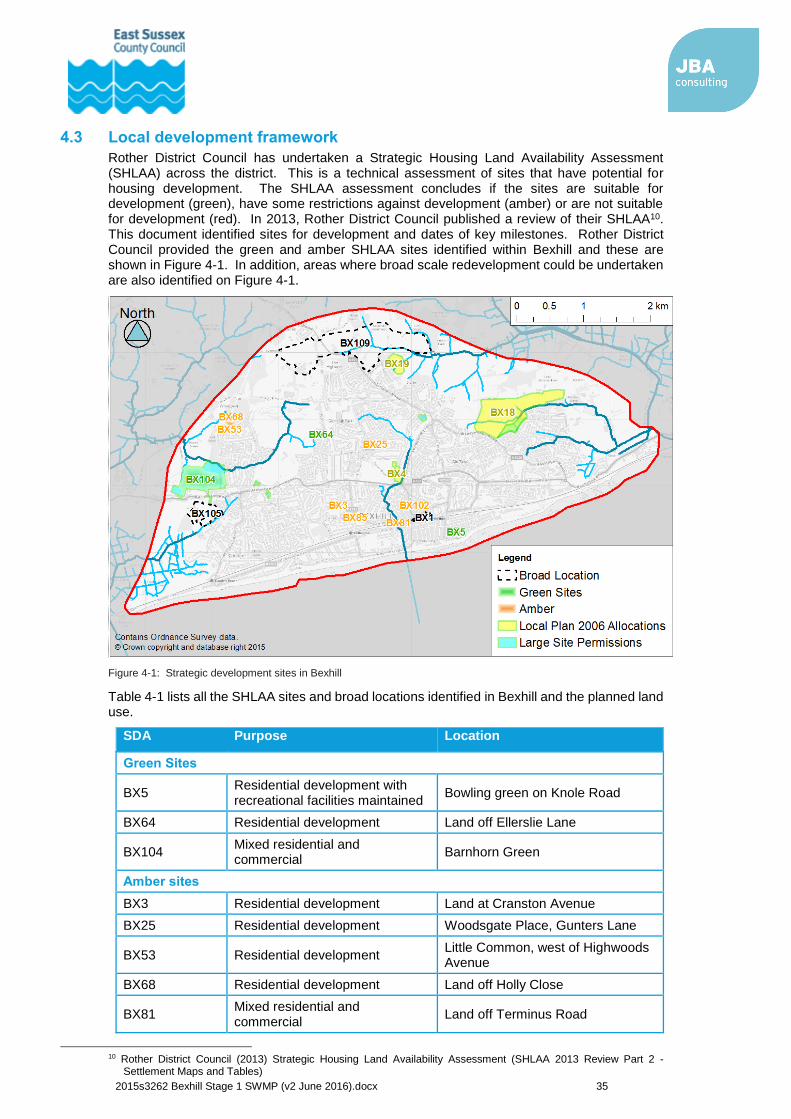
2015s3262 Bexhill Stage 1 SWMP (v2 June 2016).docx 35
4.3 Local development framework
Rother District Council has undertaken a Strategic Housing Land Availability Assessment (SHLAA) across the district. This is a technical assessment of sites that have potential for housing development. The SHLAA assessment concludes if the sites are suitable for development (green), have some restrictions against development (amber) or are not suitable for development (red). In 2013, Rother District Council published a review of their SHLAA10. This document identified sites for development and dates of key milestones. Rother District Council provided the green and amber SHLAA sites identified within Bexhill and these are shown in Figure 4-1. In addition, areas where broad scale redevelopment could be undertaken are also identified on Figure 4-1.
Figure 4-1: Strategic development sites in Bexhill
Table 4-1 lists all the SHLAA sites and broad locations identified in Bexhill and the planned land use.
SDA Purpose Location
Green Sites
BX5 Residential development with recreational facilities maintained
Bowling green on Knole Road
BX64 Residential development Land off Ellerslie Lane
BX104 Mixed residential and commercial
Barnhorn Green
Amber sites
BX3 Residential development Land at Cranston Avenue
BX25 Residential development Woodsgate Place, Gunters Lane
BX53 Residential development Little Common, west of Highwoods Avenue
BX68 Residential development Land off Holly Close
BX81 Mixed residential and commercial
Land off Terminus Road
10 Rother District Council (2013) Strategic Housing Land Availability Assessment (SHLAA 2013 Review Part 2 -
Settlement Maps and Tables)
2015s3262 Bexhill Stage 1 SWMP (v2 June 2016).docx 36
SDA Purpose Location
BX85 Residential development Land off Sutherland Avenue
BX102 Mixed residential and commercial
Land to the rear of Town Hall
Local Plan allocations
BX4 Mixed residential and commercial
High School Site and Drills Hall, Down Road
BX18 Mixed residential and commercial
Land north of Pebsham
BX19 Mixed residential and commercial
Land north of Sidley
Broad locations
BX1 Commercial development Sainsburys/Station Road
BX105 Residential development Land south of Barnhorn Road
BX109 Residential development North Bexhill
Table 4-1: Strategic development areas allocated in Bexhill
4.4 Development areas in hotspots
In line with the National Planning Policy Framework (NPPF; 2012) local planning authorities should prepare a Strategic Flood Risk Assessment11 (SFRA) as part of the evidence base supporting the development of their local plans.
The hotspots pin point one location where flooding has or is likely to arise. However, any change in land use in the sub-catchment upstream of a hotspot has the potential to impact the flood risk if runoff rates change. Therefore, this assessment looks at the area draining to a hotspot in addition to the hotspot locations.
There is one green site within a hotspot sub-catchment; BX104, which is within the Picknell Green Stream catchment. At the BX104 site, there have been no reported flooding incidents and the uFMfSW indicates that the flood risk to the majority of the site is very low. The access from Willow Drive is the area of highest risk. The majority of this development site would drain towards the Picknell Green Stream. Therefore, if the surface water runoff rate was increased from greenfield runoff rates, the fluvial flood risk could be increased downstream. However, as the stream then flows into the Pevensey Levels, it is unlikely that increased flow would impact communities as this area is lowly populated. According to the Flood Map for Planning, there is also fluvial flood risk to the north of this site.
Three of the amber sites are within a hotspot sub-catchment; BX3, BX25 and BX85. A summary of the flood risk to these site is included in Table 4-2.
Site Code Hotspot Flood Incidents
Surface Water flood risk*
Constraint Opportunity
BX3 Sutherland Avenue
No reported incidents
Very low risk Potential drain to culverted stream
Reduce runoff from site using SuDS
BX25 Buxton Drive
No reported incidents
Very low risk None identified Reduce runoff from site using SuDS
BX85 Sutherland Avenue
No reported incidents
Very low risk Potential drain to culverted stream
Reduce runoff from site using SuDS
*Based on the national uFMfSW
Table 4-2: Flood risk to development sites
Local Plan Allocation BX4 is located adjacent to the Egerton Stream within the Egerton Stream hotspot. Although there has not been any recorded flood incidents within the site, the uFMfSW
11 Department for Communities and Local Government (2012) National Planning Policy Framework.
www.communities.gov.uk
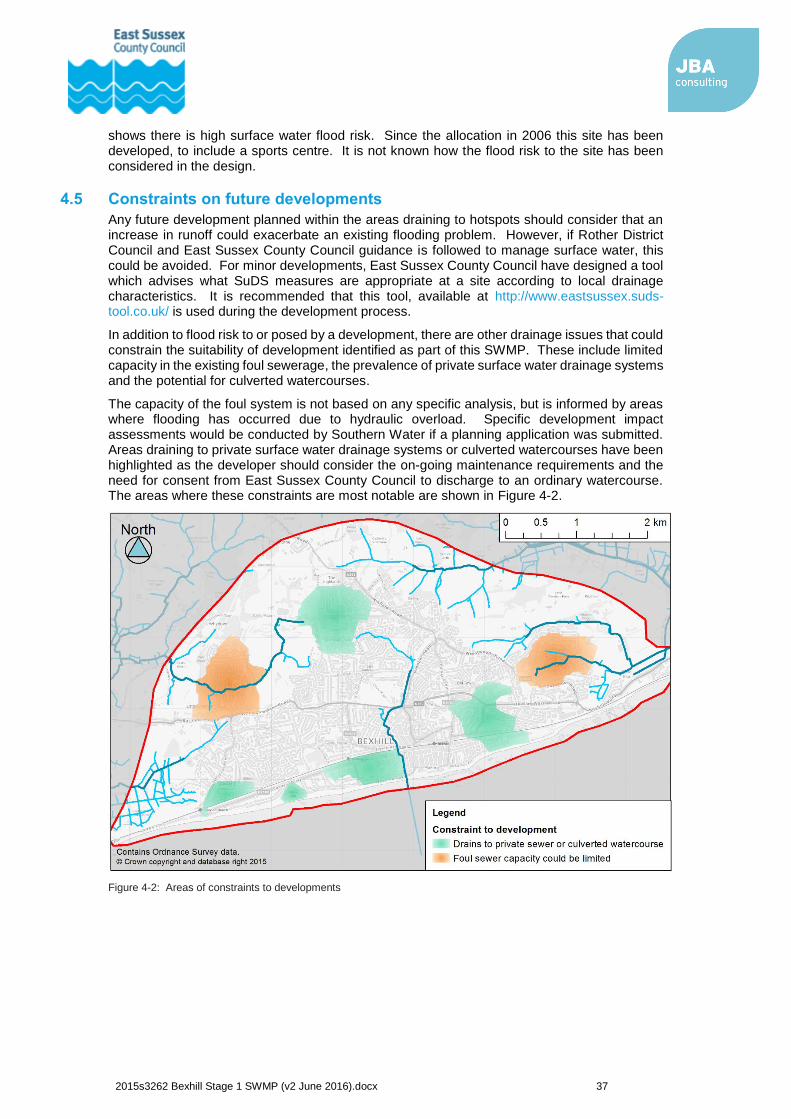
2015s3262 Bexhill Stage 1 SWMP (v2 June 2016).docx 37
shows there is high surface water flood risk. Since the allocation in 2006 this site has been developed, to include a sports centre. It is not known how the flood risk to the site has been considered in the design.
4.5 Constraints on future developments
Any future development planned within the areas draining to hotspots should consider that an increase in runoff could exacerbate an existing flooding problem. However, if Rother District Council and East Sussex County Council guidance is followed to manage surface water, this could be avoided. For minor developments, East Sussex County Council have designed a tool which advises what SuDS measures are appropriate at a site according to local drainage characteristics. It is recommended that this tool, available at http://www.eastsussex.suds-tool.co.uk/ is used during the development process.
In addition to flood risk to or posed by a development, there are other drainage issues that could constrain the suitability of development identified as part of this SWMP. These include limited capacity in the existing foul sewerage, the prevalence of private surface water drainage systems and the potential for culverted watercourses.
The capacity of the foul system is not based on any specific analysis, but is informed by areas where flooding has occurred due to hydraulic overload. Specific development impact assessments would be conducted by Southern Water if a planning application was submitted. Areas draining to private surface water drainage systems or culverted watercourses have been highlighted as the developer should consider the on-going maintenance requirements and the need for consent from East Sussex County Council to discharge to an ordinary watercourse. The areas where these constraints are most notable are shown in Figure 4-2.
Figure 4-2: Areas of constraints to developments
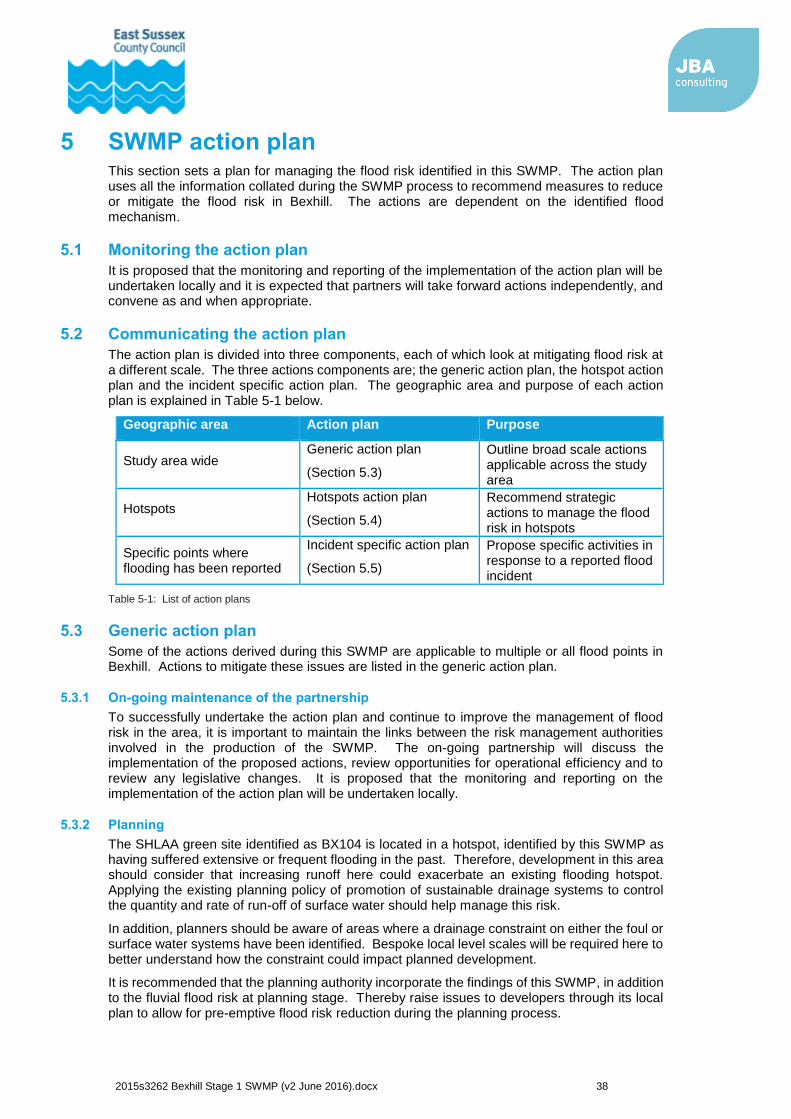
2015s3262 Bexhill Stage 1 SWMP (v2 June 2016).docx 38
5 SWMP action plan This section sets a plan for managing the flood risk identified in this SWMP. The action plan uses all the information collated during the SWMP process to recommend measures to reduce or mitigate the flood risk in Bexhill. The actions are dependent on the identified flood mechanism.
5.1 Monitoring the action plan
It is proposed that the monitoring and reporting of the implementation of the action plan will be undertaken locally and it is expected that partners will take forward actions independently, and convene as and when appropriate.
5.2 Communicating the action plan
The action plan is divided into three components, each of which look at mitigating flood risk at a different scale. The three actions components are; the generic action plan, the hotspot action plan and the incident specific action plan. The geographic area and purpose of each action plan is explained in Table 5-1 below.
Geographic area Action plan Purpose
Study area wide Generic action plan
(Section 5.3)
Outline broad scale actions applicable across the study area
Hotspots Hotspots action plan
(Section 5.4)
Recommend strategic actions to manage the flood risk in hotspots
Specific points where flooding has been reported
Incident specific action plan
(Section 5.5)
Propose specific activities in response to a reported flood incident
Table 5-1: List of action plans
5.3 Generic action plan
Some of the actions derived during this SWMP are applicable to multiple or all flood points in Bexhill. Actions to mitigate these issues are listed in the generic action plan.
5.3.1 On-going maintenance of the partnership
To successfully undertake the action plan and continue to improve the management of flood risk in the area, it is important to maintain the links between the risk management authorities involved in the production of the SWMP. The on-going partnership will discuss the implementation of the proposed actions, review opportunities for operational efficiency and to review any legislative changes. It is proposed that the monitoring and reporting on the implementation of the action plan will be undertaken locally.
5.3.2 Planning
The SHLAA green site identified as BX104 is located in a hotspot, identified by this SWMP as having suffered extensive or frequent flooding in the past. Therefore, development in this area should consider that increasing runoff here could exacerbate an existing flooding hotspot. Applying the existing planning policy of promotion of sustainable drainage systems to control the quantity and rate of run-off of surface water should help manage this risk.
In addition, planners should be aware of areas where a drainage constraint on either the foul or surface water systems have been identified. Bespoke local level scales will be required here to better understand how the constraint could impact planned development.
It is recommended that the planning authority incorporate the findings of this SWMP, in addition to the fluvial flood risk at planning stage. Thereby raise issues to developers through its local plan to allow for pre-emptive flood risk reduction during the planning process.
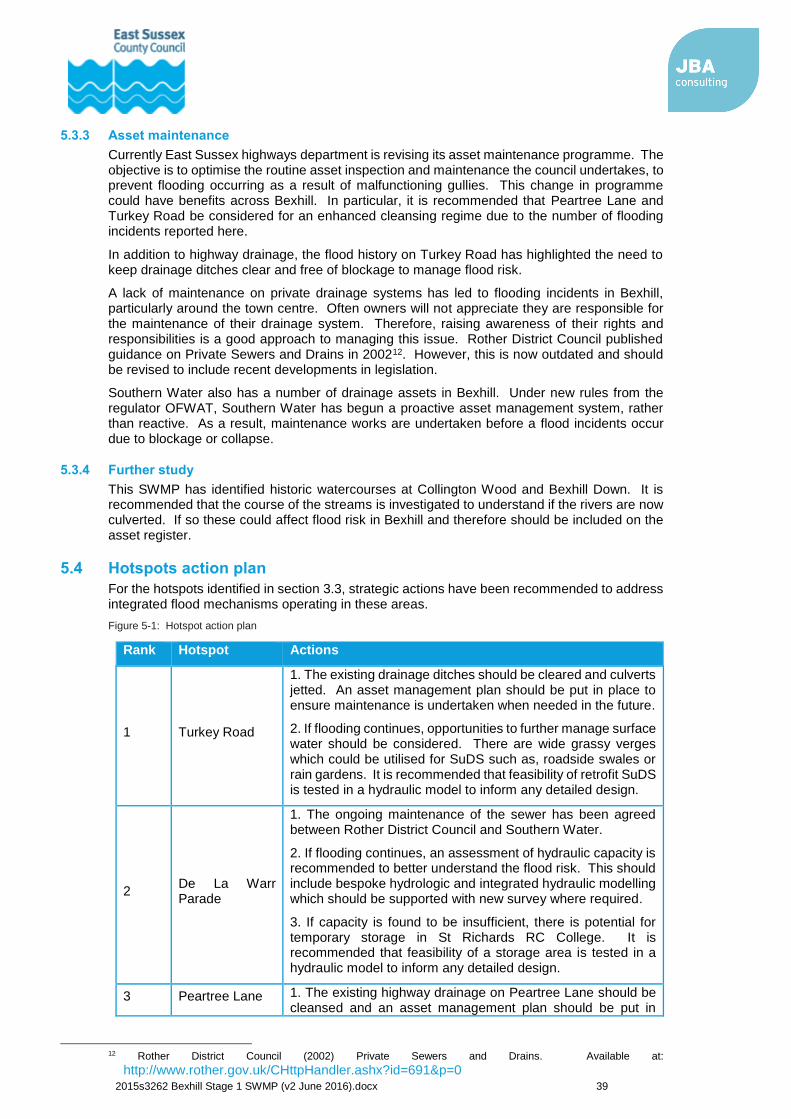
2015s3262 Bexhill Stage 1 SWMP (v2 June 2016).docx 39
5.3.3 Asset maintenance
Currently East Sussex highways department is revising its asset maintenance programme. The objective is to optimise the routine asset inspection and maintenance the council undertakes, to prevent flooding occurring as a result of malfunctioning gullies. This change in programme could have benefits across Bexhill. In particular, it is recommended that Peartree Lane and Turkey Road be considered for an enhanced cleansing regime due to the number of flooding incidents reported here.
In addition to highway drainage, the flood history on Turkey Road has highlighted the need to keep drainage ditches clear and free of blockage to manage flood risk.
A lack of maintenance on private drainage systems has led to flooding incidents in Bexhill, particularly around the town centre. Often owners will not appreciate they are responsible for the maintenance of their drainage system. Therefore, raising awareness of their rights and responsibilities is a good approach to managing this issue. Rother District Council published guidance on Private Sewers and Drains in 200212. However, this is now outdated and should be revised to include recent developments in legislation.
Southern Water also has a number of drainage assets in Bexhill. Under new rules from the regulator OFWAT, Southern Water has begun a proactive asset management system, rather than reactive. As a result, maintenance works are undertaken before a flood incidents occur due to blockage or collapse.
5.3.4 Further study
This SWMP has identified historic watercourses at Collington Wood and Bexhill Down. It is recommended that the course of the streams is investigated to understand if the rivers are now culverted. If so these could affect flood risk in Bexhill and therefore should be included on the asset register.
5.4 Hotspots action plan
For the hotspots identified in section 3.3, strategic actions have been recommended to address integrated flood mechanisms operating in these areas.
Figure 5-1: Hotspot action plan
Rank Hotspot Actions
1 Turkey Road
1. The existing drainage ditches should be cleared and culverts jetted. An asset management plan should be put in place to ensure maintenance is undertaken when needed in the future.
2. If flooding continues, opportunities to further manage surface water should be considered. There are wide grassy verges which could be utilised for SuDS such as, roadside swales or rain gardens. It is recommended that feasibility of retrofit SuDS is tested in a hydraulic model to inform any detailed design.
2 De La Warr Parade
1. The ongoing maintenance of the sewer has been agreed between Rother District Council and Southern Water.
2. If flooding continues, an assessment of hydraulic capacity is recommended to better understand the flood risk. This should include bespoke hydrologic and integrated hydraulic modelling which should be supported with new survey where required.
3. If capacity is found to be insufficient, there is potential for temporary storage in St Richards RC College. It is recommended that feasibility of a storage area is tested in a hydraulic model to inform any detailed design.
3 Peartree Lane 1. The existing highway drainage on Peartree Lane should be cleansed and an asset management plan should be put in
12 Rother District Council (2002) Private Sewers and Drains. Available at:
http://www.rother.gov.uk/CHttpHandler.ashx?id=691&p=0
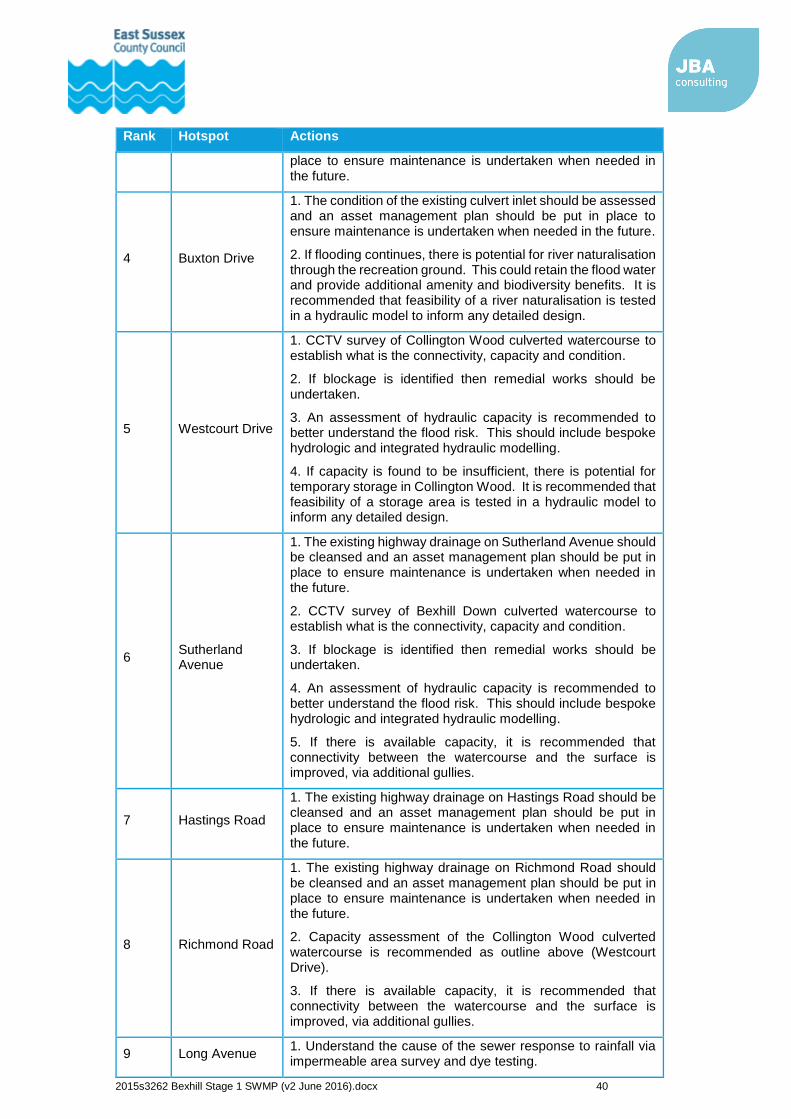
2015s3262 Bexhill Stage 1 SWMP (v2 June 2016).docx 40
Rank Hotspot Actions
place to ensure maintenance is undertaken when needed in the future.
4 Buxton Drive
1. The condition of the existing culvert inlet should be assessed and an asset management plan should be put in place to ensure maintenance is undertaken when needed in the future.
2. If flooding continues, there is potential for river naturalisation through the recreation ground. This could retain the flood water and provide additional amenity and biodiversity benefits. It is recommended that feasibility of a river naturalisation is tested in a hydraulic model to inform any detailed design.
5 Westcourt Drive
1. CCTV survey of Collington Wood culverted watercourse to establish what is the connectivity, capacity and condition.
2. If blockage is identified then remedial works should be undertaken.
3. An assessment of hydraulic capacity is recommended to better understand the flood risk. This should include bespoke hydrologic and integrated hydraulic modelling.
4. If capacity is found to be insufficient, there is potential for temporary storage in Collington Wood. It is recommended that feasibility of a storage area is tested in a hydraulic model to inform any detailed design.
6 Sutherland Avenue
1. The existing highway drainage on Sutherland Avenue should be cleansed and an asset management plan should be put in place to ensure maintenance is undertaken when needed in the future.
2. CCTV survey of Bexhill Down culverted watercourse to establish what is the connectivity, capacity and condition.
3. If blockage is identified then remedial works should be undertaken.
4. An assessment of hydraulic capacity is recommended to better understand the flood risk. This should include bespoke hydrologic and integrated hydraulic modelling.
5. If there is available capacity, it is recommended that connectivity between the watercourse and the surface is improved, via additional gullies.
7 Hastings Road
1. The existing highway drainage on Hastings Road should be cleansed and an asset management plan should be put in place to ensure maintenance is undertaken when needed in the future.
8 Richmond Road
1. The existing highway drainage on Richmond Road should be cleansed and an asset management plan should be put in place to ensure maintenance is undertaken when needed in the future.
2. Capacity assessment of the Collington Wood culverted watercourse is recommended as outline above (Westcourt Drive).
3. If there is available capacity, it is recommended that connectivity between the watercourse and the surface is improved, via additional gullies.
9 Long Avenue 1. Understand the cause of the sewer response to rainfall via impermeable area survey and dye testing.
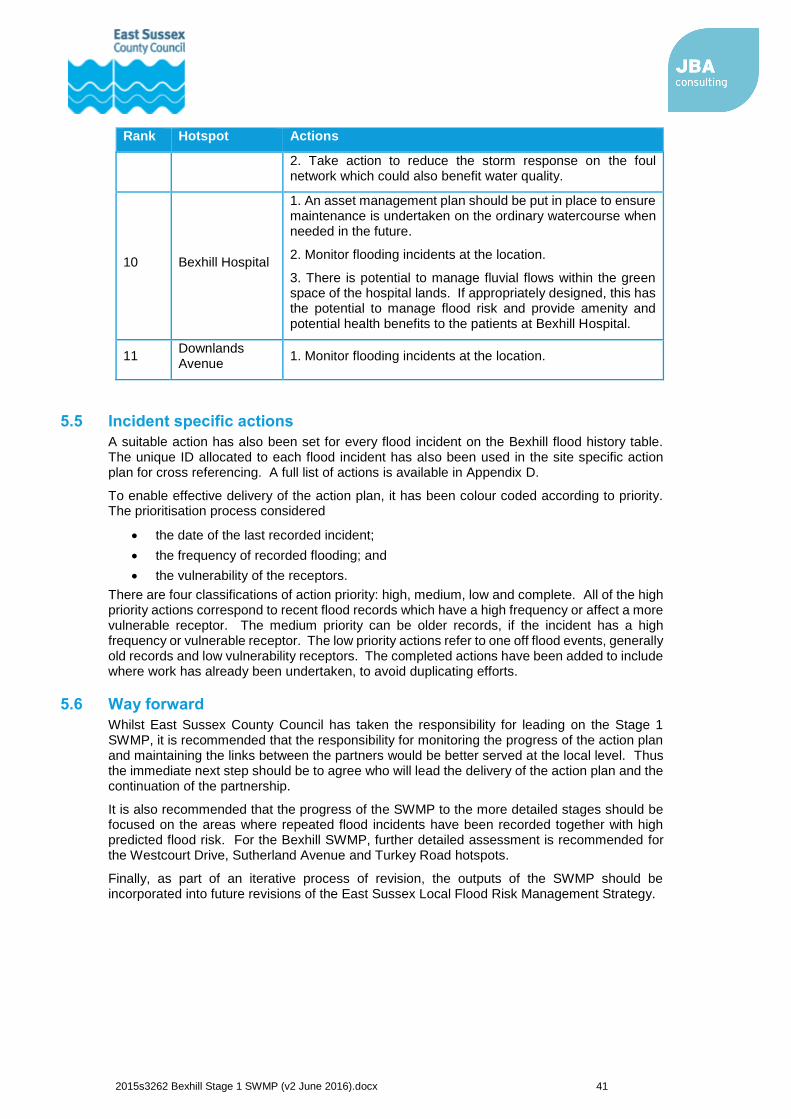
2015s3262 Bexhill Stage 1 SWMP (v2 June 2016).docx 41
Rank Hotspot Actions
2. Take action to reduce the storm response on the foul network which could also benefit water quality.
10 Bexhill Hospital
1. An asset management plan should be put in place to ensure maintenance is undertaken on the ordinary watercourse when needed in the future.
2. Monitor flooding incidents at the location.
3. There is potential to manage fluvial flows within the green space of the hospital lands. If appropriately designed, this has the potential to manage flood risk and provide amenity and potential health benefits to the patients at Bexhill Hospital.
11 Downlands Avenue
1. Monitor flooding incidents at the location.
5.5 Incident specific actions
A suitable action has also been set for every flood incident on the Bexhill flood history table. The unique ID allocated to each flood incident has also been used in the site specific action plan for cross referencing. A full list of actions is available in Appendix D.
To enable effective delivery of the action plan, it has been colour coded according to priority. The prioritisation process considered
the date of the last recorded incident;
the frequency of recorded flooding; and
the vulnerability of the receptors.
There are four classifications of action priority: high, medium, low and complete. All of the high priority actions correspond to recent flood records which have a high frequency or affect a more vulnerable receptor. The medium priority can be older records, if the incident has a high frequency or vulnerable receptor. The low priority actions refer to one off flood events, generally old records and low vulnerability receptors. The completed actions have been added to include where work has already been undertaken, to avoid duplicating efforts.
5.6 Way forward
Whilst East Sussex County Council has taken the responsibility for leading on the Stage 1 SWMP, it is recommended that the responsibility for monitoring the progress of the action plan and maintaining the links between the partners would be better served at the local level. Thus the immediate next step should be to agree who will lead the delivery of the action plan and the continuation of the partnership.
It is also recommended that the progress of the SWMP to the more detailed stages should be focused on the areas where repeated flood incidents have been recorded together with high predicted flood risk. For the Bexhill SWMP, further detailed assessment is recommended for the Westcourt Drive, Sutherland Avenue and Turkey Road hotspots.
Finally, as part of an iterative process of revision, the outputs of the SWMP should be incorporated into future revisions of the East Sussex Local Flood Risk Management Strategy.

2015s3262 Bexhill Stage 1 SWMP (v2 June 2016).docx 1
Appendices
2015s3262 Bexhill Stage 1 SWMP (v2 June 2016).docx i
A Appendix A - Data Quality Score
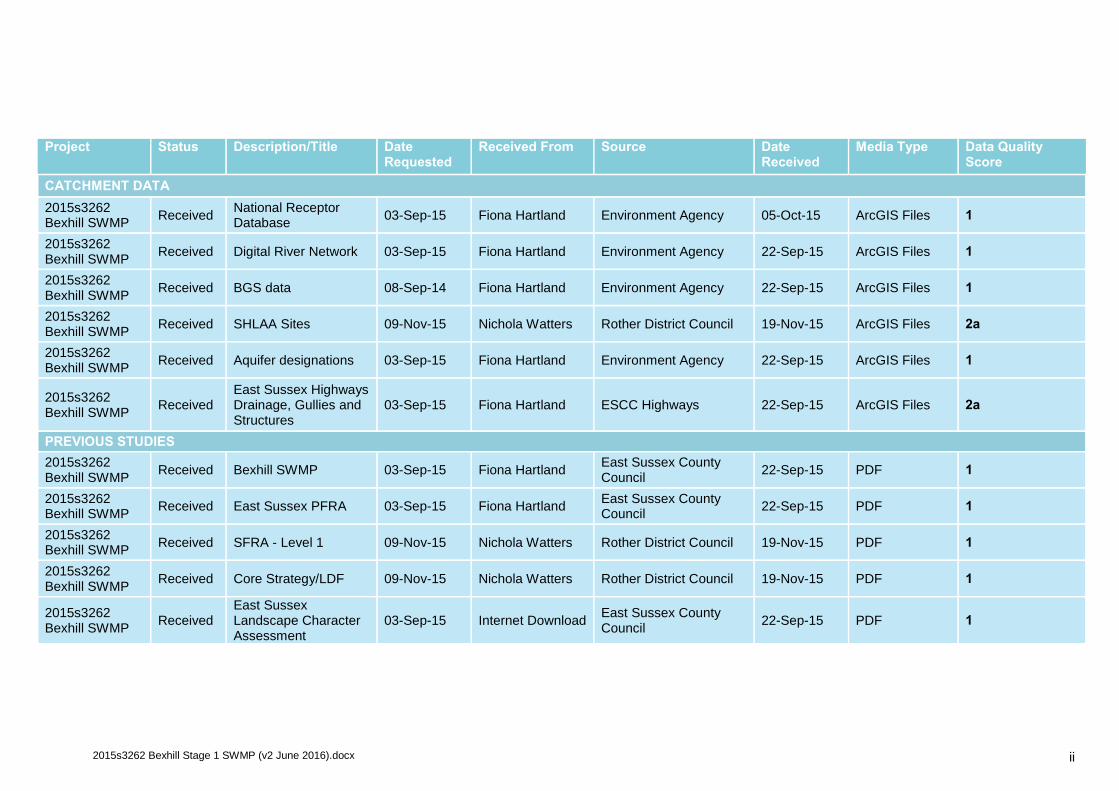
2015s3262 Bexhill Stage 1 SWMP (v2 June 2016).docx ii
Project Status Description/Title Date Requested
Received From Source Date Received
Media Type Data Quality Score
CATCHMENT DATA
2015s3262 Bexhill SWMP
Received National Receptor Database
03-Sep-15 Fiona Hartland Environment Agency 05-Oct-15 ArcGIS Files 1
2015s3262 Bexhill SWMP
Received Digital River Network 03-Sep-15 Fiona Hartland Environment Agency 22-Sep-15 ArcGIS Files 1
2015s3262 Bexhill SWMP
Received BGS data 08-Sep-14 Fiona Hartland Environment Agency 22-Sep-15 ArcGIS Files 1
2015s3262 Bexhill SWMP
Received SHLAA Sites 09-Nov-15 Nichola Watters Rother District Council 19-Nov-15 ArcGIS Files 2a
2015s3262 Bexhill SWMP
Received Aquifer designations 03-Sep-15 Fiona Hartland Environment Agency 22-Sep-15 ArcGIS Files 1
2015s3262 Bexhill SWMP
Received East Sussex Highways Drainage, Gullies and Structures
03-Sep-15 Fiona Hartland ESCC Highways 22-Sep-15 ArcGIS Files 2a
PREVIOUS STUDIES
2015s3262 Bexhill SWMP
Received Bexhill SWMP 03-Sep-15 Fiona Hartland East Sussex County Council
22-Sep-15 PDF 1
2015s3262 Bexhill SWMP
Received East Sussex PFRA 03-Sep-15 Fiona Hartland East Sussex County Council
22-Sep-15 PDF 1
2015s3262 Bexhill SWMP
Received SFRA - Level 1 09-Nov-15 Nichola Watters Rother District Council 19-Nov-15 PDF 1
2015s3262 Bexhill SWMP
Received Core Strategy/LDF 09-Nov-15 Nichola Watters Rother District Council 19-Nov-15 PDF 1
2015s3262 Bexhill SWMP
Received East Sussex Landscape Character Assessment
03-Sep-15 Internet Download East Sussex County Council
22-Sep-15 PDF 1
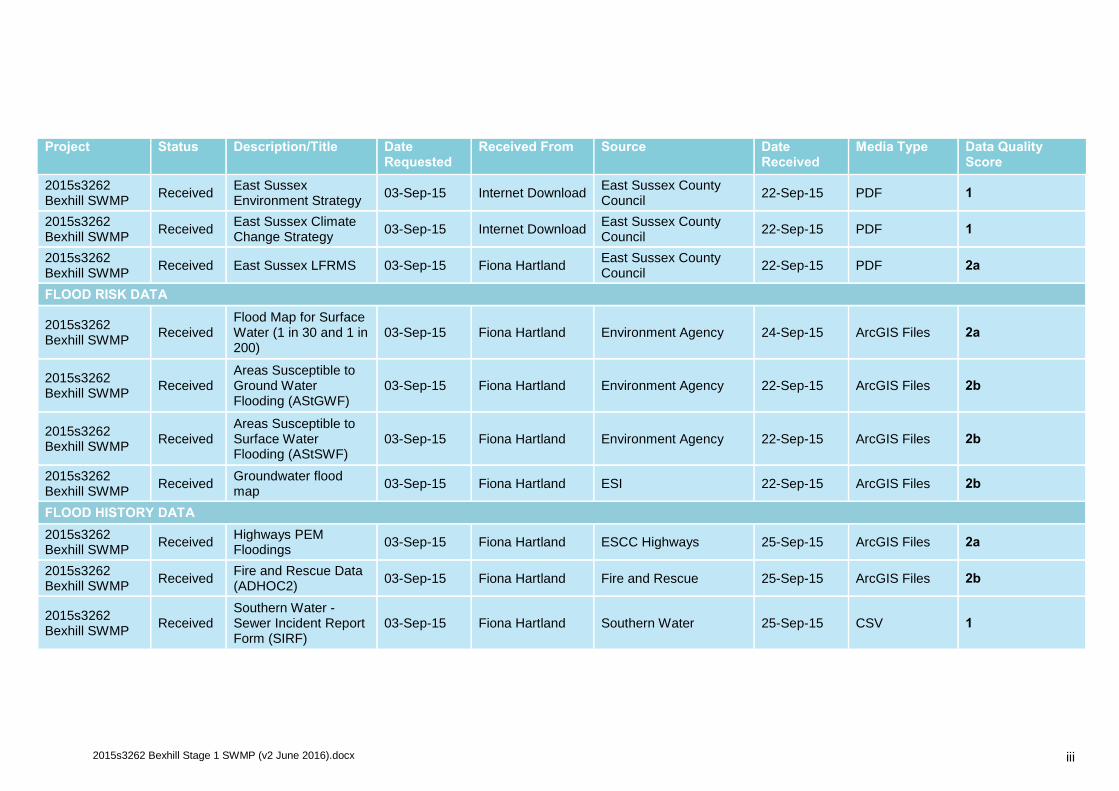
2015s3262 Bexhill Stage 1 SWMP (v2 June 2016).docx iii
Project Status Description/Title Date Requested
Received From Source Date Received
Media Type Data Quality Score
2015s3262 Bexhill SWMP
Received East Sussex Environment Strategy
03-Sep-15 Internet Download East Sussex County Council
22-Sep-15 PDF 1
2015s3262 Bexhill SWMP
Received East Sussex Climate Change Strategy
03-Sep-15 Internet Download East Sussex County Council
22-Sep-15 PDF 1
2015s3262 Bexhill SWMP
Received East Sussex LFRMS 03-Sep-15 Fiona Hartland East Sussex County Council
22-Sep-15 PDF 2a
FLOOD RISK DATA
2015s3262 Bexhill SWMP
Received Flood Map for Surface Water (1 in 30 and 1 in 200)
03-Sep-15 Fiona Hartland Environment Agency 24-Sep-15 ArcGIS Files 2a
2015s3262 Bexhill SWMP
Received Areas Susceptible to Ground Water Flooding (AStGWF)
03-Sep-15 Fiona Hartland Environment Agency 22-Sep-15 ArcGIS Files 2b
2015s3262 Bexhill SWMP
Received Areas Susceptible to Surface Water Flooding (AStSWF)
03-Sep-15 Fiona Hartland Environment Agency 22-Sep-15 ArcGIS Files 2b
2015s3262 Bexhill SWMP
Received Groundwater flood map
03-Sep-15 Fiona Hartland ESI 22-Sep-15 ArcGIS Files 2b
FLOOD HISTORY DATA
2015s3262 Bexhill SWMP
Received Highways PEM Floodings
03-Sep-15 Fiona Hartland ESCC Highways 25-Sep-15 ArcGIS Files 2a
2015s3262 Bexhill SWMP
Received Fire and Rescue Data (ADHOC2)
03-Sep-15 Fiona Hartland Fire and Rescue 25-Sep-15 ArcGIS Files 2b
2015s3262 Bexhill SWMP
Received Southern Water - Sewer Incident Report Form (SIRF)
03-Sep-15 Fiona Hartland Southern Water 25-Sep-15 CSV 1
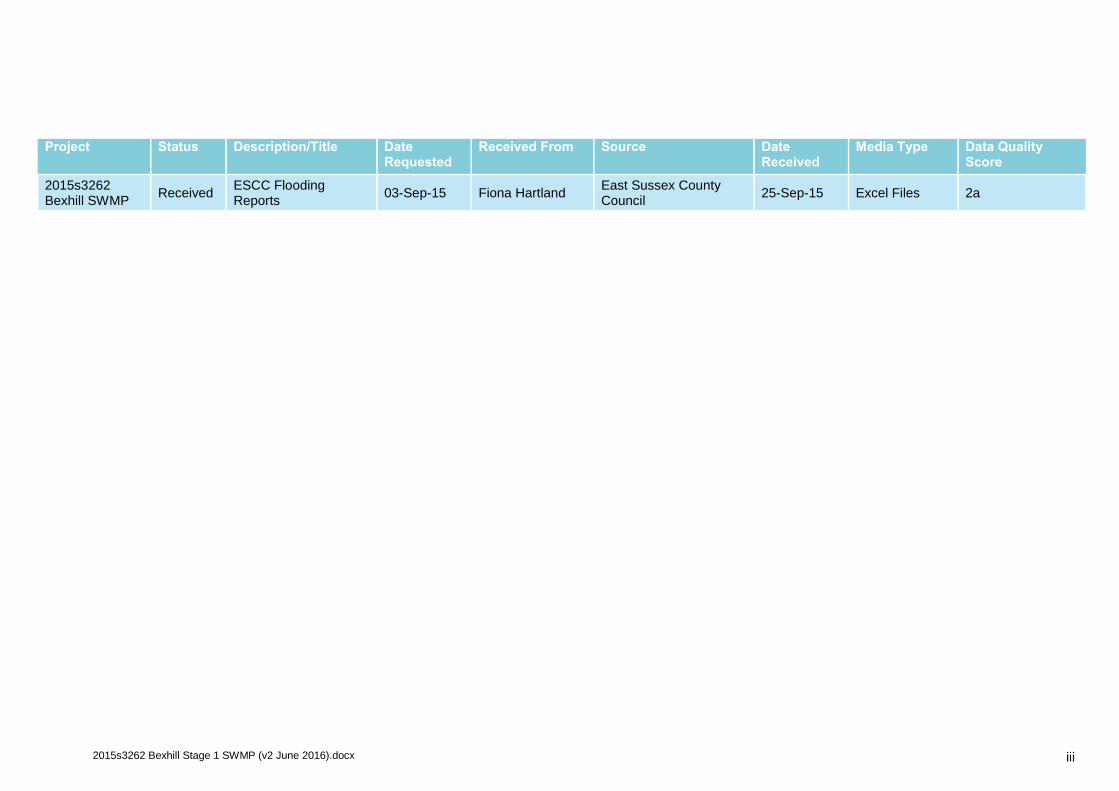
2015s3262 Bexhill Stage 1 SWMP (v2 June 2016).docx iii
Project Status Description/Title Date Requested
Received From Source Date Received
Media Type Data Quality Score
2015s3262 Bexhill SWMP
Received ESCC Flooding Reports
03-Sep-15 Fiona Hartland East Sussex County Council
25-Sep-15 Excel Files 2a

2015s3262 Bexhill Stage 1 SWMP (v2 June 2016).docx ii
B Appendix B - Flood History Table
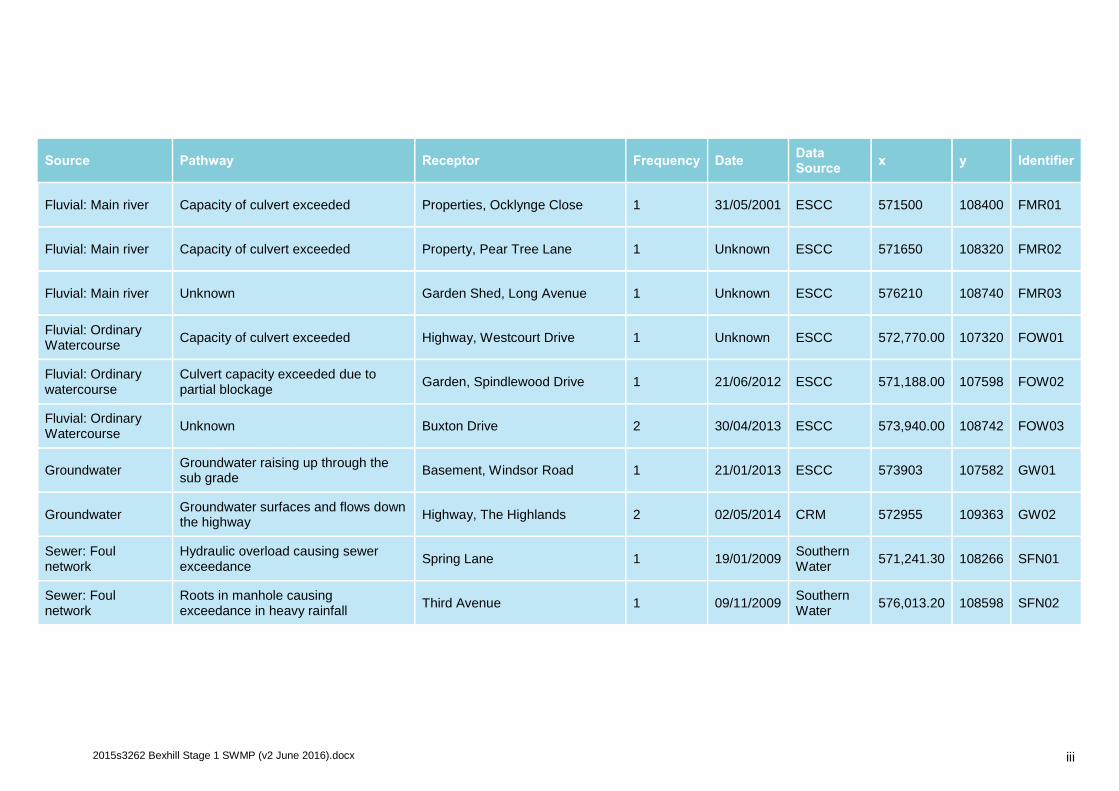
2015s3262 Bexhill Stage 1 SWMP (v2 June 2016).docx iii
Source Pathway Receptor Frequency Date Data Source
x y Identifier
Fluvial: Main river Capacity of culvert exceeded Properties, Ocklynge Close 1 31/05/2001 ESCC 571500 108400 FMR01
Fluvial: Main river Capacity of culvert exceeded Property, Pear Tree Lane 1 Unknown ESCC 571650 108320 FMR02
Fluvial: Main river Unknown Garden Shed, Long Avenue 1 Unknown ESCC 576210 108740 FMR03
Fluvial: Ordinary Watercourse
Capacity of culvert exceeded Highway, Westcourt Drive 1 Unknown ESCC 572,770.00 107320 FOW01
Fluvial: Ordinary watercourse
Culvert capacity exceeded due to partial blockage
Garden, Spindlewood Drive 1 21/06/2012 ESCC 571,188.00 107598 FOW02
Fluvial: Ordinary Watercourse
Unknown Buxton Drive 2 30/04/2013 ESCC 573,940.00 108742 FOW03
Groundwater Groundwater raising up through the sub grade
Basement, Windsor Road 1 21/01/2013 ESCC 573903 107582 GW01
Groundwater Groundwater surfaces and flows down the highway
Highway, The Highlands 2 02/05/2014 CRM 572955 109363 GW02
Sewer: Foul network
Hydraulic overload causing sewer exceedance
Spring Lane 1 19/01/2009 Southern Water
571,241.30 108266 SFN01
Sewer: Foul network
Roots in manhole causing exceedance in heavy rainfall
Third Avenue 1 09/11/2009 Southern Water
576,013.20 108598 SFN02
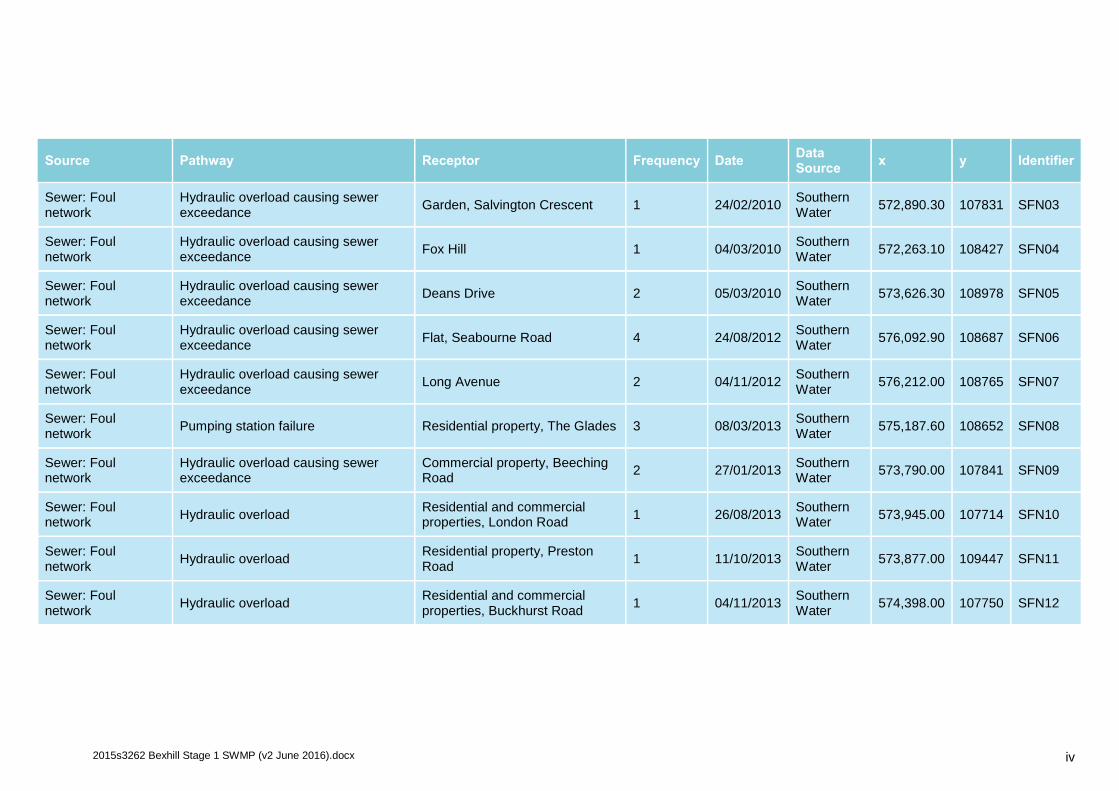
2015s3262 Bexhill Stage 1 SWMP (v2 June 2016).docx iv
Source Pathway Receptor Frequency Date Data Source
x y Identifier
Sewer: Foul network
Hydraulic overload causing sewer exceedance
Garden, Salvington Crescent 1 24/02/2010 Southern Water
572,890.30 107831 SFN03
Sewer: Foul network
Hydraulic overload causing sewer exceedance
Fox Hill 1 04/03/2010 Southern Water
572,263.10 108427 SFN04
Sewer: Foul network
Hydraulic overload causing sewer exceedance
Deans Drive 2 05/03/2010 Southern Water
573,626.30 108978 SFN05
Sewer: Foul network
Hydraulic overload causing sewer exceedance
Flat, Seabourne Road 4 24/08/2012 Southern Water
576,092.90 108687 SFN06
Sewer: Foul network
Hydraulic overload causing sewer exceedance
Long Avenue 2 04/11/2012 Southern Water
576,212.00 108765 SFN07
Sewer: Foul network
Pumping station failure Residential property, The Glades 3 08/03/2013 Southern Water
575,187.60 108652 SFN08
Sewer: Foul network
Hydraulic overload causing sewer exceedance
Commercial property, Beeching Road
2 27/01/2013 Southern Water
573,790.00 107841 SFN09
Sewer: Foul network
Hydraulic overload Residential and commercial properties, London Road
1 26/08/2013 Southern Water
573,945.00 107714 SFN10
Sewer: Foul network
Hydraulic overload Residential property, Preston Road
1 11/10/2013 Southern Water
573,877.00 109447 SFN11
Sewer: Foul network
Hydraulic overload Residential and commercial properties, Buckhurst Road
1 04/11/2013 Southern Water
574,398.00 107750 SFN12
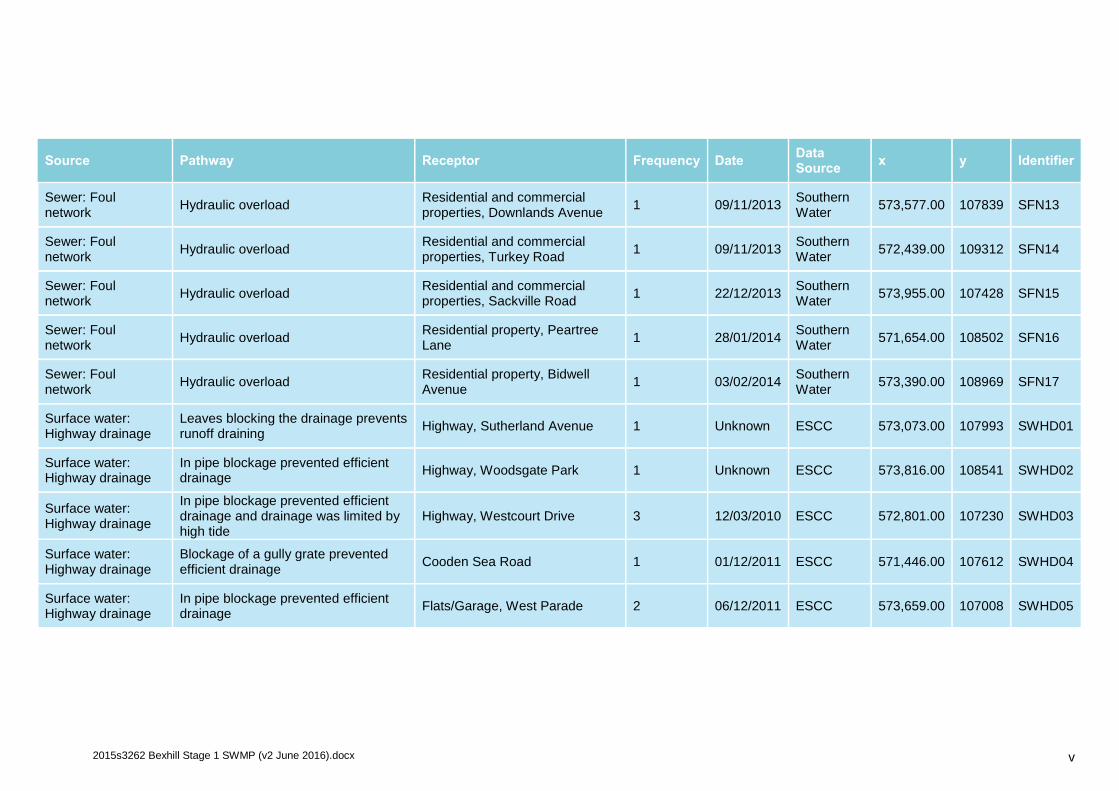
2015s3262 Bexhill Stage 1 SWMP (v2 June 2016).docx v
Source Pathway Receptor Frequency Date Data Source
x y Identifier
Sewer: Foul network
Hydraulic overload Residential and commercial properties, Downlands Avenue
1 09/11/2013 Southern Water
573,577.00 107839 SFN13
Sewer: Foul network
Hydraulic overload Residential and commercial properties, Turkey Road
1 09/11/2013 Southern Water
572,439.00 109312 SFN14
Sewer: Foul network
Hydraulic overload Residential and commercial properties, Sackville Road
1 22/12/2013 Southern Water
573,955.00 107428 SFN15
Sewer: Foul network
Hydraulic overload Residential property, Peartree Lane
1 28/01/2014 Southern Water
571,654.00 108502 SFN16
Sewer: Foul network
Hydraulic overload Residential property, Bidwell Avenue
1 03/02/2014 Southern Water
573,390.00 108969 SFN17
Surface water: Highway drainage
Leaves blocking the drainage prevents runoff draining
Highway, Sutherland Avenue 1 Unknown ESCC 573,073.00 107993 SWHD01
Surface water: Highway drainage
In pipe blockage prevented efficient drainage
Highway, Woodsgate Park 1 Unknown ESCC 573,816.00 108541 SWHD02
Surface water: Highway drainage
In pipe blockage prevented efficient drainage and drainage was limited by high tide
Highway, Westcourt Drive 3 12/03/2010 ESCC 572,801.00 107230 SWHD03
Surface water: Highway drainage
Blockage of a gully grate prevented efficient drainage
Cooden Sea Road 1 01/12/2011 ESCC 571,446.00 107612 SWHD04
Surface water: Highway drainage
In pipe blockage prevented efficient drainage
Flats/Garage, West Parade 2 06/12/2011 ESCC 573,659.00 107008 SWHD05
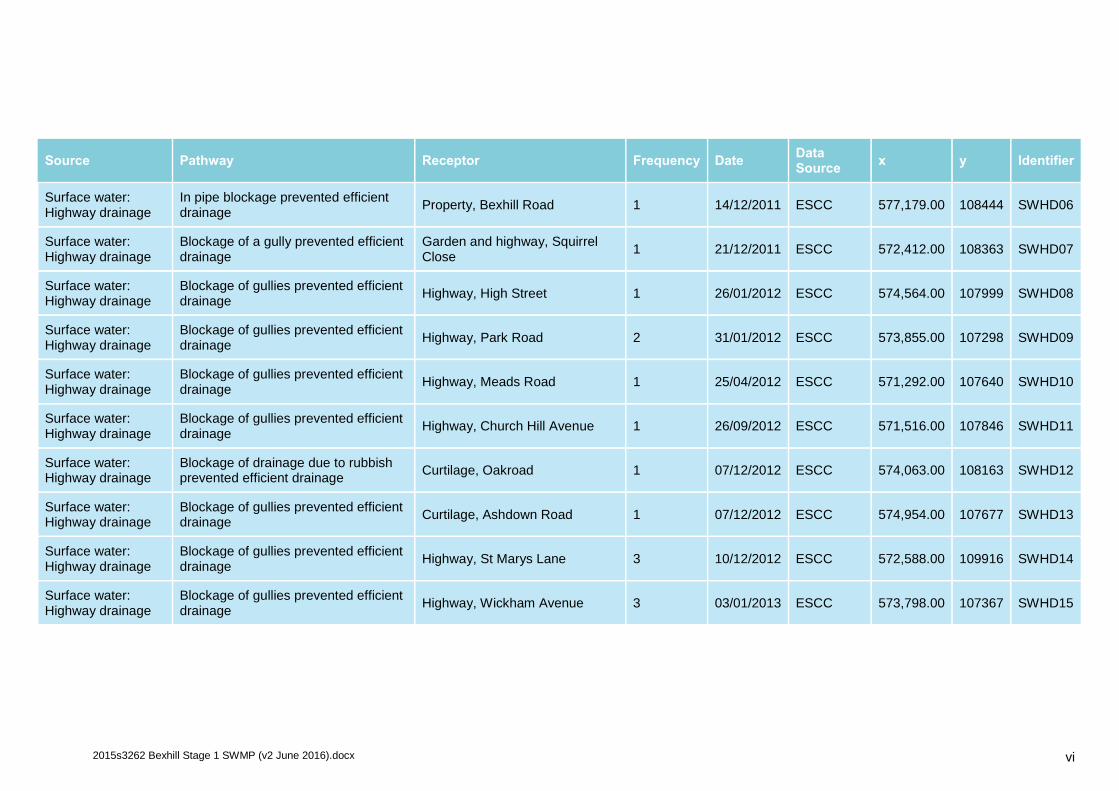
2015s3262 Bexhill Stage 1 SWMP (v2 June 2016).docx vi
Source Pathway Receptor Frequency Date Data Source
x y Identifier
Surface water: Highway drainage
In pipe blockage prevented efficient drainage
Property, Bexhill Road 1 14/12/2011 ESCC 577,179.00 108444 SWHD06
Surface water: Highway drainage
Blockage of a gully prevented efficient drainage
Garden and highway, Squirrel Close
1 21/12/2011 ESCC 572,412.00 108363 SWHD07
Surface water: Highway drainage
Blockage of gullies prevented efficient drainage
Highway, High Street 1 26/01/2012 ESCC 574,564.00 107999 SWHD08
Surface water: Highway drainage
Blockage of gullies prevented efficient drainage
Highway, Park Road 2 31/01/2012 ESCC 573,855.00 107298 SWHD09
Surface water: Highway drainage
Blockage of gullies prevented efficient drainage
Highway, Meads Road 1 25/04/2012 ESCC 571,292.00 107640 SWHD10
Surface water: Highway drainage
Blockage of gullies prevented efficient drainage
Highway, Church Hill Avenue 1 26/09/2012 ESCC 571,516.00 107846 SWHD11
Surface water: Highway drainage
Blockage of drainage due to rubbish prevented efficient drainage
Curtilage, Oakroad 1 07/12/2012 ESCC 574,063.00 108163 SWHD12
Surface water: Highway drainage
Blockage of gullies prevented efficient drainage
Curtilage, Ashdown Road 1 07/12/2012 ESCC 574,954.00 107677 SWHD13
Surface water: Highway drainage
Blockage of gullies prevented efficient drainage
Highway, St Marys Lane 3 10/12/2012 ESCC 572,588.00 109916 SWHD14
Surface water: Highway drainage
Blockage of gullies prevented efficient drainage
Highway, Wickham Avenue 3 03/01/2013 ESCC 573,798.00 107367 SWHD15
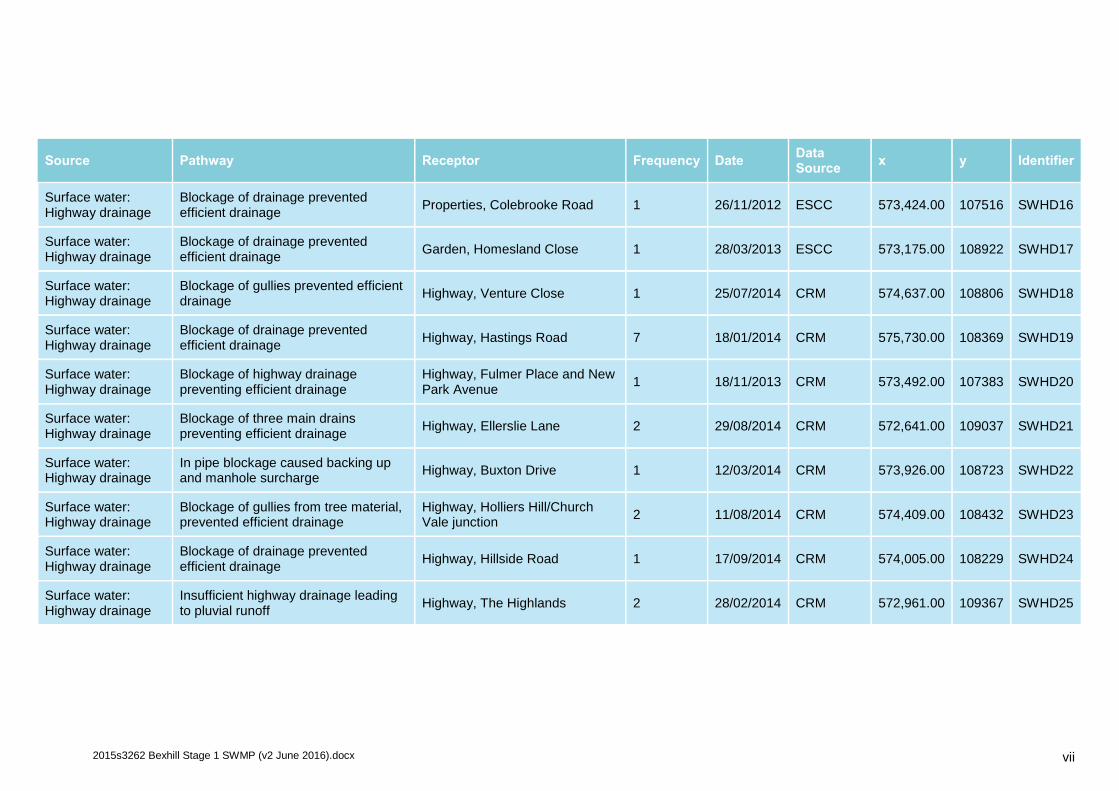
2015s3262 Bexhill Stage 1 SWMP (v2 June 2016).docx vii
Source Pathway Receptor Frequency Date Data Source
x y Identifier
Surface water: Highway drainage
Blockage of drainage prevented efficient drainage
Properties, Colebrooke Road 1 26/11/2012 ESCC 573,424.00 107516 SWHD16
Surface water: Highway drainage
Blockage of drainage prevented efficient drainage
Garden, Homesland Close 1 28/03/2013 ESCC 573,175.00 108922 SWHD17
Surface water: Highway drainage
Blockage of gullies prevented efficient drainage
Highway, Venture Close 1 25/07/2014 CRM 574,637.00 108806 SWHD18
Surface water: Highway drainage
Blockage of drainage prevented efficient drainage
Highway, Hastings Road 7 18/01/2014 CRM 575,730.00 108369 SWHD19
Surface water: Highway drainage
Blockage of highway drainage preventing efficient drainage
Highway, Fulmer Place and New Park Avenue
1 18/11/2013 CRM 573,492.00 107383 SWHD20
Surface water: Highway drainage
Blockage of three main drains preventing efficient drainage
Highway, Ellerslie Lane 2 29/08/2014 CRM 572,641.00 109037 SWHD21
Surface water: Highway drainage
In pipe blockage caused backing up and manhole surcharge
Highway, Buxton Drive 1 12/03/2014 CRM 573,926.00 108723 SWHD22
Surface water: Highway drainage
Blockage of gullies from tree material, prevented efficient drainage
Highway, Holliers Hill/Church Vale junction
2 11/08/2014 CRM 574,409.00 108432 SWHD23
Surface water: Highway drainage
Blockage of drainage prevented efficient drainage
Highway, Hillside Road 1 17/09/2014 CRM 574,005.00 108229 SWHD24
Surface water: Highway drainage
Insufficient highway drainage leading to pluvial runoff
Highway, The Highlands 2 28/02/2014 CRM 572,961.00 109367 SWHD25
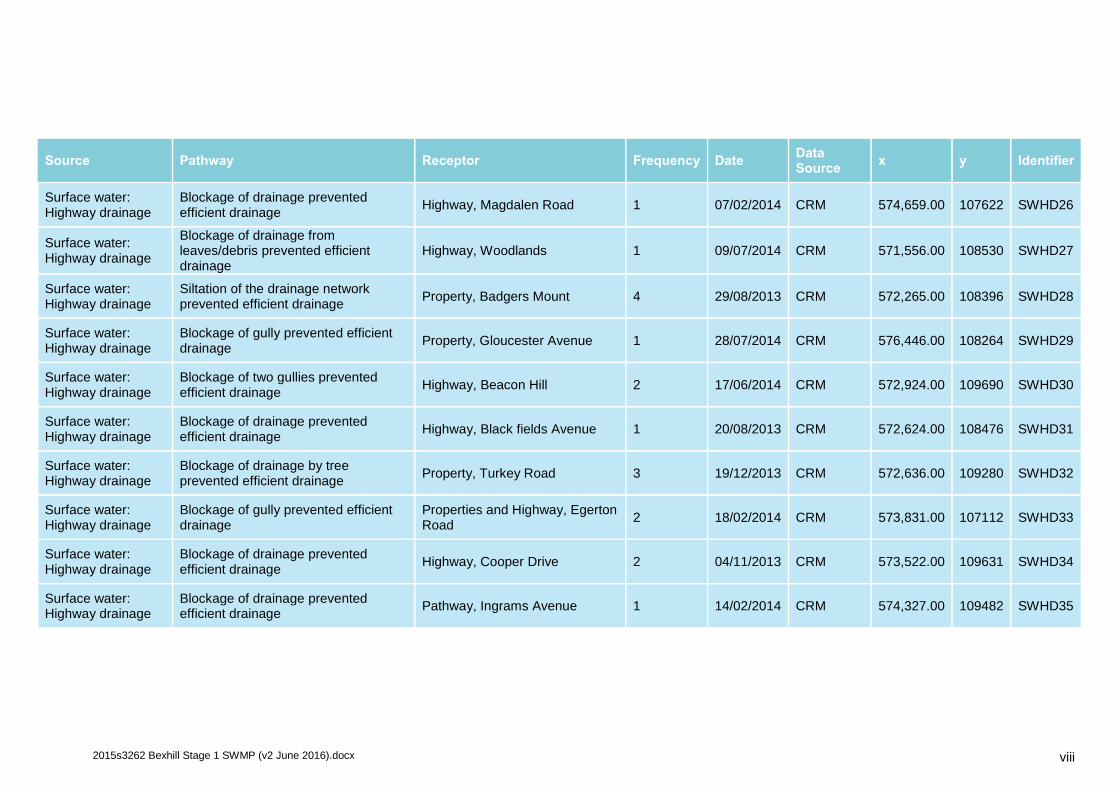
2015s3262 Bexhill Stage 1 SWMP (v2 June 2016).docx viii
Source Pathway Receptor Frequency Date Data Source
x y Identifier
Surface water: Highway drainage
Blockage of drainage prevented efficient drainage
Highway, Magdalen Road 1 07/02/2014 CRM 574,659.00 107622 SWHD26
Surface water: Highway drainage
Blockage of drainage from leaves/debris prevented efficient drainage
Highway, Woodlands 1 09/07/2014 CRM 571,556.00 108530 SWHD27
Surface water: Highway drainage
Siltation of the drainage network prevented efficient drainage
Property, Badgers Mount 4 29/08/2013 CRM 572,265.00 108396 SWHD28
Surface water: Highway drainage
Blockage of gully prevented efficient drainage
Property, Gloucester Avenue 1 28/07/2014 CRM 576,446.00 108264 SWHD29
Surface water: Highway drainage
Blockage of two gullies prevented efficient drainage
Highway, Beacon Hill 2 17/06/2014 CRM 572,924.00 109690 SWHD30
Surface water: Highway drainage
Blockage of drainage prevented efficient drainage
Highway, Black fields Avenue 1 20/08/2013 CRM 572,624.00 108476 SWHD31
Surface water: Highway drainage
Blockage of drainage by tree prevented efficient drainage
Property, Turkey Road 3 19/12/2013 CRM 572,636.00 109280 SWHD32
Surface water: Highway drainage
Blockage of gully prevented efficient drainage
Properties and Highway, Egerton Road
2 18/02/2014 CRM 573,831.00 107112 SWHD33
Surface water: Highway drainage
Blockage of drainage prevented efficient drainage
Highway, Cooper Drive 2 04/11/2013 CRM 573,522.00 109631 SWHD34
Surface water: Highway drainage
Blockage of drainage prevented efficient drainage
Pathway, Ingrams Avenue 1 14/02/2014 CRM 574,327.00 109482 SWHD35
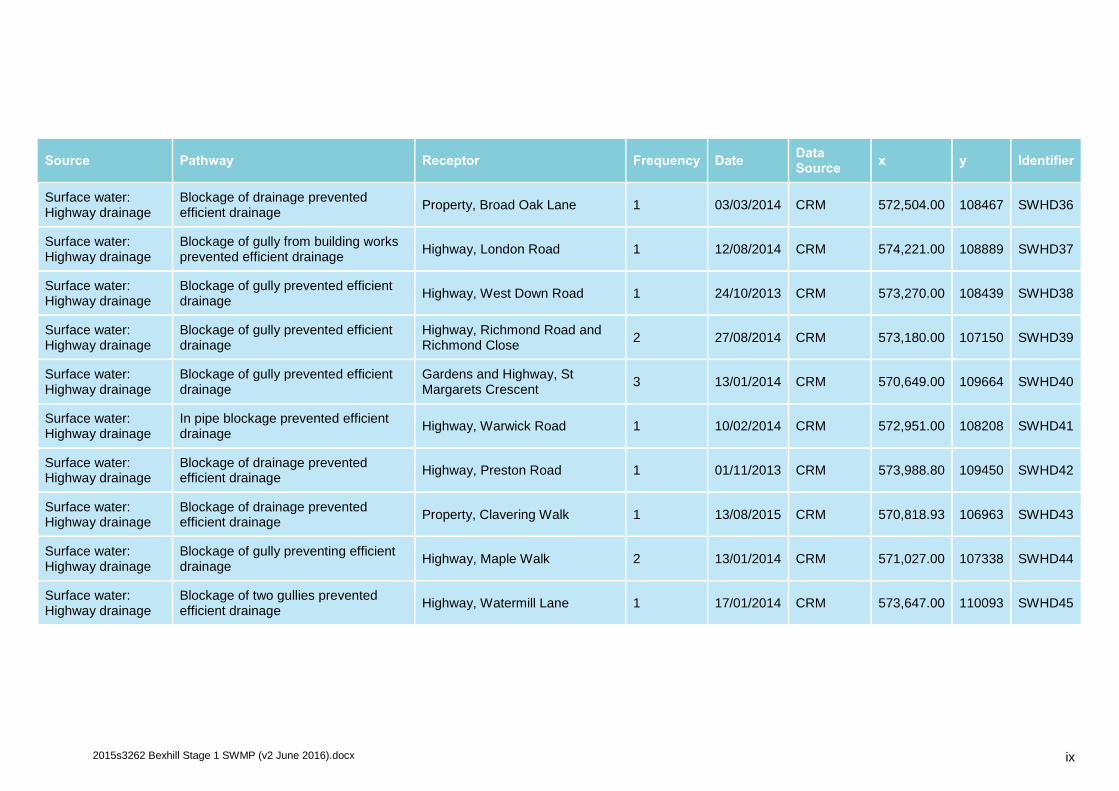
2015s3262 Bexhill Stage 1 SWMP (v2 June 2016).docx ix
Source Pathway Receptor Frequency Date Data Source
x y Identifier
Surface water: Highway drainage
Blockage of drainage prevented efficient drainage
Property, Broad Oak Lane 1 03/03/2014 CRM 572,504.00 108467 SWHD36
Surface water: Highway drainage
Blockage of gully from building works prevented efficient drainage
Highway, London Road 1 12/08/2014 CRM 574,221.00 108889 SWHD37
Surface water: Highway drainage
Blockage of gully prevented efficient drainage
Highway, West Down Road 1 24/10/2013 CRM 573,270.00 108439 SWHD38
Surface water: Highway drainage
Blockage of gully prevented efficient drainage
Highway, Richmond Road and Richmond Close
2 27/08/2014 CRM 573,180.00 107150 SWHD39
Surface water: Highway drainage
Blockage of gully prevented efficient drainage
Gardens and Highway, St Margarets Crescent
3 13/01/2014 CRM 570,649.00 109664 SWHD40
Surface water: Highway drainage
In pipe blockage prevented efficient drainage
Highway, Warwick Road 1 10/02/2014 CRM 572,951.00 108208 SWHD41
Surface water: Highway drainage
Blockage of drainage prevented efficient drainage
Highway, Preston Road 1 01/11/2013 CRM 573,988.80 109450 SWHD42
Surface water: Highway drainage
Blockage of drainage prevented efficient drainage
Property, Clavering Walk 1 13/08/2015 CRM 570,818.93 106963 SWHD43
Surface water: Highway drainage
Blockage of gully preventing efficient drainage
Highway, Maple Walk 2 13/01/2014 CRM 571,027.00 107338 SWHD44
Surface water: Highway drainage
Blockage of two gullies prevented efficient drainage
Highway, Watermill Lane 1 17/01/2014 CRM 573,647.00 110093 SWHD45
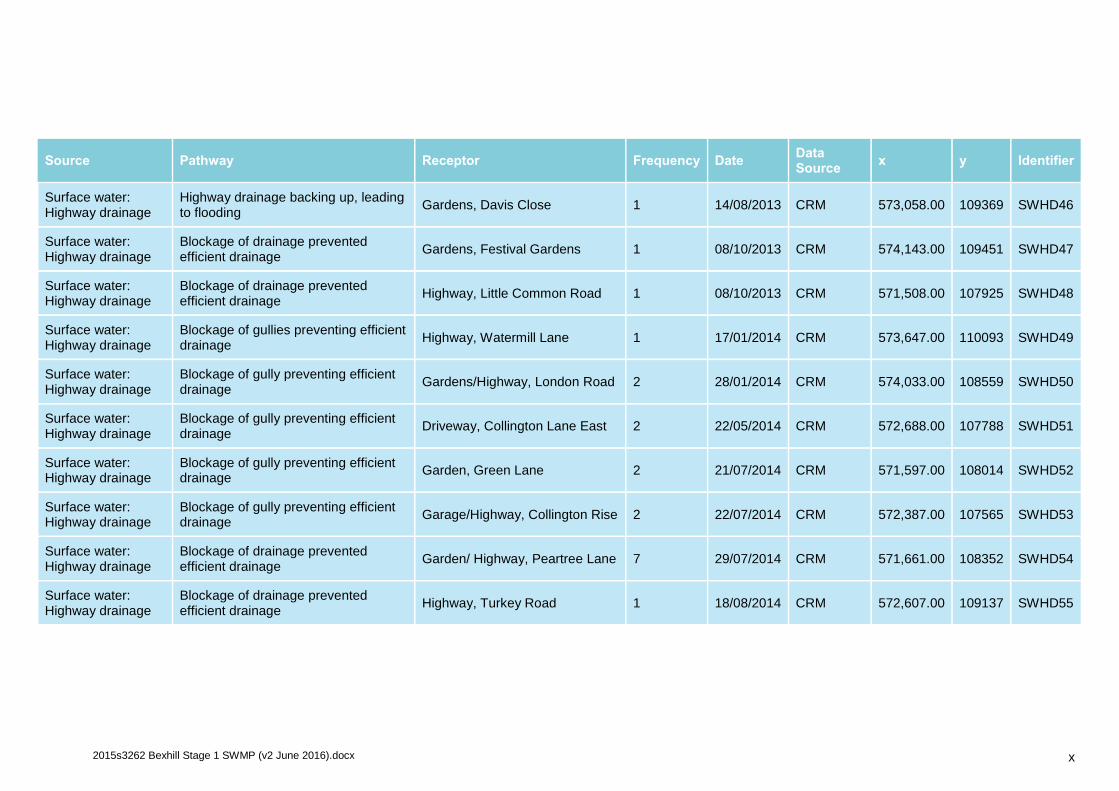
2015s3262 Bexhill Stage 1 SWMP (v2 June 2016).docx x
Source Pathway Receptor Frequency Date Data Source
x y Identifier
Surface water: Highway drainage
Highway drainage backing up, leading to flooding
Gardens, Davis Close 1 14/08/2013 CRM 573,058.00 109369 SWHD46
Surface water: Highway drainage
Blockage of drainage prevented efficient drainage
Gardens, Festival Gardens 1 08/10/2013 CRM 574,143.00 109451 SWHD47
Surface water: Highway drainage
Blockage of drainage prevented efficient drainage
Highway, Little Common Road 1 08/10/2013 CRM 571,508.00 107925 SWHD48
Surface water: Highway drainage
Blockage of gullies preventing efficient drainage
Highway, Watermill Lane 1 17/01/2014 CRM 573,647.00 110093 SWHD49
Surface water: Highway drainage
Blockage of gully preventing efficient drainage
Gardens/Highway, London Road 2 28/01/2014 CRM 574,033.00 108559 SWHD50
Surface water: Highway drainage
Blockage of gully preventing efficient drainage
Driveway, Collington Lane East 2 22/05/2014 CRM 572,688.00 107788 SWHD51
Surface water: Highway drainage
Blockage of gully preventing efficient drainage
Garden, Green Lane 2 21/07/2014 CRM 571,597.00 108014 SWHD52
Surface water: Highway drainage
Blockage of gully preventing efficient drainage
Garage/Highway, Collington Rise 2 22/07/2014 CRM 572,387.00 107565 SWHD53
Surface water: Highway drainage
Blockage of drainage prevented efficient drainage
Garden/ Highway, Peartree Lane 7 29/07/2014 CRM 571,661.00 108352 SWHD54
Surface water: Highway drainage
Blockage of drainage prevented efficient drainage
Highway, Turkey Road 1 18/08/2014 CRM 572,607.00 109137 SWHD55
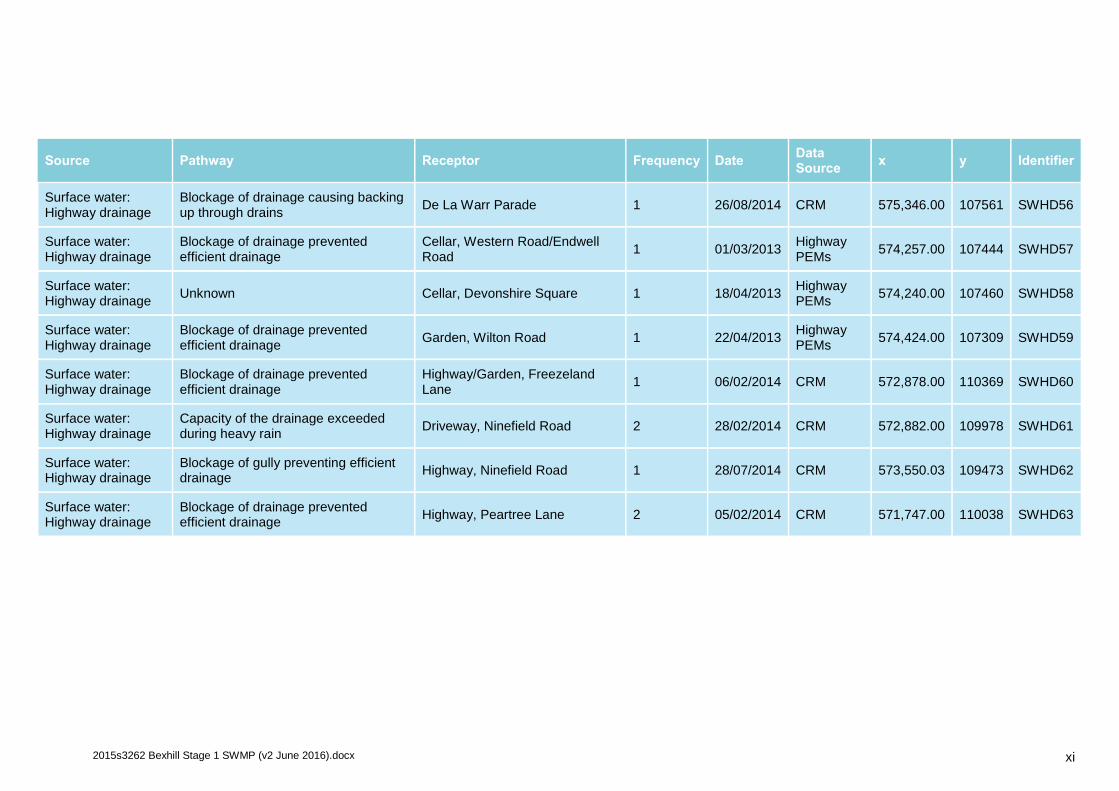
2015s3262 Bexhill Stage 1 SWMP (v2 June 2016).docx xi
Source Pathway Receptor Frequency Date Data Source
x y Identifier
Surface water: Highway drainage
Blockage of drainage causing backing up through drains
De La Warr Parade 1 26/08/2014 CRM 575,346.00 107561 SWHD56
Surface water: Highway drainage
Blockage of drainage prevented efficient drainage
Cellar, Western Road/Endwell Road
1 01/03/2013 Highway PEMs
574,257.00 107444 SWHD57
Surface water: Highway drainage
Unknown Cellar, Devonshire Square 1 18/04/2013 Highway PEMs
574,240.00 107460 SWHD58
Surface water: Highway drainage
Blockage of drainage prevented efficient drainage
Garden, Wilton Road 1 22/04/2013 Highway PEMs
574,424.00 107309 SWHD59
Surface water: Highway drainage
Blockage of drainage prevented efficient drainage
Highway/Garden, Freezeland Lane
1 06/02/2014 CRM 572,878.00 110369 SWHD60
Surface water: Highway drainage
Capacity of the drainage exceeded during heavy rain
Driveway, Ninefield Road 2 28/02/2014 CRM 572,882.00 109978 SWHD61
Surface water: Highway drainage
Blockage of gully preventing efficient drainage
Highway, Ninefield Road 1 28/07/2014 CRM 573,550.03 109473 SWHD62
Surface water: Highway drainage
Blockage of drainage prevented efficient drainage
Highway, Peartree Lane 2 05/02/2014 CRM 571,747.00 110038 SWHD63

2015s3262 Bexhill Stage 1 SWMP (v2 June 2016).docx xii
C Appendix C - Quantifying Surface Water Flood Risk
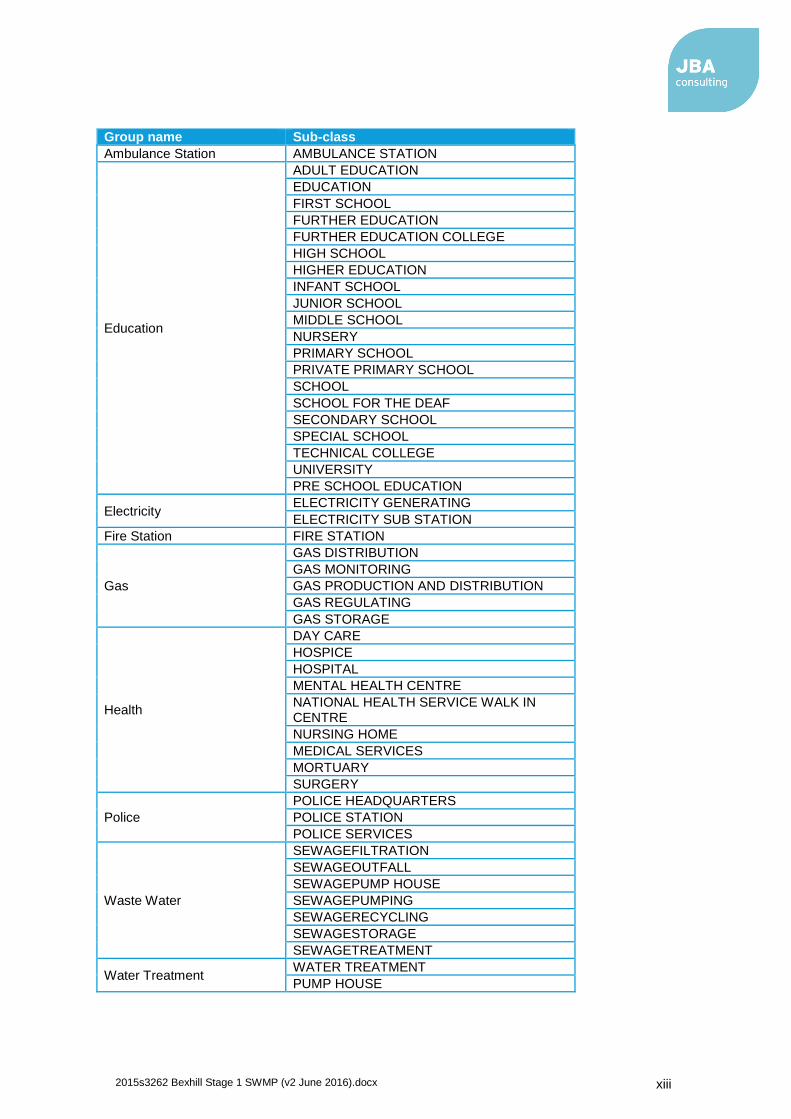
2015s3262 Bexhill Stage 1 SWMP (v2 June 2016).docx xiii
Group name Sub-class
Ambulance Station AMBULANCE STATION
Education
ADULT EDUCATION
EDUCATION
FIRST SCHOOL
FURTHER EDUCATION
FURTHER EDUCATION COLLEGE
HIGH SCHOOL
HIGHER EDUCATION
INFANT SCHOOL
JUNIOR SCHOOL
MIDDLE SCHOOL
NURSERY
PRIMARY SCHOOL
PRIVATE PRIMARY SCHOOL
SCHOOL
SCHOOL FOR THE DEAF
SECONDARY SCHOOL
SPECIAL SCHOOL
TECHNICAL COLLEGE
UNIVERSITY
PRE SCHOOL EDUCATION
Electricity ELECTRICITY GENERATING
ELECTRICITY SUB STATION
Fire Station FIRE STATION
Gas
GAS DISTRIBUTION
GAS MONITORING
GAS PRODUCTION AND DISTRIBUTION
GAS REGULATING
GAS STORAGE
Health
DAY CARE
HOSPICE
HOSPITAL
MENTAL HEALTH CENTRE
NATIONAL HEALTH SERVICE WALK IN CENTRE
NURSING HOME
MEDICAL SERVICES
MORTUARY
SURGERY
Police
POLICE HEADQUARTERS
POLICE STATION
POLICE SERVICES
Waste Water
SEWAGEFILTRATION
SEWAGEOUTFALL
SEWAGEPUMP HOUSE
SEWAGEPUMPING
SEWAGERECYCLING
SEWAGESTORAGE
SEWAGETREATMENT
Water Treatment WATER TREATMENT
PUMP HOUSE

2015s3262 Bexhill Stage 1 SWMP (v2 June 2016).docx xiv
D Appendix D - Incident specific action plan

Copyright © Jeremy Benn Associates Limited 2016
Carbon Footprint A printed copy of the main text in this document will result in a carbon footprint of 220g if 100% post-consumer recycled paper is used and 173g if primary-source paper is used. These figures assume the report is printed in black and white on A4 paper and in duplex.
JBA is aiming to reduce its per capita carbon emissions.
Offices at Coleshill
Doncaster
Dublin
Edinburgh
Exeter
Glasgow
Haywards Heath
Isle of Man
Limerick
Newcastle upon Tyne
Newport
Saltaire
Skipton
Tadcaster
Thirsk
Wallingford
Warrington
Registered Office South Barn
Broughton Hall
SKIPTON
North Yorkshire
BD23 3AE
t:+44(0)1756 799919 e:[email protected]
Jeremy Benn Associates Ltd Registered in England
3246693
Visit our website
www.jbaconsulting.com