Embed Size (px)
Citation preview
Applctn. RC-Award 2008
Application for the Responsible Care Award 2008 1/16/
www.rembrandtin.com
APPLICATION
EUROPEAN
RESPONSIBLE CARE
AWARD 2008
Project: Reduction of Emission of Volatile Organic Compounds during Production and Application of Coating Materials
August 2008
REMBRANDTIN LACK GmbH Nfg. KGIgnaz-Köck-Straße 151210 WIENÖsterreich
Applctn. RC-Award 2008
Application for the Responsible Care Award 2008 2/16/
Contents
Company Profile Rembrandtin – Your Innovative Partner – Worldwide.................. 3
Rembrandtin - Policy............................................................................................... 4
1. Introduction...................................................................................................... 5
2. Reducing the Use of Solvent with Systematic Development ........................... 6
3. Reducing the Use of Solvent with Customer Communication ......................... 7
4. Reducing the Use of Solvent with Technologies.............................................. 8
5. Quantitative Analysis ..................................................................................... 10
5.1 Material Application / Yield ................................................................... 10
5.2 Organic Solvents and Water as a Solvent............................................ 12
5.3 Organic Solvents as Cleansers ............................................................ 14
6. Summary........................................................................................................... 16
Effects ........................................................................................................ 16
Applctn. RC-Award 2008
Application for the Responsible Care Award 2008 3/16/
APPLICATION FOR THE EUROPEAN RESPONSIBLE CARE
AWARD 2008
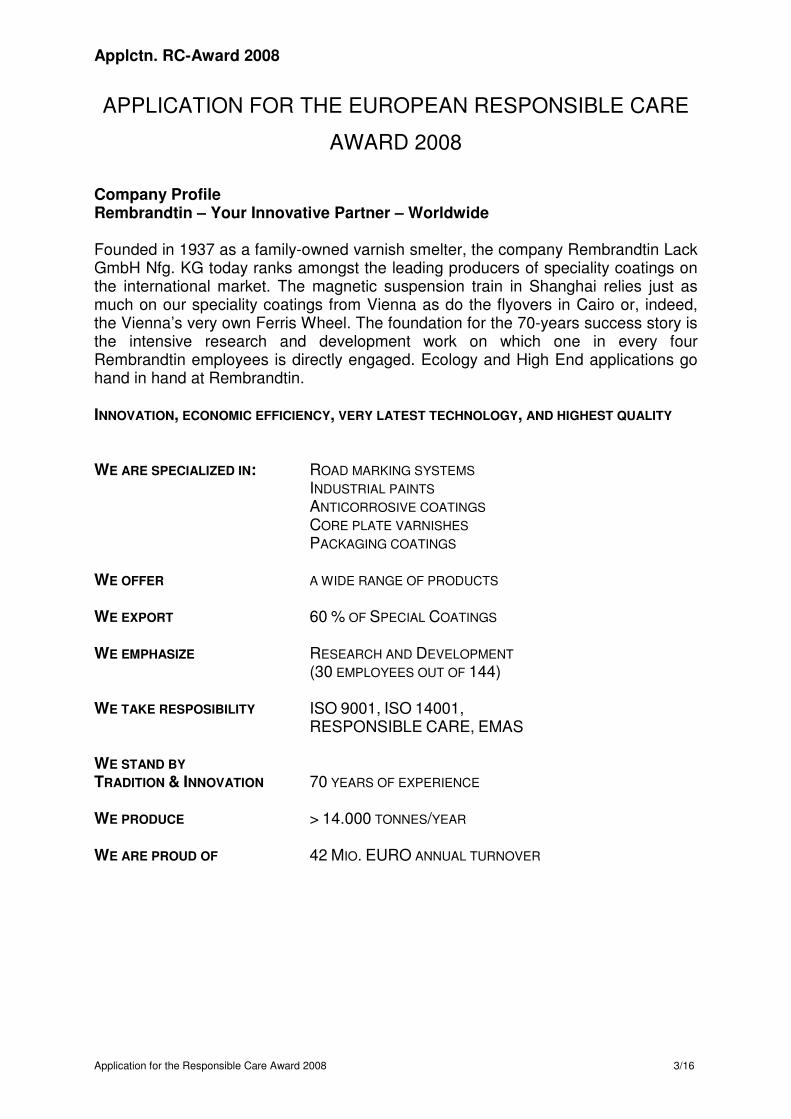
Company Profile Rembrandtin – Your Innovative Partner – Worldwide Founded in 1937 as a family-owned varnish smelter, the company Rembrandtin Lack GmbH Nfg. KG today ranks amongst the leading producers of speciality coatings on the international market. The magnetic suspension train in Shanghai relies just as much on our speciality coatings from Vienna as do the flyovers in Cairo or, indeed, the Vienna’s very own Ferris Wheel. The foundation for the 70-years success story is the intensive research and development work on which one in every four Rembrandtin employees is directly engaged. Ecology and High End applications go hand in hand at Rembrandtin. INNOVATION, ECONOMIC EFFICIENCY, VERY LATEST TECHNOLOGY, AND HIGHEST QUALITY WE ARE SPECIALIZED IN: ROAD MARKING SYSTEMS INDUSTRIAL PAINTS ANTICORROSIVE COATINGS CORE PLATE VARNISHES PACKAGING COATINGS WE OFFER A WIDE RANGE OF PRODUCTS WE EXPORT 60 % OF SPECIAL COATINGS WE EMPHASIZE RESEARCH AND DEVELOPMENT (30 EMPLOYEES OUT OF 144) WE TAKE RESPOSIBILITY ISO 9001, ISO 14001, RESPONSIBLE CARE, EMAS WE STAND BY TRADITION & INNOVATION 70 YEARS OF EXPERIENCE WE PRODUCE > 14.000 TONNES/YEAR WE ARE PROUD OF 42 MIO. EURO ANNUAL TURNOVER
Applctn. RC-Award 2008
Application for the Responsible Care Award 2008 4/16/
Rembrandtin - Policy For Rembrandtin, safety and protection of people and the environment are basic. Rembrandtin was the first company in the coating material industry to participate in the Responsible Care programme and was certified as early as 1993. Shortly thereafter, Rembrandtin was ISO 9001 certified, ISO 14001 certified in 1998 and certified in conformity with the EMAS ordinance of the European Union. Today, Rembrandtin has an integrated management system for quality, the environment and safety. REMBRANDTIN is convinced that economic success only comes about if its employees are ready to work together. This is the only way that development and change in the economy can improve the way our employees work and live. One essential for translating any project into reality is the company’s open, respectful and constructive communication culture. The thing that makes this most apparent is the way that colleagues deal with one another on a personal level. At the same time, the latest helpful information is brought up to date, expanded and made available to all employees on our Intranet platform. Rembrandtin identified the importance of good communication with all stakeholders years ago. This is the reason why our company has been convinced of the necessity of living and breathing a stakeholder culture based on an interested and constructive exchange of views. Our environmental declaration and sustainability report are available at no charge to anyone interested in Internet and we actively distribute them to our customers and other group of interested persons. Rembrandtin published its first sustainability report in 2005. Rembrandtin proactively participates in a wide range of committees such as the technical committees of CEN, the Austrian Standardisation Institute, the Austrian Chamber of Commerce, the Austrian Institute for Chemistry and Engineering to name but a few in order to help outline practicable laws, directives and standards in terms of sustainability.
Applctn. RC-Award 2008
Application for the Responsible Care Award 2008 5/16/
1. Introduction
In 1990, it was common to hear the express “varnish stinks”. It was obvious that solvents were the big problem here because they are the ones that cause emission. That also makes them responsible for nuisances, adverse effects and even potential hazards. This is the reason why we had to make it a high priority to drive down the emissions of volatile organic compounds. The question was where we should tackle this problem. It didn’t take long for us to recognise that we had to launch our efforts at several points. In 1998, we launched a programme with the goal of tracking down causes and coming up with countermeasures that we would translate into reality with a subsequent check of effectiveness. Today, we’ve got the results: we are saving about 1,472 tonnes of organic solvents every year at an output of prefabricated products in excess of 14,000 tonnes. That drives down pollution while keeping the environment cleaner for our employees and users.
Applctn. RC-Award 2008
Application for the Responsible Care Award 2008 6/16/
2. Reducing the Use of Solvent with Systematic Development
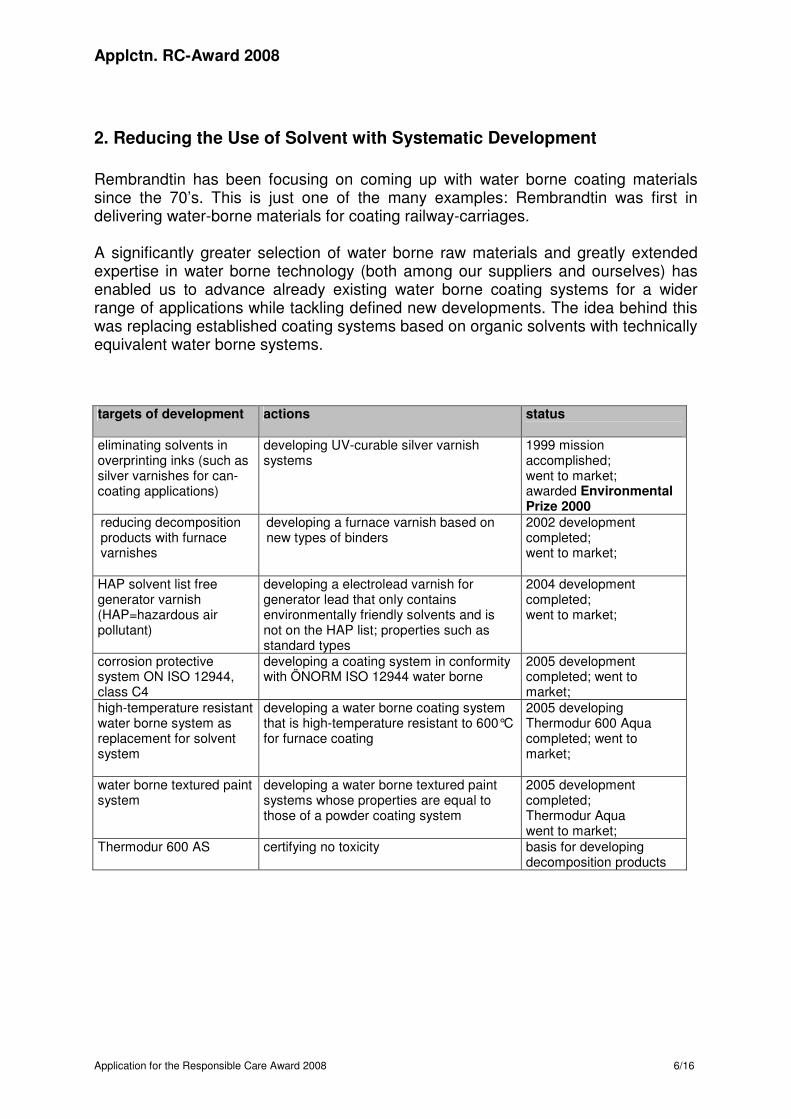
Rembrandtin has been focusing on coming up with water borne coating materials since the 70’s. This is just one of the many examples: Rembrandtin was first in delivering water-borne materials for coating railway-carriages. A significantly greater selection of water borne raw materials and greatly extended expertise in water borne technology (both among our suppliers and ourselves) has enabled us to advance already existing water borne coating systems for a wider range of applications while tackling defined new developments. The idea behind this was replacing established coating systems based on organic solvents with technically equivalent water borne systems. targets of development actions status
eliminating solvents in overprinting inks (such as silver varnishes for can-coating applications)
developing UV-curable silver varnish systems
1999 mission accomplished; went to market; awarded Environmental Prize 2000
reducing decomposition products with furnace varnishes
developing a furnace varnish based on new types of binders
2002 development completed; went to market;
HAP solvent list free generator varnish (HAP=hazardous air pollutant)
developing a electrolead varnish for generator lead that only contains environmentally friendly solvents and is not on the HAP list; properties such as standard types
2004 development completed; went to market;
corrosion protective system ON ISO 12944, class C4
developing a coating system in conformity with ÖNORM ISO 12944 water borne
2005 development completed; went to market;
high-temperature resistant water borne system as replacement for solvent system
developing a water borne coating system that is high-temperature resistant to 600°C for furnace coating
2005 developing Thermodur 600 Aqua completed; went to market;
water borne textured paint system
developing a water borne textured paint systems whose properties are equal to those of a powder coating system
2005 development completed; Thermodur Aqua went to market;
Thermodur 600 AS certifying no toxicity basis for developing decomposition products
Applctn. RC-Award 2008
Application for the Responsible Care Award 2008 7/16/
3. Reducing the Use of Solvent with Customer Communication
We not only had to develop low-emission or water borne products, but also get our customers and users to reassess their values. Our business partners were not ready to use new products and even some modified application techniques from the word go. We had to go through an intensive process of consultation, demonstration and sampling including offering help and advice in changing over or rebuilding coating systems to get our customers enthusiastic about the idea of low-emission coating. But, new statutory regulations such as the Austrian Solvent Ordinance or Varnishing System Ordinance supported us in our efforts. The ratio of water borne materials to solvent-based materials is 60:40 today in the four product areas of industrial coating, corrosion protection, packaging varnishes and core-plate varnishes or, as in the case of core-plate varnishes, much better. Our immediate target is shifting the proportion of products containing solvents in favour of products free of solvents for street marking. At present, the ratio is about 50:50 and while we are targeting a ratio of 60:40 or better. Using spraying plastics free of solvents brings about a dual effect: on the one hand, driving down solvent emissions and on the other hand 50% longer stability. At present production rates of 5,429 tonnes altogether, that would spell out a solvent reduction of 135 tonnes.
Applctn. RC-Award 2008
Application for the Responsible Care Award 2008 8/16/
4. Reducing the Use of Solvent with Technologies
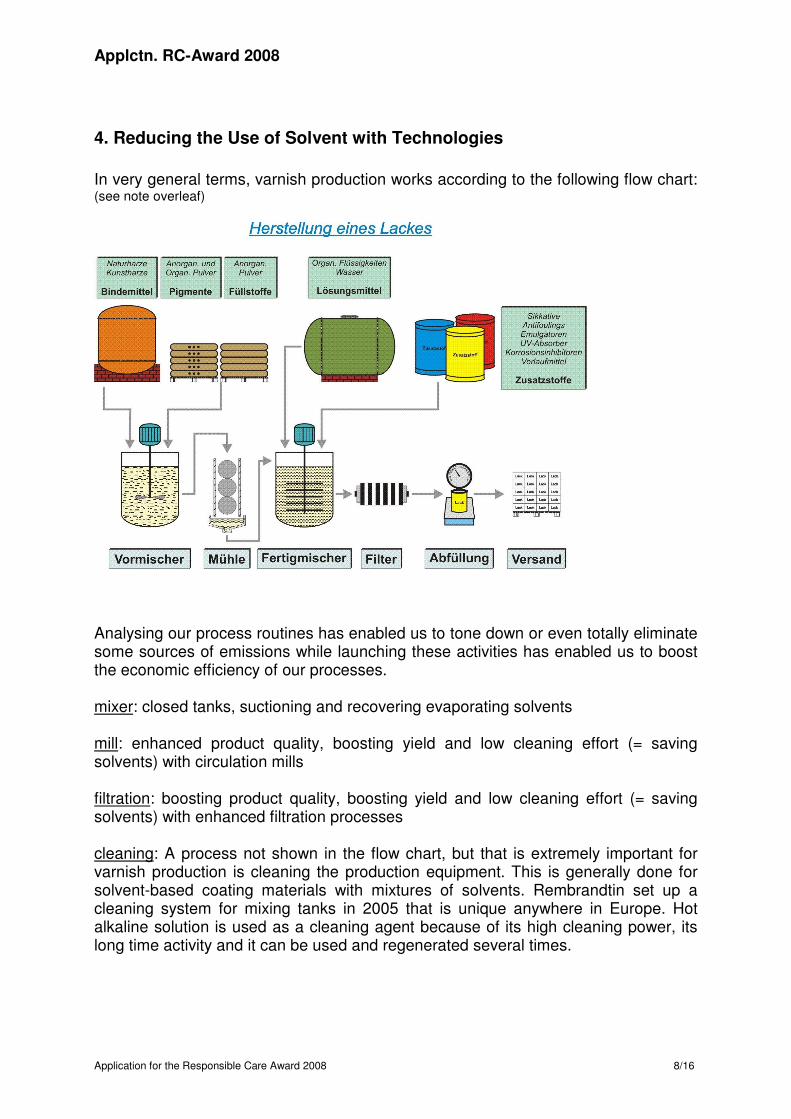
In very general terms, varnish production works according to the following flow chart: (see note overleaf)
Analysing our process routines has enabled us to tone down or even totally eliminate some sources of emissions while launching these activities has enabled us to boost the economic efficiency of our processes. mixer: closed tanks, suctioning and recovering evaporating solvents mill: enhanced product quality, boosting yield and low cleaning effort (= saving solvents) with circulation mills filtration: boosting product quality, boosting yield and low cleaning effort (= saving solvents) with enhanced filtration processes cleaning: A process not shown in the flow chart, but that is extremely important for varnish production is cleaning the production equipment. This is generally done for solvent-based coating materials with mixtures of solvents. Rembrandtin set up a cleaning system for mixing tanks in 2005 that is unique anywhere in Europe. Hot alkaline solution is used as a cleaning agent because of its high cleaning power, its long time activity and it can be used and regenerated several times.
Applctn. RC-Award 2008
Application for the Responsible Care Award 2008 9/16/
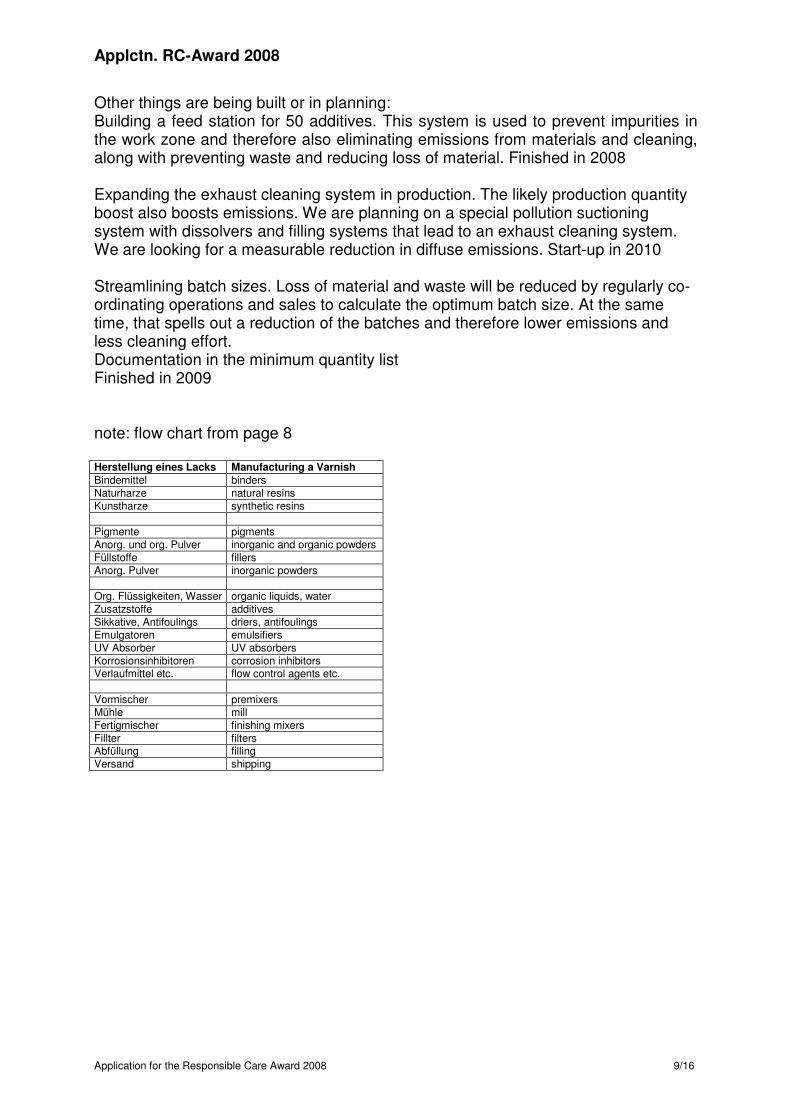
Other things are being built or in planning: Building a feed station for 50 additives. This system is used to prevent impurities in the work zone and therefore also eliminating emissions from materials and cleaning, along with preventing waste and reducing loss of material. Finished in 2008 Expanding the exhaust cleaning system in production. The likely production quantity boost also boosts emissions. We are planning on a special pollution suctioning system with dissolvers and filling systems that lead to an exhaust cleaning system. We are looking for a measurable reduction in diffuse emissions. Start-up in 2010 Streamlining batch sizes. Loss of material and waste will be reduced by regularly co-ordinating operations and sales to calculate the optimum batch size. At the same time, that spells out a reduction of the batches and therefore lower emissions and less cleaning effort. Documentation in the minimum quantity list Finished in 2009 note: flow chart from page 8 Herstellung eines Lacks Manufacturing a Varnish
Bindemittel binders Naturharze natural resins Kunstharze synthetic resins Pigmente pigments Anorg. und org. Pulver inorganic and organic powders Füllstoffe fillers Anorg. Pulver inorganic powders Org. Flüssigkeiten, Wasser organic liquids, water Zusatzstoffe additives Sikkative, Antifoulings driers, antifoulings Emulgatoren emulsifiers UV Absorber UV absorbers Korrosionsinhibitoren corrosion inhibitors Verlaufmittel etc. flow control agents etc. Vormischer premixers Mühle mill Fertigmischer finishing mixers Fillter filters Abfüllung filling Versand shipping
Applctn. RC-Award 2008
Application for the Responsible Care Award 2008 10/16/
5. Quantitative Analysis
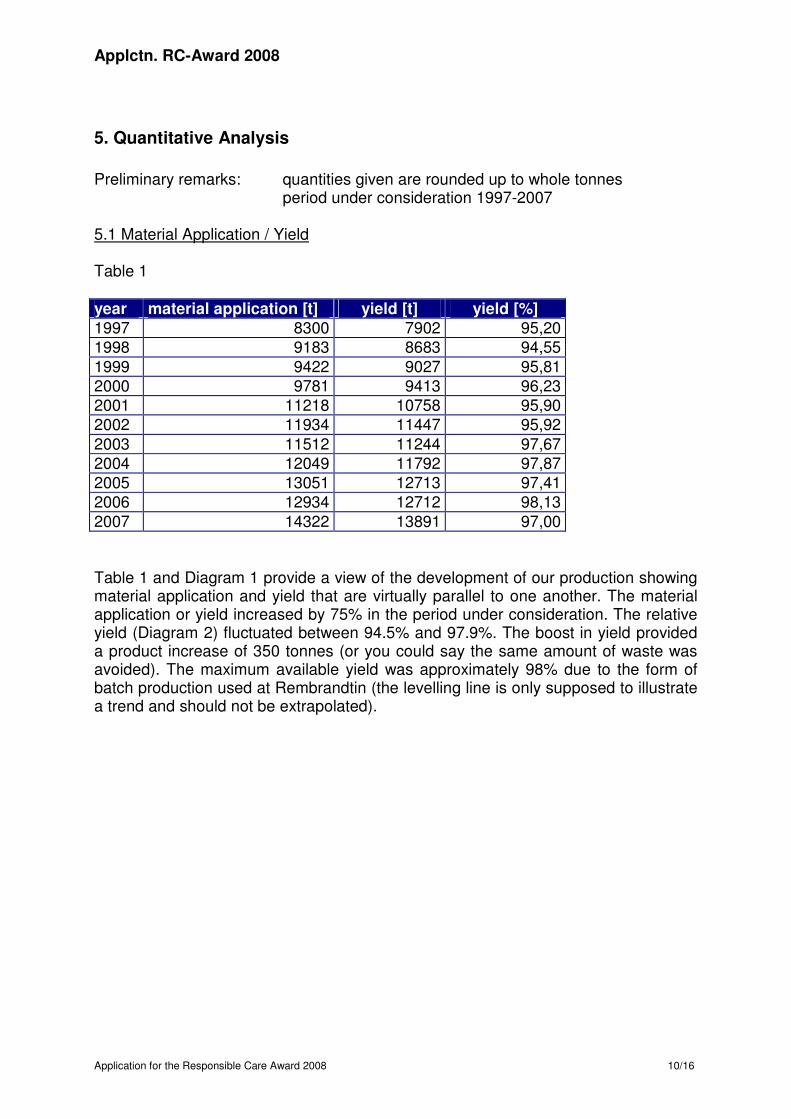
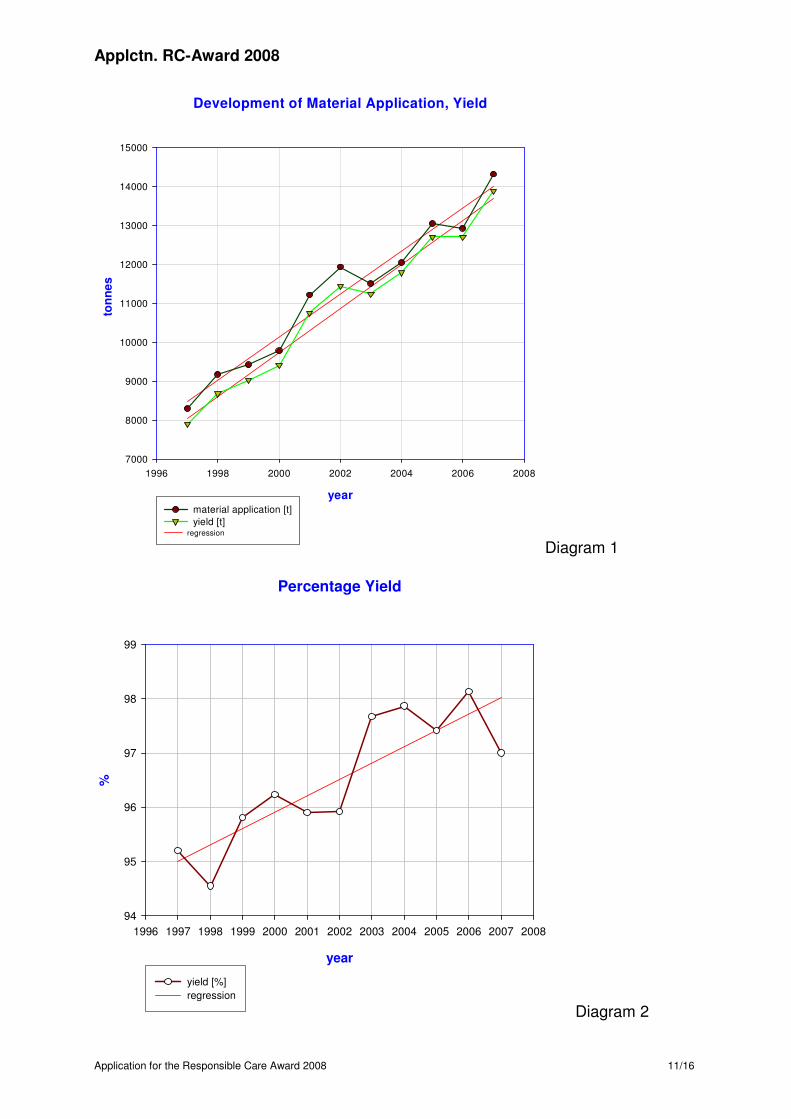
Preliminary remarks: quantities given are rounded up to whole tonnes period under consideration 1997-2007 5.1 Material Application / Yield Table 1 year material application [t] yield [t] yield [%]
1997 8300 7902 95,20 1998 9183 8683 94,55 1999 9422 9027 95,81 2000 9781 9413 96,23 2001 11218 10758 95,90 2002 11934 11447 95,92 2003 11512 11244 97,67 2004 12049 11792 97,87 2005 13051 12713 97,41 2006 12934 12712 98,13 2007 14322 13891 97,00 Table 1 and Diagram 1 provide a view of the development of our production showing material application and yield that are virtually parallel to one another. The material application or yield increased by 75% in the period under consideration. The relative yield (Diagram 2) fluctuated between 94.5% and 97.9%. The boost in yield provided a product increase of 350 tonnes (or you could say the same amount of waste was avoided). The maximum available yield was approximately 98% due to the form of batch production used at Rembrandtin (the levelling line is only supposed to illustrate a trend and should not be extrapolated).
Applctn. RC-Award 2008
Application for the Responsible Care Award 2008 11/16/
Development of Material Application, Yield
year
1996 1998 2000 2002 2004 2006 2008
ton
ne
s
7000
8000
9000
10000
11000
12000
13000
14000
15000
material application [t]yield [t]
regression
Diagram 1
Percentage Yield
year
1996 1997 1998 1999 2000 2001 2002 2003 2004 2005 2006 2007 2008
%
94
95
96
97
98
99
yield [%]regression
Diagram 2

Applctn. RC-Award 2008
Application for the Responsible Care Award 2008 12/16/
5.2 Organic Solvents and Water as a Solvent Table 2: year material application [t] organic
solvents [t] % organic solvents
H2O [t] % H2O
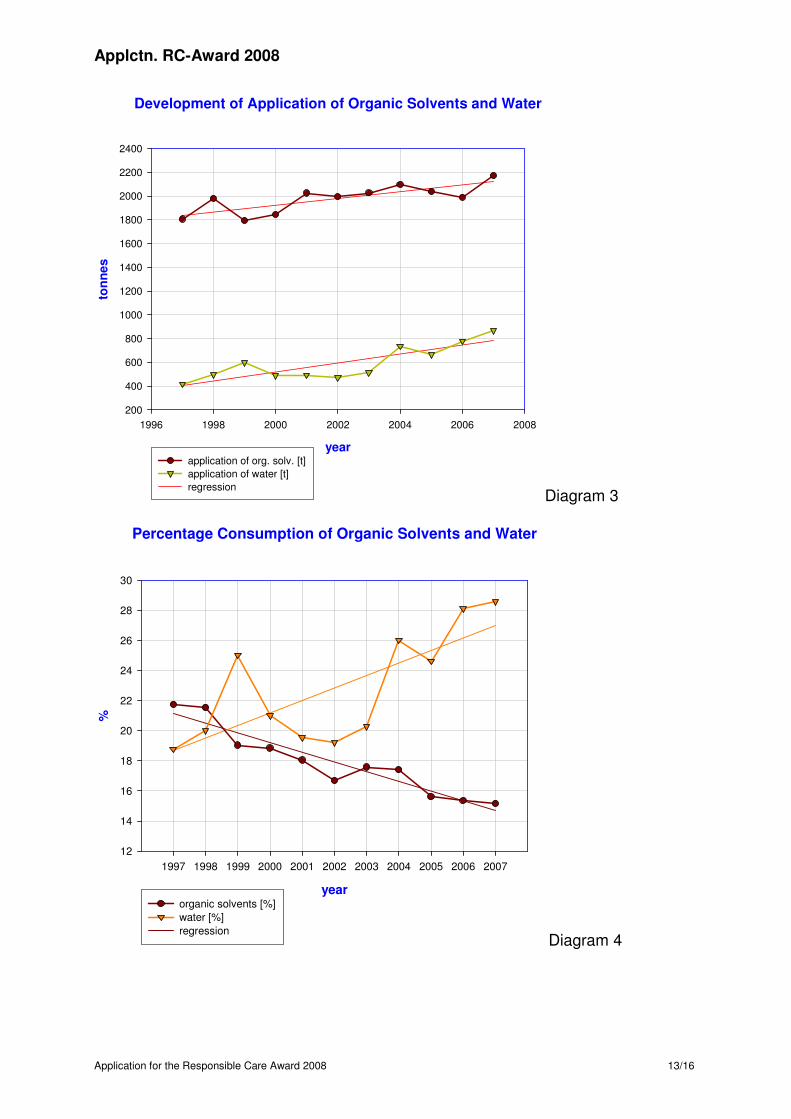
1997 8300 1806 21,76 418 18,78 1998 9183 1979 21,55 495 20,00 1999 9422 1794 19,04 599 25,03 2000 9781 1844 18,85 491 21,04 2001 11218 2025 18,05 493 19,57 2002 11934 1994 16,70 474 19,22 2003 11512 2026 17,59 516 20,30 2004 12049 2097 17,41 738 26,03 2005 13051 2038 15,62 666 24,63 2006 12934 1990 15,36 778 28,12 2007 14322 2172 15,17 869 28,58 Table 2 and Diagram 3 describe the development of amounts of organic solvent required in products opposite the amount of water required as a solvent: that means that it reflects the development trend to low-solvent, solvent-free and water borne products. This brought about a continuous increase both for organic solvent and water. This is not surprising because it can be attributed to the overall increases in production. However, the difference between increases is even more interesting: it is 20% for organic solvent, but even 108% for water! Diagram 4 shows another analysis: the percentage proportion of organic solvents and the percentage proportion of water in material application. These developments are opposed to one another. The proportion of organic solvent dropped from 22% to 15% while that of water rose from 19% to 29%. As compared with our present production quantity, this spells out a savings of organic solvents of about 944 tonnes per year (or you could say 944 t of organic solvent does not get into the environment as vapour emissions).
Applctn. RC-Award 2008
Application for the Responsible Care Award 2008 13/16/
Development of Application of Organic Solvents and Water
year
1996 1998 2000 2002 2004 2006 2008
ton
ne
s
200
400
600
800
1000
1200
1400
1600
1800
2000
2200
2400
application of org. solv. [t]application of water [t]regression
Diagram 3
Percentage Consumption of Organic Solvents and Water
year
1997 1998 1999 2000 2001 2002 2003 2004 2005 2006 2007
%
12
14
16
18
20
22
24
26
28
30
organic solvents [%]water [%]regression
Diagram 4
Applctn. RC-Award 2008
Application for the Responsible Care Award 2008 14/16/
5.3 Organic Solvents as Cleansers Table 3: year material
application [t] organic solvents cleaning [t]
% organic solvents
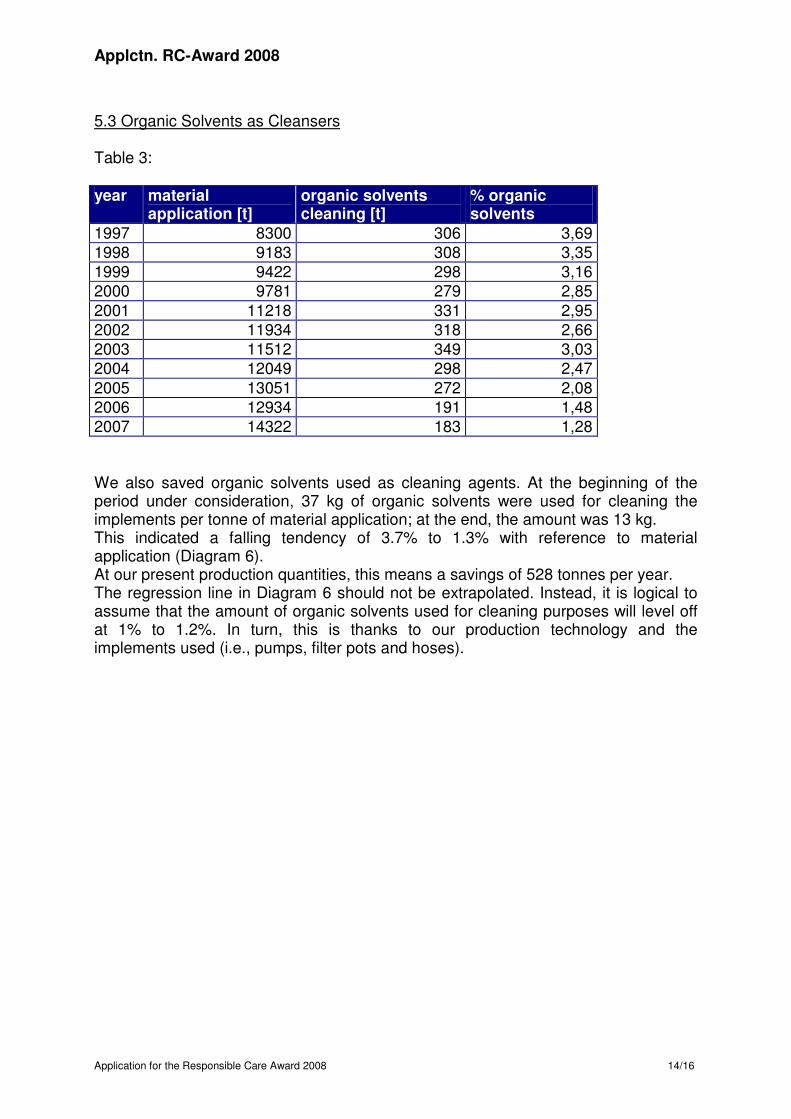
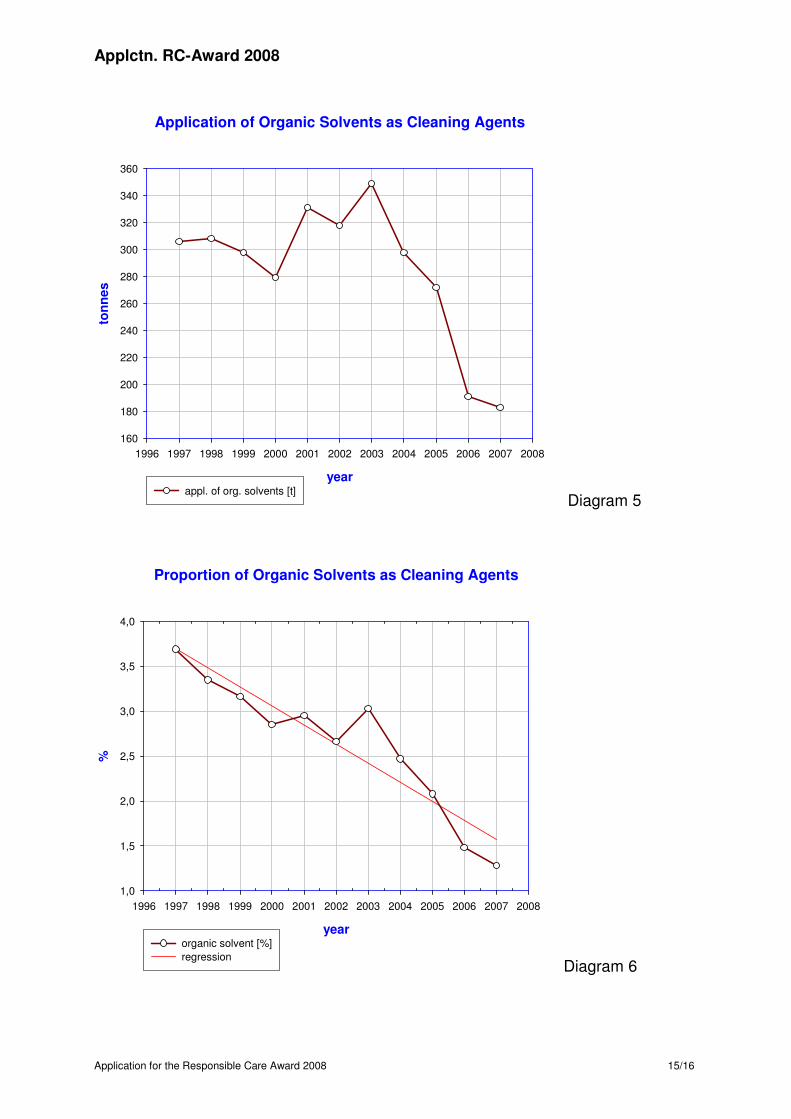
1997 8300 306 3,69 1998 9183 308 3,35 1999 9422 298 3,16 2000 9781 279 2,85 2001 11218 331 2,95 2002 11934 318 2,66 2003 11512 349 3,03 2004 12049 298 2,47 2005 13051 272 2,08 2006 12934 191 1,48 2007 14322 183 1,28 We also saved organic solvents used as cleaning agents. At the beginning of the period under consideration, 37 kg of organic solvents were used for cleaning the implements per tonne of material application; at the end, the amount was 13 kg. This indicated a falling tendency of 3.7% to 1.3% with reference to material application (Diagram 6). At our present production quantities, this means a savings of 528 tonnes per year. The regression line in Diagram 6 should not be extrapolated. Instead, it is logical to assume that the amount of organic solvents used for cleaning purposes will level off at 1% to 1.2%. In turn, this is thanks to our production technology and the implements used (i.e., pumps, filter pots and hoses).
Applctn. RC-Award 2008
Application for the Responsible Care Award 2008 15/16/
Application of Organic Solvents as Cleaning Agents
year
1996 1997 1998 1999 2000 2001 2002 2003 2004 2005 2006 2007 2008
ton
ne
s
160
180
200
220
240
260
280
300
320
340
360
appl. of org. solvents [t]Diagram 5
Proportion of Organic Solvents as Cleaning Agents
year
1996 1997 1998 1999 2000 2001 2002 2003 2004 2005 2006 2007 2008
%
1,0
1,5
2,0
2,5
3,0
3,5
4,0
organic solvent [%]regression
Diagram 6
Applctn. RC-Award 2008
Application for the Responsible Care Award 2008 16/16/
6. Summary Effects ad 5.1. improving yield by 350 tonnes of prefabricated product ⇒ avoiding waste and reducing resource utilisation ad 5.2. savings 944 tonnes of organic solvent in prefabricated products ⇒ keeping the environment cleaner for our employees and users while
driving down pollution and reducing resource utilisation ad 5.3. saving 528 tonnes of organic solvents for cleaning purposes ⇒ keeping the environment cleaner for our employees and users while
driving down pollution and reducing resource utilisation There were not only these effects, there was also reduction in the health risk to the people involved with our products including the risk of fire and the risk of explosion on the production plants both in manufacturing and applying our products. These data indicate a reduction in the usage of organic solvents of 1472 tonnes per year. As an illustration, this quantity equals the approximate amount loaded by 75 tank trucks. (With this comparison it also should be noticed the contribution in easing of traffic and the reduction in consumption of fuel and Diesel emissions.) We are convinced that the savings in consumption of organic solvents and therefore the reduction of emission of volatile organic compounds is an invaluable contribution to a cleaner and healthier world. Rembrandtin is proud of the success of this foresighted project.