Embed Size (px)
Citation preview

2 0 2 0 Per f or mance Rev iew an d O ut look – B ever age s D i v is ion
BE V ER AGE S DI V ISION
Coca-Cola beverages bring a refreshing taste to consumers.


BE V ER AGE S DI V ISION
Swire Coca-Cola has the exclusive right to manufacture, market and distribute products of The Coca-Cola Company (TCCC) in 11 provinces
and the Shanghai Municipality in the Chinese mainland and in Hong Kong, Taiwan and an extensive area of the western USA.
O V ER V IE W OF T HE BUSINE S S
Profit Attributable to the Company’s Shareholders
Capital Employed
Return on Capital Employed
Net Cash Generated from Operating Activities
2016 1917 180
500
1,000
1,500
2,500
2,000
HK$M
2016 1917 180
1,000
6,000
5,000
4,000
3,000
2,000
HK$M
2016 1917 180
15
10
5
25
20
%
2016 1917 180
20,000
15,000
10,000
5,000
HK$M

47SWIRE PACIFIC ANNUAL REPORT 2020
Swire Coca-Cola has ten wholly-owned franchise businesses (in Hong Kong, Taiwan and the USA, and in Fujian, Anhui, Guangxi, Jiangxi, Jiangsu and Hainan provinces and the cities of Zhanjiang and Maoming in Guangdong province in the Chinese mainland) and five majority-owned franchise businesses (in Zhejiang, Guangdong (excluding the cities of Zhanjiang, Maoming and Zhuhai), Henan, Yunnan and Hubei provinces in the Chinese mainland). It has a joint venture interest in a
STRATEGY
The strategic objective of Swire Coca-Cola is to build a world-class bottling system which is recognised as a first-class employer, a first-class entity with which to do business and a first-class corporate citizen in all territories where it does business. To achieve this objective, Swire Coca-Cola has five strategic priorities:
– Portfolio expansion We are fully aligned with The Coca-Cola Company’s commitment to providing drinks that meet the needs of consumers and will capture growth in a fast-changing marketplace. We must not just increase sales of sparkling drinks. We must also develop winning propositions across other major categories of drinks, so as to increase our share of the value of the total non-alcoholic beverage market.
– Commercial leadership Continuous improvements in execution, customer service, delivery and route-to-market metrics, with a view to being our customers’ preferred supplier.
– Digital leadership Becoming a digital leader, first in the beverage industry, then in the entire fast-moving consumer goods industry, in each of our markets.
– Benchmarking Benchmarking our operational and financial performance against peers in the Coca-Cola system and learning from such peers in order to adopt global best practices quickly.
– Sustainability Identifying and implementing sustainable practices in order to meet our commitments to decarbonisation, to reductions in the consumption of water and packaging materials and in the production of waste, to wider product choice, to sustainable sourcing, to supporting our communities and to creating a safe, diverse and inclusive working environment.
franchise in the Shanghai Municipality in the Chinese mainland and an associate interest in Coca-Cola Bottlers Manufacturing Holdings Limited (CCBMH), which supplies still beverages to all Coca-Cola franchises in the Chinese mainland.
At the end of 2020, Swire Coca-Cola manufactured 60 beverage brands and distributed them to a franchise population of 741 million people.

2020 PERFORMANCE REVIEW AND OUTLOOKBEVERAGES DIVISION
Idaho
Arizona
Henan Jiangsu
Anhui
Zhejiang
Fujian
Guangdong
Washington
Oregon
California
NevadaUtah
Wyoming
SouthDakota
Colorado
New Mexico
Nebraska
Kansas
Taiwan
Hong Kong
> 100
51 to 100
25 to 50
Bottling plant
2019 per capita consumption of Coca-Cola beverages (8oz servings)
Hubei
YunnanGuangxi
Jiangxi
Shanghai
HainanBottling plant
48
Per Capita Consumption in Franchise Territories
20202010
0 50 100 150 200 250 300 350
Franchise Territories
GREATER CHINA
Franchise population(millions)
(end 2020)GDP per capita
(US$)
Sales volume(million unit cases)
Per capita consumption of Coca-Cola beverages (8-oz servings)2020 2010
Chinese mainland 679.9 13,715 1,307 719
Hong Kong 7.5 45,510 56 60
Taiwan 23.6 28,180 63 62
USA 30.3 53,902 317 82
741.3 1,743 923
Note 1: A unit case comprises 24 8-ounce servings.
Idaho
Arizona
Henan Jiangsu
Anhui
Zhejiang
Fujian
Guangdong
Washington
Oregon
California
NevadaUtah
Wyoming
SouthDakota
Colorado
New Mexico
Nebraska
Kansas
Taiwan
Hong Kong
> 100
51 to 100
25 to 50
Bottling plant
2019 per capita consumption of Coca-Cola beverages (8oz servings)
Hubei
YunnanGuangxi
Jiangxi
Shanghai
HainanBottling plant
49SWIRE PACIFIC ANNUAL REPORT 2020
Franchise Territories
GREATER CHINA
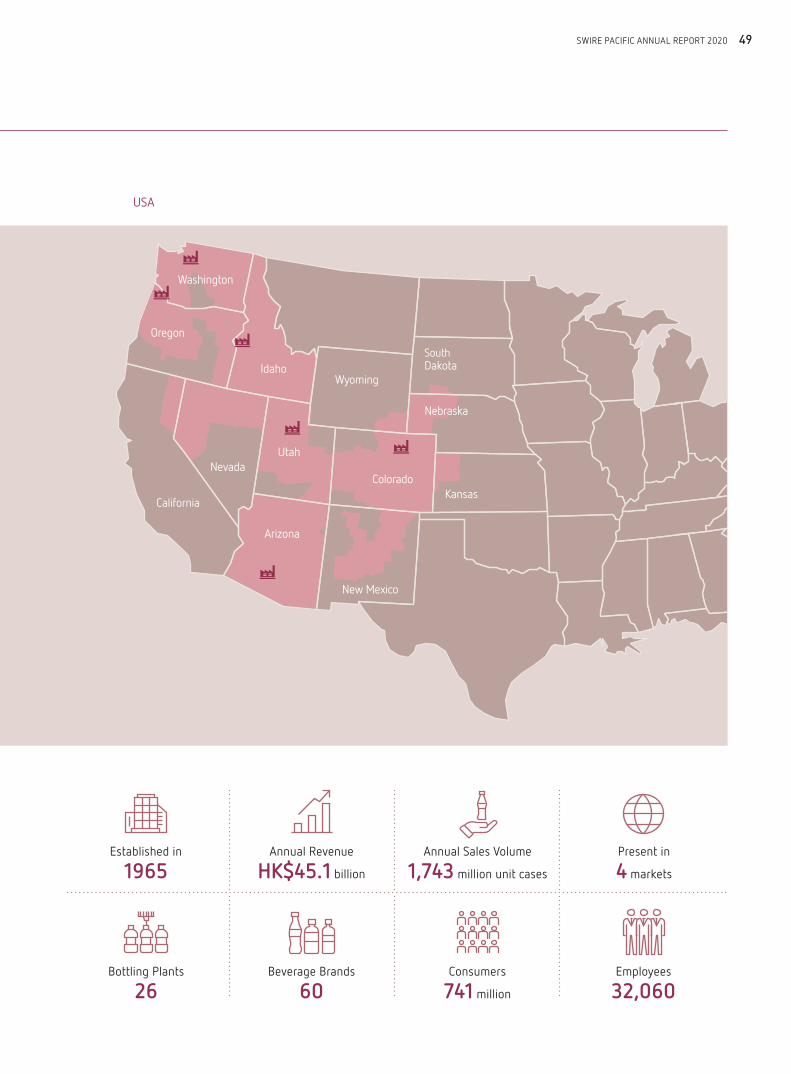
Established in
1965Annual Revenue
HK$45.1 billion
Annual Sales Volume
1,743 million unit cases
Present in
4 markets
Bottling Plants
26Beverage Brands
60Consumers
741 million
Employees
32,060
USA

2020 PERFORMANCE REVIEW AND OUTLOOKBEVERAGES DIVISION
50
2020 PERFORMANCE
Financial Highlights2020
HK$M2019
HK$M
Revenue 45,082 43,317
EBITDA 4,918 4,344
Operating profit derived from
Operating activities 2,854 2,346
Non-recurring items – 141
Total operating profit 2,854 2,487
Share of post-tax profits from joint venture and associated companies 153 153
Attributable profit (excluding non-recurring items) 2,076 1,584
Non-recurring items Gain on disposal of a plant in Yunnan, the Chinese mainland – 85
Gain on disposal of a sales centre in the USA – 17
Attributable profit 2,076 1,686
Segment Financial HighlightsRevenue EBITDA Attributable Profit
2020 HK$M
2019 HK$M
2020HK$M
2019HK$M
2020HK$M
2019 HK$M
Chinese mainland
Operating activities 22,942 22,087 2,755 2,362 1,041 856
Non-recurring items – – – 118 – 85
22,942 22,087 2,755 2,480 1,041 941
Hong Kong 2,199 2,340 340 327 216 207
Taiwan 1,933 1,694 227 164 118 75
USA
Operating activities 18,008 17,196 1,692 1,453 797 550
Non-recurring items – – – 23 – 17
18,008 17,196 1,692 1,476 797 567
Central costs – – (96) (103) (96) (104)
Beverages Division 45,082 43,317 4,918 4,344 2,076 1,686
Accounting for the Beverages DivisionThe non-recurring gains included under attributable profit are after the deduction of tax and non-controlling interests.
The ten wholly-owned franchise businesses (in Hong Kong, Taiwan and the USA, and in Fujian, Anhui, Guangxi, Jiangxi, Jiangsu and Hainan provinces and the cities of Zhanjiang and Maoming in Guangdong province in the Chinese mainland) and five majority-owned franchise businesses (in Zhejiang, Guangdong (excluding the cities of Zhanjiang, Maoming and Zhuhai), Henan, Yunnan and Hubei provinces in the Chinese mainland) were accounted for as subsidiaries in the financial statements of Swire Pacific. Revenue, EBITDA and operating profit from these franchise businesses are included in the revenue, EBITDA and operating profit shown above. The division’s joint venture interest in the Coca-Cola bottling unit of Shanghai Shen-Mei Beverage and Food Co., Ltd. and its associate interest in CCBMH were accounted for using the equity method of accounting. Swire Pacific recognised its share of net profit or loss from each of these interests as a single line-item in the consolidated statement of profit or loss.
51SWIRE PACIFIC ANNUAL REPORT 2020
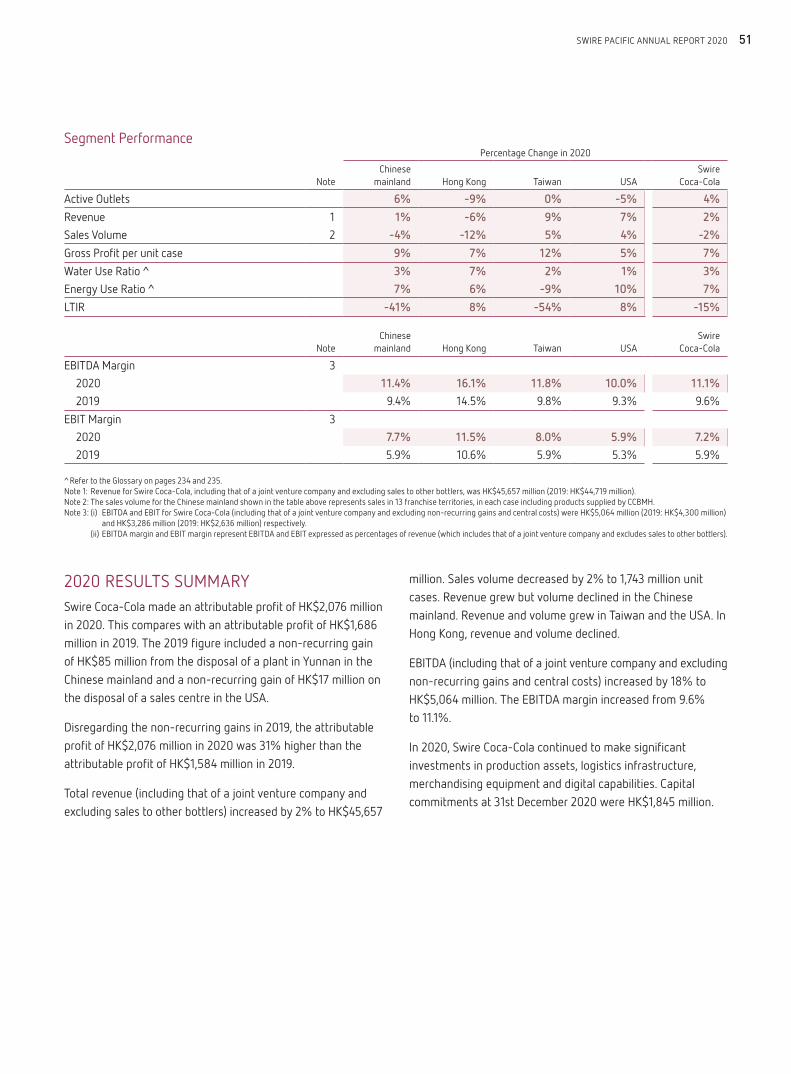
Segment Performance
Note
Percentage Change in 2020
Chinesemainland Hong Kong Taiwan USA
Swire Coca-Cola
Active Outlets 6% -9% 0% -5% 4%
Revenue 1 1% -6% 9% 7% 2%Sales Volume 2 -4% -12% 5% 4% -2%
Gross Profit per unit case 9% 7% 12% 5% 7%
Water Use Ratio ^ 3% 7% 2% 1% 3%Energy Use Ratio ^ 7% 6% -9% 10% 7%
LTIR -41% 8% -54% 8% -15%
NoteChinese
mainland Hong Kong Taiwan USASwire
Coca-Cola
EBITDA Margin 3
2020 11.4% 16.1% 11.8% 10.0% 11.1% 2019 9.4% 14.5% 9.8% 9.3% 9.6%
EBIT Margin 3
2020 7.7% 11.5% 8.0% 5.9% 7.2% 2019 5.9% 10.6% 5.9% 5.3% 5.9%
^ Refer to the Glossary on pages 234 and 235.Note 1: Revenue for Swire Coca-Cola, including that of a joint venture company and excluding sales to other bottlers, was HK$45,657 million (2019: HK$44,719 million). Note 2: The sales volume for the Chinese mainland shown in the table above represents sales in 13 franchise territories, in each case including products supplied by CCBMH. Note 3: (i) EBITDA and EBIT for Swire Coca-Cola (including that of a joint venture company and excluding non-recurring gains and central costs) were HK$5,064 million (2019: HK$4,300 million)
and HK$3,286 million (2019: HK$2,636 million) respectively. (ii) EBITDA margin and EBIT margin represent EBITDA and EBIT expressed as percentages of revenue (which includes that of a joint venture company and excludes sales to other bottlers).
2020 RESULTS SUMMARYSwire Coca-Cola made an attributable profit of HK$2,076 million in 2020. This compares with an attributable profit of HK$1,686 million in 2019. The 2019 figure included a non-recurring gain of HK$85 million from the disposal of a plant in Yunnan in the Chinese mainland and a non-recurring gain of HK$17 million on the disposal of a sales centre in the USA.
Disregarding the non-recurring gains in 2019, the attributable profit of HK$2,076 million in 2020 was 31% higher than the attributable profit of HK$1,584 million in 2019.
Total revenue (including that of a joint venture company and excluding sales to other bottlers) increased by 2% to HK$45,657
million. Sales volume decreased by 2% to 1,743 million unit cases. Revenue grew but volume declined in the Chinese mainland. Revenue and volume grew in Taiwan and the USA. In Hong Kong, revenue and volume declined.
EBITDA (including that of a joint venture company and excluding non-recurring gains and central costs) increased by 18% to HK$5,064 million. The EBITDA margin increased from 9.6% to 11.1%.
In 2020, Swire Coca-Cola continued to make significant investments in production assets, logistics infrastructure, merchandising equipment and digital capabilities. Capital commitments at 31st December 2020 were HK$1,845 million.
2020 PERFORMANCE REVIEW AND OUTLOOKBEVERAGES DIVISION
52
2020
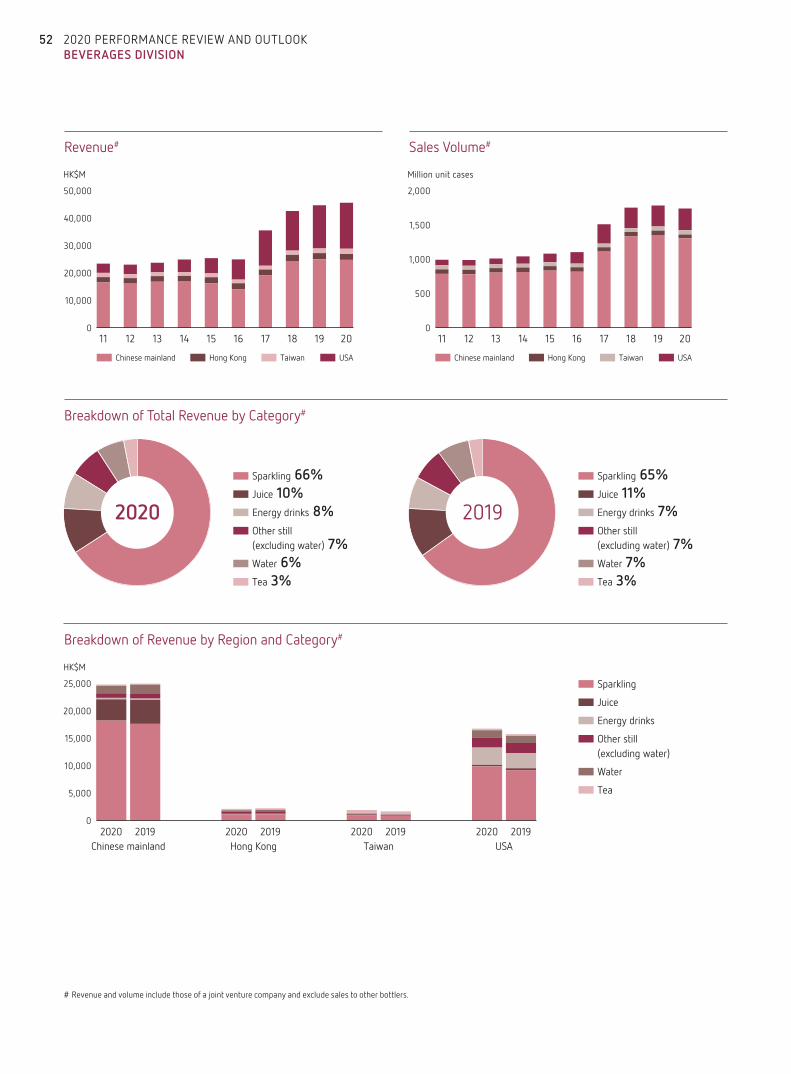
Sparkling 66%Juice 10%Energy drinks 8%
Tea 3%
Other still (excluding water) 7%Water 6%
11 12 13 14 15 16 17 18 19 200
2,000
1,500
1,000
500
Chinese mainland Hong Kong Taiwan USA
Million unit cases
11 12 13 14 15 16 17 18 19 200
50,000
40,000
30,000
20,000
10,000
Chinese mainland Hong Kong Taiwan USA
HK$M
2019
Sparkling 65%Juice 11%
Tea 3%
Energy drinks 7%Other still (excluding water) 7%Water 7%
0
25,000
20,000
15,000
10,000
5,000
2020 2019 2020 2019 2020 2019 2020 2019
Sparkling
Juice
Tea
Energy drinks
Other still (excluding water)
Water
Chinese mainland Hong Kong USATaiwan
HK$M
Breakdown of Total Revenue by Category#
Breakdown of Revenue by Region and Category#
Sales Volume#Revenue#
# Revenue and volume include those of a joint venture company and exclude sales to other bottlers.

53SWIRE PACIFIC ANNUAL REPORT 2020
Chinese mainland Hong Kong Taiwan USA
Revenue Volume Revenue Volume Revenue Volume Revenue Volume
Sparkling 6% 4% -1% -7% 7% 5% 9% 3%Juice -10% -10% -13% -14% 1% -1% -17% -28%Tea 14% 2% -7% -8% 14% 4% -7% -8%Energy drinks 24% 23% 13% 10% 19% 21% 14% 13%Other still (excluding water) 0% -9% -4% -8% -2% 12% 5% 1%Water -18% -21% -25% -23% 16% 14% 1% 10%
## Revenue (in local currency terms) and volume include those of a joint venture company and exclude sales to other bottlers.
Growth in Revenue and Volume in 2020 by Category##
Chinese mainland
Attributable profit from the Chinese mainland was HK$1,041 million in 2020. Disregarding a non-recurring gain on disposal of a plant in 2019, the attributable profit increased by 22%.
Revenue (including that of a joint venture company and excluding sales to other bottlers) grew by 1% in local currency terms. At the start of 2020, sales were adversely affected by COVID-19. There was a strong recovery from May.
Sparkling sales revenue grew by 6%. Juice and water sales revenue declined by 10% and 18% respectively. A lot of juice and water is drunk away from home. COVID-19 adversely
affected consumption of drinks away from home. Revenue from premium categories of coffee, tea and energy drinks increased by 210%, 14% and 24% respectively.
Total sales volume decreased by 4%.
The increase in revenue and lower raw material costs were partly offset by higher depreciation charges.
EBITDA and EBIT (including that of a joint venture company and excluding non-recurring gains and central costs) increased by 23% and 32% in local currency terms respectively. The EBITDA margin increased from 9.4% in 2019 to 11.4% in 2020. The EBIT margin increased from 5.9% to 7.7%.
Swire Coca-Cola’s business was adversely affected by COVID-19 in the early part of the year, but recovered
strongly outside Hong Kong.

2020 PERFORMANCE REVIEW AND OUTLOOKBEVERAGES DIVISION
54
Hong Kong
Attributable profit from Hong Kong in 2020 was HK$216 million, a 4% increase from 2019. A decrease in revenue was more than offset by savings in the costs of raw materials and the financial support provided by the Hong Kong government under the employment subsidy scheme.
Revenue (excluding sales to other bottlers) decreased by 6%, reflecting the adverse effect of COVID-19 throughout the year. Sparkling revenue decreased by 1%. Still revenue decreased by 10%. Tea, juice and water revenue decreased by 7%, 13% and 25% respectively.
Total sales volume decreased by 12%, principally reflecting the adverse effect of COVID-19 on the consumption of drinks away from home.
EBITDA and EBIT increased by 5% and 2% respectively. The EBITDA margin increased from 14.5% in 2019 to 16.1% in 2020. The EBIT margin increased from 10.6% to 11.5%.
Taiwan
Attributable profit from Taiwan in 2020 was HK$118 million, a 57% increase from 2019.
Revenue in local currency terms increased by 9%, a higher growth rate than that of volume. This reflected effective revenue growth management, successful introductions of new products and an improved product mix.
Sparkling revenue increased by 7%. Still revenue increased by 11%. Tea and energy drinks revenue increased by 14% and 19% respectively.
Total sales volume increased by 5%.
The increase in revenue was partly offset by higher operating costs.
EBITDA and EBIT increased by 32% and 48% in local currency terms respectively. The EBITDA margin increased from 9.8% in 2019 to 11.8% in 2020. The EBIT margin increased from 5.9% to 8.0%.
USA
Attributable profit from the USA was HK$797 million in 2020. Disregarding a non-recurring gain on disposal of a sales centre in 2019, the attributable profit increased by 45%. The beneficial effects of an increase in revenue and absence of a withholding tax payment were partly offset by higher operating expenses.
Revenue in local currency terms (excluding sales to other bottlers) grew by 7%. The revenue increase reflected higher sales volume, price increases, reductions in sales discounts and expenditure on promotion, and an improved product mix.
Sparkling revenue increased by 9%. Still revenue increased by 6%. The latter increase reflected increases in revenue from energy and sports drinks of 14% and 8% respectively.
Total sales volume increased by 4%. This reflected in part a shift from on-premise channels to at-home channels, where we have a stronger presence.
The increase in revenue was partly offset by higher cost of goods sold and operating expenses.
11 12 13 14 15 16 17 18 19 200
2,500
2,000
1,500
1,000
500
Chinese mainland Hong Kong Taiwan USA
HK$M
Capital Expenditure

55SWIRE PACIFIC ANNUAL REPORT 2020
EBITDA and EBIT (excluding non-recurring gains and central costs) increased by 15% and 20% in local currency terms respectively. The EBITDA margin increased from 9.3% in 2019 to 10.0% in 2020. The EBIT margin increased from 5.3% to 5.9%.
OUTLOOKAssuming no resurgence of COVID-19, revenue in the Chinese mainland is expected to grow strongly in 2021. This reflects better product and package mixes, and improved market execution. Increased operating costs, particularly staff costs, will put pressure on profits. Significant capital expenditure will continue as planned.
In Hong Kong, the beverages market is expected to continue to be adversely affected by COVID-19 in 2021. Increased depreciation charges and operating costs (due to the enhancement of distribution and production facilities) will put pressure on profits.
Revenue is expected to grow strongly in Taiwan in 2021. Capacity constraints should be eased when a contract packer’s new production line is operated at full capacity.
In the USA, revenue is expected to grow strongly in 2021. Expansion of logistics facilities will improve operational efficiency but will add depreciation charges and operating costs.
Patrick Healy
Swire Coca-Cola continues to develop better product and package mixes, and improve
market execution for its diversified product portfolio.