Embed Size (px)
Citation preview

Beverage Consumption Patterns and
Oral Health Outcomes: Do Milk and Water Confer Protective Benefits
against Sugary- or Acidic-Beverage Consumption?
by
Lindsay Ellen Gibson
A thesis presented to the University of Waterloo
in fulfilment of the thesis requirement for the degree of
Master of Science in
Health Studies and Gerontology
Waterloo, Ontario, Canada, 2014
© Lindsay Ellen Gibson 2014

ii
AUTHOR’S DECLARATION
I hereby declare that I am the sole author of this thesis. This is a true copy of the
thesis, including any required final revisions, as accepted by my examiners.
I understand that my thesis may be made electronically available to the public.
Lindsay E. Gibson
iii
ABSTRACT
Background
Diseases affecting the oral cavity are the most prevalent chronic conditions in the
world, and affect all ages, sexes, and nationalities. Diet is a strong predictor of oral
health, and beverage consumption may affect oral health outcomes; however, there has
been relatively little research on the association between the balance of beverages in the
diet and oral health outcomes.
Methods
The current study used data from the Canadian Health Measures Survey (CHMS)
to determine the impact of the type and frequency of beverage consumption on oral
health, as well as the interaction between beverages. The first round of data collection
for the CHMS took place between March 1, 2007 and March 31, 2009, and involved
5604 Canadians between the ages of 6 and 79 from across Canada. The sample targeted
individuals in privately occupied dwellings, and is representative of 97% of the Canadian
population. The CHMS consisted of two components: a household questionnaire to
collect sociodemographic information, health history, and information on personal habits,
and a clinical examination to collect anthropometric measures, blood and urine samples,
and oral health measures. For our current analysis, age was restricted to age 12-30
inclusive, with 16 participants removed for missing responses giving a final sample size
of 1534.
iv
The current analysis examined a number of different types of beverages, including
water, milk, regular soft drinks, diet soft drinks, fruit juices, fruit-flavoured drinks,
vegetable juices, sport drinks, and alcohol; and four oral health outcomes: dental decay,
periodontal health, self-rated oral health (SROH), and a general oral health index (OHX).
Descriptive tests and Poisson and Ordinal Regression were used to determine whether an
association existed between the variables of interest, and if so, the magnitude of this
association. Four models, each consisting of three sub-models, were fitted in order to
address the hypotheses and research questions. Due to the complex sampling nature of
the CHMS, survey weights were used as outlined by Statistics Canada, and clustering and
bootstrapped analyses were carried out in order to account for the complex nature of the
data.
Results
A number of the beverage variables, as well as other covariates, were associated
with oral health outcomes. Soft drink consumption was associated with all of the oral
health outcomes in the main effects models with increased soft drink consumption having
a detrimental effect on oral health. Fruit-flavoured beverage consumption was significant
with a negative impact in the dental decay main effects model, and water consumption
was significant for the SROH main effects model, having a positive effect on SROH as
the frequency of water consumption increased. Milk was significant and beneficial in all
index models, and the milk and sugary- or acidic-beverage interaction variables were
significant in all index models except for the sugary index model for dental decay. A
number of the covariates were also found to be significant: age was associated with all
v
dental decay, periodontal health and OHX models with higher age being associated with
poorer oral health, sex was significant in the dental decay models as well as the index
models for SROH with females having better oral health, income and frequency of dental
care were significant in all of the SROH models (higher income and more frequent visits
to health care professionals being associated with better SROH), frequency of flossing
was associated with all of the dental decay models in a detrimental way, and fibre
consumption was significant in the dental decay models as well as the index models for
periodontal health and OHX and had a positive impact on oral health. All other beverage
variables and covariates were not significant in any model.
Discussion
Consumption of some beverages, specifically regular soft drinks, fruit-flavoured
beverages, water and milk, had a small but significant effect on oral health outcomes. It
was also found that milk consumption is protective over sugary or acidic beverage
interaction, but the interaction between water and sugary and acidic beverages does not
seem to be significant. The small magnitude of association suggests oral health outcomes
are highly multi-factorial in etiology and oral health status is the result of an
accumulation of life exposures. Further investigations would benefit from the inclusion
of information regarding access to fluoridated water, as well as longitudinal studies.
Overall, the current findings contribute evidence on the importance of minimizing
consumption of regular soft drinks and fruit-flavoured beverages, and replacing these
drinks with those with more beneficial oral health effects such as milk and water.
vi
ACKNOWLEDGMENTS
This project would not have been possible without the help of many. First and
foremost to my thesis advisor Dr. David Hammond – thank you for your support,
patience and guidance at every stage of this process. I would also like to acknowledge the
help and excellent input received from my other committee members Dr. Rhona Hanning
and Dr. Christian Boudreau, with a special thank you to the latter for sharing his expertise
at the data analysis stage. Thank you to Dr. Pat Newcombe-Welch and the SWORDC for
accommodating my research and for the help received. I would also like to acknowledge
the University of Waterloo School of Public Health and Health Systems and the
University of Toronto Faculty of Dentistry for their flexibility and accommodation. Last
but not least, thank you to my friends, family and colleagues: without your support and
guidance this project would not have been possible.

vii
TABLE OF CONTENTS
AUTHOR’S DECLARATION ........................................................................................... ii
ABSTRACT ....................................................................................................................... iii
Background ................................................................................................................. iii
Methods ...................................................................................................................... iii
Results ........................................................................................................................ iv
Discussion .................................................................................................................... v
ACKNOWLEDGMENTS ................................................................................................. vi
LIST OF FIGURES ........................................................................................................... xi
LIST OF TABLES ........................................................................................................... xiii
LIST OF ABBREVIATIONS .......................................................................................... xiv
BACKGROUND ................................................................................................................ 1
Oral Health ...................................................................................................................... 1
Importance of Good Oral Health ................................................................................. 1
Conditions Associated with Oral Health ..................................................................... 2
Beverages and Oral Health .............................................................................................. 7
Water and Oral Health ................................................................................................. 8
Milk and Oral Health ................................................................................................... 8
Regular Soft Drinks and Oral Health ........................................................................ 10
Diet Soft Drinks and Oral Health .............................................................................. 11
Sport Drinks and Oral Health .................................................................................... 12
Fruit Juices and Oral Health ...................................................................................... 13
Fruit-Flavoured Drinks and Oral Health ................................................................... 14
Vegetable Juices and Oral Health .............................................................................. 14
viii
Alcohol and Oral Health ............................................................................................ 15
Other Beverages and Oral Health .............................................................................. 15
Balance of Beverages in the Diet .................................................................................. 16
Existing Body of Evidence ........................................................................................ 18
Research Gaps ........................................................................................................... 21
RESEARCH RATIONALE .............................................................................................. 22
Rationale ........................................................................................................................ 22
Purpose and Research Questions ................................................................................... 23
METHODS ....................................................................................................................... 24
Canadian Health Measures Survey ............................................................................... 24
Study Participants .......................................................................................................... 25
Measures ........................................................................................................................ 28
Sociodemographic Variables ..................................................................................... 28
Oral Health Variables ................................................................................................ 29
Beverage Variables .................................................................................................... 33
Beverage Consumption Indices (Sugary and Acidic) ................................................ 34
Other Variables .......................................................................................................... 35
Hypotheses .................................................................................................................... 38
ANALYSIS ....................................................................................................................... 40
Models ........................................................................................................................... 46
RESULTS ......................................................................................................................... 49
Descriptive Analyses ..................................................................................................... 49
Sociodemographic Variables ..................................................................................... 49
Beverage Variables .................................................................................................... 50
Beverage Variables – Water ...................................................................................... 50

ix
Beverage Variables – Milk ........................................................................................ 51
Beverage Variables – Regular Soft Drinks ................................................................ 52
Beverage Variables – Diet Soft Drinks ..................................................................... 53
Beverage Variables – Sports Drinks .......................................................................... 53
Beverage Variables – Fruit Juices ............................................................................. 54
Beverage Variables – Fruit-Flavoured Beverages ..................................................... 55
Beverage Variables – Vegetable Juice ...................................................................... 55
Beverage Variables – Alcohol ................................................................................... 56
Beverage Variables – Sugary Beverage Index .......................................................... 57
Beverage Variables – Acidic Beverage Index ........................................................... 58
Outcome Variables .................................................................................................... 59
Outcome Variables – Dental Decay .......................................................................... 59
Outcome Variables –Periodontal Health ................................................................... 60
Outcome Variables – Self-Rated Oral Health ........................................................... 62
Outcome Variables – OHX ........................................................................................ 63
Models ........................................................................................................................... 65
Main Effects Model – Dental Decay ......................................................................... 66
Sugary Beverage Index Model – Dental Decay ........................................................ 71
Acidic Beverage Index Model – Dental Decay ......................................................... 77
Main Effects Model – Periodontal Health ................................................................. 82
Sugary Beverage Index Model- Periodontal Health .................................................. 86
Acidic Beverage Index Model – Periodontal Health ................................................. 90
Main Effects Model – Self-Rated Oral Health .......................................................... 95
Sugary Beverage Index Model – Self-Rated Oral Health ......................................... 99
Acidic Beverage Index Model – Self-Rated Oral Health ........................................ 104
x
Main Effects Model – Oral Health Index ................................................................ 109
Sugary Beverage Index Model – Oral Health Index ............................................... 113
Acidic Beverage Index Model – Oral Health Index ................................................ 117
DISCUSSION ................................................................................................................. 122
CONCLUSIONS ............................................................................................................ 138
REFERENCES ............................................................................................................... 141
Appendix A – CHMS Questions .................................................................................... 153
Sociodemographic Variables: ..................................................................................... 153
Oral Health Variables: ................................................................................................. 153
Beverage Variables: .................................................................................................... 154
How often do you usually drink regular soft drinks? (WSD_B11) ............................. 154
Other Variables: .......................................................................................................... 155
Appendix B – CHMS Derived Variables ........................................................................ 158
Sociodemographic Variables: ..................................................................................... 158
Oral Health Variables: ................................................................................................. 158
Beverage Variables: .................................................................................................... 159
Nutrition Variables: ..................................................................................................... 159
xi
LIST OF FIGURES
Figure 1. Response Proportions of Weekly Water Consumption Figure 2. Response Proportions of Weekly Milk Consumption Figure 3. Response Proportions of Weekly Soft Drink Consumption Figure 4. Response Proportions of Weekly Diet Soft Drink Consumption Figure 5. Response Proportions of Weekly Sports Drink Consumption Figure 6. Response Proportions of Weekly Fruit Juice Consumption Figure 7. Response Proportions of Weekly Fruit-Flavoured Drink Consumption Figure 8. Response Proportions of Weekly Vegetable Juice Consumption Figure 9. Response Proportions of Weekly Alcohol Consumption Figure 10. Response Proportions of Weekly Sugary Beverage Consumption Figure 11. Response Proportions of Weekly Acidic Beverage Consumption Figure 12. Response Proportions of Dental Decay Figure 13. Response Proportions of Periodontal Health Figure 14. Response Proportions for Self-Rated Oral Health Figure 15. Response Proportions for Oral Health Index Scores Figure 16. Effect of Water Consumption on Dental Decay Figure 17. Effect of Milk Consumption on Dental Decay Figure 18. Effect of Regular Soft Drink Consumption on Dental Decay Figure 19. Effect of Fruit-Flavoured Beverage Consumption on Dental Decay Figure 20. Effect of Sugary Beverage Consumption on Dental Decay Figure 21. Interaction of Water and Sugary Beverage Consumption Figure 22. Interaction of Milk and Sugary Beverage Consumption Figure 23. Effect of Acidic Beverage Consumption on Dental Decay Figure 24. Interaction of Water and Acidic Beverage Consumption Figure 25. Interaction between Milk and Acidic Beverage Consumption Figure 26. Effect of Water Consumption on Periodontal Health Figure 27. Effect of Milk Consumption on Periodontal Health Figure 28. Effect of Regular Soft Drink Consumption on Periodontal Health Figure 29. Effect of Sugary Beverage Consumption on Periodontal Health Figure 30. Interaction of Water and Sugary Beverage Consumption Figure 31. Interaction between Milk and Sugary Beverage Consumption Figure 32. Effect of Acidic Beverage Consumption on Periodontal Health Figure 33. Interaction between Water and Acidic Beverage Consumption Figure 34. Interaction between Milk and Acidic Beverage Consumption Figure 35. Effect of Water Consumption on Self-Rated Oral Health Figure 36. Effect of Milk Consumption on Self-Rated Oral Health Figure 37. Effect of Regular Soft Drink Consumption on Self-Rated Oral Health Figure 38. Effect of Sugary Beverage Consumption on Self-Rated Oral Health

xii
Figure 39. Interaction between Water and Sugary Beverage Consumption Figure 40. Interaction between Milk and Sugary Beverage Consumption Figure 41. Effect of Acidic Beverage Consumption on Self-Rated Oral Health Figure 42. Interaction between Water and Acidic Beverage Consumption Figure 43. Interaction between Milk and Acidic Beverage Consumption Figure 44. Effect of Water Consumption on Overall Oral Health Figure 45. Effect of Milk Consumption on Overall Oral Health Figure 46. Effect of Regular Soft Drink Consumption on Overall Oral Health Figure 47. Effect of Sugary Beverage Consumption on Overall Oral Health Figure 48. Interaction between Water and Sugary Beverage Consumption Figure 49. Interaction between Milk and Sugary Beverage Consumption Figure 50. Effect of Acidic Beverage Consumption on Overall Oral Health Figure 51. Interaction between Water and Acidic Beverage Consumption Figure 52. Interaction between Milk and Acidic Beverage Consumption

xiii
LIST OF TABLES
Table 1. Models Table 2. Sociodemographic and Covariate Descriptive Statistics (n=1543) Table 3. Dental Decay Descriptive Statistics (n=1534) Table 4. Periodontal Health Descriptive Statistics (n=1534) Table 5. Self-Rated Oral Health Descriptive Statistics (n=1534) Table 6. Oral Health Index Descriptive Statistics (n=1534) Table 7. Correlates of Dental Decay, Main Effects Model, Poisson Regression (n=1534) Table 8. Correlates of Dental Decay, Sugary Beverage Index Model, Poisson Regression
(n=1534) Table 9. Correlates of Dental Decay, Acidic Beverage Index Model, Poisson Regression
(n=1534) Table 10. Correlates of Periodontal Health, Main Effects Model, Poisson Regression
(n=1534) Table 11. Correlates of Periodontal Health, Sugary Beverage Index Model, Poisson
Regression (n=1534) Table 12. Correlates of Periodontal Health, Acidic Beverage Index Model, Poisson
Regression (n=1534) Table 13. Correlates of Self-Rated Oral Health, Main Effects Model, Ordinal Regression
(n=1534) Table 14. Correlates of Self-Rated Oral Health, Sugary Beverage Index Model, Ordinal
Regression (n=1534) Table 15. Correlates of Self-Rated Oral Health, Acidic Beverage Index Model, Ordinal
Regression (n=1534) Table 16. Correlates of Oral Health Index, Main Effects Model, Poisson Regression
(n=1534) Table 17. Correlates of Oral Health Index, Sugary Beverage Index Model, Poisson
Regression (n=1534) Table 18. Correlates of Oral Health Index, Acidic Beverage Index Model, Poisson
Regression (n=1534)

xiv
LIST OF ABBREVIATIONS
BMI – Body Mass Index
CHMS – Canadian Health Measures Survey
CI – Confidence Interval
df – degrees of freedom
dmfs – (primary) decayed, missing or filled surfaces
IRR – Incidence Rate Ratio
NHANES III – National Health and Nutrition Examination Survey III
OHX – Oral Health Index
PHAC – Public Health Agency of Canada
sd – standard deviation
SES – Socioeconomic Status
SROH – Self-Rated Oral Health
SWORDC – South Western Ontario Research Data Centre
WHO – World Health Organization
1
BACKGROUND
Oral Health
Importance of Good Oral Health
Diseases related to oral health, including periodontal disease and dental caries, are
the most prevalent chronic diseases in the world and can affect everyone, from newborns
to the elderly (Public Health Agency of Canada [PHAC], 2010). In fact, up to 90% of
schoolchildren are affected by dental caries (PHAC, 2010). Oral health is defined by the
World Health Organization (WHO) as “being free of chronic mouth and facial pain, oral
and throat cancer, oral sores, birth defects such as cleft lip and palate, periodontal (gum)
disease, tooth decay and tooth loss, and other disease and disorders that affect the mouth
and oral cavity” (WHO, 2007). Due to the widespread prevalence of oral health issues
and the possible link between oral and systemic disease, there has been a recent research
focus on oral health, including the relationship between oral health and nutrition.
The mouth is involved in a large number of functions essential to everyday life,
including eating, drinking, chewing, and verbal and non-verbal communication (Scardina
& Messina, 2012). It is important to maintain good oral health in order to preserve the
ability to carry out these functions. In particular, tooth pain can make chewing or biting
painful and difficult, which affects nutritional intake (Iacopino, 2008). For instance, an
Australian study found that tooth loss, characterized by having less than 21 teeth (the
normal fully dentate individual has 32 teeth including wisdom teeth), was found to be
associated with decreased intake of a variety of fruits and vegetables, especially lettuce
2
(prevalence ratio [PR] = 3.99), stir-fried/mixed vegetables (PR = 2.34), and pitted fruits
(PR = 1.91) (Brennan, Singh, Liu, & Spencer, 2010). A similar study found that
edentulous older adults were 2.9 times (95% confidence interval 1.1-7.8) more likely to
be malnourished (BMI <21 kg/m2, or serum albumin <33g/L) than those with teeth or
properly fitting dentures (Mojon, Budtz-Jorgensen, & Rapin, 1999). Oral health has
implications for one’s self-esteem and success, as self-confidence issues related to oral
health, such as feeling one’s smile is not white enough, can hold individuals back from
social and professional situations (Klages, Bruckner, & Zentner, 2004). For example, a
study examining the oral health related quality of life in university students found that
those individuals with lower self-ranked dental aesthetics scored significantly higher on
social and general appearance disapproval, and lower on dental self-confidence (Klages
et al., 2004). As these examples illustrate, oral health is important to carry out the
functions of daily life and it is essential to maintain good oral health.
Conditions Associated with Oral Health
There are a large number of conditions associated with oral health; however, only
the two most prevalent oral health indicators/conditions will be examined as a part of the
present analysis: dental decay (consisting of dental caries and dental erosion) and
gingivitis/periodontitis. Self-rated oral health will be examined for its impact on quality
of life and overall experience of oral health, as well as an Oral Health Index compiling a
number of oral health indicators in order to capture an overall impression of the
individual’s oral health status.

3
Dental Decay
Tooth decay (including caries and erosion) is the most common condition
involving oral health, as well as the most common chronic disease (PHAC, 2010).
Dental decay affects 56.8% of Canadian children age 6-11 years old, and 58.8% of
Canadian adolescents between the ages of 12-19 (Health Canada, 2010). 95.9% of
Canadian adults age 19 or older have experienced tooth decay (Health Canada, 2010).
Dental caries are caused by the demineralization of tooth surfaces and the
dissolution of the organic component of the tooth (Alvarez, 1995). When bacteria, or
plaque, come into contact with sugars in the mouth, acid is produced (Alvarez, 1995).
This acid works to break down food, but can also break down the tooth structure
(Alvarez, 1995). Although dental caries require the presence of bacteria and sugars or
fermentable carbohydrates to form, they can also be influenced by a number of other
factors including the susceptibility of the teeth, type of bacteria, fluoride exposure, and
salivary secretions (Scardina & Messina, 2012).
Dental erosion is the permanent loss of tooth structure due to chemical dissolution
resulting from acidic conditions within the oral cavity, beginning in the enamel and
progressing to the underlying dentin (O’Sullivan & Milosevic, 1997). Although both
dental caries and erosion involve the irreversible destruction of tooth structure, caries
develop as a result of bacterial catalysis of sugars, whereas erosion occurs due to the
presence of an acidic oral environment (O’Sullivan & Milosevic, 1997). The most
common cause of erosion is consumption of acidic foods and beverages, specifically
those foods and drinks which cause the pH of the oral cavity to become lower than the

4
critical pH of 5.5 (O’Sullivan & Milosevic, 1997). Beverages in particular seem to
contribute largely to the high rates of dental erosion seen today, partly due to the low
viscosity of these substances and ability to easily access most areas of the oral cavity;
these acidic drinks include regular and diet soft drinks, fruit juices, sports drinks, and
wine (Mandel, 2005).
Certain groups tend to be at increased risk for developing dental caries and
erosion; these groups include children, young adults, elderly individuals, and those of low
socioeconomic status (SES) (Waldo, 2009). As dental caries are multifactorial in
causation, it is difficult to determine why these groups are at increased risk; however, the
poor diet quality of many of these groups, especially high sugar sweetened beverage
consumption, as well as poor oral hygiene habits, likely contributes to their increased risk
(Waldo, 2009). In addition, many of these populations are unable to afford or access
regular dental preventive care and treatment (Gillchrist, Brumley, & Blackford, 2001;
Rayner, 1970; Teodora Timis, 2005). There is also particular concern with infants and
toddlers taking a bottle of juice to bed, as this long-term exposure to sugary- and acidic-
beverages is a risk factor for the development of caries and acid erosion (O’Sullivan &
Milosevic, 1997).
Periodontal Diseases
Gingivitis is the most common form of periodontal disease and is characterized by
inflammation of the gums, sometimes to the point of pain or bleeding (Listgarten, 2005).
It most commonly develops as a result of plaque (bacterial biofilm) build-up on tooth
5
surfaces near the gingiva and within the gingival sulcus (Listgarten, 2005). This bacterial
build-up causes an immune response in the body, which has been linked to a number of
systemic conditions including diabetes, cerebrovascular disease, myocardial infarction,
and impaired memory (Soskolne & Klinger, 2001; Wu et al., 2000; Pussinen et al., 2007;
Noble et al., 2009). If left untreated, gingivitis can progress to become periodontitis,
which is a destructive inflammatory disease affecting the tissues that surround and
support the teeth (Savage et al., 2009). Periodontitis may result in tooth loss or decay,
abscesses in the oral cavity, and swollen glands (Listgarten, 2005). Gingivitis commonly
develops as a result of poor oral hygiene and low calcium intake, which may be a result
of low milk consumption (Nishida et al., 2000). Approximately 32% of Canadian adults
between the ages of 20 and 79 have gingivitis, with smokers and individuals with lower
incomes are more likely to be affected by periodontal disease (Health Canada, 2010).
Oral Health Index (OHX)
Oral health and disease encompasses a wide range of diseases, conditions,
anatomical structures, and psychosocial states, and thus it is difficult to measure the
overall oral health of an individual; however, several indices have been developed with
this aim. Most indices are restricted for use in certain situations, such as for seniors
(Atchison & Dolan, 1990; Tubert-Jeannin, Riordan, Moral-Papernot, Porcheray, & Saby-
Collet, 2003) or children (Bratthall, 2000; Yusuf, Gherunpong, Sheiham, & Tsakos,
2006), or only focus on one aspect of oral health, such as caries (Bratthall, 2000) or
quality of life (Locker, Clarke & Payne, 2000; Slade & Spencer, 1994; Tubert-Jeannin et
6
al., 2003; Yusuf et al., 2006), and thus are not appropriate for use in this study. However,
the Oral Health Index (OHX) developed by Burke and Wilson (1995) is applicable to all
ages and examines many aspects of oral health, and thus has been adapted for use in this
investigation. There are some other composite measures of oral health with a broader
focus, such as the Oral Health Status Index (Marcus, Koch & Gershen, 1980), but the
OHX was deemed to be the best fit with the variables available from the CHMS.
The OHX consists of assessments for caries, restorations, tooth fracture, wear,
periodontal disease, mucosa, occlusion, dentures and patient satisfaction, covering many
aspects of oral health, although some areas, such as root canal treatment, cannot be
included due to the solely visual and verbal nature of the examination (Burke & Wilson,
1995). Weightings are assigned to each area based on its overall importance to oral
health, and although these weightings are somewhat arbitrary, they are consistent with
other measures of oral health and are related to overall function of and severity of impact
to the oral cavity and individual as a whole (Burke and Wilson, 1995). Although only
certain sections of the OHX were used in this analysis, this is not generally seen as an
issue as the OHX was developed for such use, due to the inherent problem of not all
assessment sections being relevant to each patient (such as the denture assessment)
(Burke & Wilson, 1995). The OHX score is usually presented as a percentage achieved
of the total possible score, although for this analysis, we have expressed the score as the
raw value of the assessment (out of a total possible score of 60), as the sections used were
the same for each study participant (Burke & Wilson, 1995). Oral health, rather than
disease, is viewed and scored positively, with positive scores being awarded for an
acceptable state, and a zero score for unacceptable assessments, and thus the OHX is a
7
measure of oral health with higher scores indicating better oral health (Burke & Wilson,
1995).
Beverages and Oral Health
Nutrition plays an important role in maintaining good oral health through
numerous functions such as helping to provide the nutrients necessary to the
physiological functioning of the oral cavity, as well as promoting salivary release through
mastication (Scardina & Messina, 2012). For instance, peanuts and sugarless chewing
gum mechanically stimulate the secretion of saliva, which helps to protect the teeth
against dental caries and acid erosion (Scardina & Messina, 2012). As well, increased
consumption of fibre can be beneficial to the oral cavity in a number of ways including
increasing salivary output and decreasing appetite and therefore the number of potentially
harmful substances the mouth is subject to (Sheiham, 2005). It also helps to control
systemic disease and inflammation which may affect the gingival tissues, as is the case in
diabetes (Sheiham, 2005). Other behaviours such as smoking tobacco increase one’s risk
for a variety of oral conditions including oral cancer, stained teeth, and recession of the
gum line (Canadian Dental Association [CDA], 2012b; Sands, 2006). Along with solid
foods, beverages play an important role in determining oral health status. For the most
part, the association between certain types of beverages consumed and oral health
outcomes have been well established in the literature.
8
Water and Oral Health
Water helps to prevent dental decay and oral diseases by rinsing the mouth of
food debris and bacteria (Scardina & Messina, 2012). Fluoridated water has the
additional benefit of remineralizing the teeth, which helps to protect against dental caries
and other oral diseases, and has been shown to reduce dental caries by up to 40%
(Gordon, 2007). The average Canadian consumes 4 250mL servings of water per day,
which is approximately half of the recommended amount (Jones et al., 2006). However,
like most foods/beverages, the frequency of water consumption has a bigger impact on
oral health than the amount; water offers the most protective benefits if consumed after
eating or drinking other substances, especially those that are high in sugar or acidity
(Touger-Decker & van Loveren, 2003).
Milk and Oral Health
Milk consumption also confers benefits for oral health. Although the primary
compound of milk is a sugar, lactose is much less cariogenic as compared with other
sugars (Merritt, Qi, & Shi, 2006). Milk also helps to remineralize the teeth due to its high
calcium and phosphorus contents (Merritt, Qi, & Shi, 2006). In fact, milk has been found
to be protective against dental caries in children with poor oral hygiene, frequent sugar
consumption and who did not use fluoride (Petti, Simonetti, & Simonetti D’Arca, 1997).
In addition to its role in remineralization, milk also acts as a salivary buffer, raising the
pH of the mouth and helping to protect against dental decay and erosion (Fejerskov &
Kidd, 2008). The probiotic cultures in milk products may also help to combat oral

9
infections, including periodontal diseases, by replacing pathogenic bacteria with more
harmless microorganisms (Calgar, Kargul, & Tanboga, 2005). However, there is also
limited evidence to suggest that the presence of lactobacilli is associated with a more
carious oral environment (Calgar, Kargul, & Tanboga, 2005).
Over the past 20 years, milk consumption in Canada has declined significantly,
with the exception of chocolate milk. As of 2011, the average Canadian consumed 78.7L
of fluid milk products per year, or about 220mL of milk per day (Canadian Dairy
Information Centre, 2012). This is concerning because it indicates many individuals are
not receiving the protective oral health benefits milk confers, among other health
benefits. Also, chocolate milk (and other flavoured milk) is higher in sugar content than
white milk, which can increase the risk for developing dental caries, although the added
benefits of consuming a dairy product make flavoured milks a healthier option than other
sweetened beverages, especially in terms of oral health (Levine, 2001). Although there is
no recommended level of milk consumption in order to improve oral health, the Canadian
Food Guide recommends between 2 and 4 servings of milk products each day, depending
on age and sex, and it is generally recommended to increase dairy consumption to protect
oral health (Health Canada, 2011; CDA, 2012a). Although milk consumption is
generally lower than ideal among all sociodemographic groups, those of low SES are
particularly at risk for poor oral health due to low milk consumption (Wang et al., 2007).

10
Regular Soft Drinks and Oral Health
On the other hand, some beverages have detrimental impacts on oral health.
Regular soft drinks are high in sugar content, and as a result, can lead to caries
development if consumed frequently (Touger-Decker & van Loveren, 2003). Due to
their acidic properties, regular soft drinks can also contribute to dental erosion by
lowering the pH of the mouth (Dugmore & Rock, 2004). The impact of regular soft
drinks on dental health has become so great that they often emerge as the single
nutritional item affecting oral health in multifactorial analysis; this is largely due to their
frequent and widespread consumption among many populations (Burt et al., 2006;
Dugmore & Rock, 2004).
However, the relationship between these sugary and acidic beverages and oral
health is complex. Dental caries and erosion, along with many other oral diseases, have a
multifactorial etiology, and as a result, a direct causative association between sugary
and/or acidic beverages and disease of the oral cavity has not been established (Ismail,
Burt, & Eklund, 1984; Fejerskov & Kidd, 2008). Dental caries develop as a result of the
long-term presence of bacteria and enzymes in the oral cavity, especially if the
neutralizing capabilities of saliva have been compromised (Scardina & Messina, 2012).
Specifically, the frequency of food intake affects its cariogenicity: Ismail and colleagues
(1984) recorded a 1.79 increased odds for decayed, missing or filled teeth (DMFT – a
common indicator of dental caries) if soft drinks were consumed between meals three or
more times per day. Interestingly, DMFT score was not associated with meal-time
consumption of soft drinks (Ismail et al., 1984). Certain groups tend to be at heightened
risk for dental caries: children, young adults, elderly individuals, and those of low SES
11
(Waldo, 2009). As dental caries are multifactorial in causation, it is difficult to determine
why these groups are at increased risk; however, it is likely the poor diet quality,
especially high sugar sweetened beverage consumption, of many of these groups plays a
role, as well as poor oral hygiene habits (Waldo, 2009).
Diet Soft Drinks and Oral Health
Diet soft drinks are often selected as an alternative to regular soft drinks as they
are lower in caloric content, and thus are thought to be a healthier, or at least less
obesogenic, option. Unlike regular soft drinks, diet soft drinks are not sweetened with
sugar, and thus, most of the risk for dental caries is ameliorated. However, diet soft
drinks are generally acidic (pH between 3.00 and 3.70), which can lower the pH of the
saliva in the mouth, contributing to dental erosion as well as a decreased ability to combat
the formation of dental caries (Jain, Nihill, Sobkowski, & Agustin, 2007; von Fraunhofer
& Rogers, 2004). However, there is some evidence to suggest that diet soft drinks,
specifically Diet Coke, pose a lesser acid challenge to the enamel than regular Coke
(Roos & Donly, 2002). Like other acidic beverages, it is less harmful for one’s oral
health to consume diet soft drinks in low quantities and frequencies, and at meal times,
which allows for the other foods being consumed to neutralize the acidity of these drinks
(von Fraunhofer & Rogers, 2004).
12
Sport Drinks and Oral Health
Sport drinks also tend to be high in sugar, generally over 10g of sugar per 250mL,
which equates to between 6-8% carbohydrate composition, depending on the
manufacturer (Coombes, 2005). Sports drinks also tend to be high in acidity (pH of
between 2.4 and 4.5), and thus affect oral health in a way similar to other sugary and
acidic beverages (Coombes, 2005). The erosive potential of sport drinks has been shown
to be similar to diet soft drinks, but not as high as regular soft drinks and orange juice
(Rytomaa et al., 1988). It has also been indicated that sport drinks can contribute to
dental erosion but not dental caries in a rat population (Sorvari, 1989). In human
populations, no link has been found between sport drinks and dental caries; however,
sport drinks are comparable in cariogenicity to fruit juices, fruit flavoured drinks and
regular soft drinks, so an association between sport drinks and caries cannot be
overlooked (Birkhead, 1984). Again, many researchers have suggested it is the
frequency and timing of sport drink consumption that affects oral health, as opposed to
the amount consumed (Coombes, 2005). The type of sports drink also affects its erosive
potential, as the acidity and sugar content of sport drinks varies between drinks
(Milosevic, 1997). The group at highest risk for poor oral health outcomes due to
consumption of sport drinks is athletes and other active individuals, as well as those with
genetic factors which make their teeth more susceptible to decay (Coombes, 2005).
Compared to water, however, sport drinks confer only negligible benefits for most
recreationally active individuals, while they may lead to significantly poorer oral health
outcomes (Coombes & Hamilton, 2000).
13
Fruit Juices and Oral Health
100% fruit juices impact oral health in a similar way to regular soft drinks, by
promoting the development of dental decay (Touger-Decker & van Loveren, 2003).
Although the sugar content in fruit juices originates from a natural source, it still requires
the presence of bacteria to break down these fermentable carbohydrates in the oral cavity,
and this can contribute to the formation of dental caries (Landon, 2007). Fruit juices also
tend to be acidic, ranging in pH from about 2.00 (lime and lemon juices) to 4.19 (orange
juice) (United States Food and Drug Administration [USFDA], 2007). The low pH of
these beverages lowers the salivary pH, which impairs the ability of the saliva to protect
against dental decay (Landon, 2007). Like other sugary and acidic beverages, the timing
and frequency of fruit juice consumption influences its impact on oral health, with more
frequent consumption outside of meal time being associated with poorer oral health
outcomes (Landon, 2007).
However, drinking 100% fruit juice with a high Vitamin C content may actually
help to protect dental health. Vitamin C promotes collagen synthesis, wound healing, and
acts as a powerful anti-toxin, and in addition, improves the oral immune response by
creating a protective barrier against bacterial endotoxins (Rubinoff, Latner, & Pasut,
1989). Due to vitamin C’s role in improving immune function, it may help to combat
periodontal disease, especially aspects involving gingival inflammation and bacterial
infection (Rubinoff et al., 1989). Fruit juices seem to be the primary source of Vitamin C
in an individual’s diet; in Australia, fruit juices provide 33% of the Vitamin C in
children’s diets, and almost 25% of the Vitamin C adults consume (Record, 2001).
14
Fruit-Flavoured Drinks and Oral Health
Like regular soft drinks and fruit juices, fruit flavoured drinks tend to be acidic
and high in sugar content, and thus affect oral health in a similar way. The high sugar
content of these drinks, usually about 11-12g of sugar per 355mL (1 can), promotes the
development of dental caries (Winnipeg Regional Health Authority, 2010). Fruit
flavoured drinks are also low in pH, which can promote acid erosion of the teeth (Ligh,
Fridgen, & Saxton, 2011). Like other sugary and acidic beverages, the impact of fruit
flavoured drinks on oral health depends on their frequency and timing of consumption
(Touger-Decker & van Loveren, 2003). Children, teenagers, and those of low SES are
more likely to consume fruit flavoured drinks, and are thus at higher risk for poor oral
health as a result of this consumption (Nicklas, 2003).
Vegetable Juices and Oral Health
Like many of the other drinks discussed, vegetable juices are low in pH, and thus
increase the risk for dental erosion. However, although vegetable juices are generally
acidic, with a pH ranging from 3.90 to 4.30, they are less acidic than most fruit juices
(USFDA, 2007). There is limited evidence examining the association between vegetable
juice and oral health, likely due to the low consumption patterns of this beverage
(Ruxton, Gardner, & Walker, 2006).
15
Alcohol and Oral Health
Alcohol consumption can also have an impact on oral health. Many types of
alcohol, especially wine, are highly acidic and thus contribute to the risk of dental erosion
(Mandel, 2005). Some alcohols are high in sugar content, and thus contribute to caries
formation (Petti & Scully, 2009). High alcohol consumption, generally defined as over
50g per day or frequent binge drinking episodes, has also been linked to an increased risk
of oral cancer (Petti & Scully, 2009). Individuals who abuse alcohol are much more
likely to experience dental decay, periodontal disease, and poor oral health in general; in
fact, up to 80% of alcohol abusers have an impaired oral health status (Araujo, Dermen,
Lalonde, Connors, & Ciancio, 2003).
Other Beverages and Oral Health
Other beverages, including coffee and tea, also have an impact on oral health.
Although these beverages will not be examined as a part of the present analysis, as
CHMS did not investigate the consumption patterns of each of these beverages, it is
important to recognize their impact on oral health.
Tea can have both a protective and detrimental impact on oral health. Black tea
can aid in fluoride remineralization of the teeth, which helps to protect against dental
caries (Moynihan, 2000). The pH of tea is around 7.20, which means it does not
contribute to the lowering of salivary pH, and thus is not a significant risk factor for
dental erosion (USFDA, 2007). The polyphenols in tea may also help to combat
halitosis, by inhibiting the growth of bacteria that cause bad breath (Xu, Zhou, & Wu,

16
2010). However, tea is often sweetened with sugar or honey, and this can increase the
risk for dental caries if consumed frequently (Touger-Decker & van Loveren, 2003).
Also, frequent tea consumption can stain the teeth so they do not appear as white as most
individuals would prefer (Addy & Moran, 1995). Like tea, coffee can also stain the teeth,
and frequent consumption of sweetened coffee may increase the risk for dental caries
(Addy & Moran, 1995; Touger-Decker & van Loveren, 2003). The average pH of coffee
is about 5.1 to 5.2; because this value is lower than 5.5, coffee may contribute to acid
erosion of the dental enamel; however, its erosive potential is not as high as the acidic
drinks being examined in this analysis (USFDA, 2007). On a positive note, the tannins in
coffee may also help to reduce to cariogenic potential of other foods and drinks, by
reducing plaque formation (Touger-Decker & van Loveren, 2003).
Balance of Beverages in the Diet
Although the association between oral health and each specific type of beverage
has been established, the combination and balance of these beverages in the diet and the
effects on oral health has not been extensively examined. This is an area of importance
as individuals rarely, if ever, consume solely one type of drink, and the type of drink
consumed has significant impact on oral health. For instance, Edwards and colleagues
(2001) examined the buffering effect certain beverages had on salivary pH, as those with
an increased resistance to salivary buffering capacity, specifically fruit juices and fruit-
based carbonated beverages, may cause a prolonged drop in oral pH, a risk factor for
dental decay, especially when compared to more alkaline beverages like sparkling and

17
still mineral water. This has lead dental professional associations and other bodies to
recommend balancing soft drink consumption with milk and water intake, or replacing
sugary- and acidic-beverage consumption with healthier options such as water or milk
(CDA, 2012a; WHO, 2012).
The balance of drinks in the diet is especially of concern as there is a growing
notion that increased sugary- and acidic-beverage consumption replaces milk and water
in the diet, although this has only been supported by a few studies (Lee & Brearley
Messer, 2011; Jacobson, 2005). For instance, the annual consumption of soft drinks has
increased 500% over the last 50 years, and the average 13- to 18-year old now consumes
twice as much soda (regular and diet) as milk (Putnam & Allshouse, 1999; Jacobson,
2005). Soda pop consumption continues to rise; compared to data collected from 1994-
1996, soda pop contributed about 25% more of teens’ calories in 1999-2002 (Jacobson,
2005). Soft drink consumption has also been found to be associated with lower intake of
milk (Vartanian, Schwartz & Brownell, 2006). These contemporary changes in beverage
consumption are likely the result of a fast-paced lifestyle; for instance, regular and diet
soft drinks are readily available at fast-food and other restaurants, and drinking bottled
water does not always have the added protection of fluoridation (Lee & Brearley Messer,
2011). Thus, it is also important to examine how the balance of the type of beverages in
the diet affects oral health.
18
Existing Body of Evidence
To date, I am aware of five main studies that have examined the association
between the balance of drinks in one’s diet and oral health outcomes. Marshall and
colleagues (2003) examined the association between dental caries and the consumption of
dairy foods, sugared beverages, and micronutrients such as vitamins C and B12 in
members of the Iowa Fluoride Study. Nutritional data were collected at ages 1 through 5
using 3-day food and beverage diaries, and caries were identified through a dental
examination by a dentist at 4 to 7 years of age (Marshall et al., 2003). The study found
that contemporary changes in beverage consumption, especially increased sugar-
sweetened soda pop, powered beverage, and 100% fruit juice intake, has the potential to
increase the rate of caries in children (Marshall et al., 2003). Specifically, those children
with caries experience consumed on average 260g of sugared beverages per day, as
compared to 232g of sugared beverages in those without caries (Marshall et al., 2003).
The study also found that milk had a neutral association with caries, and that the risk for
dental caries is likely dependent on the sugar composition of the drink or its role in the
diet and the habits surrounding its use (Marshall et al., 2003). The number of tooth
surfaces with caries was positively associated with age and negatively associated with
fluoride exposure (Marshall et al., 2003). The results also suggested an interaction
between detrimental effects from sugary-beverage consumption and protective benefits of
fluoridated water as fluoride exposure was associated with reduced extent of caries, but
not caries prevalence; however, this was not specifically examined as a part of the study
design (Marshall et al., 2003). The authors did not report on whether there were
differences in caries or nutritional experience based on SES, although individuals

19
excluded from the analysis due to missing information were more likely to be of low SES
(Marshall et al., 2003).
Data obtained from the 24-hour dietary recall interviews in the National Health
and Nutrition Examination Survey (NHANES) III was also used to investigate the
relationship between fluid consumption patterns and dental caries in children aged 2-10
(Sohn, Burt, & Sowers, 2006). Using cluster analysis, four fluid consumption patterns
were identified: high carbonated soft drinks, high juice, high milk, and high water (Sohn
et al., 2006). When compared to high intakes of water, milk or juice, children who had a
high consumption of soft drinks (over 6oz per day in children aged 1-6, and over 12oz
per day in children aged 7-18) were almost two times more likely to experience dental
caries, and about 13% of children fell into this group (Sohn et al., 2006). Children in the
milk group were found to have the lowest caries experience of any of the groups (Sohn et
al., 2006).
A similar study looking at low-income African-American children found that
those children who increased their consumption soft drinks over the three year study
period had 1.75 times more new caries, as compared to those who were consistently low
consumers of soft drinks, or who consumed 100% fruit juice or milk (Lim et al., 2008).
Consumption patterns were analyzed using 4 groups clustered by their regular
consumption pattern of each beverage (Lim et al., 2008). Again, age was positively
associated with caries experience; however, the design of the study focused on low-
income children, and as a result, it is not possible to determine whether there are any
differences between SES levels (Lim et al., 2008).

20
The association between dental caries and beverage consumption patterns was
also investigated in another study using data from the Iowa Fluoride Study (Hamasha,
Warren, Levy, Broffitt & Kanellis, 2006). In this study, low and high SES children were
followed from 6 to 108 months of age, with dental exams conducted at 5 and 9 years of
age (Hamasha et al., 2006). Although no significant difference existed between the two
groups in terms of tooth-brushing frequency, use of dentifrice or fluoride concentration in
drinking water, low SES children consistently consumed more soda pop and powder-
based beverages than their high SES counterparts, and had significantly higher decayed,
missing or filled surfaces (dmfs) scores (Hamasha et al., 2006). This study concluded
that beverage consumption patterns seem to be a key difference in caries experience
between low and high SES children, and decreasing or eliminating soda pop and powder-
based beverage consumption may help to reduce the caries burden on low SES children
(Hamasha et al., 2006).
The balance of beverages in the diet has also been examined in the context of
dental erosion. A case-control study matched 309 children on the basis of age and gender
to dental erosion, caries-active or caries-free groups (O’Sullivan & Curzon, 2000).
Structured dietary histories were taken to determine the type and frequency of acidic
foods and drinks consumed, as well as the habits surrounding this consumption that
prolonged dental exposure to acid (O’Sullivan & Curzon, 2000). It was found that those
children with erosion drank acidic beverages more frequently than those children in the
caries-active and caries-free groups (O’Sullivan & Curzon, 2000). Fruit, vinegar, and
vitamin C supplement consumption was also highest in the erosion group (O’Sullivan &
Curzon, 2000). Children with erosion also drank milk and water significantly less often

21
than the children in the other groups (O’Sullivan & Curzon, 2000). Overall, the results
suggested that consuming acidic food and drinks more frequently, especially combined
with a swishing or holding habit, may contribute to the development of dental erosion in
some children (O’Sullivan & Curzon, 2000).
Research Gaps
Research to date has established that a diet high in regular soft drinks is associated
with greater caries and erosion experience in children than diets high in water, milk and
100% fruit juice. However, there are still significant gaps in the literature. Previous
studies have focused on children and dental caries or erosion, and the association between
beverage consumption and oral health outcomes has also not been examined in a
Canadian population. Finally, previous studies have not looked at the interaction effects
of the different types of beverages in the diet, which is important to consider in order to
determine whether regular consumption of one type of beverage, such as water, confers
protective benefits over other beverages.

22
RESEARCH RATIONALE
Rationale
The association between oral health and the consumption of certain beverages has
been well established: soft drinks and other sugar-sweetened beverages are generally
cariogenic due to their high sugar levels and low pH, while milk tends to confer a
protective benefit on oral health by calcium remineralization of the teeth (Scardina &
Messina, 2012). Water consumption is also protective to oral health by rinsing the mouth
of food debris and bacteria. (Scardina & Messina, 2012). Although the associations
between oral health and certain types of drinks have been established, the interaction
between the frequency of consumption of each of the beverages and the subsequent oral
health outcomes is an area that has not yet been studied in depth. This area is of interest
because few, if any, individuals consume only one type of beverage, and to date, this has
not been extensively examined in the literature.
23
Purpose and Research Questions
The current analysis examined the association between the balance of type and
frequency of beverages consumed and oral health outcomes.
The specific research questions addressed were:
1. What is the association between the frequency of milk and water consumption and
oral health?
2. What is the association between the frequency of drinking sugary/acidic drinks
and oral health?
3. What, if any, is the interaction between the frequency of consumption of
milk/water and sugary/acidic-drinks and oral health?
4. What sociodemographic factors are associated with oral health outcomes after
adjustment for beverage consumption?

24
METHODS
Canadian Health Measures Survey
The Canadian Health Measures Survey (CHMS) was first conducted in 2007 to
address significant data gaps and limitations in existing population health information.
The CHMS contains two major components: a computer-assisted household
questionnaire, and direct physical measures collected through a mobile examination
centre (MEC). The household questionnaires were used to collect information on
demographic, socioeconomic and environment/housing characteristics, as well as
nutrition, physical activity, substance use, medical history, current health status, sexual
behaviour, and lifestyle. The clinic questionnaires collected a wide variety of measures,
including height and weight, blood pressure, blood measures including lipid profile and
Vitamin D status, and urine measures such as creatinine and iodine, and also included an
oral health examination. Each variable collected during the household questionnaire
corresponded to and was verified by a clinic measure, apart from sociodemographic
information. Clinic measures were taken at 15 collection sites spread throughout Canada
(1 in Atlantic Canada, 4 in Quebec, 6 in Ontario, 2 in the Prairies and 2 in British
Columbia) for ease of access for study participants. Scheduling was organized so that
collection periods at each site differed over the year and season collected, and the MEC
stayed in each site for approximately 6 to 8 weeks at a time. Each clinic visit took
approximately 2 hours, and each section started by determining eligibility criteria in order
to reduce the chance of any adverse effects.

25
The first cycle of data collection took place from March 1, 2007 to March 31,
2009. The second cycle of data collection began in September 2009 and was completed
in 2011. Planning for future cycles is currently underway. For this investigation, we
used the first wave of CHMS data as the second wave did not include measures
addressing oral health. (Statistics Canada, 2010)
Study Participants
The CHMS targets Canadians in all 10 provinces and 3 territories between 6 and
79 years of age, who live in a privately occupied residence; the specific age groups used
for CHMS sampling are 6-11, 12-19, 20-39, 40-59, and 60-79 years. Overall, about 97%
of Canadians are represented by the survey; however, residents of institutions, full-time
members of the Canadian Forces, persons living on Indian Reserves or Crown Land, and
residents of some remote communities are excluded from CHMS. CHMS used a cross-
sectional survey design, with 10 age-gender groups as described above, and aimed to
have at least 500 individuals per group. The households sampled were identified using
2006 Census data, and were stratified according to location and age of residents. In total,
5604 individuals took part in both the household and MEC components of CHMS.
From each household, one participant (or two participants if one was aged 11 or
under) was selected to take part in CHMS. To facilitate travel to the MEC, the homes of
participants were located within 50km of the clinic location, or 100km for rural areas.
Approximately 350 individuals were sampled for each clinic location, from an initial
selection of 9349 dwellings. Dwellings were contacted by telephone in a random order

26
until the required number and distribution of respondents had agreed to participate. From
the criteria specified above, participants were selected randomly, and a vector with
variable selection probabilities by age group was used.
For the purposes of this study (rationale discussed below), a restricted age range
of 12 to 30 inclusive was used for the analysis, for a total of 1550 respondents. Due to
the nature in which the household and clinic questionnaires were administered, there was
minimal missing data; however, 16 participants were removed from the analysis due to
missing responses on one or more of the variables used. All participants had data for all
of the sociodemographic variables, although 50 respondents chose not to disclose their
education and 164 declined to provide their income. These individuals were kept in the
analysis, with their response recoded as “not stated”. Seven individuals were missing
information used to determine dental decay, periodontal health and OHX scores, and thus
were eliminated from the analysis. Alcohol consumption data were originally missing for
553 participants; however, further investigation revealed that 542 of these did not
consume alcohol in the past 12 months and thus were excluded from the weekly alcohol
consumption question – these individuals were recoded as consuming 0 drinks per week.
Of the 11 respondents remaining, 8 were excluded from the question as they were 11
years of age at the household interview (but 12 years of age at the clinic visit and thus
included in the analysis), and thus it was assumed they did not consume alcohol and were
recoded as having 0 drinks per week. The remaining 3 participants were excluded from
the analysis. A similar situation arose for smoking habits: 12 participants had missing
information, and 8 were excluded from the question as they were 11 years old at the
household interview, and thus were presumed to have never smoked. The final four

27
individuals were removed from the analysis. Finally, one respondent was missing
information on fruit-flavoured drink consumption, and one did not respond to the
frequency of visiting a dental professional, and thus they were both eliminated from the
analysis, bringing the total number of study participants to 1534, with no missing data on
any measure.
28
Measures
A comprehensive list of the specific questions and derived variables taken from
CHMS can be found in Appendices A and B.
Sociodemographic Variables
The sociodemographic variables used in the analysis were: age (AWC_Q04), sex
(SEX_Q01), income and education. It was important to include age in the analysis, as the
most prevalent chronic oral conditions differ by age. For instance, dental caries are
common in young children, whereas seniors are much more likely to be edentulous
(National Institute of Dental and Craniofacial Research [NIDCR], 2000). For the
purposes of this investigation, only respondents from 12 to 30 years of age were included
and age was split into 4 groups: age 12-15, 16-19, 20-24 and 25-30. The purpose of this
age restriction was to simplify the analysis as oral health conditions vary widely with age,
and preliminary data analysis identified several “breaks” in oral health trends based on
age. For instance, oral health appears to become significantly poorer between ages 30
and 40, and the outcome of dental fluorosis was only measured in the 6-11 age group.
Additionally, using data from participants ages 12 to 30 ameliorated complications
related to deciduous, permanent or mixed dentition, as well as teeth counts related to
edentulism due to old age.
Education was measured using the highest level of education achieved by a
member of the household: Highest level of education – household, 4 levels (EDUDH04):
Less than secondary school graduation, secondary school graduation but no post-
29
secondary education, some post-secondary education, post-secondary degree/diploma,
and not stated. Due to low prevalence of respondents in the lowest two education
groups, less than secondary graduation and secondary school graduation but no post-
secondary education were grouped into one category: no post-secondary education.
Income was determined using the total household income – 5 categories
(INCDDIA5): lowest income, lower middle income, middle income, upper middle
income, highest income grouping, and not stated. Again, due to low prevalence of
respondents in the lowest two income groups, lowest income and lower middle income
were grouped into one category: lowest incomes. The education and income variables
were analyzed separately, as well as by creating an interaction SES variable by
multiplying the values for income and education, with higher scores indicating higher
SES. SES was included in the analysis as it can greatly affect an individual’s oral health
outcomes; specifically, those of low SES tend to be at greater risk for most oral health
conditions, due to their diet and inability to access dental care on a regular basis (NIDCR,
2000).
Oral Health Variables
The current study examined both self-reported and clinical oral health outcomes.
These outcomes included dental decay, periodontal health and self-reported oral health,
as well as the oral health index. Dental decay, which includes caries and erosion, was
assessed by examining the condition of each tooth and calculating the total number of
teeth exhibiting decay. Dental decay was determined by the addition of four scores

30
together to determine the total number of sound and never decayed teeth in the oral
cavity: OHEDAC01 (Number of permanent crowns that are sound, never decayed or
restored), OHEDAC02 (Number of permanent crowns that are sound – crown sealed,
never decayed or otherwise restored), OHEDDT01 (Number of deciduous teeth recorded
as sound, never decayed or restored), and OHEDDT02 (Number of deciduous teeth that
are sound – crown sealed, never decayed or otherwise restored) to get the total number of
teeth that have never experienced decay, from a minimum of 0 to a maximum of 28
(wisdom teeth were not included in the analysis as many individuals are congenitally or
surgically missing these teeth, and they are not viewed as essential for oral function)
(Meyer-Lueckel & Paris, 2013).
The gingivitis score was used in order to determine the extent of periodontal
disease. Each of the six gingivitis scores have 5 response options: 0 = no inflammation,
1 = mild inflammation, 2 = moderate inflammation, 3 = severe inflammation, 4 = tooth
missing. These six scores were added together and recoded into one periodontal health,
with a range from 0 to 24, and the values reverse coded so that higher scores indicated
better oral health.
Perceived oral health was assessed using self-rated oral health; specifically with
the question: In general, would you say the health of your mouth is: Excellent, very
good, good, fair, poor (OHM_Q11). Each category was given a score of 1-5 (i.e. the
excellent category was scored 5, very good was 4, etc.) with higher scores indicating
better oral health.

31
Although the impact beverages and other variables have on oral health outcomes
were examined separately for each outcome, an oral health index was also used in order
to investigate the overall impact on oral health. The oral health index is essentially an
indicator of the proportion of healthy teeth in an individual’s mouth, with higher scores
indicating better oral health. The index used in this study was based on the Oral Health
Index (OHX) developed by Burke and Wilson (1995). Only sections of the OHX to
which there is related data in CHMS were included: specifically, caries, periodontal
disease, mucosa, and patient assessment. The wear, occlusion and denture assessments
were not included as there was not direct correspondence to sections in the CHMS.
In order to calculate the oral health index, the following steps were taken:
1) Caries/standing teeth was determined from the variable derived for dental decay
(sum of OHEDAC01, OHEDAC02, OHEDDT01 and OHEDDT02) out of a
possible 28.
2) For periodontal disease, the measures OHEDGS12-OHEDGS44 were used and
recorded into 2 scores – those with a score of 0 on this measure were recorded as
a 1 (sound periodontal health), and those with a 1 or higher were given a zero.
This measure was given as a score out of a possible six (one point for each tooth
measured) with higher scores indicating better periodontal health.
3) To determine the presence of subgingival calculus (an indicator associated with
periodontal disease), OHEDCS01-OHEDCS06 were recoded into 2 scores - those
with a score of 0 on this measure were recorded as a 1 (no calculus), and those
with a 1 or higher were given a zero. This measure was given as a score out of a

32
possible six (one point for each tooth measured) with higher scores indicating
better periodontal health.
4) To determine the health of the participants’ mucosa, OHE_N14 was used. A score
of 1 on this measure was awarded 5 points, and every other score was given a 0
(out of a possible 5).
5) Patient Assessment was captured using three questions: OHM_Q23, OHM_Q22,
and OHM_Q12.
a. The first part of the OHX patient assessment was determined by the
response to the question “is your mouth free from pain?”. This
approximates to the CHMS measure “In the past 12 months, how often
have you had any other persistent or ongoing pain anywhere in your
mouth?” (OHM_Q23). The responses rarely and never were coded as 5,
with all other responses recoded as 0 (out of a possible 5).
b. The second question in the OHX patient assessment is “can you
comfortably chew an unrestricted diet?”. The CHMS question “(in the
past 12 months) how often have you avoided eating particular foods
because of problems with your mouth?” was used for this measure; rarely
and never were scored as 5, and all other responses as 0 (out of a possible
5).
c. The final component of the OHX patient assessment is “are you happy
with the appearance of your teeth?”. OHM_Q12 (“how satisfied are you
with the appearance of your teeth and/or dentures?”) was used, with very

33
satisfied and satisfied recoded as 5, and all other responses as 0 (out of a
possible 5).
In this way, a patient assessment score out of fifteen was determined.
The scores of these four components were added together to give a possible score out of
60. In summary, the scoring of the OHX was as follows:
1) Dental Decay (/28) +
2) Periodontal Disease (/6) +
3) Subgingival Calculus (/6) +
4) Mucosal Health (/5) +
5) Patient Assessment
a. Pain (/5) +
b. Restricting diet (/5) +
c. Satisfaction with Appearance (/5)
This approach was consistent with the published measure, as were the relative weightings
given to each component; the modification to the index was simply whether or not certain
components were included based on their applicability and inclusion in the CHMS.
Beverage Variables
The beverages of interest in this analysis were: water (Drinks water – times per
year – WSDD21Y), milk (Drinks milk – times per year – MDCD11Y), regular soft drinks
(Drinks regular soft drinks – times per year – WSDD11Y), diet soft drinks (Drinks diet

34
soft drinks – times per year – WSDD12Y), sport drinks (Drinks sport drinks – times per
year – WSDD13Y), fruit juices (Drinks fruit juices – times per year – WSDD14Y), fruit
flavoured drinks (Drinks fruit flavoured drinks – times per year – WSDD15Y), vegetable
juices (Drinks vegetable juices – times per year – WSDD16Y), and alcohol (Alcohol –
weekly consumption (ALCDWKY)). All of these variables, except for alcohol
consumption, were then recoded into times consuming the beverage per week by dividing
by 52. Each of these beverages was examined separately in order to better understand
their impact on oral health.
Beverage Consumption Indices (Sugary and Acidic)
In addition, some of the variables were grouped into sugary beverages and acidic
beverages in order to determine how these broad categorizations of beverages impact oral
health outcomes. The drinks that were classified as sugary beverages were those that
contain sugar, as it seems to be the frequency sugar is consumed that affects oral health,
as opposed to the amount of sugar (Ismail et al., 1984). These drinks included: regular
soft drinks, fruit juices, fruit flavoured drinks, sport drinks, and alcohol [SUGARY
BEVERAGES: Sum of: Drinks regular soft drinks – times per year (WSDD11Y), Drinks
sport drinks – times per year (WSDD13Y), Drinks fruit juices – times per year
(WSDD14Y), Drinks fruit flavoured drinks – times per year (WSDD15Y); total count
then divided by 52 to determine weekly consumption; and Alcohol consumption – times
per week (ALCDWKY)]. Although milk also contains sugar, the primary sugar is
lactose, which has been found to be much less cariogenic than other sugars, as it produces
35
a less acidic salivary environment, and thus was not classified as a sugary beverage
(Scardina & Messina, 2012).
The drinks included as acidic beverages are those with a pH of less than 5.5, as
those drinks that are more acidic than this critical pH have been suggested to lower the
pH of the mouth to a point that can negatively affect the tooth structure (Mandel, 2005).
Specifically, acidic beverages include regular and diet soft drinks, vegetable juices, fruit
juices, fruit flavoured drinks, sport drinks, and alcohol [ACIDIC BEVERAGES: Sum of:
Drinks regular soft drinks – times per year (WSDD11Y), Drinks diet soft drinks – times
per year (WSDD12Y), Drinks sport drinks – times per year (WSDD13Y), Drinks fruit
juices – times per year (WSDD14Y), Drinks fruit flavoured drinks – times per year
(WSDD15Y) ; total count then divided by 52 to determine weekly consumption; and
Alcohol consumption – times per week (ALCDWKY)].
Other Variables
The analysis also examined dietary factors, specifically fibre consumption [Eats
fibre, times per year: Sum of: Eats hot or cold cereal – times per year (GFVD11Y), Eats
brown bread, including bagels, rolls, pita bread, or tortillas – times per year (GFVD12Y),
Eats white bread, including bagels, rolls, pita bread or tortillas – times per year
(GFVD13Y), Eats any kind of pasta – times per year (GFVD14Y), Eats any kind of rice –
times per year (GFVD15Y), Eats fruit – times per year (GFVD17Y), Eats lettuce or green
leafy salad – times per year (GFVD19Y), Eats spinach, mustard greens, or collards –
times per year (GFVD20Y), Eats french fries, home fries or hash brown potatoes – times
36
per year (GFVD21Y), Eats other potatoes – times per year (GFVD22Y) and Eats all other
types of vegetables – times per year (GFVD23Y); total count then divided by 52 to
determine weekly consumption] and consumption of (non-milk) dairy products [Eats
diary, times per year: Sum of: Eats cottage cheese – times per year (MDCD13Y), Eats
yogurt – times per year (MDCD14Y), Eats ice cream or frozen yogurt – times per year
(MDCD15Y); total count then divided by 52 to determine weekly consumption].
Smoking habits [Type of Smoker (SMKDSTY) – Current daily smoker,
occasional smoker (former daily smoker), occasional smoker (never a daily smoker or
has smoked less than 100 cigarettes in lifetime), non-smoker (former daily smoker), non-
smoker (former occasional smoker, at least 100 cigarettes in lifetime), never smoked (at
least 100 cigarettes), missing information, population exclusions; to simplify analysis,
the smoking variable was recoded into three different responses – current smoker
(consisting of current daily smoker, occasional smoker (former daily smoker), and
occasional smoker (never a daily smoker or has smoked less than 100 cigarettes in
lifetime)), former smoker (consisting of non-smoker (former daily smoker), and non-
smoker (former occasional smoker, at least 100 cigarettes in lifetime)), and never smoked
(consisting of never smoked (at least 100 cigarettes))] were also included in the analyses.
Oral health behaviours, such as flossing [Number of times teeth flossed per year
(OHMD32Y); total count then divided by 52 to determine weekly habit], brushing
[Number of times teeth brushed per year (OHMD31Y); total count then divided by 52 to
determine weekly habit], and visiting a dental professional [Do you usually see a dental
professional? More than once a year for check-ups or treatment, about once a year for
check-ups for treatment, less than once a year for check-ups or treatment, only for

37
emergency care, never. (OHM_Q33); analyzed as a categorical variable], also have an
impact on oral health and were examined here.
38
Hypotheses
The study tested the following hypotheses:
1) Individuals who consume water more often will be less likely to have negative
oral health outcomes.
2) Individuals who consume milk more often will be less likely to have negative
oral health outcomes.
3) Individuals who consume regular soft drinks more often will be more likely to
have negative oral health outcomes, especially dental decay.
4) Individuals who consume diet soft drinks more often will be more likely to have
negative oral health outcomes, especially dental decay.
5) Individuals who consume sports drinks more often will be more likely to have
negative oral health outcomes, especially dental decay.
6) Individuals who consume fruit juices more often will be more likely to have
negative oral health outcomes, especially dental decay.
7) Individuals who consume fruit flavoured drinks more often will be more likely to
have negative oral health outcomes, especially dental decay.
8) Individuals who consume vegetable juice more often will be more likely to have
negative oral health outcomes, especially dental decay.
9) Individuals who consume alcohol more often will be more likely to experiences
negative oral health outcomes, especially dental decay.

39
10) Individuals who consume sugary beverages more often will be more likely to
experiences negative oral health outcomes, especially dental decay.
11) Individuals who consume acidic beverages more often will be more likely to
experiences negative oral health outcomes, especially dental decay.

40
ANALYSIS
Data analysis was completed using Stata Version 12 at the South-Western Ontario
Research Data Centre (SWORDC) in Waterloo, Ontario, Canada. Statistical analysis
included the following:
1. Analyses were conducted on weighted data. The SVY function was used to obtain
more accurate estimations of results. In accordance with the design of the CHMS, the
syntax: svyset SITE [pweight=WGT_FULL], strata(prov) was used to cluster data by
collection site and stratify by province, and the full sample weights provided by
Statistics Canada were applied, using the pweight function to rescale the weights to
the number of survey participants. Through this design, p-values were based on 11
degrees of freedom.
2. Descriptive analyses were conducted to examine proportions, means and standard
deviations for all relevant measures using the SVY function as described above. In
order to meet Statistics Canada confidentiality and vetting requirements for releasing
proportions and frequencies (i.e., a minimum of 30 cases per cell), some response
options were grouped together for reporting. For sociodemographic variables and
other covariates, this was done as outlined in the Measures section, and these
groupings were kept consistent throughout the analysis. For beverage variables, these
groupings were used solely for the purpose of reporting proportions and frequencies,
and the raw count data was used when fitting models.
3. Models were run for four outcome measures: 1) dental decay, 2) periodontal health, 3)
self-reported oral health and 4) the oral health index. The outcomes of dental decay,
41
periodontal health and oral health index were counts, whereas self-reported oral health
was a categorical measure. For each outcome measure, three models were run; the
first in which each beverage type was included as a separate variable, the second in
which sugary beverages were grouped, and acidic beverages being grouped together in
the third outcome. The models were fitted using the SVY function to examine
differences between frequency of consumption of milk, water, regular soft drinks, diet
soft drinks, sports drinks, fruit juices, fruit-flavoured drinks, vegetable juices, and
alcohol, as well as between milk and water and sugary or acidic beverages. Models
included socio-demographic variables (age, gender, education, and household
income), oral health behaviours such as brushing, flossing, and visiting a dental
professional, smoking, and diet variables, specifically (non-milk) dairy and fibre
consumption. Two-way interactions were examined between education and income in
exploratory analysis; however, only one of the level contrasts was significant for one
of the outcome measures, so it was not included in the final models in order to better
examine the individual effects of income and education. Two-way interactions were
examined between types of beverages, specifically water and sugary beverages, water
and acidic beverages, milk and sugary beverages, and milk and acidic beverages, in
order to examine whether water and milk confer a protective benefit to oral health
over other types of beverages. It was important to include age and gender to the list of
covariates, as they play a key role in the sampling design. Further contrasts were also
run to examine significant differences between different beverage types in order to
better interpret results.
42
For the outcomes measured using count data (dental decay, periodontal health and
the oral health index), Poisson regression was used to obtain model estimates. Poisson
regression is generally used for predictive modelling of count data for rare events and
“expresses the log outcome rate as a linear function of a set of predictors” (Oxford
Journals (OJ), 2013, p. 136). In order to verify the assumption that the data fit a
Poisson distribution and thus Poisson regression was the most appropriate function to
use, negative binomial regression models were also run using the same lists of
variables. Negative binomial regression is also used to model count data but accounts
for over-dispersion, which is often observed in count variables, and a negative
binomial distribution is more commonly seen in social data (Piza, 2012). The Poisson
regression and negative binomial regression models were then compared for
consistency between the two models in order to ensure that assumptions for Poisson
regression had been met. For the dental decay and periodontal health outcomes, the
Poisson and negative binomial regression models appeared to be identical; therefore,
only the results from the Poisson regression models are displayed here. The Poisson
models were chosen as Poisson regression is a more commonly used and understood
model for count data. Although not identical, the results obtained from the Poisson
and negative binominal regression models for the oral health index were highly
consistent, with the same variables being significant, variables having the same
direction of effect, and the magnitudes of the incidence-rate ratio (IRR) being within
0.01 of each other. Thus, Poisson regression models were also chosen to be displayed
for the OHX for purposes of consistency. The results of the Poisson regression
models were given as the incidence-rate ratio (IRR), in addition to p-values and 95%

43
confidence intervals. The IRR is also often referred to as simply the “rate ratio”, and is
comparable to an odds ratio, but for Poisson regression (OJ, 2013). The IRR is the
ratio of the expected incidence rate at x+1 and the expected incidence rate at x (OJ,
2013).
Self-perceived oral health was a categorical outcome, and thus ordinal regression
was used to obtain model estimates. Ordinal regression, more specifically the ordered
logit models, is used for ordered data which meets the proportional odds assumption
that the relationship between any of the two outcome groups is essentially the same
(Heeringa, West & Berglund, 2010). Based on this assumption, the coefficients are the
same in all of the models (for each level), meaning the only difference between the
models is in the intercept terms, and the estimates from the separate binary models can
be pooled together to give one set of regression coefficients (Heeringa et al., 2010).
As the data analysis centre did not have the resources necessary to test the assumption
that ordinal regression would be suitable for this model, multiple linear regression
models were also run using the same list of variables. Linear regression is used to
model the relationship between variables that are assumed to depend linearly on their
parameters (Heeringa et al., 2010). Linear regression is based upon a conditional
probability distribution of y given the value of x, as opposed to a joint probability
distribution of both x and y as is the case in multivariate linear regression (Heeringa et
al., 2010). Ordinal scales can often generate data with skewed distributions, whereas
linear regression is less prone to this limitation, so accordance between the two
methods reduces the likelihood of inaccurate results (Norris et al., 2006). Upon
comparison, the ordinal and linear regression models were found to be very similar, in

44
terms of which variables were significant and the direction of their effects. There was
variation in the magnitude of the effects, and the acidic beverage consumption models
differed with sex being significant in the ordinal model but not the linear regression
model; otherwise, any differences between models were unlikely to affect results and
conclusions. Due to the high degree of similarity, only the ordinal regression models
are displayed here, as theoretically this was the correct model to fit for the categorical
data.
4. In order to better illustrate the effects of the beverage variables on the outcomes,
participants were divided into four or five groups based on their consumption pattern
of a specific beverage. The mean score of each outcome was then calculated and
graphed in order to observe any trends in the association between a specific beverage
and outcome. Due to the large number of beverage variables with very few emerging
as significant predictors, these analyses were only run for water, milk, the Sugary
Beverage Consumption Index, the Acidic Beverage Consumption Index and any other
beverage variables found to be significant in the models.
5. In order to determine the effect of the interaction between different beverage types, the
lincom command was used to determine the linear combination of estimators. This
analysis was completed for the beverage interactions as described above (water and
sugary beverages, water and acidic beverages, milk and sugary beverages, and milk
and acidic beverages in all relevant models). The results were then compared
graphically as to the outcome when the consumption of one beverage was held
constant and the other increased, and vice versa.

45
6. Bootstrapping analysis using the SVY function was completed on final models,
descriptives and other analyses in order to obtain more precise estimates and
confidence intervals, as this analysis took into account the complex sampling frame
and clustering of households.
Regression analyses allowed for examination of socio-demographic predictors of
beverage consumption and oral health outcomes in the Canadian population within the
previously described analyses. All analyses were conducted using the survey weights, as
described in the Data User Guide for Cycle 1 (Statistics Canada, 2011). Stata Version
12.1 SVY module was used for all analyses. These estimation procedures used Taylor
linearization to compute variance estimates that account for the complex survey design
used to collect the data; see Binder (1983). However, the CHMS Data User Guide
(section 11.3) indicated that Taylor linearization does not fully account for the complex
survey design used to collect the CHMS sample, and recommended using the
Bootstrapped weights created by Statistics Canada. Although exploratory analyses were
done using the SVY function and took into account clustering by collection site,
stratifying by province and the survey weights (WGT_FULL) created by Statistics
Canada, all final analyses used the bootstrapped weights. This was a reasonable method
of analysis as Taylor linearization gave close estimations of our final results for
exploratory analyses without the significant time investment the bootstrapping function
took to perform. All final and reported results were acquired using bootstrapping to
obtain the most accurate results and as per Statistics Canada requirements

46
Models
Four models were run with each of the four oral health indicators as an outcome:
dental decay, periodontal health, self-rated oral health, and the oral health index. For each
of the models, the following covariates were used: age, sex, education, income, visits to
dental professional, brushing, flossing, smoking habits, (non-milk) dairy consumption
and fibre consumption. An SES variable (education x income interaction) was also used
in exploratory analysis, but as only one of the nine possible interaction levels was
significant in only one of the models, this variable was excluded from the final models so
as not to obscure the effects of the income and education variables singularly.
In order to examine differences between individual types of beverages versus
beverage categories (i.e., sugary beverage index and acidic beverage index), three sub-
models were fitted for each of the four outcomes: Model A included individual beverage
types and covariates included as predictor variables; Model B included milk, water, diet
soft drinks, vegetable juices, covariates, and the sugary beverage index; and Model C
included milk, water, covariates and the acidic beverage index. In total, 12 models were
fitted.
Two-way interaction terms were examined between milk or water, and the sugary
or acidic beverage indices in Models B and C, respectively.
The variables and outcomes used in each model were as described in Table 1
below.

47
Table 1. Models
Model Outcome Predictors Covariates 1a – Main Effects
Dental Decay
Water, milk, regular soft drinks, diet soft drinks, sports drinks, fruit juices, fruit-flavoured drinks, vegetable juice, alcohol
age, sex, education, income, visits to dental professional, brushing, flossing, smoking habits, dairy consumption, fibre consumption
1b – Sugary Beverage Consumption
Dental Decay
Water, milk, sugary beverage index, diet soft drinks, vegetable juices, water x sugary beverage index (interaction variable), milk x sugary beverage index (interaction variable)
1c – Acidic Beverage Consumption
Dental Decay
Water, milk, acidic beverage index, water x acidic beverage index (interaction variable), milk x acidic beverage index (interaction variable)
2a – Main Effects
Periodontal Health
Water, milk, regular soft drinks, diet soft drinks, sports drinks, fruit juices, fruit-flavoured drinks, vegetable juice, alcohol
2b – Sugary Beverage Consumption
Periodontal Health
Water, milk, sugary beverage index, diet soft drinks, vegetable juices, water x sugary beverage index (interaction variable), milk x sugary beverage index (interaction variable)
2c – Acidic Beverage Consumption
Periodontal Health
Water, milk, acidic beverage index, water x acidic beverage index (interaction variable), milk x acidic beverage index (interaction variable)
3a – Main Effects
Self-Rated Oral Health
Water, milk, regular soft drinks, diet soft drinks, sports drinks, fruit juices, fruit-flavoured drinks, vegetable juice, alcohol
3b – Sugary Beverage Consumption
Self-Rated Oral Health
Water, milk, sugary beverage index, diet soft drinks, vegetable juices, water x sugary beverage index (interaction variable), milk x sugary beverage index (interaction variable)
3c – Acidic Beverage Consumption
Self-Rated Oral Health
Water, milk, acidic beverage index, water x acidic beverage index (interaction variable), milk x acidic beverage index (interaction variable)
4a – Main Effects
Oral Health Index
Water, milk, regular soft drinks, diet soft drinks, sports drinks, fruit juices, fruit-flavoured drinks, vegetable juice, alcohol
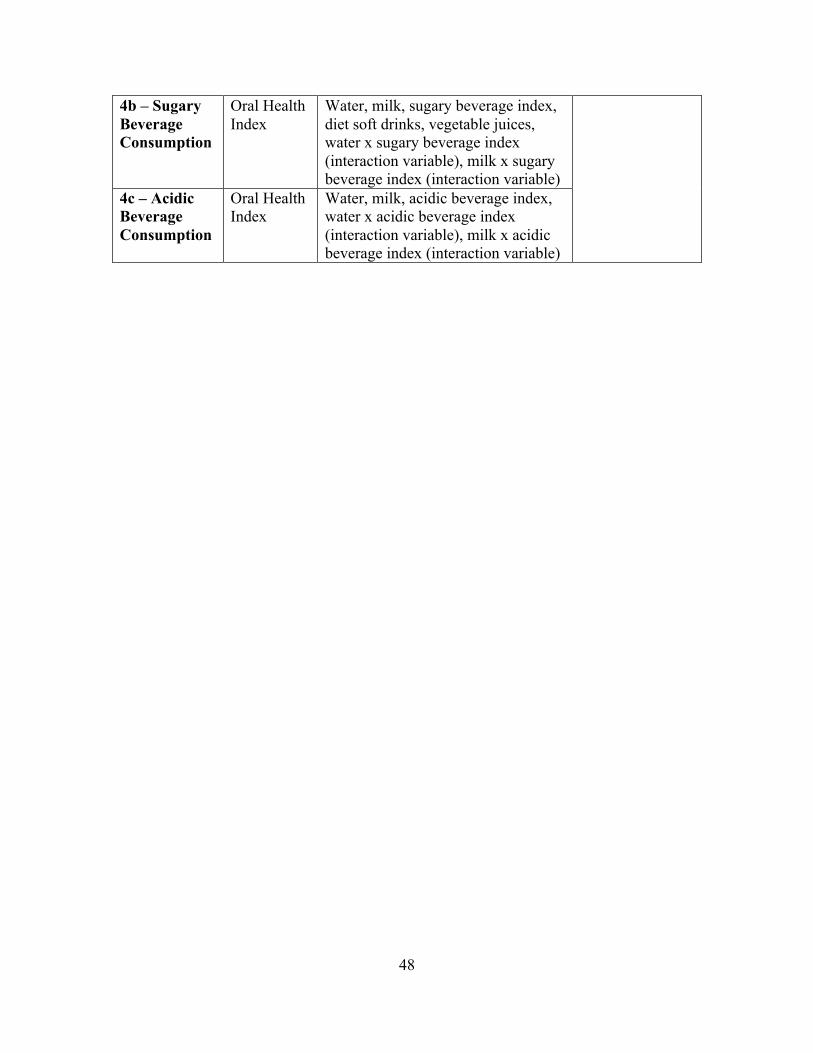
48
4b – Sugary Beverage Consumption
Oral Health Index
Water, milk, sugary beverage index, diet soft drinks, vegetable juices, water x sugary beverage index (interaction variable), milk x sugary beverage index (interaction variable)
4c – Acidic Beverage Consumption
Oral Health Index
Water, milk, acidic beverage index, water x acidic beverage index (interaction variable), milk x acidic beverage index (interaction variable)

49
RESULTS
Descriptive Analyses
Descriptive analyses were carried out on all predictor and outcome variables
included in the analysis. Means, standard deviations (sd) and proportions, both raw
values and percentages, are displayed below for each of the variables. The data have
been stratified by province, clustered by collection site and CHMS survey weights have
been applied. Weighted and bootstrapped data have been used, and some responses have
been grouped in accordance with Statistics Canada confidentiality and vetting rules. Due
to rounding, the reported proportions may not sum to the expected amounts (1534 and
100%).
Sociodemographic Variables
Descriptive analyses of the sociodemographic variables are displayed in Table 2, and
were roughly equal to those characteristics in the Canadian population. Descriptive
statistics for the other covariates included in the analysis are also displayed in Table 2.
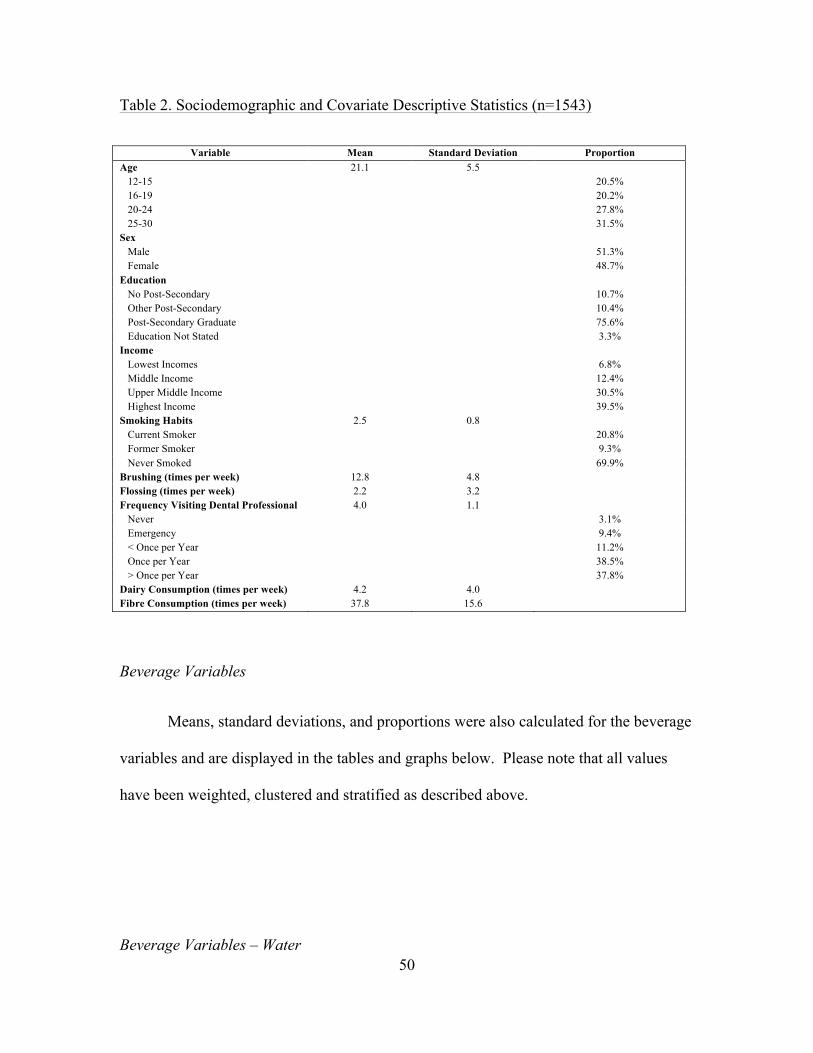
50
Table 2. Sociodemographic and Covariate Descriptive Statistics (n=1543)
Variable Mean Standard Deviation Proportion Age 21.1 5.5 12-15 20.5% 16-19 20.2% 20-24 27.8% 25-30 31.5% Sex Male 51.3% Female 48.7% Education No Post-Secondary 10.7% Other Post-Secondary 10.4% Post-Secondary Graduate 75.6% Education Not Stated 3.3% Income Lowest Incomes 6.8% Middle Income 12.4% Upper Middle Income 30.5% Highest Income 39.5% Smoking Habits 2.5 0.8 Current Smoker 20.8% Former Smoker 9.3% Never Smoked 69.9% Brushing (times per week) 12.8 4.8 Flossing (times per week) 2.2 3.2 Frequency Visiting Dental Professional 4.0 1.1 Never 3.1% Emergency 9.4% < Once per Year 11.2% Once per Year 38.5% > Once per Year 37.8% Dairy Consumption (times per week) 4.2 4.0 Fibre Consumption (times per week) 37.8 15.6
Beverage Variables
Means, standard deviations, and proportions were also calculated for the beverage
variables and are displayed in the tables and graphs below. Please note that all values
have been weighted, clustered and stratified as described above.
Beverage Variables – Water
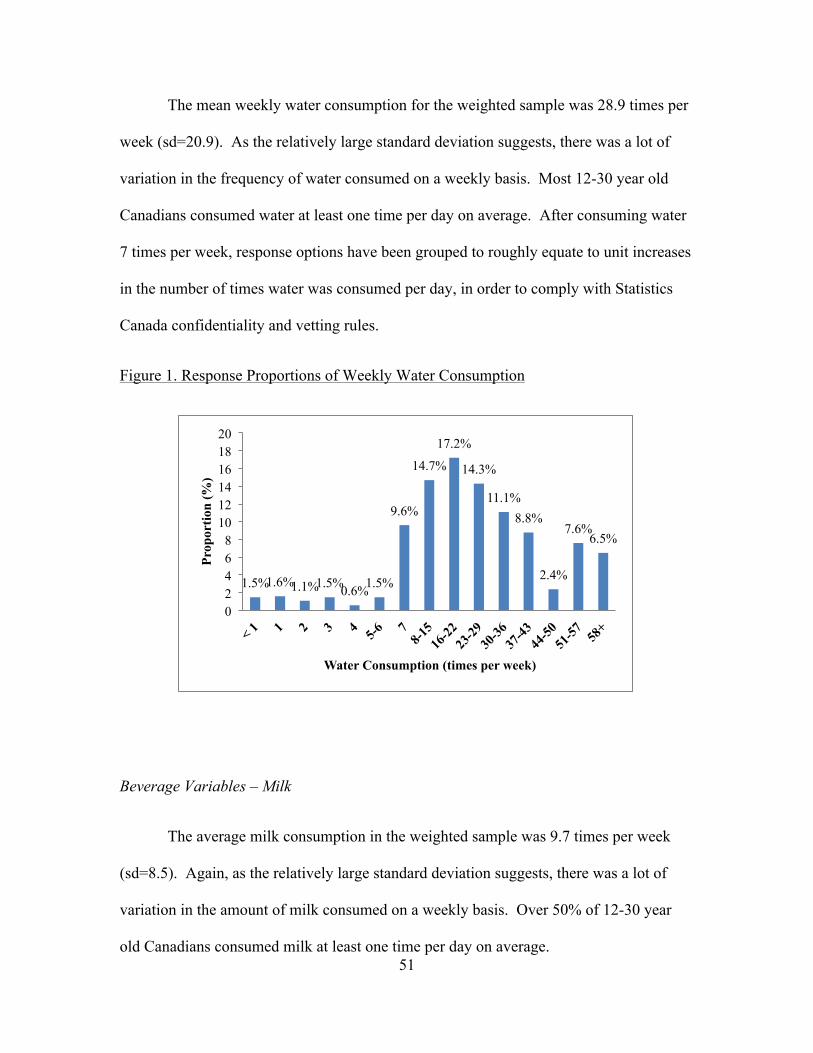
51
The mean weekly water consumption for the weighted sample was 28.9 times per
week (sd=20.9). As the relatively large standard deviation suggests, there was a lot of
variation in the frequency of water consumed on a weekly basis. Most 12-30 year old
Canadians consumed water at least one time per day on average. After consuming water
7 times per week, response options have been grouped to roughly equate to unit increases
in the number of times water was consumed per day, in order to comply with Statistics
Canada confidentiality and vetting rules.
Figure 1. Response Proportions of Weekly Water Consumption
Beverage Variables – Milk
The average milk consumption in the weighted sample was 9.7 times per week
(sd=8.5). Again, as the relatively large standard deviation suggests, there was a lot of
variation in the amount of milk consumed on a weekly basis. Over 50% of 12-30 year
old Canadians consumed milk at least one time per day on average.
1.5% 1.6% 1.1% 1.5% 0.6% 1.5%
9.6%
14.7%
17.2%
14.3%
11.1% 8.8%
2.4%
7.6% 6.5%
0 2 4 6 8
10 12 14 16 18 20
Prop
ortio
n (%
)
Water Consumption (times per week)
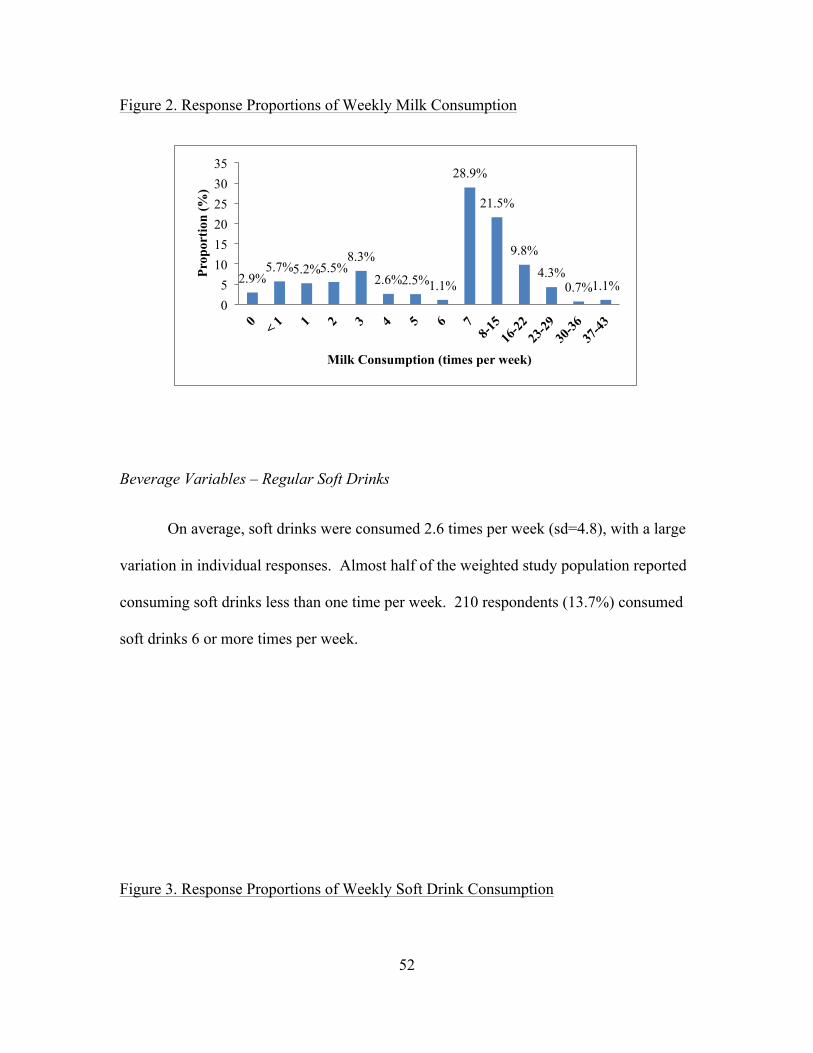
52
Figure 2. Response Proportions of Weekly Milk Consumption
Beverage Variables – Regular Soft Drinks
On average, soft drinks were consumed 2.6 times per week (sd=4.8), with a large
variation in individual responses. Almost half of the weighted study population reported
consuming soft drinks less than one time per week. 210 respondents (13.7%) consumed
soft drinks 6 or more times per week.
Figure 3. Response Proportions of Weekly Soft Drink Consumption
2.9% 5.7% 5.2% 5.5%
8.3%
2.6% 2.5% 1.1%
28.9%
21.5%
9.8%
4.3% 0.7% 1.1%
0 5
10 15 20 25 30 35
Prop
ortio
n (%
)
Milk Consumption (times per week)

53
Beverage Variables – Diet Soft Drinks
The average number of times diet soft drinks were consumed per week by the
weighted sample was 0.8 (sd=2.7). 70.4% of the weighted sample did not consume diet
soft drinks on a regular basis, and another 11.1% consumed diet soft drinks less than once
per week.
Figure 4. Response Proportions of Weekly Diet Soft Drink Consumption
Beverage Variables – Sports Drinks
20.9% 24.1%
15.4%
9.9% 9.6%
4.0% 2.4%
13.7%
0
5
10
15
20
25
30
0 < 1 1 2 3 4 5 6+
Prop
ortio
n (%
)
Regular Soft Drink Consumption (times per week)
70.4%
11.1% 6.0% 3.8% 3.0% 1.6% 4.0%
0 10 20 30 40 50 60 70 80
0 < 1 1 2 3 4-6 7 +
Prop
ortio
n (%
)
Diet Soft Drink Consumption (times per week)

54
Sports drinks were consumed a mean number of 0.8 times per week (sd=2.1) by
the sample population. Most did not regularly consumed sports drinks (45.3%), or
consumed them less than one time per week (31.2%).
Figure 5. Response Proportions of Weekly Sports Drink Consumption
Beverage Variables – Fruit Juices
On average, the weighted study population consumed fruit juices 5.5 times per
week (sd =6.0). The largest consumption group consumed fruit juices on 6 or more
occasions each week (40.9%), although there was great variation in responses.
Figure 6. Response Proportions of Weekly Fruit Juice Consumption
45.3%
31.7%
9.4% 4.9% 4.0% 1.0% 0.7% 3.0%
0
10
20
30
40
50
0 < 1 1 2 3 4 5 6+
Prop
ortio
n (%
)
Sport Drink Consumption (times per week)
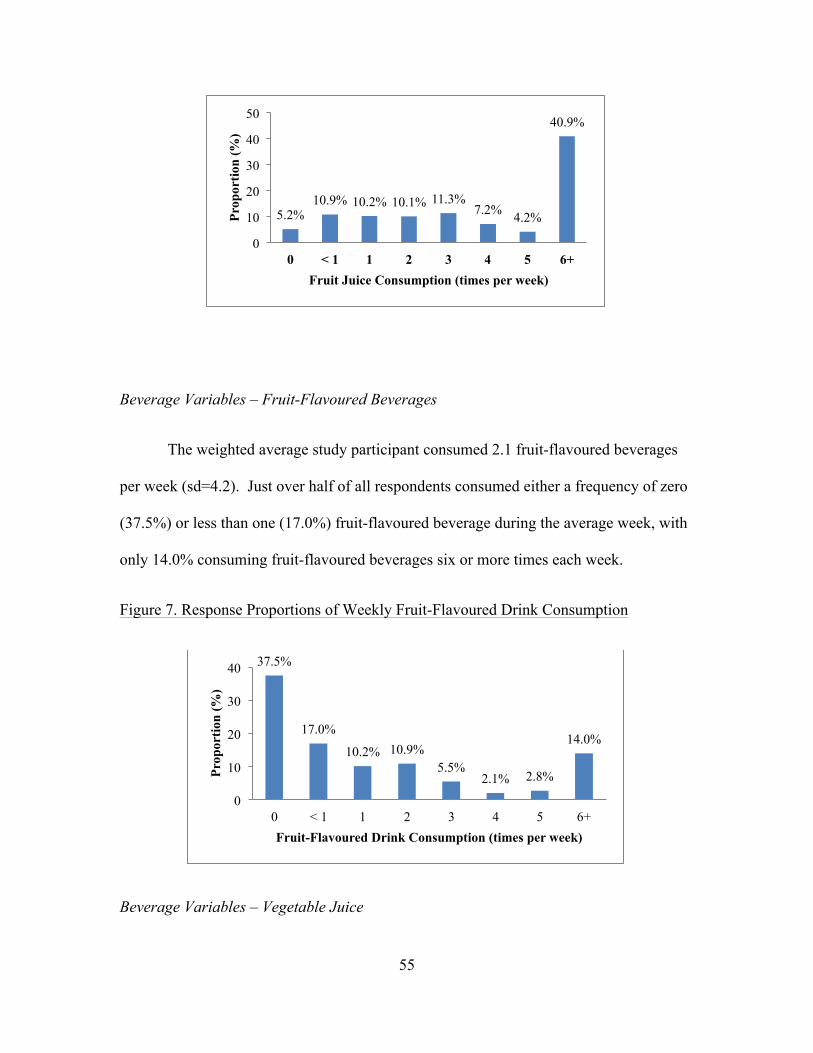
55
Beverage Variables – Fruit-Flavoured Beverages
The weighted average study participant consumed 2.1 fruit-flavoured beverages
per week (sd=4.2). Just over half of all respondents consumed either a frequency of zero
(37.5%) or less than one (17.0%) fruit-flavoured beverage during the average week, with
only 14.0% consuming fruit-flavoured beverages six or more times each week.
Figure 7. Response Proportions of Weekly Fruit-Flavoured Drink Consumption
Beverage Variables – Vegetable Juice
5.2% 10.9% 10.2% 10.1% 11.3%
7.2% 4.2%
40.9%
0
10
20
30
40
50
0 < 1 1 2 3 4 5 6+
Prop
ortio
n (%
)
Fruit Juice Consumption (times per week)
37.5%
17.0%
10.2% 10.9% 5.5%
2.1% 2.8%
14.0%
0
10
20
30
40
0 < 1 1 2 3 4 5 6+
Prop
ortio
n (%
)
Fruit-Flavoured Drink Consumption (times per week)

56
Vegetable juice consumption was generally low in the weighted study population,
with participants consuming vegetable juice an average of 0.6 times (sd=1.7) per week.
The vast majority of participants (64.4%) did not consume vegetable juice at all, and
18.8% consumed it less than once per week.
Figure 8. Response Proportions of Weekly Vegetable Juice Consumption
Beverage Variables – Alcohol
The average weekly alcohol consumption of the weighted sample was 4.3 times
per week (sd=8.5). Just over half (51.8%) did not consume any alcohol, due
predominantly to the fact that a large proportion of the study population was not of legal
age to consume alcohol in Canada.
Figure 9. Response Proportions of Weekly Alcohol Consumption
64.4%
18.8%
6.3% 2.9% 2.0% 1.9% 3.7%
0 10 20 30 40 50 60 70
0 <1 1 2 3 4 5+
Prop
ortio
n (%
)
Vegetable Juice Consumption (times per week)
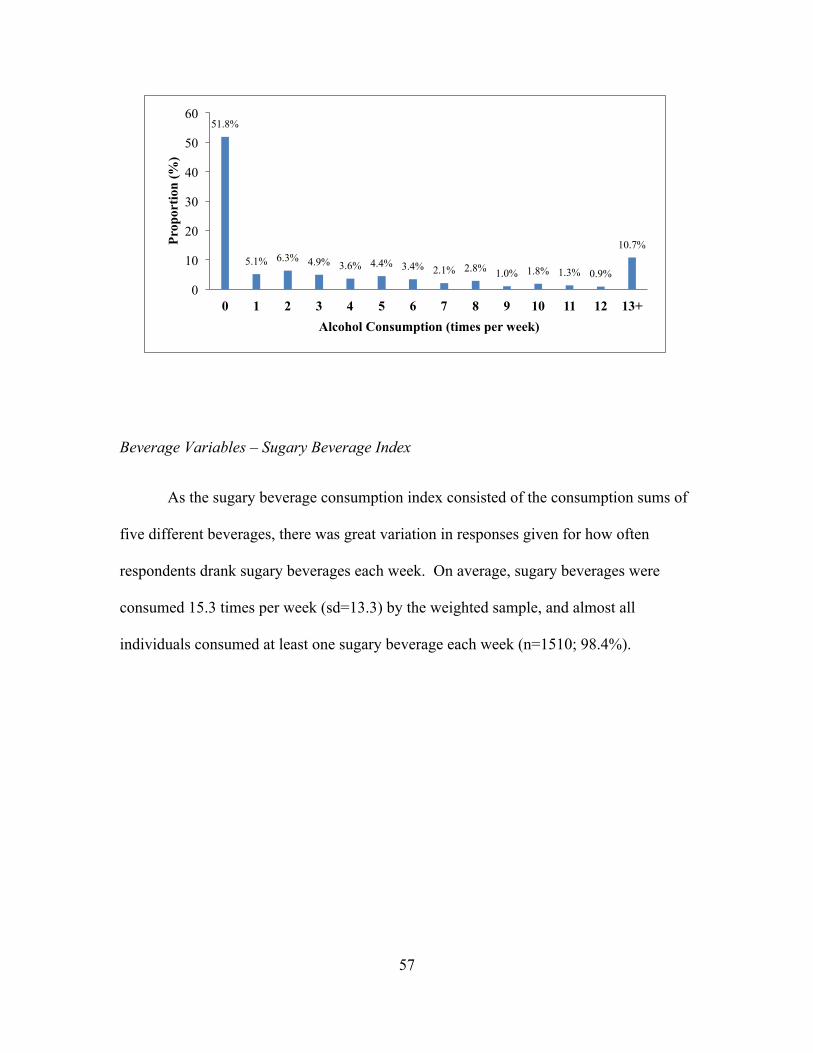
57
Beverage Variables – Sugary Beverage Index
As the sugary beverage consumption index consisted of the consumption sums of
five different beverages, there was great variation in responses given for how often
respondents drank sugary beverages each week. On average, sugary beverages were
consumed 15.3 times per week (sd=13.3) by the weighted sample, and almost all
individuals consumed at least one sugary beverage each week (n=1510; 98.4%).
51.8%
5.1% 6.3% 4.9% 3.6% 4.4% 3.4% 2.1% 2.8% 1.0% 1.8% 1.3% 0.9%
10.7%
0
10
20
30
40
50
60
0 1 2 3 4 5 6 7 8 9 10 11 12 13+
Prop
ortio
n (%
)
Alcohol Consumption (times per week)

58
Figure 10. Response Proportions of Weekly Sugary Beverage Consumption
Beverage Variables – Acidic Beverage Index
The Acidic Beverage Consumption Index also showed a lot of variation between
individual responses, as again it is a compilation index, this time of seven separate
beverages. The mean frequency of acidic beverages consumed in a week by the weighted
sample was 16.6 times (sd=13.7), with only 0.9% consuming acidic drinks less than once
per week.
Figure 11. Response Proportions of Weekly Acidic Beverage Consumption
1.6% 2.1%
2.7%
5.0% 4.5%
3.1% 3.6%
7.3% 6.3%
7.1% 5.9%
3.4% 4.1%
2.5%
5.2%
3.1% 2.1%
2.0% 1.6% 2.0%
1.3% 1.6% 2.5% 2.0%
1.4%
16.0%
0
2
4
6
8
10
12
14
16
18 <1
1 2 3 4 5 6 7 8 9 10
11
12
13
14
15
16
17
18
19
20
21
22
23
24
25+
Prop
ortio
n (%
)
Sugary Beverage Consumption (times per week)

59
Outcome Variables
Descriptive analyses, including means, standard deviations, and proportions are
displayed below in table and graphical format for each of the four outcome variables.
Please note that all values have been weighted, clustered and stratified as described
above.
Outcome Variables – Dental Decay
The average patient in the weighted study sample had 23 sound teeth (never
decayed nor restored) out of a possible 28 in their mouth, with a standard deviation of
4.6. Of the weighted sample, 17.7% had a full 28 sound teeth, so did not have a decayed,
restored or missing tooth in their mouth. Participants with 12 or less sound teeth in their
0.9% 2.0%
1.7%
4.4% 4.1%
2.5%
4.4% 4.6%
6.8% 5.4% 5.8%
4.7% 4.0%
2.1%
5.2% 4.3%
2.7% 2.5%
1.2% 1.9% 1.9%
1.3%
3.5%
1.9% 1.5%
18.6%
0
2
4
6
8
10
12
14
16
18
20
<1 1 2 3 4 5 6 7 8 9 10
11
12
13
14
15
16
17
18
19
20
21
22
23
24
25+
Prop
ortio
n (%
)
Acidic Beverage Consumption (times per week)

60
mouth have been grouped together for reporting purposes, in order to comply with
Statistics Canada guidelines.
Table 3. Dental Decay Descriptive Statistics (n=1534)
Number of Sound, Never Decayed Teeth Mean Standard Deviation Proportion Dental Decay 23.0 4.6
0-12 2.6% 13 1.2% 14 1.5% 15 1.7% 16 3.1% 17 3.5% 18 2.7% 19 4.6% 20 5.1% 21 5.2% 22 7.6% 23 7.2% 24 8.8% 25 7.5% 26 10.9% 27 9.2% 28 17.7%
Figure 12. Response Proportions of Dental Decay
Outcome Variables –Periodontal Health
2.6% 1.2% 1.5% 1.7%
3.1% 3.5% 2.7%
4.6% 5.1% 5.2%
7.6% 7.2% 8.8%
7.5%
10.9% 9.2%
17.7%
0 2 4 6 8
10 12 14 16 18 20
Prop
ortio
n (%
)
Number of Sound Teeth (/28)

61
The Periodontal Health outcome is expressed as a score out of 24 with higher
scores indicating better periodontal health. The mean gingivitis score of the weighted
study population was 19.4 (sd=3.5). Of the weighted sample, 14.5% had perfect
gingivitis scores of 24, whereas only 1.9% fell into the lowest score groups of having a
gingivitis score of less than 12.
Table 4. Periodontal Health Descriptive Statistics (n=1534)
Gingivitis Score Mean Standard Deviation Proportion Periodontal Health 19.4 3.5
<12 1.9% 12 2.3% 13 2.7% 14 2.8% 15 3.4% 16 5.6% 17 7.6% 18 15.3% 19 8.1% 20 8.7% 21 9.6% 22 8.2% 23 9.2% 24 14.5%
Figure 13. Response Proportions of Gingivitis Score
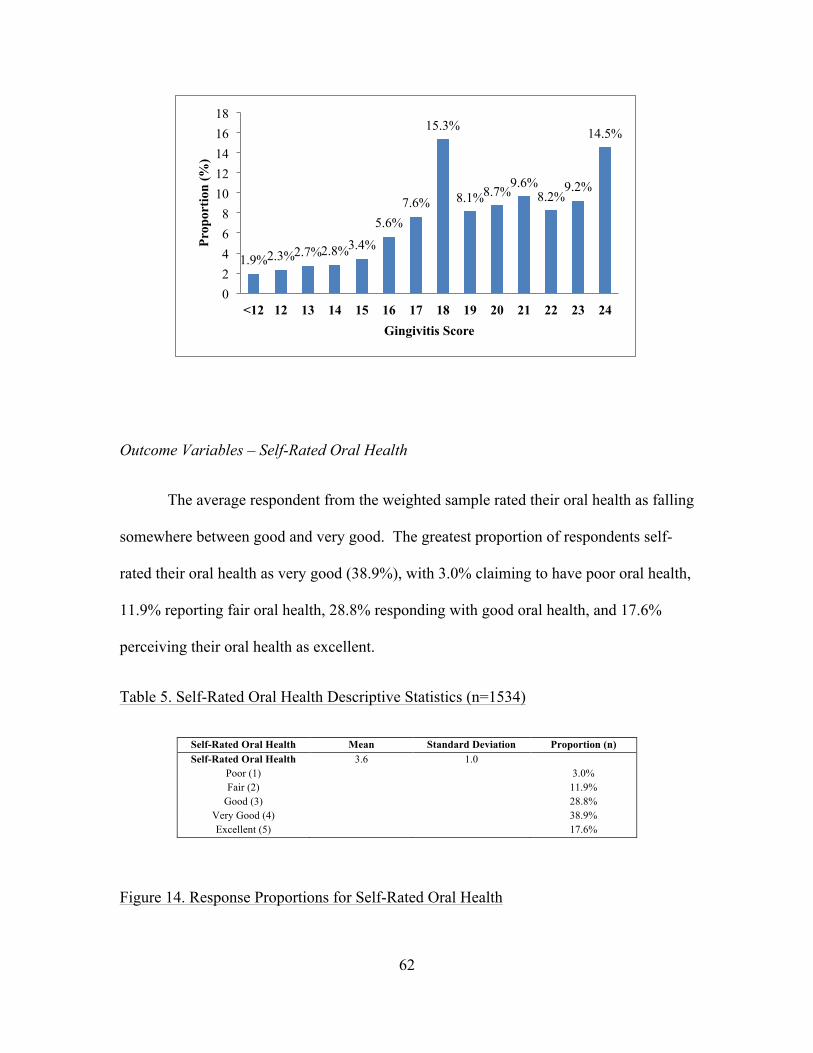
62
Outcome Variables – Self-Rated Oral Health
The average respondent from the weighted sample rated their oral health as falling
somewhere between good and very good. The greatest proportion of respondents self-
rated their oral health as very good (38.9%), with 3.0% claiming to have poor oral health,
11.9% reporting fair oral health, 28.8% responding with good oral health, and 17.6%
perceiving their oral health as excellent.
Table 5. Self-Rated Oral Health Descriptive Statistics (n=1534)
Self-Rated Oral Health Mean Standard Deviation Proportion (n) Self-Rated Oral Health 3.6 1.0
Poor (1) 3.0% Fair (2) 11.9%
Good (3) 28.8% Very Good (4) 38.9% Excellent (5) 17.6%
Figure 14. Response Proportions for Self-Rated Oral Health
1.9% 2.3% 2.7% 2.8% 3.4%
5.6% 7.6%
15.3%
8.1% 8.7% 9.6%
8.2% 9.2%
14.5%
0 2 4 6 8
10 12 14 16 18
<12 12 13 14 15 16 17 18 19 20 21 22 23 24
Prop
ortio
n (%
)
Gingivitis Score

63
Outcome Variables – OHX
The calculated Oral Health Index scores for the weighted study participants varied
widely, with an average score of 46.9 and a standard deviation of 8.4. 1.6% of the
weighted study population had a perfect Oral Health Index score of 60. In order to
comply with Statistics Canada confidentiality and vetting rules, scores of 30 or less have
been combined for reporting purposes.
Table 6. Oral Health Index Descriptive Statistics (n=1534)
3.0%
11.9%
28.8%
38.9%
17.6%
0 5
10 15 20 25 30 35 40 45
Poor Fair Good Very Good Excellent
Prop
ortio
n (%
)
Self-Rated Oral Health
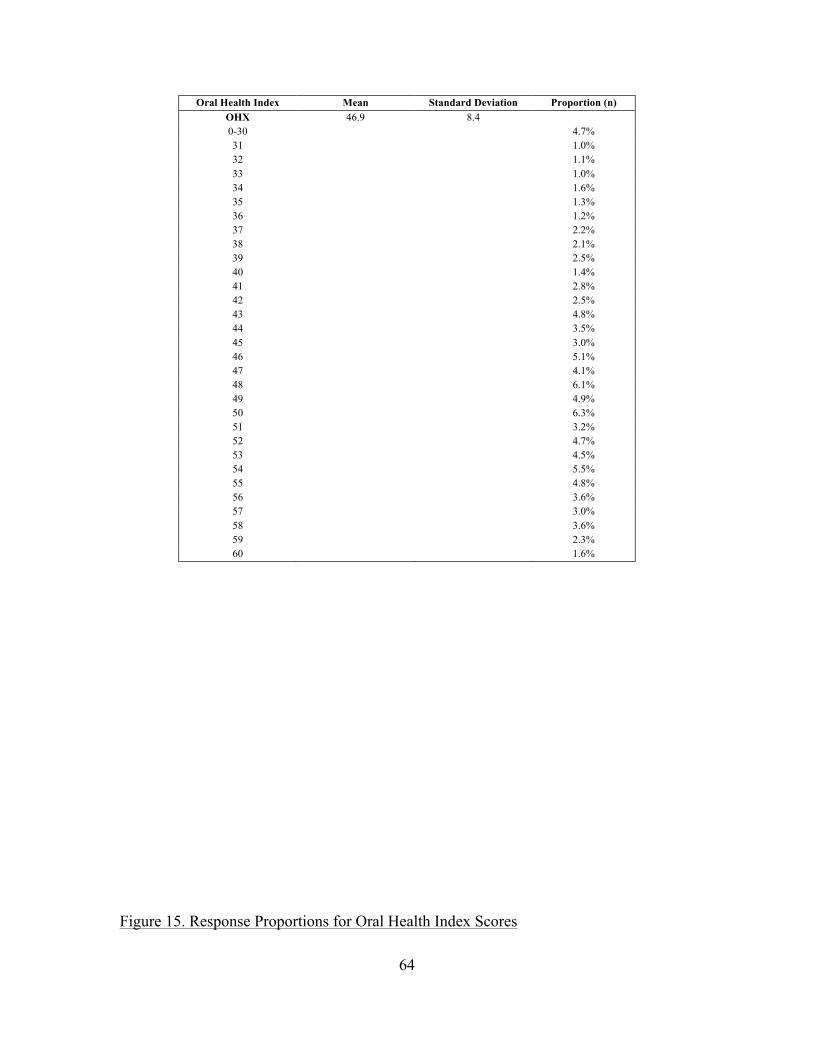
64
Oral Health Index Mean Standard Deviation Proportion (n) OHX 46.9 8.4 0-30 4.7% 31 1.0% 32 1.1% 33 1.0% 34 1.6% 35 1.3% 36 1.2% 37 2.2% 38 2.1% 39 2.5% 40 1.4% 41 2.8% 42 2.5% 43 4.8% 44 3.5% 45 3.0% 46 5.1% 47 4.1% 48 6.1% 49 4.9% 50 6.3% 51 3.2% 52 4.7% 53 4.5% 54 5.5% 55 4.8% 56 3.6% 57 3.0% 58 3.6% 59 2.3% 60 1.6%
Figure 15. Response Proportions for Oral Health Index Scores

65
Models
After completing initial exploratory analyses, 12 models were fitted in order to
better understand the association between the predictor variables, especially beverage
consumption variables, and each of the four outcomes. The models were fitted as
described in the Analysis section. Below, the incidence-rate ratios (IRR), 95%
confidence intervals (CI) and p-values for each of the variables in the models are
displayed in table format, with significant predictor variables bolded. For each of the
categorical covariates, the multiple degrees of freedom test was reported as the overall p-
value for the category. Overall degrees of freedom tests are reported for age (3 degrees of
freedom (3df)), education (3df), income (4df), smoking habits (2df), and frequency of
dental care (3df).
4.7%
1.0% 1.1% 1.0%
1.6% 1.3% 1.2%
2.2% 2.1% 2.5%
1.4%
2.8% 2.5%
4.8%
3.5%
3.0%
5.1%
4.1%
6.1%
4.9%
6.3%
3.2%
4.7% 4.5%
5.5%
4.8%
3.6%
3.0%
3.6%
2.3%
1.6%
0
1
2
3
4
5
6
7
0-30
31
32
33
34
35
36
37
38
39
40
41
42
43
44
45
46
47
48
49
50
51
52
53
54
55
56
57
58
59
60
Prop
ortio
n (%
)
Oral Health Index Score (/60)

66
Main Effects Model – Dental Decay
The first model fitted looked at the outcome of dental decay with each of the nine
beverage variables being included separately in the model. As shown in Table 7, regular
soft drink consumption, fruit-flavoured drink consumption, age, sex, frequency of
flossing teeth and fibre consumption were significantly associated with dental decay.
Regular soft drink consumption had a detrimental impact on dental decay, with every
increase of 1 regular soft drink per week causing the number of sound teeth in the mouth
to decrease by 1.004 times (or increase by 0.996 times; 95% CI = 0.993-0.998). Fruit-
flavoured beverage consumption also had a negative impact on the number of sound teeth
in the patient’s mouth, causing a decrease in the number of sound teeth by 1.003 times
(95% CI = 0.994 – 0.9995) for each one unit increase in number of fruit-flavoured
beverages consumed each week. Consumption of water, milk, diet soft drinks, fruit
juices, sports drinks, vegetable juice and alcohol were not significant in this model.
In order to further investigate the effects of beverage consumption on dental
decay, the mean number of sound teeth was calculated for differing consumption patterns
of certain beverages, and is displayed below. Although the categories chosen were
arbitrary and restricted by Statistics Canada reporting requirements, some interesting
trends can be seen. These differences for water consumption are displayed in Figure 16
below. Since water consumption was not a significant variables it is not surprising that no
clear pattern emerges in the graph; however those who do not consume water (0 times per
day) have much fewer sound teeth on average than those who consumed at least one glass
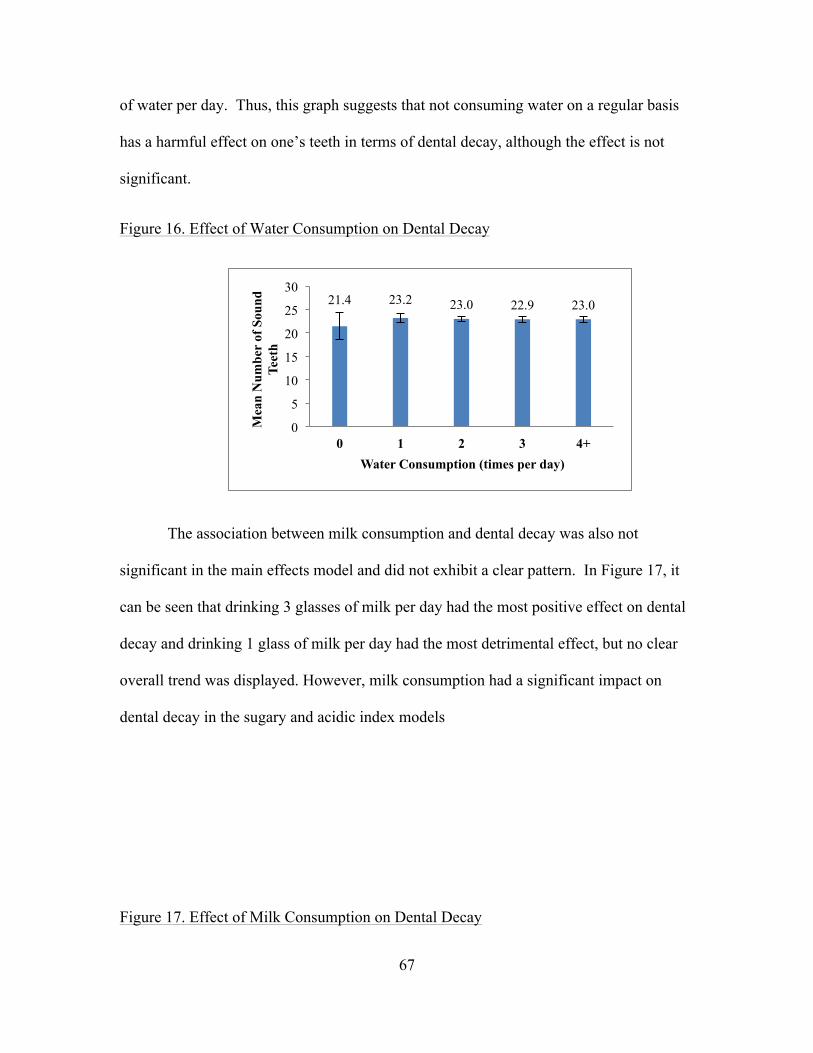
67
of water per day. Thus, this graph suggests that not consuming water on a regular basis
has a harmful effect on one’s teeth in terms of dental decay, although the effect is not
significant.
Figure 16. Effect of Water Consumption on Dental Decay
The association between milk consumption and dental decay was also not
significant in the main effects model and did not exhibit a clear pattern. In Figure 17, it
can be seen that drinking 3 glasses of milk per day had the most positive effect on dental
decay and drinking 1 glass of milk per day had the most detrimental effect, but no clear
overall trend was displayed. However, milk consumption had a significant impact on
dental decay in the sugary and acidic index models
Figure 17. Effect of Milk Consumption on Dental Decay
21.4 23.2 23.0 22.9 23.0
0
5
10
15
20
25
30
0 1 2 3 4+
Mea
n N
umbe
r of
Sou
nd
Teet
h
Water Consumption (times per day)

68
Of particular interest in the main effects model for dental decay are the two
significant beverages, namely regular soft drinks and fruit-flavoured beverages. In Figure
18 below, it can be observed that regular soft drink consumption did not show a clear
trend in regards to its effect on dental decay, which may be due to the presentation of the
data in arbitrary groupings. However, it does seem that those participants in the highest
consumption category (7 or more times consuming soft drinks per week) had lower
average scores than any of the other consumption groups.
Figure 18. Effect of Regular Soft Drink Consumption on Dental Decay
23.6 22.5 23.4 24.2 22.9
0
5
10
15
20
25
30
0 1 2 3 4+
Mea
n N
umbe
r of
Sou
nd
Teet
h
Milk Consumption (times per day)
22.9 23.6 22.6 22.9 20.9
0
5
10
15
20
25
30
0 <1 1-4 4-7 7+
Mea
n N
umbe
r of
Sou
nd T
eeth
Regular Soft Drink Consumption (times per week)

69
The effect of fruit-flavoured beverages on dental decay was similar to regular soft
drinks, but to a lesser magnitude, as displayed in Figure 19. Like above, no clear trend
was exhibited, but respondents in the highest consumption group had fewer sound teeth
on average than other participants, although this impact was not as severe as for regular
soft drinks.
Figure 19. Effect of Fruit-Flavoured Beverage Consumption on Dental Decay
In addition to the beverage variables, age as an overall predictor was significant in
the model with higher age having a detrimental impact on decay in the mouth: all age
contrasts except between the highest two age groups (20-24 vs. 25-30) were significant
predictors of dental decay. Interestingly, as the difference in ages being compared
became larger, so did the incidence rate ratio in the number of sound teeth; for instance,
being of age 16-19 as opposed to age 12-15 was associated with 1.030 times (95% CI =
0.951 – 0.991) fewer sound teeth in the oral cavity whereas being in the 20-24 age group
as opposed to between ages 12-15 lead to a 1.108 times (95% CI = 0.847 – 0.939) greater
chance of having dental decay in the oral cavity. Sex was also significant with females
23.2 23.0 22.7 23.1 21.7
0
5
10
15
20
25
30
0 <1 1-4 4-7 7+
Mea
n N
umbe
r of
Sou
nd T
eeth
Fruit-Flavoured Beverage Consumption (times per week)
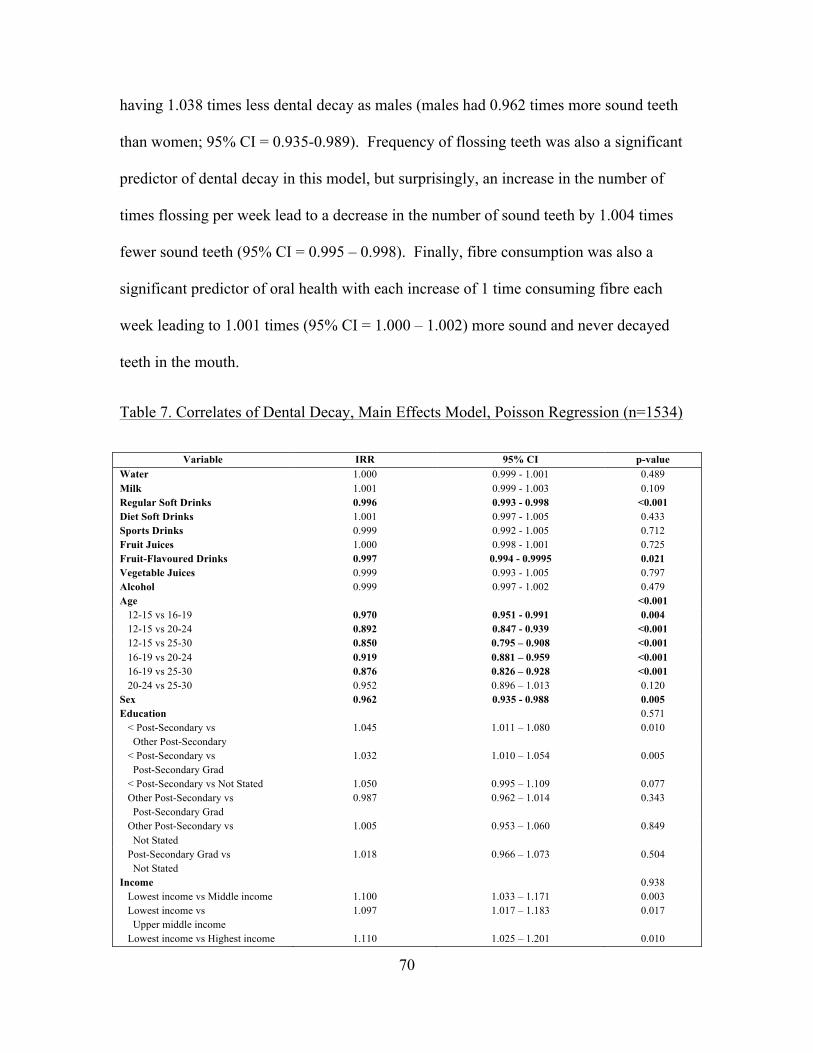
70
having 1.038 times less dental decay as males (males had 0.962 times more sound teeth
than women; 95% CI = 0.935-0.989). Frequency of flossing teeth was also a significant
predictor of dental decay in this model, but surprisingly, an increase in the number of
times flossing per week lead to a decrease in the number of sound teeth by 1.004 times
fewer sound teeth (95% CI = 0.995 – 0.998). Finally, fibre consumption was also a
significant predictor of oral health with each increase of 1 time consuming fibre each
week leading to 1.001 times (95% CI = 1.000 – 1.002) more sound and never decayed
teeth in the mouth.
Table 7. Correlates of Dental Decay, Main Effects Model, Poisson Regression (n=1534)
Variable IRR 95% CI p-value Water 1.000 0.999 - 1.001 0.489 Milk 1.001 0.999 - 1.003 0.109 Regular Soft Drinks 0.996 0.993 - 0.998 <0.001 Diet Soft Drinks 1.001 0.997 - 1.005 0.433 Sports Drinks 0.999 0.992 - 1.005 0.712 Fruit Juices 1.000 0.998 - 1.001 0.725 Fruit-Flavoured Drinks 0.997 0.994 - 0.9995 0.021 Vegetable Juices 0.999 0.993 - 1.005 0.797 Alcohol 0.999 0.997 - 1.002 0.479 Age <0.001 12-15 vs 16-19 0.970 0.951 - 0.991 0.004 12-15 vs 20-24 0.892 0.847 - 0.939 <0.001 12-15 vs 25-30 0.850 0.795 – 0.908 <0.001 16-19 vs 20-24 0.919 0.881 – 0.959 <0.001 16-19 vs 25-30 0.876 0.826 – 0.928 <0.001 20-24 vs 25-30 0.952 0.896 – 1.013 0.120 Sex 0.962 0.935 - 0.988 0.005 Education 0.571 < Post-Secondary vs Other Post-Secondary
1.045 1.011 – 1.080 0.010
< Post-Secondary vs Post-Secondary Grad
1.032 1.010 – 1.054 0.005
< Post-Secondary vs Not Stated 1.050 0.995 – 1.109 0.077 Other Post-Secondary vs Post-Secondary Grad
0.987 0.962 – 1.014 0.343
Other Post-Secondary vs Not Stated
1.005 0.953 – 1.060 0.849
Post-Secondary Grad vs Not Stated
1.018 0.966 – 1.073 0.504
Income 0.938 Lowest income vs Middle income 1.100 1.033 – 1.171 0.003 Lowest income vs Upper middle income
1.097 1.017 – 1.183 0.017
Lowest income vs Highest income 1.110 1.025 – 1.201 0.010
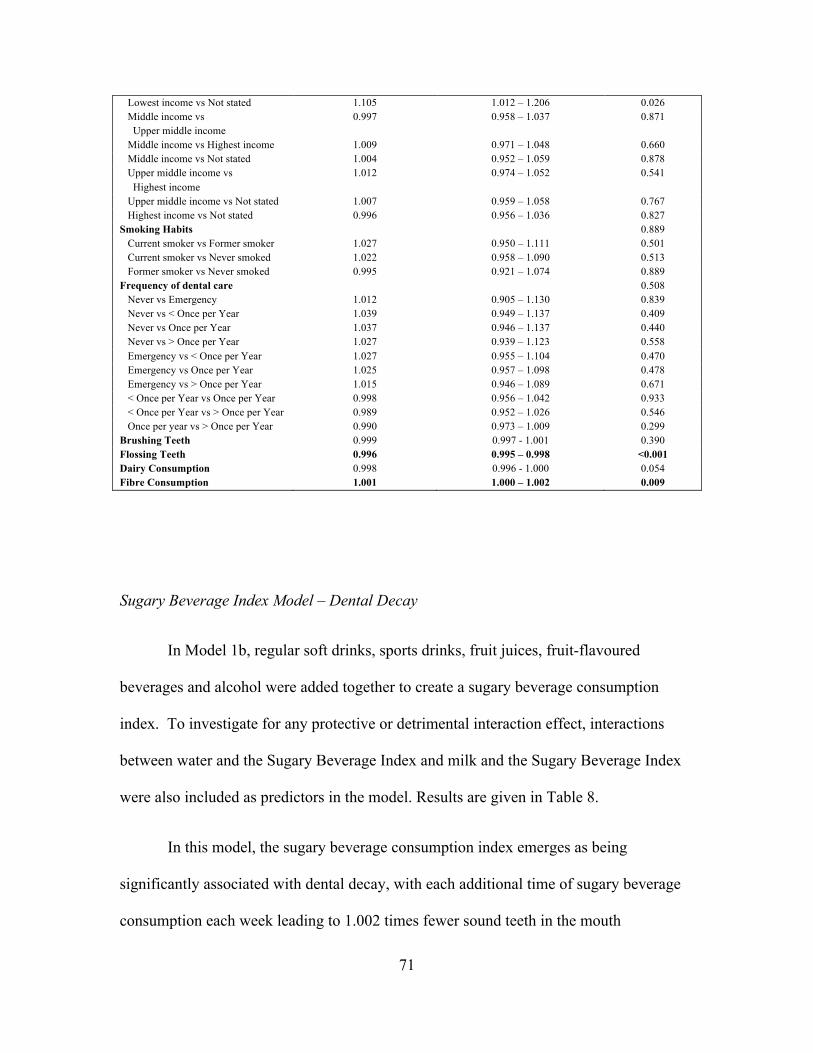
71
Lowest income vs Not stated 1.105 1.012 – 1.206 0.026 Middle income vs Upper middle income
0.997 0.958 – 1.037 0.871
Middle income vs Highest income 1.009 0.971 – 1.048 0.660 Middle income vs Not stated 1.004 0.952 – 1.059 0.878 Upper middle income vs Highest income
1.012 0.974 – 1.052 0.541
Upper middle income vs Not stated 1.007 0.959 – 1.058 0.767 Highest income vs Not stated 0.996 0.956 – 1.036 0.827 Smoking Habits 0.889 Current smoker vs Former smoker 1.027 0.950 – 1.111 0.501 Current smoker vs Never smoked 1.022 0.958 – 1.090 0.513 Former smoker vs Never smoked 0.995 0.921 – 1.074 0.889 Frequency of dental care 0.508 Never vs Emergency 1.012 0.905 – 1.130 0.839 Never vs < Once per Year 1.039 0.949 – 1.137 0.409 Never vs Once per Year 1.037 0.946 – 1.137 0.440 Never vs > Once per Year 1.027 0.939 – 1.123 0.558 Emergency vs < Once per Year 1.027 0.955 – 1.104 0.470 Emergency vs Once per Year 1.025 0.957 – 1.098 0.478 Emergency vs > Once per Year 1.015 0.946 – 1.089 0.671 < Once per Year vs Once per Year 0.998 0.956 – 1.042 0.933 < Once per Year vs > Once per Year 0.989 0.952 – 1.026 0.546 Once per year vs > Once per Year 0.990 0.973 – 1.009 0.299 Brushing Teeth 0.999 0.997 - 1.001 0.390 Flossing Teeth 0.996 0.995 – 0.998 <0.001 Dairy Consumption 0.998 0.996 - 1.000 0.054 Fibre Consumption 1.001 1.000 – 1.002 0.009
Sugary Beverage Index Model – Dental Decay
In Model 1b, regular soft drinks, sports drinks, fruit juices, fruit-flavoured
beverages and alcohol were added together to create a sugary beverage consumption
index. To investigate for any protective or detrimental interaction effect, interactions
between water and the Sugary Beverage Index and milk and the Sugary Beverage Index
were also included as predictors in the model. Results are given in Table 8.
In this model, the sugary beverage consumption index emerges as being
significantly associated with dental decay, with each additional time of sugary beverage
consumption each week leading to 1.002 times fewer sound teeth in the mouth

72
(IRR=0.998; 95% CI = 0.996 – 0.9999). Milk was also found to be significant in the
model and had a protective effect on dental decay; each one unit increase in the number
times milk was consumed each week lead to 1.002 times more sound teeth in the oral
cavity (95% CI = 1.000 – 1.004). Water, diet soft drink and vegetable juice consumption
were not significant in this model, nor were the two interaction variables.
In order to better conceptualize the effect of sugary beverage consumption on
dental decay, the mean number of sound teeth for each group was calculated and graphed,
after being grouped by average number of times sugary beverages were consumed per
week. As displayed in Figure 20, those who did not consume any sugary beverages in a
day had less dental decay on average than those who consumed sugar-containing
beverages at least once per day. Furthermore, those who drank 4 or more sugary
beverages per day had much fewer sound teeth on average than those who consumed less
sugary beverages. Participants who drank 1, 2 or 3 sugary beverages per day had about
the same number of sound teeth on average.
Figure 20. Effect of Sugary Beverage Consumption on Dental Decay
25.0
23.1 23.0 23.5 21.6
0
5
10
15
20
25
30
35
0 1 2 3 4+ Mea
n N
umbe
r of
Sou
nd T
eeth
Sugary Beverage Consumption (times per day)

73
Not only were the individual beverages consumed of interest, but also the
interactions between beverages hypothesized to be harmful and beneficial to oral health.
The interaction between water and sugary beverage consumption is displayed in Figure
21 below. The interaction between water and sugary beverages, as well as water on its
own, were not significant, and thus do not seem to have a particular impact on oral
health. Although not significant, both water and sugary beverage consumption appeared
to cause a reduction in the number of sound teeth in the mouth. The reduction due to
increased water consumption was rather minimal, with each extra time consuming water
interacting with one sugary beverage leading to 0.0002 reduced incidence odds ratio.
Clinically, this effect is negligible, as even increasing water consumption by 10 times per
day would only lead to an IRR of 1.014 times more sound teeth. An increase of sugary
beverage consumption, when holding water consumption constant, lead to 1.0019 times
fewer sound teeth in the oral cavity. Thus, consuming sugary beverages 10 more times
per day would lead to 1.142 times fewer sound teeth in the oral cavity.
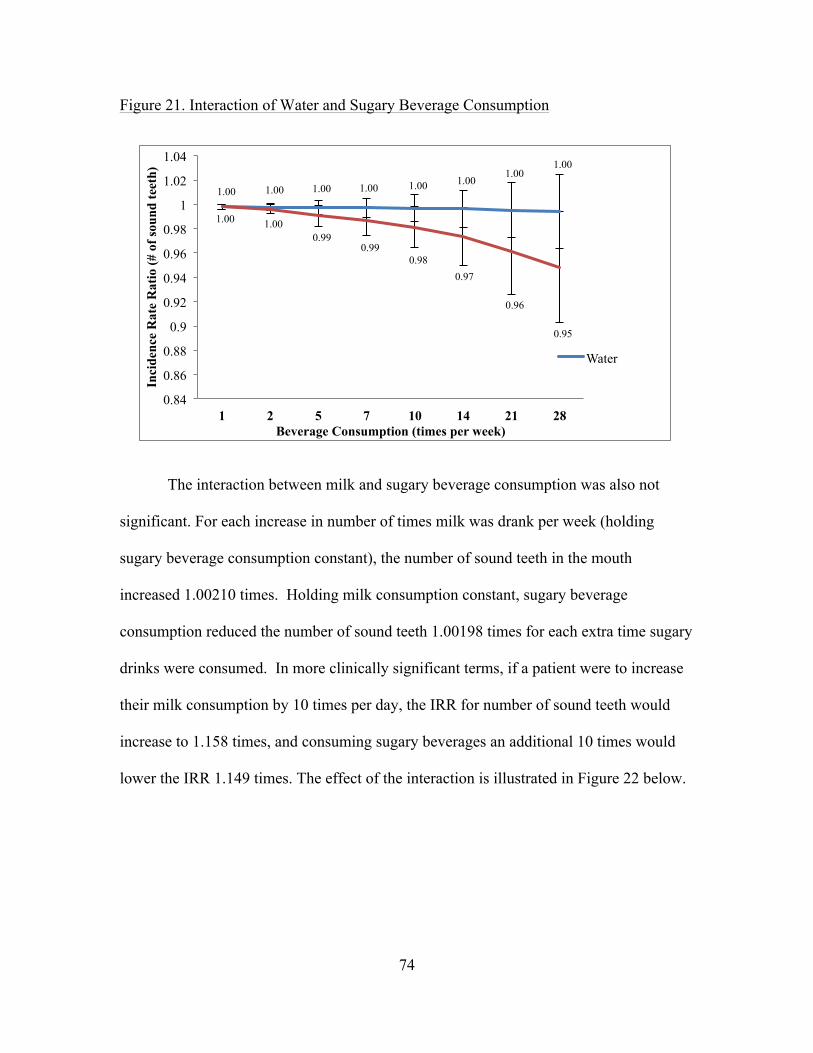
74
Figure 21. Interaction of Water and Sugary Beverage Consumption
The interaction between milk and sugary beverage consumption was also not
significant. For each increase in number of times milk was drank per week (holding
sugary beverage consumption constant), the number of sound teeth in the mouth
increased 1.00210 times. Holding milk consumption constant, sugary beverage
consumption reduced the number of sound teeth 1.00198 times for each extra time sugary
drinks were consumed. In more clinically significant terms, if a patient were to increase
their milk consumption by 10 times per day, the IRR for number of sound teeth would
increase to 1.158 times, and consuming sugary beverages an additional 10 times would
lower the IRR 1.149 times. The effect of the interaction is illustrated in Figure 22 below.
1.00 1.00 1.00 1.00 1.00 1.00 1.00
1.00
1.00 1.00 0.99
0.99 0.98
0.97
0.96
0.95
0.84
0.86
0.88
0.9
0.92
0.94
0.96
0.98
1
1.02
1.04
1 2 5 7 10 14 21 28
Inci
denc
e R
ate
Rat
io (#
of s
ound
teet
h)
Beverage Consumption (times per week)
Water

75
Figure 22. Interaction of Milk and Sugary Beverage Consumption
Age, sex, frequency of flossing teeth and fibre consumption remained significant
predictors of dental decay. All age contrasts except between the two highest age groups
(20-24 and 25-30) were found to be significant, and as in the main effects model, higher
age was associated with higher chance of experiencing dental decay and greater extent of
dental decay. Sex also had a similar effect, with females having 1.038 times more sound
teeth than males (95% CI = 0.936 – 0.988). Flossing again was found to have a
damaging effect on dental decay (IRR = 0.996; 95% CI = 0.994 – 0.998), and fibre
continued to have a slight protective effect against caries and other dental decay (IRR =
1.001; 95% CI = 1.000 – 1.002).
1.00 1.00 1.01 1.01 1.02 1.03 1.04 1.06
1.00 1.00 0.99 0.99 0.98 0.98 0.96 0.95
0
0.2
0.4
0.6
0.8
1
1.2
1 2 5 7 10 14 21 28
Inci
denc
e R
ate
Rat
io (#
of s
ound
teet
h)
Beverage Consumption (times per week)
Milk
Sugary Beverages

76
Table 8. Correlates of Dental Decay, Sugary Beverage Index Model, Poisson Regression
(n=1534)
Variable IRR 95% CI p-value Water 1.000 0.999 - 1.001 0.780 Milk 1.002 1.000 - 1.004 0.029 Sugary Beverage Consumption Index 0.998 0.996 – 0.9999 0.035 Diet Soft Drinks 1.002 0.998 - 1.005 0.390 Vegetable Juices 1.000 0.993 - 1.006 0.982 Milk and Sugary Beverage Interaction 1.000 1.000 - 1.000 0.138 Water and Sugary Beverage Interaction 1.000 1.000 - 1.000 0.186 Age <0.001 12-15 vs 16-19 0.975 0.954 – 0.996 0.019 12-15 vs 20-24 0.897 0.855 – 0.940 <0.001 12-15 vs 25-30 0.855 0.800 – 0.914 <0.001 16-19 vs 20-24 0.918 0.884 – 0.957 <0.001 16-19 vs 25-30 0.877 0.828 – 0.929 <0.001 20-24 vs 25-30 0.954 0.901 – 1.010 0.103 Sex 0.962 0.936 - 0.988 0.005 Education 0.674 < Post-Secondary vs Other Post-Secondary
1.046 1.012 – 1.081 0.008
< Post-Secondary vs Post-Secondary Grad
1.036 1.015 – 1.058 0.001
< Post-Secondary vs Not Stated 1.053 0.994 – 1.115 0.079 Other Post-Secondary vs Post-Secondary Grad
0.990 0.965 – 1.016 0.451
Other Post-Secondary vs Not Stated
1.006 0.952 – 1.064 0.828
Post-Secondary Grad vs Not Stated
1.016 0.963 – 1.072 0.557
Income 0.916 Lowest income vs Middle income 1.097 1.032 – 1.167 0.003 Lowest income vs Upper middle income
1.093 1.013 – 1.180 0.022
Lowest income vs Highest income 1.107 1.022 – 1.199 0.013 Lowest income vs Not stated 1.103 1.010 – 1.203 0.028 Middle income vs Upper middle income
0.912 0.857 – 0.969 0.003
Middle income vs Highest income 0.996 0.955 – 1.039 0.860 Middle income vs Not stated 1.009 0.972 – 1.048 0.637 Upper middle income vs Highest income
1.013 0.976 – 1.052 0.503
Upper middle income vs Not stated 1.009 0.959 – 1.062 0.737 Highest income vs Not stated 0.996 0.956 – 1.037 0.844 Smoking Habits 0.918 Current smoker vs Former smoker 1.029 0.951 – 1.113 0.479 Current smoker vs Never smoked 1.025 0.963 – 1.091 0.443 Former smoker vs Never smoked 0.996 0.924 – 1.073 0.917 Frequency of dental care 0.389 Never vs Emergency 1.010 0.905 – 1.128 0.853 Never vs < Once per Year 1.044 0.955 – 1.140 0.343 Never vs Once per Year 1.043 0.952 – 1.142 0.365 Never vs > Once per Year 1.032 0.946 – 1.126 0.475 Emergency vs < Once per Year 1.033 0.961 – 1.110 0.376 Emergency vs Once per Year 1.032 0.965 – 1.104 0.360 Emergency vs > Once per Year 1.021 0.953 – 1.094 0.548

77
< Once per Year vs Once per Year 0.999 0.958 – 1.042 0.968 < Once per Year vs > Once per Year 0.989 0.954 – 1.025 0.544 Once per year vs > Once per Year 0.990 0.972 – 1.007 0.255 Brushing Teeth 0.999 0.997 - 1.001 0.489 Flossing Teeth 0.996 0.994 – 0.998 <0.001 Dairy Consumption 0.998 0.996 – 1.000 0.088 Fibre Consumption 1.001 1.000 – 1.002 0.001
Acidic Beverage Index Model – Dental Decay
The final model investigating the association between dental decay and beverage
consumption was the acidic beverage index model. In this model, all beverages except
for milk and water (soft drinks, diet soft drinks, sports beverages, fruit juices, fruit-
flavoured drinks, vegetable juices and alcohol) were grouped together to create an acidic
beverage consumption index to compile the number of times acid is consumed in
beverage form within a one week span. Results are given in Table 9. Milk was found to
be associated with reduced dental decay in the acidic beverage consumption model and
had a positive effect on the number of sound teeth in the mouth, raising this number by
1.002 times (95% CI = 1.001 – 1.004) for each extra time milk was consumed per week.
The milk and acidic beverage interaction was also significant to dental decay (IRR =
0.9999; 95% CI = 0.9998 – 0.9999). The effect of this interaction will be discussed
further in reference to Figure 25 below. Water, acidic beverage consumption and the
water and acidic beverage interaction variables were not found to be significant.
Although it was not significant, further investigation of the effect of acidic
beverage consumption on dental decay revealed a trend similar to that shown for sugary
beverage consumption. Again, those respondents that did not drink acidic beverages had
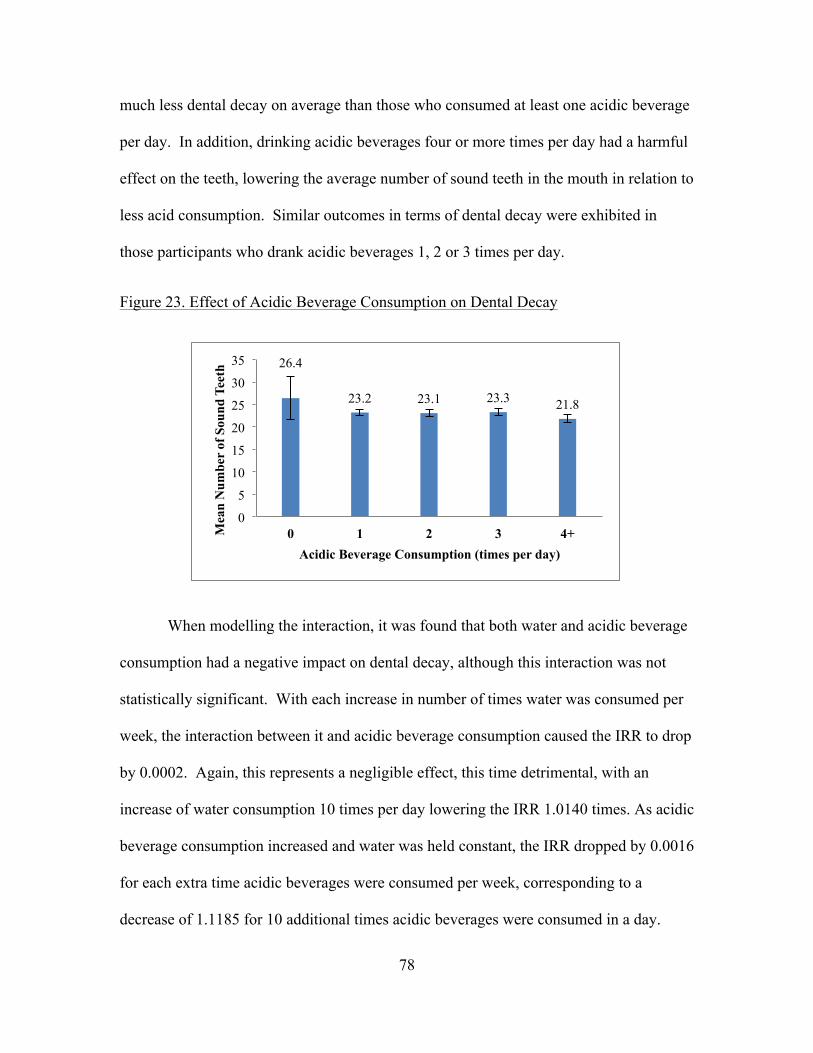
78
much less dental decay on average than those who consumed at least one acidic beverage
per day. In addition, drinking acidic beverages four or more times per day had a harmful
effect on the teeth, lowering the average number of sound teeth in the mouth in relation to
less acid consumption. Similar outcomes in terms of dental decay were exhibited in
those participants who drank acidic beverages 1, 2 or 3 times per day.
Figure 23. Effect of Acidic Beverage Consumption on Dental Decay
When modelling the interaction, it was found that both water and acidic beverage
consumption had a negative impact on dental decay, although this interaction was not
statistically significant. With each increase in number of times water was consumed per
week, the interaction between it and acidic beverage consumption caused the IRR to drop
by 0.0002. Again, this represents a negligible effect, this time detrimental, with an
increase of water consumption 10 times per day lowering the IRR 1.0140 times. As acidic
beverage consumption increased and water was held constant, the IRR dropped by 0.0016
for each extra time acidic beverages were consumed per week, corresponding to a
decrease of 1.1185 for 10 additional times acidic beverages were consumed in a day.
26.4
23.2 23.1 23.3 21.8
0
5
10
15
20
25
30
35
0 1 2 3 4+ Mea
n N
umbe
r of
Sou
nd T
eeth
Acidic Beverage Consumption (times per day)

79
However, this interaction was not significant in the model and thus the interaction
between water and acidic beverage consumption does not seem to have an impact on
dental decay. These results are shown in Figure 24 below.
Figure 24. Interaction of Water and Acidic Beverage Consumption
As it was significant, the milk and acidic beverage consumption interaction is of
particular interest. When examining the milk and acidic beverage interaction, it was
found that milk has a protective effect over acidic beverage consumption, raising the IRR
for number of sound teeth 1.0024 times for each extra time milk was consumed per week.
For an increase in 10 times of milk consumption per day, this would correspond to an
increased IRR of 1.1829. Acidic beverage consumption had a detrimental effect on the
interaction between itself and milk, with each additional time consuming an acidic
beverage lowering the IRR 1.0016 times, or by 1.1185 for each additional 10 acidic
beverages consumed in a day. From the data obtained from the CHMS, it was seen as
0.998 0.998 0.998 0.997 0.997 0.996 0.995 0.994
0.998 0.997 0.992 0.989
0.985 0.978
0.968
0.958
0.84
0.86
0.88
0.9
0.92
0.94
0.96
0.98
1
1.02
1.04
1 2 5 7 10 14 21 28
Inci
denc
e R
ate
Rat
io (#
of s
ound
teet
h)
Beverage Consumption (times per week)
Water
Acidic Beverages

80
well that the protective effect of milk was stronger than the detrimental effect of acidic
beverage consumption in the interaction between the two (IRR = 1.0024 vs. IRR=
1.0016).
Figure 25. Interaction between Milk and Acidic Beverage Consumption
Age continued to be a significant predictor of dental decay, and was significant at
all levels of contrast except between the highest two age groups (20-24 and 25-30).
Again, higher age was associated with fewer sound teeth in the mouth, and the magnitude
of this difference increased as the difference in age grew. Sex was also found to predict
dental decay, with males having 1.037 times fewer sound teeth in their mouths than
females (95% CI = 0.938 – 0.989). Frequency of flossing teeth and fibre consumption
continued to be associated with dental decay; as before, flossing caused a 1.004 times
reduction (95% CI = 0.994 – 0.998) in the number of sound teeth in the mouth and fibre
consumption was found to increase the number of sound teeth 1.001 times (95% CI =
1.000 – 1.002) for each increase in number of times fibre is consumed per week.
1.00 1.00 1.01 1.02 1.02 1.03 1.05 1.07
1.00 1.00 0.99 0.99 0.99 0.98 0.97 0.96
0
0.2
0.4
0.6
0.8
1
1.2
1 2 5 7 10 14 21 28
Inci
denc
e R
ate
Rat
io (#
of s
ound
teet
h)
Beverage Consumption (times per week)
Milk
Acidic Beverages
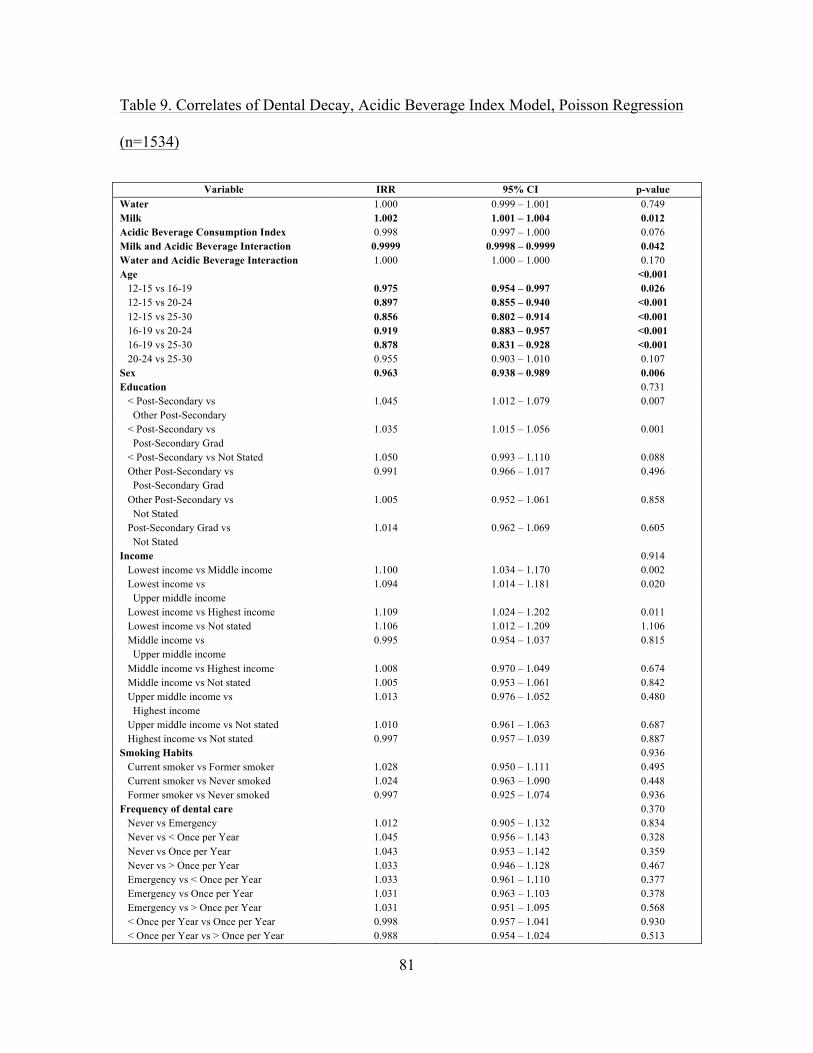
81
Table 9. Correlates of Dental Decay, Acidic Beverage Index Model, Poisson Regression
(n=1534)
Variable IRR 95% CI p-value Water 1.000 0.999 – 1.001 0.749 Milk 1.002 1.001 – 1.004 0.012 Acidic Beverage Consumption Index 0.998 0.997 – 1.000 0.076 Milk and Acidic Beverage Interaction 0.9999 0.9998 – 0.9999 0.042 Water and Acidic Beverage Interaction 1.000 1.000 – 1.000 0.170 Age <0.001 12-15 vs 16-19 0.975 0.954 – 0.997 0.026 12-15 vs 20-24 0.897 0.855 – 0.940 <0.001 12-15 vs 25-30 0.856 0.802 – 0.914 <0.001 16-19 vs 20-24 0.919 0.883 – 0.957 <0.001 16-19 vs 25-30 0.878 0.831 – 0.928 <0.001 20-24 vs 25-30 0.955 0.903 – 1.010 0.107 Sex 0.963 0.938 – 0.989 0.006 Education 0.731 < Post-Secondary vs Other Post-Secondary
1.045 1.012 – 1.079 0.007
< Post-Secondary vs Post-Secondary Grad
1.035 1.015 – 1.056 0.001
< Post-Secondary vs Not Stated 1.050 0.993 – 1.110 0.088 Other Post-Secondary vs Post-Secondary Grad
0.991 0.966 – 1.017 0.496
Other Post-Secondary vs Not Stated
1.005 0.952 – 1.061 0.858
Post-Secondary Grad vs Not Stated
1.014 0.962 – 1.069 0.605
Income 0.914 Lowest income vs Middle income 1.100 1.034 – 1.170 0.002 Lowest income vs Upper middle income
1.094 1.014 – 1.181 0.020
Lowest income vs Highest income 1.109 1.024 – 1.202 0.011 Lowest income vs Not stated 1.106 1.012 – 1.209 1.106 Middle income vs Upper middle income
0.995 0.954 – 1.037 0.815
Middle income vs Highest income 1.008 0.970 – 1.049 0.674 Middle income vs Not stated 1.005 0.953 – 1.061 0.842 Upper middle income vs Highest income
1.013 0.976 – 1.052 0.480
Upper middle income vs Not stated 1.010 0.961 – 1.063 0.687 Highest income vs Not stated 0.997 0.957 – 1.039 0.887 Smoking Habits 0.936 Current smoker vs Former smoker 1.028 0.950 – 1.111 0.495 Current smoker vs Never smoked 1.024 0.963 – 1.090 0.448 Former smoker vs Never smoked 0.997 0.925 – 1.074 0.936 Frequency of dental care 0.370 Never vs Emergency 1.012 0.905 – 1.132 0.834 Never vs < Once per Year 1.045 0.956 – 1.143 0.328 Never vs Once per Year 1.043 0.953 – 1.142 0.359 Never vs > Once per Year 1.033 0.946 – 1.128 0.467 Emergency vs < Once per Year 1.033 0.961 – 1.110 0.377 Emergency vs Once per Year 1.031 0.963 – 1.103 0.378 Emergency vs > Once per Year 1.031 0.951 – 1.095 0.568 < Once per Year vs Once per Year 0.998 0.957 – 1.041 0.930 < Once per Year vs > Once per Year 0.988 0.954 – 1.024 0.513
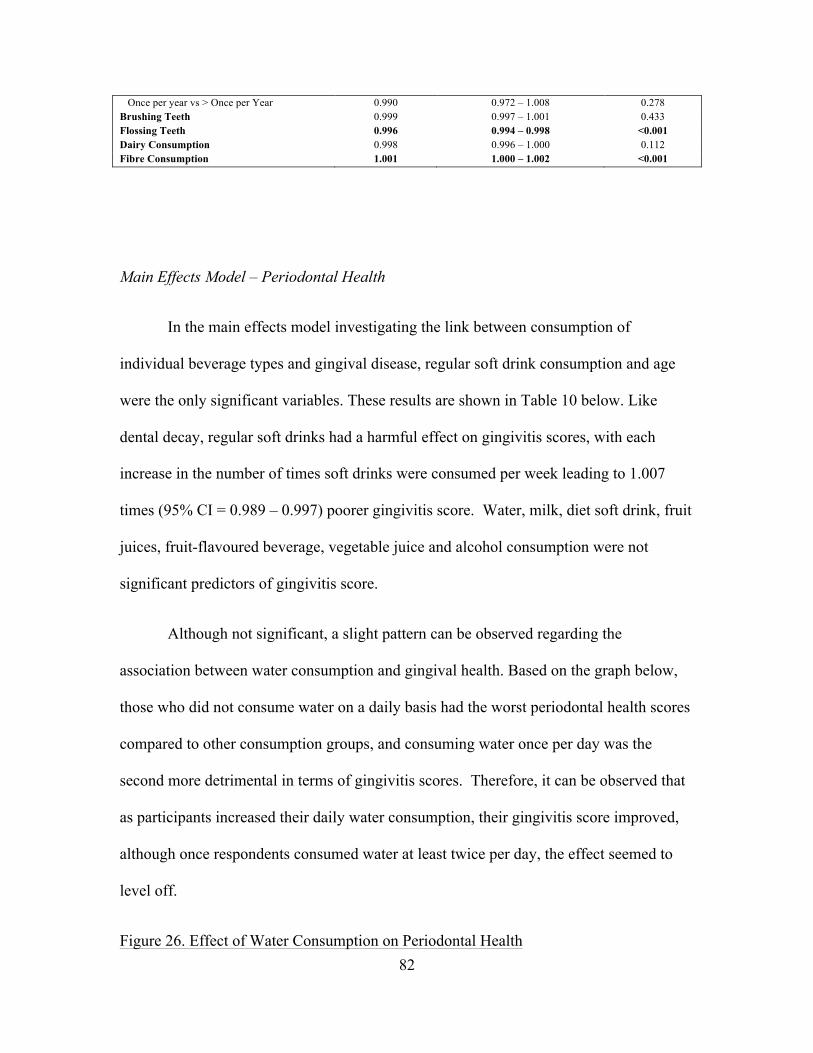
82
Once per year vs > Once per Year 0.990 0.972 – 1.008 0.278 Brushing Teeth 0.999 0.997 – 1.001 0.433 Flossing Teeth 0.996 0.994 – 0.998 <0.001 Dairy Consumption 0.998 0.996 – 1.000 0.112 Fibre Consumption 1.001 1.000 – 1.002 <0.001
Main Effects Model – Periodontal Health
In the main effects model investigating the link between consumption of
individual beverage types and gingival disease, regular soft drink consumption and age
were the only significant variables. These results are shown in Table 10 below. Like
dental decay, regular soft drinks had a harmful effect on gingivitis scores, with each
increase in the number of times soft drinks were consumed per week leading to 1.007
times (95% CI = 0.989 – 0.997) poorer gingivitis score. Water, milk, diet soft drink, fruit
juices, fruit-flavoured beverage, vegetable juice and alcohol consumption were not
significant predictors of gingivitis score.
Although not significant, a slight pattern can be observed regarding the
association between water consumption and gingival health. Based on the graph below,
those who did not consume water on a daily basis had the worst periodontal health scores
compared to other consumption groups, and consuming water once per day was the
second more detrimental in terms of gingivitis scores. Therefore, it can be observed that
as participants increased their daily water consumption, their gingivitis score improved,
although once respondents consumed water at least twice per day, the effect seemed to
level off.
Figure 26. Effect of Water Consumption on Periodontal Health

83
For the most part, periodontal health did not seem to be related to milk
consumption, and it was not significant in the main effects model. However, participants
in the 4 times consuming milk per day group had much lower scores than other
consumption groups. This may be suggestive of a threshold effect, where consuming
milk more than 3 times per day has a harmful effect on the gingiva.
Figure 27. Effect of Milk Consumption on Periodontal Health
A somewhat linear association was exhibited between regular soft drink
consumption and gingivitis scores. Those participants that did not consume soft drinks
had the best probing scores on average. As frequency of consumption of soft drinks
17.6 18.7 19.5 19.6 19.5
0
5
10
15
20
25
0 1 2 3 4+ M
ean
Gin
givi
tis S
core
Water Consumption (times per day)
19.4 19.3 19.8 19.1 17.5
0
5
10
15
20
25
0 1 2 3 4+
Mea
n G
ingi
vitis
Sco
re
Milk Consumption (times per day)

84
increased, periodontal health decreased: the highest regular soft drink consumption group
(7 or more times per week) had the worst gingival health. Therefore, the data from
CHMS suggests that consuming any regular soft drinks can have a detrimental effect on
one’s gingival health, with more frequent consumption being linked to worse periodontal
health.
Figure 28. Effect of Regular Soft Drink Consumption on Periodontal Health
Only two of the level contrasts for age were found to be significant; compared to
the 12-15 year old age group, 20-24 year olds had a gingivitis score 1.076 times poorer
(95% CI = 0.891 – 0.957) and the gingivitis score of 25-30 year olds was 1.074 times
poorer (95% CI = 0.887 – 0.967).
Table 10. Correlates o Periodontal Health, Main Effects Model, Poisson Regression
(n=1534)
20.0 19.7 19.1 18.6 17.8
0
5
10
15
20
25
0 <1 1-4 4-7 7+
Mea
n G
ingi
vitis
Sco
re
Regular Soft Drink Consumption (times per week)

85
Variable IRR 95% CI p-value Water 1.000 0.999 – 1.001 0.974 Milk 1.000 0.999 – 1.001 0.912 Regular Soft Drinks 0.993 0.989 – 0.997 0.001 Diet Soft Drinks 1.000 0.997 – 1.004 0.821 Sports Drinks 1.004 0.998 – 1.009 0.211 Fruit Juices 1.000 0.998 – 1.001 0.579 Fruit-Flavoured Drinks 0.998 0.995 – 1.000 0.062 Vegetable Juices 1.000 0.996 – 1.005 0.879 Alcohol 1.000 0.997 – 1.002 0.857 Age 0.002 12-15 vs 16-19 0.984 0.962 – 1.006 0.159 12-15 vs 20-24 0.924 0.891 – 0.957 <0.001 12-15 vs 25-30 0.926 0.887 – 0.967 0.001 16-19 vs 20-24 0.959 0.910 – 1.011 0.122 16-19 vs 25-30 0.976 0.930 – 1.024 0.328 20-24 vs 25-30 1.018 0.961 – 1.079 0.544 Sex 0.989 0.968 – 1.010 0.295 Education 0.918 < Post-Secondary vs Other Post-Secondary
1.028 0.990 – 1.068 0.152
< Post-Secondary vs Post-Secondary Grad
1.022 0.991 – 1.053 0.161
< Post-Secondary vs Not Stated 1.026 0.972 – 1.084 0.354 Other Post-Secondary vs Post-Secondary Grad
1.015 0.980 – 1.051 0.407
Other Post-Secondary vs Not Stated
1.013 0.914 – 1.122 0.806
Post-Secondary Grad vs Not Stated
0.998 0.900 – 1.108 0.972
Income 0.184 Lowest income vs Middle income 1.059 0.998 – 1.124 0.058 Lowest income vs Upper middle income
1.063 0.992 – 1.138 0.083
Lowest income vs Highest income 1.082 1.014 – 1.154 0.018 Lowest income vs Not stated 1.077 1.007 – 1.151 0.030 Middle income vs Upper middle income
1.013 0.970 – 1.058 0.558
Middle income vs Highest income 1.022 0.979 – 1.069 0.316 Middle income vs Not stated 1.006 0.961 – 1.053 0.797 Upper middle income vs Highest income
1.010 0.981 – 1.039 0.519
Upper middle income vs Not stated 0.993 0.949 – 1.039 0.762 Highest income vs Not stated 0.984 0.943 – 1.026 0.437 Smoking Habits 0.727 Current smoker vs Former smoker 1.039 0.965 – 1.119 0.306 Current smoker vs Never smoked 1.056 1.014 – 1.099 0.009 Former smoker vs Never smoked 0.959 0.900 – 1.022 0.194 Frequency of dental care 0.176 Never vs Emergency 1.026 0.915 – 1.150 0.664 Never vs < Once per Year 1.103 1.000 – 1.216 0.050 Never vs Once per Year 1.106 1.002 – 1.222 0.045 Never vs > Once per Year 1.103 0.996 – 1.221 0.060 Emergency vs < Once per Year 1.034 0.953 – 1.122 0.425 Emergency vs Once per Year 1.026 0.938 – 1.121 0.577 Emergency vs > Once per Year 1.019 0.937 – 1.108 0.663 < Once per Year vs Once per Year 0.992 0.945 – 1.041 0.740 < Once per Year vs > Once per Year 0.985 0.938 – 1.035 0.556 Once per year vs > Once per Year 0.993 0.974 – 1.013 0.512 Brushing Teeth 1.000 0.998 – 1.002 0.750

86
Flossing Teeth 1.000 0.998 – 1.003 0.958 Dairy Consumption 1.000 0.998 – 1.002 0.699 Fibre Consumption 1.001 1.000 – 1.002 0.057
Sugary Beverage Index Model- Periodontal Health
In the sugary beverage consumption index model, milk was associated with
gingival health. Results are given in Table 11 below. Milk was found to improve
gingivitis scores 1.003 times (95% CI = 1.001 – 1.005) for every increase in the number
of times milk was drank per week. The interaction between milk and sugary beverages
was also significant (IRR = 1.000; 95% CI = 0.998 – 1.000), and will be discussed further
below. Water, diet soft drink, vegetable juice and sugary beverage consumption were not
significant, and neither was the interaction between water and sugary beverage
consumption.
In accordance with the fact sugary beverage consumption was not found to have a
significant effect on gingival health, further investigation of mean gingival score by
sugary beverage consumption group showed no distinct pattern. Those participants that
did not consume sugary beverages had lower average gingivitis scores than the rest of the
consumption groups, suggesting that any consumption of sugary beverages may
positively affect periodontal health; however, the large confidence interval for the lowest
consumption group does not support this suggestion.
Figure 29. Effect of Sugary Beverage Consumption on Periodontal Health
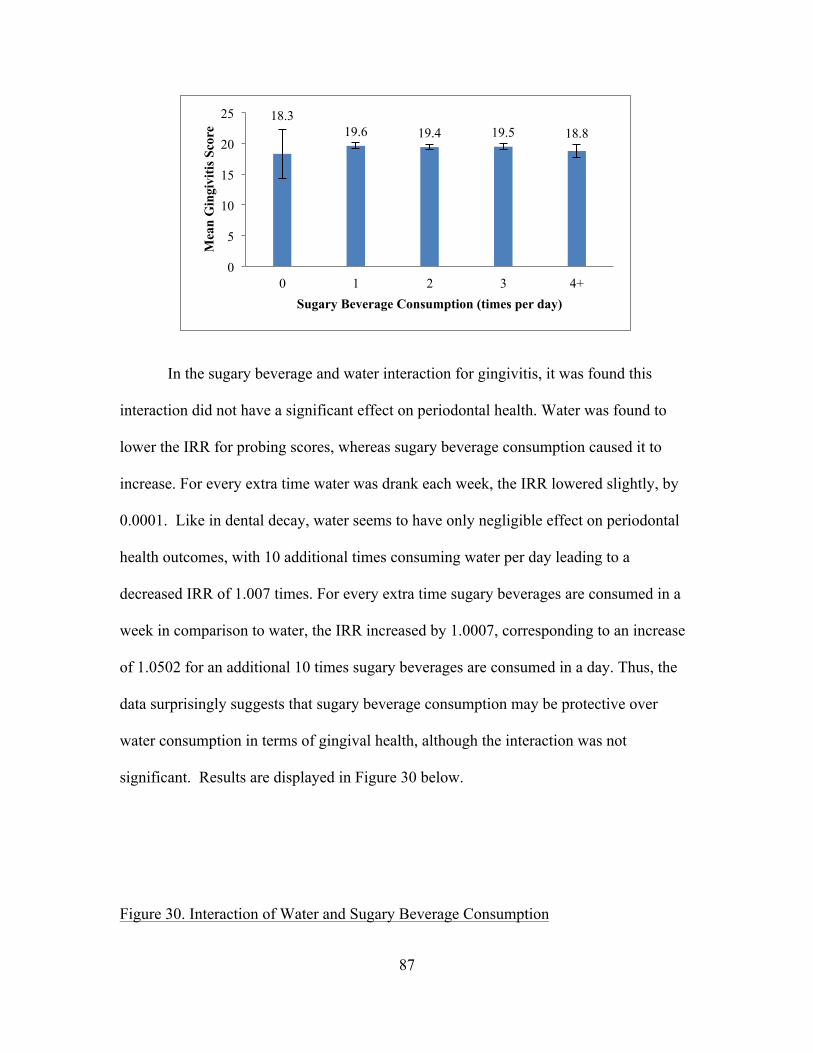
87
In the sugary beverage and water interaction for gingivitis, it was found this
interaction did not have a significant effect on periodontal health. Water was found to
lower the IRR for probing scores, whereas sugary beverage consumption caused it to
increase. For every extra time water was drank each week, the IRR lowered slightly, by
0.0001. Like in dental decay, water seems to have only negligible effect on periodontal
health outcomes, with 10 additional times consuming water per day leading to a
decreased IRR of 1.007 times. For every extra time sugary beverages are consumed in a
week in comparison to water, the IRR increased by 1.0007, corresponding to an increase
of 1.0502 for an additional 10 times sugary beverages are consumed in a day. Thus, the
data surprisingly suggests that sugary beverage consumption may be protective over
water consumption in terms of gingival health, although the interaction was not
significant. Results are displayed in Figure 30 below.
Figure 30. Interaction of Water and Sugary Beverage Consumption
18.3 19.6 19.4 19.5 18.8
0
5
10
15
20
25
0 1 2 3 4+
Mea
n G
ingi
vitis
Sco
re
Sugary Beverage Consumption (times per day)
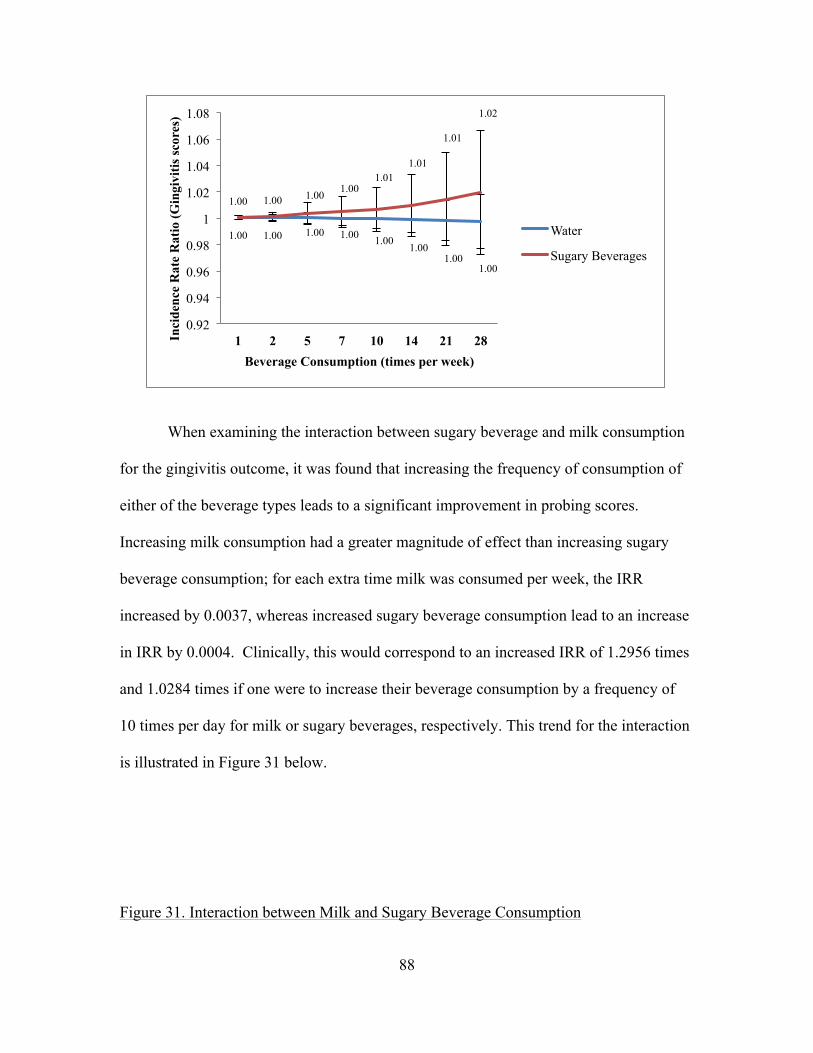
88
When examining the interaction between sugary beverage and milk consumption
for the gingivitis outcome, it was found that increasing the frequency of consumption of
either of the beverage types leads to a significant improvement in probing scores.
Increasing milk consumption had a greater magnitude of effect than increasing sugary
beverage consumption; for each extra time milk was consumed per week, the IRR
increased by 0.0037, whereas increased sugary beverage consumption lead to an increase
in IRR by 0.0004. Clinically, this would correspond to an increased IRR of 1.2956 times
and 1.0284 times if one were to increase their beverage consumption by a frequency of
10 times per day for milk or sugary beverages, respectively. This trend for the interaction
is illustrated in Figure 31 below.
Figure 31. Interaction between Milk and Sugary Beverage Consumption
1.00 1.00 1.00 1.00 1.00 1.00
1.00 1.00
1.00 1.00 1.00 1.00 1.01
1.01
1.01
1.02
0.92
0.94
0.96
0.98
1
1.02
1.04
1.06
1.08
1 2 5 7 10 14 21 28 Inci
denc
e R
ate
Rat
io (G
ingi
vitis
scor
es)
Beverage Consumption (times per week)
Water
Sugary Beverages

89
Age, specifically the contrast between ages 12-15 and ages 20-24 as well as
between ages 12-15 and ages 25-30, was again significant to gingival health, with higher
age being associated with worse gingivitis scores (IRR = 0.933 (95% CI = 0.902 – 0.965)
and IRR = 0.934 (95% CI = 0.894 – 0.977), respectively). Fibre also had an impact on
gingival health in the sugary beverage model, with each extra time consuming fibre in a
week leading to a gingivitis score 1.001 times higher (95% CI = 1.000 – 1.002).
Table 11. Correlates of Periodontal Health, Sugary Beverage Index Model, Poisson
Regression (n=1534)
Variable IRR 95% CI p-value Water 0.999 0.998 – 1.000 0.194 Milk 1.003 1.001 – 1.005 0.009 Sugary Beverage Consumption Index 0.999 0.998 – 1.000 0.081 Diet Soft Drinks 1.001 0.997 – 1.005 0.599 Vegetable Juices 1.001 0.996 – 1.006 0.689 Milk and Sugary Beverage Interaction 1.000 0.998 – 1.000 <0.001 Water and Sugary Beverage Interaction 1.000 1.000 – 1.000 0.209 Age 0.002 12-15 vs 16-19 0.989 0.966 – 1.012 0.349 12-15 vs 20-24 0.933 0.902 – 0.965 <0.001 12-15 vs 25-30 0.934 0.894 – 0.977 0.003 16-19 vs 20-24 0.967 0.918 – 1.019 0.210 16-19 vs 25-30 0.982 0.937 – 1.031 0.483
1.00 1.01 1.02 1.03 1.04 1.05 1.08 1.11
1.00 1.00 1.01 1.01 1.01 1.01 1.01 1.02
0
0.2
0.4
0.6
0.8
1
1.2
1.4
1 2 5 7 10 14 21 28
Inci
denc
e R
ate
Rat
io (G
ingi
vitis
scor
e)
Beverage Consumption (times per week)
Milk
Sugary Beverages

90
20-24 vs 25-30 1.016 0.953 – 1.084 0.624 Sex 0.988 0.966 – 1.010 0.279 Education 0.888 < Post-Secondary vs Other Post-Secondary
1.027 0.990 – 1.065 0.161
< Post-Secondary vs Post-Secondary Grad
1.024 0.993 – 1.056 0.127
< Post-Secondary vs Not Stated 1.035 0.985 – 1.088 0.171 Other Post-Secondary vs Post-Secondary Grad
1.016 0.978 – 1.055 0.420
Other Post-Secondary vs Not Stated
1.026 0.927 – 1.135 0.626
Post-Secondary Grad vs Not Stated
1.010 0.910 – 1.120 0.857
Income 0.072 Lowest income vs Middle income 1.052 0.996 – 1.113 0.069 Lowest income vs Upper middle income
1.057 0.998 – 1.132 0.109
Lowest income vs Highest income 1.079 1.012 – 1.151 0.019 Lowest income vs Not stated 1.073 1.006 – 1.114 0.033 Middle income vs Upper middle income
1.015 0.971 – 1.061 0.505
Middle income vs Highest income 1.028 0.980-1.077 0.258 Middle income vs Not stated 1.009 0.962 – 1.058 0.723 Upper middle income vs Highest income
1.012 0.983 – 1.042 0.411
Upper middle income vs Not stated 0.994 0.949 – 1.041 0.784 Highest income vs Not stated 0.982 0.940 – 1.025 0.398 Smoking Habits 0.703 Current smoker vs Former smoker 1.042 0.974 – 1.113 0.232 Current smoker vs Never smoked 1.059 1.018 – 1.101 0.004 Former smoker vs Never smoked 0.958 0.901 – 1.019 0.176 Frequency of dental care 0.052 Never vs Emergency 1.012 0.900 – 1.137 0.847 Never vs < Once per Year 1.103 0.997 – 1.220 0.058 Never vs Once per Year 1.109 1.002 – 1.229 0.046 Never vs > Once per Year 1.104 0.994 – 1.226 0.066 Emergency vs < Once per Year 1.047 0.966 – 1.136 0.264 Emergency vs Once per Year 1.042 0.952 – 1.141 0.376 Emergency vs > Once per Year 1.032 0.947 – 1.125 0.469 < Once per Year vs Once per Year 0.995 0.946 – 1.046 0.837 < Once per Year vs > Once per Year 0.986 0.936 – 1.037 0.576 Once per year vs > Once per Year 0.991 0.972 – 1.010 0.350 Brushing Teeth 1.000 0.998 – 1.002 0.844 Flossing Teeth 1.000 0.997 – 1.002 0.869 Dairy Consumption 1.000 0.998 – 1.002 0.730 Fibre Consumption 1.001 1.000 – 1.002 0.007
Acidic Beverage Index Model – Periodontal Health
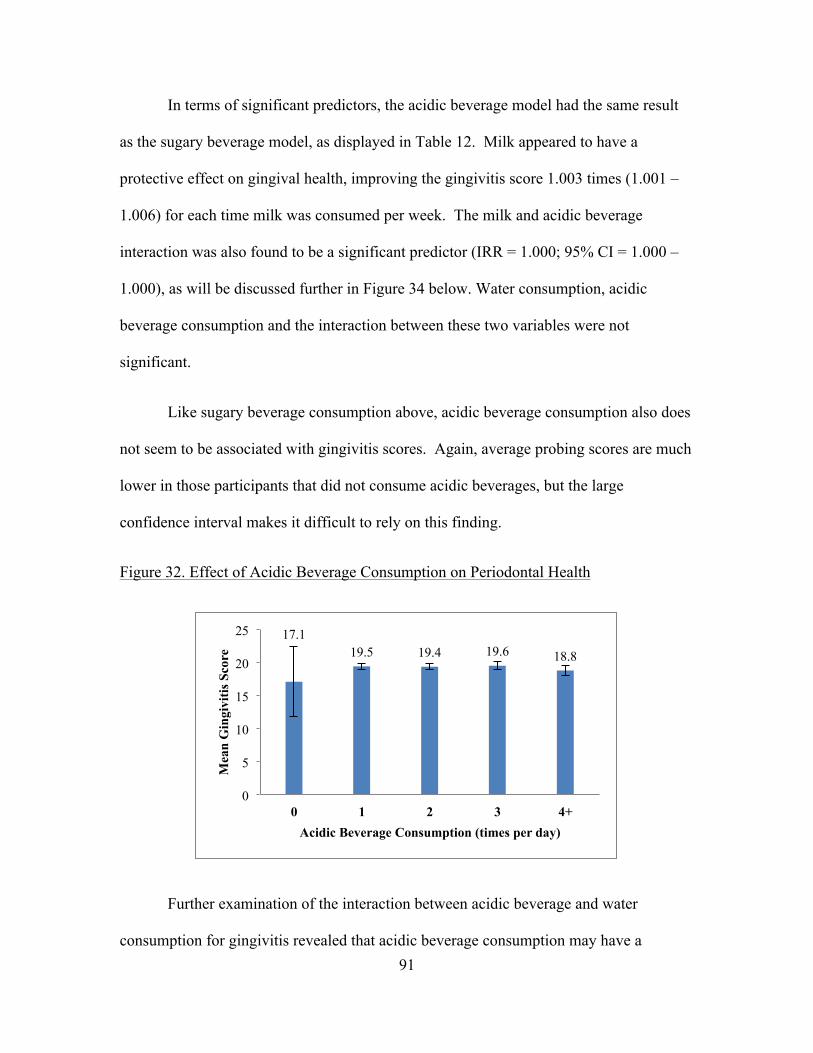
91
In terms of significant predictors, the acidic beverage model had the same result
as the sugary beverage model, as displayed in Table 12. Milk appeared to have a
protective effect on gingival health, improving the gingivitis score 1.003 times (1.001 –
1.006) for each time milk was consumed per week. The milk and acidic beverage
interaction was also found to be a significant predictor (IRR = 1.000; 95% CI = 1.000 –
1.000), as will be discussed further in Figure 34 below. Water consumption, acidic
beverage consumption and the interaction between these two variables were not
significant.
Like sugary beverage consumption above, acidic beverage consumption also does
not seem to be associated with gingivitis scores. Again, average probing scores are much
lower in those participants that did not consume acidic beverages, but the large
confidence interval makes it difficult to rely on this finding.
Figure 32. Effect of Acidic Beverage Consumption on Periodontal Health
Further examination of the interaction between acidic beverage and water
consumption for gingivitis revealed that acidic beverage consumption may have a
17.1 19.5 19.4 19.6 18.8
0
5
10
15
20
25
0 1 2 3 4+
Mea
n G
ingi
vitis
Sco
re
Acidic Beverage Consumption (times per day)

92
protective effect on water consumption; however this effect was not statistically
significant. For each increase in number of acidic beverages consumed per week, the
IRR increased by 1.0010, with water consumption being held constant at a consumption
frequency of once per week. If acidic beverage consumption were to be increased by 10
times per day, this would lead to an increased IRR of 1.0725 times. When holding acidic
beverage consumption constant, water lowered the IRR for gingivitis by 1.0001 for each
extra time water was consumed, or lowered the IRR by 1.0070 for every 10 times
consuming water in a day. These results are shown in Figure 33 below.
Figure 33. Interaction between Water and Acidic Beverage Consumption
The interaction between acidic beverages and milk had a synergistic and
significant effect, with both beverages raising incidence rate ratios for gingival health.
The effect of milk was of a larger magnitude, raising the IRR by 0.0044 for each extra
time consuming milk when acidic beverage consumption was held constant. This is a
relatively large effect, and for each 10 additional times milk was consumed per day, the
1.00 1.00 1.00 1.00 1.00 1.00 1.00 1.00
1.00 1.00 1.00 1.01 1.01
1.01
1.02
1.03
0.92
0.94
0.96
0.98
1
1.02
1.04
1.06
1.08
1.1
1 2 5 7 10 14 21 28
Inci
denc
e R
ate
Rat
io (G
ingi
vitis
sc
ores
)
Beverage Consumption (times per week)
Water
Acidic Beverages

93
IRR would increase by 0.3607. Acidic beverages raised the IRR by 0.0007 for each extra
drink consumed in a week, or raised the IRR by 1.0502 for each additional 10 times
acidic beverages were consumed in a day. These results are displayed in the Figure 34.
Figure 34. Interaction between Milk and Acidic Beverage Consumption
Age was again significant, with the 12-15 year old age group having a 1.067 times
(95% CI = 0.902 – 0.965) higher gingivitis score than the 20-24 year olds and 1.064
times (95% CI = 0.897 – 0.976) higher score than 25-30 year olds. Fibre consumption
was also associated with gingival health, with each increase in frequency of fibre
consumption per week leading to a 1.001 times (95% CI = 1.000 – 1.002) improvement
in gingivitis scores.
Table 12. Correlates of Periodontal Health, Acidic Beverage Index Model, Poisson
Regression (n=1534)
1.01 1.01 1.02 1.03 1.04 1.06 1.09
1.13
1.01 1.01 1.01 1.01 1.01 1.01 1.02 1.03
0
0.2
0.4
0.6
0.8
1
1.2
1.4
1 2 5 7 10 14 21 28
Inci
denc
e R
ate
Rat
io (G
ingi
vitis
Sco
res)
Beverage Consumption (times per week)
Milk
Acidic Beverages
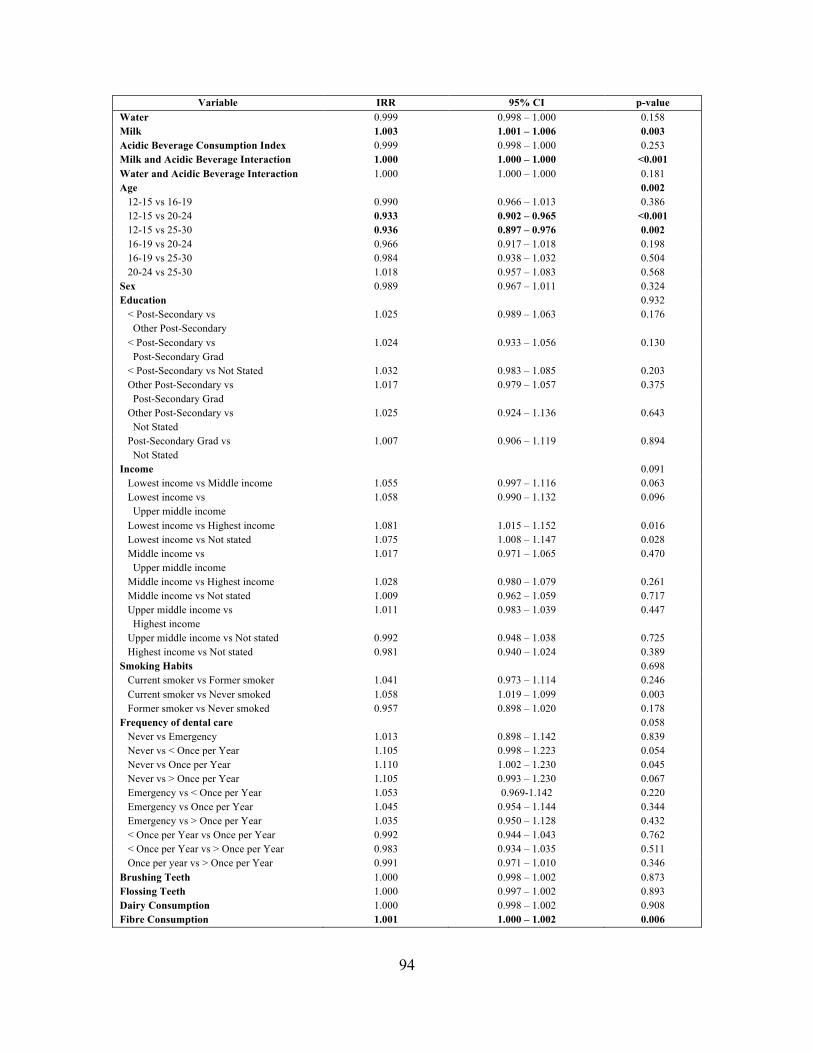
94
Variable IRR 95% CI p-value Water 0.999 0.998 – 1.000 0.158 Milk 1.003 1.001 – 1.006 0.003 Acidic Beverage Consumption Index 0.999 0.998 – 1.000 0.253 Milk and Acidic Beverage Interaction 1.000 1.000 – 1.000 <0.001 Water and Acidic Beverage Interaction 1.000 1.000 – 1.000 0.181 Age 0.002 12-15 vs 16-19 0.990 0.966 – 1.013 0.386 12-15 vs 20-24 0.933 0.902 – 0.965 <0.001 12-15 vs 25-30 0.936 0.897 – 0.976 0.002 16-19 vs 20-24 0.966 0.917 – 1.018 0.198 16-19 vs 25-30 0.984 0.938 – 1.032 0.504 20-24 vs 25-30 1.018 0.957 – 1.083 0.568 Sex 0.989 0.967 – 1.011 0.324 Education 0.932 < Post-Secondary vs Other Post-Secondary
1.025 0.989 – 1.063 0.176
< Post-Secondary vs Post-Secondary Grad
1.024 0.933 – 1.056 0.130
< Post-Secondary vs Not Stated 1.032 0.983 – 1.085 0.203 Other Post-Secondary vs Post-Secondary Grad
1.017 0.979 – 1.057 0.375
Other Post-Secondary vs Not Stated
1.025 0.924 – 1.136 0.643
Post-Secondary Grad vs Not Stated
1.007 0.906 – 1.119 0.894
Income 0.091 Lowest income vs Middle income 1.055 0.997 – 1.116 0.063 Lowest income vs Upper middle income
1.058 0.990 – 1.132 0.096
Lowest income vs Highest income 1.081 1.015 – 1.152 0.016 Lowest income vs Not stated 1.075 1.008 – 1.147 0.028 Middle income vs Upper middle income
1.017 0.971 – 1.065 0.470
Middle income vs Highest income 1.028 0.980 – 1.079 0.261 Middle income vs Not stated 1.009 0.962 – 1.059 0.717 Upper middle income vs Highest income
1.011 0.983 – 1.039 0.447
Upper middle income vs Not stated 0.992 0.948 – 1.038 0.725 Highest income vs Not stated 0.981 0.940 – 1.024 0.389 Smoking Habits 0.698 Current smoker vs Former smoker 1.041 0.973 – 1.114 0.246 Current smoker vs Never smoked 1.058 1.019 – 1.099 0.003 Former smoker vs Never smoked 0.957 0.898 – 1.020 0.178 Frequency of dental care 0.058 Never vs Emergency 1.013 0.898 – 1.142 0.839 Never vs < Once per Year 1.105 0.998 – 1.223 0.054 Never vs Once per Year 1.110 1.002 – 1.230 0.045 Never vs > Once per Year 1.105 0.993 – 1.230 0.067 Emergency vs < Once per Year 1.053 0.969-1.142 0.220 Emergency vs Once per Year 1.045 0.954 – 1.144 0.344 Emergency vs > Once per Year 1.035 0.950 – 1.128 0.432 < Once per Year vs Once per Year 0.992 0.944 – 1.043 0.762 < Once per Year vs > Once per Year 0.983 0.934 – 1.035 0.511 Once per year vs > Once per Year 0.991 0.971 – 1.010 0.346 Brushing Teeth 1.000 0.998 – 1.002 0.873 Flossing Teeth 1.000 0.997 – 1.002 0.893 Dairy Consumption 1.000 0.998 – 1.002 0.908 Fibre Consumption 1.001 1.000 – 1.002 0.006

95
Main Effects Model – Self-Rated Oral Health
The third set of models focused on the participants’ self-rated oral health (SROH).
In the main effects model, water consumption, regular soft drink consumption, income
and frequency of visiting a dental professional were found to be associated with SROH.
These results are displayed in Table 13 below. Water consumption had a positive impact
on SROH, with every increase in the number of times water was consumed on a weekly
basis leading to 1.009 (95% CI = 1.002 – 1.017) times better SROH. Regular soft drinks,
on the other hand, had a detrimental effect in this model, lowering the SROH 1.059 times
(95% CI = 0.916 – 0.968) for every extra time a regular soft drink was consumed each
week. Milk, diet soft drink, fruit juice, fruit-flavoured beverage, sports drink, vegetable
juice and alcohol consumption were not significant in this model.
A distinct trend in the association between water consumption and self-rated oral
health was shown in the CHMS data. Water consumption had a positive effect on
average self-perceived oral health scores, and as water consumption increased, the
participants’ oral health was self-reported in a more positive manner.
Figure 35. Effect of Water Consumption on Self-Rated Oral Health

96
As seen in Figure 36 below, no clear trend was exhibited between milk
consumption and self-rated oral health. Those respondents who drank milk 3 times per
day had the best self-perceived oral health, and those that drank milk 4 or more times per
day have the worst self-rated oral health.
Figure 36. Effect of Milk Consumption on Self-Rated Oral Health
As displayed in Figure 37, regular soft drink consumption had a negative effect on
self-perceived oral health. As regular soft drink consumption increased, average self-
rated oral health scores generally went down. There was one exception to this trend, that
being between 1-4 and 4-7 soft drinks per week, although the average SROH scores in
3.0 3.5 3.5 3.5 3.7
0
1
2
3
4
5
0 1 2 3 4+
Mea
n Se
lf-R
ated
Ora
l Hea
lth
Scor
e
Water Consumption (times per day)
3.5 3.5 3.6 3.8
3.2
0
1
2
3
4
5
0 1 2 3 4+ Mea
n Se
lf-R
ated
Ora
l Hea
lth
Scor
e
Milk Consumption (times per day)

97
this category were only 0.01 points different. As of interest is the rather large difference
in average SROH scores between 4-7 times per week and 7 or more times per week.
Figure 37. Effect of Regular Soft Drink Consumption on Self-Rated Oral Health
In addition to beverage variables, the highest income category was found to be
significantly different from the other three income levels, specifically lowest income
(IRR = 2.415; 95% CI = 1.045 – 5.582), middle income (IRR = 1.988; 95% CI = 1.497 –
2.639), and upper middle income (IRR = 1.506; 95% CI = 1.084 – 2.091). This finding
suggests that those respondents in the highest income group generally had better SROH,
and the level of SROH was proportionate to one’s income level. All other income level
contrasts were not significant. Finally, visiting a dental professional was also associated
with SROH. Visiting a dental professional once per year as opposed to on an emergency
basis lead to 2.620 times (95% CI = 1.223 – 5.616) better SROH, and yearly visits, in
contrast with less than yearly visits to a dental professional, were linked to 1.738 times
(95% CI = 1.095 – 2.757) higher SROH. Visiting a dental professional more than once
per year was associated with 3.287 times (95% CI = 1.676 – 6.450) better SROH than
3.8 3.7 3.4 3.4
2.8
0 0.5
1 1.5
2 2.5
3 3.5
4 4.5
0 <1 1-4 4-7 7+ Mea
n Se
lf-R
ated
Ora
l Hea
lth
Scor
e
Regular Soft Drink Consumption (times per week)
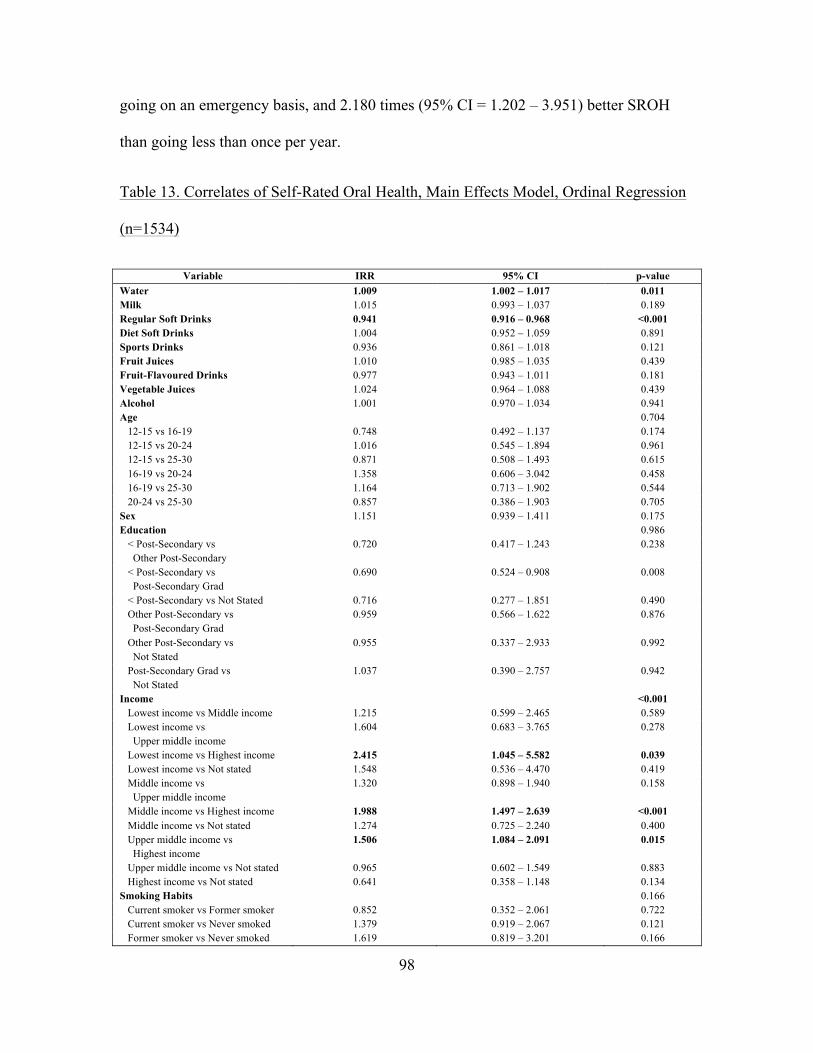
98
going on an emergency basis, and 2.180 times (95% CI = 1.202 – 3.951) better SROH
than going less than once per year.
Table 13. Correlates of Self-Rated Oral Health, Main Effects Model, Ordinal Regression
(n=1534)
Variable IRR 95% CI p-value Water 1.009 1.002 – 1.017 0.011 Milk 1.015 0.993 – 1.037 0.189 Regular Soft Drinks 0.941 0.916 – 0.968 <0.001 Diet Soft Drinks 1.004 0.952 – 1.059 0.891 Sports Drinks 0.936 0.861 – 1.018 0.121 Fruit Juices 1.010 0.985 – 1.035 0.439 Fruit-Flavoured Drinks 0.977 0.943 – 1.011 0.181 Vegetable Juices 1.024 0.964 – 1.088 0.439 Alcohol 1.001 0.970 – 1.034 0.941 Age 0.704 12-15 vs 16-19 0.748 0.492 – 1.137 0.174 12-15 vs 20-24 1.016 0.545 – 1.894 0.961 12-15 vs 25-30 0.871 0.508 – 1.493 0.615 16-19 vs 20-24 1.358 0.606 – 3.042 0.458 16-19 vs 25-30 1.164 0.713 – 1.902 0.544 20-24 vs 25-30 0.857 0.386 – 1.903 0.705 Sex 1.151 0.939 – 1.411 0.175 Education 0.986 < Post-Secondary vs Other Post-Secondary
0.720 0.417 – 1.243 0.238
< Post-Secondary vs Post-Secondary Grad
0.690 0.524 – 0.908 0.008
< Post-Secondary vs Not Stated 0.716 0.277 – 1.851 0.490 Other Post-Secondary vs Post-Secondary Grad
0.959 0.566 – 1.622 0.876
Other Post-Secondary vs Not Stated
0.955 0.337 – 2.933 0.992
Post-Secondary Grad vs Not Stated
1.037 0.390 – 2.757 0.942
Income <0.001 Lowest income vs Middle income 1.215 0.599 – 2.465 0.589 Lowest income vs Upper middle income
1.604 0.683 – 3.765 0.278
Lowest income vs Highest income 2.415 1.045 – 5.582 0.039 Lowest income vs Not stated 1.548 0.536 – 4.470 0.419 Middle income vs Upper middle income
1.320 0.898 – 1.940 0.158
Middle income vs Highest income 1.988 1.497 – 2.639 <0.001 Middle income vs Not stated 1.274 0.725 – 2.240 0.400 Upper middle income vs Highest income
1.506 1.084 – 2.091 0.015
Upper middle income vs Not stated 0.965 0.602 – 1.549 0.883 Highest income vs Not stated 0.641 0.358 – 1.148 0.134 Smoking Habits 0.166 Current smoker vs Former smoker 0.852 0.352 – 2.061 0.722 Current smoker vs Never smoked 1.379 0.919 – 2.067 0.121 Former smoker vs Never smoked 1.619 0.819 – 3.201 0.166
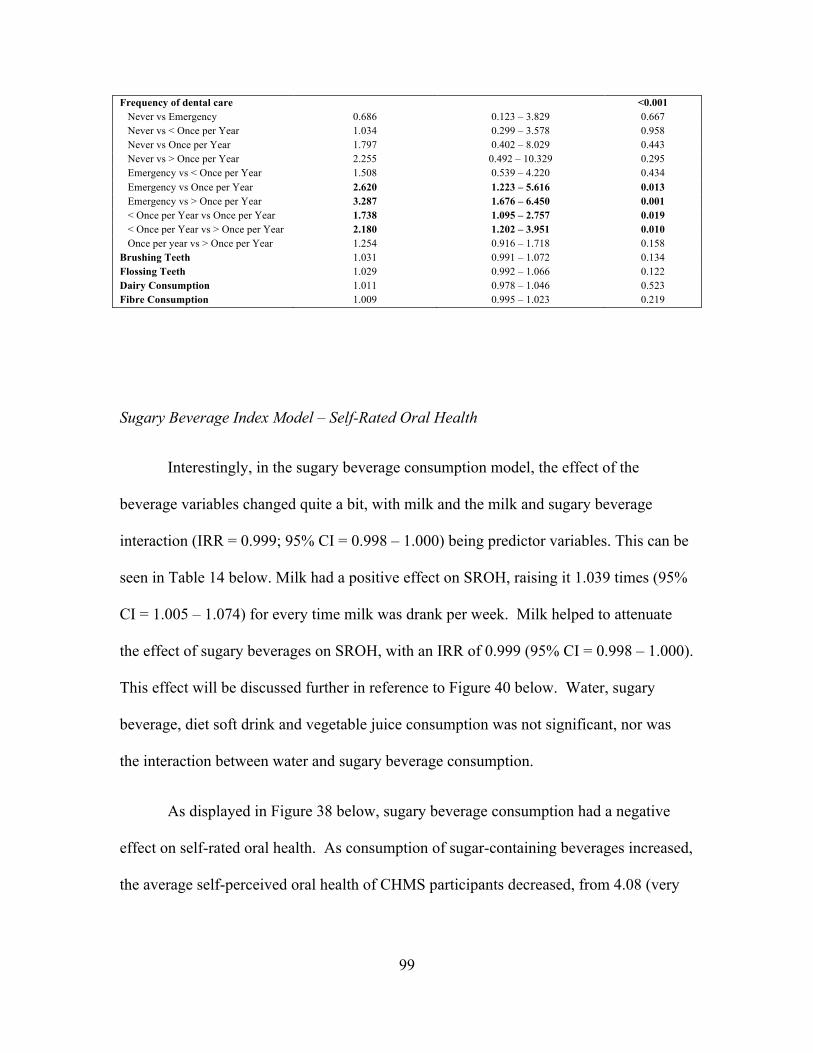
99
Frequency of dental care <0.001 Never vs Emergency 0.686 0.123 – 3.829 0.667 Never vs < Once per Year 1.034 0.299 – 3.578 0.958 Never vs Once per Year 1.797 0.402 – 8.029 0.443 Never vs > Once per Year 2.255 0.492 – 10.329 0.295 Emergency vs < Once per Year 1.508 0.539 – 4.220 0.434 Emergency vs Once per Year 2.620 1.223 – 5.616 0.013 Emergency vs > Once per Year 3.287 1.676 – 6.450 0.001 < Once per Year vs Once per Year 1.738 1.095 – 2.757 0.019 < Once per Year vs > Once per Year 2.180 1.202 – 3.951 0.010 Once per year vs > Once per Year 1.254 0.916 – 1.718 0.158 Brushing Teeth 1.031 0.991 – 1.072 0.134 Flossing Teeth 1.029 0.992 – 1.066 0.122 Dairy Consumption 1.011 0.978 – 1.046 0.523 Fibre Consumption 1.009 0.995 – 1.023 0.219
Sugary Beverage Index Model – Self-Rated Oral Health
Interestingly, in the sugary beverage consumption model, the effect of the
beverage variables changed quite a bit, with milk and the milk and sugary beverage
interaction (IRR = 0.999; 95% CI = 0.998 – 1.000) being predictor variables. This can be
seen in Table 14 below. Milk had a positive effect on SROH, raising it 1.039 times (95%
CI = 1.005 – 1.074) for every time milk was drank per week. Milk helped to attenuate
the effect of sugary beverages on SROH, with an IRR of 0.999 (95% CI = 0.998 – 1.000).
This effect will be discussed further in reference to Figure 40 below. Water, sugary
beverage, diet soft drink and vegetable juice consumption was not significant, nor was
the interaction between water and sugary beverage consumption.
As displayed in Figure 38 below, sugary beverage consumption had a negative
effect on self-rated oral health. As consumption of sugar-containing beverages increased,
the average self-perceived oral health of CHMS participants decreased, from 4.08 (very

100
good) in those that did not consume sugary beverages, to 3.18 (good) for respondents
consuming 4 or more sugary beverages per day.
Figure 38. Effect of Sugary Beverage Consumption on Self-Rated Oral Health
In examining the sugary beverage and water interaction, it was found that water
has a slight protective effect over sugary beverage consumption for SROH. However, this
effect was not significant so overall there appears to be no effect of the interaction
between water and sugary beverage interaction in SROH. Each extra time water was
consumed in a week raised the IRR by 0.0032 when sugary beverage consumption was
held constant at 1 time per week. This effect is positive, but so minimal that to improve
SROH score by one unit, an individual would have to consume water almost 45 more
times per day. Sugary beverage consumption had a detrimental effect on SROH, lowering
the IRR by 0.0106 for each increase in frequency of consumption. Thus, increasing
sugary beverage consumption by 13.5 drinks per day would lower the SROH score by
one unit. Figure 39 displays these effects.
Figure 39. Interaction between Water and Sugary Beverage Consumption
4.
3.7 3.7 3.5 3.2
0
1
2
3
4
5
6
0 1 2 3 4+
Mea
n Se
lf-R
ated
Ora
l Hea
lth
Scor
e
Sugary Beverage Consumption (times per day)

101
Milk had a significant protective effect over sugary beverage consumption for
SROH. Investigation of the interaction term found that holding sugary beverage
consumption constant, each extra time milk was consumed per week raised the IRR by
0.0386. Thus, milk confers a much greater protective benefit than water over sugary
beverage consumption as it takes an increase of only 3.7 times drinking milk per day to
improve SROH by one unit as opposed to almost 45 times for water (additionally, the
milk and sugary beverage interaction was significant whereas the water and sugary
beverage interaction was not). On the other hand, sugary beverage consumption lowered
the IRR by 0.0149 when milk was held constant. Clinically, this translates to a unit
decrease in self-rated oral health for every 9.6 times sugary beverages were consumed per
day. Figure 40 below illustrates these results.
Figure 40. Interaction between Milk and Sugary Beverage Consumption
0.99 0.99 1.00 1.01 1.02 1.03
1.06 1.08
0.99 0.98
0.94 0.92
0.88 0.84
0.76
0.70
0
0.2
0.4
0.6
0.8
1
1.2
1.4
1 2 5 7 10 14 21 28
Inci
denc
e R
ate
Rat
io (S
RO
H)
Beverage Consumption (times per week)
Water
Sugary Beverages

102
As illustrated in Table 14, income and visiting a dental professional were again
associated with SROH. The same contrasts as in the main effects model were significant
for visiting a dental professional, specifically emergency vs. once per year (IRR = 2.763;
95% CI = 1.353 – 5.641), emergency vs. more than once per year (IRR = 0.496; 95% CI
= 1.865 – 6.552), less than once per year vs. once per year (IRR = 1.764; 95% CI = 1.142
– 2.724), and less than once per year vs. more than once per year (IRR = 2.232; 95% CI =
1.272 – 3.915). For income, the lowest income vs. highest income contrast was no longer
significant, but being in the highest income group was associated with rating your oral
health better than the middle (IRR = 1.953; 95% CI = 1.447 – 2.636) or upper middle
(IRR = 1.480; 95% CI = 1.072 – 2.043) income groups. Additionally, sex was found to
be significant in the sugary beverage model, with females having 1.215 times higher
SROH and thus perceive their oral health better than men (95% CI = 1.003-1.471).
Table 14. Correlates of Self-Rated Oral Health, Sugary Beverage Index Model, Ordinal
Regression (n=1534)
1.02 1.06 1.19
1.28 1.43
1.66
2.15
2.78
1.02 1.01 0.97 0.94 0.90 0.85 0.76 0.69 0 0.5
1 1.5
2 2.5
3 3.5
4 4.5
5
1 2 5 7 10 14 21 28
Inci
denc
e R
ate
Rat
io (S
RO
H)
Beverage Consumption (times per week)
Milk
Sugary Beverages

103
Variable IRR 95% CI p-value Water 1.003 0.994 – 1.012 0.530 Milk 1.039 1.005 – 1.074 0.023 Sugary Beverage Consumption Index 0.987 0.963 – 1.011 0.280 Diet Soft Drinks 1.006 0.958 – 1.057 0.805 Vegetable Juices 1.034 0.974 – 1.098 0.269 Milk and Sugary Beverage Interaction 0.999 0.998 – 1.000 0.037 Water and Sugary Beverage Interaction 1.000 1.000 – 1.001 0.084 Age 0.551 12-15 vs 16-19 0.802 0.529 – 1.215 0.297 12-15 vs 20-24 1.122 0.642 – 1.961 0.686 12-15 vs 25-30 0.972 0.578 – 1.633 0.914 16-19 vs 20-24 1.399 0.650 – 3.013 0.391 16-19 vs 25-30 1.212 0.789 – 1.860 0.380 20-24 vs 25-30 0.866 0.399 – 1.877 0.715 Sex 1.215 1.003 – 1.471 0.046 Education 0.980 < Post-Secondary vs Other Post-Secondary
0.733 0.420 – 1.279 0.274
< Post-Secondary vs Post-Secondary Grad
0.766 0.591 – 0.993 0.044
< Post-Secondary vs Not Stated 0.717 0.286 – 1.815 0.483 Other Post-Secondary vs Post-Secondary Grad
1.046 0.599 – 1.824 0.875
Other Post-Secondary vs Not Stated
0.979 0.334 – 2.867 0.969
Post-Secondary Grad vs Not Stated
0.936 0.358 – 2.447 0.893
Income <0.001 Lowest income vs Middle income 1.130 0.542 – 2.357 0.744 Lowest income vs Upper middle income
1.492 0.638 – 3.487 0.356
Lowest income vs Highest income 2.208 0.931 – 5.236 0.072 Lowest income vs Not stated 1.471 0.486 – 4.447 0.494 Middle income vs Upper middle income
1.320 0.929 – 1.876 0.122
Middle income vs Highest income 1.953 1.447 – 2.636 <0.001 Middle income vs Not stated 1.301 0.730 – 2.319 0.372 Upper middle income vs Highest income
1.480 1.072 – 2.043 0.017
Upper middle income vs Not stated 0.986 0.613 – 1.585 0.953 Highest income vs Not stated 0.666 0.380 – 1.167 0.156 Smoking Habits 0.163 Current smoker vs Former smoker 0.869 0.366 – 2.062 0.750 Current smoker vs Never smoked 1.407 0.963 – 2.054 0.077 Former smoker vs Never smoked 1.619 0.823 – 3.182 0.163 Frequency of dental care <0.001 Never vs Emergency 0.818 0.156 – 4.302 0.813 Never vs < Once per Year 1.282 0.382 – 4.306 0.688 Never vs Once per Year 2.261 0.521 – 9.803 0.276 Never vs > Once per Year 2.861 0.657 – 12.448 0.161 Emergency vs < Once per Year 1.566 0.597 – 4.108 0.362 Emergency vs Once per Year 2.763 1.353 – 5.641 0.005 Emergency vs > Once per Year 0.496 1.865 – 6.552 <0.001 < Once per Year vs Once per Year 1.764 1.142 – 2.724 0.011 < Once per Year vs > Once per Year 2.232 1.272 – 3.915 0.005 Once per year vs > Once per Year 1.265 0.923 – 1.735 0.144 Brushing Teeth 1.032 0.992 – 1.073 0.118 Flossing Teeth 1.2027 0.988 – 1.067 0.179 Dairy Consumption 1.013 0.981 – 1.047 0.432
104
Fibre Consumption 1.011 0.997 – 1.025 0.112
Acidic Beverage Index Model – Self-Rated Oral Health
In the acidic beverage consumption model shown in Table 15 below, the
significant predictor variables included milk consumption, the interaction between milk
and acidic beverage consumption, sex, income and frequency of dental care. As in the
sugary beverage model, milk again had a positive influence on SROH, increasing this
score 1.045 times (95% CI = 1.012 – 1.080) for each extra time milk was consumed per
week. The interaction between milk and acidic beverages (IRR = 0.999; 95% CI = 0.997
– 1.000) is further discussed below and displayed in Figure 43. Water consumption,
acidic beverage consumption and the interaction between the two were not significant
variables in this model.
Although not significant, acidic beverage consumption had a negative effect on
self-reported oral health. As weekly consumption of acidic beverages rose, average self-
rated oral health scores became lower. Those participants who did not regularly consume
acidic beverages had much higher scores than those who drank any amount of acidic
beverages. The middle consumption groups (1, 2 or 3 times per day) had similar self-
perceived oral health scores, although they decreased slightly as consumption increased.
Those participants who drank acidic beverages 4 or more times per day had the lowest
average self-rated oral health scores of any of the consumption groups.
Figure 41. Effect of Acidic Beverage Consumption on Self-Rated Oral Health

105
For the acidic beverage and water interaction for SROH, water was found to have
a protective but insignificant effect over acidic beverage consumption. An increase in
water consumption raised the IRR by 0.0034 when acidic beverage consumption was
held constant, and the IRR decreased by 0.0072 for each extra acidic beverage per week
when water consumption was held constant. This translates to an increase in one level of
SROH for every 42 times water was consumed per day, and a decrease for every 19.8
times acidic beverages were consumed. This is illustrated in Figure 42 below.
Figure 42. Interaction between Water and Acidic Beverage Consumption
4.6
3.7 3.6 3.6 3.2
0
1
2
3
4
5
6
0 1 2 3 4+ Mea
n Se
lf-R
ated
Ora
l Hea
lth
Scor
e
Acidic Beverage Consumption (times per day)

106
In the acidic beverage and milk interaction for SROH, milk was found to have a
significant and relatively strong protective effect. Each increase in the number of times
milk was consumed on a weekly basis raised the IRR for SROH by 0.0452 when acidic
beverage consumption was held constant. In clinically significant terms, a patient would
have to increase their milk consumption by 3.2 times per day to improve their SROH
scale by one unit. Holding milk constant, acidic beverages lowered the IRR by 0.0092 for
every extra time consumed per week, meaning one would have to consume acidic
beverages an additional 15.5 times per day to decrease their SROH by one unit. The
results of this analysis are illustrated in Figure 43.
Figure 43. Interaction between Milk and Acidic Beverage Consumption
1.00 1.00 1.01 1.02 1.03 1.04
1.07 1.10
1.00 0.99 0.97
0.95 0.93
0.91
0.86 0.82
0
0.2
0.4
0.6
0.8
1
1.2
1.4
1.6
1 2 5 7 10 14 21 28
Inci
denc
e R
ate
Rat
io (S
RO
H)
Beverage Consumption (times per week)
Water
Acidic Beverages

107
Females were found to have 1.227 times (95% CI = 1.008 – 1.493) better SROH
than males in the acidic beverage index model. In regards to income, the highest income
group was found to have a significantly different effect on SROH than being in the
middle income group or the upper middle income group, raising the SROH 1.946 times
(95% CI = 1.452 – 2.607) and 1.476 times (95% CI = 1.073 – 2.031) respectively.
Significant differences in SROH were also found between the frequencies of visiting a
dental professional; those who visited a dental professional once per year had 2.805 times
(95% CI = 1.398 = 5.628) better SROH than those who visited on an emergency basis
and 1.741 times (95% CI = 1.123 – 2.699) higher SROH than those who saw an oral
health care provider less than once per year. Compared to those who saw a dental
professional more than once per year, respondents who visited their provider only for
emergencies had 3.529 times (95% CI = 1.900 – 6.556) poorer SROH and those who
visited less than once per year had 2.191 times (95% CI = 1.246 – 3.850) worse SROH.
1.04 1.08 1.23
1.34 1.52
1.80
2.43
3.28
1.04 1.03 1.00 0.98 0.96 0.92 0.87 0.81 0
1
2
3
4
5
6
1 2 5 7 10 14 21 28
Inci
denc
e R
ate
Rat
io (S
RO
H)
Beverage Consumption (times per week)
Milk
Acidic Beverages

108
Table 15. Correlates of Self-Rated Oral Health, Acidic Beverage Index Model, Ordinal
Regression (n=1534)
Variable IRR 95% CI p-value Water 1.003 0.994 – 1.013 0.520 Milk 1.045 1.012 – 1.080 0.008 Acidic Beverage Consumption Index 0.993 0.971 – 1.014 0.498 Milk and Acidic Beverage Interaction 0.999 0.997 – 1.000 0.004 Water and Acidic Beverage Interaction 1.000 1.000 – 1.001 0.107 Age 0.522 12-15 vs 16-19 0.804 0.534 – 1.210 0.295 12-15 vs 20-24 1.114 0.631 – 1.967 0.709 12-15 vs 25-30 0.986 0.581 – 1.676 0.960 16-19 vs 20-24 1.387 0.637 – 3.019 0.410 16-19 vs 25-30 1.228 0.797 – 1.890 0.352 20-24 vs 25-30 0.885 0.392 – 2.000 0.769 Sex 1.227 1.008 – 1.493 0.041 Education 0.955 < Post-Secondary vs Other Post-Secondary
0.719 0.410 – 1.260 0.249
< Post-Secondary vs Post-Secondary Grad
0.771 0.586 – 1.014 0.062
< Post-Secondary vs Not Stated 0.702 0.277 – 1.778 0.456 Other Post-Secondary vs Post-Secondary Grad
1.072 0.618 – 1.861 0.804
Other Post-Secondary vs Not Stated
0.976 0.336 – 2.838 0.965
Post-Secondary Grad vs Not Stated
0.910 0.349 – 2.375 0.848
Income <0.001 Lowest income vs Middle income 1.146 0.553 – 2.376 0.713 Lowest income vs Upper middle income
1.511 0.648 – 3.524 0.339
Lowest income vs Highest income 2.231 0.947 – 5.253 0.066 Lowest income vs Not stated 1.491 0.504 – 4.406 0.470 Middle income vs Upper middle income
1.319 0.920 – 1.889 0.132
Middle income vs Highest income 1.946 1.452 – 2.607 <0.001 Middle income vs Not stated 1.300 0.732 – 2.310 0.370 Upper middle income vs Highest income
1.476 1.073 – 2.031 0.017
Upper middle income vs Not stated 0.987 0.626 – 1.556 0.954 Highest income vs Not stated 0.668 0.389 – 1.149 0.145 Smoking Habits 0.149 Current smoker vs Former smoker 0.860 0.366 – 2.020 0.730 Current smoker vs Never smoked 1.409 0.976 – 2.034 0.067 Former smoker vs Never smoked 1.637 0.838 – 3.198 0.149 Frequency of dental care <0.001 Never vs Emergency 0.816 0.157 – 4.240 0.809 Never vs < Once per Year 1.315 0.391 – 4.426 0.658 Never vs Once per Year 2.289 0.527 – 9.939 0.269 Never vs > Once per Year 2.881 0.658 – 12.609 0.160 Emergency vs < Once per Year 1.611 0.623 – 4.168 0.325 Emergency vs Once per Year 2.805 1.398 – 5.628 0.004 Emergency vs > Once per Year 3.529 1.900 – 6.556 <0.001 < Once per Year vs Once per Year 1.741 1.123 – 2.699 0.013 < Once per Year vs > Once per Year 2.191 1.246 – 3.850 0.006

109
Once per year vs > Once per Year 1.258 0.924 – 1.714 0.145 Brushing Teeth 1.032 0.992 – 1.073 0.117 Flossing Teeth 1.028 0.989 – 1.068 0.159 Dairy Consumption 1.016 0.983 – 1.049 0.347 Fibre Consumption 1.011 0.997 – 1.024 0.120
Main Effects Model – Oral Health Index
The final set of models examined the effect of the predictor variables on the Oral
Health Index (OHX). In the main effects model, regular soft drink consumption and age
were the only significant variables. This is shown in Table 16 below. Regular soft drinks
had a negative effect on OHX score, with each increase in number of times regular soft
drinks were consumed per week gave an OHX 1.007 times lower (95% CI = 0.989 –
0.997). The beverage variables that were not significant in this model included water,
milk, diet soft drinks, sports drinks, fruit juices, fruit-flavoured drinks, vegetable juices
and alcohol.
Based on the CHMS data, water consumption does not appear to have an effect on
the OHX provided a participant consumed water at least once per day. However, those
respondents who did not consume water on a daily basis had much lower average OHX
scores than other participants. This is shown in Figure 44 below.

110
Figure 44. Effect of Water Consumption on Overall Oral Health
For the most part, milk consumption did not appear to affect OHX score.
Although one group (1 time consuming milk per day) was slightly lower than the other
three groups, average OHX scores were relatively similar for all participants who
consumed milk less than 4 times per day. Those who did drink milk 4 or more times per
day had much lower OHX scores than other consumption groups.
Figure 45. Effect of Milk Consumption on Overall Oral Health
40.8 47.2 47.3 46.8 46.7
0
10
20
30
40
50
60
0 1 2 3 4+
Mea
n O
HX
Sco
re
Water Consumption (times per day)
48.6 46.2 48.2 48.2
42.9
0
10
20
30
40
50
60
0 1 2 3 4+
Mea
n O
HX
Sco
re
Milk Consumption (times per day)

111
Based on the CHMS data, a negative association existed between regular soft
drink consumption and OHX score. Interestingly, similar average OHX scores were
exhibited between the 0 and less than 1 times per week consumption groups, as well as
between the 1-4 and 4-7 drinks per week groups. Those participants who consumed
regular soft drinks 7 or more times per week had much lower average OHX scores than
other consumption groups.
Figure 46. Effect of Regular Soft Drink Consumption on Overall Oral Health
Additionally, three of the six age contrast variables were significant; 12-15 year
olds had OHX scores 1.076 times (95% CI = 0.891 – 0.957) higher than to 20-24 year
olds and 1.074 times (95% CI = 0.887 – 0.967) higher than 25-30 year olds, and
participants in the 20-24 age group had OHX scores 1.058 times (95% CI = 0.901 –
0.985) higher than 25-30 year olds.
48.5 48.0 45.8 45.2 40.7
0
10
20
30
40
50
60
0 <1 1-4 4-7 7+
Mea
n O
HX
Sco
re
Regular Soft Drink Consumption (times per week)

112
Table 16. Correlates of Oral Health Index, Main Effects Model, Poisson Regression
(n=1534)
Variable IRR 95% CI p-value Water 1.000 0.999 – 1.001 0.974 Milk 1.000 0.999 – 1.001 0.912 Regular Soft Drinks 0.993 0.989 – 0.997 0.001 Diet Soft Drinks 1.000 0.997 – 1.004 0.821 Sports Drinks 1.004 0.998 – 1.009 0.211 Fruit Juices 1.000 0.998 – 1.001 0.579 Fruit-Flavoured Drinks 0.998 0.995 – 1.000 0.062 Vegetable Juices 1.000 0.996 – 1.005 0.879 Alcohol 1.000 0.997 – 1.002 0.857 Age 0.002 12-15 vs 16-19 0.984 0.962 – 1.006 0.159 12-15 vs 20-24 0.924 0.891 – 0.957 <0.001 12-15 vs 25-30 0.926 0.887 – 0.967 0.001 16-19 vs 20-24 1.016 0.969 – 1.066 0.504 16-19 vs 25-30 0.982 0.923 – 1.045 0.568 20-24 vs 25-30 0.942 0.901 – 0.985 0.008 Sex 0.989 0.968 – 1.010 0.295 Education 0.918 < Post-Secondary vs Other Post-Secondary
1.028 0.990 – 1.068 0.152
< Post-Secondary vs Post-Secondary Grad
1.022 0.991 – 1.054 0.161
< Post-Secondary vs Not Stated 1.026 0.972 – 1.084 0.354 Other Post-Secondary vs Post-Secondary Grad
0.976 0.880 – 1.082 0.643
Other Post-Secondary vs Not Stated
0.993 0.893 – 1.103 0.894
Post-Secondary Grad vs Not Stated
0.998 0.950 – 1.050 0.943
Income 0.184 Lowest income vs Middle income 1.059 0.998 – 1.124 0.058 Lowest income vs Upper middle income
1.063 0.992 – 1.138 0.083
Lowest income vs Highest income 1.082 1.014 – 1.154 0.018 Lowest income vs Not stated 1.077 1.007- 1.151 0.030 Middle income vs Upper middle income
0.991 0.945 – 1.040 0.717
Middle income vs Highest income 1.008 0.963 – 1.055 0.725 Middle income vs Not stated 1.019 0.976 – 1.063 0.389 Upper middle income vs Highest income
1.021 0.977 – 1.068 0.355
Upper middle income vs Not stated 1.017 0.978 – 1.057 0.410 Highest income vs Not stated 1.013 0.977 – 1.051 0.490 Smoking Habits 0.727 Current smoker vs Former smoker 1.039 0.965 – 1.119 0.306 Current smoker vs Never smoked 1.056 1.014 – 1.099 0.009 Former smoker vs Never smoked 1.045 0.980 – 1.113 0.178 Frequency of dental care 0.176 Never vs Emergency 1.026 0.915 – 1.150 0.664 Never vs < Once per Year 1.103 1.000 – 1.216 0.050 Never vs Once per Year 1.106 1.002 – 1.222 0.045 Never vs > Once per Year 1.103 0.996 – 1.221 0.060 Emergency vs < Once per Year 0.966 0.886 – 1.053 0.432

113
Emergency vs Once per Year 1.017 0.997 – 1.071 0.511 Emergency vs > Once per Year 1.010 0.990 – 1.030 0.346 < Once per Year vs Once per Year 1.079 1.002 – 1.161 0.044 < Once per Year vs > Once per Year 1.075 1.005 – 1.150 0.035 Once per year vs > Once per Year 1.000 0.956 – 1.046 0.998 Brushing Teeth 1.000 0.998 – 1.002 0.750 Flossing Teeth 1.000 0.998 – 1.003 0.958 Dairy Consumption 1.000 0.998 – 1.002 0.699 Fibre Consumption 1.001 1.000 – 1.002 0.057
Sugary Beverage Index Model – Oral Health Index
In the sugary beverage consumption model, milk consumption had a positive
effect on OHX scores, raising it by 1.003 times for every increase in frequency of milk
consumption per week. The milk and sugary beverage interaction was also significant
(IRR = 1.000; 95% CI = 1.000 – 1.000). Water, sugary beverage, diet soft drink, and
vegetable juice consumption were not significant predictors. The water and sugary
beverage consumption interaction variable was also not significant in this model. These
results are displayed in Table 17 below.
In general, increased consumption of sugar-containing beverages lowered mean
OHX scores, although not significantly. There was one exception to this rule, that being
2 vs. 3 acidic beverages per day. Otherwise, as consumption of sugary beverages
increased, average OHX scores decreased, with the largest difference in scores being
between 3 sugary beverages per day and the largest consumption groups, 4 or more times
consuming sugary-containing per day.

114
Figure 47. Effect of Sugary Beverage Consumption on Overall Oral Health
In the OHX Sugary Beverage model, both sugary beverages and water magnified
the negative effect of each other when their interaction was examined; however, this
interaction was not statistically significant. For each extra time water was consumed in a
week, the IRR lowered by 0.0006, and each increase in sugary beverage consumption
caused the IRR for OHX to decrease by 0.0011. These values correspond to decreases in
IRR by 0.0429 and 0.0800 for each additional 10 times water or sugary beverages were
consumed in a day, respectively. Figure 48 below further illustrates these effects.
49.4 48.1 46.7 47.4 44.0
0
10
20
30
40
50
60
0 1 2 3 4+
Mea
n O
HX
Sco
re
Sugary Beverage Consumption (times per day)

115
Figure 48. Interaction between Water and Sugary Beverage Consumption
In this model, milk was found to have a significant protective effect when
interacting with sugar-containing beverages. Holding sugary beverage consumption
constant, each extra time milk was consumed in a week raised the IRR by 0.0028. If milk
consumption was increased by 10 times per day, this would correspond to an IRR
increased 1.2165 times. When milk consumption was held constant, an increase in sugary
beverage consumption lowered the IRR by 0.0012. For each additional 10 times sugary
beverages were consumed in a day, the IRR would be lowered by 0.0876. These findings
are further demonstrated in Figure 49.
1.00 1.00 1.00 0.99 0.99 0.99 0.99 0.98
1.00 1.00 0.99
0.99 0.99
0.99
0.98
0.97
0.91 0.92 0.93 0.94 0.95 0.96 0.97 0.98 0.99
1 1.01 1.02
1 2 5 7 10 14 21 28
Inci
denc
e R
ate
Rat
io (O
HX
Sco
re)
Beverage Consumption (times per week)
Water
Sugary Beverages

116
Figure 49. Interaction between Milk and Sugary Beverage Consumption
Significant differences were found between all age groups except between 12-15
and 16-19 year olds, and 16-19 and 25-30 year olds. Increasing fibre consumption by
eating fibre one more time per week raised OHX by 1.001 times (95% CI = 1.000 –
1.002).
Table 17. Correlates of Oral Health Index, Sugary Beverage Index Model, Poisson
Regression (n=1534)
Variable IRR 95% CI p-value Water 0.999 0.998 – 1.000 0.194 Milk 1.003 1.001 – 1.005 0.009 Sugary Beverage Consumption Index 0.999 0.998 – 1.000 0.081 Diet Soft Drinks 1.001 0.997 – 1.005 0.599 Vegetable Juices 1.001 0.996 – 1.006 0.689 Milk and Sugary Beverage Interaction 1.000 1.000 – 1.000 <0.001 Water and Sugary Beverage Interaction 1.000 1.000 – 1.000 0.209 Age 0.002 12-15 vs 16-19 0.989 0.966 – 1.012 0.349 12-15 vs 20-24 0.933 0.902 – 0.965 <0.001 12-15 vs 25-30 0.934 0.894 – 0.977 0.003 16-19 vs 20-24 1.062 1.016 – 1.110 0.008 16-19 vs 25-30 0.997 0.951 – 1.045 0.897 20-24 vs 25-30 0.945 0.904 – 0.988 0.012 Sex 0.988 0.966 – 1.001 0.279
1.00 1.00 1.01 1.02 1.03 1.04 1.06 1.08
1.00 1.00 1.00 0.99 0.99 0.99 0.98 0.97
0
0.2
0.4
0.6
0.8
1
1.2
1.4
1 2 5 7 10 14 21 28
Inci
denc
e R
ate
Rat
io (O
HX
scor
e)
Beverage Consumption (times per week)
Milk
Sugary Beverages

117
Education 0.888 < Post-Secondary vs Other Post-Secondary
1.027 0.990 – 1.065 0.161
< Post-Secondary vs Post-Secondary Grad
1.024 0.993 – 1.056 0.127
< Post-Secondary vs Not Stated 1.035 0.985 – 1.088 0.171 Other Post-Secondary vs Post-Secondary Grad
1.002 0.953 – 1.053 0.943
Other Post-Secondary vs Not Stated
0.996 0.949 – 1.045 0.869
Post-Secondary Grad vs Not Stated
1.008 0.963 – 1.056 0.725
Income 0.072 Lowest income vs Middle income 1.053 0.996 – 1.113 0.069 Lowest income vs Upper middle income
1.057 0.988 – 1.132 0.109
Lowest income vs Highest income 1.079 1.012 – 1.151 0.019 Lowest income vs Not stated 1.073 1.006 – 1.144 0.033 Middle income vs Upper middle income
0.984 0.946 – 1/023 0.410
Middle income vs Highest income 0.987 0.952 – 1.024 0.490 Middle income vs Not stated 1.005 0.964 – 1.046 0.825 Upper middle income vs Highest income
1.025 0.980 – 1.072 0.275
Upper middle income vs Not stated 1.019 0.981 – 1.058 0.329 Highest income vs Not stated 1.015 0.977 – 1.055 0.455 Smoking Habits 0.703 Current smoker vs Former smoker 1.042 0.974 – 1.113 0.232 Current smoker vs Never smoked 1.059 1.018 – 1.101 0.004 Former smoker vs Never smoked 0.984 0.902 – 1.075 0.727 Frequency of dental care 0.052 Never vs Emergency 1.012 0.900 – 1.137 0.847 Never vs < Once per Year 1.103 0.997 – 1.220 0.058 Never vs Once per Year 1.109 1.002 – 1.229 0.046 Never vs > Once per Year 1.104 0.994 – 1.226 0.066 Emergency vs < Once per Year 0.930 0.869 – 0.995 0.035 Emergency vs Once per Year 1.000 0.956 – 1.046 0.998 Emergency vs > Once per Year 1.003 0.989 – 1.018 0.665 < Once per Year vs Once per Year 1.097 1.022 – 1.177 0.011 < Once per Year vs > Once per Year 1.091 1.023 – 1.163 0.008 Once per year vs > Once per Year 1.001 0.954 – 1.050 0.970 Brushing Teeth 1.000 0.998 – 1.002 0.844 Flossing Teeth 1.000 0.997 – 1.002 0.869 Dairy Consumption 1.000 0.998 – 1.002 0.730 Fibre Consumption 1.001 1.000 – 1.002 0.007
Acidic Beverage Index Model – Oral Health Index
The same variables that were significant in the sugary beverage model were also
significant in the acidic beverage model for OHX. Each unit increase in the number of
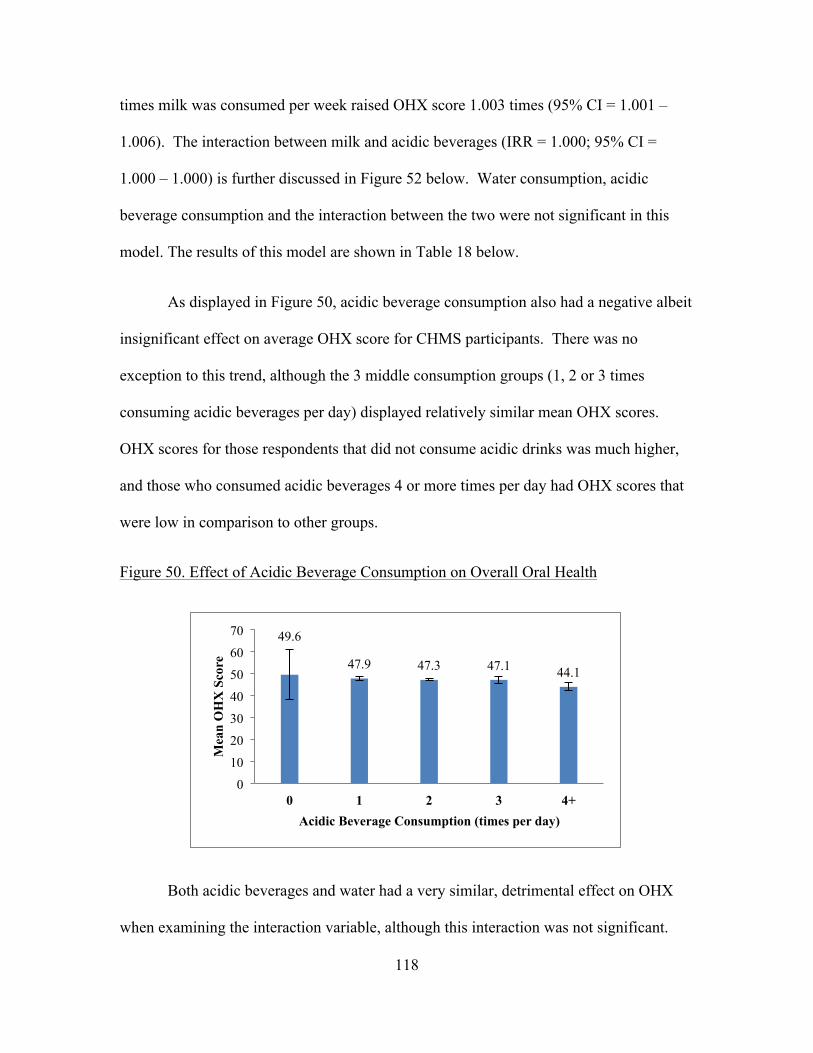
118
times milk was consumed per week raised OHX score 1.003 times (95% CI = 1.001 –
1.006). The interaction between milk and acidic beverages (IRR = 1.000; 95% CI =
1.000 – 1.000) is further discussed in Figure 52 below. Water consumption, acidic
beverage consumption and the interaction between the two were not significant in this
model. The results of this model are shown in Table 18 below.
As displayed in Figure 50, acidic beverage consumption also had a negative albeit
insignificant effect on average OHX score for CHMS participants. There was no
exception to this trend, although the 3 middle consumption groups (1, 2 or 3 times
consuming acidic beverages per day) displayed relatively similar mean OHX scores.
OHX scores for those respondents that did not consume acidic drinks was much higher,
and those who consumed acidic beverages 4 or more times per day had OHX scores that
were low in comparison to other groups.
Figure 50. Effect of Acidic Beverage Consumption on Overall Oral Health
Both acidic beverages and water had a very similar, detrimental effect on OHX
when examining the interaction variable, although this interaction was not significant.
49.6
47.9 47.3 47.1 44.1
0
10
20
30
40
50
60
70
0 1 2 3 4+
Mea
n O
HX
Sco
re
Acidic Beverage Consumption (times per day)
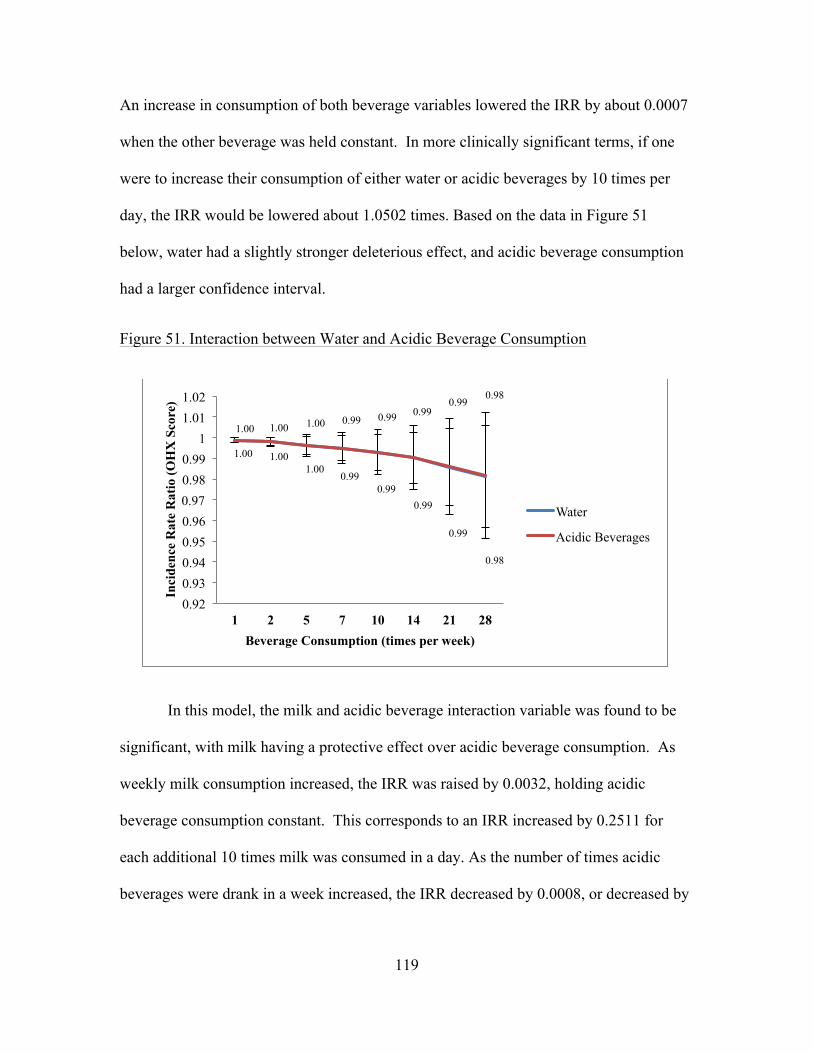
119
An increase in consumption of both beverage variables lowered the IRR by about 0.0007
when the other beverage was held constant. In more clinically significant terms, if one
were to increase their consumption of either water or acidic beverages by 10 times per
day, the IRR would be lowered about 1.0502 times. Based on the data in Figure 51
below, water had a slightly stronger deleterious effect, and acidic beverage consumption
had a larger confidence interval.
Figure 51. Interaction between Water and Acidic Beverage Consumption
In this model, the milk and acidic beverage interaction variable was found to be
significant, with milk having a protective effect over acidic beverage consumption. As
weekly milk consumption increased, the IRR was raised by 0.0032, holding acidic
beverage consumption constant. This corresponds to an IRR increased by 0.2511 for
each additional 10 times milk was consumed in a day. As the number of times acidic
beverages were drank in a week increased, the IRR decreased by 0.0008, or decreased by
1.00 1.00 1.00
0.99 0.99
0.99
0.99
0.98
1.00 1.00 1.00 0.99 0.99 0.99 0.99
0.98
0.92 0.93 0.94 0.95 0.96 0.97 0.98 0.99
1 1.01 1.02
1 2 5 7 10 14 21 28
Inci
denc
e R
ate
Rat
io (O
HX
Sco
re)
Beverage Consumption (times per week)
Water
Acidic Beverages
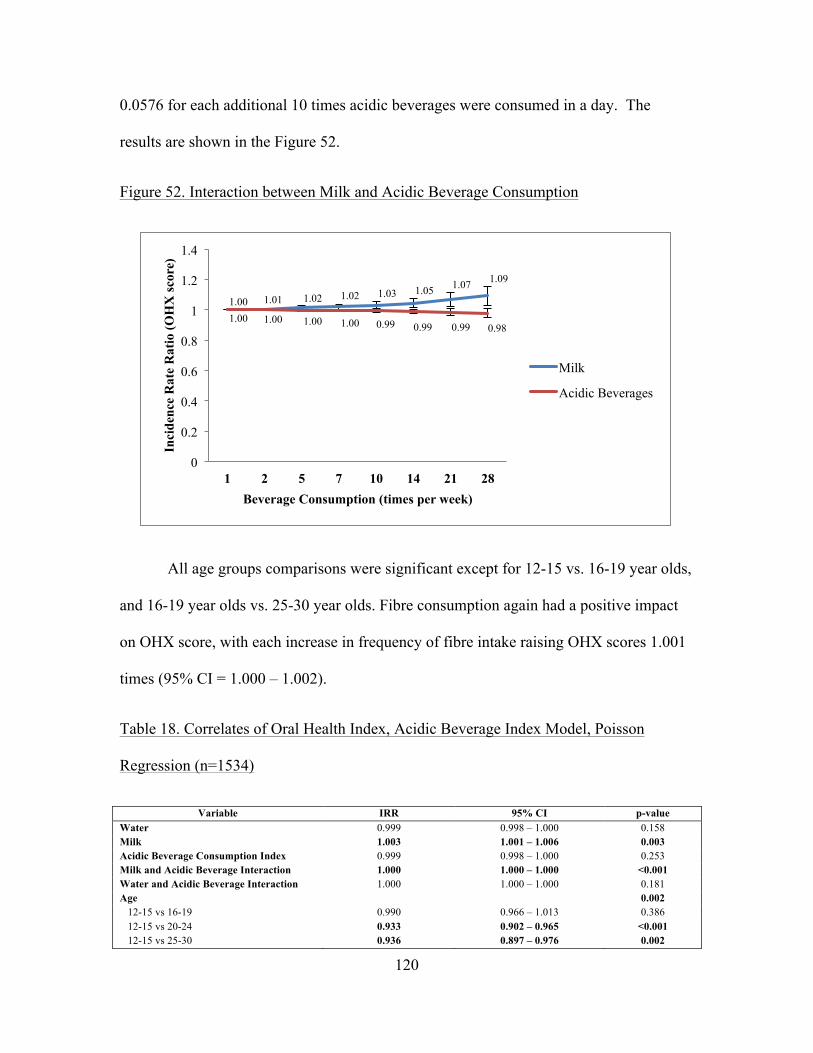
120
0.0576 for each additional 10 times acidic beverages were consumed in a day. The
results are shown in the Figure 52.
Figure 52. Interaction between Milk and Acidic Beverage Consumption
All age groups comparisons were significant except for 12-15 vs. 16-19 year olds,
and 16-19 year olds vs. 25-30 year olds. Fibre consumption again had a positive impact
on OHX score, with each increase in frequency of fibre intake raising OHX scores 1.001
times (95% CI = 1.000 – 1.002).
Table 18. Correlates of Oral Health Index, Acidic Beverage Index Model, Poisson
Regression (n=1534)
Variable IRR 95% CI p-value Water 0.999 0.998 – 1.000 0.158 Milk 1.003 1.001 – 1.006 0.003 Acidic Beverage Consumption Index 0.999 0.998 – 1.000 0.253 Milk and Acidic Beverage Interaction 1.000 1.000 – 1.000 <0.001 Water and Acidic Beverage Interaction 1.000 1.000 – 1.000 0.181 Age 0.002 12-15 vs 16-19 0.990 0.966 – 1.013 0.386 12-15 vs 20-24 0.933 0.902 – 0.965 <0.001 12-15 vs 25-30 0.936 0.897 – 0.976 0.002
1.00 1.01 1.02 1.02 1.03 1.05 1.07 1.09
1.00 1.00 1.00 1.00 0.99 0.99 0.99 0.98
0
0.2
0.4
0.6
0.8
1
1.2
1.4
1 2 5 7 10 14 21 28
Inci
denc
e R
ate
Rat
io (O
HX
scor
e)
Beverage Consumption (times per week)
Milk
Acidic Beverages

121
16-19 vs 20-24 1.059 1.012 – 1.107 0.012 16-19 vs 25-30 0.999 0.954 – 1.046 0.961 20-24 vs 25-30 0.945 0.906 – 0.986 0.009 Sex 0.989 0.967 – 1.011 0.324 Education 0.932 < Post-Secondary vs Other Post-Secondary
1.025 0.989 – 1.063 0.176
< Post-Secondary vs Post-Secondary Grad
1.024 0.993 – 1.056 0.130
< Post-Secondary vs Not Stated 1.033 0.982 – 1.085 0.203 Other Post-Secondary vs Post-Secondary Grad
0.992 0.947 – 1.033 0.627
Other Post-Secondary vs Not Stated
0.932 0.874 – 0.994 0.033
Post-Secondary Grad vs Not Stated
1.007 0.962 – 1.054 0.763
Income 0.091 Lowest income vs Middle income 1.055 0.997 – 1.116 0.063 Lowest income vs Upper middle income
1.058 0.990 – 1.132 0.096
Lowest income vs Highest income 1.081 1.015 – 1.152 0.016 Lowest income vs Not stated 1.075 1.008 – 1.147 0.028 Middle income vs Upper middle income
0.981 0.945 – 1.019 0.329
Middle income vs Highest income 0.985 0.948 – 1.024 0.455 Middle income vs Not stated 1.006 0.967 – 1.047 0.761 Upper middle income vs Highest income
1.025 0.979 – 1.072 0.293
Upper middle income vs Not stated 1.019 0.980 – 1.060 0.337 Highest income vs Not stated 1.016 0.977 – 1.056 0.428 Smoking Habits 0.698 Current smoker vs Former smoker 1.041 0.973 – 1.114 0.246 Current smoker vs Never smoked 1.058 1.019 – 1.099 0.003 Former smoker vs Never smoked 0.983 0.904 – 1.070 0.698 Frequency of dental care 0.058 Never vs Emergency 1.013 0.898 – 1.142 0.839 Never vs < Once per Year 1.105 0.998 – 1.223 0.054 Never vs Once per Year 1.110 1.002 – 1.230 0.045 Never vs > Once per Year 1.105 0.993 – 1.230 0.067 Emergency vs < Once per Year 0.917 0.860 – 0.977 0.008 Emergency vs Once per Year 0.999 0.953 – 1.048 0.970 Emergency vs > Once per Year 1.005 0.990 – 1.021 0.503 < Once per Year vs Once per Year 1.097 1.021 – 1.117 0.011 < Once per Year vs > Once per Year 1.091 1.023 – 1.164 0.008 Once per year vs > Once per Year 1.000 0.954-1.048 0.997 Brushing Teeth 1.000 0.998 – 1.002 0.873 Flossing Teeth 1.000 0.997 – 1.002 0.893 Dairy Consumption 1.000 0.998 – 1.002 0.908 Fibre Consumption 1.001 1.000 – 1.002 0.006
122
DISCUSSION
Although it was hypothesized that each of the beverage types and indices would
affect oral health in either a beneficial or detrimental manner, many of the beverages
were not associated with any of the various oral health outcomes. These variables
included diet soft drinks, sports beverages, fruit juices, vegetable juice and alcohol. The
acidic beverage consumption index was also not significant in all cases; however most of
the interactions involving the indices were found to significantly contribute to oral health
outcomes. Whereas other studies have found that most of these beverage types affect the
teeth and oral cavity when their effects are examined in isolation, it appears from the
current findings that consumption of many different beverage types does not have
specific oral health outcomes when examined in the context of a whole person and the
complexity of their diets and habits. In a way, this evidence could support an ecological
fallacy in drawing hypotheses in this circumstance: liquid substances that may affect
teeth and other oral structures at the biochemical level may not have a significant effect
when the context of the whole person is considered.
Despite many of the predictor variables having no effect, some of the beverages
were found to significantly contribute to oral health outcomes. It was hypothesized that
water would have a positive effect on oral health. Although this was found to be the
case, water was only significantly associated with one of the outcome measures, namely
the main effects model for Self-Rated Oral Health. Since this was an outcome centered in
self-perception, it is possible that many people believe that drinking a lot of water may
have a positive impact on their oral health. This may be due to knowledge about the

123
rinsing effects of water or the benefits of community water fluoridation. Alternatively,
the relationship between water consumption and self-rated oral health could be
confounded by having a health-conscious outlook, especially as other common health
promoting behaviours, such as visiting a dental professional more often, were also
significant in this model.
Fruit-flavoured beverage consumption was also found to have a limited effect,
detrimentally impacting dental decay in the main effects model. This is likely due to the
sugar content and acidic action of fruit-flavoured beverages affecting the tooth structure.
Similarly, the sugary beverage consumption index, which was significant only for dental
decay, likely affects oral health through the acid metabolism of sugars. Regular soft
drinks, on the other hand, were found to be associated with all of the oral health
outcomes, albeit the effect being small. This was consistent with the existing literature in
which regular soft drink consumption often emerges as the only significant beverage
predictor of oral health outcomes (Burt et al., 2006; Dugmore & Rock, 2004).
Milk was also found to be a common contributor to oral health outcomes. Milk
emerged as significant in all of the consumption index models except for the sugary
beverage consumption index for decay. Many of the interaction terms involving milk
were also significant, except for the milk and sugary beverage interaction term in the
sugary beverage index model for dental decay. When predictive on its own, milk always
had a beneficial effect on oral health, as did it in 7 of the 8 interaction terms. These
findings suggest that consuming milk more frequently is beneficial to oral health,
although the specific reason why is not known; however, based on our data, we can begin
to formulate some hypotheses. First, it does not appear that the effect milk is the same

124
for all dairy products, as non-milk dairy consumption did not emerge in any of the
models as a significant predictor. Thus, it is not likely that an inherent property of dairy
products, such as calcium content, is responsible for the benefit to oral health; however, it
is important to note that the effect of non-milk dairy products may have been mitigated
by the high sugar content of ice cream, frozen yogurt and flavoured yogurt, and each
dairy product should be considered individually when examining effects in future
studies. One possible mechanism by which milk aids oral health is through its buffering
capacity; this observation is strengthened by the fact that when considering the
interaction between milk and sugary or acidic beverages, increased milk consumption
tended to be protective over sugar or acid consumption. Finally, the effect of milk may
be through remineralization of the tooth structure, as milk does contain calcium and
phosphate, the two major constituents of hydroxyapatite, and may act topically as
opposed to systemically in the case of other dairy products.
Although some of the beverage variables were significant, the magnitude of these
effects was very small, meaning that although some of our results may be statistically
significant, they are likely not clinically significant. This observation lends strength to
the fact that oral health outcomes are multi-causative, and the reasons for an individual's
oral health status must be explored in the context of an accumulation of life experiences
and circumstances. This can also support the message that anything is acceptable in
moderation, but consuming high amounts, especially of soft drinks, may have a
detrimental impact to one's oral health.
In consideration of the small magnitude of effects and the multi-factorial
causation of oral health or disease, other covariates are also important to examine. In

125
dental decay, age, sex, flossing and fibre consumption were significant predictors. Most
of the age contrasts were found to be significant, with older participants having more
dental decay than younger respondents. This is consistent with current dental knowledge,
as time is an essential factor in the caries development process. As time goes on, more
opportunities are presented for acid attack on the tooth structure due to sugar metabolism
by certain bacteria, and if this is not reversed, it can eventually lead to decay and
cavitation within the enamel and dentin. Thus, age is associated with greater extent,
number and severity of dental decay.
In terms of sex effects, it was found that females generally had less decay than
males. This may be explained by females generally having better hygiene habits than
males, especially during the adolescent age period; however, females are generally found
to exhibit a higher prevalence of dental caries than men when rates are reported by sex
(Lukacs & Largaespada, 2006). Reasons commonly given for this difference include an
earlier time of eruption in females and thus longer exposure to the cariogenic oral
environment, frequent snacking during food preparation as in most cultures females are
the primary food preparers, and hormone fluctuations during pregnancy (Lukacs &
Largaespada, 2006). These trends may not have held true in the sub-population, as the
restricted age group suggests the majority of women may not have experienced a
pregnancy or are not the primary food preparers, and the relative affluence of Canada
may indicate that fewer females may be subscribing to the gender role of food
preparation, or this chore may be more equitably shared (Lukacs & Largaespada, 2006).
Fibre consumption was found to positively affect the number of sound teeth in the
mouth, a finding consistent with the literature, as discussed in the introductory section.
126
Finally, somewhat counter-intuitively, flossing was found to have a negative
association with dental decay. Although more frequent flossing and better oral hygiene
habits are generally thought to improve oral health, this was not the case here. This may
be explained by the lack of temporal data in the CHMS, as it not possible to determine
when the decay took place and when the patient started their current flossing habits. It is
likely that these participants had been identified as high risk patients based on their
extensive decay and were motivated to start flossing regularly. Further evidence that may
help to test this hypothesis would be the location of the caries; if true, it is likely that
interproximal as opposed to occlusal caries were prevented once the respondent starting
flossing. Interestingly, although flossing may help to prevent decay, it is more often
indicated for gum disease such as gingivitis and periodontitis, but flossing did not emerge
as a predictor in these models. Future studies should therefore use temporal data in
exploring the relationship between flossing and dental decay.
In the gingivitis models, very few variables were significant predictors of gingival
outcomes. Age appeared to be the most consistent and significant covariate, with two of
the age contrasts emerging in all three models. Specifically, those respondents in the 12-
15 age group (the youngest group) were found to have better periodontal health than
participants in the two highest age groups (20-24 and 25-30). This is not unexpected, as
prevalence of gingivitis and other periodontal diseases increases with age (Eke, Dye,
Wei, Thornton-Evans & Genco, 2012). This is grounded in the fact that increased age
means increased exposure to the risk factors for periodontitis, an increased chance of
developing a condition such as diabetes and heart disease that may promote gingival
inflammation, and an increased exposure to stress and other hormones (Ababneh, Hwaij

127
& Khader, 2012; Eke et al., 2012; Loesche & Grossman, 2001; Rajhans, Kohad,
Chaudhari & Mhaske, 2011). In addition to age, fibre consumption was also significant
in the two index models. This finding is consistent with the published literature, which
has found that fibre consumption, especially from fruit sources, can help to both prevent
and slow the progression of periodontal disease (Merchant, Pitiphat, Franz & Joshipura,
2006; Schwartz, Kaye, Nunn, Spiro & Garcia, 2012).
In examining the significant covariates for self-rated oral health, income and
frequency of visiting a dental professional consistently emerged. In terms of income,
those in the highest income group rated their oral health as better than all other groups
(lowest, middle and upper middle incomes). This is not surprising, as those of a higher
SES are generally found to have better health for a variety of reasons including being
more likely to have dental insurance or being better able to afford dental treatment in
general, having better knowledge and education about the benefits of preventive dental
behaviours, having an increased ability to purchase healthy foods that may benefit oral
health, and placing a higher personal value on oral health, especially aesthetics
(Donaldson et al., 2008; Hobdell et al., 2003). These thoughts are consistent with another
significant covariate: frequency of visiting a dental professional. In general, those who
visited a dental professional on at least a yearly basis had better oral health than those that
visited less than once per year or only on an emergency basis. Interestingly, those who
responded that they never visited a dental professional were not found to be significantly
different than any of the other contrasts, possibly due to a confounding of reasons the
participants responded to being a part of this group. Specifically, participants may never
visit a dental professional for a variety of reasons: those who perceive they have good or
128
excellent oral health likely never visit a dental professional as they view it as an
unnecessary expense, whereas those with fair to poor self-rated oral health may not be
able to afford dental care or do not understand its importance in achieving and
maintaining good oral health (Afonso-Souza et al., 2007; Donaldson et al., 2008).
Interestingly, income and frequency of visiting a dental professional were significant
covariates only in the self-rated oral health, which suggests there may be a perception
around the importance of finances, especially in relation to being able to afford dental
care, that is not reflected in reality.
In addition to income and visiting a dental professional, sex was also significantly
associated with SROH in the index models, with females perceiving themselves to have
poorer oral health. Sex differences have been found in some aspects of oral health; for
instance, women have a greater prevalence of dental caries, xerostomia due to Sjogren’s
Syndrome, or Temporo-Mandibular Joint pain (American Dental Association, 2006;
Lukacs & Largaespada, 2006). Although there is a some evidence to suggest that females
may experience poorer oral health overall, females were found to have less dental decay
than males in this analysis, and no sex differences were found in our OHX model,
suggesting that it is likely not a problem in this sample/population; however, it is
important to remember that the OHX was not a comprehensive index of all possible oral
and dental health conditions. In other self-rated measures of health, no clear and
consistent sex differences were found, although there may be some association when age
and sex are considered together, especially in older populations (Beniyamini, Blumstein,
Lusky & Modan, 2003; Demirchyan, Petrosyan, & Thompson, 2012). However, in
adolescent populations, it appears that girls tend to rate their health more poorly than
129
boys, likely due to sex differences in self-esteem around this age; as the sample in our
study was age-restricted to include adolescents and young adults, this may explain the sex
differences observed (Jerden, Burell, Stenlund, Weinehall & Bergstrom, 2011; Vingilis,
Wade & Seeley, 2002)
Similar to dental decay and periodontal disease, age was also a significant
covariate in the Oral Health Index models, with increasing age generally being associated
with poorer OHX scores. This is to be expected as many components of oral health are
affected by an accumulation of life experiences and oral health tends to worsen with age
(Hugoson et al., 2005; Steele et al., 2004). Dental decay and periodontal disease are two
such oral health conditions that follow this trend, and are also large components of the
OHX, and thus it is not surprising that age is a significant covariate in the OHX models.
However, although age was taken into account in all models, it is important to note that
age may have skewed the results in some models, as most oral health conditions do
worsen with cumulative exposures and experiences, and thus age. In the sugary and
acidic index models, fibre consumption also emerged as a covariate. As discussed above,
fibre consumption, like age, was also significant in the decay and gingivitis models, and
thus is not surprising that it also plays a role in the composite measure of oral health.
In addition, a few of the covariates were not significant in any model, namely
brushing teeth, (non-milk) dairy consumption, education and smoking. The fact that
brushing teeth and smoking were not significant is particularly surprising, as dental
professionals commonly advise patients about these two habits (CDA, 2012b; CDA,
2014). The value of toothbrushing is commonly accepted and has been generally been
found to improve prevalence of both caries and periodontal disease; however, the

130
frequency of toothbrushing, technique employed and type of toothbrush used all play a
role in the impact of toothbrushing and the wide variability in these factors may have
contributed to the lack of significance in this investigation (Claydon, 2008; Davies,
Davies & Ellwood, 2003). Additionally, much of the preventive value of toothbrushing
is attached to the use of fluoride toothpaste when brushing; since the type of toothpaste
used was not taken into consideration in the CHMS, this may also have affected results
(Claydon, 2008; Davies, Davies & Ellwood, 2003). The lack of significance of
toothbrushing may also be attributable to a lack of variability within the CHMS
population, with most participants brushing their teeth at least once per day, and this lack
of variability may have obscured any effects tooth brushing does have on oral health.
There could also be a threshold effect after which the number of times one brushes their
teeth does not have an additional impact. Interestingly, there is also evidence to suggest
that toothbrushing may actually cause damage to the dentition and soft tissues in terms of
abrasion, sensitivity and periodontal recession (Addy, 2010; Claydon, 2008).
Smoking has been widely identified as a risk factor for poor oral health. Current
smokers are more likely to have fewer teeth, more dental decay on both crown and root
surfaces, a greater severity and extent of periodontal disease, higher prevalence of
mucosal disorders, decreased functional ability of the oral structures, and overall exhibit a
greater need for dental care (Locker, 1992; Locker & Millar, 2007; Preber, Kant &
Bergstrom, 1980). The incidence of oral cancer is also significantly higher in smokers
(Blot et al., 1988; Mashberg, Boffetta, Winkelman, & Garfinkel, 2006). The risk for poor
oral health outcomes is higher in former smokers as compared to non-smokers; however,
over time the risk of poor oral health decreases in former smokers as compared to current
131
smokers (Locker & Millar, 2007). Chewing tobacco has also been found to contribute to
poorer oral health, especially through incidence of oral squamous cell carcinoma and
other oral cancers (Critchley & Unal, 2002). Future analyses should also consider the
impact of smokeless as well as smoking tobacco for these reasons, although at this time it
does not present an extensive public health concern due to the low prevalence of
smokeless tobacco use in Canada (Reid, Hammond, Rynard, & Burkhalter, 2014).
Considering the strength of the body of evidence advocating that tobacco consumption is
harmful to oral health, it is surprising that smoking status did not seem to have a
significant effect on any of the outcomes. This may be due to underreporting in line with
social desirability bias, or a lack of variability as the majority of participants had never
smoked. The age restriction used in the study may also have had an effect, as the length
of time smoking has the largest impact on oral health and these times were likely to be
significantly lower in this study as compared to much of the body of research. The
categorical nature of this variable may also have skewed the results; future investigations
should consider the effect of the number of cigarettes smoked per day and the length of
time the participant has been a smoker.
As discussed above, the effect of dairy consumption on oral health may have been
negated by combining non-milk dairy products, especially considering the relatively high
sugar content of ice cream and how this may affect oral health. In addition, although the
non-milk dairy products recorded tend to be those most highly consumed, other dairy
product consumption, such as cheese, sour cream and butter, was not considered and may
have had an effect. The different types of yogurt that were consumed may also have an
effect; some yogurts and dairy products contain probiotics which may be beneficial to

132
oral health that may not be present in other products due to processing differences
(Caglar, Kargul & Tanboga, 2005).
Unexpectedly, education was also not significant in any models. The role of
education on oral health status has been well documented, with the potential mechanism
of its effect being exerted through higher SES and therefore access to dental care, and a
higher dental IQ (Hollister & Weintraub, 1993; Paulander, Axelsson & Lindhe, 2003).
There are several possible reasons that education was not significant in this investigation.
First of all, there was not much variability in education, with over 75% of the sample
falling in the “post-secondary graduate” category. The inclusion of the “not stated”
category may also have skewed results. Additionally, income was significant in at least
one of the models, and the effect of education may have been obscured with income as a
proxy for SES; however, an education and income interaction variable was considered in
the investigatory phase of this study and did not seem to have much effect on oral health
outcomes. The effect of education or other significant variables may also have acted as a
proxy for the effects of other variables, especially considering the high number of
covariates included in this analysis.
There were several limitations to this study affecting its generalizability and the
ability to draw certain conclusions. First and foremost, the lack of temporal data in the
CHMS and the cross-sectional design of this study limit the conclusions that can be
drawn. This limitation has already been mentioned a number of times, and further
investigations of this topic should use temporal data.
133
Time is also a limitation of the study in the context of patterns of consumption of
the beverage. By choosing to report beverage consumption habits in aggregate measures
of times per week or year, results were not as precise as say diet diaries or monitoring
would have been, and this may have impacted the accuracy of results. This information
was also based on participant recall, and this method may have lead to bias and
inaccuracies in results.
Furthermore, no information was captured on the habits that surrounded beverage
consumption such as at what time in the day the beverage(s) was consumed, whether it
was consumed with a meal or on its own, how long it took to drink the beverage, or what
habits participants employed after consuming the beverage, such as brushing their teeth
or rinsing their mouth with water. In relation to the interaction terms, these results may
have been impacted by whether or not they were consumed in close proximity, as the
time between drinks could have affected the buffering capacity or multiplicatory effect of
the beverages. These are important considerations as research has shown that patterns
surrounding beverage consumption can greatly affect the impact the beverage has on oral
health. For instance, beverages consumed with food tend to have lesser impact on oral
health than those consumed alone, due to a faster clearance rate, increased salivary
output, and buffering capacity (Scardina & Messina, 2012). The faster a beverage is
consumed, the less impact it has on the teeth and oral cavity as time is an essential factor
in the caries process, as well as other oral diseases (Scardina & Messina, 2012). By
clearing from the mouth at a faster rate, there length of the acid attack is shorter and less
demineralization of the tooth structure will occur (Scardina & Messina, 2012). The
length of action and acid attack can also be minimized by brushing the teeth or rinsing
134
with water following sugary or acidic beverage consumption; however brushing the teeth
immediately following consumption during the acid attack may contribute to erosion via
mechanical action (Scardina & Messina, 2012).
The use of an unvalidated food frequency questionnaire for both food and
beverage consumption is another serious limitation of the CHMS. The challenges and
limitations of food-frequency questionnaires have been well documented, and include
recall and social desirability biases, a lack of information regarding serving size
(especially in the case of the CHMS), as well as general inaccuracies in reporting
(Schaefer, et al., 2000). The CHMS is no exception to these limitations, especially as the
questionnaire was not a validated scale, including in reliability. This may have resulted in
inaccurate reporting, which could have in turn affected the accuracy of our results.
Furthermore, the use of food and beverage frequencies for reporting may have resulted in
a “time anchor” effect, which appears to have happened judging by the relatively
common consumption of beverages in multiples of seven times per week. In this way,
study participants may have used convenient approximations of frequency of
consumption for reporting, as opposed to more accurate values.
Beyond the limitations in data collection from the CHMS, some of the indices
used in this analysis may also have affected the accuracy of results. The fibre index
created for this study was basically a measure of frequency of grains and fruit and
vegetable intake, and did not take into consideration some fibre sources such as nuts and
legumes. Reporting in terms of frequency may also have lead to inaccuracies in our
index. As some fibre sources were not included, it is likely these inaccuracies resulted in
underestimations. Since increased fibre consumption was found to have a positive
135
association with many of the outcome measures, this underestimation likely does not
affect the conclusions drawn; however the magnitude of effect may be larger than
indicated, and results should be used with these limitations in mind. Additionally, the
sugary and acidic beverage indices differed by the addition of two drinks (vegetable
juices and diet soft drinks) in the acidic beverage index, so some of the effects and results
could have been confounded by this overlap. As regular soft drink consumption was
significant and had a detrimental effect in all of the main effects models, the significance
of the indices could be driven by the relatively strong effect of regular soft drinks itself,
and the sugar content or acidity of the beverage may not be as important as the results
indicate.
Another major limitation of the study was the inability to use fluoridation data,
due to the lack of a reliable and complete source of this information and the inability to
integrate it with the existing data identifiers. Fluoridation data is especially of importance
considering the current dental political climate in which many communities are opting to
have fluoride removed from their public water supplies. This lack of data may also have
confounded results, as significant differences between consumption effects of fluoridated
versus unfluoridated water may exist, and may have skewed or obscured results in this
analysis. Future research would be greatly strengthened and more applicable if this
information could be included. Further beverage details would also be beneficial for milk,
as many different types of milk are regularly consumed, including 1%, 2%, skim,
homogenized, flavoured, powdered, soy and almond, among others. It is possible
differences in the type of milk consumed may affect oral health, although this area has
not yet been examined in detail.
136
In addition, although the OHX was based on the validated measure by Burke and
Wilson (1995), it was modified slightly to better fit our study and the available measures.
Specifically, the wear, occlusion and denture assessments were not included as there was
not direct correspondence to sections in the CHMS, and this may have affected the
accuracy of the OHX as an index measure of oral health.
Due to the large number of models investigated in this study, the risk of one of the
significant associations being solely due to chance is greatly increased, and may have
contributed to inaccuracies in the data. It may be argued that a lower p-value of p<0.01
should have been used; however, this would have had minimal impact on the results as
most of the significant variables continue to be significant at this lower cut-off point. This
change would have made no changes in the periodontal health models, and would have
affected only one age contrast in the sugary and acidic index models for OHX. This
change would have had a greater effect on the dental decay and SROH models,
eliminating fruit-flavoured beverages in the main effects model, and the milk, milk and
sugary- or acidic-beverage interaction and one age contrast in the dental decay index
models. For SROH, water would have narrowly missed the cut-off (p<0.011), and some
contrasts for income and frequency of dental care would no longer have been significant.
Sex and one contrast for each income and frequency of dental care would have been
affected in the SROH index models, as well milk and the milk and sugary-beverage
interaction variable in the sugary index model. Although there would have been some
changes, it appears as if the general trends and conclusions drawn from the investigation
would be similar; namely that soft drink consumption consistently demonstrates a
detrimental effect on oral health and milk consumption may confer a protective benefit.

137
Although the CMHS was representative of 97% of Canadians, individuals living
on reserves, and in penitentiaries and other government institutions were not included,
and thus results are not generalizable to these populations. Those from extremely remote
locations may also be underrepresented as only participants that lived within a 100km
radius of the MEC were sampled. Otherwise, the sampling frame, representativeness and
generalizability of the study are strengths of this investigation.
Other strengths associated with using the CHMS include its large sample size,
which helped ensure we had adequate power for this study. Thanks to the design of both
the CHMS and this study, there was no missing information, other than the "not stated"
groups for income and education; this helped to simplify the analysis and minimized the
effect of non-response bias. Another benefit of the CHMS is the standardization of both
the household interview and clinical assessment. Although there may be some inter-rater
bias as multiple individuals were used to carry out these investigations, they were
consistent in the questions asked and how they were asked, the equipment available and
technique used.
Much of the value in this study is rooted in the number of covariates included. As
oral health conditions tend to be multifactorial in etiology, controlling for as many
potential confounders as possible was essential to the success and accuracy of this
investigation. Thanks to the comprehensive and detailed design of the CHMS, we were
able to include many factors that have been shown to affect oral health. The extensive
number of measures included in the CHMS also made it possible to investigate a wide
variety of oral health outcomes in order to achieve a more complete picture of the impact
beverage consumption has on various aspects oral health, as well as overall.
138
CONCLUSIONS
Overall, a picture of the trends surrounding beverage consumption and oral health
outcomes has emerged from this investigation, and can contribute to public health
recommendations in order to improve the oral health of Canadian citizens. Soft drinks
have consistently arisen from this and other research as being detrimental to oral health,
and thus their consumption should be limited. On the other hand, milk emerged from
many of the analyses as being beneficial to oral health; with this in mind, it would be
recommended for individuals and the population as a whole to replace soft drink
consumption with milk in order to improve population oral health. However, it is
important to keep in mind that the etiology of oral diseases is multi-causative, and many
factors play a part in determining one's oral health.
In general, these results are consistent with similar previous research. As
discussed in the introductory section, regular soft drink consumption consistently
emerges from analysis as having a significant, detrimental impact on many areas of oral
health, as was the case in this investigation. Milk has been found to have a beneficial or
neutral effect on oral health, a finding that was again reflected in this analysis. Although
in the context of diet the results are similar to the published literature, this was not the
case when investigating the effects of singular beverages. This suggests that the effects of
beverages which may be evident at a biochemical level do not necessarily have a
significant effect on oral health at the individual level. Further and more detailed
examination of the effect of interactions in diet is needed to better address this
discrepancy.
139
The added value of this investigation was the examination of beverage interaction
effects. In our investigation, water did not significantly interact with sugary or acidic
beverages, but milk had a significant interaction with the sugary- or acidic-beverage
index in all but one of the cases investigated. In general, milk was found to have a
protective effect over sugary or acidic beverage consumption, and intake of these sugary
and acidic beverages had a detrimental impact when consumption was increased and milk
consumption was held constant. In order to further investigate this phenomenon, future
research should take into consideration the context and volume of consumption of the
beverages, as well as understand at a biochemical level how this interaction may be
affecting oral health. As discussed above, the sugary and acidic beverage indices were
very similar and their significant effects could have been driven by the relatively strong
effect of regular soft drink consumption; however, whatever the driving force, our results
suggest that milk consumption can help to mitigate the detrimental oral effects of sugary
or acidic beverage consumption.
Future research is needed to examine the association between beverage
consumption and oral health more closely. Subsequent investigations should employ a
longitudinal design to address the causative factors surrounding the associations between
oral health, beverage consumption and other relevant factors. This longitudinal design
should also address the context of consumption, including timing and frequency. Future
research would also benefit from a more complete list of beverages, including coffee and
tea, as well as information on fluoridation and its impact. Additionally, it would be
beneficial to determine whether there were any differences in type of milk consumed
(skim, 1%, 2%, homogenized, soy, almond, etc.). Until this research can be undergone

140
and the knowledge base expanded, it may be best to subscribe to the adage “everything is
okay so long as it’s in moderation”.

141
REFERENCES
Ababneh, K. T., Hwaij, Z. M. F. A., & Khader, Y. S. (2012). Prevalence and risk
indicator of gingivitis and periodontitis in a multi-centre study in North Jordan: A
cross sectional study. BMC Oral Health, 12(1). doi:10.1186/1472-6831-12-1.
Addy, M. (2010). Tooth brushing, tooth wear and dentine sensitivity – are they
associated? International Dental Journal, 55(S4), 261-267.
Addy, M., & Moran, J. (1995). Mechanism of stain formation on teeth, in particular
associated with metal ions and antiseptics. Advances in Dental Research, 9(4),
450-456.
Afonso-Souza, G., Nadanovsky, P., Chor, D., Faerstein, E., Werneck, G. L., & Lopes, C.
S. (2007). Assocation between routine visits for dental checkup and self-perceived
oral health in an adult population in Rio de Janeiro: the Pro-Saude study.
Community Dentistry and Oral Epidemiology, 35(5), 393-400.
Alvarez, J. A., Rezende, K. M. P. C., Salazar Marocho, S. M., Alves, F. B. T., Celiberti,
P., & Ciamponi, A. L. (2009). Dental fluorosis: Exposures, prevention and
management. Medicina Oral, Patologia Oral y Cirugia Bucal, 14(2), E103-E107.
Alvarez, J. O. (1995). Nutrition, tooth development, and dental caries. American Journal
of Clinical Nutrition, 61(supplement), 410S-416S.
American Dental Association. (2006). Women’s oral health issues. Retrieved February
20, 2014 from http://www.ada.org/sections/professionalResources/pdfs/
healthcare_womens.pdf
Araujo, M. W. B., Dermen, K., Lalonde, D., Connors, G., & Cincio, S. G. (2003). Dental
hygiene practices and oral/dental health among alcoholic inpatients: Pilot study.
General Dentistry, 2003, 30-36.
Atchison, K. A., & Dolan, T. A. (1990). Development of the Geriatric Oral Health
Assessment Index. Journal of Dental Education, 54(11), 680-687.
Benyamini, Y., Blumstein, T., Lusky, A., & Modan, B. (2003). Gender differences in the
self-rated health-mortality association: Is it poor self-rated health that predicts
mortality of excellent self-rated health that predicts survival? Gerontologist,
43(3), 372-375.

142
Birkhead, D. (1984). Sugar content, acidity and effect on plaque pH of fruit juices, fruit
drinks, carbonated beverages and sport drinks. Caries Research, 18, 120-127.
Blot, W. J., McLaughlin, J. K., Winn, D. M., Austin, D. F., Greenberg, R. S., Preston-
Martin, S., … , Fraumeni, J. F. (1988). Smoking and drinking in relation to oral
and pharyngeal cancer. Cancer Research, 48, 3282.
Bratthall, D. (2000). Introducing the Significant Caries Index together with a proposal for
a new global oral health goal for 12-year-olds. International Dental Journal,
50(6), 378-384.
Brennan, D. S., Singh, K. A., Liu, O., & Spencer, A. (2010). Fruit and vegetable
consumption among older adults by tooth loss and socio-economic status.
Australian Dental Journal, 55(2), 143-149.
Budtz-Jorgensen, E., Chung, J-P., & Rapin, C-H. (2001). Nutrition and oral health. Best
Practice and Research Clinical Gastroenterology, 15(6), 885-896.
Burke, F. J. T., & Wilson, N. H. F. (1995). Measuring oral health: An historical view and
details of a contemporary oral health index (OHX). International Dental Journal,
45, 358-370.
Burt, B. A., Kolker, J. L., Sandretto, A. M., Yuan, Y., Sohn W., & Ismail, A. I. (2006).
Dietary patterns related to caries in a low-income adult population. Caries
Research, 40, 473-480.
Calgar, E., Kargul, B., & Tanboga, I. (2005). Bacteriotherapy and probiotics’ role on oral
health. Oral Diseases, 11(3), 131-137.
Canadian Dairy Information Centre. (2012). Per capita consumption of milk and cream.
Retrieved June 16, 2012 from http://www.dairyinfo.gc.ca/index_e.php?s1=dff-
fcil&s2=cons&s3=cons&page=consmclc#mc-lc-ca
Canadian Dental Association. (2012a). Nutrition. Retrieved June 4, 2012 from
http://www.cda-adc.ca/en/oral_health/cfyt/dental_care/nutrition.asp
Canadian Dental Association. (2012b). Tobacco and oral health. Retrieved July 6, 2012
from http://www.cda-adc.ca/en/oral_health/complications/tobacco/
Canadian Dental Association. (2014). Brushing and flossing. Retrieved March 3, 2014
from http://www.cda-adc.ca/en/oral_health/cfyt/dental_care/flossing_brushing.asp
Claydon, N. C. (2008). Current concepts in toothbrushing and interdental cleaning.

143
Periodontology 2000, 48, 10-22.
Coombes, J. S. (2005). Sports drinks and dental. American Journal of Dentistry, 18(2),
101-104.
Coombes, J. S., & Hamilton, K. L. (2000). The effectiveness of commercially available
sports drinks. Sports Medicine, 29, 181-209.
Critchley, J. A., & Unal, B. (2002). Health effects associated with smokeless tobacco: A
systematic review. Thorax, 58, 435-443.
Davies, R. M., Davies, G. M., & Ellwood, R. P. (2003). Prevention part 4:
Toothbrushing: What advice should be given to patients? British Dental Journal,
195(3), 135-141.
Demirchyan, A., Petrosyan, V., & Thompson, M. E. (2012). Gender differences in
predictors of self-rated health in Armenia: A population-based study of an
economy in transition. International Journal for Equity in Health, 11(67).
doi:10.1186/1475-9276-11-67.
Donaldson, A. N., Everitt, B., Newton, T., Steele, J., Sherriff, M., & Bower, E. (2008).
The effects of social class and dental attendance on oral health. Journal of Dental
Research, 87(1), 60-64.
Dugmore, C. R., & Rock, W. P. (2004). A multifactorial analysis of factors associated
with dental erosion. British Dental Journal, 196, 283-286.
Edwards, M., Creanor, S. L., Foye, R. H., & Gilmour, W. H. (2001). Buffering capacities
of soft drinks: The potential influence on dental erosion. Journal of Oral
Rehabilitation, 26(12), 923-927.
Fejerskov, O., & Kidd, E. A. M. (2008). Dental caries: The disease and its clinical
management (2nd Ed.). Copenhagen, Denmark: Blackwell Munksgaard.
Foulkes, R. G. (1995). Investigation of inorganic fluoride and its effect on the occurrence
of dental caries and dental fluorosis in Canada – final report. Fluoride, 28(3), 146-
148.
Gillchrist, J. A., Brumley, D. E., & Blackford, J. U. (2001). Community socioeconomic
status and children’s dental health. The Journal of the American Dental
Association, 132, 216-222.
Gordon, N. (2007). Oral health care for children attending a malnutrition clinic in South
144
Africa. International Journal of Dental Hygiene, 5(3), 180-186.
Hamasha, A. A., Warren, J. J., Levy, S. M., Broffitt, B., & Kanellis, M. J. (2006). Oral
health behaviours of children in low and high socioeconomic status families.
Pediatric Dentistry, 28(4), 310-315.
Health Canada. (2010). Report on the findings of the oral health component of the
Canadian Health Measures Survey 2007-2009 (Health Canada Publication No.
100183). Ottawa, Ontario, Canada: Publications Health Canada.
Health Canada. (2011). Eating well with Canada’s food guide. Retrieved June 16, 2012
from http://www.hc-sc.gc.ca/fn-an/alt_formats/hpfb-dgpsa/pdf/food-guide-
aliment/view_eatwell_vue_bienmang-eng.pdf
Heeringa, S. G., West, B. T., & Berglund, P. A. (2010). Applied survey data analysis.
Florida, USA: Chapman & Hall/CRC.
Hobdell, M. H., Oliveira, E. R., Bautista, R., Myburgh, N. G., Lalloo, R., Narendran, S.,
& Johnson, N. W. (2003). Oral disease and socio-economic status (SES). British
Dental Journal, 194, 91-96.
Hollister, M. C., & Weintraub, J. A. (1993). The association of oral health status with
systemic health, quality of life, and economic productivity. Journal of Dental
Education, 57(12), 901-912.
Hugoson, A., Koch, G., Gothberg, C., Heikimo, A. N., Lundin, S. A., Norderyd, O.,
Sjodin B., & Sondell, K. (2005). Oral health of individuals aged 3-80 years in
Jonkoping, Sweden during 30 years (1973-2003): Review of clinical and
radiographic findings. Swedish Dental Journal, 29(4), 139-155.
Iacopino, A. M. (2008). Relationship between nutrition and oral health. Journal of the
Canadian Dental Association, 74(9), 771.
Ismail, A. I., Burt, B. A., & Eklund, S. A. (1984). The cariogenicity of soft drinks in the
United States. Journal of the American Dental Association, 109(2), 241-245.
Jacobson, M. F. (2005). Liquid candy: How soft drinks are harming Americans’ health.
Retrieved June 14, 2012 from
http://www.cspinet.org/new/pdf/liquid_candy_final_w_new_supplement.pdf
Jain, P., Nihill, P., Sobkowski, J., & Agustin, M. Z. (2007). Commerical soft drinks: pH

145
and in vitro dissolution of enamel. General Dentistry, March/April 2007, 151-
154.
Jerden, L., Burell, G., Stenlund, H., Weinehall, L., & Bergstrom, E. (2011). Gender
differences and predocitors of self-rated health development among Swedish
adolescents. Journal of Adolescent Health, 48(2), 143-150.
Jones, A. Q., Dewey, C. E., Dore, K., Majowicz, S. E., McEwen, S. A., & Waltner-
Toews, D. (2006). Drinking water consumption patterns of residents in a
Canadian community. Journal of Water and Health, 4(1), 125-138,
doi: 10.2166/wh.2005.001
Klages, U., Bruckner, A., & Zentner, A. (2004). Dental aesthetics, self-awareness, and
oral health-related quality of life in young adults. European Journal of
Orthodontics, 26(5), 507-514.
Landon, S. (2007). Fruit juice review: Fruit juice nutrition and health. Food Australia,
59(11), 533-538.
Lee, J. G., & Brearley Messer, L. J. (2011). Contempary fluid intake and dental caries in
Australian children. Australian Dental Journal, 56, 122-131.
Levine, R. S. (2001). Milk, flavoured milk products and caries. British Dental Journal,
191(1), 20.
Ligh, R. Q., Fridgen, J., & Saxton, C. (2011). The effect of nutrition and diet on dental
structure integrity. Journal of the California Dental Association, 39(4), 243-249.
Lim, S., Sohn, W., Burt, B. A., Sandretto, A. M., Kolker, J. L., Marshall, T. A., & Ismail,
A. I. (2008). Cariogenicity of soft drinks, milk and fruit juice in low-income
African-American children: A longitudinal study. Journal of the American Dental
Association, 139(7), 959-967.
Listgarten, M. A. (2005). The role of dental plaque in gingivitis and periodontitis.
Journal of Clinical Periodontology, 15(8), 485-487.
Locker, D. (1992). Smoking and oral health in older adults. Canadian Journal of Public
Health, 83(6), 429-432.
Locker. D., Clarke, M., & Payne, B. (2000). Self-perceived oral health status
psychological well-being, and life satisfaction in an older adult population.
Dentistry, Oral Surgery & Medicine, 79(4), 970-975.

146
Locker, D., & Millar, W. J. (2007). Smoking and oral health status. Journal of the
Canadian Dental Association, 73(2), 155-163.
Loesche, W. J., & Grossman, N. S. (2001). Periodontal disease as a specific, albeit
chronic, infection: Diagnosis and treatment. Clinical Microbiology Reviews,
14(4), 727-752.
Lukacs, J. R., & Largaespada, L. L. (2006). Explaining sex differences in dental caries
prevalence: saliva, hormones, and “life-history” etiologies. American Journal of
Human Biology, 18(4), 540-555.
Mandel, L. (2005). Dental erosion due to wine consumption. Journal of the American
Dental Association, 136(1), 71-75.
Marcus, M., Koch, A. L., & Gershen, J. A. (1980). An empirically derived measure of
oral health status for adult populations. Journal of Public Health Dentistry, 40,
334-343.
Marshall, T. A., Levy, S. M., Broffitt, B., Warren, J. J., Eichenberger-Gilmore, J. M.,
Burns, T. L., & Stumbo, P. J. (2003). Dental caries and beverage consumption in
young children. Pediatrics, 112(3), e184-e191.
Mashberg, A., Boffetta, P., Wilnkelman, R., & Garfinkel, L. (1993). Tobacco smoking,
alcohol drinking, and cancer of the oral cavity and oropharynx among U.S.
veterans. Cancer, 72(4), 1369-1375.
Merchant, A. T., Pitiphat, W., Franz, M., & Joshipura, K. J. (2006). Whole-grain and
fiber intakes and periodontitis risk in men. The American Journal of Clinical
Nutrition, 83(6), 1395-1400.
Merritt, J., Qi, F., & Shi, W. (2006). Milk helps to build strong teeth and promotes oral
health. Journal of the California Dental Association, 34(5), 361-366.
Meyer-Lueckel, H., & Paris, S. (Eds.). (2013). Caries management – Science and clinical
practice. New York, NY: Thieme Medical Publishers, Inc.
Millar, W. J., & Locker, D. (2005). Edentulism and denture use (Statistics Canada
Catalogue No. 82-003). Health Reports, 17(1), 55-58.
Milosevic, A. (1997). Sports drinks hazard to teeth. British Journal of Sports Medicine,
31, 28-30.
Moynihan, P. (2000). Foods and factors that protect against dental caries. Nutrition
147
Bulletin, 25(4), 281-286.
National Institute of Dental and Craniofacial Research. (2000). Oral health in America: A
report of the Surgeon General. Retrieved June 10, 2012 from
http://www.nidcr.nih.gov/DataStatistics/SurgeonGeneral/sgr/
Nicklas, T. A. (2003). Calcium intake trends and health consequences from childhood
through adulthood. Journal of the American College of Nutrition, 22(5), 34-356.
Nicolau, B., Marcenes, W., Bartley, M., & Sheiham, A. (2005). Associations between
socio-economic circumstances at two stages of life and adolescents’ oral health
status. Journal of Public Health Dentistry, 65(1), 14-20.
Nishida, M., Grossi, S. G., Dunford, R. G., Ho, A. W., Trevisan, M., & Genco, R. J.
(2000). Calcium and the risk for periodontal disease. Journal of Periodontology,
71(7), 1057-1066.
Noble, J. M., Borrell, L. N., Papapanou, P. N., Elkind, M. S., Scarmeas, N., & Wright, C.
B. (2009). Periodontitis is associated with cognitive impairment among older
adults: Analysis of NHANES-III. Journal of Neurology, Neurosurgery &
Psychiatry, 80(11), 1206-1211.
Norris, C. M., Ghali, W. A., Saunders, L. D., Brant, R., Galbraith, D., Faris, P., &
Knudtson, M. L. (2006). Ordinal regression model and the linear regression
model were superior to the logistic regression model. Journal of Clinical
Epidemiology, 59(5), 448-456.
O’Sullivan, E. A., & Curzon, M. E. (2000). A comparison of acific dietary factors in
children with and without dental erosion. American Society for Dentistry for
Children Journal of Dentistry for Children, 67(3), 16-192.
O’Sullivan, E., & Milosevic, A. (1997). UK national clinical guidelines in paediatric
dentistry: Diagnosis, prevention and management of dental erosion. International
Journal of Paediatric Dentistry, 18(Suppl. 1), 29-38.
Oxford Journals. (2013). Research methods II: Multivariate analysis. Journal of Tropical
Pediatrics, Online (Retrieved Dec 28, 2013 from
http://www.oxfordjournals.org/our_journals/tropej/online/ma_chap13.pdf),
p. 136.
Paulander, J., Axelsson, P., & Lindhe, J. (2003). Association between level of education

148
and oral health status in 35-, 50-, 65- and 75-year-olds. Journal of Clinical
Periodontology, 30(8), 697-704.
Petti, S., & Scully, C. Alcohol and oral health. In M. Wilson (Ed.), Food constituents and
oral health: Current status and future prospects. United States: Woodhead
Publishing in Food Science, Technology and Nutrition.
Petti, S., Simonetti, R., & Simonetti D’Arca, A. (1997). The effect of milk and sucrose
consumption on caries in 6- to 11-year old Italian schoolchildren. European
Journal of Epidemiology, 13, 659-664.
Piza, E. L. (2012). Using Poisson and negative binomial regression models to measure
the influence of risk on crime incident counts. Retrieved December 28, 2013 from
http://www.rutgerscps.org/docs/CountRegressionModels.pdf
Preber, H., Kant, T., & Bergstrom, J. (1980). Cigarette smoking, oral hygiene and
periodontal health in Swedish army conscripts. Journal of Clinical
Periodontology, 7(2), 106-113.
Public Health Agency of Canada. (2010). Chronic diseases in Canada: Preface to the
Canadian Health Measures Survey results – oral health statistics, 2007-2009.
Retrieved from http://www.phac-aspc.gc.ca/publicat/cdic-mcbc/30-4/preface-
eng.php
Pussinen, P. J., Alfthan, G., Tuomilehto, J., Asikainen, S., & Jousilahit, P. (2004). High
serum antibody levels to Porphyromonas gingivalis predict myocardial infarction.
European Journal of Cardiovascular Prevention & Rehabilitation, 11(5), 408-
411.
Putnam, J. J., & Allshouse, J. E. (1999). Food consumption, price and expenditures,
1970-97 (Statistical Bulletin No, SB-965). Washington, DC: Food and Consumers
Economic Division, Economic Research Services, US Department of Agriculture.
Rabb-Waytowich, D. (2009). Water fluoridation in Canada: Past and present. Journal of
the Canadian Dental Association, 75(6), 451-454.
Rajhans, N. S., Kohad, R. M., Chaudharu, V. G., & Mhaske, N. H. (2011). A clinical
study of the relationship between diabetes mellitus and periodontal disease.
Journal of Indian Society of Periodontology, 15(4), 388-392.
Rayner, J. F. (1970). Socioeconomic status and factors influencing the dental health

149
practices of mothers. American Journal of Public Health and the Nation’s Health,
60(7), 1250-1258.
Record, S. J. (2001). Intakes for fruit and fruit juices in the 1995 national nutrition
survey. Commonwealth Scientific and Industrial Research Organization Health
Sciences and Nutrition.
Reid, J. L., Hammond, D., Rynard, V. L., & Burkhalter, R. (2014). Tobacco use in
Canada: Patterns and trends, 2014 edition. Retrieved June 15, 2014 from
www.propel.uwaterloo.ca
Roos, E. H., & Donly, K. J. (2002). In vivo dental plaque pH variation with regular and
diet soft drinks. Pediatric Dentistry, 24(4), 350-353.
Rubinoff, A. B., Latner, P. A., & Pasut, L. A. (1989). Vitamin C and oral health. Journal
of the Canadian Dental Association, 55(9), 705-707.
Ruxton, C. H. S., Garnder, E. J., & Walker, D. (2006). Can pure fruit and vegetable juices
protect against cancer and cardiovascular disease too? A review of the evidence.
International Journal of Food Sciences and Nutrition, 57(3-4), 249-272.
Rytomaa, I., Meurman, J. H., Koskinen, J., Laakso, T., Gharazi, L., & Turunen, R.
(1988). In vitro erosion of bovine enamel cause by acidic drinks and other
foodstuffs. Scandinavian Journal of Dental Research, 96, 324-333.
Savage, A., Eaton, K. A., Moles, D. R., & Needleman, I. (2009). A systematic review of
definitions of periodontitis and methods that have been used to identify this
disease. Journal of Clinical Periodontology, 36(6), 458-467.
Scardina, G. A., & Messina, P. (2012). Good oral health and diet. Journal of Biomedicine
and Biotechnology, 2012, 1-8.
Schaefer, E. J., Augustin, J. L., Schaefer, M. M., Rasmussen, H., Ordovas, J. M., Dallal,
G. E., & Dwyer, J. T. (2000). Lack of efficacy of a food-frequency questionnaire
in assessing dietary macronutrient intakes in subjects consuming diets of known
composition. American Society for Clinical Nutrition, 71(3), 746-751.
Schwartz, N., Kaye, E. K., Nunn, M. E., Spiro, A., & Garcia, R. I. (2012). High-fiber
foods reduce periodontal disease progression in men aged 65 and older: the
Veterans Affairs normative aging study/dental longitudinal study. Journal of the
American Geriatric Society, 60(4), 676-683.
150
Sheiham, A. (2005). Oral health, general health and quality of life. Bulletin of the World
Health Organization, 83(9), 644.
Slade, G. D., & Spencer, A. J. (1994). Development and evaluation of the Oral Health
Impact Profile. Community Dental Health, 11(1), 3-11.
Sohn, W., Burt, B. A., & Sowers, M. R. (2006). Carbonated soft drinks and dental caries
in the primary dentition. Journal of Dental Research, 85, 262-266.
Sorvari, R. (1989). Effects of various sport drink modifications on dental caries and
erosion in rats with controlled eating and drinking pattern. Proc Fin Dent Soc, 85,
13-20.
Soskolne, W. A., & Klinger, A. (2001). The relationship between periodontal disease and
diabetes: An overview. Annals of Periodontology, 6(1), 91-98.
Statistics Canada. (2010). Canadian Health Measures Survey (CHMS). Retrieved June 8,
2012 from
http://www23.statcan.gc.ca:81/imdb/p2SV.pl?Function=getSurvey&SDDS=5071
&lang=en&db=imdb&adm=8&dis=2
Statistics Canada. (2011). Canadian Health Measures Survey (CHMS) data user guide:
Cycle 1. Retrieved June 8, 2012 from http://www23.statcan.gc.ca/imdb-
bmdi/document/5071_D2_T1_V1-eng.htm
Steele, J. G., Sanders, A. E., Slade, G. D., Allen, P. F., Lahti, S., Nuttalli, N., & Spencer,
J. A. (2004). How do age and tooth loss affect oral health impacts and quality of
life? A study comparing two national samples. Community Dentistry and Oral
Epidemiology, 32(2), 107-114.
Teodora Timis, D. I. (2005). Socioeconomic status and oral health. The Journal of
Preventive Medicine, 13(1-2), 116-121.
Touger-Decker, R., & van Loveren, C. (2003). Sugars and dental caries. American
Journal of Clinical Nutrition, 78(supplement), 881S-892S.
Tubert-Jeannin, S., Riordan, P. J., Morel-Papernot, A., Porcheray, S., & Saby-Collet, S.
(2003). Validation of an oral health quality of life index (GOHAI) in France.
Community Dentistry and Oral Epidemiology, 31(4), 275-284.
United States Food and Drug Administration. (2007). Approximate pH of foods and food
products. Retrieved June 19, 2012 from http://foodscience.caes.uga.edu/
151
extension/documents/FDAapproximatepHoffoodslacf-phs.pdf Vartanian, L. R., Schwartz, M. B., & Brownell, K. D. (2006). Effects of soft drink
consumption on nutrition and health: A systematic review and meta-analysis.
American Journal of Public Health, 97(4), 667-675.
Vingilis, E. R., Wade, T. J., & Seeley, J. S. (2002). Predictors of adolescent self-rated
health: Analysis of the National Population Health Survey. Canadian Journal of
Public Health, 93(2), 193-197.
Von Fraunhofer, J. A., & Rogers, M. M. (2004). Dissolution of dental enamel in soft
drinks. General Dentistry, 52, 308-312.
Waldo, B. (2009). Oral health means more than just healthy teeth. Inside Dental
Hygiene, September 2009. Retrieved June 5, 2012 from
http://www.cdeworld.com/courses/4428-oral-health-means-more-than-just-
healthy-teeth
Wang, Y., Liang, H., Tussing, L., Braunschweig, C., Caballero, B., & Flay, B. (2007).
Obesity and related risk factors among low socio-economic status minority
students in Chicago. Public Health Nutrition, 10(9), 927-938,
doi: 10.1017/S1368980007658005.
Winnipeg Regional Health Authority. (2010). Your health: How much sugar is in your
drink? Retrieved June 20, 2012 from http://www.wrha.mb.ca/wave/2010/08/how-
much-sugar.php
World Health Organization. (2003). The world oral health report: Continuous
improvement of oral health in the 21st century – the approach of the WHO global
oral health programme. Geneva: World Health Organization.
World Health Organization. (2007). Oral health: Fact sheet number 318. Retrieved from
http://www.who.int/mediacentre/factsheets/fs318/en/index.html
World Health Organization. (2012). Oral health: Risks to oral health and intervention:
Diet & nutrition. Retrieved from
http://www.who.int/oral_health/action/risks/en/index.html
Wu, T., Trevisan, M., Genco, R. J., Dorn, J. P., Falkner, K. L., & Sempos, C. T. (2000).

152
Periodontal disease and risk of cerebroascular disease: The first national health
and nutrition examination survey and its follow-up study. Archives of
International Medicine, 160(160), 2749-2755.
Xu, X., Zhou, X. D., & Wu, C. D. (2010). Tea catechin EGCg suppresses the mgl gene
associated with halitosis. Journal of Dental Research, 89(11), 1304-1308.
Yusuf, H., Gherunpong, S., Sheiham, A., & Tsakos, G. (2006). Validation of an English
version of the Child-OIDP index, an oral health-related quality of life measure for
children. Health and Quality of Life Outcomes, 4(1), 38.

153
Appendix A – CHMS Questions
Sociodemographic Variables:
What is [respondent name]’s age? (AWC_Q04)
Is [respondent’s name] male or female?
Male, female. (SEX_Q01)
What is the highest degree, certificate or diploma [Respondent’s Name] has obtained?
No post-secondary degree, certificate or diploma; trade certificate or diploma from a
vocational school or apprenticeship training; Non-university certificate or diploma from
a community college, CEGEP, school of nursing, etc.; Certificate below bachelor’s level;
Bachelor’s degree; University degree or certificate above bachelor’s degree. (ED_Q04)
What is your best estimate of the total income, before taxes and deductions, of all
household members from all sources in the past 12 months? (INC_Q21)
Oral Health Variables:
In general, would you say the health of your mouth is:
Excellent, very good, good, fair, poor. (OHM_Q11)
How satisfied are you with the appearance of your teeth and/or dentures?
Very satisfied, satisfied, neither satisfied nor dissatisfied, dissatisfied, very dissatisfied.
(OHM_Q12)
(In the past 12 months,) How often have you avoided eating particular foods because of
problems with your month?
Often, Sometimes, Rarely, Never. (OHM_Q22)
154
In the past 12 months, how often have you had any other persistent or on-going pain
anywhere in your mouth?
Often, Sometimes, Rarely, Never. (OHM_Q23)
Record the mucosal status of the respondent. Mark all that apply:
1. No mucosal abnormalities
2. Angular cheilitis
3. Mucosal white patches
4. Denture stomatitis
5. Denture induced hyperplasia (epulis)
6. Glossitis
7. Sinus or fistula
8. Aphthous ulcer
9. Traumatic or unspecified ulcer
10. Other – Specify
(OHE_N14)
Beverage Variables:
How often do you usually drink regular soft drinks? (WSD_B11)
How often do you usually drink diet soft drinks (WSD_B12)
How often do you usually drinks sport drinks, such as Gatorade or Powerade?
(WSD_B13)
How often do you usually drink fruit juices (100% pure fruit juices either from
concentrate or not from concentrate)? (WSD_B14)
155
How often do you usually drink fruit-flavoured drinks (such as Sunny Delight, fruit
punch or Kool Aid)? (WSD_B15)
How often do you usually drink vegetable juices (WSD_B16)
How often do you usually drink water? (WSD_B21)
How often do you drink milk or enriched milk substitutes or use them on cereal?
(MDC_B11)
During the past 12 months have you had a drink of beer, wine, liquor or any other
alcoholic beverage?
Yes, No (ALC_Q11)
During the past 12 months, how often did you drink alcoholic beverages?
Less than once a month, once a month, 2 to 3 times a month, once a week, 2 to 3 times a
week, 4 to 6 times a week, every day (ALC_Q12)
Other Variables:
How often do you usually eat hot or cold cereal? (GFV_B11)
How often do you usually eat brown bread, including bagels, rolls, pita bread or tortillas?
(GFV_B12)

156
How often do you usually eat white bread, including bagels, rolls, pita bread or tortillas?
(GFV_B13)
How often do you usually eat any kind of pasta (including spaghetti, noodles, macaroni &
cheese or pasta salad)? (GFV_B14)
How often do you usually eat any kind of rice? (GFV_B15)
How often do you usually eat fruit (fresh, frozen or canned)? (GFV_B17)
How often do you usually eat tomatoes or tomato sauce, including salsa, tomato soup and
spaghetti sauce but excluding tomato paste, ketchup or pizza sauce? (GFV_B18)
How often do you usually eat lettuce or green leafy salad, with or without other
vegetables? (GFV_B19)
How often do you usually eat spinach, mustard greens or collards excluding kale?
(GFV_B20)
How often do you usually eat other potatoes including baked, boiled, mashed or in potato
salad, but excluding sweet potatoes? (GFV_B22)
How often do you usually eat all other types of vegetables, excluding those already
mentioned? (GFV_B23)
How often do you usually eat cottage cheese? (MDC_B13)
How often do you usually eat yogurt, excluding frozen yogurt? (MDC_B14)
How often do you usually eat ice cream or frozen yogurt? (MDC_B15)
157
In your lifetime, have you smoked a total of 100 or more cigarettes (about 4 packs)?
(SMK_Q11)
At the present time, do you smoke cigarettes daily, occasionally or not at all?
Daily, Occasionally, Not at all (SMK_Q12)
How often do you usually brush your teeth and/or dentures? (OHM_Q31)
How often do you usually floss your teeth? (OHM_Q32)
Do you usually see a dental professional?
More than once a year for check-ups or treatment, about once a year for check-ups for
treatment, less than once a year for check-ups or treatment, only for emergency care,
never. (OHM_Q33)

158
Appendix B – CHMS Derived Variables
Sociodemographic Variables:
Highest level of education – household, 4 levels (highest level of education acquired by
any member of the household) (EDUDH04 – based on ED_Q04)
Less than secondary school graduation, secondary school graduation but no post-
secondary education, some post-secondary education, post-secondary degree/diploma,
missing information
Total household income – 5 categories (INCDDIA5)
Not enough information, lowest income, lower middle income, middle income, upper
middle income, and highest income groupings
Oral Health Variables:
Gingivitis score (OHEDGS12 – OHEDGS44)
0 – No inflammation, 1 – Mild inflammation, 2 – Moderate inflammation, 3 – Severe
inflammation, 4 – Tooth missing
Number of permanent crowns recorded as 1 (sound – never decayed or restored)
(OHEDAC01) 0-28
159
Number of permanent crowns recorded as 2 (sound – crown sealed, never decayed or
restored) (OHEDAC02) 0-28
Number of deciduous teeth recorded as 1 (sound – never decayed or restored)
(OHEDDT01) 0-28
Number of deciduous teeth recorded as 2 (sound – crown sealed, never decayed or
restored) (OHEDDT02) 0-28
Beverage Variables:
Drinks milk – times per year (MDCD11Y)
Drinks regular soft drinks – times per year (WSDD11Y)
Drinks diet soft drinks – times per year (WSDD12Y)
Drinks sport drinks – times per year (WSDD13Y)
Drinks fruit juices – times per year (WSDD14Y)
Drinks fruit flavoured drinks – times per year (WSDD15Y)
Drinks vegetable juices – times per year (WSDD16Y)
Drinks water – times per year (WSDD21Y)
Alcohol – weekly consumption (ALCDWKY)
Nutrition Variables:
Number of times teeth brushed per year (OHMD31Y)

160
Number of times teeth flossed per year (OHMD32Y)
Smoking – Type of Smoker (SMKDSTY)
Current daily smoker, occasional smoker (former daily smoker), occasional smoker
(never a daily smoker or has smoked less than 100 cigarettes in lifetime), non-smoker
(former daily smoker), non-smoker (former occasional smoker, at least 100 cigarettes in
lifetime), never smoked (at least 100 cigarettes), missing information, population
exclusions
Fibre Consumption – Eats hot or cold cereal – times per year (GFVD11Y)
Fibre Consumption – Eats brown bread, including bagels, rolls, pita bread, or tortillas –
times per year (GFVD12Y)
Fibre Consumption – Eats white bread, including bagels, rolls, pita bread or tortillas –
times per year (GFVD13Y)
Fibre Consumption – Eats any kind of pasta – times per year (GFVD14Y)
Fibre Consumption – Eats any kind of rice – times per year (GFVD15Y)
Fibre Consumption – Eats fruit – times per year (GFVD17Y)
Fibre Consumption – Eats lettuce or green leafy salad – times per year (GFVD19Y)
Fibre Consumption – Eats spinach, mustard greens, or collards – times per year
(GFVD20Y)
Fibre Consumption – Eats other potatoes – times per year (GFVD22Y)

161
Fibre Consumption – Eats all other types of vegetables – times per year (GFVD23Y)
Dairy Consumption – Eats cottage cheese – times per year (MDCD13Y)
Dairy Consumption – Eats yogurt – times per year (MDCD14Y)
Dairy Consumption – Eats ice cream or frozen yogurt – times per year (MDCD15Y)