Embed Size (px)
Citation preview

Between the Tides
http://video.google.com/videosearch?q=Grunion%20run%20at%20la%20jolla&rls=com.microsoft:en-us&oe=UTF-8&startIndex=&startPage=1&um=1&hl=en&ie=UTF-8&sa=N&tab=iv#
La Jolla Grunion Run

Where?• Shoreline between high
and low tide marks
Organismal adaptations?• Community has to be
adapted to exposure to air
• Communities differ greatly depending on structure– Rocky or sandy
bottoms

What is the greatest concern to the intertidal organisms?
• Water loss or desiccation
• Take advantage of crevices, clustering, shade, tidepools, other organisms, etc.
Fig. 11.2

• Move to moisture & clamp their ventral surface to the substrate to conserve water (chitons)
• Closed mussel shells• Contracted anemone• Resilient tissues that can
withstand 75-90% water loss…tidal exposure limits activities…can be harsh conditions
Fig. 11.3Fig. 11.4
Fig. 11.5

Wave exposure and wave shock
• Adaptations to cope? – Seaweeds?
– Mussels?
– Intertidal fishes?
• Wave energy varies– Sheltered coastlines
– Angled wave approach
– Varied impact to organisms
– Gradient of impact (shock) and exposure
Fig. 11.7
Fig. 11.8

• Distribution, diversity, & abundance partially defined by exposure
• Why the differences?
Fig. 11.11
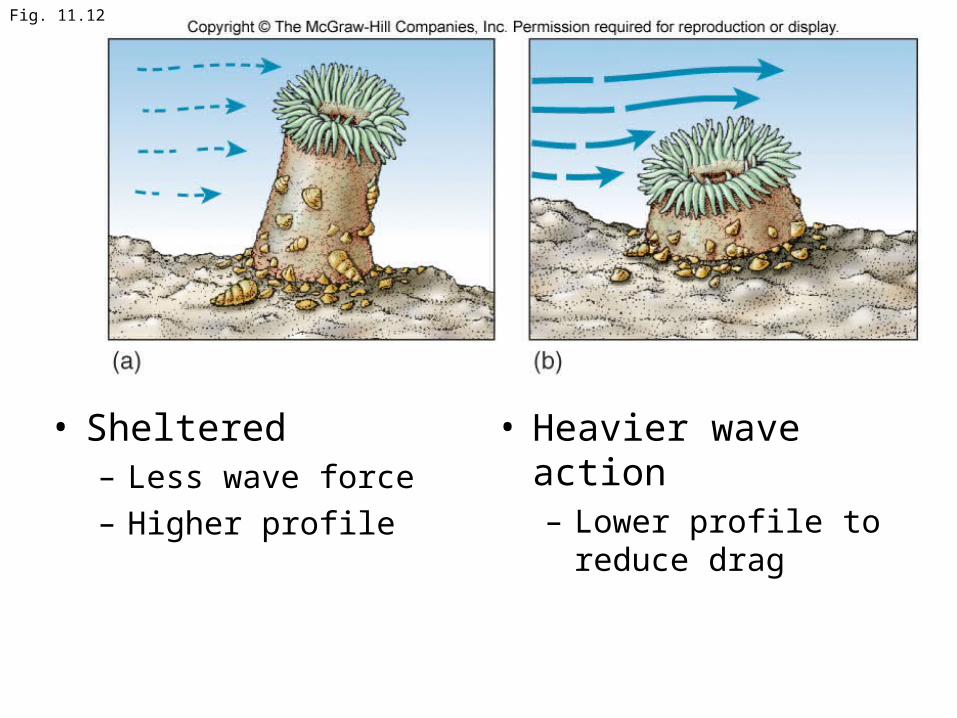
• Sheltered– Less wave force
– Higher profile
• Heavier wave action– Lower profile to reduce drag
Fig. 11.12

• Flexibility to deal with wave action
Fig. 11.13

• Safety in numbers– (a) Wave force can detach higher profile individuals– Clustering can protect from wave shock (as well as preventing
excessive desiccation).– (b) Wave force is indirect – reduced or dissipated some– (c) Too dense can be a problem sometimes
Fig. 11.14

• Shaping the intertidal zones so far…– Effects of wave exposure
• Temp, salinity, desiccation– Effects of wave shock
• What else effects organismal distribution?
• Food / nutrients• Trophic interactions
– Many suspension feeders– Grazers– Scavengers– Predators– Detritus is central
• typically most important food source
Fig. 11.15

• Space is typically most limiting resource
• Most organisms are attached to substrate– Mussel species
– Barnacle species
– Anemones, seaweed
• Much competition for any freed-up space
Fig. 11.16

What is happening here?• Juvenile sea palm settled
on mussels– Increased profile and drag
increases vulnerability of wave shock
• Mussel clumps detach
• Makes space for juvenile sea palms on substrate
Fig. 11.17

Trophic interactions & environmental adaptations define zones
• Vertical zonation– Patterns or banding of
distribution
– Upper limit set by physical factors
• Space often defines upper end of range – zones
• Exposure
– Lower limit set by biotic factors
• Predation
• Competition
Fig. 11.19
Fig. 11.18

Fig. 11.20
Fig. 11.21

Diversity and abundance• At Scripps intertidal, organismal diversity was high.• Species abundance varies with diversity
– Mussels in mod. abundance; Barnacles – mod.; Sea stars – mod.
• Keystone predators– A predatory species that significantly affects the community beyond their
abundance– Can maintain diversity
Fig. 11.22

Fig. 11.23
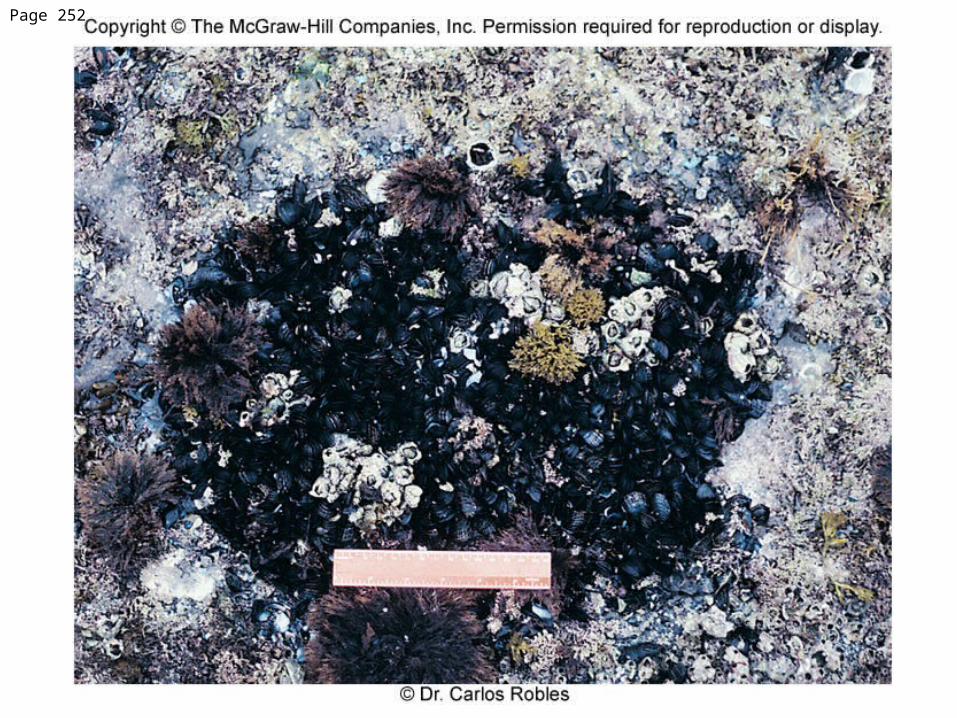
Page 252

Predation on dominant competitors = disturbance• ↓ predation = ↓ disturbance = competitive
exclusion• ↑ disturbance = ↓ establishment = ↓ diversity• Moderate disturbance = provides a balance
between abiotic and biotic factors; a chance for diverse species
Fig. 11.23 & 11.24

What about sandy intertidal areas? Beaches?
• Still get zonation patterns…– However, here many organisms are adapted for
sand/sediments rather than rocks and tidepools
Fig. 11.33 & 11.34