Embed Size (px)
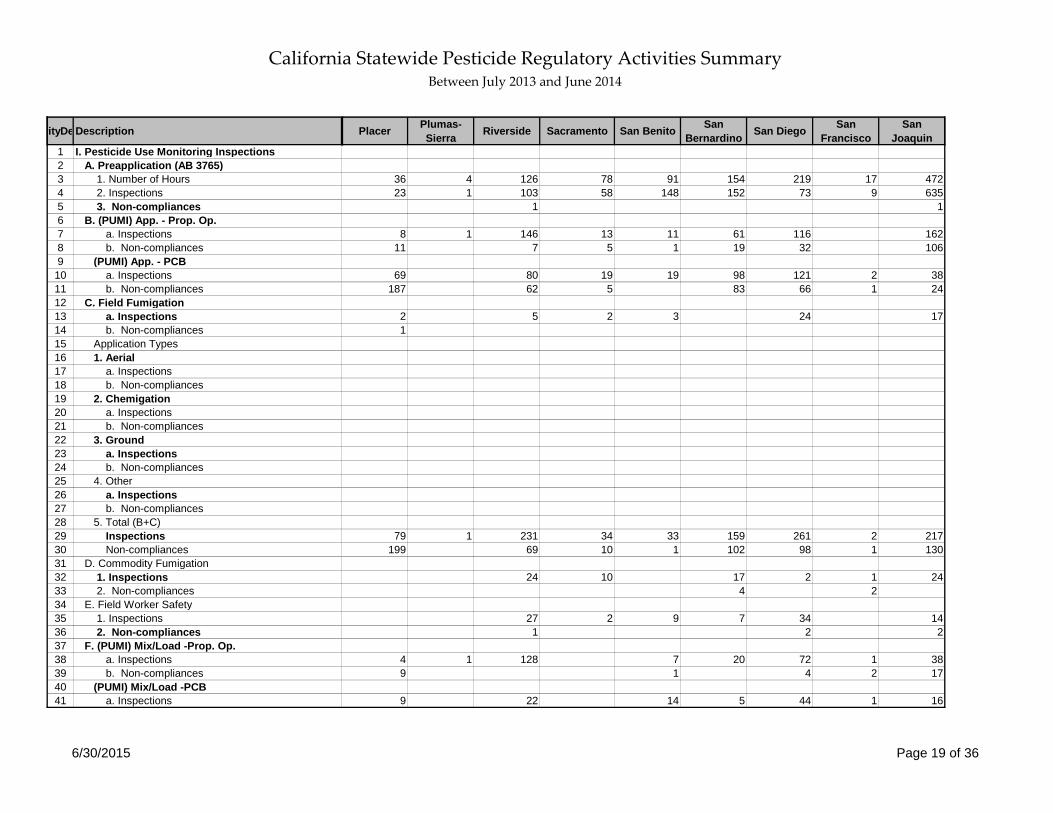
Citation preview
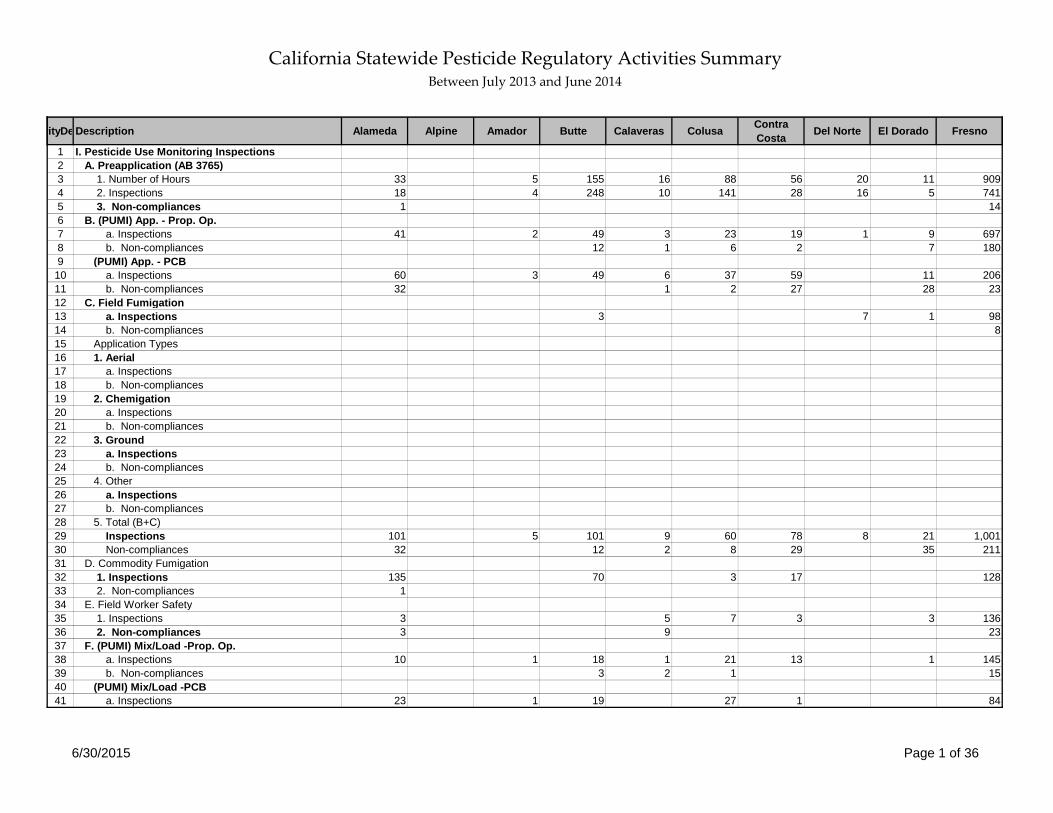
California Statewide Pesticide Regulatory Activities Summary Between July 2013 and June 2014
6/30/2015 Page 1 of 36
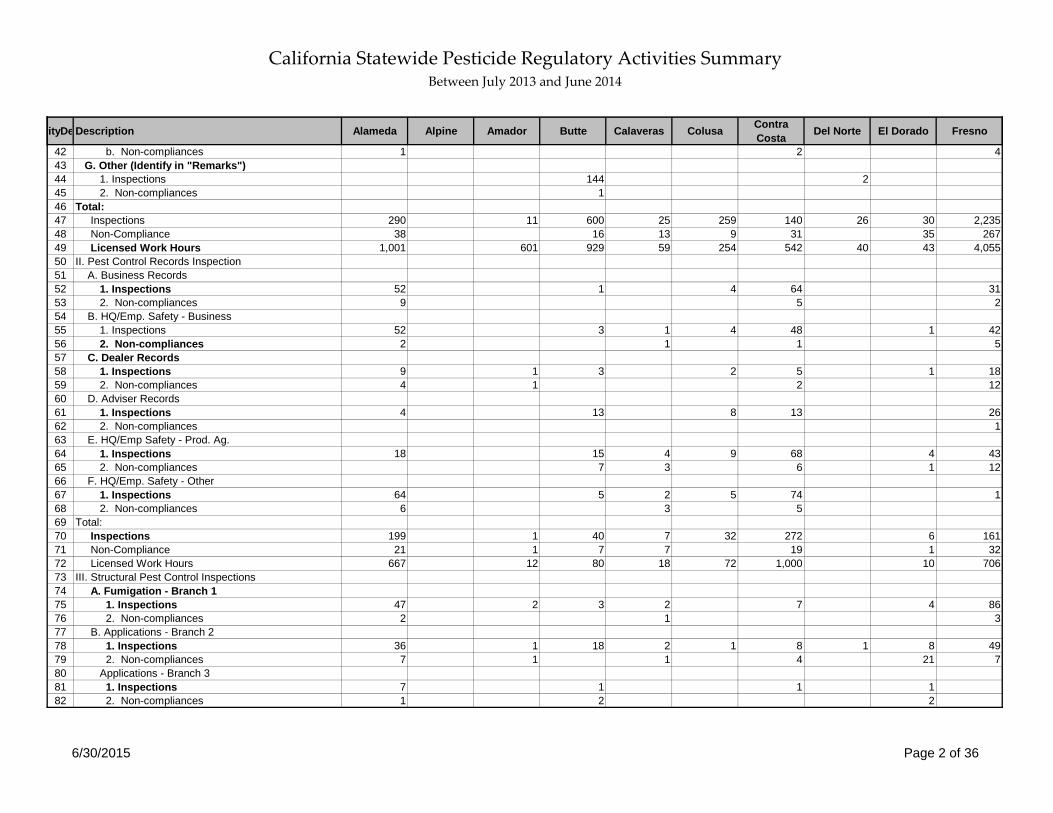
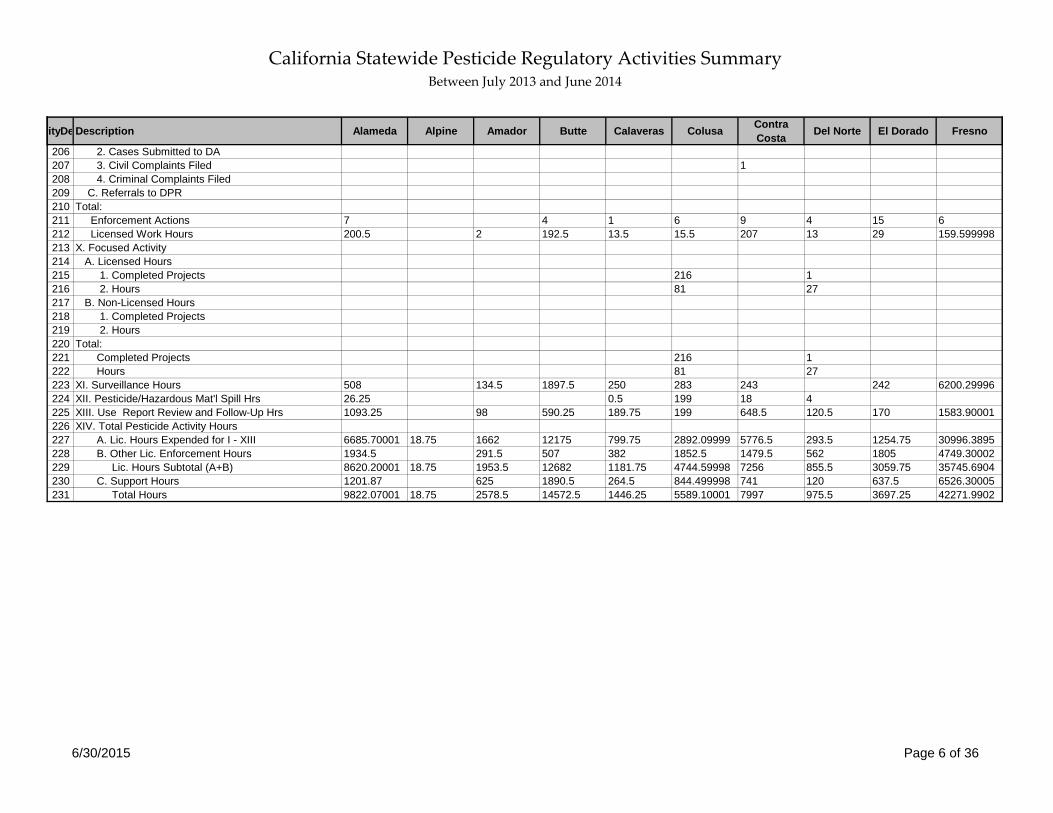
vityDe Description Alameda Alpine Amador Butte Calaveras Colusa Contra Costa Del Norte El Dorado Fresno
1 I. Pesticide Use Monitoring Inspections2 A. Preapplication (AB 3765)3 1. Number of Hours 33 5 155 16 88 56 20 11 9094 2. Inspections 18 4 248 10 141 28 16 5 7415 3. Non-compliances 1 146 B. (PUMI) App. - Prop. Op.7 a. Inspections 41 2 49 3 23 19 1 9 6978 b. Non-compliances 12 1 6 2 7 1809 (PUMI) App. - PCB
10 a. Inspections 60 3 49 6 37 59 11 20611 b. Non-compliances 32 1 2 27 28 2312 C. Field Fumigation13 a. Inspections 3 7 1 9814 b. Non-compliances 815 Application Types16 1. Aerial17 a. Inspections18 b. Non-compliances19 2. Chemigation20 a. Inspections21 b. Non-compliances22 3. Ground23 a. Inspections24 b. Non-compliances25 4. Other26 a. Inspections27 b. Non-compliances28 5. Total (B+C)29 Inspections 101 5 101 9 60 78 8 21 1,00130 Non-compliances 32 12 2 8 29 35 21131 D. Commodity Fumigation32 1. Inspections 135 70 3 17 12833 2. Non-compliances 134 E. Field Worker Safety35 1. Inspections 3 5 7 3 3 13636 2. Non-compliances 3 9 2337 F. (PUMI) Mix/Load -Prop. Op.38 a. Inspections 10 1 18 1 21 13 1 14539 b. Non-compliances 3 2 1 1540 (PUMI) Mix/Load -PCB41 a. Inspections 23 1 19 27 1 84
California Statewide Pesticide Regulatory Activities Summary Between July 2013 and June 2014
6/30/2015 Page 2 of 36
vityDe Description Alameda Alpine Amador Butte Calaveras Colusa Contra Costa Del Norte El Dorado Fresno
42 b. Non-compliances 1 2 443 G. Other (Identify in "Remarks")44 1. Inspections 144 245 2. Non-compliances 146 Total:47 Inspections 290 11 600 25 259 140 26 30 2,23548 Non-Compliance 38 16 13 9 31 35 26749 Licensed Work Hours 1,001 601 929 59 254 542 40 43 4,05550 II. Pest Control Records Inspection51 A. Business Records52 1. Inspections 52 1 4 64 3153 2. Non-compliances 9 5 254 B. HQ/Emp. Safety - Business55 1. Inspections 52 3 1 4 48 1 4256 2. Non-compliances 2 1 1 557 C. Dealer Records58 1. Inspections 9 1 3 2 5 1 1859 2. Non-compliances 4 1 2 1260 D. Adviser Records61 1. Inspections 4 13 8 13 2662 2. Non-compliances 163 E. HQ/Emp Safety - Prod. Ag.64 1. Inspections 18 15 4 9 68 4 4365 2. Non-compliances 7 3 6 1 1266 F. HQ/Emp. Safety - Other67 1. Inspections 64 5 2 5 74 168 2. Non-compliances 6 3 569 Total:70 Inspections 199 1 40 7 32 272 6 16171 Non-Compliance 21 1 7 7 19 1 3272 Licensed Work Hours 667 12 80 18 72 1,000 10 70673 III. Structural Pest Control Inspections74 A. Fumigation - Branch 175 1. Inspections 47 2 3 2 7 4 8676 2. Non-compliances 2 1 377 B. Applications - Branch 278 1. Inspections 36 1 18 2 1 8 1 8 4979 2. Non-compliances 7 1 1 4 21 780 Applications - Branch 381 1. Inspections 7 1 1 182 2. Non-compliances 1 2 2
California Statewide Pesticide Regulatory Activities Summary Between July 2013 and June 2014
6/30/2015 Page 3 of 36
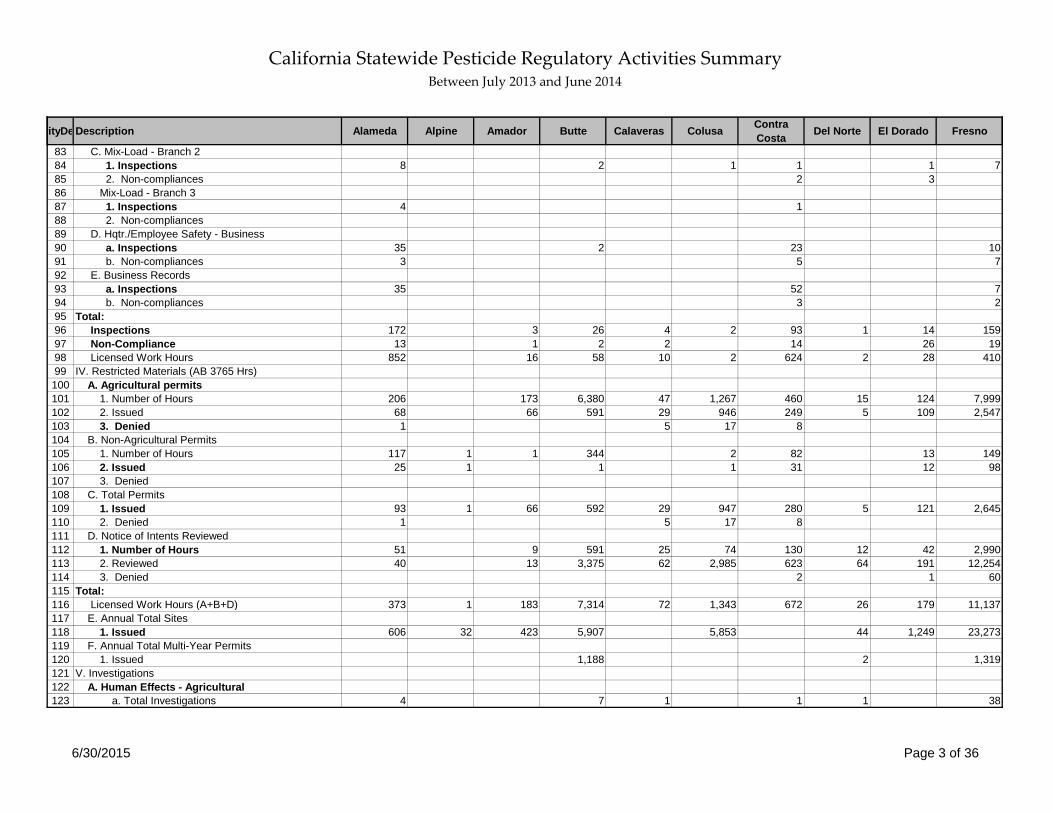
vityDe Description Alameda Alpine Amador Butte Calaveras Colusa Contra Costa Del Norte El Dorado Fresno
83 C. Mix-Load - Branch 284 1. Inspections 8 2 1 1 1 785 2. Non-compliances 2 386 Mix-Load - Branch 387 1. Inspections 4 188 2. Non-compliances89 D. Hqtr./Employee Safety - Business90 a. Inspections 35 2 23 1091 b. Non-compliances 3 5 792 E. Business Records93 a. Inspections 35 52 794 b. Non-compliances 3 295 Total:96 Inspections 172 3 26 4 2 93 1 14 15997 Non-Compliance 13 1 2 2 14 26 1998 Licensed Work Hours 852 16 58 10 2 624 2 28 41099 IV. Restricted Materials (AB 3765 Hrs)100 A. Agricultural permits101 1. Number of Hours 206 173 6,380 47 1,267 460 15 124 7,999102 2. Issued 68 66 591 29 946 249 5 109 2,547103 3. Denied 1 5 17 8104 B. Non-Agricultural Permits105 1. Number of Hours 117 1 1 344 2 82 13 149106 2. Issued 25 1 1 1 31 12 98107 3. Denied108 C. Total Permits109 1. Issued 93 1 66 592 29 947 280 5 121 2,645110 2. Denied 1 5 17 8111 D. Notice of Intents Reviewed112 1. Number of Hours 51 9 591 25 74 130 12 42 2,990113 2. Reviewed 40 13 3,375 62 2,985 623 64 191 12,254114 3. Denied 2 1 60115 Total:116 Licensed Work Hours (A+B+D) 373 1 183 7,314 72 1,343 672 26 179 11,137117 E. Annual Total Sites118 1. Issued 606 32 423 5,907 5,853 44 1,249 23,273119 F. Annual Total Multi-Year Permits120 1. Issued 1,188 2 1,319121 V. Investigations122 A. Human Effects - Agricultural123 a. Total Investigations 4 7 1 1 1 38
California Statewide Pesticide Regulatory Activities Summary Between July 2013 and June 2014
6/30/2015 Page 4 of 36
vityDe Description Alameda Alpine Amador Butte Calaveras Colusa Contra Costa Del Norte El Dorado Fresno
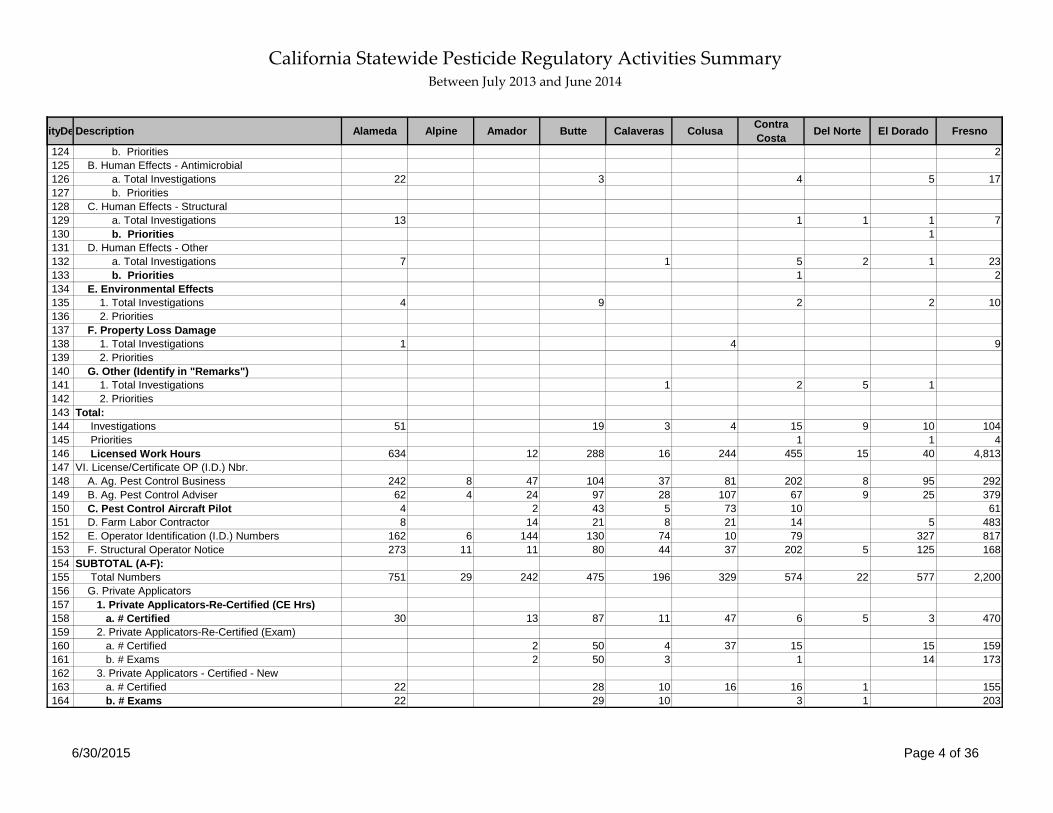
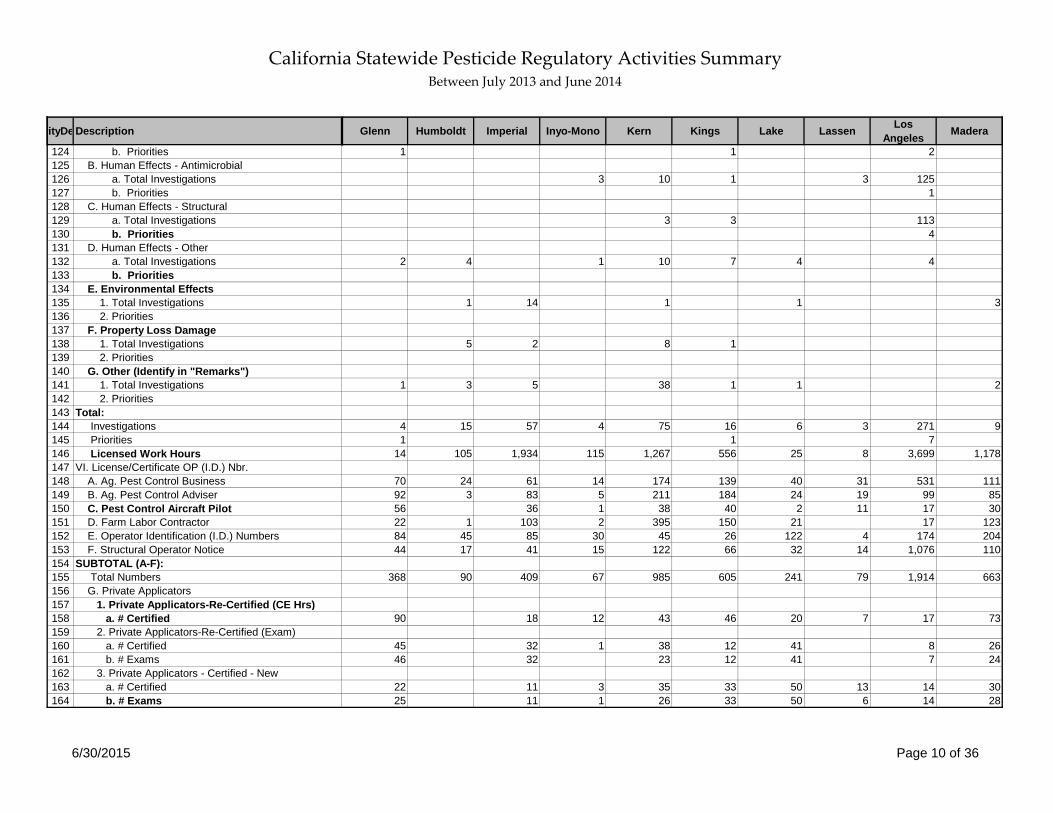
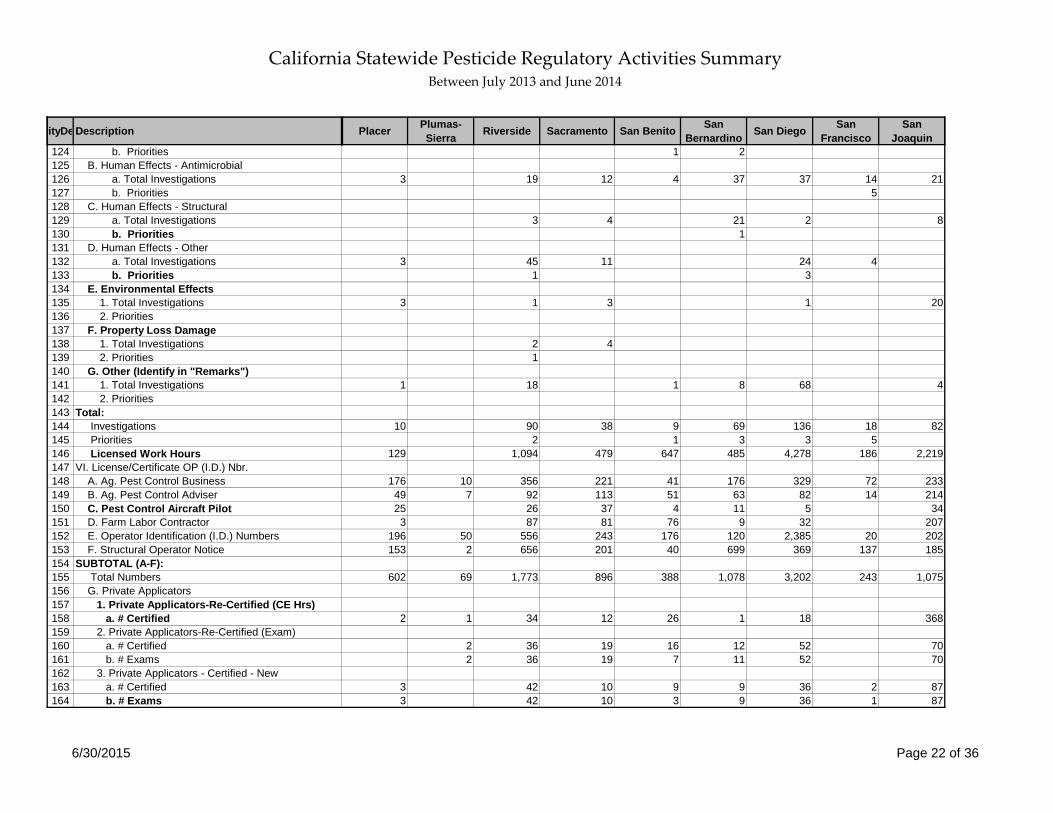
124 b. Priorities 2125 B. Human Effects - Antimicrobial126 a. Total Investigations 22 3 4 5 17127 b. Priorities128 C. Human Effects - Structural129 a. Total Investigations 13 1 1 1 7130 b. Priorities 1131 D. Human Effects - Other132 a. Total Investigations 7 1 5 2 1 23133 b. Priorities 1 2134 E. Environmental Effects135 1. Total Investigations 4 9 2 2 10136 2. Priorities137 F. Property Loss Damage138 1. Total Investigations 1 4 9139 2. Priorities140 G. Other (Identify in "Remarks")141 1. Total Investigations 1 2 5 1142 2. Priorities143 Total:144 Investigations 51 19 3 4 15 9 10 104145 Priorities 1 1 4146 Licensed Work Hours 634 12 288 16 244 455 15 40 4,813147 VI. License/Certificate OP (I.D.) Nbr.148 A. Ag. Pest Control Business 242 8 47 104 37 81 202 8 95 292149 B. Ag. Pest Control Adviser 62 4 24 97 28 107 67 9 25 379150 C. Pest Control Aircraft Pilot 4 2 43 5 73 10 61151 D. Farm Labor Contractor 8 14 21 8 21 14 5 483152 E. Operator Identification (I.D.) Numbers 162 6 144 130 74 10 79 327 817153 F. Structural Operator Notice 273 11 11 80 44 37 202 5 125 168154 SUBTOTAL (A-F):155 Total Numbers 751 29 242 475 196 329 574 22 577 2,200156 G. Private Applicators157 1. Private Applicators-Re-Certified (CE Hrs)158 a. # Certified 30 13 87 11 47 6 5 3 470159 2. Private Applicators-Re-Certified (Exam)160 a. # Certified 2 50 4 37 15 15 159161 b. # Exams 2 50 3 1 14 173162 3. Private Applicators - Certified - New163 a. # Certified 22 28 10 16 16 1 155164 b. # Exams 22 29 10 3 1 203
California Statewide Pesticide Regulatory Activities Summary Between July 2013 and June 2014
6/30/2015 Page 5 of 36
vityDe Description Alameda Alpine Amador Butte Calaveras Colusa Contra Costa Del Norte El Dorado Fresno
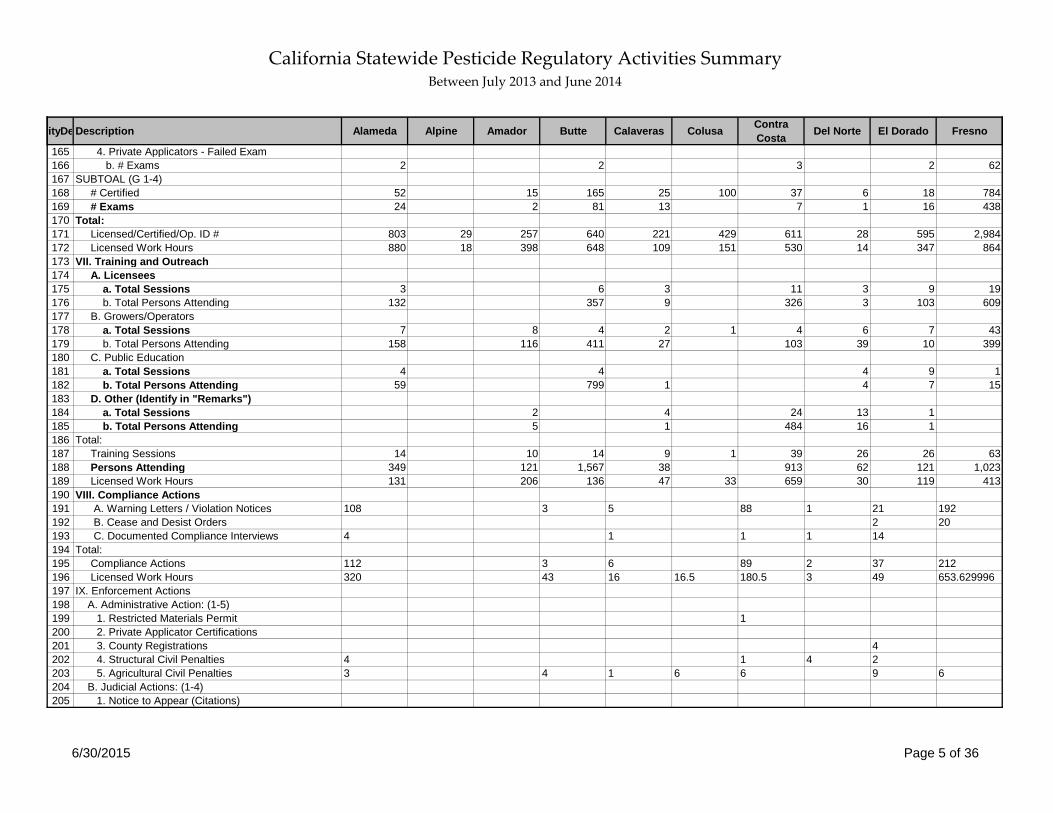
165 4. Private Applicators - Failed Exam166 b. # Exams 2 2 3 2 62167 SUBTOAL (G 1-4)168 # Certified 52 15 165 25 100 37 6 18 784169 # Exams 24 2 81 13 7 1 16 438170 Total:171 Licensed/Certified/Op. ID # 803 29 257 640 221 429 611 28 595 2,984172 Licensed Work Hours 880 18 398 648 109 151 530 14 347 864173 VII. Training and Outreach174 A. Licensees175 a. Total Sessions 3 6 3 11 3 9 19176 b. Total Persons Attending 132 357 9 326 3 103 609177 B. Growers/Operators178 a. Total Sessions 7 8 4 2 1 4 6 7 43179 b. Total Persons Attending 158 116 411 27 103 39 10 399180 C. Public Education181 a. Total Sessions 4 4 4 9 1182 b. Total Persons Attending 59 799 1 4 7 15183 D. Other (Identify in "Remarks")184 a. Total Sessions 2 4 24 13 1185 b. Total Persons Attending 5 1 484 16 1186 Total:187 Training Sessions 14 10 14 9 1 39 26 26 63188 Persons Attending 349 121 1,567 38 913 62 121 1,023189 Licensed Work Hours 131 206 136 47 33 659 30 119 413190 VIII. Compliance Actions191 A. Warning Letters / Violation Notices 108 3 5 88 1 21 192192 B. Cease and Desist Orders 2 20193 C. Documented Compliance Interviews 4 1 1 1 14194 Total:195 Compliance Actions 112 3 6 89 2 37 212196 Licensed Work Hours 320 43 16 16.5 180.5 3 49 653.629996197 IX. Enforcement Actions198 A. Administrative Action: (1-5)199 1. Restricted Materials Permit 1200 2. Private Applicator Certifications201 3. County Registrations 4202 4. Structural Civil Penalties 4 1 4 2203 5. Agricultural Civil Penalties 3 4 1 6 6 9 6204 B. Judicial Actions: (1-4)205 1. Notice to Appear (Citations)
California Statewide Pesticide Regulatory Activities Summary Between July 2013 and June 2014
6/30/2015 Page 6 of 36
vityDe Description Alameda Alpine Amador Butte Calaveras Colusa Contra Costa Del Norte El Dorado Fresno
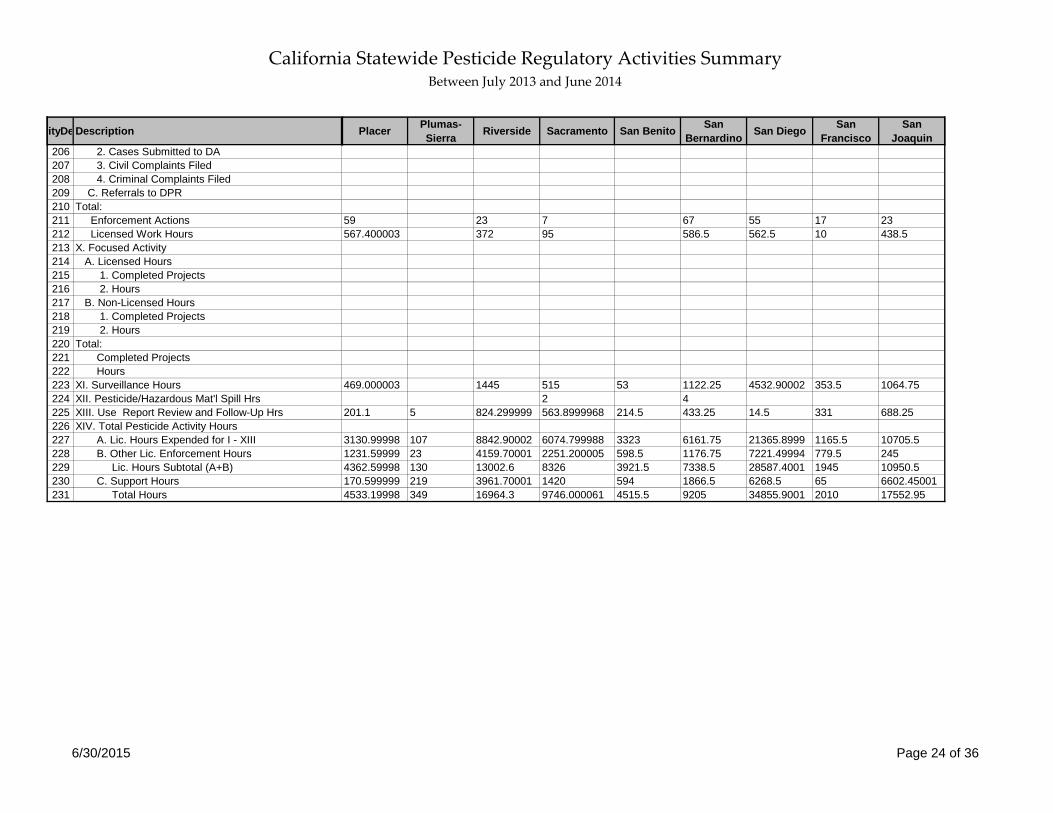
206 2. Cases Submitted to DA207 3. Civil Complaints Filed 1208 4. Criminal Complaints Filed209 C. Referrals to DPR210 Total:211 Enforcement Actions 7 4 1 6 9 4 15 6212 Licensed Work Hours 200.5 2 192.5 13.5 15.5 207 13 29 159.599998213 X. Focused Activity214 A. Licensed Hours215 1. Completed Projects 216 1216 2. Hours 81 27217 B. Non-Licensed Hours218 1. Completed Projects219 2. Hours220 Total:221 Completed Projects 216 1222 Hours 81 27223 XI. Surveillance Hours 508 134.5 1897.5 250 283 243 242 6200.29996224 XII. Pesticide/Hazardous Mat'l Spill Hrs 26.25 0.5 199 18 4225 XIII. Use Report Review and Follow-Up Hrs 1093.25 98 590.25 189.75 199 648.5 120.5 170 1583.90001226 XIV. Total Pesticide Activity Hours227 A. Lic. Hours Expended for I - XIII 6685.70001 18.75 1662 12175 799.75 2892.09999 5776.5 293.5 1254.75 30996.3895228 B. Other Lic. Enforcement Hours 1934.5 291.5 507 382 1852.5 1479.5 562 1805 4749.30002229 Lic. Hours Subtotal (A+B) 8620.20001 18.75 1953.5 12682 1181.75 4744.59998 7256 855.5 3059.75 35745.6904230 C. Support Hours 1201.87 625 1890.5 264.5 844.499998 741 120 637.5 6526.30005231 Total Hours 9822.07001 18.75 2578.5 14572.5 1446.25 5589.10001 7997 975.5 3697.25 42271.9902
California Statewide Pesticide Regulatory Activities Summary Between July 2013 and June 2014
6/30/2015 Page 7 of 36
vityDe Description
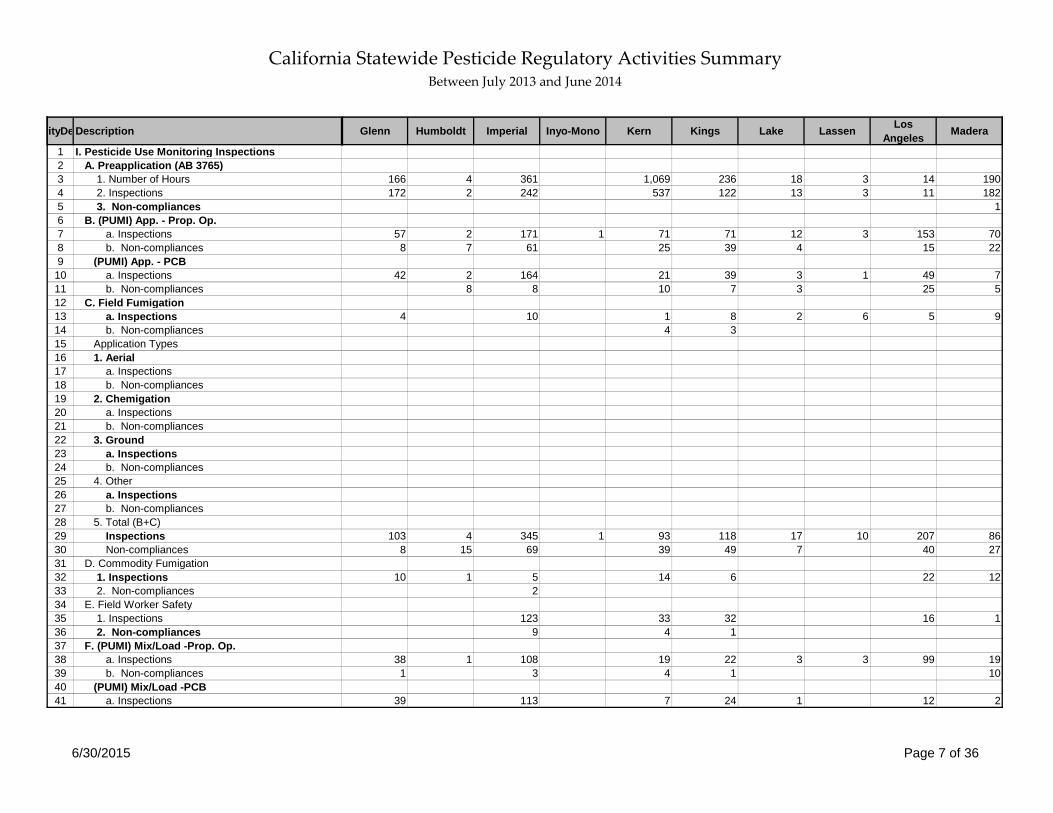
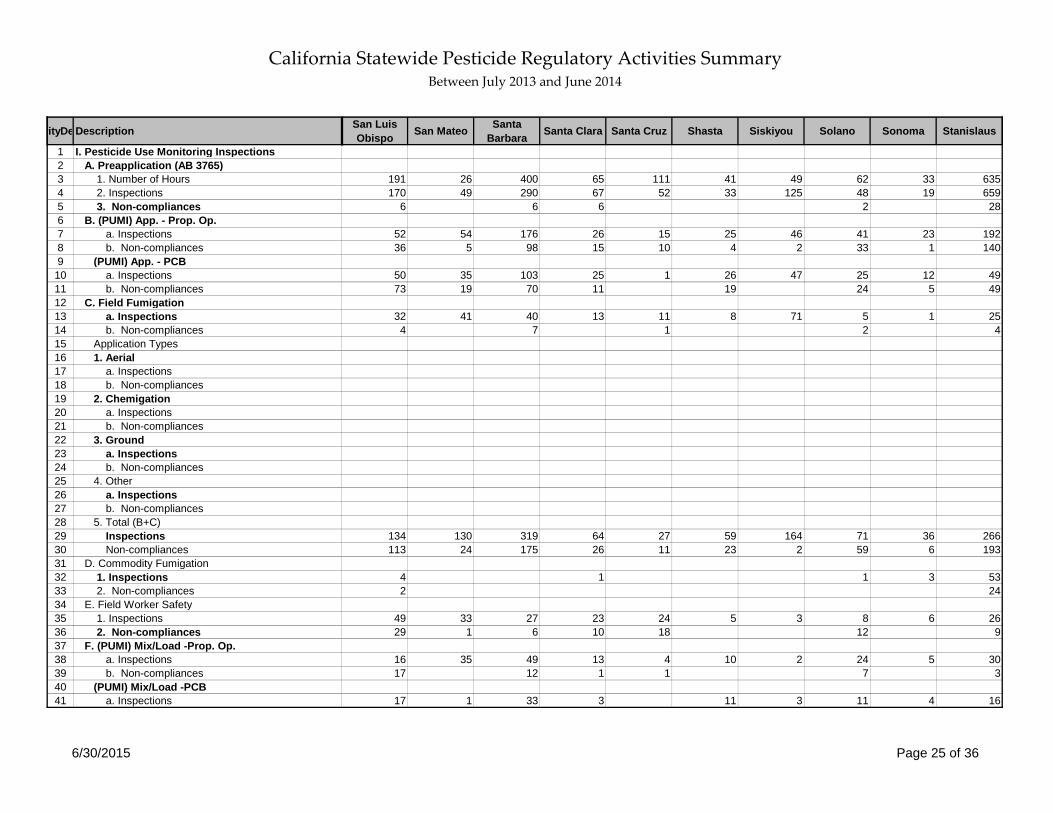
1 I. Pesticide Use Monitoring Inspections2 A. Preapplication (AB 3765)3 1. Number of Hours4 2. Inspections5 3. Non-compliances6 B. (PUMI) App. - Prop. Op.7 a. Inspections8 b. Non-compliances9 (PUMI) App. - PCB
10 a. Inspections11 b. Non-compliances12 C. Field Fumigation13 a. Inspections14 b. Non-compliances15 Application Types16 1. Aerial17 a. Inspections18 b. Non-compliances19 2. Chemigation20 a. Inspections21 b. Non-compliances22 3. Ground23 a. Inspections24 b. Non-compliances25 4. Other26 a. Inspections27 b. Non-compliances28 5. Total (B+C)29 Inspections30 Non-compliances31 D. Commodity Fumigation32 1. Inspections33 2. Non-compliances34 E. Field Worker Safety35 1. Inspections36 2. Non-compliances37 F. (PUMI) Mix/Load -Prop. Op.38 a. Inspections39 b. Non-compliances40 (PUMI) Mix/Load -PCB41 a. Inspections
Glenn Humboldt Imperial Inyo-Mono Kern Kings Lake Lassen Los Angeles Madera
166 4 361 1,069 236 18 3 14 190172 2 242 537 122 13 3 11 182
1
57 2 171 1 71 71 12 3 153 708 7 61 25 39 4 15 22
42 2 164 21 39 3 1 49 78 8 10 7 3 25 5
4 10 1 8 2 6 5 94 3
103 4 345 1 93 118 17 10 207 868 15 69 39 49 7 40 27
10 1 5 14 6 22 122
123 33 32 16 19 4 1
38 1 108 19 22 3 3 99 191 3 4 1 10
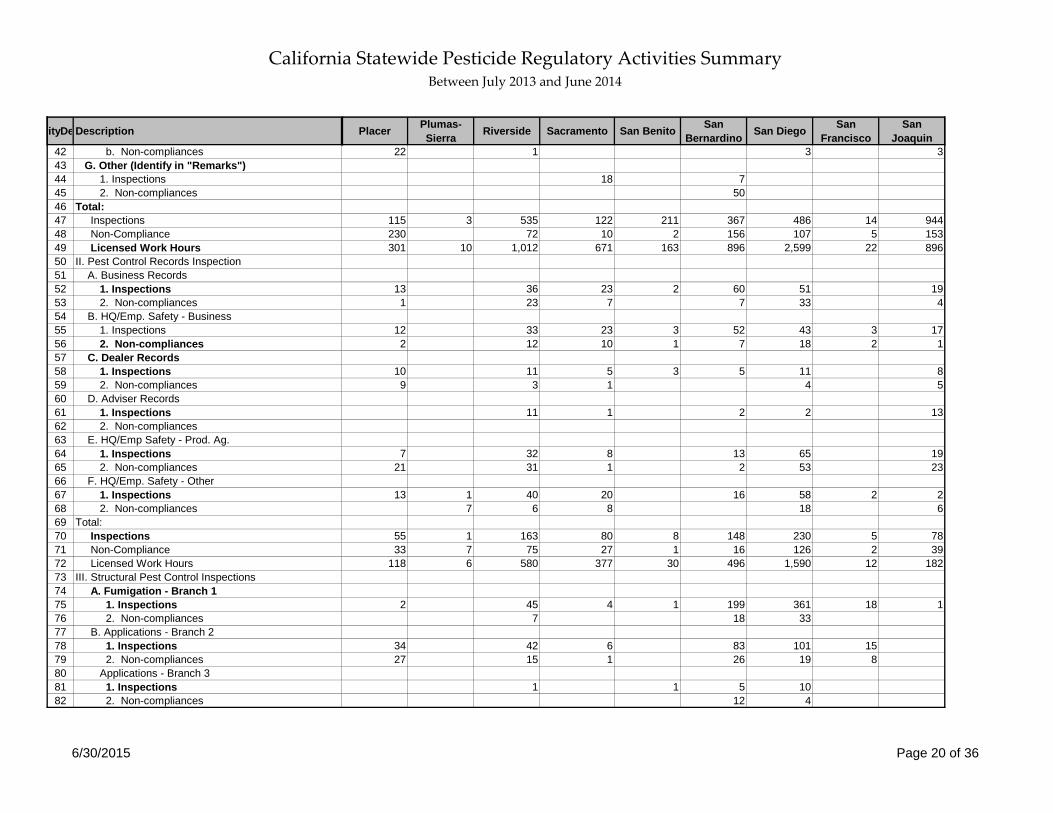
39 113 7 24 1 12 2
California Statewide Pesticide Regulatory Activities Summary Between July 2013 and June 2014
6/30/2015 Page 8 of 36
vityDe Description
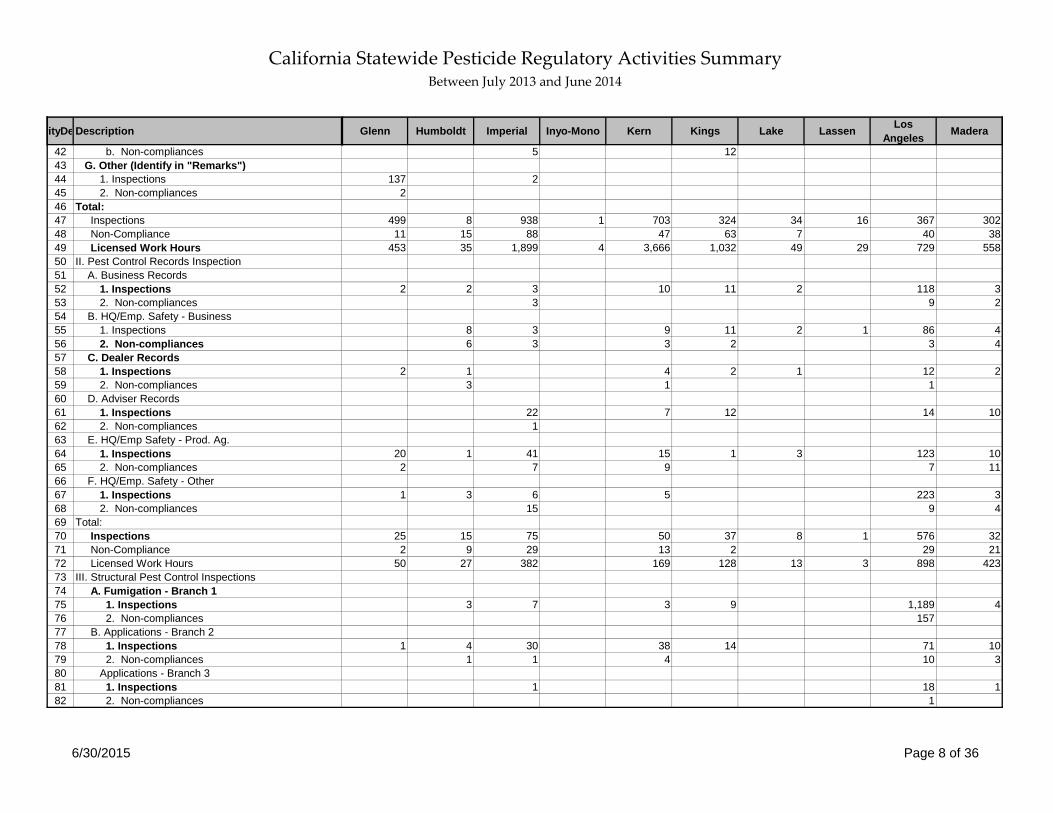
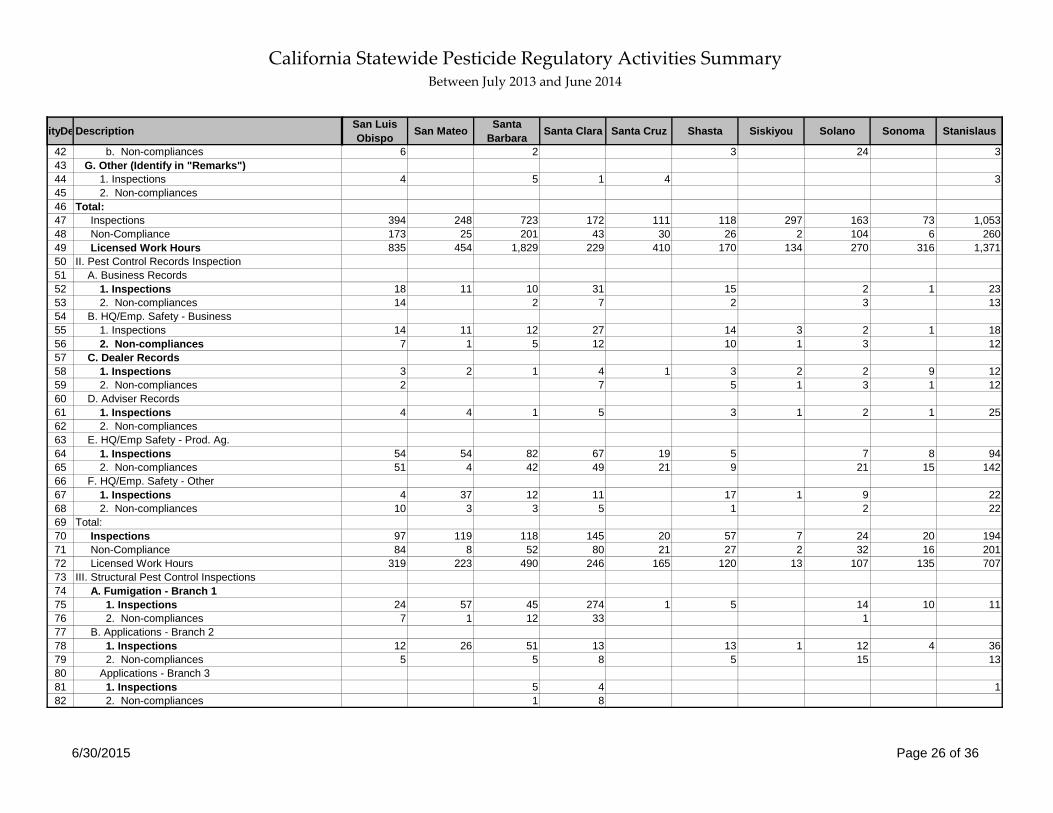
42 b. Non-compliances43 G. Other (Identify in "Remarks")44 1. Inspections45 2. Non-compliances46 Total:47 Inspections48 Non-Compliance49 Licensed Work Hours50 II. Pest Control Records Inspection51 A. Business Records52 1. Inspections53 2. Non-compliances54 B. HQ/Emp. Safety - Business55 1. Inspections56 2. Non-compliances57 C. Dealer Records58 1. Inspections59 2. Non-compliances60 D. Adviser Records61 1. Inspections62 2. Non-compliances63 E. HQ/Emp Safety - Prod. Ag.64 1. Inspections65 2. Non-compliances66 F. HQ/Emp. Safety - Other67 1. Inspections68 2. Non-compliances69 Total:70 Inspections71 Non-Compliance72 Licensed Work Hours73 III. Structural Pest Control Inspections74 A. Fumigation - Branch 175 1. Inspections76 2. Non-compliances77 B. Applications - Branch 278 1. Inspections79 2. Non-compliances80 Applications - Branch 381 1. Inspections82 2. Non-compliances
Glenn Humboldt Imperial Inyo-Mono Kern Kings Lake Lassen Los Angeles Madera
5 12
137 22
499 8 938 1 703 324 34 16 367 30211 15 88 47 63 7 40 38
453 35 1,899 4 3,666 1,032 49 29 729 558
2 2 3 10 11 2 118 33 9 2
8 3 9 11 2 1 86 46 3 3 2 3 4
2 1 4 2 1 12 23 1 1
22 7 12 14 101
20 1 41 15 1 3 123 102 7 9 7 11
1 3 6 5 223 315 9 4
25 15 75 50 37 8 1 576 322 9 29 13 2 29 21
50 27 382 169 128 13 3 898 423
3 7 3 9 1,189 4157
1 4 30 38 14 71 101 1 4 10 3
1 18 11
California Statewide Pesticide Regulatory Activities Summary Between July 2013 and June 2014
6/30/2015 Page 9 of 36
vityDe Description
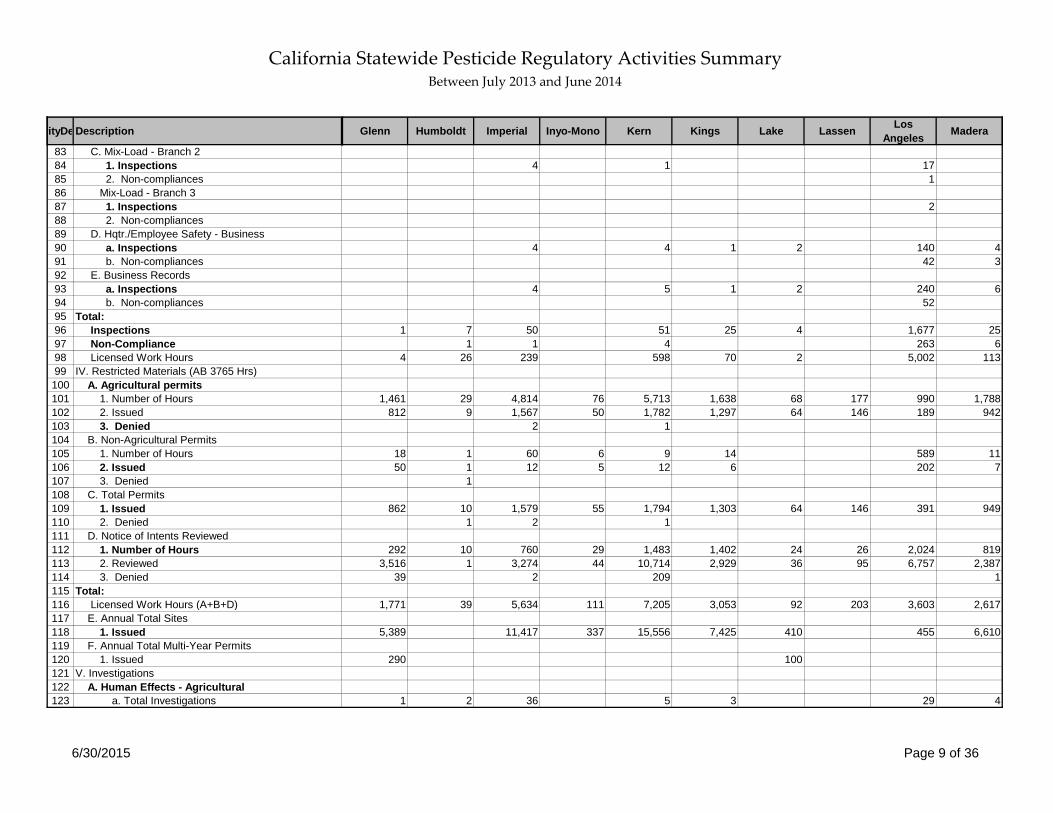
83 C. Mix-Load - Branch 284 1. Inspections85 2. Non-compliances86 Mix-Load - Branch 387 1. Inspections88 2. Non-compliances89 D. Hqtr./Employee Safety - Business90 a. Inspections91 b. Non-compliances92 E. Business Records93 a. Inspections94 b. Non-compliances95 Total:96 Inspections97 Non-Compliance98 Licensed Work Hours99 IV. Restricted Materials (AB 3765 Hrs)100 A. Agricultural permits101 1. Number of Hours102 2. Issued103 3. Denied104 B. Non-Agricultural Permits105 1. Number of Hours106 2. Issued107 3. Denied108 C. Total Permits109 1. Issued110 2. Denied111 D. Notice of Intents Reviewed112 1. Number of Hours113 2. Reviewed114 3. Denied115 Total:116 Licensed Work Hours (A+B+D)117 E. Annual Total Sites118 1. Issued119 F. Annual Total Multi-Year Permits120 1. Issued121 V. Investigations122 A. Human Effects - Agricultural123 a. Total Investigations
Glenn Humboldt Imperial Inyo-Mono Kern Kings Lake Lassen Los Angeles Madera
4 1 171
2
4 4 1 2 140 442 3
4 5 1 2 240 652
1 7 50 51 25 4 1,677 251 1 4 263 6
4 26 239 598 70 2 5,002 113
1,461 29 4,814 76 5,713 1,638 68 177 990 1,788812 9 1,567 50 1,782 1,297 64 146 189 942
2 1
18 1 60 6 9 14 589 1150 1 12 5 12 6 202 7
1
862 10 1,579 55 1,794 1,303 64 146 391 9491 2 1
292 10 760 29 1,483 1,402 24 26 2,024 8193,516 1 3,274 44 10,714 2,929 36 95 6,757 2,387
39 2 209 1
1,771 39 5,634 111 7,205 3,053 92 203 3,603 2,617
5,389 11,417 337 15,556 7,425 410 455 6,610
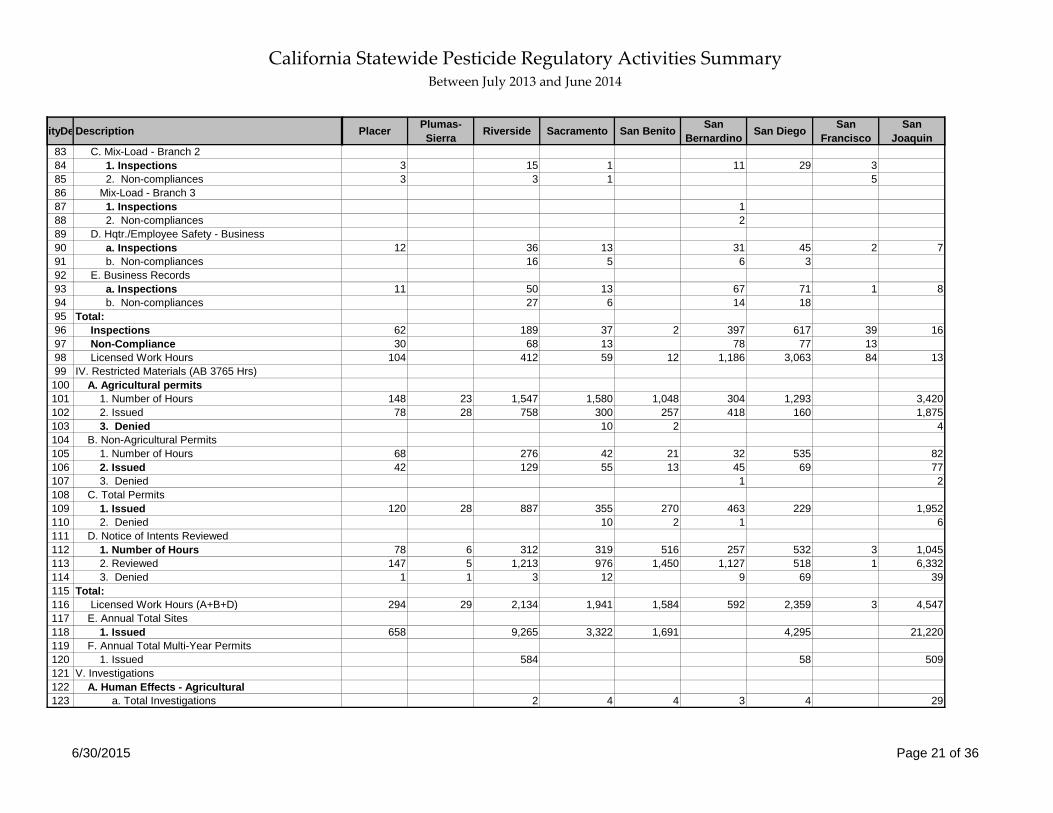
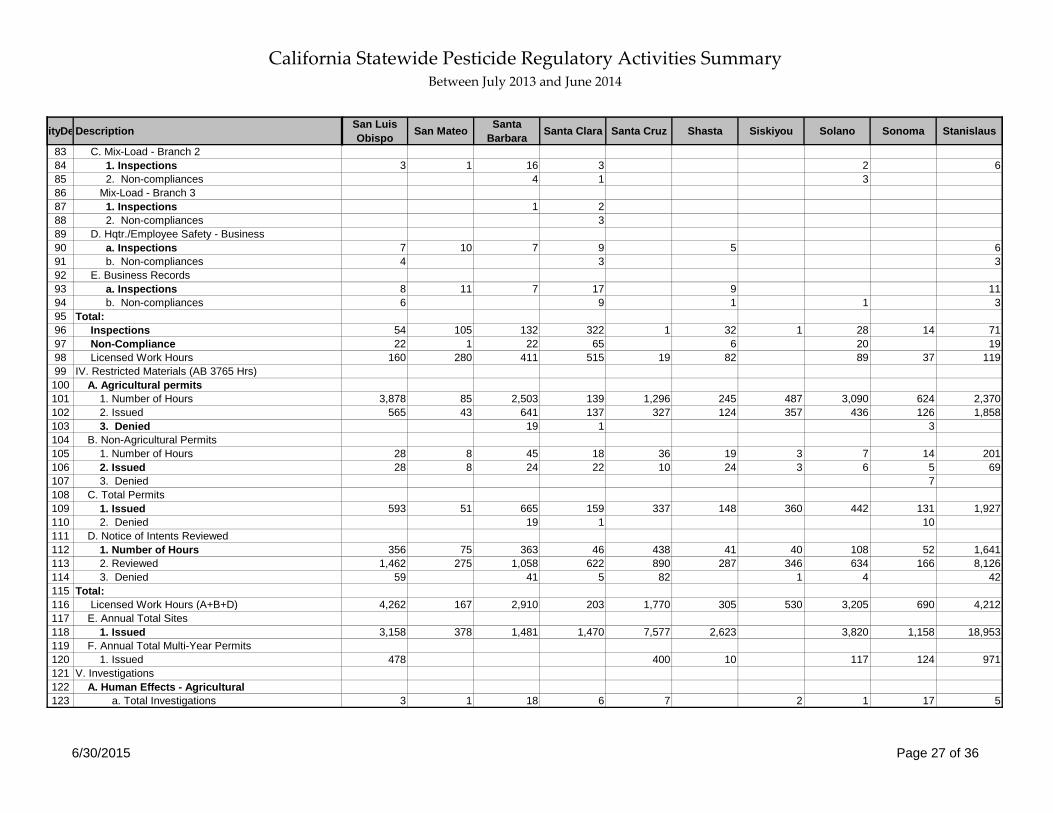
290 100
1 2 36 5 3 29 4
California Statewide Pesticide Regulatory Activities Summary Between July 2013 and June 2014
6/30/2015 Page 10 of 36
vityDe Description
124 b. Priorities125 B. Human Effects - Antimicrobial126 a. Total Investigations127 b. Priorities128 C. Human Effects - Structural129 a. Total Investigations130 b. Priorities131 D. Human Effects - Other132 a. Total Investigations133 b. Priorities134 E. Environmental Effects135 1. Total Investigations136 2. Priorities137 F. Property Loss Damage138 1. Total Investigations139 2. Priorities140 G. Other (Identify in "Remarks")141 1. Total Investigations142 2. Priorities143 Total:144 Investigations145 Priorities146 Licensed Work Hours147 VI. License/Certificate OP (I.D.) Nbr.148 A. Ag. Pest Control Business149 B. Ag. Pest Control Adviser150 C. Pest Control Aircraft Pilot151 D. Farm Labor Contractor152 E. Operator Identification (I.D.) Numbers153 F. Structural Operator Notice154 SUBTOTAL (A-F):155 Total Numbers156 G. Private Applicators157 1. Private Applicators-Re-Certified (CE Hrs)158 a. # Certified159 2. Private Applicators-Re-Certified (Exam)160 a. # Certified161 b. # Exams162 3. Private Applicators - Certified - New163 a. # Certified164 b. # Exams
Glenn Humboldt Imperial Inyo-Mono Kern Kings Lake Lassen Los Angeles Madera
1 1 2
3 10 1 3 1251
3 3 1134
2 4 1 10 7 4 4
1 14 1 1 3
5 2 8 1
1 3 5 38 1 1 2
4 15 57 4 75 16 6 3 271 91 1 7
14 105 1,934 115 1,267 556 25 8 3,699 1,178
70 24 61 14 174 139 40 31 531 11192 3 83 5 211 184 24 19 99 8556 36 1 38 40 2 11 17 3022 1 103 2 395 150 21 17 12384 45 85 30 45 26 122 4 174 20444 17 41 15 122 66 32 14 1,076 110
368 90 409 67 985 605 241 79 1,914 663
90 18 12 43 46 20 7 17 73
45 32 1 38 12 41 8 2646 32 23 12 41 7 24
22 11 3 35 33 50 13 14 3025 11 1 26 33 50 6 14 28
California Statewide Pesticide Regulatory Activities Summary Between July 2013 and June 2014
6/30/2015 Page 11 of 36
vityDe Description
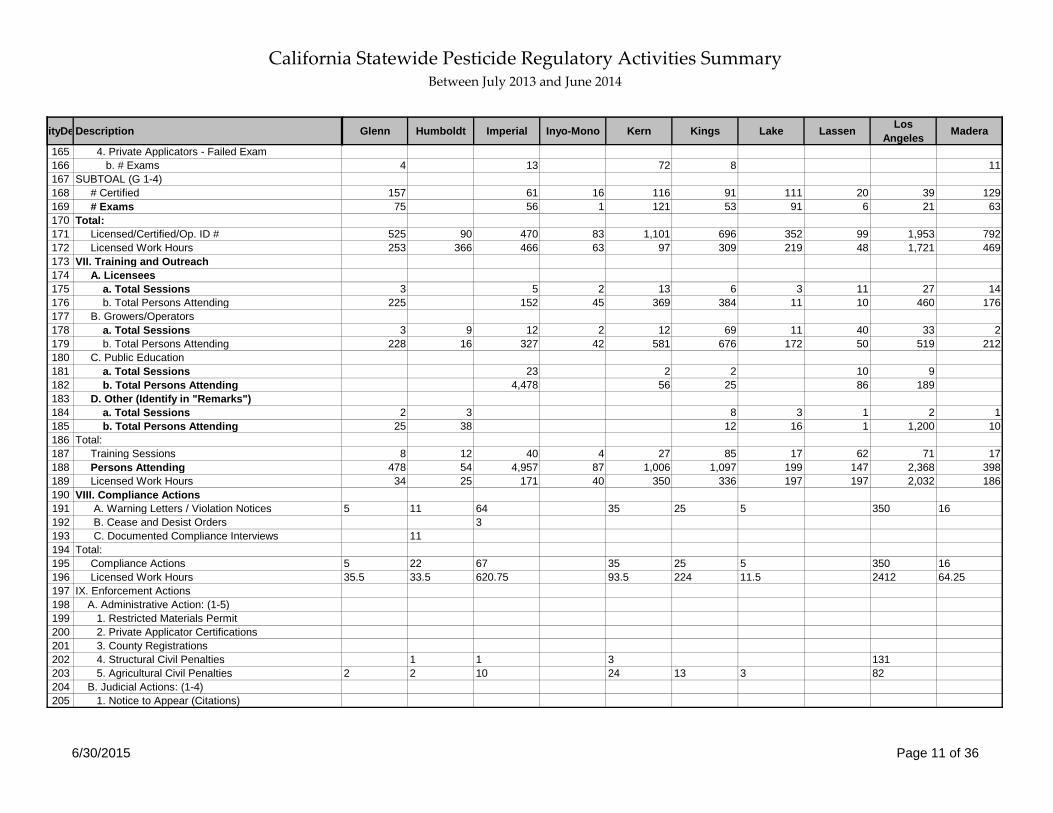
165 4. Private Applicators - Failed Exam166 b. # Exams167 SUBTOAL (G 1-4)168 # Certified169 # Exams170 Total:171 Licensed/Certified/Op. ID #172 Licensed Work Hours173 VII. Training and Outreach174 A. Licensees175 a. Total Sessions176 b. Total Persons Attending177 B. Growers/Operators178 a. Total Sessions179 b. Total Persons Attending180 C. Public Education181 a. Total Sessions182 b. Total Persons Attending183 D. Other (Identify in "Remarks")184 a. Total Sessions185 b. Total Persons Attending186 Total:187 Training Sessions188 Persons Attending189 Licensed Work Hours190 VIII. Compliance Actions191 A. Warning Letters / Violation Notices192 B. Cease and Desist Orders193 C. Documented Compliance Interviews194 Total:195 Compliance Actions196 Licensed Work Hours197 IX. Enforcement Actions198 A. Administrative Action: (1-5)199 1. Restricted Materials Permit200 2. Private Applicator Certifications201 3. County Registrations202 4. Structural Civil Penalties203 5. Agricultural Civil Penalties204 B. Judicial Actions: (1-4)205 1. Notice to Appear (Citations)
Glenn Humboldt Imperial Inyo-Mono Kern Kings Lake Lassen Los Angeles Madera
4 13 72 8 11
157 61 16 116 91 111 20 39 12975 56 1 121 53 91 6 21 63
525 90 470 83 1,101 696 352 99 1,953 792253 366 466 63 97 309 219 48 1,721 469
3 5 2 13 6 3 11 27 14225 152 45 369 384 11 10 460 176
3 9 12 2 12 69 11 40 33 2228 16 327 42 581 676 172 50 519 212
23 2 2 10 94,478 56 25 86 189
2 3 8 3 1 2 125 38 12 16 1 1,200 10
8 12 40 4 27 85 17 62 71 17478 54 4,957 87 1,006 1,097 199 147 2,368 39834 25 171 40 350 336 197 197 2,032 186
5 11 64 35 25 5 350 163
11
5 22 67 35 25 5 350 1635.5 33.5 620.75 93.5 224 11.5 2412 64.25
1 1 3 1312 2 10 24 13 3 82
California Statewide Pesticide Regulatory Activities Summary Between July 2013 and June 2014
6/30/2015 Page 12 of 36
vityDe Description
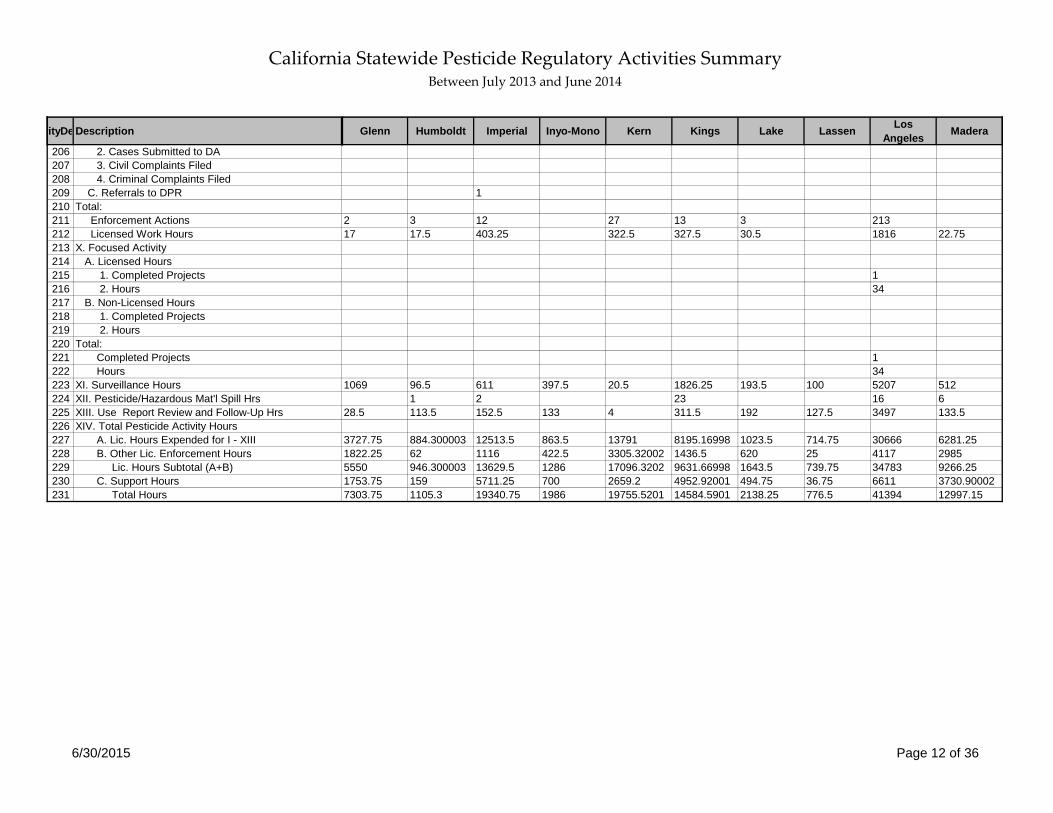
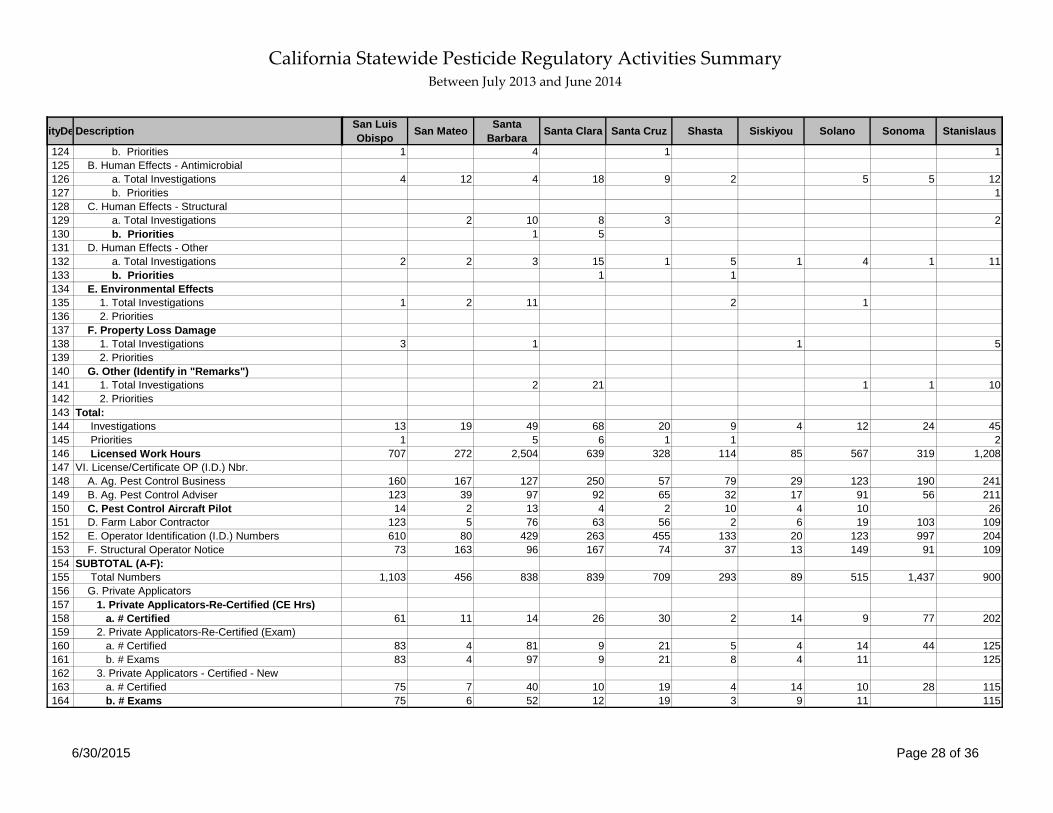
206 2. Cases Submitted to DA207 3. Civil Complaints Filed208 4. Criminal Complaints Filed209 C. Referrals to DPR210 Total:211 Enforcement Actions212 Licensed Work Hours213 X. Focused Activity214 A. Licensed Hours215 1. Completed Projects216 2. Hours217 B. Non-Licensed Hours218 1. Completed Projects219 2. Hours220 Total:221 Completed Projects222 Hours223 XI. Surveillance Hours224 XII. Pesticide/Hazardous Mat'l Spill Hrs225 XIII. Use Report Review and Follow-Up Hrs226 XIV. Total Pesticide Activity Hours227 A. Lic. Hours Expended for I - XIII228 B. Other Lic. Enforcement Hours229 Lic. Hours Subtotal (A+B)230 C. Support Hours231 Total Hours
Glenn Humboldt Imperial Inyo-Mono Kern Kings Lake Lassen Los Angeles Madera
1
2 3 12 27 13 3 21317 17.5 403.25 322.5 327.5 30.5 1816 22.75
134
134
1069 96.5 611 397.5 20.5 1826.25 193.5 100 5207 5121 2 23 16 6
28.5 113.5 152.5 133 4 311.5 192 127.5 3497 133.5
3727.75 884.300003 12513.5 863.5 13791 8195.16998 1023.5 714.75 30666 6281.251822.25 62 1116 422.5 3305.32002 1436.5 620 25 4117 29855550 946.300003 13629.5 1286 17096.3202 9631.66998 1643.5 739.75 34783 9266.251753.75 159 5711.25 700 2659.2 4952.92001 494.75 36.75 6611 3730.900027303.75 1105.3 19340.75 1986 19755.5201 14584.5901 2138.25 776.5 41394 12997.15
California Statewide Pesticide Regulatory Activities Summary Between July 2013 and June 2014
6/30/2015 Page 13 of 36
vityDe Description
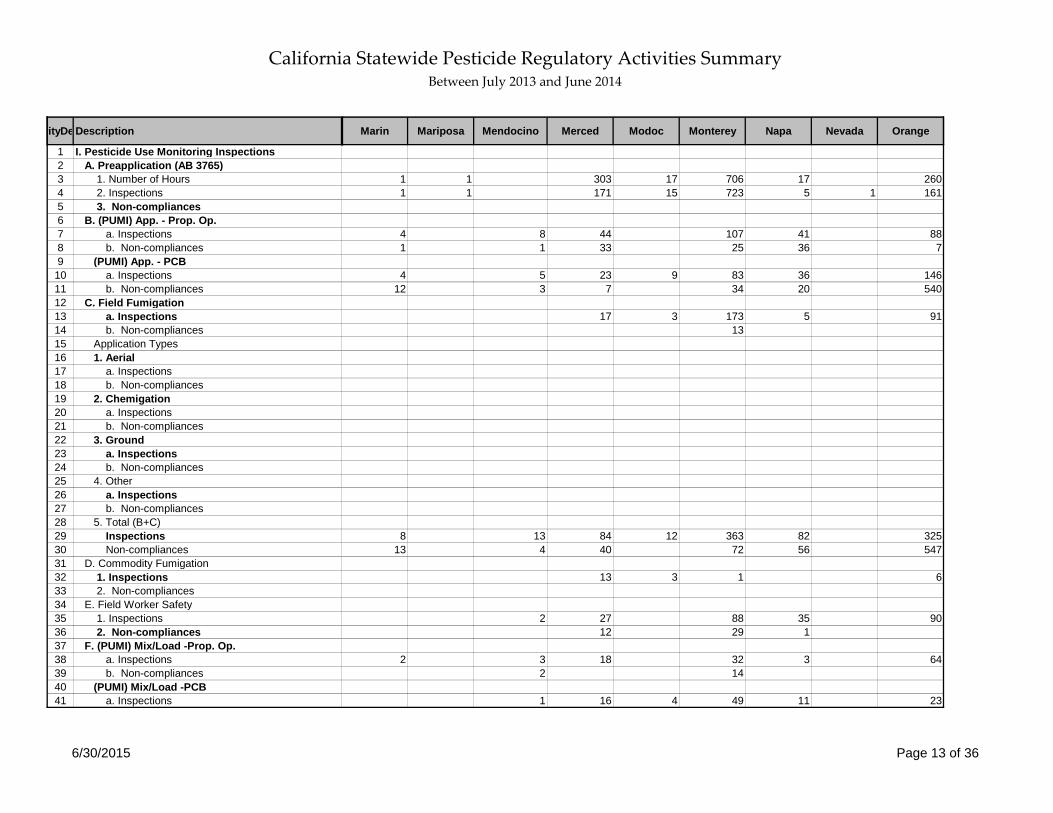
1 I. Pesticide Use Monitoring Inspections2 A. Preapplication (AB 3765)3 1. Number of Hours4 2. Inspections5 3. Non-compliances6 B. (PUMI) App. - Prop. Op.7 a. Inspections8 b. Non-compliances9 (PUMI) App. - PCB
10 a. Inspections11 b. Non-compliances12 C. Field Fumigation13 a. Inspections14 b. Non-compliances15 Application Types16 1. Aerial17 a. Inspections18 b. Non-compliances19 2. Chemigation20 a. Inspections21 b. Non-compliances22 3. Ground23 a. Inspections24 b. Non-compliances25 4. Other26 a. Inspections27 b. Non-compliances28 5. Total (B+C)29 Inspections30 Non-compliances31 D. Commodity Fumigation32 1. Inspections33 2. Non-compliances34 E. Field Worker Safety35 1. Inspections36 2. Non-compliances37 F. (PUMI) Mix/Load -Prop. Op.38 a. Inspections39 b. Non-compliances40 (PUMI) Mix/Load -PCB41 a. Inspections
Marin Mariposa Mendocino Merced Modoc Monterey Napa Nevada Orange
1 1 303 17 706 17 2601 1 171 15 723 5 1 161
4 8 44 107 41 881 1 33 25 36 7
4 5 23 9 83 36 14612 3 7 34 20 540
17 3 173 5 9113
8 13 84 12 363 82 32513 4 40 72 56 547
13 3 1 6
2 27 88 35 9012 29 1
2 3 18 32 3 642 14
1 16 4 49 11 23
California Statewide Pesticide Regulatory Activities Summary Between July 2013 and June 2014
6/30/2015 Page 14 of 36
vityDe Description
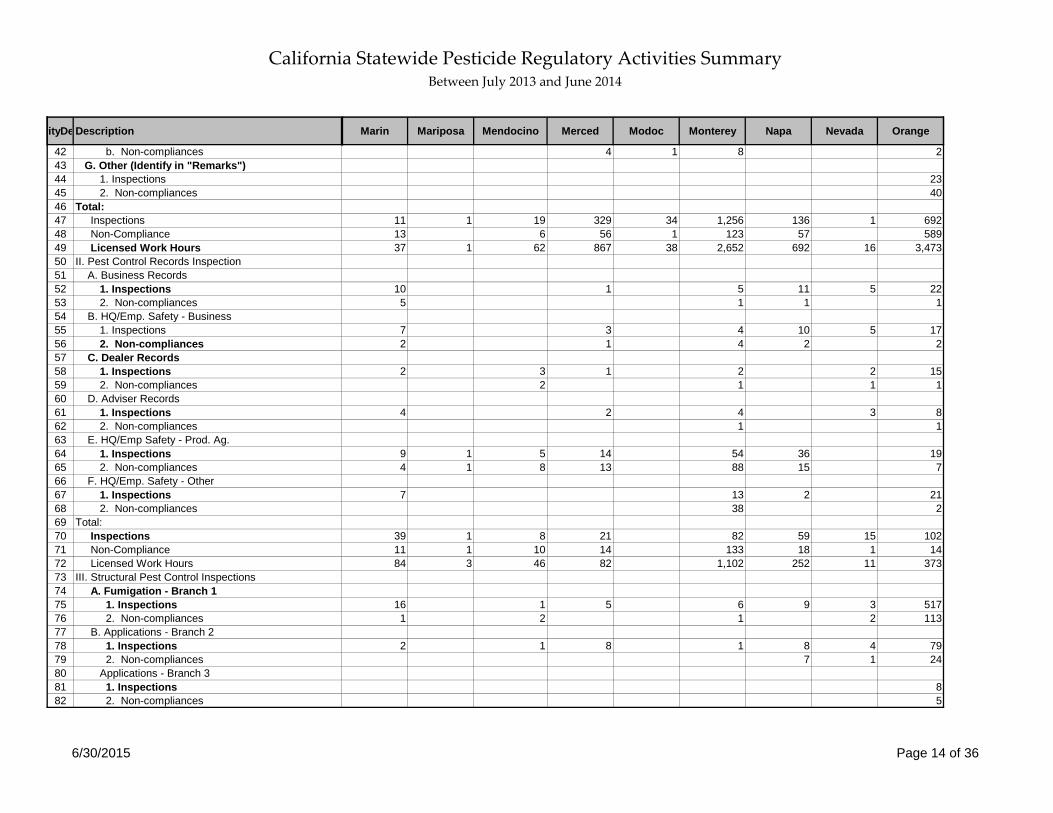
42 b. Non-compliances43 G. Other (Identify in "Remarks")44 1. Inspections45 2. Non-compliances46 Total:47 Inspections48 Non-Compliance49 Licensed Work Hours50 II. Pest Control Records Inspection51 A. Business Records52 1. Inspections53 2. Non-compliances54 B. HQ/Emp. Safety - Business55 1. Inspections56 2. Non-compliances57 C. Dealer Records58 1. Inspections59 2. Non-compliances60 D. Adviser Records61 1. Inspections62 2. Non-compliances63 E. HQ/Emp Safety - Prod. Ag.64 1. Inspections65 2. Non-compliances66 F. HQ/Emp. Safety - Other67 1. Inspections68 2. Non-compliances69 Total:70 Inspections71 Non-Compliance72 Licensed Work Hours73 III. Structural Pest Control Inspections74 A. Fumigation - Branch 175 1. Inspections76 2. Non-compliances77 B. Applications - Branch 278 1. Inspections79 2. Non-compliances80 Applications - Branch 381 1. Inspections82 2. Non-compliances
Marin Mariposa Mendocino Merced Modoc Monterey Napa Nevada Orange
4 1 8 2
2340
11 1 19 329 34 1,256 136 1 69213 6 56 1 123 57 58937 1 62 867 38 2,652 692 16 3,473
10 1 5 11 5 225 1 1 1
7 3 4 10 5 172 1 4 2 2
2 3 1 2 2 152 1 1 1
4 2 4 3 81 1
9 1 5 14 54 36 194 1 8 13 88 15 7
7 13 2 2138 2
39 1 8 21 82 59 15 10211 1 10 14 133 18 1 1484 3 46 82 1,102 252 11 373
16 1 5 6 9 3 5171 2 1 2 113
2 1 8 1 8 4 797 1 24
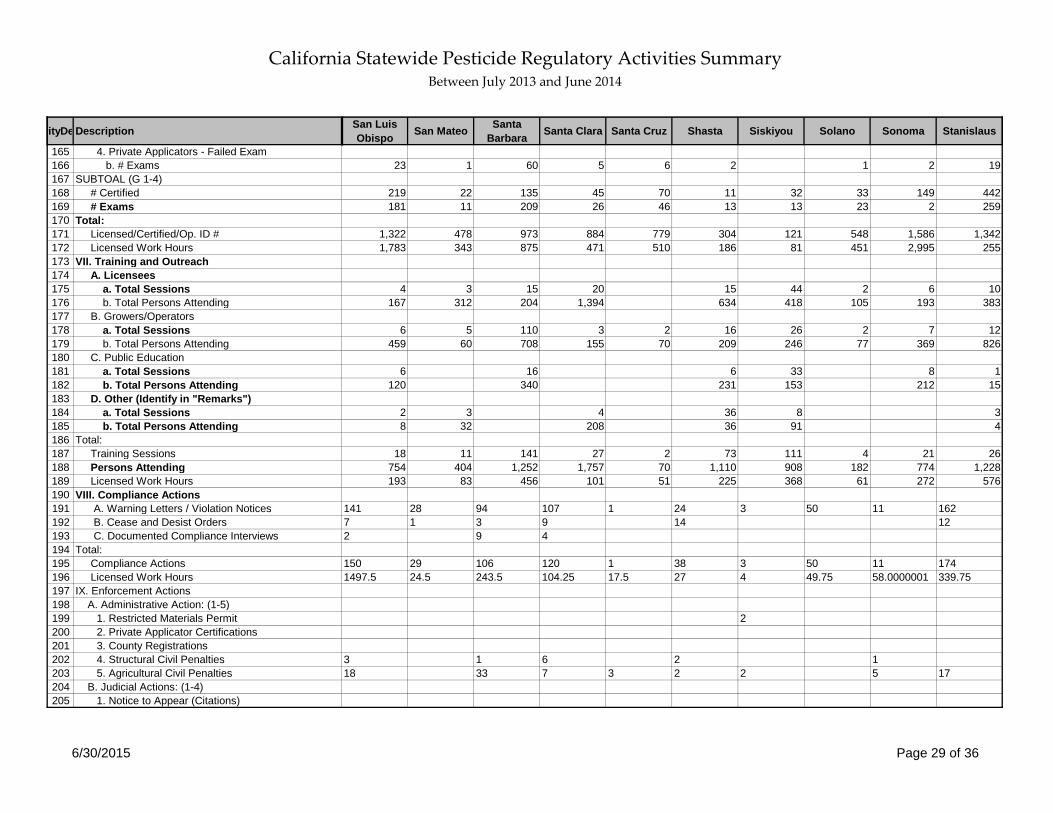
85
California Statewide Pesticide Regulatory Activities Summary Between July 2013 and June 2014
6/30/2015 Page 15 of 36
vityDe Description
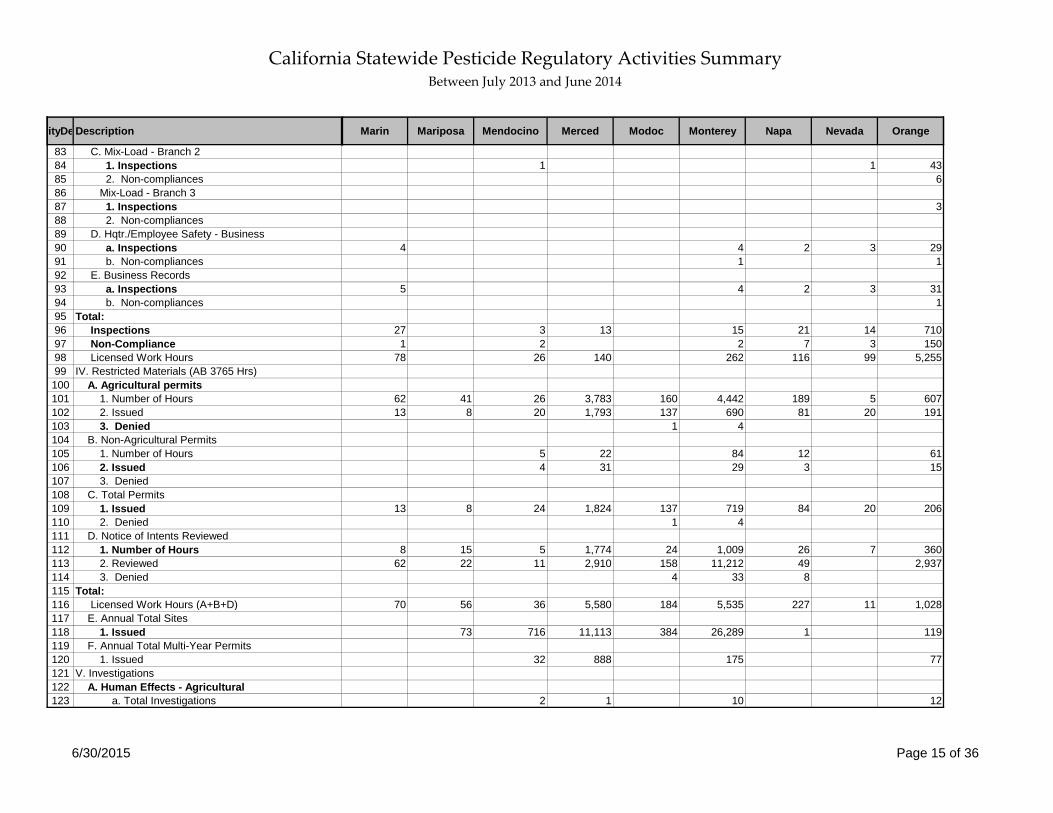
83 C. Mix-Load - Branch 284 1. Inspections85 2. Non-compliances86 Mix-Load - Branch 387 1. Inspections88 2. Non-compliances89 D. Hqtr./Employee Safety - Business90 a. Inspections91 b. Non-compliances92 E. Business Records93 a. Inspections94 b. Non-compliances95 Total:96 Inspections97 Non-Compliance98 Licensed Work Hours99 IV. Restricted Materials (AB 3765 Hrs)100 A. Agricultural permits101 1. Number of Hours102 2. Issued103 3. Denied104 B. Non-Agricultural Permits105 1. Number of Hours106 2. Issued107 3. Denied108 C. Total Permits109 1. Issued110 2. Denied111 D. Notice of Intents Reviewed112 1. Number of Hours113 2. Reviewed114 3. Denied115 Total:116 Licensed Work Hours (A+B+D)117 E. Annual Total Sites118 1. Issued119 F. Annual Total Multi-Year Permits120 1. Issued121 V. Investigations122 A. Human Effects - Agricultural123 a. Total Investigations
Marin Mariposa Mendocino Merced Modoc Monterey Napa Nevada Orange
1 1 436
3
4 4 2 3 291 1
5 4 2 3 311
27 3 13 15 21 14 7101 2 2 7 3 150
78 26 140 262 116 99 5,255
62 41 26 3,783 160 4,442 189 5 60713 8 20 1,793 137 690 81 20 191
1 4
5 22 84 12 614 31 29 3 15
13 8 24 1,824 137 719 84 20 2061 4
8 15 5 1,774 24 1,009 26 7 36062 22 11 2,910 158 11,212 49 2,937
4 33 8
70 56 36 5,580 184 5,535 227 11 1,028
73 716 11,113 384 26,289 1 119
32 888 175 77
2 1 10 12
California Statewide Pesticide Regulatory Activities Summary Between July 2013 and June 2014
6/30/2015 Page 16 of 36
vityDe Description
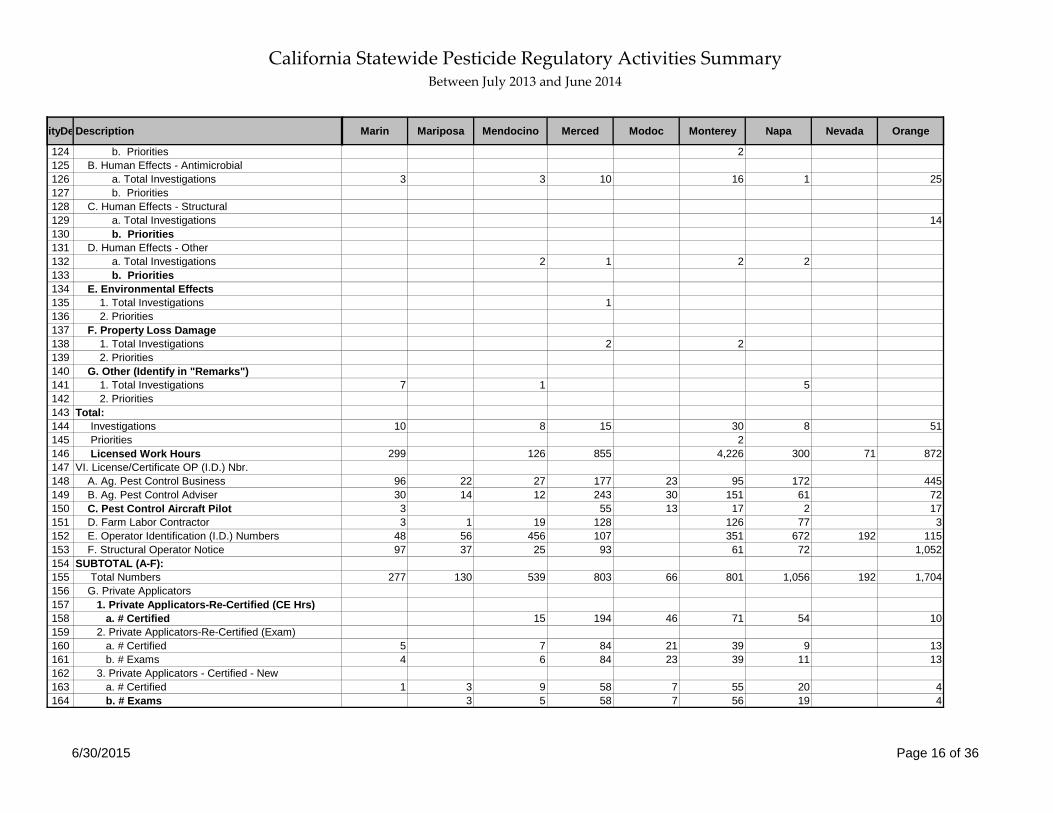
124 b. Priorities125 B. Human Effects - Antimicrobial126 a. Total Investigations127 b. Priorities128 C. Human Effects - Structural129 a. Total Investigations130 b. Priorities131 D. Human Effects - Other132 a. Total Investigations133 b. Priorities134 E. Environmental Effects135 1. Total Investigations136 2. Priorities137 F. Property Loss Damage138 1. Total Investigations139 2. Priorities140 G. Other (Identify in "Remarks")141 1. Total Investigations142 2. Priorities143 Total:144 Investigations145 Priorities146 Licensed Work Hours147 VI. License/Certificate OP (I.D.) Nbr.148 A. Ag. Pest Control Business149 B. Ag. Pest Control Adviser150 C. Pest Control Aircraft Pilot151 D. Farm Labor Contractor152 E. Operator Identification (I.D.) Numbers153 F. Structural Operator Notice154 SUBTOTAL (A-F):155 Total Numbers156 G. Private Applicators157 1. Private Applicators-Re-Certified (CE Hrs)158 a. # Certified159 2. Private Applicators-Re-Certified (Exam)160 a. # Certified161 b. # Exams162 3. Private Applicators - Certified - New163 a. # Certified164 b. # Exams
Marin Mariposa Mendocino Merced Modoc Monterey Napa Nevada Orange
2
3 3 10 16 1 25
14
2 1 2 2
1
2 2
7 1 5
10 8 15 30 8 512
299 126 855 4,226 300 71 872
96 22 27 177 23 95 172 44530 14 12 243 30 151 61 723 55 13 17 2 173 1 19 128 126 77 3
48 56 456 107 351 672 192 11597 37 25 93 61 72 1,052
277 130 539 803 66 801 1,056 192 1,704
15 194 46 71 54 10
5 7 84 21 39 9 134 6 84 23 39 11 13
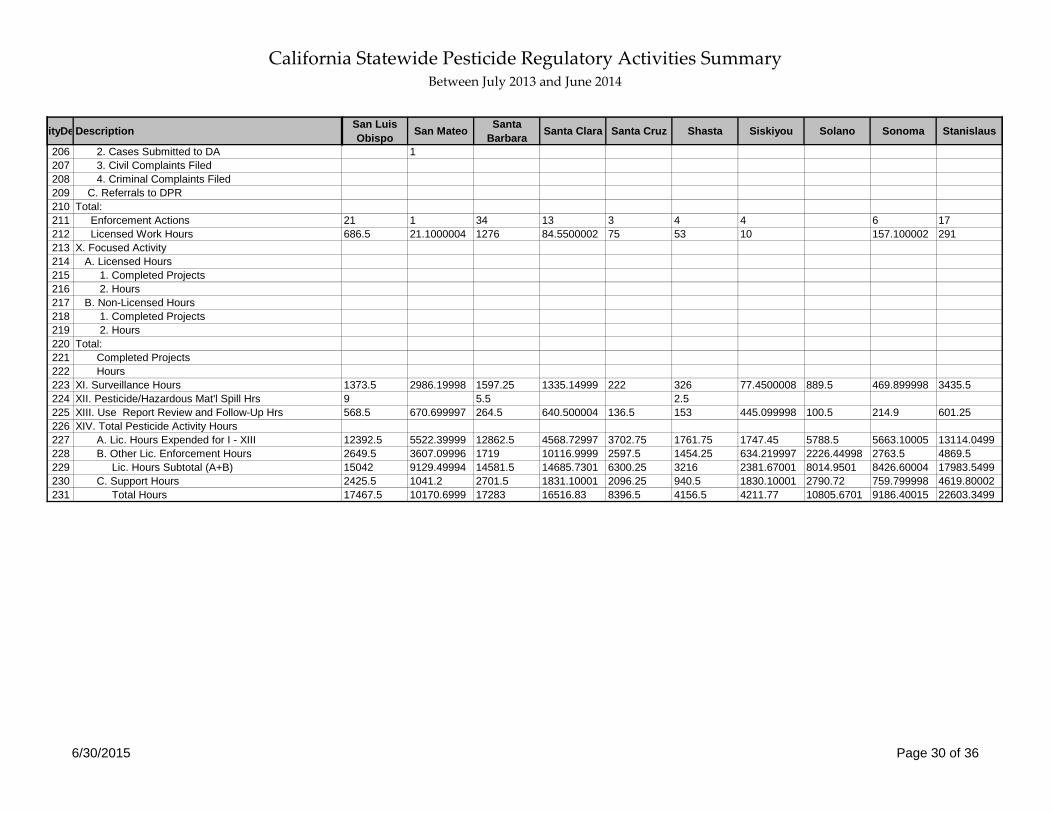
1 3 9 58 7 55 20 43 5 58 7 56 19 4
California Statewide Pesticide Regulatory Activities Summary Between July 2013 and June 2014
6/30/2015 Page 17 of 36
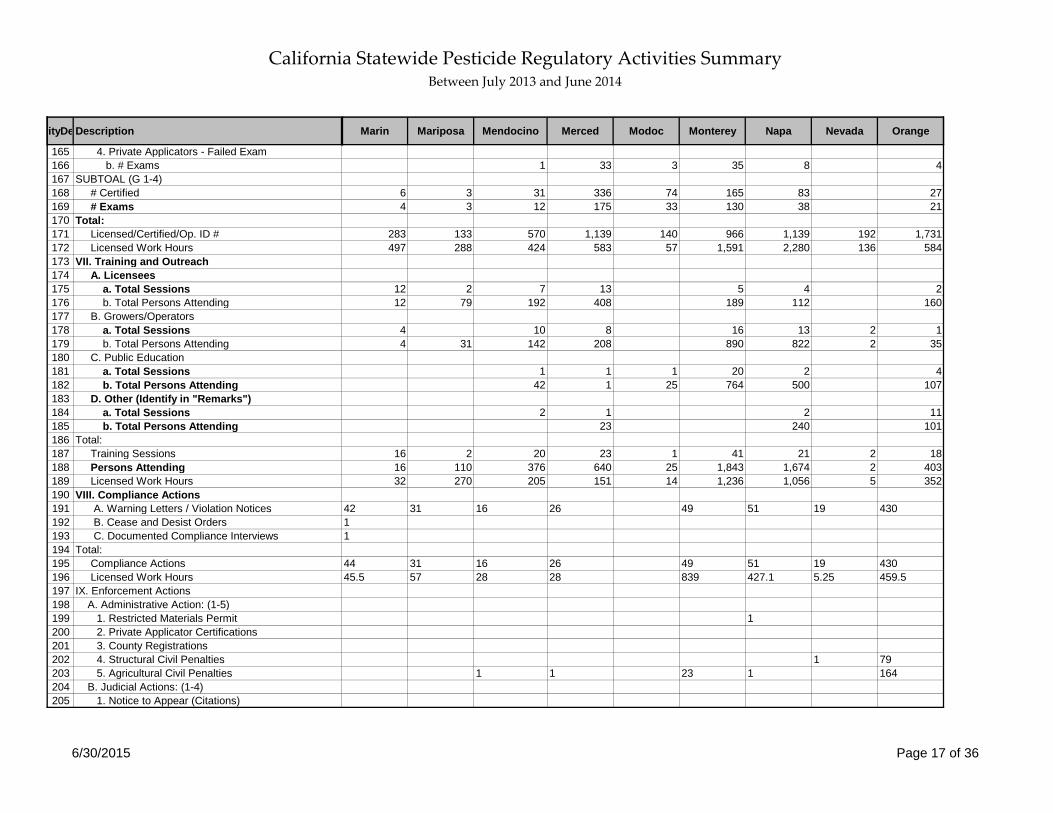
vityDe Description
165 4. Private Applicators - Failed Exam166 b. # Exams167 SUBTOAL (G 1-4)168 # Certified169 # Exams170 Total:171 Licensed/Certified/Op. ID #172 Licensed Work Hours173 VII. Training and Outreach174 A. Licensees175 a. Total Sessions176 b. Total Persons Attending177 B. Growers/Operators178 a. Total Sessions179 b. Total Persons Attending180 C. Public Education181 a. Total Sessions182 b. Total Persons Attending183 D. Other (Identify in "Remarks")184 a. Total Sessions185 b. Total Persons Attending186 Total:187 Training Sessions188 Persons Attending189 Licensed Work Hours190 VIII. Compliance Actions191 A. Warning Letters / Violation Notices192 B. Cease and Desist Orders193 C. Documented Compliance Interviews194 Total:195 Compliance Actions196 Licensed Work Hours197 IX. Enforcement Actions198 A. Administrative Action: (1-5)199 1. Restricted Materials Permit200 2. Private Applicator Certifications201 3. County Registrations202 4. Structural Civil Penalties203 5. Agricultural Civil Penalties204 B. Judicial Actions: (1-4)205 1. Notice to Appear (Citations)
Marin Mariposa Mendocino Merced Modoc Monterey Napa Nevada Orange
1 33 3 35 8 4
6 3 31 336 74 165 83 274 3 12 175 33 130 38 21
283 133 570 1,139 140 966 1,139 192 1,731497 288 424 583 57 1,591 2,280 136 584
12 2 7 13 5 4 212 79 192 408 189 112 160
4 10 8 16 13 2 14 31 142 208 890 822 2 35
1 1 1 20 2 442 1 25 764 500 107
2 1 2 1123 240 101
16 2 20 23 1 41 21 2 1816 110 376 640 25 1,843 1,674 2 40332 270 205 151 14 1,236 1,056 5 352
42 31 16 26 49 51 19 43011
44 31 16 26 49 51 19 43045.5 57 28 28 839 427.1 5.25 459.5
1
1 791 1 23 1 164
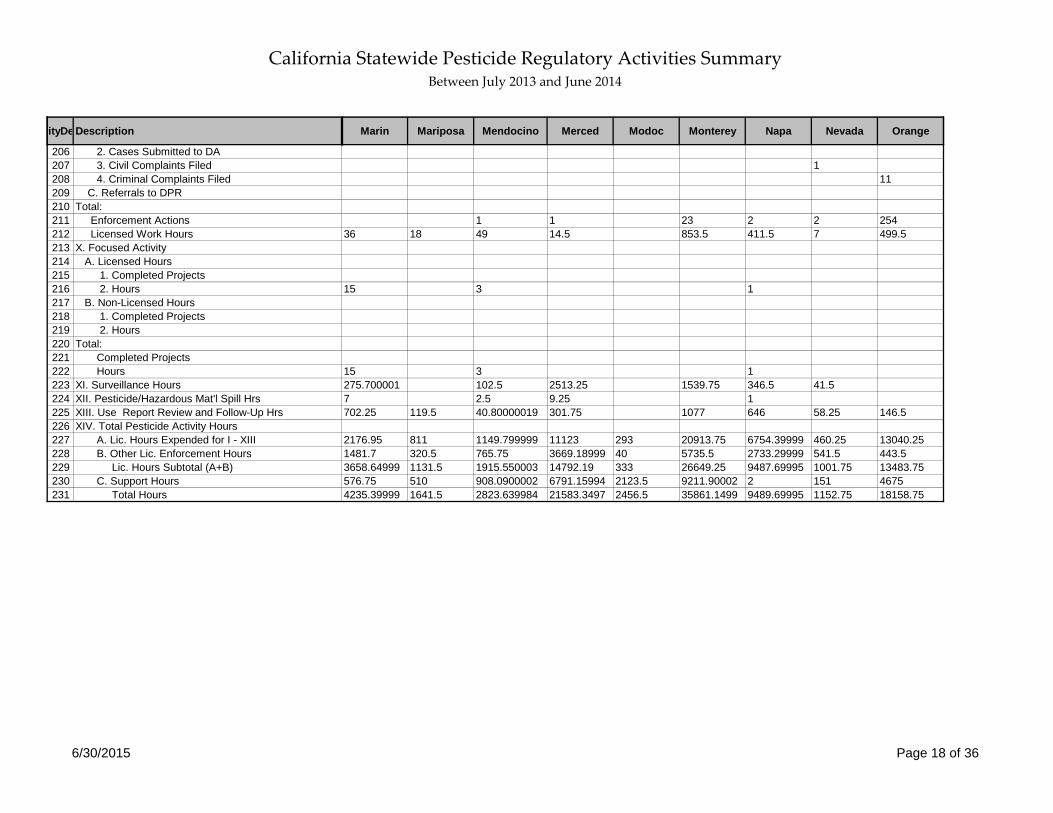
California Statewide Pesticide Regulatory Activities Summary Between July 2013 and June 2014
6/30/2015 Page 18 of 36
vityDe Description
206 2. Cases Submitted to DA207 3. Civil Complaints Filed208 4. Criminal Complaints Filed209 C. Referrals to DPR210 Total:211 Enforcement Actions212 Licensed Work Hours213 X. Focused Activity214 A. Licensed Hours215 1. Completed Projects216 2. Hours217 B. Non-Licensed Hours218 1. Completed Projects219 2. Hours220 Total:221 Completed Projects222 Hours223 XI. Surveillance Hours224 XII. Pesticide/Hazardous Mat'l Spill Hrs225 XIII. Use Report Review and Follow-Up Hrs226 XIV. Total Pesticide Activity Hours227 A. Lic. Hours Expended for I - XIII228 B. Other Lic. Enforcement Hours229 Lic. Hours Subtotal (A+B)230 C. Support Hours231 Total Hours
Marin Mariposa Mendocino Merced Modoc Monterey Napa Nevada Orange
111
1 1 23 2 2 25436 18 49 14.5 853.5 411.5 7 499.5
15 3 1
15 3 1275.700001 102.5 2513.25 1539.75 346.5 41.57 2.5 9.25 1702.25 119.5 40.80000019 301.75 1077 646 58.25 146.5
2176.95 811 1149.799999 11123 293 20913.75 6754.39999 460.25 13040.251481.7 320.5 765.75 3669.18999 40 5735.5 2733.29999 541.5 443.53658.64999 1131.5 1915.550003 14792.19 333 26649.25 9487.69995 1001.75 13483.75576.75 510 908.0900002 6791.15994 2123.5 9211.90002 2 151 46754235.39999 1641.5 2823.639984 21583.3497 2456.5 35861.1499 9489.69995 1152.75 18158.75
California Statewide Pesticide Regulatory Activities Summary Between July 2013 and June 2014
6/30/2015 Page 19 of 36
vityDe Description
1 I. Pesticide Use Monitoring Inspections2 A. Preapplication (AB 3765)3 1. Number of Hours4 2. Inspections5 3. Non-compliances6 B. (PUMI) App. - Prop. Op.7 a. Inspections8 b. Non-compliances9 (PUMI) App. - PCB
10 a. Inspections11 b. Non-compliances12 C. Field Fumigation13 a. Inspections14 b. Non-compliances15 Application Types16 1. Aerial17 a. Inspections18 b. Non-compliances19 2. Chemigation20 a. Inspections21 b. Non-compliances22 3. Ground23 a. Inspections24 b. Non-compliances25 4. Other26 a. Inspections27 b. Non-compliances28 5. Total (B+C)29 Inspections30 Non-compliances31 D. Commodity Fumigation32 1. Inspections33 2. Non-compliances34 E. Field Worker Safety35 1. Inspections36 2. Non-compliances37 F. (PUMI) Mix/Load -Prop. Op.38 a. Inspections39 b. Non-compliances40 (PUMI) Mix/Load -PCB41 a. Inspections
Placer Plumas-Sierra Riverside Sacramento San Benito San
Bernardino San Diego San Francisco
San Joaquin
36 4 126 78 91 154 219 17 47223 1 103 58 148 152 73 9 635
1 1
8 1 146 13 11 61 116 16211 7 5 1 19 32 106
69 80 19 19 98 121 2 38187 62 5 83 66 1 24
2 5 2 3 24 171
79 1 231 34 33 159 261 2 217199 69 10 1 102 98 1 130
24 10 17 2 1 244 2
27 2 9 7 34 141 2 2
4 1 128 7 20 72 1 389 1 4 2 17
9 22 14 5 44 1 16
California Statewide Pesticide Regulatory Activities Summary Between July 2013 and June 2014
6/30/2015 Page 20 of 36
vityDe Description
42 b. Non-compliances43 G. Other (Identify in "Remarks")44 1. Inspections45 2. Non-compliances46 Total:47 Inspections48 Non-Compliance49 Licensed Work Hours50 II. Pest Control Records Inspection51 A. Business Records52 1. Inspections53 2. Non-compliances54 B. HQ/Emp. Safety - Business55 1. Inspections56 2. Non-compliances57 C. Dealer Records58 1. Inspections59 2. Non-compliances60 D. Adviser Records61 1. Inspections62 2. Non-compliances63 E. HQ/Emp Safety - Prod. Ag.64 1. Inspections65 2. Non-compliances66 F. HQ/Emp. Safety - Other67 1. Inspections68 2. Non-compliances69 Total:70 Inspections71 Non-Compliance72 Licensed Work Hours73 III. Structural Pest Control Inspections74 A. Fumigation - Branch 175 1. Inspections76 2. Non-compliances77 B. Applications - Branch 278 1. Inspections79 2. Non-compliances80 Applications - Branch 381 1. Inspections82 2. Non-compliances
Placer Plumas-Sierra Riverside Sacramento San Benito San
Bernardino San Diego San Francisco
San Joaquin
22 1 3 3
18 750
115 3 535 122 211 367 486 14 944230 72 10 2 156 107 5 153301 10 1,012 671 163 896 2,599 22 896
13 36 23 2 60 51 191 23 7 7 33 4
12 33 23 3 52 43 3 172 12 10 1 7 18 2 1
10 11 5 3 5 11 89 3 1 4 5
11 1 2 2 13
7 32 8 13 65 1921 31 1 2 53 23
13 1 40 20 16 58 2 27 6 8 18 6
55 1 163 80 8 148 230 5 7833 7 75 27 1 16 126 2 39
118 6 580 377 30 496 1,590 12 182
2 45 4 1 199 361 18 17 18 33
34 42 6 83 101 1527 15 1 26 19 8
1 1 5 1012 4
California Statewide Pesticide Regulatory Activities Summary Between July 2013 and June 2014
6/30/2015 Page 21 of 36
vityDe Description
83 C. Mix-Load - Branch 284 1. Inspections85 2. Non-compliances86 Mix-Load - Branch 387 1. Inspections88 2. Non-compliances89 D. Hqtr./Employee Safety - Business90 a. Inspections91 b. Non-compliances92 E. Business Records93 a. Inspections94 b. Non-compliances95 Total:96 Inspections97 Non-Compliance98 Licensed Work Hours99 IV. Restricted Materials (AB 3765 Hrs)100 A. Agricultural permits101 1. Number of Hours102 2. Issued103 3. Denied104 B. Non-Agricultural Permits105 1. Number of Hours106 2. Issued107 3. Denied108 C. Total Permits109 1. Issued110 2. Denied111 D. Notice of Intents Reviewed112 1. Number of Hours113 2. Reviewed114 3. Denied115 Total:116 Licensed Work Hours (A+B+D)117 E. Annual Total Sites118 1. Issued119 F. Annual Total Multi-Year Permits120 1. Issued121 V. Investigations122 A. Human Effects - Agricultural123 a. Total Investigations
Placer Plumas-Sierra Riverside Sacramento San Benito San
Bernardino San Diego San Francisco
San Joaquin
3 15 1 11 29 33 3 1 5
12
12 36 13 31 45 2 716 5 6 3
11 50 13 67 71 1 827 6 14 18
62 189 37 2 397 617 39 1630 68 13 78 77 13
104 412 59 12 1,186 3,063 84 13
148 23 1,547 1,580 1,048 304 1,293 3,42078 28 758 300 257 418 160 1,875
10 2 4
68 276 42 21 32 535 8242 129 55 13 45 69 77
1 2
120 28 887 355 270 463 229 1,95210 2 1 6
78 6 312 319 516 257 532 3 1,045147 5 1,213 976 1,450 1,127 518 1 6,332
1 1 3 12 9 69 39
294 29 2,134 1,941 1,584 592 2,359 3 4,547
658 9,265 3,322 1,691 4,295 21,220
584 58 509
2 4 4 3 4 29
California Statewide Pesticide Regulatory Activities Summary Between July 2013 and June 2014
6/30/2015 Page 22 of 36
vityDe Description
124 b. Priorities125 B. Human Effects - Antimicrobial126 a. Total Investigations127 b. Priorities128 C. Human Effects - Structural129 a. Total Investigations130 b. Priorities131 D. Human Effects - Other132 a. Total Investigations133 b. Priorities134 E. Environmental Effects135 1. Total Investigations136 2. Priorities137 F. Property Loss Damage138 1. Total Investigations139 2. Priorities140 G. Other (Identify in "Remarks")141 1. Total Investigations142 2. Priorities143 Total:144 Investigations145 Priorities146 Licensed Work Hours147 VI. License/Certificate OP (I.D.) Nbr.148 A. Ag. Pest Control Business149 B. Ag. Pest Control Adviser150 C. Pest Control Aircraft Pilot151 D. Farm Labor Contractor152 E. Operator Identification (I.D.) Numbers153 F. Structural Operator Notice154 SUBTOTAL (A-F):155 Total Numbers156 G. Private Applicators157 1. Private Applicators-Re-Certified (CE Hrs)158 a. # Certified159 2. Private Applicators-Re-Certified (Exam)160 a. # Certified161 b. # Exams162 3. Private Applicators - Certified - New163 a. # Certified164 b. # Exams
Placer Plumas-Sierra Riverside Sacramento San Benito San
Bernardino San Diego San Francisco
San Joaquin
1 2
3 19 12 4 37 37 14 215
3 4 21 2 81
3 45 11 24 41 3
3 1 3 1 20
2 41
1 18 1 8 68 4
10 90 38 9 69 136 18 822 1 3 3 5
129 1,094 479 647 485 4,278 186 2,219
176 10 356 221 41 176 329 72 23349 7 92 113 51 63 82 14 21425 26 37 4 11 5 343 87 81 76 9 32 207
196 50 556 243 176 120 2,385 20 202153 2 656 201 40 699 369 137 185
602 69 1,773 896 388 1,078 3,202 243 1,075
2 1 34 12 26 1 18 368
2 36 19 16 12 52 702 36 19 7 11 52 70
3 42 10 9 9 36 2 873 42 10 3 9 36 1 87

California Statewide Pesticide Regulatory Activities Summary Between July 2013 and June 2014
6/30/2015 Page 23 of 36
vityDe Description
165 4. Private Applicators - Failed Exam166 b. # Exams167 SUBTOAL (G 1-4)168 # Certified169 # Exams170 Total:171 Licensed/Certified/Op. ID #172 Licensed Work Hours173 VII. Training and Outreach174 A. Licensees175 a. Total Sessions176 b. Total Persons Attending177 B. Growers/Operators178 a. Total Sessions179 b. Total Persons Attending180 C. Public Education181 a. Total Sessions182 b. Total Persons Attending183 D. Other (Identify in "Remarks")184 a. Total Sessions185 b. Total Persons Attending186 Total:187 Training Sessions188 Persons Attending189 Licensed Work Hours190 VIII. Compliance Actions191 A. Warning Letters / Violation Notices192 B. Cease and Desist Orders193 C. Documented Compliance Interviews194 Total:195 Compliance Actions196 Licensed Work Hours197 IX. Enforcement Actions198 A. Administrative Action: (1-5)199 1. Restricted Materials Permit200 2. Private Applicator Certifications201 3. County Registrations202 4. Structural Civil Penalties203 5. Agricultural Civil Penalties204 B. Judicial Actions: (1-4)205 1. Notice to Appear (Citations)
Placer Plumas-Sierra Riverside Sacramento San Benito San
Bernardino San Diego San Francisco
San Joaquin
5 2 4 19 1 37
5 3 112 41 51 22 106 2 5253 2 83 29 12 24 107 2 194
607 72 1,885 937 439 1,100 3,308 245 1,600697 44 424 987 478 136 1,135 155 160
18 1 3 1 10 77 10108 1 540 1 187 572 417
15 9 2 11 4 4 175 1055 7 33 724 213 23 450 1,651
4 954 1,436
1 4 1 2 10100 8 9 242
38 14 5 13 4 16 271 20317 16 573 725 213 219 2,700 2,068201 14 14 82 143 42 315 1 480
80 159 92 156 158 7 2643 74 2 23 21 51 3 1
124 233 94 182 180 7 3150.0999993 533 305 184 918.5 8 18.25
1
17 20 14 8
58 16 7 47 41 8 23
California Statewide Pesticide Regulatory Activities Summary Between July 2013 and June 2014
6/30/2015 Page 24 of 36
vityDe Description
206 2. Cases Submitted to DA207 3. Civil Complaints Filed208 4. Criminal Complaints Filed209 C. Referrals to DPR210 Total:211 Enforcement Actions212 Licensed Work Hours213 X. Focused Activity214 A. Licensed Hours215 1. Completed Projects216 2. Hours217 B. Non-Licensed Hours218 1. Completed Projects219 2. Hours220 Total:221 Completed Projects222 Hours223 XI. Surveillance Hours224 XII. Pesticide/Hazardous Mat'l Spill Hrs225 XIII. Use Report Review and Follow-Up Hrs226 XIV. Total Pesticide Activity Hours227 A. Lic. Hours Expended for I - XIII228 B. Other Lic. Enforcement Hours229 Lic. Hours Subtotal (A+B)230 C. Support Hours231 Total Hours
Placer Plumas-Sierra Riverside Sacramento San Benito San
Bernardino San Diego San Francisco
San Joaquin
59 23 7 67 55 17 23567.400003 372 95 586.5 562.5 10 438.5
469.000003 1445 515 53 1122.25 4532.90002 353.5 1064.752 4
201.1 5 824.299999 563.8999968 214.5 433.25 14.5 331 688.25
3130.99998 107 8842.90002 6074.799988 3323 6161.75 21365.8999 1165.5 10705.51231.59999 23 4159.70001 2251.200005 598.5 1176.75 7221.49994 779.5 2454362.59998 130 13002.6 8326 3921.5 7338.5 28587.4001 1945 10950.5170.599999 219 3961.70001 1420 594 1866.5 6268.5 65 6602.450014533.19998 349 16964.3 9746.000061 4515.5 9205 34855.9001 2010 17552.95
California Statewide Pesticide Regulatory Activities Summary Between July 2013 and June 2014
6/30/2015 Page 25 of 36
vityDe Description
1 I. Pesticide Use Monitoring Inspections2 A. Preapplication (AB 3765)3 1. Number of Hours4 2. Inspections5 3. Non-compliances6 B. (PUMI) App. - Prop. Op.7 a. Inspections8 b. Non-compliances9 (PUMI) App. - PCB
10 a. Inspections11 b. Non-compliances12 C. Field Fumigation13 a. Inspections14 b. Non-compliances15 Application Types16 1. Aerial17 a. Inspections18 b. Non-compliances19 2. Chemigation20 a. Inspections21 b. Non-compliances22 3. Ground23 a. Inspections24 b. Non-compliances25 4. Other26 a. Inspections27 b. Non-compliances28 5. Total (B+C)29 Inspections30 Non-compliances31 D. Commodity Fumigation32 1. Inspections33 2. Non-compliances34 E. Field Worker Safety35 1. Inspections36 2. Non-compliances37 F. (PUMI) Mix/Load -Prop. Op.38 a. Inspections39 b. Non-compliances40 (PUMI) Mix/Load -PCB41 a. Inspections
San Luis Obispo San Mateo Santa
Barbara Santa Clara Santa Cruz Shasta Siskiyou Solano Sonoma Stanislaus
191 26 400 65 111 41 49 62 33 635170 49 290 67 52 33 125 48 19 659
6 6 6 2 28
52 54 176 26 15 25 46 41 23 19236 5 98 15 10 4 2 33 1 140
50 35 103 25 1 26 47 25 12 4973 19 70 11 19 24 5 49
32 41 40 13 11 8 71 5 1 254 7 1 2 4
134 130 319 64 27 59 164 71 36 266113 24 175 26 11 23 2 59 6 193
4 1 1 3 532 24
49 33 27 23 24 5 3 8 6 2629 1 6 10 18 12 9
16 35 49 13 4 10 2 24 5 3017 12 1 1 7 3
17 1 33 3 11 3 11 4 16
California Statewide Pesticide Regulatory Activities Summary Between July 2013 and June 2014
6/30/2015 Page 26 of 36
vityDe Description
42 b. Non-compliances43 G. Other (Identify in "Remarks")44 1. Inspections45 2. Non-compliances46 Total:47 Inspections48 Non-Compliance49 Licensed Work Hours50 II. Pest Control Records Inspection51 A. Business Records52 1. Inspections53 2. Non-compliances54 B. HQ/Emp. Safety - Business55 1. Inspections56 2. Non-compliances57 C. Dealer Records58 1. Inspections59 2. Non-compliances60 D. Adviser Records61 1. Inspections62 2. Non-compliances63 E. HQ/Emp Safety - Prod. Ag.64 1. Inspections65 2. Non-compliances66 F. HQ/Emp. Safety - Other67 1. Inspections68 2. Non-compliances69 Total:70 Inspections71 Non-Compliance72 Licensed Work Hours73 III. Structural Pest Control Inspections74 A. Fumigation - Branch 175 1. Inspections76 2. Non-compliances77 B. Applications - Branch 278 1. Inspections79 2. Non-compliances80 Applications - Branch 381 1. Inspections82 2. Non-compliances
San Luis Obispo San Mateo Santa
Barbara Santa Clara Santa Cruz Shasta Siskiyou Solano Sonoma Stanislaus
6 2 3 24 3
4 5 1 4 3
394 248 723 172 111 118 297 163 73 1,053173 25 201 43 30 26 2 104 6 260835 454 1,829 229 410 170 134 270 316 1,371
18 11 10 31 15 2 1 2314 2 7 2 3 13
14 11 12 27 14 3 2 1 187 1 5 12 10 1 3 12
3 2 1 4 1 3 2 2 9 122 7 5 1 3 1 12
4 4 1 5 3 1 2 1 25
54 54 82 67 19 5 7 8 9451 4 42 49 21 9 21 15 142
4 37 12 11 17 1 9 2210 3 3 5 1 2 22
97 119 118 145 20 57 7 24 20 19484 8 52 80 21 27 2 32 16 201
319 223 490 246 165 120 13 107 135 707
24 57 45 274 1 5 14 10 117 1 12 33 1
12 26 51 13 13 1 12 4 365 5 8 5 15 13
5 4 11 8
California Statewide Pesticide Regulatory Activities Summary Between July 2013 and June 2014
6/30/2015 Page 27 of 36
vityDe Description
83 C. Mix-Load - Branch 284 1. Inspections85 2. Non-compliances86 Mix-Load - Branch 387 1. Inspections88 2. Non-compliances89 D. Hqtr./Employee Safety - Business90 a. Inspections91 b. Non-compliances92 E. Business Records93 a. Inspections94 b. Non-compliances95 Total:96 Inspections97 Non-Compliance98 Licensed Work Hours99 IV. Restricted Materials (AB 3765 Hrs)100 A. Agricultural permits101 1. Number of Hours102 2. Issued103 3. Denied104 B. Non-Agricultural Permits105 1. Number of Hours106 2. Issued107 3. Denied108 C. Total Permits109 1. Issued110 2. Denied111 D. Notice of Intents Reviewed112 1. Number of Hours113 2. Reviewed114 3. Denied115 Total:116 Licensed Work Hours (A+B+D)117 E. Annual Total Sites118 1. Issued119 F. Annual Total Multi-Year Permits120 1. Issued121 V. Investigations122 A. Human Effects - Agricultural123 a. Total Investigations
San Luis Obispo San Mateo Santa
Barbara Santa Clara Santa Cruz Shasta Siskiyou Solano Sonoma Stanislaus
3 1 16 3 2 64 1 3
1 23
7 10 7 9 5 64 3 3
8 11 7 17 9 116 9 1 1 3
54 105 132 322 1 32 1 28 14 7122 1 22 65 6 20 19
160 280 411 515 19 82 89 37 119
3,878 85 2,503 139 1,296 245 487 3,090 624 2,370565 43 641 137 327 124 357 436 126 1,858
19 1 3
28 8 45 18 36 19 3 7 14 20128 8 24 22 10 24 3 6 5 69
7
593 51 665 159 337 148 360 442 131 1,92719 1 10
356 75 363 46 438 41 40 108 52 1,6411,462 275 1,058 622 890 287 346 634 166 8,126
59 41 5 82 1 4 42
4,262 167 2,910 203 1,770 305 530 3,205 690 4,212
3,158 378 1,481 1,470 7,577 2,623 3,820 1,158 18,953
478 400 10 117 124 971
3 1 18 6 7 2 1 17 5
California Statewide Pesticide Regulatory Activities Summary Between July 2013 and June 2014
6/30/2015 Page 28 of 36
vityDe Description
124 b. Priorities125 B. Human Effects - Antimicrobial126 a. Total Investigations127 b. Priorities128 C. Human Effects - Structural129 a. Total Investigations130 b. Priorities131 D. Human Effects - Other132 a. Total Investigations133 b. Priorities134 E. Environmental Effects135 1. Total Investigations136 2. Priorities137 F. Property Loss Damage138 1. Total Investigations139 2. Priorities140 G. Other (Identify in "Remarks")141 1. Total Investigations142 2. Priorities143 Total:144 Investigations145 Priorities146 Licensed Work Hours147 VI. License/Certificate OP (I.D.) Nbr.148 A. Ag. Pest Control Business149 B. Ag. Pest Control Adviser150 C. Pest Control Aircraft Pilot151 D. Farm Labor Contractor152 E. Operator Identification (I.D.) Numbers153 F. Structural Operator Notice154 SUBTOTAL (A-F):155 Total Numbers156 G. Private Applicators157 1. Private Applicators-Re-Certified (CE Hrs)158 a. # Certified159 2. Private Applicators-Re-Certified (Exam)160 a. # Certified161 b. # Exams162 3. Private Applicators - Certified - New163 a. # Certified164 b. # Exams
San Luis Obispo San Mateo Santa
Barbara Santa Clara Santa Cruz Shasta Siskiyou Solano Sonoma Stanislaus
1 4 1 1
4 12 4 18 9 2 5 5 121
2 10 8 3 21 5
2 2 3 15 1 5 1 4 1 111 1
1 2 11 2 1
3 1 1 5
2 21 1 1 10
13 19 49 68 20 9 4 12 24 451 5 6 1 1 2
707 272 2,504 639 328 114 85 567 319 1,208
160 167 127 250 57 79 29 123 190 241123 39 97 92 65 32 17 91 56 21114 2 13 4 2 10 4 10 26
123 5 76 63 56 2 6 19 103 109610 80 429 263 455 133 20 123 997 20473 163 96 167 74 37 13 149 91 109
1,103 456 838 839 709 293 89 515 1,437 900
61 11 14 26 30 2 14 9 77 202
83 4 81 9 21 5 4 14 44 12583 4 97 9 21 8 4 11 125
75 7 40 10 19 4 14 10 28 11575 6 52 12 19 3 9 11 115
California Statewide Pesticide Regulatory Activities Summary Between July 2013 and June 2014
6/30/2015 Page 29 of 36
vityDe Description
165 4. Private Applicators - Failed Exam166 b. # Exams167 SUBTOAL (G 1-4)168 # Certified169 # Exams170 Total:171 Licensed/Certified/Op. ID #172 Licensed Work Hours173 VII. Training and Outreach174 A. Licensees175 a. Total Sessions176 b. Total Persons Attending177 B. Growers/Operators178 a. Total Sessions179 b. Total Persons Attending180 C. Public Education181 a. Total Sessions182 b. Total Persons Attending183 D. Other (Identify in "Remarks")184 a. Total Sessions185 b. Total Persons Attending186 Total:187 Training Sessions188 Persons Attending189 Licensed Work Hours190 VIII. Compliance Actions191 A. Warning Letters / Violation Notices192 B. Cease and Desist Orders193 C. Documented Compliance Interviews194 Total:195 Compliance Actions196 Licensed Work Hours197 IX. Enforcement Actions198 A. Administrative Action: (1-5)199 1. Restricted Materials Permit200 2. Private Applicator Certifications201 3. County Registrations202 4. Structural Civil Penalties203 5. Agricultural Civil Penalties204 B. Judicial Actions: (1-4)205 1. Notice to Appear (Citations)
San Luis Obispo San Mateo Santa
Barbara Santa Clara Santa Cruz Shasta Siskiyou Solano Sonoma Stanislaus
23 1 60 5 6 2 1 2 19
219 22 135 45 70 11 32 33 149 442181 11 209 26 46 13 13 23 2 259
1,322 478 973 884 779 304 121 548 1,586 1,3421,783 343 875 471 510 186 81 451 2,995 255
4 3 15 20 15 44 2 6 10167 312 204 1,394 634 418 105 193 383
6 5 110 3 2 16 26 2 7 12459 60 708 155 70 209 246 77 369 826
6 16 6 33 8 1120 340 231 153 212 15
2 3 4 36 8 38 32 208 36 91 4
18 11 141 27 2 73 111 4 21 26754 404 1,252 1,757 70 1,110 908 182 774 1,228193 83 456 101 51 225 368 61 272 576
141 28 94 107 1 24 3 50 11 1627 1 3 9 14 122 9 4
150 29 106 120 1 38 3 50 11 1741497.5 24.5 243.5 104.25 17.5 27 4 49.75 58.0000001 339.75
2
3 1 6 2 118 33 7 3 2 2 5 17
California Statewide Pesticide Regulatory Activities Summary Between July 2013 and June 2014
6/30/2015 Page 30 of 36
vityDe Description
206 2. Cases Submitted to DA207 3. Civil Complaints Filed208 4. Criminal Complaints Filed209 C. Referrals to DPR210 Total:211 Enforcement Actions212 Licensed Work Hours213 X. Focused Activity214 A. Licensed Hours215 1. Completed Projects216 2. Hours217 B. Non-Licensed Hours218 1. Completed Projects219 2. Hours220 Total:221 Completed Projects222 Hours223 XI. Surveillance Hours224 XII. Pesticide/Hazardous Mat'l Spill Hrs225 XIII. Use Report Review and Follow-Up Hrs226 XIV. Total Pesticide Activity Hours227 A. Lic. Hours Expended for I - XIII228 B. Other Lic. Enforcement Hours229 Lic. Hours Subtotal (A+B)230 C. Support Hours231 Total Hours
San Luis Obispo San Mateo Santa
Barbara Santa Clara Santa Cruz Shasta Siskiyou Solano Sonoma Stanislaus
1
21 1 34 13 3 4 4 6 17686.5 21.1000004 1276 84.5500002 75 53 10 157.100002 291
1373.5 2986.19998 1597.25 1335.14999 222 326 77.4500008 889.5 469.899998 3435.59 5.5 2.5568.5 670.699997 264.5 640.500004 136.5 153 445.099998 100.5 214.9 601.25
12392.5 5522.39999 12862.5 4568.72997 3702.75 1761.75 1747.45 5788.5 5663.10005 13114.04992649.5 3607.09996 1719 10116.9999 2597.5 1454.25 634.219997 2226.44998 2763.5 4869.515042 9129.49994 14581.5 14685.7301 6300.25 3216 2381.67001 8014.9501 8426.60004 17983.54992425.5 1041.2 2701.5 1831.10001 2096.25 940.5 1830.10001 2790.72 759.799998 4619.8000217467.5 10170.6999 17283 16516.83 8396.5 4156.5 4211.77 10805.6701 9186.40015 22603.3499
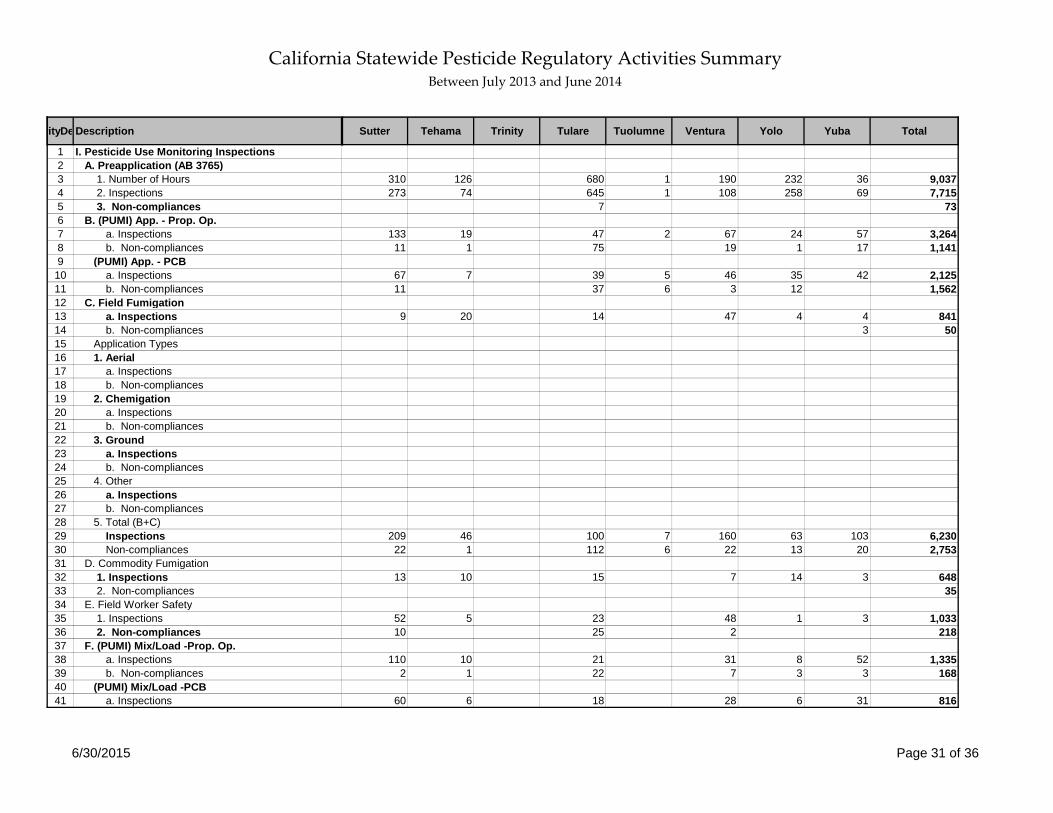
California Statewide Pesticide Regulatory Activities Summary Between July 2013 and June 2014
6/30/2015 Page 31 of 36
vityDe Description
1 I. Pesticide Use Monitoring Inspections2 A. Preapplication (AB 3765)3 1. Number of Hours4 2. Inspections5 3. Non-compliances6 B. (PUMI) App. - Prop. Op.7 a. Inspections8 b. Non-compliances9 (PUMI) App. - PCB
10 a. Inspections11 b. Non-compliances12 C. Field Fumigation13 a. Inspections14 b. Non-compliances15 Application Types16 1. Aerial17 a. Inspections18 b. Non-compliances19 2. Chemigation20 a. Inspections21 b. Non-compliances22 3. Ground23 a. Inspections24 b. Non-compliances25 4. Other26 a. Inspections27 b. Non-compliances28 5. Total (B+C)29 Inspections30 Non-compliances31 D. Commodity Fumigation32 1. Inspections33 2. Non-compliances34 E. Field Worker Safety35 1. Inspections36 2. Non-compliances37 F. (PUMI) Mix/Load -Prop. Op.38 a. Inspections39 b. Non-compliances40 (PUMI) Mix/Load -PCB41 a. Inspections
Sutter Tehama Trinity Tulare Tuolumne Ventura Yolo Yuba Total
310 126 680 1 190 232 36 9,037273 74 645 1 108 258 69 7,715
7 73
133 19 47 2 67 24 57 3,26411 1 75 19 1 17 1,141
67 7 39 5 46 35 42 2,12511 37 6 3 12 1,562
9 20 14 47 4 4 8413 50
209 46 100 7 160 63 103 6,23022 1 112 6 22 13 20 2,753
13 10 15 7 14 3 64835
52 5 23 48 1 3 1,03310 25 2 218
110 10 21 31 8 52 1,3352 1 22 7 3 3 168
60 6 18 28 6 31 816
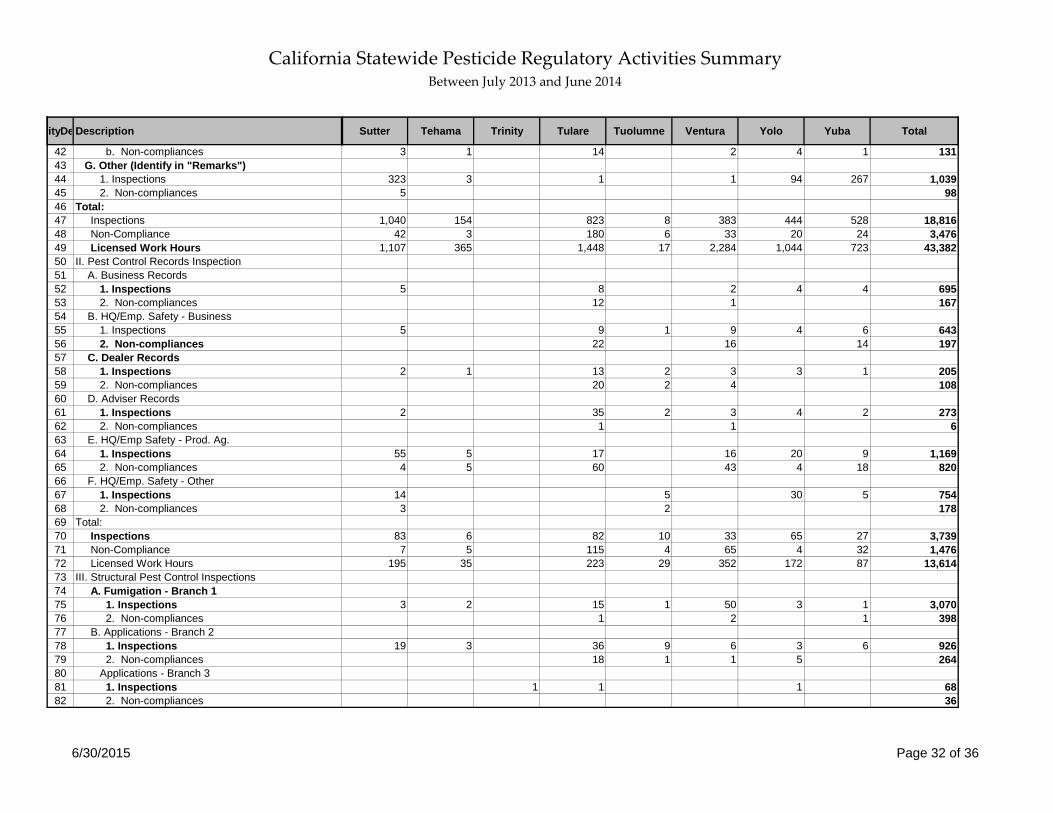
California Statewide Pesticide Regulatory Activities Summary Between July 2013 and June 2014
6/30/2015 Page 32 of 36
vityDe Description
42 b. Non-compliances43 G. Other (Identify in "Remarks")44 1. Inspections45 2. Non-compliances46 Total:47 Inspections48 Non-Compliance49 Licensed Work Hours50 II. Pest Control Records Inspection51 A. Business Records52 1. Inspections53 2. Non-compliances54 B. HQ/Emp. Safety - Business55 1. Inspections56 2. Non-compliances57 C. Dealer Records58 1. Inspections59 2. Non-compliances60 D. Adviser Records61 1. Inspections62 2. Non-compliances63 E. HQ/Emp Safety - Prod. Ag.64 1. Inspections65 2. Non-compliances66 F. HQ/Emp. Safety - Other67 1. Inspections68 2. Non-compliances69 Total:70 Inspections71 Non-Compliance72 Licensed Work Hours73 III. Structural Pest Control Inspections74 A. Fumigation - Branch 175 1. Inspections76 2. Non-compliances77 B. Applications - Branch 278 1. Inspections79 2. Non-compliances80 Applications - Branch 381 1. Inspections82 2. Non-compliances
Sutter Tehama Trinity Tulare Tuolumne Ventura Yolo Yuba Total
3 1 14 2 4 1 131
323 3 1 1 94 267 1,0395 98
1,040 154 823 8 383 444 528 18,81642 3 180 6 33 20 24 3,476
1,107 365 1,448 17 2,284 1,044 723 43,382
5 8 2 4 4 69512 1 167
5 9 1 9 4 6 64322 16 14 197
2 1 13 2 3 3 1 20520 2 4 108
2 35 2 3 4 2 2731 1 6
55 5 17 16 20 9 1,1694 5 60 43 4 18 820
14 5 30 5 7543 2 178
83 6 82 10 33 65 27 3,7397 5 115 4 65 4 32 1,476
195 35 223 29 352 172 87 13,614
3 2 15 1 50 3 1 3,0701 2 1 398
19 3 36 9 6 3 6 92618 1 1 5 264
1 1 1 6836

California Statewide Pesticide Regulatory Activities Summary Between July 2013 and June 2014
6/30/2015 Page 33 of 36
vityDe Description
83 C. Mix-Load - Branch 284 1. Inspections85 2. Non-compliances86 Mix-Load - Branch 387 1. Inspections88 2. Non-compliances89 D. Hqtr./Employee Safety - Business90 a. Inspections91 b. Non-compliances92 E. Business Records93 a. Inspections94 b. Non-compliances95 Total:96 Inspections97 Non-Compliance98 Licensed Work Hours99 IV. Restricted Materials (AB 3765 Hrs)100 A. Agricultural permits101 1. Number of Hours102 2. Issued103 3. Denied104 B. Non-Agricultural Permits105 1. Number of Hours106 2. Issued107 3. Denied108 C. Total Permits109 1. Issued110 2. Denied111 D. Notice of Intents Reviewed112 1. Number of Hours113 2. Reviewed114 3. Denied115 Total:116 Licensed Work Hours (A+B+D)117 E. Annual Total Sites118 1. Issued119 F. Annual Total Multi-Year Permits120 1. Issued121 V. Investigations122 A. Human Effects - Agricultural123 a. Total Investigations
Sutter Tehama Trinity Tulare Tuolumne Ventura Yolo Yuba Total
1 1 1 18332
145 10
3 7 5 1 4731 5 108
4 8 1 3 2 6995 148
29 6 1 68 11 64 8 10 5,43320 1 18 5 1 996
50 6 1 464 19 445 17 28 21,703
3,236 684 4 6,857 27 3,591 2,556 1,147 84,9151,098 290 2 2,373 13 1,300 703 252 28,940
2 80
1 4 94 3 85 13 3 3,23317 40 3 148 10 1,393
11
1,115 290 2 2,413 16 1,448 713 252 30,3332 91
177 168 1,489 5 2,201 118 283 24,6813,275 514 6,813 6 1,986 2,601 958 108,509
1 127 2 2 859
3,414 856 4 8,440 35 5,877 2,687 1,433 112,830
5,348 3,617 21,753 2,170 5,628 243,266
4 2,756 370 10,452
7 23 4 12 2 311
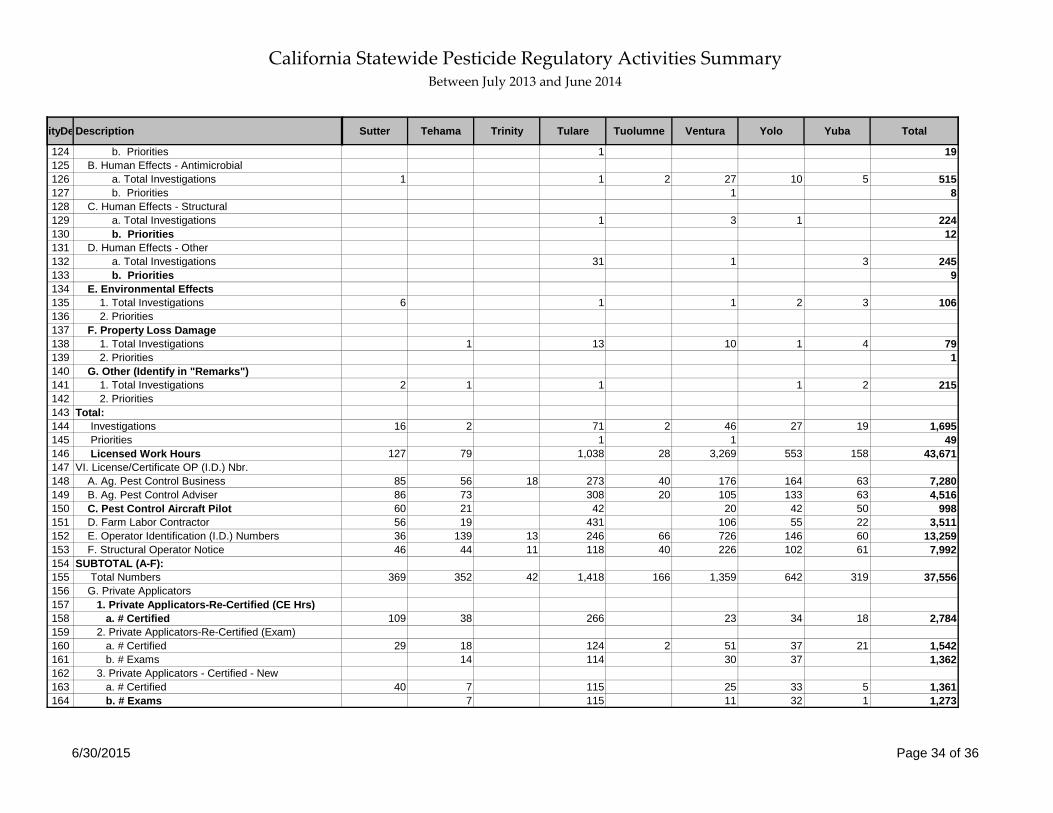
California Statewide Pesticide Regulatory Activities Summary Between July 2013 and June 2014
6/30/2015 Page 34 of 36
vityDe Description
124 b. Priorities125 B. Human Effects - Antimicrobial126 a. Total Investigations127 b. Priorities128 C. Human Effects - Structural129 a. Total Investigations130 b. Priorities131 D. Human Effects - Other132 a. Total Investigations133 b. Priorities134 E. Environmental Effects135 1. Total Investigations136 2. Priorities137 F. Property Loss Damage138 1. Total Investigations139 2. Priorities140 G. Other (Identify in "Remarks")141 1. Total Investigations142 2. Priorities143 Total:144 Investigations145 Priorities146 Licensed Work Hours147 VI. License/Certificate OP (I.D.) Nbr.148 A. Ag. Pest Control Business149 B. Ag. Pest Control Adviser150 C. Pest Control Aircraft Pilot151 D. Farm Labor Contractor152 E. Operator Identification (I.D.) Numbers153 F. Structural Operator Notice154 SUBTOTAL (A-F):155 Total Numbers156 G. Private Applicators157 1. Private Applicators-Re-Certified (CE Hrs)158 a. # Certified159 2. Private Applicators-Re-Certified (Exam)160 a. # Certified161 b. # Exams162 3. Private Applicators - Certified - New163 a. # Certified164 b. # Exams
Sutter Tehama Trinity Tulare Tuolumne Ventura Yolo Yuba Total
1 19
1 1 2 27 10 5 5151 8
1 3 1 22412
31 1 3 2459
6 1 1 2 3 106
1 13 10 1 4 791
2 1 1 1 2 215
16 2 71 2 46 27 19 1,6951 1 49
127 79 1,038 28 3,269 553 158 43,671
85 56 18 273 40 176 164 63 7,28086 73 308 20 105 133 63 4,51660 21 42 20 42 50 99856 19 431 106 55 22 3,51136 139 13 246 66 726 146 60 13,25946 44 11 118 40 226 102 61 7,992
369 352 42 1,418 166 1,359 642 319 37,556
109 38 266 23 34 18 2,784
29 18 124 2 51 37 21 1,54214 114 30 37 1,362
40 7 115 25 33 5 1,3617 115 11 32 1 1,273

California Statewide Pesticide Regulatory Activities Summary Between July 2013 and June 2014
6/30/2015 Page 35 of 36
vityDe Description
165 4. Private Applicators - Failed Exam166 b. # Exams167 SUBTOAL (G 1-4)168 # Certified169 # Exams170 Total:171 Licensed/Certified/Op. ID #172 Licensed Work Hours173 VII. Training and Outreach174 A. Licensees175 a. Total Sessions176 b. Total Persons Attending177 B. Growers/Operators178 a. Total Sessions179 b. Total Persons Attending180 C. Public Education181 a. Total Sessions182 b. Total Persons Attending183 D. Other (Identify in "Remarks")184 a. Total Sessions185 b. Total Persons Attending186 Total:187 Training Sessions188 Persons Attending189 Licensed Work Hours190 VIII. Compliance Actions191 A. Warning Letters / Violation Notices192 B. Cease and Desist Orders193 C. Documented Compliance Interviews194 Total:195 Compliance Actions196 Licensed Work Hours197 IX. Enforcement Actions198 A. Administrative Action: (1-5)199 1. Restricted Materials Permit200 2. Private Applicator Certifications201 3. County Registrations202 4. Structural Civil Penalties203 5. Agricultural Civil Penalties204 B. Judicial Actions: (1-4)205 1. Notice to Appear (Citations)
Sutter Tehama Trinity Tulare Tuolumne Ventura Yolo Yuba Total
5 2 42 1 21 4 525
178 63 505 2 99 104 44 5,6875 23 271 1 62 69 5 3,160
547 415 42 1,923 168 1,458 746 363 43,24315 325 38 294 105 780 118 261 28,505
11 7 8 2 4 6 8 468488 103 380 33 96 497 130 11,886
28 6 42 15 79 9181,473 282 970 17 299 707 220 16,523
14 1 3 2 23 2238,826 12 350 42 85 19,034
1 1 2 1 1 1603 63 252 15 3,244
40 8 30 3 50 24 110 1,7691,964 448 10,428 62 745 1,261 435 50,687
286 73 294 31 232 290 82 13,619
43 2 149 64 6 6 31624 244
3 1 57
43 5 154 64 6 6 346331 8 664.5 2 179 15 9 11957.08
1 6
5289
22 18 1 12 10 4 715
California Statewide Pesticide Regulatory Activities Summary Between July 2013 and June 2014
6/30/2015 Page 36 of 36
vityDe Description
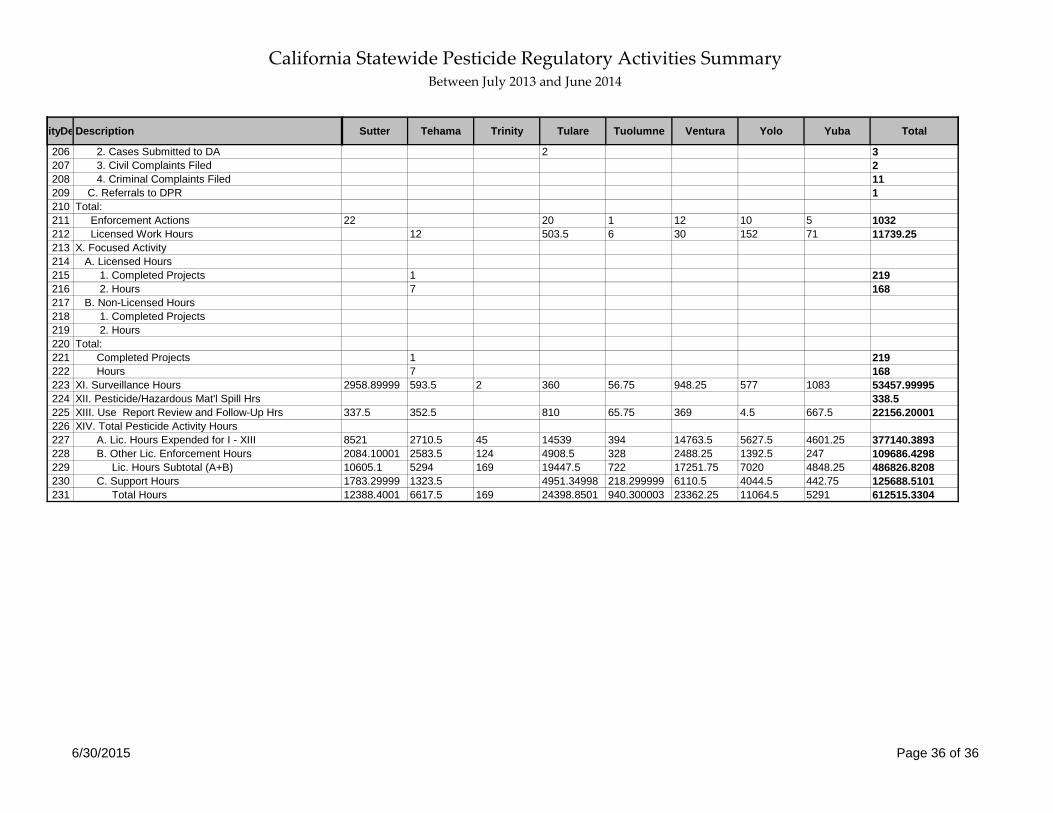
206 2. Cases Submitted to DA207 3. Civil Complaints Filed208 4. Criminal Complaints Filed209 C. Referrals to DPR210 Total:211 Enforcement Actions212 Licensed Work Hours213 X. Focused Activity214 A. Licensed Hours215 1. Completed Projects216 2. Hours217 B. Non-Licensed Hours218 1. Completed Projects219 2. Hours220 Total:221 Completed Projects222 Hours223 XI. Surveillance Hours224 XII. Pesticide/Hazardous Mat'l Spill Hrs225 XIII. Use Report Review and Follow-Up Hrs226 XIV. Total Pesticide Activity Hours227 A. Lic. Hours Expended for I - XIII228 B. Other Lic. Enforcement Hours229 Lic. Hours Subtotal (A+B)230 C. Support Hours231 Total Hours
Sutter Tehama Trinity Tulare Tuolumne Ventura Yolo Yuba Total
2 32111
22 20 1 12 10 5 103212 503.5 6 30 152 71 11739.25
1 2197 168
1 2197 168
2958.89999 593.5 2 360 56.75 948.25 577 1083 53457.99995338.5
337.5 352.5 810 65.75 369 4.5 667.5 22156.20001
8521 2710.5 45 14539 394 14763.5 5627.5 4601.25 377140.38932084.10001 2583.5 124 4908.5 328 2488.25 1392.5 247 109686.429810605.1 5294 169 19447.5 722 17251.75 7020 4848.25 486826.82081783.29999 1323.5 4951.34998 218.299999 6110.5 4044.5 442.75 125688.510112388.4001 6617.5 169 24398.8501 940.300003 23362.25 11064.5 5291 612515.3304


![July-Answers - comeafterme.comcomeafterme.com/.../English/SmallGroup/07-July-Small-… · Web viewJuly Answers [July 1] The conflict between Syria and Israel continued throughout](https://img.pdfslide.us/doc/110x75/5abb3a1d7f8b9a567c8c6701/july-answers-web-viewjuly-answers-july-1-the-conflict-between-syria-and-israel.jpg)