Embed Size (px)
Citation preview
LUND UNIVERSITY
PO Box 117221 00 Lund+46 46-222 00 00
Better Prognosis of Patients with Glioma Expressing FGF2-Dependent PDGFRAIrrespective of Morphological Diagnosis.
Chen, Dongfeng; Persson, Annette; Sun, Yingyu; Salford, Leif; Gisselsson Nord, David;Englund, Elisabet; Jiang, Tao; Fan, XiaolongPublished in:PLoS ONE
DOI:10.1371/journal.pone.0061556
2013
Link to publication
Citation for published version (APA):Chen, D., Persson, A., Sun, Y., Salford, L., Gisselsson Nord, D., Englund, E., ... Fan, X. (2013). Better Prognosisof Patients with Glioma Expressing FGF2-Dependent PDGFRA Irrespective of Morphological Diagnosis. PLoSONE, 8(4), [e61556]. https://doi.org/10.1371/journal.pone.0061556
General rightsCopyright and moral rights for the publications made accessible in the public portal are retained by the authorsand/or other copyright owners and it is a condition of accessing publications that users recognise and abide by thelegal requirements associated with these rights.
• Users may download and print one copy of any publication from the public portal for the purpose of private studyor research. • You may not further distribute the material or use it for any profit-making activity or commercial gain • You may freely distribute the URL identifying the publication in the public portalTake down policyIf you believe that this document breaches copyright please contact us providing details, and we will removeaccess to the work immediately and investigate your claim.
Better Prognosis of Patients with Glioma ExpressingFGF2-Dependent PDGFRA Irrespective of MorphologicalDiagnosisDongfeng Chen1, Annette Persson2, Yingyu Sun5, Leif G. Salford1, David Gisselsson Nord2,3,
Elisabet Englund2, Tao Jiang4, Xiaolong Fan1,5*
1 The Rausing Laboratory, Department of Neurosurgery, Lund University, Lund, Sweden, 2 Department of Pathology, Lund University, Lund, Sweden, 3 Department of
Clinical Genetics, Lund University, Lund, Sweden, 4 Glioma Center, Department of Neurosurgery, Beijing Tiantan Hospital, Capital Medical University, Beijing, China,
5 Beijing Key Laboratory of Gene Resource and Molecular Development, Laboratory of Neuroscience and Brain Development, Beijing Normal University, Beijing, China
Abstract
Signaling of platelet derived growth factor receptor alpha (PDGFRA) is critically involved in the development of gliomas.However, the clinical relevance of PDGFRA expression in glioma subtypes and the mechanisms of PDGFRA expression ingliomas have been controversial. Under the supervision of morphological diagnosis, analysis of the GSE16011 and theRepository of Molecular Brain Neoplasia Data (Rembrandt) set revealed enriched PDGFRA expression in low-grade gliomas.However, gliomas with the top 25% of PDGFRA expression levels contained nearly all morphological subtypes, which wasassociated with frequent IDH1 mutation, 1p LOH, 19q LOH, less EGFR amplification, younger age at disease onset and bettersurvival compared to those gliomas with lower levels of PDGFRA expression. SNP analysis in Rembrandt data set and FISHanalysis in eleven low passage glioma cell lines showed infrequent amplification of PDGFRA. Using in vitro culture of theselow passage glioma cells, we tested the hypothesis of gliogenic factor dependent expression of PDGFRA in glioma cells.Fibroblast growth factor 2 (FGF2) was able to maintain PDGFRA expression in glioma cells. FGF2 also induced PDGFRAexpression in glioma cells with low or non-detectable PDGFRA expression. FGF2-dependent maintenance of PDGFRAexpression was concordant with the maintenance of a subset of gliogenic genes and higher rates of cell proliferation.Further, concordant expression patterns of FGF2 and PDGFRA were detected in glioma samples by immunohistochemicalstaining. Our findings suggest a role of FGF2 in regulating PDGFRA expression in the subset of gliomas with younger age atdisease onset and longer patient survival regardless of their morphological diagnosis.
Citation: Chen D, Persson A, Sun Y, Salford LG, Nord DG, et al. (2013) Better Prognosis of Patients with Glioma Expressing FGF2-Dependent PDGFRA Irrespectiveof Morphological Diagnosis. PLoS ONE 8(4): e61556. doi:10.1371/journal.pone.0061556
Editor: Joseph Najbauer, University of Pecs Medical School, Hungary
Received January 14, 2013; Accepted March 12, 2013; Published April 22, 2013
Copyright: � 2013 Chen et al. This is an open-access article distributed under the terms of the Creative Commons Attribution License, which permitsunrestricted use, distribution, and reproduction in any medium, provided the original author and source are credited.
Funding: This study was supported by The Swedish Cancer Society, National Natural Science Foundation of China (grant 81072080), international collaborativeprogram of the Ministry of Science and Technology of China (grant 2012DFA30470), and the Hans and Marit Rausing Charitable Foundation. The funders had norole in study design, data collection and analysis, decision to publish, or preparation of the manuscript.
Competing Interests: The authors have declared that no competing interests exist.
* E-mail: [email protected]
Introduction
Gliomas are the most common primary tumors in adult central
nervous system. According to the World Health Organization
classification scheme, gliomas are morphologically diagnosed as
astrocytic, oligodendroglial, and mixed oligoastrocytic tumors,
which are further subdivided into I to IV malignant grades based
on the extent of cell proliferation, angiogenesis and necrosis [1].
Despite intensive efforts in mechanistic and clinical investigations,
the prognosis of glioma patients remains poor. Patients with
glioblastoma multiforme (GBM) have a survival time of only up to
2 years after diagnosis [2]. Low-grade gliomas will eventually
progress into high-grade gliomas, although with varying kinetics
among the patients. A large number of studies have indicated
a resemblance between glioma cells and immature neural cells,
including neural stem cells and glial progenitor cells [3,4,5].
Understanding the mechanisms that are responsible for these
resemblances may clarify causes for the abnormal proliferation,
migration and differentiation features of glioma cells, and thereby
identify new therapeutic targets.
Glioma cells are maintained by interplay between the intrinsic
gene expression profiles of glioma cells and the niche environment.
Gliogenic growth factors and their receptors are frequently over-
expressed in gliomas [6,7,8]. PDGFRA is a characteristic marker
of oligodendrocyte progenitor cells (OPCs) [9,10,11,12] and its
disruption results in diminished oligodendrogenesis [13]. Previous
studies have also demonstrated crucial roles of PDGFRA signaling
in gliomagenesis and shown that it is overexpressed in 30% of
human gliomas [5,7,14,15]. In particular, autocrine stimulation of
PDGFRA signaling is suggested to be important for glioma
initiation and progression [15,16]. In mice, PDGFB overexpres-
sion in neonatal CNS or adult CNS, either by the transgenic
approach on a p532/2 background [17], or by the retroviral gene
transfer approach [16,18,19], generated glioma-like tumor growth.
Interestingly, tumors generated in these models all expressed
PDGFRA [17,18,20]. Inhibition of PDGFRA signaling resulted in
a reversion of transformed phenotype in glioma cell lines [21], or
a reversion from high-grade to lower grade tumor histology in
mouse model [22]. However, compared to the established close
PLOS ONE | www.plosone.org 1 April 2013 | Volume 8 | Issue 4 | e61556
association between EGFR high expression and EGFR gene
amplification and mutation [23], the regulation mechanism for
PDGFRA expression in glioma cells is yet unclear [5,24]. Further,
the occurrence and clinical relevance of PDGFRA expression in
different glioma subtypes is debated and controversial as both
enhanced as well as negative expression patterns have been
reported in GBM [8,14,24]. Recently, enriched PDGFRA
expression was reported in the proneural GBM subtype which
was seen to be associated with a better prognosis compared to the
other molecular subtypes of GBM [25,26], while other studies
reported no correlation between PDGFRA expression and
clinical-pathological parameters of glioma patients [14].
In this report, we hypothesize that PDGFRA expression is
regulated by gliogenic factors in gliomas. Using large glioma gene
expression databases, we found that the expression of both
PDGFRA and FGF2 were enriched in low-grade gliomas. Using in
vitro cell culture combined with microarray gene expression
analysis, we demonstrated that FGF2 dependent glioma cell
growth was concomitant with maintained expression of a subset of
gliogenic genes, including PDGFRA. Clinically, enriched PDGFRA
expression in low- as well as in high-grade glioma samples was
associated with younger age at disease onset and better survival
outcome of patients. Our findings indicated FGF2 signaling as
a potential intervening target in glioma subset with enriched
PDGFRA expression.
Materials and Methods
Ethics StatementThe collection and use of the human tissues in this study were
performed after obtaining written consent from all participants, in
accordance with a study protocol approved by The Regional
Ethical Review Board in Lund, Sweden with the permission H15
642/2008. Glioma biopsies of fresh tumor tissue were obtained
from patients operated at the Clinic of Neurosurgery, Lund
University Hospital, Sweden. Glioma tissue blocks derived from
surgical excision biopsies were obtained from the archive of
Department of Pathology, Lund University Hospital.
Microarray data and analysis of microarray geneexpression data
Total cellular RNA was extracted and purified using the
RNeasy Mini kit (Qiagen) according to the manufacturer’s
instructions. The quality of total RNA and integrity of rRNA
were determined using Agilent 2100 Bioanalyzer (Agilent Tech-
nologies). Cells from two GBM cell lines (L1 and L2) cultured
under conditions with FGF2 (+FGF2) or without FGF2 (2FGF2)
support were used. Cells were harvested when PDGFRA
expression in 2FGF2 condition was undetectable by flow
cytometric analysis. Each condition contained three biological
replicates. The hybridizations were performed at SCIBLU of
Lund University using Affymetrix arrays (GeneChipH Human
Gene ST Arrays, Affymetrix).
Microarray data from GSE16011 (containing 244 gliomas of all
major morphological subtypes and 8 controls), GSE4290 (con-
taining 157 gliomas of all major morphological subtypes and 23
controls) and the Rembrandt (containing 404 gliomas of all major
known morphological subtypes and 21 controls), were gathered
from published studies [27,28,29]. The CEL files for GSE16011
and the Rembrandt data set were separately merged and
computed with RMAExpress tool. The expression data were
normalized according to quantile normalization, and expressed in
natural scale. FGF2 or PDGFRA expression was analyzed using
SPSS software in GSE16011 and Rembrandt data sets, respec-
tively. Qlucore Omics Explore 2.2 (Qlucore AB, Lund, Sweden)
was used for gene expression clustering analysis.
A gliogenesis gene list of 172 genes was first compiled from gene
ontology GO:0042063 and transcriptional control of oligoden-
drogenesis [30]. Subsequently, differential expression of gliogenesis
genes in glioma samples was evaluated in GSE4290 [29], which
includes 157 gliomas of all major morphological subtypes and
malignant grades and 23 epileptic brain samples as control.
Seventy-eight gliogenesis genes differentially enriched in glioma
samples (compared to non-tumor brain samples) in GSE4290 were
selected as glioma-relevant gliogenesis genes (Figure S1).
SNP-array analysisCopy number analysis was performed on 205 gliomas from the
Rembrandt data set [28]. The raw HindIII CEL files from the 50K
single nucleotide polymorphism (SNP) array for tumor and
matched normal samples were imported into dChip [31]. Copy
number profiles were calculated by (a) normalizing the intensities
using an invariant set of probes, (b) calculating a raw copy number
for each SNP using ‘‘model based expression’’ with perfect match/
mismatch difference, and (c) using median smoothing with a 10
SNP window. To eliminate batch specific noise in the copy
number data, the calculations were performed in smaller batches
based on the creation date of the CEL-files. The copy number
data was segmented and analyzed within each cluster defined by
the extent of PDGFRA or EGFR expression using GLAD [32]
and GISTIC2.0 [33] at an amplitude threshold of 60.2 as
implemented in the web application of Gene Pattern at http://
genepattern.broadinstitute.org.
Survival analysisOverall survival time was separately calculated for patients
grouped according to the clusters of PDGFRA expression in
glioma samples from the date of surgery until death or the last
follow-up contact. The clinical data for the Rembrandt data set
was downloaded in May 2012. Kaplan-Meier survival curves were
generated and analyzed with log-rank test in SPSS software.
Isolation and culture of glioma cellsGlioma biopsies of fresh tumor tissue were obtained from
patients operated at the Clinic of Neurosurgery, Lund University
Hospital, Sweden. Written informed consent was obtained from
patients. For preparing viable glioma cells, the fresh specimen
were cut into small pieces, and incubated in IMDM with 0.5 mg/
ml collagenase (Sigma) and 25 mg/ml DNAse (Sigma) at 37uC for
40 minutes. Red cells were lysed with NH4Cl. The remaining
glioma cells were washed in PBS containing 2% fetal calf serum
(FCS). Glioma cells were grown in poly-L-Lysine (PLL) coated
flasks with DMEM/F12 (1:1) medium (Life Technologies)
supplemented with 2% FCS, D-(+)-Glucose solution (0.6%;
Sigma), heparin (5 mg/ml; Sigma), sodium bicarbonate (0.1%;
Sigma), N2 supplement (Life Technologies), FGF2 (20 ng/ml;
Peprotech), sonic hedgehog (SHH) (2 ng/ml of C24II version,
R&D Systems), and PDGF-AA(20 ng/ml; Peprotech).
Flow cytometric analysisAbout 105 to 106 cells were stained with allophycocyanin (APC)-
conjugated anti-CD44 monoclonal antibody (mAb, clone C26,
BD) in combination with phycoerythrin (PE)-conjugated mAb
against PDGFRA (clone aR1, BD) for 10 minutes in the dark at
4uC. Subsequently, cells were washed once with PBS and
suspended in 500 ml PBS supplemented with 2% FCS and
1.0 mg/ml 7- aminoactinomycin D (7-AAD, Sigma). PDGFRA
Clinical Relevance of PDGFRA Expression in Gliomas
PLOS ONE | www.plosone.org 2 April 2013 | Volume 8 | Issue 4 | e61556
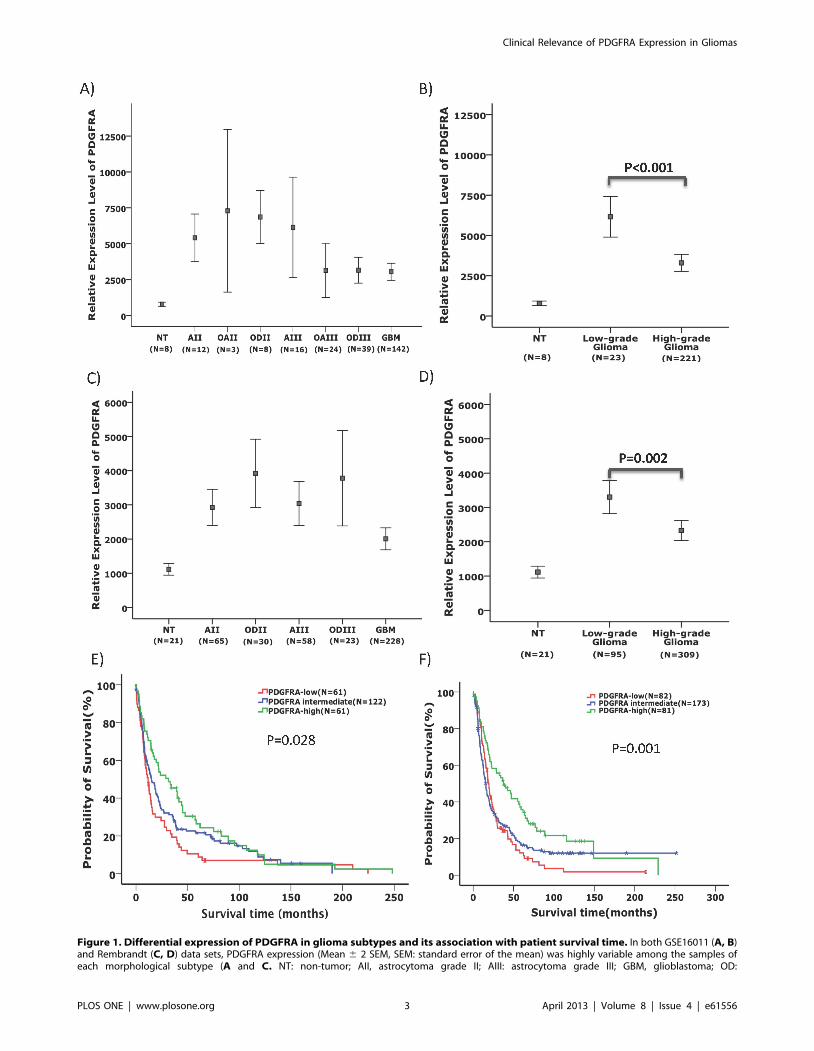
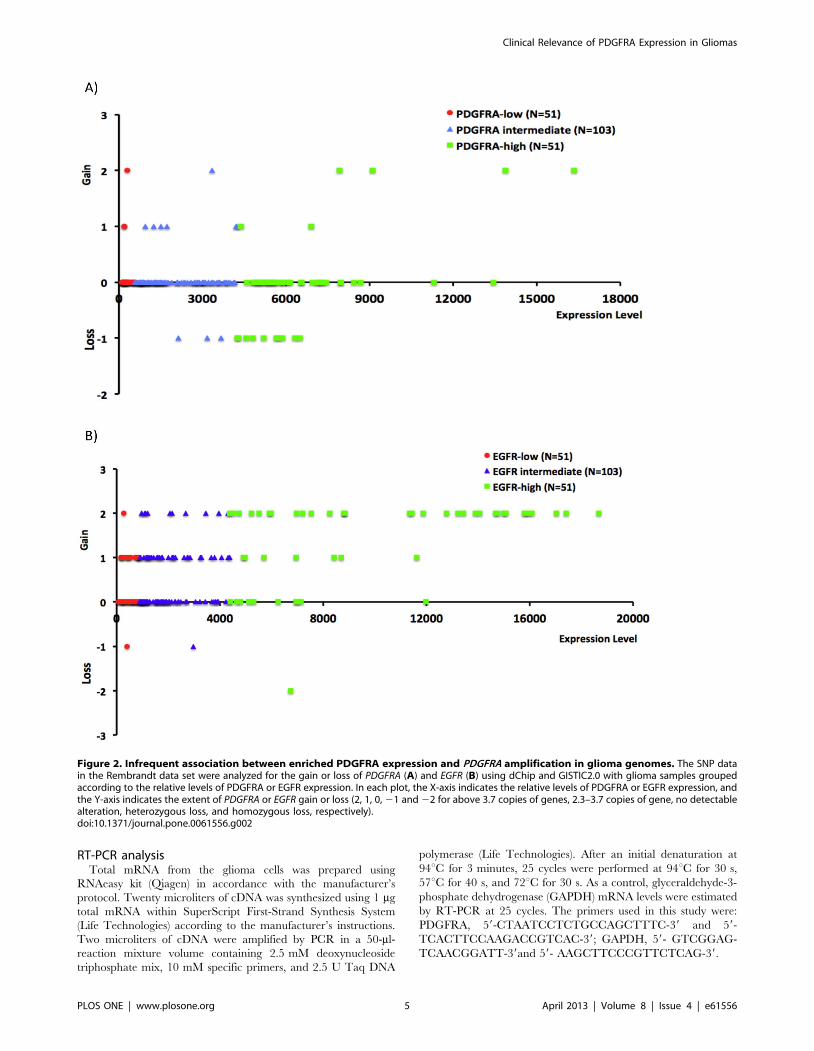
Figure 1. Differential expression of PDGFRA in glioma subtypes and its association with patient survival time. In both GSE16011 (A, B)and Rembrandt (C, D) data sets, PDGFRA expression (Mean 6 2 SEM, SEM: standard error of the mean) was highly variable among the samples ofeach morphological subtype (A and C. NT: non-tumor; AII, astrocytoma grade II; AIII: astrocytoma grade III; GBM, glioblastoma; OD:
Clinical Relevance of PDGFRA Expression in Gliomas
PLOS ONE | www.plosone.org 3 April 2013 | Volume 8 | Issue 4 | e61556
and CD44 expression was evaluated using a FACSCalibur (Becton
Dickinson Immunocytometry Systems) and analyzed using FlowJo
software.
Fluorescence in situ hybridization (FISH) analysis ofPDGFRA copy-numbers
FISH analysis of PDGFRA copy-number in metaphase and
interphase cells was performed in glioma cells cultured in the
medium described above according to standard protocols [34],
using a fluorescein-labelled probe for PDGFRA together with
a proximal (CHIC2) Cy3-labelled control probe for chromosome 4
(Kreatech Biotechnology/Medprobe, Lund, Sweden). Gene am-
plification was defined as the presence of at least double the
number of PDGFRA probe signal compared to the control probe.
Ploidy was defined by the number of signals of the control probe (2
signals = 2n, 4 signals = 4n, etc.).
Bromodeoxyuridine (BrdU)-based cell proliferation assayL2 glioma cells, a cell line previously tested capable of
generating xenograft tumors (the Lux-2 cells in [35]), were seeded
(26105 cells/well) into 6-well plates and cultured with (+) or
without (2) FGF2 (20 ng/ml) for 48 h. Cells were then incubated
with 10 mM BrdU for 1 h. Proliferating cells with BrdU
incorporated were estimated using BD PharmingenTM BrdU Flow
Kits according to the manufacture’s protocol (BD).
oligodendroglioma; OA: oligoastrocytoma). Low-grade gliomas showed significantly higher levels of PDGFRA expression compared to high-gradegliomas (B and D). Kaplan-Meier plots showed that in both GSE16011 (E) and Rembrandt (F) data sets, the survival of patients with the upper 25%PDGFRA expression (PDGFRA-high) in glioma samples irrespective of their morphological diagnosis was significantly longer compared with thoseglioma patients with PDGFRA expression at the lowest 25% (PDGFRA-low) and the intermediate 50% (log-rank test).doi:10.1371/journal.pone.0061556.g001
Table 1. Pathological and clinical parameters of gliomas with varying extent of PDGFRA expression.
Data set Morphological Subtypes Number of samples
PDGFRA-low (N = 61)PDGFRA intermediate(N = 122) PDGFRA-high (N = 61)
GSE16011 (N = 244) AII 0 7 5
AIII 0 8 8
OAII 0 1 2
OAIII 10 10 4
ODII 0 1 7
ODIII 7 23 9
GBM 44 72 26
IDH1 mutation 14/52 (P = 0.02)* 35/94 24/48
1p LOH 9/31 (P = 0.001)* 25/69 (P,0.001)* 18/34
19q LOH 9/30 (P = 0.005)* 22/70 (P,0.001)* 16/30
EGFR amplification 13/35 (P,0.001)* 19/65 (P,0.001)* 5/32
Age at diagnosis (Median 6 SD) 55.2613.17 (P,0.001)* 51.51613.95 (P = 0.005)* 43.89613.68
Survival years (Median 6 SD) 0.9863.53 (P = 0.045)* 1.2763.26 (P = 0.13)* 2.4163.88
Rembrandt (N = 336)** Morphological Subtypes PDGFRA-low (N = 82) PDGFRA intermediate (N = 173) PDGFRA-high (N = 81)
AII 4 29 17
AIII 13 18 16
ODII 3 10 9
ODIII 4 14 6
GBM 58 102 33
1p LOH 15/51 (P,0.001)* 27/103 (P,0.001)* 26/51
19q LOH 8/51 (P,0.001)* 25/103 (P,0.001)* 23/51
EGFR amplification 32/51 (P,0.001)* 59/103 (P,0.001)* 10/51
Survival years (Median 6 SD) 1.5362.46 (P = 0.002)* 1.2363.21 (P = 0.007)* 3.0463.49
PDGFRA expression among the glioma samples in GSE16011 and the Rembrandt data sets was analyzed independent of morphological diagnosis. The samples with theupmost 25% of PDGFRA expression (PDGFRA-high) were compared with the samples with the lowest 25% of PDGFRA expression (PDGFRA-low) and the samples withthe 50% intermediate levels of PDGFRA expression (PDGFRA intermediate) regarding frequencies of IDH1 mutation, age at diagnosis and survival period. The data onIDH1 mutation, LOH at 1p and 19q, and EGFR amplification for GSE16011 data set were derived from the results of Gravendeel et al [27]. The data on LOH in regions of1p36 (1p36.23 or 1p36.32 or 1p36.31) and 19q13 (19q13.32 or 19q13.41) as analyzed by Mariani et al. [47], and EGFR amplification for the Rembrandt data set werederived from GISTIC2.0 analysis of the 50K HindIII SNP array data [28]. The differences for IDH1 mutation rate, LOH at 1p and 19q and EGFR amplification were analyzedusing chi-square test. The median age at diagnosis and survival period between the PDGFRA subgroups were analyzed using Fisher’s exact test, One-way Anova andlog-rank tests, respectively.*: Comparison with the PDGFRA-high group.**: The number of patients with known survival data.doi:10.1371/journal.pone.0061556.t001
Clinical Relevance of PDGFRA Expression in Gliomas
PLOS ONE | www.plosone.org 4 April 2013 | Volume 8 | Issue 4 | e61556
RT-PCR analysisTotal mRNA from the glioma cells was prepared using
RNAeasy kit (Qiagen) in accordance with the manufacturer’s
protocol. Twenty microliters of cDNA was synthesized using 1 mg
total mRNA within SuperScript First-Strand Synthesis System
(Life Technologies) according to the manufacturer’s instructions.
Two microliters of cDNA were amplified by PCR in a 50-ml-
reaction mixture volume containing 2.5 mM deoxynucleoside
triphosphate mix, 10 mM specific primers, and 2.5 U Taq DNA
polymerase (Life Technologies). After an initial denaturation at
94uC for 3 minutes, 25 cycles were performed at 94uC for 30 s,
57uC for 40 s, and 72uC for 30 s. As a control, glyceraldehyde-3-
phosphate dehydrogenase (GAPDH) mRNA levels were estimated
by RT-PCR at 25 cycles. The primers used in this study were:
PDGFRA, 59-CTAATCCTCTGCCAGCTTTC-39 and 59-
TCACTTCCAAGACCGTCAC-39; GAPDH, 59- GTCGGAG-
TCAACGGATT-39and 59- AAGCTTCCCGTTCTCAG-39.
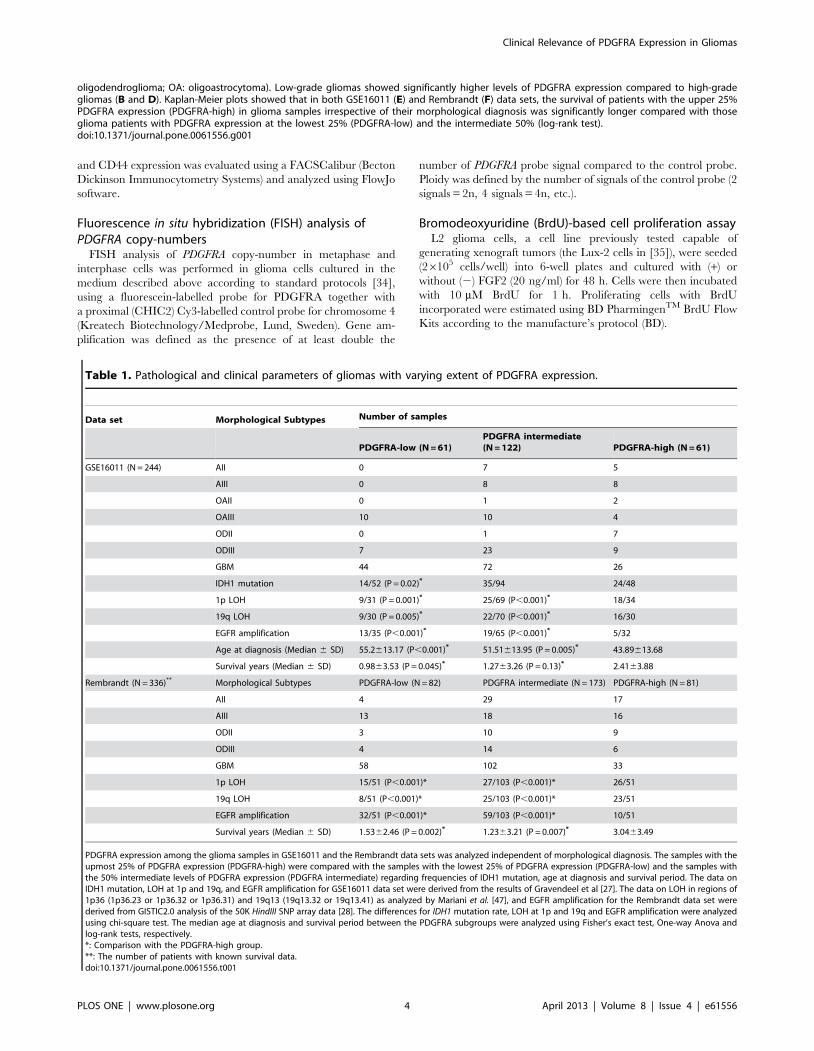
Figure 2. Infrequent association between enriched PDGFRA expression and PDGFRA amplification in glioma genomes. The SNP datain the Rembrandt data set were analyzed for the gain or loss of PDGFRA (A) and EGFR (B) using dChip and GISTIC2.0 with glioma samples groupedaccording to the relative levels of PDGFRA or EGFR expression. In each plot, the X-axis indicates the relative levels of PDGFRA or EGFR expression, andthe Y-axis indicates the extent of PDGFRA or EGFR gain or loss (2, 1, 0, 21 and 22 for above 3.7 copies of genes, 2.3–3.7 copies of gene, no detectablealteration, heterozygous loss, and homozygous loss, respectively).doi:10.1371/journal.pone.0061556.g002
Clinical Relevance of PDGFRA Expression in Gliomas
PLOS ONE | www.plosone.org 5 April 2013 | Volume 8 | Issue 4 | e61556
Immunohistochemical staining of PDGFRA and FGF2expression
Formaldehyde-fixed, paraffin-embedded tissue blocks derived
from surgical excision biopsies were obtained from the archive of
Department of Pathology, Lund University Hospital. Permission
for using the material was obtained from The Regional Ethical
Review Board in Lund. Sections of five-mm thickness were
mounted on capillary glass slides (DAKO ChemMate Capillary
Gap Microscope Slides, 75 mm, DAKO Sweden AB). All sections
were microwave pre-treated in 10 mM citrate buffer pH 6.0 for
15 minutes at 800 W in order to achieve antigen retrieval. An
automated immunostainer (TechMateTM 500 Plus, DAKO
Sweden AB) was used for the staining procedure using DAKO
ChemMate Kit Peroxidase/3-39 diaminobenzidine. Primary
antibodies used were polyclonal for anti-FGF2 (Sigma-Aldrich,
1: 2000 dilution) and clone D1E1E for anti-PDGFRA (Cell
Signaling, 1:400 dilution). We analyzed a collection of samples
containing 6 low-grade gliomas (two pilocytic astrocytomas, three
astrocytomas grade II and one oligoastrocytoma grade II) and 15
high-grade gliomas (one anaplastic astrocytoma grade III, one
anaplastic oligodendroglioma grade III, one anaplastic oligoas-
trocytoma grade III and 12 GBM). The staining was semi-
quantitatively evaluated for staining intensity within a defined
area. The staining was judged as markedly positive staining (++),
low-moderately positive staining (+) or no positive staining (2). In
each section, the predominant staining intensity was noted in the
grading score.
Results
To characterize the differential PDGFRA expression patterns in
the various glioma subtypes, we compared PDGFRA expression
among glioma morphological subtypes in GSE16011 and
Rembrandt data sets including 244 and 404 gliomas of known
diagnosis, respectively. High range of variations in PDGFRA
expression was evident in each morphological subtype. In both
data sets, the expression of PDGFRA was enriched in low-grade
(grade II) gliomas compared to high-grade (grades III and IV)
gliomas (p,0.001 and p = 0.002 in GSE16011 and Rembrandt,
respectively, t test, Figure 1A, 1B, 1C, 1D). Morphological
diagnosis of gliomas is known to be subjective and inconsistent
between the observers [36], which may account for the large
ranges of PDGFRA expression among the samples within each
morphological subtype, we thus analyzed PDGFRA expression in
glioma samples independent of their morphological diagnosis. We
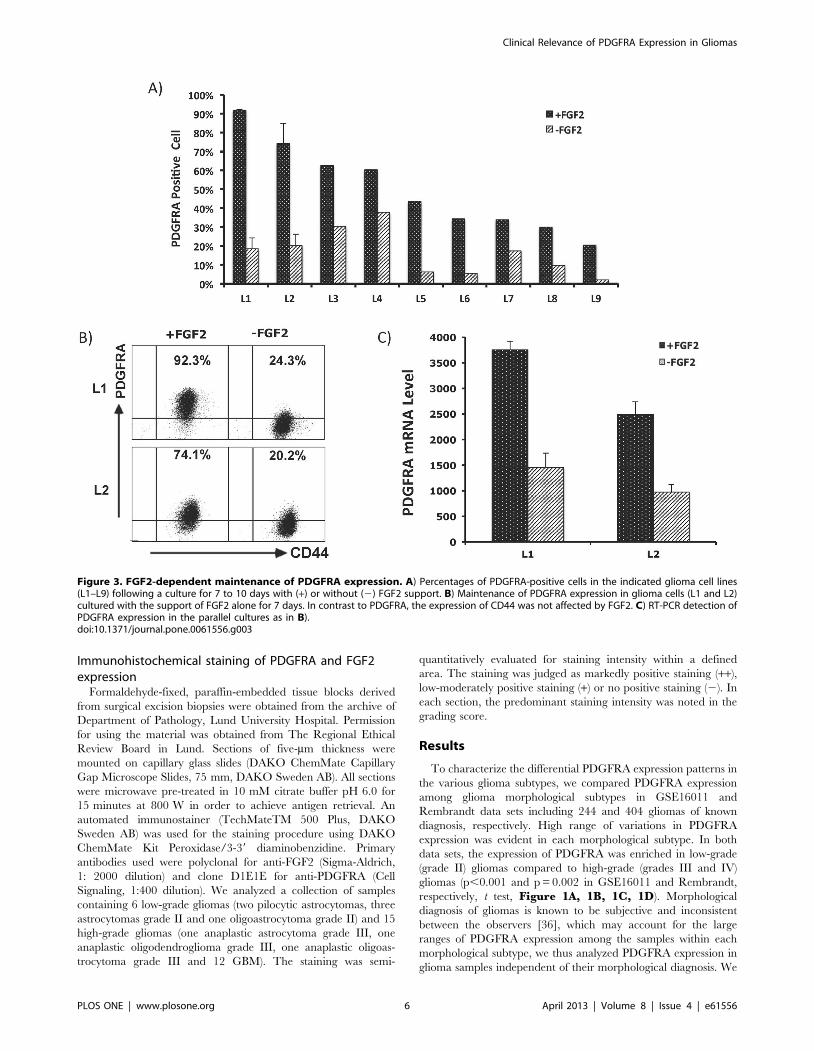
Figure 3. FGF2-dependent maintenance of PDGFRA expression. A) Percentages of PDGFRA-positive cells in the indicated glioma cell lines(L1–L9) following a culture for 7 to 10 days with (+) or without (2) FGF2 support. B) Maintenance of PDGFRA expression in glioma cells (L1 and L2)cultured with the support of FGF2 alone for 7 days. In contrast to PDGFRA, the expression of CD44 was not affected by FGF2. C) RT-PCR detection ofPDGFRA expression in the parallel cultures as in B).doi:10.1371/journal.pone.0061556.g003
Clinical Relevance of PDGFRA Expression in Gliomas
PLOS ONE | www.plosone.org 6 April 2013 | Volume 8 | Issue 4 | e61556
analyzed the survival and clinical diagnoses in gliomas with the
upper 25% PDGFRA expression levels (PDGFRA-high gliomas)
and compared to gliomas with lower 25% levels of PDGFRA
expression (PDGFRA-low gliomas). Both the PDGFRA-high and
PDGFRA-low groups contained gliomas of all morphological
subtypes (Table 1). The frequency of IDH1 mutation was
significantly higher in PDGFRA-high gliomas compared to
PDGFRA-low gliomas.
Furthermore, compared to PDGFRA-low and PDGFRA-
intermediate gliomas, PDGFRA-high gliomas were associated
with significantly higher frequency of loss of heterozygosity (LOH)
at 1p and 19q. Conversely, PDGFRA-low and PDGFRA-
intermediate gliomas were associated with significantly higher
frequency of EGFR amplification compared to PDGFRA-high
gliomas (Table 1). Interestingly, in both the GSE16011 and the
Rembrandt data sets, PDGFRA-high gliomas were associated with
younger age at disease onset compared to PDGFRA-low gliomas
(p,0.01, t test, Table 1). Patients with PDGFRA-high gliomas
survived significantly longer compared to patients with PDGFRA-
low gliomas (p = 0.028 and p = 0.001 in GSE16011 and
Rembrandt, respectively, log-rank test, Figure 1E, 1F and
Table 1). We further assessed if this is true for patients with
gliomas within the same malignancy grade. In the Rembrandt
data set, patients with PDGFRA-high GBMs or PDGFRA-high
low-grade gliomas showed significant better survival and younger
age at disease onset compared to patients with PDGFRA-low
GBMs or PDGFRA-low low-grade gliomas, respectively (FigureS2).
To address the causes of PDGFRA overexpression in gliomas,
we first analyzed the 50k HindIII SNP data in the Rembrandt data
set using dChip and GISTIC2.0. Six of the 51 gliomas in the
PDGFRA-high group showed gain of PDGFRA, and heterozygous
loss of PDGFRA gene was found in 10 cases in this group
(Figure 2A). This was in striking contrast to the nearly invariable
association between gain of EGFR and enriched EGFR expression
in the same cohort of glioma samples (Figure 2B). PDGFRA
overexpression is thus unlikely caused by PDGFRA gene amplifi-
cation in the majority of gliomas.
Next, we hypothesized that PDGFRA overexpression in glioma
cells is niche factor dependent. We established 11 low passage
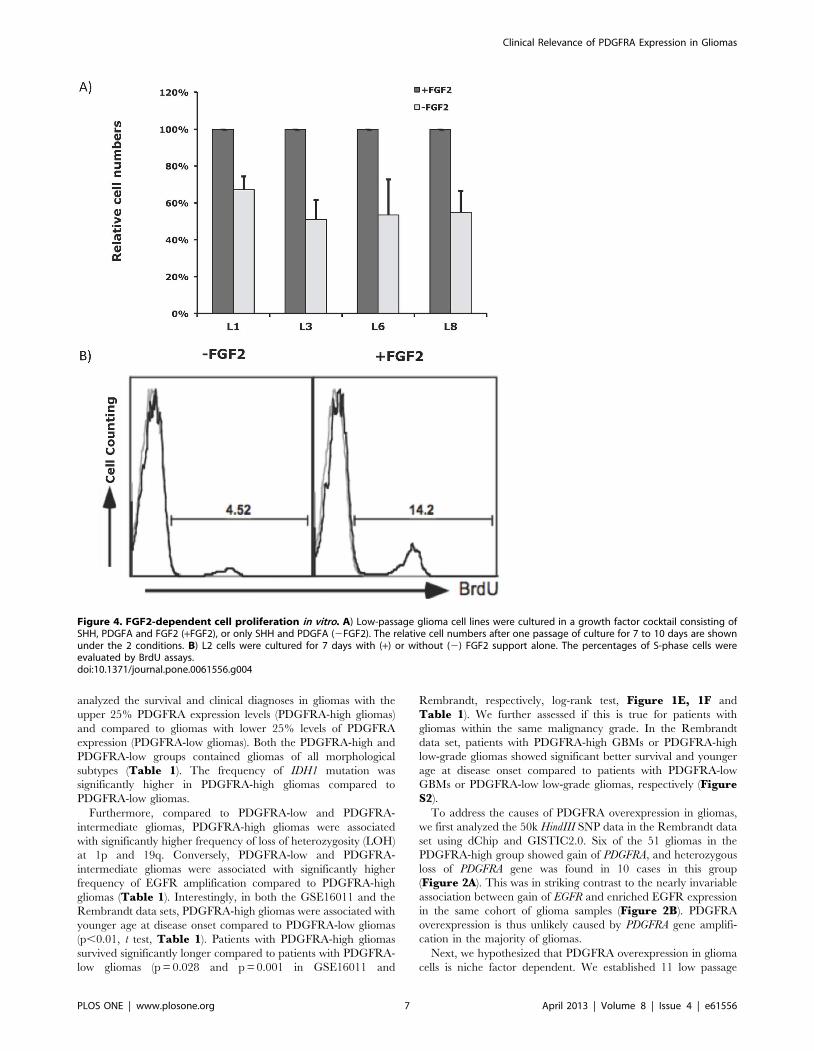
Figure 4. FGF2-dependent cell proliferation in vitro. A) Low-passage glioma cell lines were cultured in a growth factor cocktail consisting ofSHH, PDGFA and FGF2 (+FGF2), or only SHH and PDGFA (2FGF2). The relative cell numbers after one passage of culture for 7 to 10 days are shownunder the 2 conditions. B) L2 cells were cultured for 7 days with (+) or without (2) FGF2 support alone. The percentages of S-phase cells wereevaluated by BrdU assays.doi:10.1371/journal.pone.0061556.g004
Clinical Relevance of PDGFRA Expression in Gliomas
PLOS ONE | www.plosone.org 7 April 2013 | Volume 8 | Issue 4 | e61556
glioma cell lines in N2 supported DMEM/F12 medium containing
2% FCS with a growth factor cocktail consisting of FGF2, PDGF-
AA and SHH. PDGFRA expression was measured in fresh cells
and also monitored in cultured cells using flow cytometry. With
a cut-off at .4 copies, FISH analysis did not detect PDGFRA
amplification in any of these cell lines (Table 2). Under our
culture conditions, PDGFRA expression was maintained in all cell
lines as detected in flow cytometric analysis. In all of the 9 cell lines
tested, withdrawal of FGF2 resulted in a drop of PDGFRA
expression (Figure 3). However, the expression of CD44, a marker
of glial progenitor cells widely expressed on the surface of glioma
cells [37], was not detectably affected. Thus, withdrawal of FGF2
did not result in a general decline of gene expression in glioma
cells. No measurable decline in PDGFRA expression was detected
following withdrawal of PDGFA or SHH (data not shown). A
decline in PDGFRA expression following withdrawal of FGF2 was
concordant with diminished cell proliferation, as assessed by cell
counting and BrdU incorporation assays (Figure 4). Thus, FGF2
appears to be a key growth factor involved in regulating PDGFRA
expression in glioma cells.
We further assessed whether FGF2 can induce PDGFRA
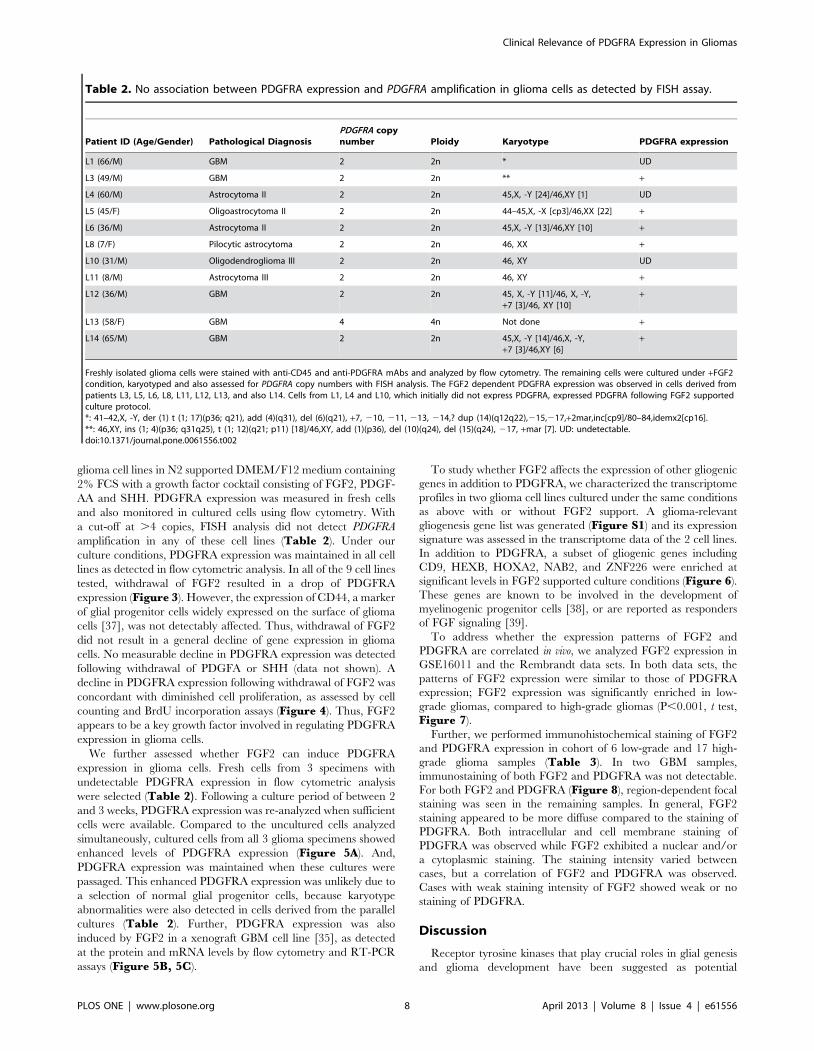
expression in glioma cells. Fresh cells from 3 specimens with
undetectable PDGFRA expression in flow cytometric analysis
were selected (Table 2). Following a culture period of between 2
and 3 weeks, PDGFRA expression was re-analyzed when sufficient
cells were available. Compared to the uncultured cells analyzed
simultaneously, cultured cells from all 3 glioma specimens showed
enhanced levels of PDGFRA expression (Figure 5A). And,
PDGFRA expression was maintained when these cultures were
passaged. This enhanced PDGFRA expression was unlikely due to
a selection of normal glial progenitor cells, because karyotype
abnormalities were also detected in cells derived from the parallel
cultures (Table 2). Further, PDGFRA expression was also
induced by FGF2 in a xenograft GBM cell line [35], as detected
at the protein and mRNA levels by flow cytometry and RT-PCR
assays (Figure 5B, 5C).
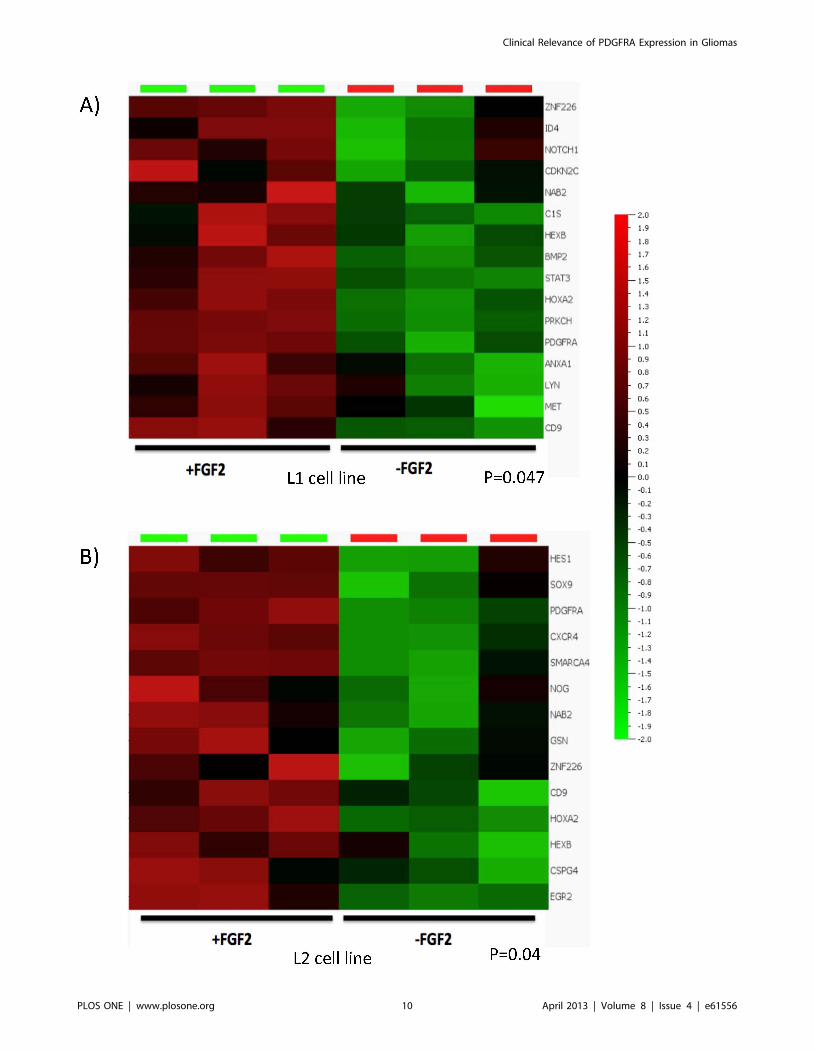
To study whether FGF2 affects the expression of other gliogenic
genes in addition to PDGFRA, we characterized the transcriptome
profiles in two glioma cell lines cultured under the same conditions
as above with or without FGF2 support. A glioma-relevant
gliogenesis gene list was generated (Figure S1) and its expression
signature was assessed in the transcriptome data of the 2 cell lines.
In addition to PDGFRA, a subset of gliogenic genes including
CD9, HEXB, HOXA2, NAB2, and ZNF226 were enriched at
significant levels in FGF2 supported culture conditions (Figure 6).
These genes are known to be involved in the development of
myelinogenic progenitor cells [38], or are reported as responders
of FGF signaling [39].
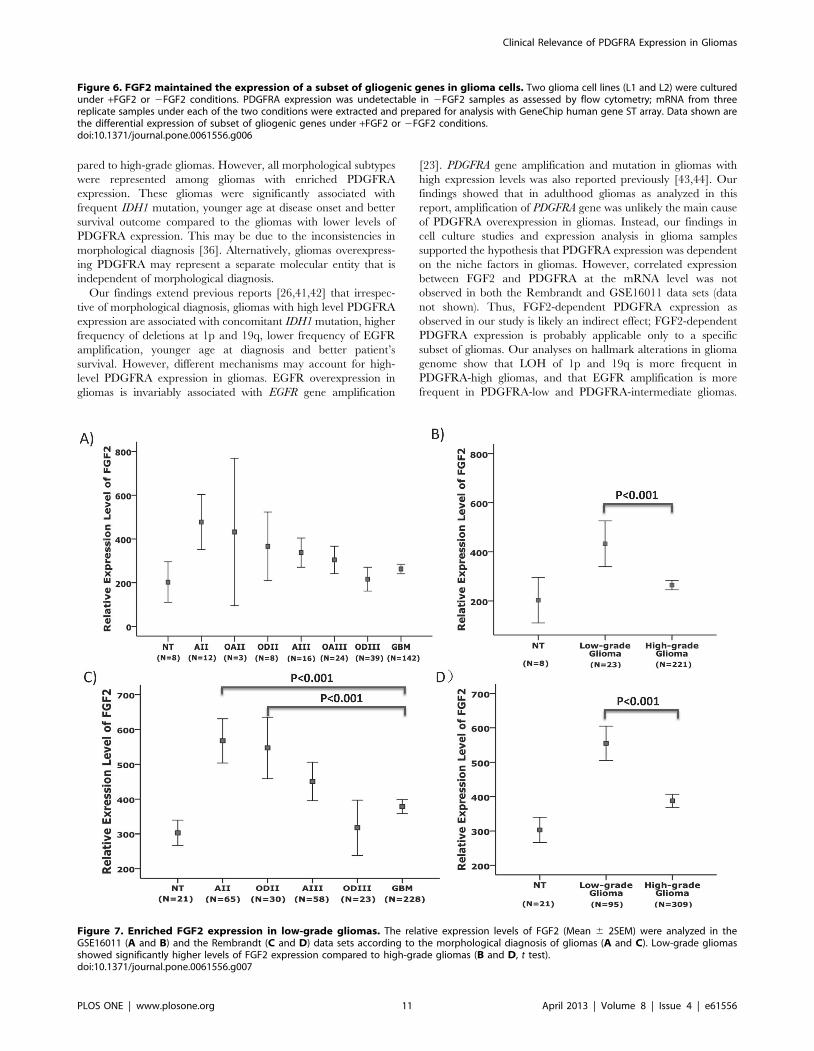
To address whether the expression patterns of FGF2 and
PDGFRA are correlated in vivo, we analyzed FGF2 expression in
GSE16011 and the Rembrandt data sets. In both data sets, the
patterns of FGF2 expression were similar to those of PDGFRA
expression; FGF2 expression was significantly enriched in low-
grade gliomas, compared to high-grade gliomas (P,0.001, t test,
Figure 7).
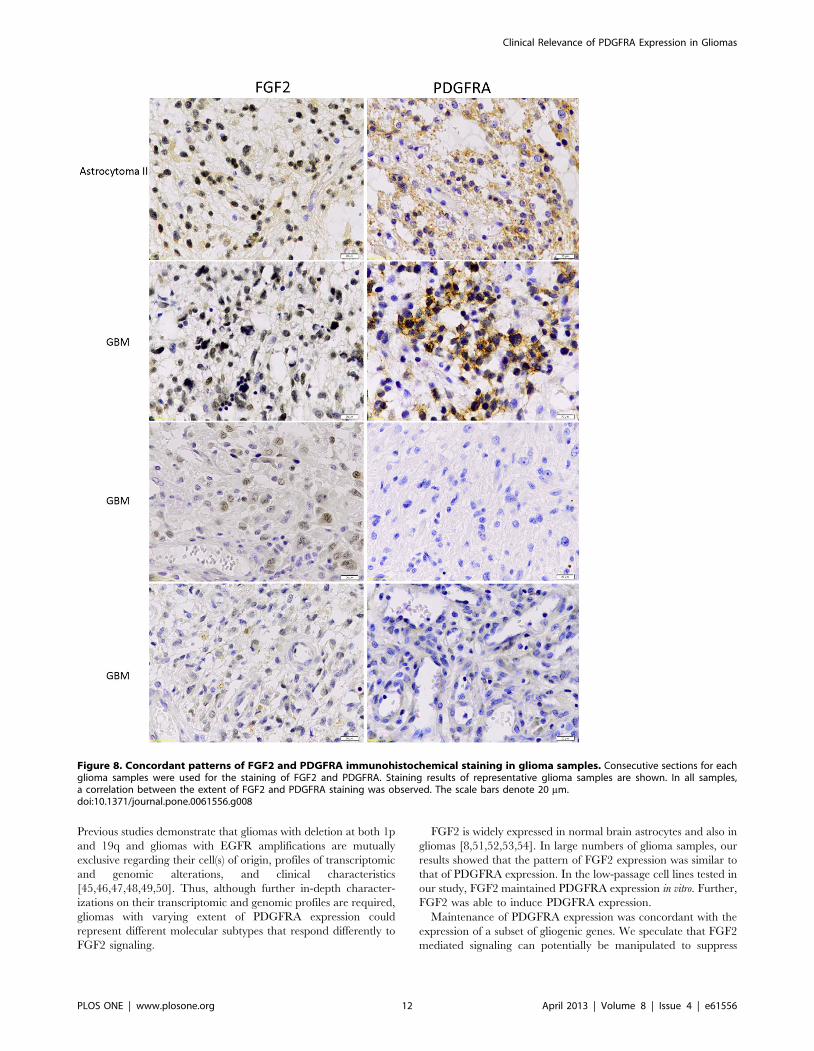
Further, we performed immunohistochemical staining of FGF2
and PDGFRA expression in cohort of 6 low-grade and 17 high-
grade glioma samples (Table 3). In two GBM samples,
immunostaining of both FGF2 and PDGFRA was not detectable.
For both FGF2 and PDGFRA (Figure 8), region-dependent focal
staining was seen in the remaining samples. In general, FGF2
staining appeared to be more diffuse compared to the staining of
PDGFRA. Both intracellular and cell membrane staining of
PDGFRA was observed while FGF2 exhibited a nuclear and/or
a cytoplasmic staining. The staining intensity varied between
cases, but a correlation of FGF2 and PDGFRA was observed.
Cases with weak staining intensity of FGF2 showed weak or no
staining of PDGFRA.
Discussion
Receptor tyrosine kinases that play crucial roles in glial genesis
and glioma development have been suggested as potential
Table 2. No association between PDGFRA expression and PDGFRA amplification in glioma cells as detected by FISH assay.
Patient ID (Age/Gender) Pathological DiagnosisPDGFRA copynumber Ploidy Karyotype PDGFRA expression
L1 (66/M) GBM 2 2n * UD
L3 (49/M) GBM 2 2n ** +
L4 (60/M) Astrocytoma II 2 2n 45,X, -Y [24]/46,XY [1] UD
L5 (45/F) Oligoastrocytoma II 2 2n 44–45,X, -X [cp3]/46,XX [22] +
L6 (36/M) Astrocytoma II 2 2n 45,X, -Y [13]/46,XY [10] +
L8 (7/F) Pilocytic astrocytoma 2 2n 46, XX +
L10 (31/M) Oligodendroglioma III 2 2n 46, XY UD
L11 (8/M) Astrocytoma III 2 2n 46, XY +
L12 (36/M) GBM 2 2n 45, X, -Y [11]/46, X, -Y,+7 [3]/46, XY [10]
+
L13 (58/F) GBM 4 4n Not done +
L14 (65/M) GBM 2 2n 45,X, -Y [14]/46,X, -Y,+7 [3]/46,XY [6]
+
Freshly isolated glioma cells were stained with anti-CD45 and anti-PDGFRA mAbs and analyzed by flow cytometry. The remaining cells were cultured under +FGF2condition, karyotyped and also assessed for PDGFRA copy numbers with FISH analysis. The FGF2 dependent PDGFRA expression was observed in cells derived frompatients L3, L5, L6, L8, L11, L12, L13, and also L14. Cells from L1, L4 and L10, which initially did not express PDGFRA, expressed PDGFRA following FGF2 supportedculture protocol.*: 41–42,X, -Y, der (1) t (1; 17)(p36; q21), add (4)(q31), del (6)(q21), +7, 210, 211, 213, 214,? dup (14)(q12q22),215,217,+2mar,inc[cp9]/80–84,idemx2[cp16].**: 46,XY, ins (1; 4)(p36; q31q25), t (1; 12)(q21; p11) [18]/46,XY, add (1)(p36), del (10)(q24), del (15)(q24), 217, +mar [7]. UD: undetectable.doi:10.1371/journal.pone.0061556.t002
Clinical Relevance of PDGFRA Expression in Gliomas
PLOS ONE | www.plosone.org 8 April 2013 | Volume 8 | Issue 4 | e61556
therapeutic targets against gliomas [5]. However, extensive clinical
studies have failed to demonstrate the efficacy of kinase inhibitors
in GBM patients [40]. A better understanding on the correlation
and the causes of receptor tyrosine kinase overexpression in glioma
subtypes may improve the utility of kinase inhibitors in combating
gliomas.
The occurrence of PDGFRA expression and its association with
the pathological and clinical parameters of gliomas have been
controversial [8,14,24,25,26]. Using two large data sets consisting
of 648 glioma samples of known morphological diagnosis, we
found that under the supervision of morphological diagnosis,
PDGFRA expression was enriched in low-grade gliomas com-
Figure 5. Induction of PDGFRA expression in glioma cells. A) Fresh cells from 3 different glioma samples without detectable PDGFRAexpression cultured with the support of FGF2 for 2 to 3 weeks were analyzed for PDGFRA expression and compared with the fresh cells from thesame patients simultaneously. B) and C) L2 cells from xenograft gliomas [35] were cultured for 9 days under +FGF2 or 2FGF2 conditions andassessed for PDGFRA expression by flow cytometry and RT-PCR analysis, respectively. Non-cultured cells served as control (0 days).doi:10.1371/journal.pone.0061556.g005
Clinical Relevance of PDGFRA Expression in Gliomas
PLOS ONE | www.plosone.org 9 April 2013 | Volume 8 | Issue 4 | e61556
Clinical Relevance of PDGFRA Expression in Gliomas
PLOS ONE | www.plosone.org 10 April 2013 | Volume 8 | Issue 4 | e61556
pared to high-grade gliomas. However, all morphological subtypes
were represented among gliomas with enriched PDGFRA
expression. These gliomas were significantly associated with
frequent IDH1 mutation, younger age at disease onset and better
survival outcome compared to the gliomas with lower levels of
PDGFRA expression. This may be due to the inconsistencies in
morphological diagnosis [36]. Alternatively, gliomas overexpress-
ing PDGFRA may represent a separate molecular entity that is
independent of morphological diagnosis.
Our findings extend previous reports [26,41,42] that irrespec-
tive of morphological diagnosis, gliomas with high level PDGFRA
expression are associated with concomitant IDH1 mutation, higher
frequency of deletions at 1p and 19q, lower frequency of EGFR
amplification, younger age at diagnosis and better patient’s
survival. However, different mechanisms may account for high-
level PDGFRA expression in gliomas. EGFR overexpression in
gliomas is invariably associated with EGFR gene amplification
[23]. PDGFRA gene amplification and mutation in gliomas with
high expression levels was also reported previously [43,44]. Our
findings showed that in adulthood gliomas as analyzed in this
report, amplification of PDGFRA gene was unlikely the main cause
of PDGFRA overexpression in gliomas. Instead, our findings in
cell culture studies and expression analysis in glioma samples
supported the hypothesis that PDGFRA expression was dependent
on the niche factors in gliomas. However, correlated expression
between FGF2 and PDGFRA at the mRNA level was not
observed in both the Rembrandt and GSE16011 data sets (data
not shown). Thus, FGF2-dependent PDGFRA expression as
observed in our study is likely an indirect effect; FGF2-dependent
PDGFRA expression is probably applicable only to a specific
subset of gliomas. Our analyses on hallmark alterations in glioma
genome show that LOH of 1p and 19q is more frequent in
PDGFRA-high gliomas, and that EGFR amplification is more
frequent in PDGFRA-low and PDGFRA-intermediate gliomas.
Figure 6. FGF2 maintained the expression of a subset of gliogenic genes in glioma cells. Two glioma cell lines (L1 and L2) were culturedunder +FGF2 or 2FGF2 conditions. PDGFRA expression was undetectable in 2FGF2 samples as assessed by flow cytometry; mRNA from threereplicate samples under each of the two conditions were extracted and prepared for analysis with GeneChip human gene ST array. Data shown arethe differential expression of subset of gliogenic genes under +FGF2 or 2FGF2 conditions.doi:10.1371/journal.pone.0061556.g006
Figure 7. Enriched FGF2 expression in low-grade gliomas. The relative expression levels of FGF2 (Mean 6 2SEM) were analyzed in theGSE16011 (A and B) and the Rembrandt (C and D) data sets according to the morphological diagnosis of gliomas (A and C). Low-grade gliomasshowed significantly higher levels of FGF2 expression compared to high-grade gliomas (B and D, t test).doi:10.1371/journal.pone.0061556.g007
Clinical Relevance of PDGFRA Expression in Gliomas
PLOS ONE | www.plosone.org 11 April 2013 | Volume 8 | Issue 4 | e61556
Previous studies demonstrate that gliomas with deletion at both 1p
and 19q and gliomas with EGFR amplifications are mutually
exclusive regarding their cell(s) of origin, profiles of transcriptomic
and genomic alterations, and clinical characteristics
[45,46,47,48,49,50]. Thus, although further in-depth character-
izations on their transcriptomic and genomic profiles are required,
gliomas with varying extent of PDGFRA expression could
represent different molecular subtypes that respond differently to
FGF2 signaling.
FGF2 is widely expressed in normal brain astrocytes and also in
gliomas [8,51,52,53,54]. In large numbers of glioma samples, our
results showed that the pattern of FGF2 expression was similar to
that of PDGFRA expression. In the low-passage cell lines tested in
our study, FGF2 maintained PDGFRA expression in vitro. Further,
FGF2 was able to induce PDGFRA expression.
Maintenance of PDGFRA expression was concordant with the
expression of a subset of gliogenic genes. We speculate that FGF2
mediated signaling can potentially be manipulated to suppress
Figure 8. Concordant patterns of FGF2 and PDGFRA immunohistochemical staining in glioma samples. Consecutive sections for eachglioma samples were used for the staining of FGF2 and PDGFRA. Staining results of representative glioma samples are shown. In all samples,a correlation between the extent of FGF2 and PDGFRA staining was observed. The scale bars denote 20 mm.doi:10.1371/journal.pone.0061556.g008
Clinical Relevance of PDGFRA Expression in Gliomas
PLOS ONE | www.plosone.org 12 April 2013 | Volume 8 | Issue 4 | e61556
PDGFRA expression and thereby inhibit niche factor-dependent
glioma growth.
FGF2-dependent PDGFRA expression appears to be a con-
verged mechanism in normal glial development and glioma
genesis. PDGFRA is a characteristic marker of OPC [9,10]. Early
studies had demonstrated an FGF2 dependent PDGF signaling in
OPCs [55,56]. Disruption of PDGFRA signaling results in
diminished generation of oligodendrocytes [13]. Enhanced signal-
ing of FGF2 or PDGFRA results in proliferation but blocked
differentiation of OPCs towards oligodendrocytes [20,57,58].
Although it is beyond the scope of this report, we speculate that
additional features governing differentiation and proliferation of
oligodendrocyte lineage can be detected in gliomas with enriched
PDGFRA expression.
Supporting Information
Figure S1 Selection of glioma-relevant gliogenic genes.A combined glial genesis gene list (172 genes) was created by
combining the glial genesis gene list GO:0042063 and the gene list
composed of genes controlling oligodendrogenesis [30]. Using
unsupervised hierarchical clustering analysis of the expression of
glial genesis genes and glioma samples in GSE4290 data set [29].
Seventy-eight gliogenic genes differentially expressed in gliomas
were selected after exclusion of genes with standard deviations
below 1.5% of the maximal standard deviation in variance
filtering. The colored rectangles on the top of the heat map
represent morphological diagnosis of glioma samples: orange
rectangles for unknown diagnosis; pink for astrocytoma grade II;
red for astrocytoma grade III; green for glioblastoma multiforme;
blue for oligodendroglioma grade II; yellow for oligodendroglioma
grade III and white for non-tumor samples. The glioma-relevant
gliogenic genes included: AGT, ANXA1, ASCL1, ATF5, BCL2,
BMP2, C1S, CCL2, CD86, CD9, CDK1, CDK6, CDKN1A, CDKN2C,
CSPG4, CTNNB1, CXCR4, DAG1, DLL3, EGR1, EGR2, EIF2B1,
EIF2B4, ERBB2, EXOC4, FGF2, FOXD1, GFAP, GLI3, GPC1,
GSN, HDAC2, HES1, HES5, HEXB, HMBS, HMGA2, HOXA2,
ID2, ID4, ITGAM, KLF15, LAMB2, LIF, LYN, MET, MMP14,
MPP5, MYT1, NAB2, NF1, NFIB, NOG, NOTCH1, NR2E1, OLIG2,
PAX2, PAX6, PDGFRA, POU3F2, PRKCH, PTEN, PTPRC, RELA,
SMARCA4, SOX11, SOX2, SOX4, SOX5, SOX6, SOX8, SOX9,
STAT3, TCF7L2, TGFB2, TSPO, VCAN, ZNF226.
(TIFF)Figure S2 Differential expression of PDGFRA in glio-mas of the same malignancy grade is associated withpatient survival time. High-grade (grade III and IV) and low-
grade (grade II) gliomas in the Rembrandt data set were separately
analyzed for the extent of PDGFRA expression. Kaplan-Meier
plots for the survival time of the patients with high-grade gliomas
(panel A) or low-grade gliomas (panel B) are shown. Within the
same malignancy grade, PDGFRA-high gliomas are associated
with better survival; furthermore, the PDGFRA-high gliomas
occur more frequently in younger than 40 patients (p,0.01, X2
test, comparing the number of patients younger than 40 and the
number of patients older then 60 between the PDGFRA-low and
PDGFRA-high group). A similar but not significant trend was
observed for the high-grade gliomas in GSE16011 data sets.
(TIFF)
Acknowledgments
The authors thank Hans Olov Sjogren and Seema Rosqvist for discussion
and critical reading of the manuscript.
Author Contributions
Conceived and designed the experiments: DFC XLF. Performed the
experiments: DFC AP YYS DGN. Analyzed the data: DFC. Contributed
reagents/materials/analysis tools: LGS XLF EE TJ. Wrote the paper:
DFC XLF.
References
1. Louis DN, Ohgaki H, Wiestler OD, Cavenee WK, Burger PC, et al. (2007) The
2007 WHO classification of tumours of the central nervous system. Acta
Neuropathol 114: 97–109.
2. Stupp R, Mason WP, van den Bent MJ, Weller M, Fisher B, et al. (2005)
Radiotherapy plus concomitant and adjuvant temozolomide for glioblastoma.
N Engl J Med 352: 987–996.
3. Canoll P, Goldman JE (2008) The interface between glial progenitors and
gliomas. Acta Neuropathol 116: 465–477.
4. Fan X, Salford LG, Widegren B (2007) Glioma stem cells: Evidence and
limitation. Semin Cancer Biol 17: 214–218.
5. Dunn GP, Rinne ML, Wykosky J, Genovese G, Quayle SN, et al. (2012)
Emerging insights into the molecular and cellular basis of glioblastoma. Genes
Dev 26: 756–784.
6. Sauvageot CM, Stiles CD (2002) Molecular mechanisms controlling cortical
gliogenesis. Curr Opin Neurobiol 12: 244–249.
7. Holland EC (2001) Gliomagenesis: genetic alterations and mouse models. Nat
Rev Genet 2: 120–129.
8. van der Valk P, Lindeman J, Kamphorst W (1997) Growth factor profiles of
human gliomas. Do non-tumour cells contribute to tumour growth in glioma?
Ann Oncol 8: 1023–1029.
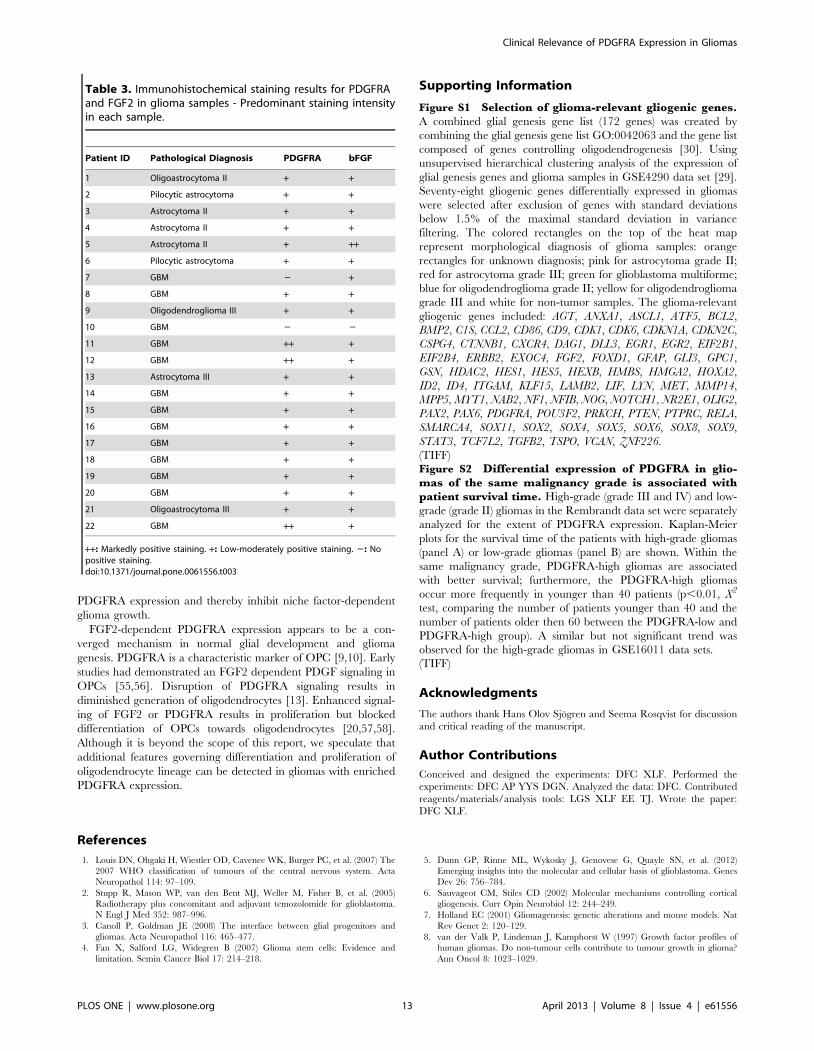
Table 3. Immunohistochemical staining results for PDGFRAand FGF2 in glioma samples - Predominant staining intensityin each sample.
Patient ID Pathological Diagnosis PDGFRA bFGF
1 Oligoastrocytoma II + +
2 Pilocytic astrocytoma + +
3 Astrocytoma II + +
4 Astrocytoma II + +
5 Astrocytoma II + ++
6 Pilocytic astrocytoma + +
7 GBM 2 +
8 GBM + +
9 Oligodendroglioma III + +
10 GBM 2 2
11 GBM ++ +
12 GBM ++ +
13 Astrocytoma III + +
14 GBM + +
15 GBM + +
16 GBM + +
17 GBM + +
18 GBM + +
19 GBM + +
20 GBM + +
21 Oligoastrocytoma III + +
22 GBM ++ +
++: Markedly positive staining. +: Low-moderately positive staining. 2: Nopositive staining.doi:10.1371/journal.pone.0061556.t003
Clinical Relevance of PDGFRA Expression in Gliomas
PLOS ONE | www.plosone.org 13 April 2013 | Volume 8 | Issue 4 | e61556
9. Chojnacki A, Mak G, Weiss S (2011) PDGFRalpha expression distinguishes
GFAP-expressing neural stem cells from PDGF-responsive neural precursors inthe adult periventricular area. J Neurosci 31: 9503–9512.
10. Pringle NP, Richardson WD (1993) A singularity of PDGF alpha-receptor
expression in the dorsoventral axis of the neural tube may define the origin of theoligodendrocyte lineage. Development 117: 525–533.
11. Sim FJ, Lang JK, Waldau B, Roy NS, Schwartz TE, et al. (2006)Complementary patterns of gene expression by human oligodendrocyte
progenitors and their environment predict determinants of progenitor
maintenance and differentiation. Ann Neurol 59: 763–779.12. Scolding N, Franklin R, Stevens S, Heldin CH, Compston A, et al. (1998)
Oligodendrocyte progenitors are present in the normal adult human CNS and inthe lesions of multiple sclerosis. Brain 121 (Pt 12): 2221–2228.
13. Jackson EL, Garcia-Verdugo JM, Gil-Perotin S, Roy M, Quinones-Hinojosa A,et al. (2006) PDGFR alpha-positive B cells are neural stem cells in the adult SVZ
that form glioma-like growths in response to increased PDGF signaling. Neuron
51: 187–199.14. Martinho O, Longatto-Filho A, Lambros MB, Martins A, Pinheiro C, et al.
(2009) Expression, mutation and copy number analysis of platelet-derivedgrowth factor receptor A (PDGFRA) and its ligand PDGFA in gliomas.
Br J Cancer 101: 973–982.
15. Hermanson M, Funa K, Hartman M, Claesson-Welsh L, Heldin CH, et al.(1992) Platelet-derived growth factor and its receptors in human glioma tissue:
expression of messenger RNA and protein suggests the presence of autocrine andparacrine loops. Cancer Res 52: 3213–3219.
16. Dai C, Celestino JC, Okada Y, Louis DN, Fuller GN, et al. (2001) PDGFautocrine stimulation dedifferentiates cultured astrocytes and induces oligoden-
drogliomas and oligoastrocytomas from neural progenitors and astrocytes in
vivo. Genes Dev 15: 1913–1925.17. Hede SM, Hansson I, Afink GB, Eriksson A, Nazarenko I, et al. (2009) GFAP
promoter driven transgenic expression of PDGFB in the mouse brain leads toglioblastoma in a Trp53 null background. Glia 57: 1143–1153.
18. Assanah M, Lochhead R, Ogden A, Bruce J, Goldman J, et al. (2006) Glial
progenitors in adult white matter are driven to form malignant gliomas byplatelet-derived growth factor-expressing retroviruses. J Neurosci 26: 6781–
6790.19. Uhrbom L, Hesselager G, Nister M, Westermark B (1998) Induction of brain
tumors in mice using a recombinant platelet-derived growth factor B-chainretrovirus. Cancer Res 58: 5275–5279.
20. Assanah MC, Bruce JN, Suzuki SO, Chen A, Goldman JE, et al. (2009) PDGF
stimulates the massive expansion of glial progenitors in the neonatal forebrain.Glia 57: 1835–1847.
21. Lokker NA, Sullivan CM, Hollenbach SJ, Israel MA, Giese NA (2002) Platelet-derived growth factor (PDGF) autocrine signaling regulates survival and
mitogenic pathways in glioblastoma cells: evidence that the novel PDGF-C
and PDGF-D ligands may play a role in the development of brain tumors.Cancer Res 62: 3729–3735.
22. Shih AH, Dai C, Hu X, Rosenblum MK, Koutcher JA, et al. (2004) Dose-dependent effects of platelet-derived growth factor-B on glial tumorigenesis.
Cancer Res 64: 4783–4789.23. Wong AJ, Bigner SH, Bigner DD, Kinzler KW, Hamilton SR, et al. (1987)
Increased expression of the epidermal growth factor receptor gene in malignant
gliomas is invariably associated with gene amplification. Proc Natl Acad Sci U S A84: 6899–6903.
24. Hermanson M, Funa K, Koopmann J, Maintz D, Waha A, et al. (1996)Association of loss of heterozygosity on chromosome 17p with high platelet-
derived growth factor alpha receptor expression in human malignant gliomas.
Cancer Res 56: 164–171.25. Phillips HS, Kharbanda S, Chen R, Forrest WF, Soriano RH, et al. (2006)
Molecular subclasses of high-grade glioma predict prognosis, delineate a patternof disease progression, and resemble stages in neurogenesis. Cancer Cell 9: 157–
173.
26. Verhaak RG, Hoadley KA, Purdom E, Wang V, Qi Y, et al. (2010) Integratedgenomic analysis identifies clinically relevant subtypes of glioblastoma charac-
terized by abnormalities in PDGFRA, IDH1, EGFR, and NF1. Cancer Cell 17:98–110.
27. Gravendeel LA, Kouwenhoven MC, Gevaert O, de Rooi JJ, Stubbs AP, et al.(2009) Intrinsic gene expression profiles of gliomas are a better predictor of
survival than histology. Cancer Res 69: 9065–9072.
28. Madhavan S, Zenklusen JC, Kotliarov Y, Sahni H, Fine HA, et al. (2009)Rembrandt: helping personalized medicine become a reality through integrative
translational research. Mol Cancer Res 7: 157–167.29. Sun L, Hui AM, Su Q, Vortmeyer A, Kotliarov Y, et al. (2006) Neuronal and
glioma-derived stem cell factor induces angiogenesis within the brain. Cancer
Cell 9: 287–300.30. Nicolay DJ, Doucette JR, Nazarali AJ (2007) Transcriptional control of
oligodendrogenesis. Glia 55: 1287–1299.31. Lin M, Wei LJ, Sellers WR, Lieberfarb M, Wong WH, et al. (2004) dChipSNP:
significance curve and clustering of SNP-array-based loss-of-heterozygosity data.Bioinformatics 20: 1233–1240.
32. Hupe P, Stransky N, Thiery JP, Radvanyi F, Barillot E (2004) Analysis of array
CGH data: from signal ratio to gain and loss of DNA regions. Bioinformatics 20:3413–3422.
33. Mermel CH, Schumacher SE, Hill B, Meyerson ML, Beroukhim R, et al. (2011)
GISTIC2.0 facilitates sensitive and confident localization of the targets of focal
somatic copy-number alteration in human cancers. Genome Biol 12: R41.
34. Gisselsson D (2001) Refined characterisation of chromosome aberrations in
tumours by multicolour banding and electronic mapping resources. Methods
Cell Sci 23: 23–28.
35. Glanz C, Rebetz J, Stewenius Y, Persson A, Englund E, et al. (2007) Genetic
intratumour heterogeneity in high-grade brain tumours is associated with
telomere-dependent mitotic instability. Neuropathol Appl Neurobiol 33: 440–
454.
36. Coons SW, Johnson PC, Scheithauer BW, Yates AJ, Pearl DK (1997) Improving
diagnostic accuracy and interobserver concordance in the classification and
grading of primary gliomas. Cancer 79: 1381–1393.
37. Rebetz J, Tian D, Persson A, Widegren B, Salford LG, et al. (2008) Glial
progenitor-like phenotype in low-grade glioma and enhanced CD133-expression
and neuronal lineage differentiation potential in high-grade glioma. PLoS ONE
3: e1936.
38. Sim FJ, McClain CR, Schanz SJ, Protack TL, Windrem MS, et al. (2011)
CD140a identifies a population of highly myelinogenic, migration-competent
and efficiently engrafting human oligodendrocyte progenitor cells. Nat
Biotechnol 29: 934–941.
39. Mason I (2007) Initiation to end point: the multiple roles of fibroblast growth
factors in neural development. Nat Rev Neurosci 8: 583–596.
40. De Witt Hamer PC (2010) Small molecule kinase inhibitors in glioblastoma:
a systematic review of clinical studies. Neuro Oncol 12: 304–316.
41. Huse JT, Phillips HS, Brennan CW (2011) Molecular subclassification of diffuse
gliomas: seeing order in the chaos. Glia 59: 1190–1199.
42. Kim YH, Nobusawa S, Mittelbronn M, Paulus W, Brokinkel B, et al. (2010)
Molecular classification of low-grade diffuse gliomas. Am J Pathol 177: 2708–
2714.
43. Ozawa T, Brennan CW, Wang L, Squatrito M, Sasayama T, et al. (2010)
PDGFRA gene rearrangements are frequent genetic events in PDGFRA-
amplified glioblastomas. Genes Dev 24: 2205–2218.
44. Clarke ID, Dirks PB (2003) A human brain tumor-derived PDGFR-alpha
deletion mutant is transforming. Oncogene 22: 722–733.
45. Ducray F, Idbaih A, de Reynies A, Bieche I, Thillet J, et al. (2008) Anaplastic
oligodendrogliomas with 1p19q codeletion have a proneural gene expression
profile. Mol Cancer 7: 41.
46. Idbaih A, Marie Y, Lucchesi C, Pierron G, Manie E, et al. (2008) BAC array
CGH distinguishes mutually exclusive alterations that define clinicogenetic
subtypes of gliomas. Int J Cancer 122: 1778–1786.
47. Mariani L, Deiana G, Vassella E, Fathi AR, Murtin C, et al. (2006) Loss of
heterozygosity 1p36 and 19q13 is a prognostic factor for overall survival in
patients with diffuse WHO grade 2 gliomas treated without chemotherapy. J Clin
Oncol 24: 4758–4763.
48. Nigro JM, Misra A, Zhang L, Smirnov I, Colman H, et al. (2005) Integrated
array-comparative genomic hybridization and expression array profiles identify
clinically relevant molecular subtypes of glioblastoma. Cancer Res 65: 1678–
1686.
49. Labussiere M, Idbaih A, Wang XW, Marie Y, Boisselier B, et al. (2010) All the
1p19q codeleted gliomas are mutated on IDH1 or IDH2. Neurology 74: 1886–
1890.
50. Lai A, Kharbanda S, Pope WB, Tran A, Solis OE, et al. (2011) Evidence for
sequenced molecular evolution of IDH1 mutant glioblastoma from a distinct cell
of origin. J Clin Oncol 29: 4482–4490.
51. Dono R (2003) Fibroblast growth factors as regulators of central nervous system
development and function. Am J Physiol Regul Integr Comp Physiol 284:
R867–881.
52. Fukui S, Nawashiro H, Otani N, Ooigawa H, Nomura N, et al. (2003) Nuclear
accumulation of basic fibroblast growth factor in human astrocytic tumors.
Cancer 97: 3061–3067.
53. Takahashi JA, Mori H, Fukumoto M, Igarashi K, Jaye M, et al. (1990) Gene
expression of fibroblast growth factors in human gliomas and meningiomas:
demonstration of cellular source of basic fibroblast growth factor mRNA and
peptide in tumor tissues. Proc Natl Acad Sci U S A 87: 5710–5714.
54. Zagzag D, Miller DC, Sato Y, Rifkin DB, Burstein DE (1990) Immunohisto-
chemical localization of basic fibroblast growth factor in astrocytomas. Cancer
Res 50: 7393–7398.
55. McKinnon RD, Matsui T, Dubois-Dalcq M, Aaronson SA (1990) FGF
modulates the PDGF-driven pathway of oligodendrocyte development. Neuron
5: 603–614.
56. Mason JL, Goldman JE (2002) A2B5+ and O4+ Cycling progenitors in the adult
forebrain white matter respond differentially to PDGF-AA, FGF-2, and IGF-1.
Mol Cell Neurosci 20: 30–42.
57. Fortin D, Rom E, Sun H, Yayon A, Bansal R (2005) Distinct fibroblast growth
factor (FGF)/FGF receptor signaling pairs initiate diverse cellular responses in
the oligodendrocyte lineage. J Neurosci 25: 7470–7479.
58. Mayer M, Bogler O, Noble M (1993) The inhibition of oligodendrocytic
differentiation of O-2A progenitors caused by basic fibroblast growth factor is
overridden by astrocytes. Glia 8: 12–19.
Clinical Relevance of PDGFRA Expression in Gliomas
PLOS ONE | www.plosone.org 14 April 2013 | Volume 8 | Issue 4 | e61556