Embed Size (px)
Citation preview
Better Polymer Modified Bitumen
(PmB) via crosslinking
Guillaume ROUSSEAU, Bruno MARCANT
ValoChem
28. – 29. listopadu 2017, České Budějovice
Motto: Asfaltové vozovky – bezpečná cesta k prosperitě

Agenda
2
I. Past and future needs for transportation
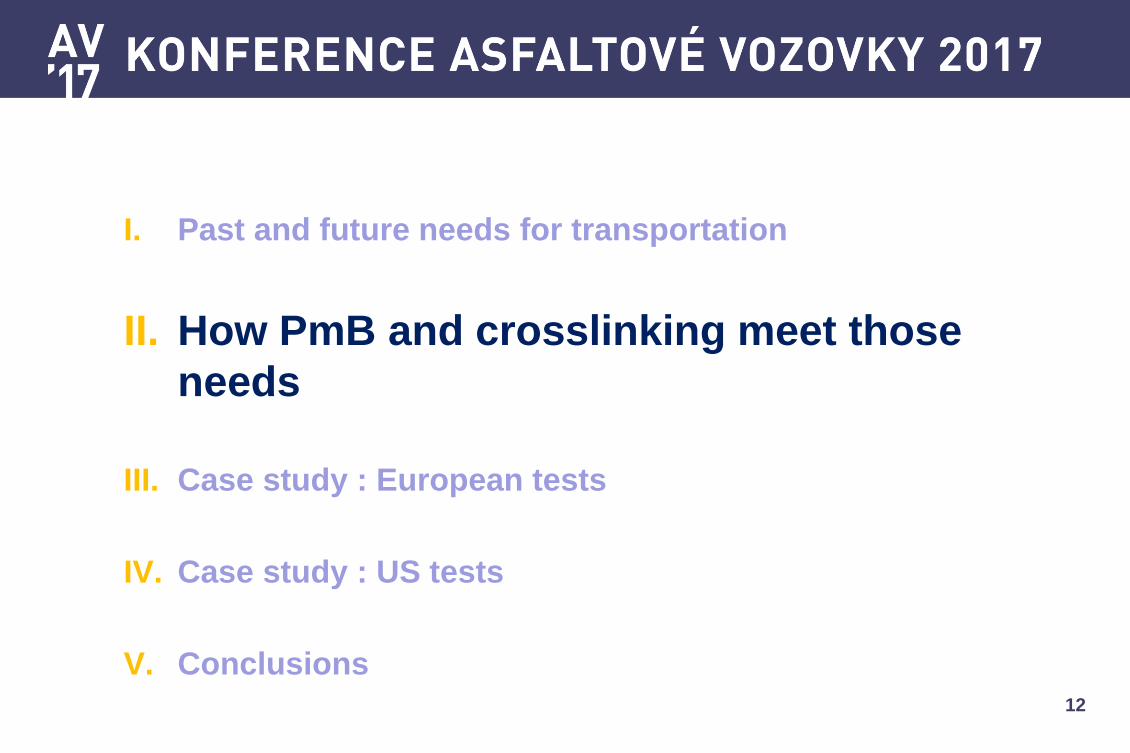
II. How PmB and crosslinking meet those needs
III. Case study : European tests
IV. Case study : US tests
V. Conclusions

I. Past and future needs for transportation
II. How PmB and crosslinking meet those needs
III. Case study : European tests
IV. Case study : US tests
V. Conclusions
3
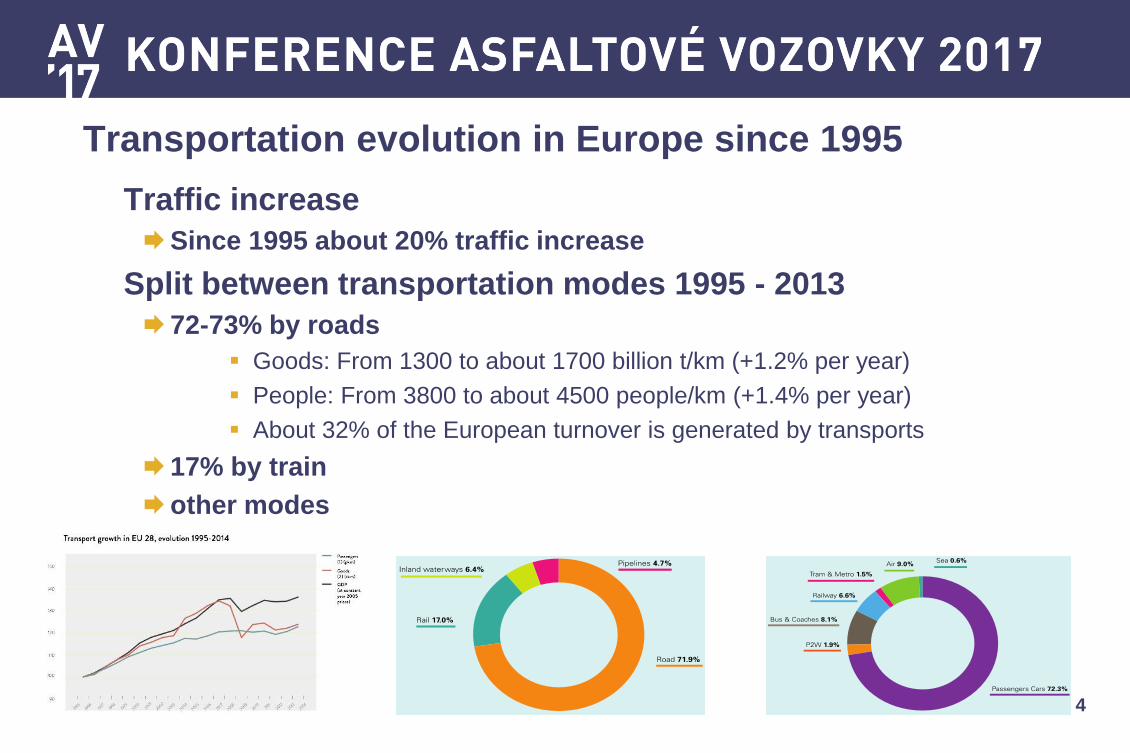
Transportation evolution in Europe since 1995
Traffic increase
Since 1995 about 20% traffic increase
Split between transportation modes 1995 - 2013
72-73% by roads
Goods: From 1300 to about 1700 billion t/km (+1.2% per year)
People: From 3800 to about 4500 people/km (+1.4% per year)
About 32% of the European turnover is generated by transports
17% by train
other modes
4
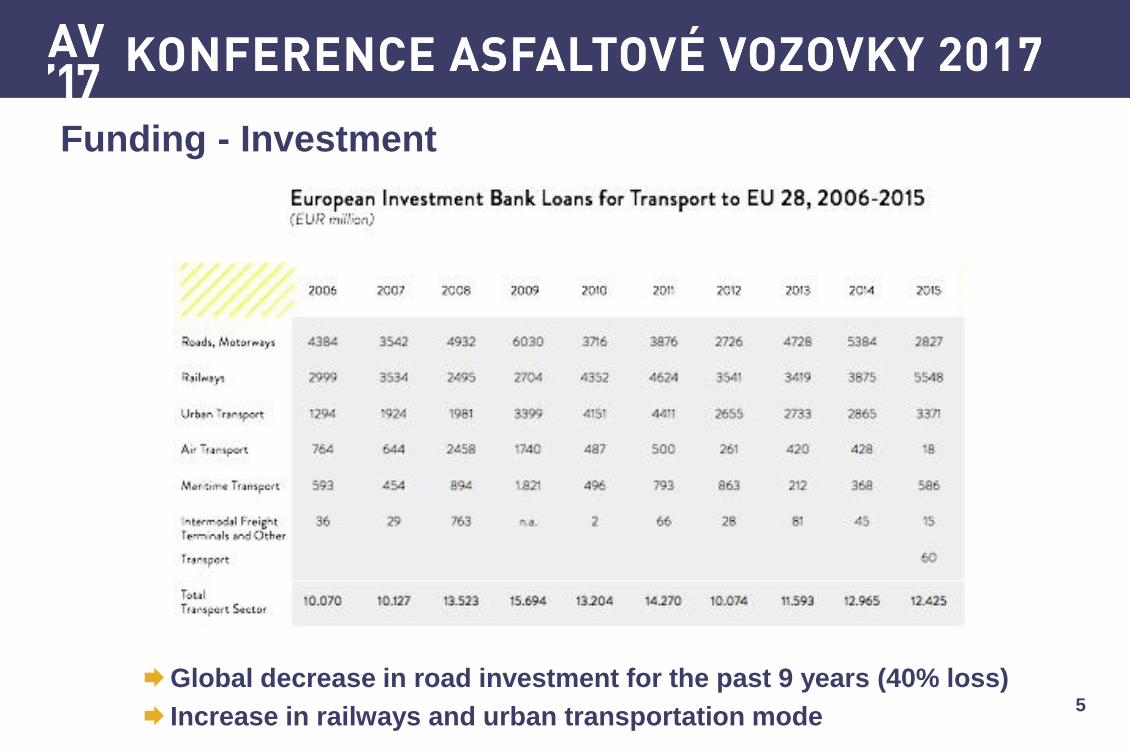
Funding - Investment
Global decrease in road investment for the past 9 years (40% loss)
Increase in railways and urban transportation mode 5
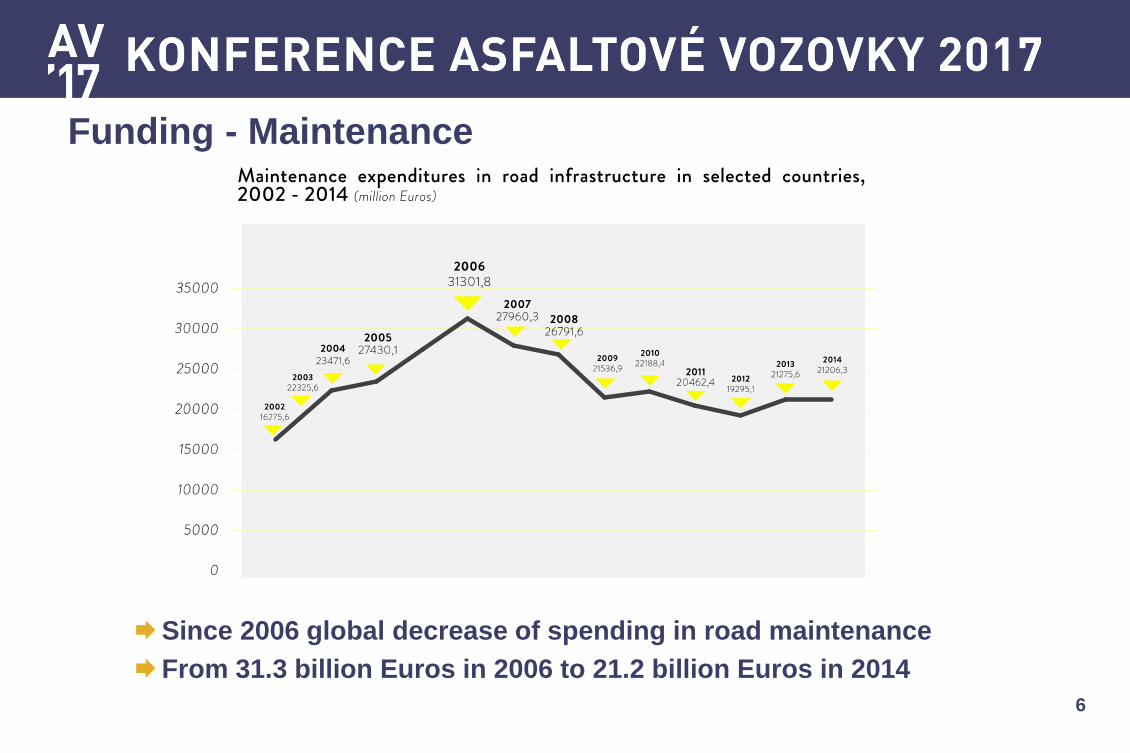
Funding - Maintenance
6
Since 2006 global decrease of spending in road maintenance
From 31.3 billion Euros in 2006 to 21.2 billion Euros in 2014
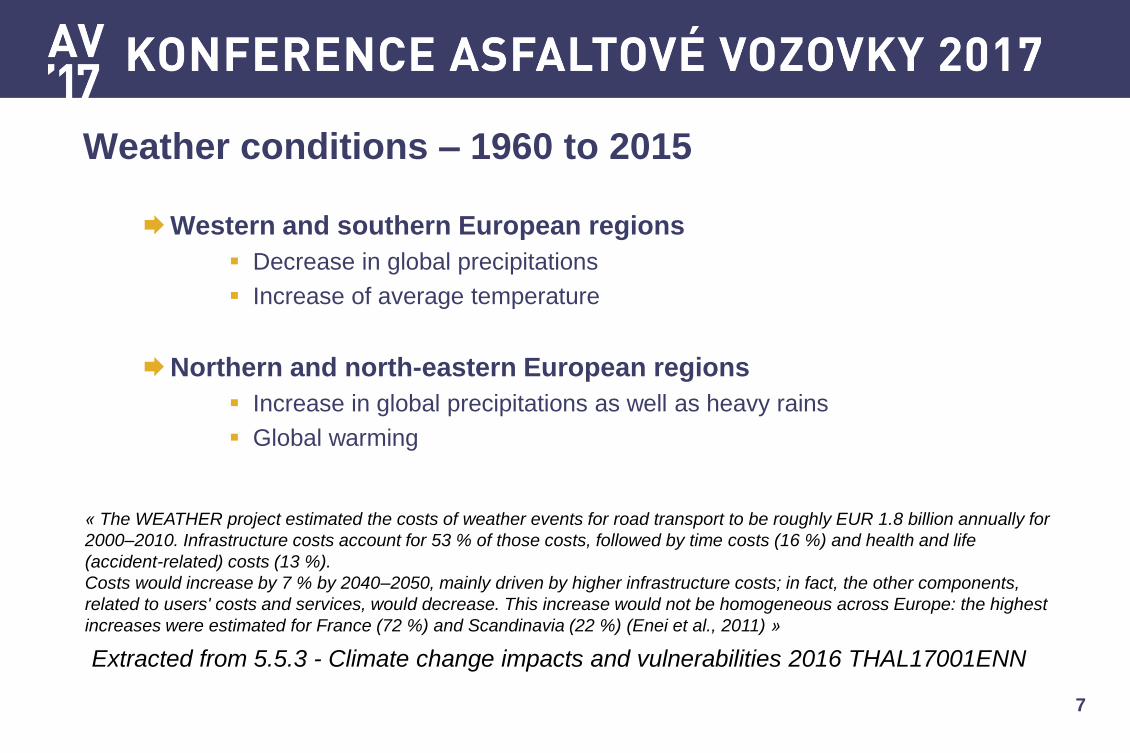
Weather conditions – 1960 to 2015
Western and southern European regions
Decrease in global precipitations
Increase of average temperature
Northern and north-eastern European regions
Increase in global precipitations as well as heavy rains
Global warming
7
« The WEATHER project estimated the costs of weather events for road transport to be roughly EUR 1.8 billion annually for
2000–2010. Infrastructure costs account for 53 % of those costs, followed by time costs (16 %) and health and life
(accident-related) costs (13 %).
Costs would increase by 7 % by 2040–2050, mainly driven by higher infrastructure costs; in fact, the other components,
related to users' costs and services, would decrease. This increase would not be homogeneous across Europe: the highest
increases were estimated for France (72 %) and Scandinavia (22 %) (Enei et al., 2011) »
Extracted from 5.5.3 - Climate change impacts and vulnerabilities 2016 THAL17001ENN
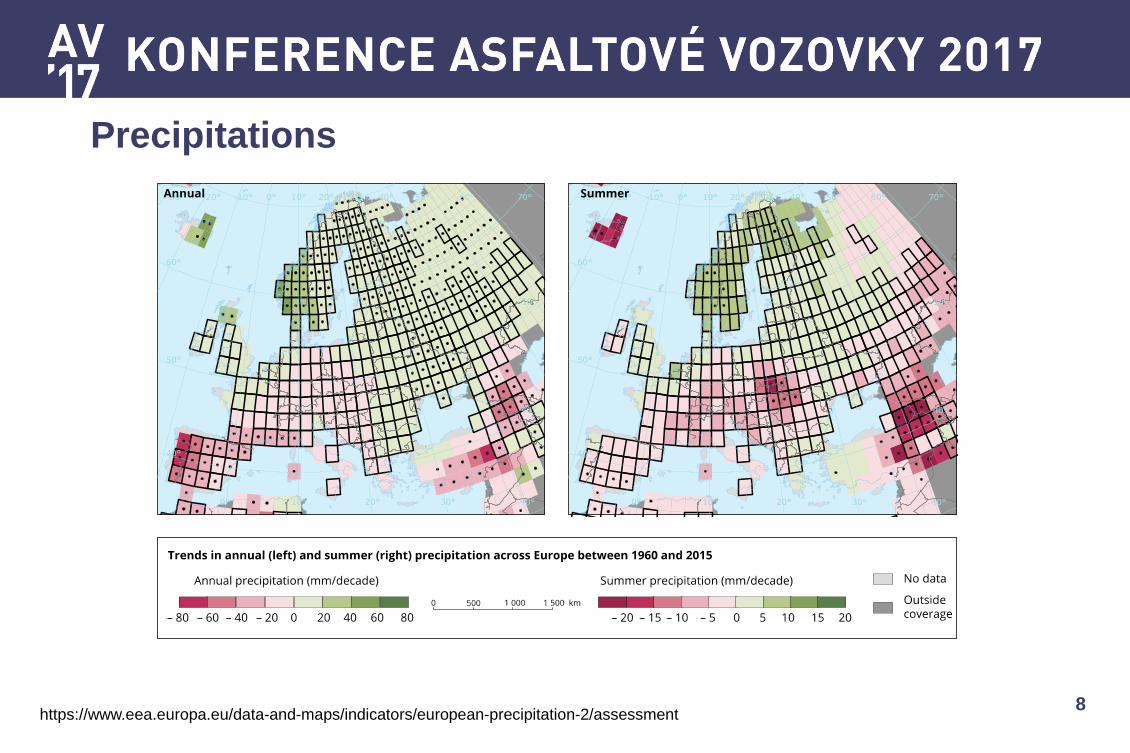
Precipitations
https://www.eea.europa.eu/data-and-maps/indicators/european-precipitation-2/assessment 8
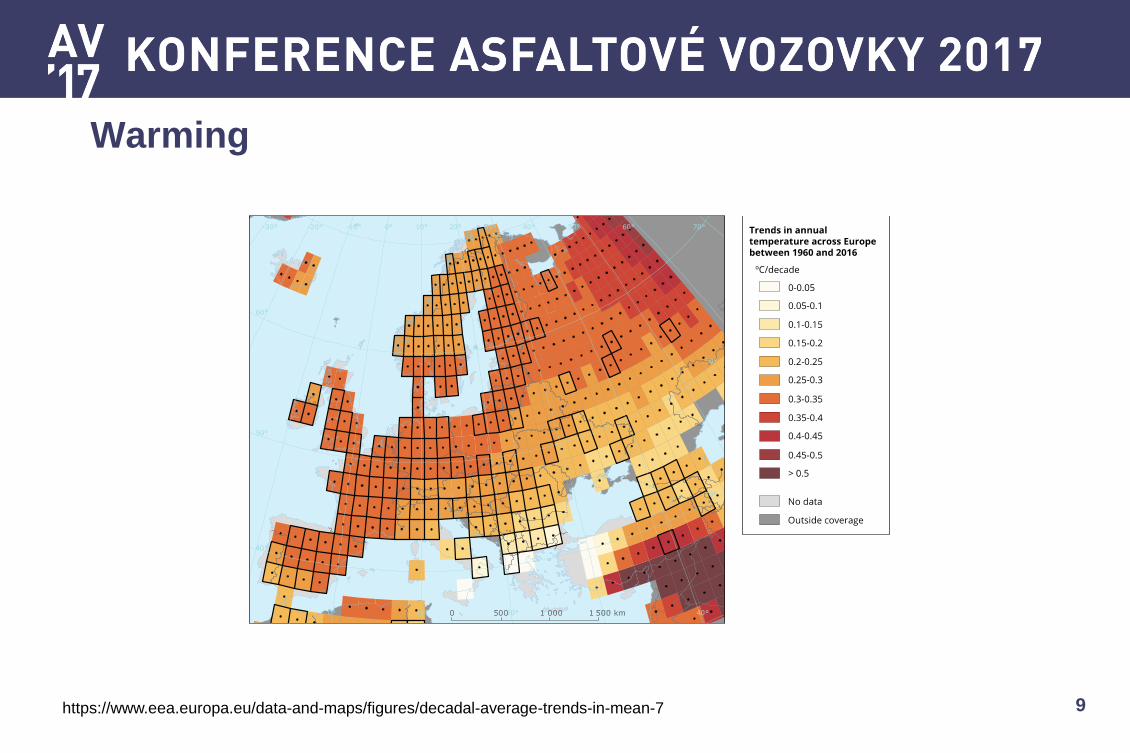
Warming
https://www.eea.europa.eu/data-and-maps/figures/decadal-average-trends-in-mean-7 9
More and more severe field constraints
Increase of traffic volume with time
Power steering, heavier weight and larger tires of vehicles
Funding
Less and less money for investment and/or maintenance
Global warming
Climate change (heavy rains and T°C increase)
What do those figures say ?
10
Improved performance of materials
Better resistance to higher field constraints
Adaptability to climate change
Higher durability
Longer-lasting materials for lower overall budget (investment +
maintenance)
And with initial cost control
What are the needs associated?
11
I. Past and future needs for transportation
II. How PmB and crosslinking meet those
needs
III. Case study : European tests
IV. Case study : US tests
V. Conclusions
12
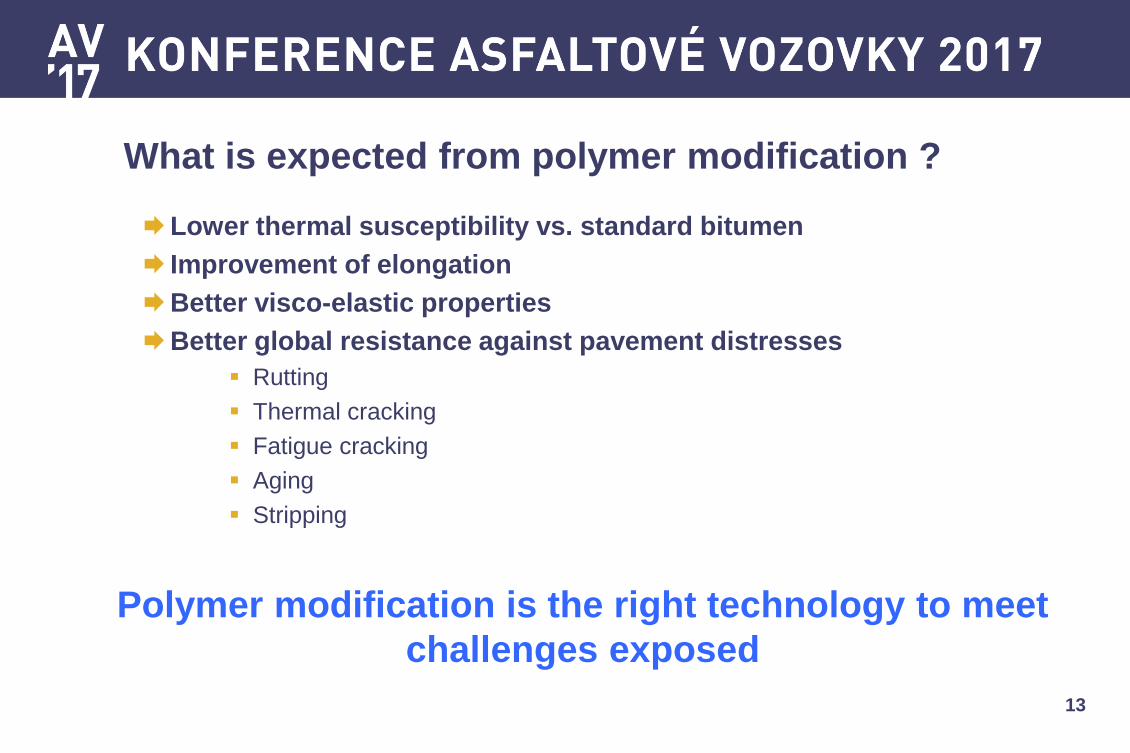
What is expected from polymer modification ?
Lower thermal susceptibility vs. standard bitumen
Improvement of elongation
Better visco-elastic properties
Better global resistance against pavement distresses
Rutting
Thermal cracking
Fatigue cracking
Aging
Stripping
13
Polymer modification is the right technology to meet
challenges exposed
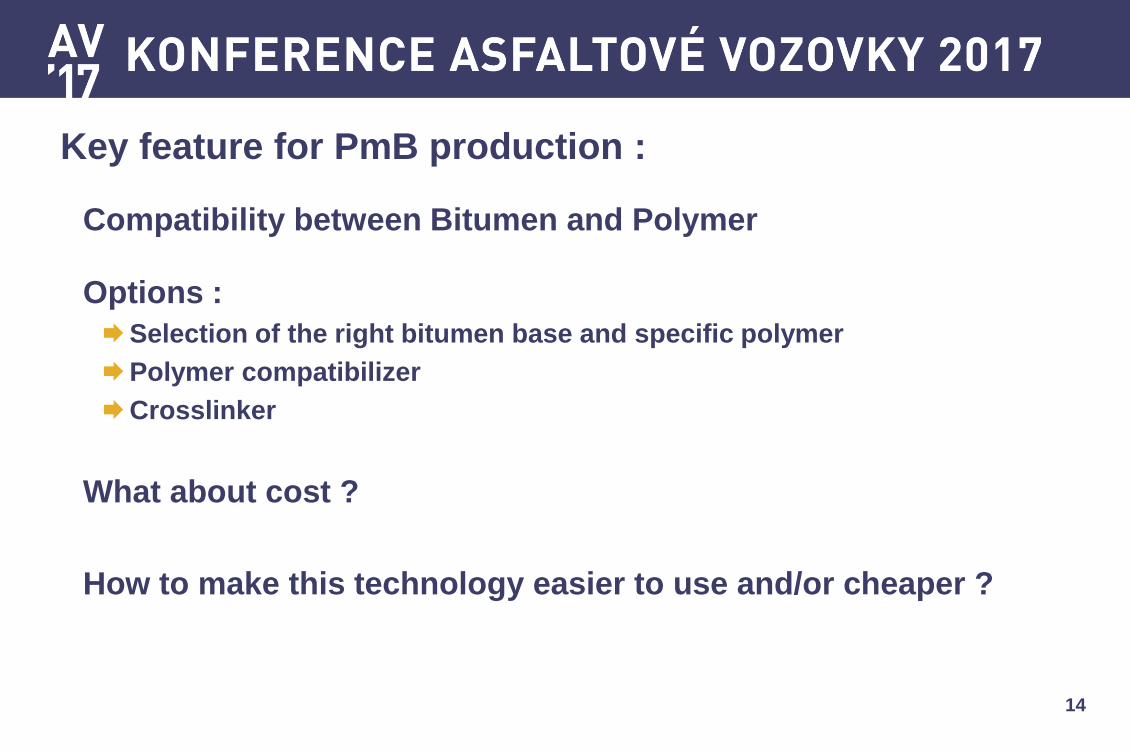
Key feature for PmB production :
Compatibility between Bitumen and Polymer
Options :
Selection of the right bitumen base and specific polymer
Polymer compatibilizer
Crosslinker
What about cost ?
How to make this technology easier to use and/or cheaper ?
14
Crosslinking effect (X-linking)
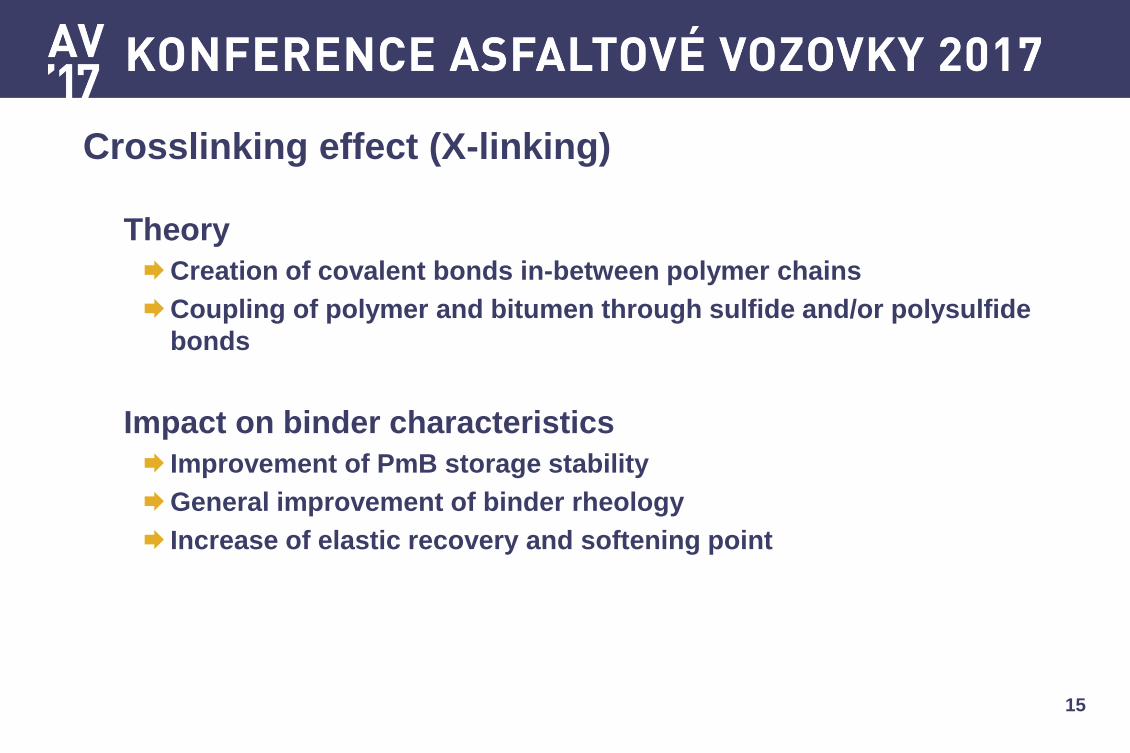
Theory
Creation of covalent bonds in-between polymer chains
Coupling of polymer and bitumen through sulfide and/or polysulfide
bonds
Impact on binder characteristics
Improvement of PmB storage stability
General improvement of binder rheology
Increase of elastic recovery and softening point
15
I. Past and future needs for transportation
II. How PmB and crosslinking meet those needs
III. Case study : European tests
IV. Case study : US tests
V. Conclusions
16
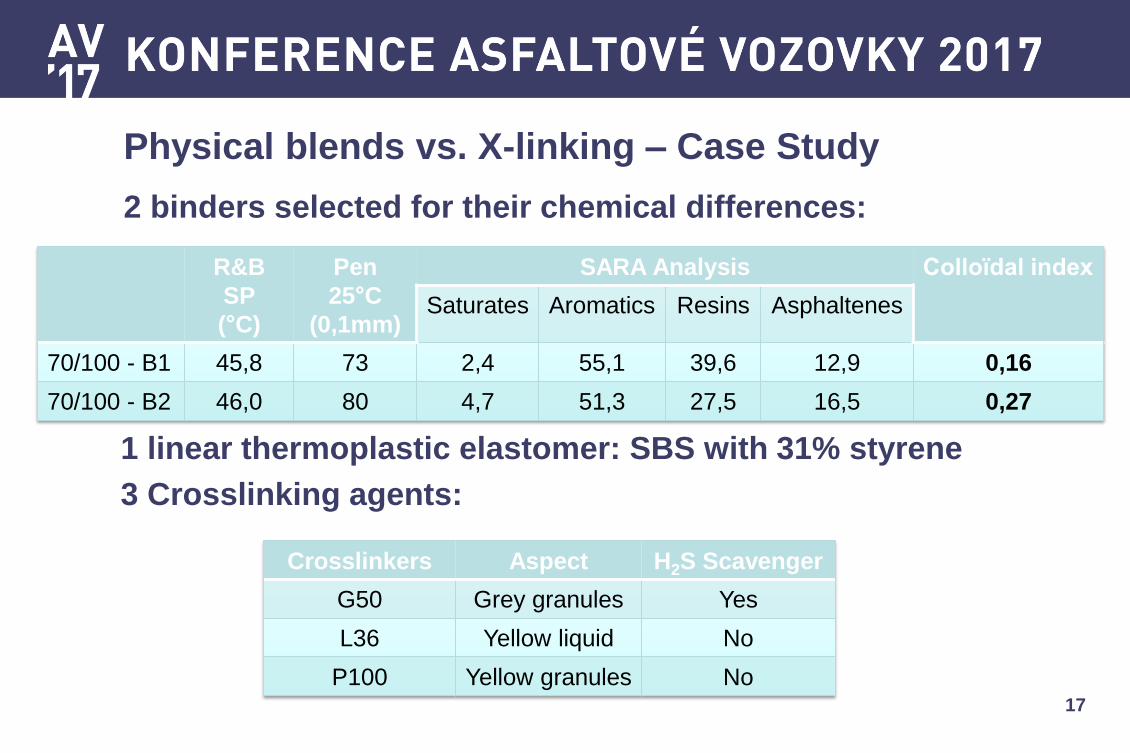
Physical blends vs. X-linking – Case Study
2 binders selected for their chemical differences:
17
R&B
SP
(°C)
Pen
25°C
(0,1mm)
SARA Analysis Colloïdal index
Saturates Aromatics Resins Asphaltenes
70/100 - B1 45,8 73 2,4 55,1 39,6 12,9 0,16
70/100 - B2 46,0 80 4,7 51,3 27,5 16,5 0,27
Crosslinkers Aspect H2S Scavenger
G50 Grey granules Yes
L36 Yellow liquid No
P100 Yellow granules No
1 linear thermoplastic elastomer: SBS with 31% styrene
3 Crosslinking agents:
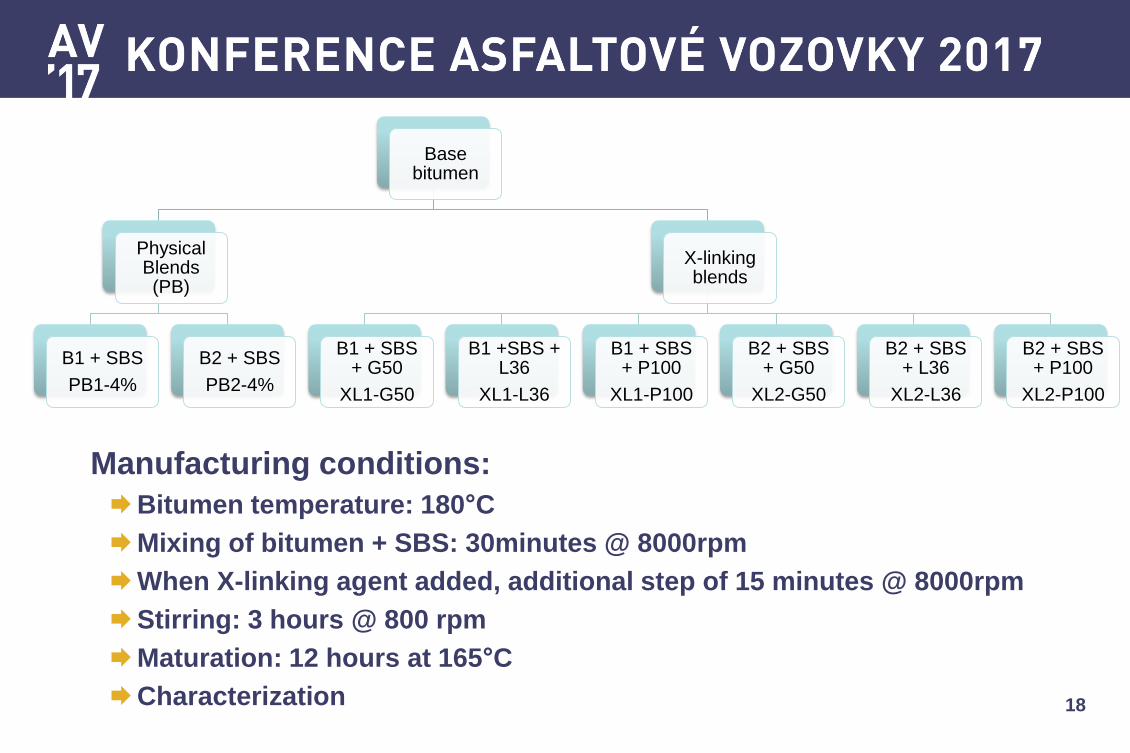
Base bitumen
Physical Blends (PB)
B1 + SBS
PB1-4%
B2 + SBS
PB2-4%
X-linking blends
B1 + SBS + G50
XL1-G50
B1 +SBS + L36
XL1-L36
B1 + SBS + P100
XL1-P100
B2 + SBS + G50
XL2-G50
B2 + SBS + L36
XL2-L36
B2 + SBS + P100
XL2-P100
18
Manufacturing conditions:
Bitumen temperature: 180°C
Mixing of bitumen + SBS: 30minutes @ 8000rpm
When X-linking agent added, additional step of 15 minutes @ 8000rpm
Stirring: 3 hours @ 800 rpm
Maturation: 12 hours at 165°C
Characterization
19
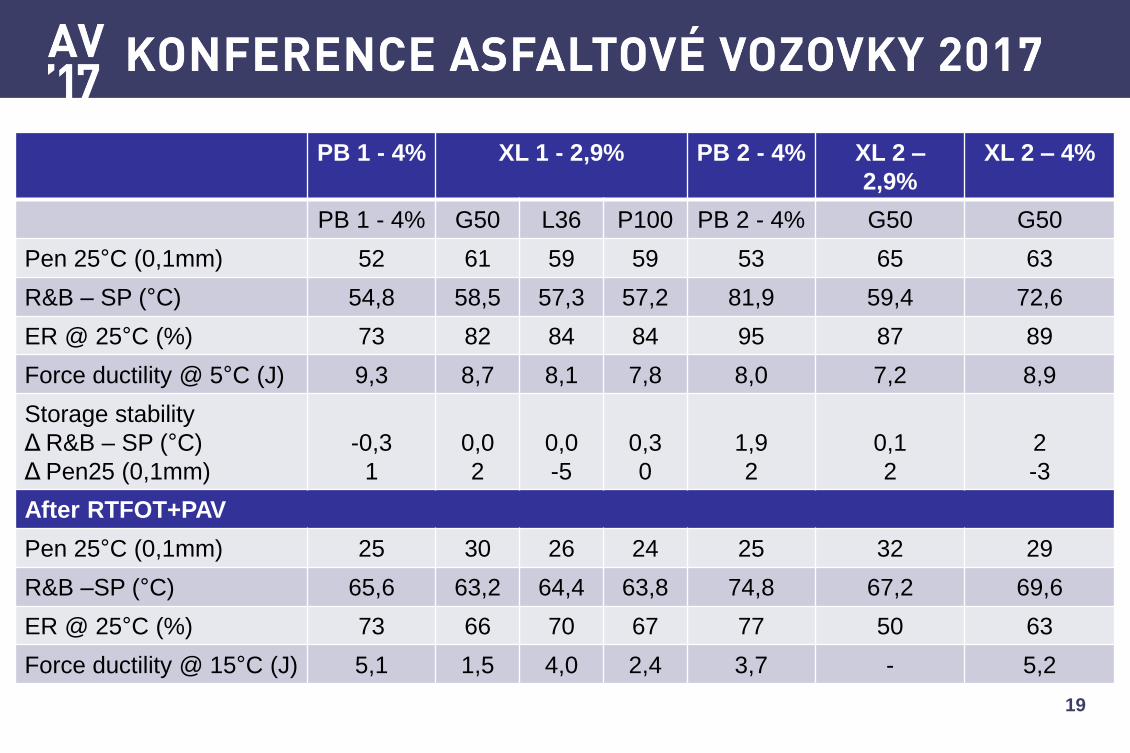
PB 1 - 4% XL 1 - 2,9% PB 2 - 4% XL 2 –
2,9%
XL 2 – 4%
PB 1 - 4% G50 L36 P100 PB 2 - 4% G50 G50
Pen 25°C (0,1mm) 52 61 59 59 53 65 63
R&B – SP (°C) 54,8 58,5 57,3 57,2 81,9 59,4 72,6
ER @ 25°C (%) 73 82 84 84 95 87 89
Force ductility @ 5°C (J) 9,3 8,7 8,1 7,8 8,0 7,2 8,9
Storage stability
Δ R&B – SP (°C)
Δ Pen25 (0,1mm)
-0,3
1
0,0
2
0,0
-5
0,3
0
1,9
2
0,1
2
2
-3
After RTFOT+PAV
Pen 25°C (0,1mm) 25 30 26 24 25 32 29
R&B –SP (°C) 65,6 63,2 64,4 63,8 74,8 67,2 69,6
ER @ 25°C (%) 73 66 70 67 77 50 63
Force ductility @ 15°C (J) 5,1 1,5 4,0 2,4 3,7 - 5,2
20
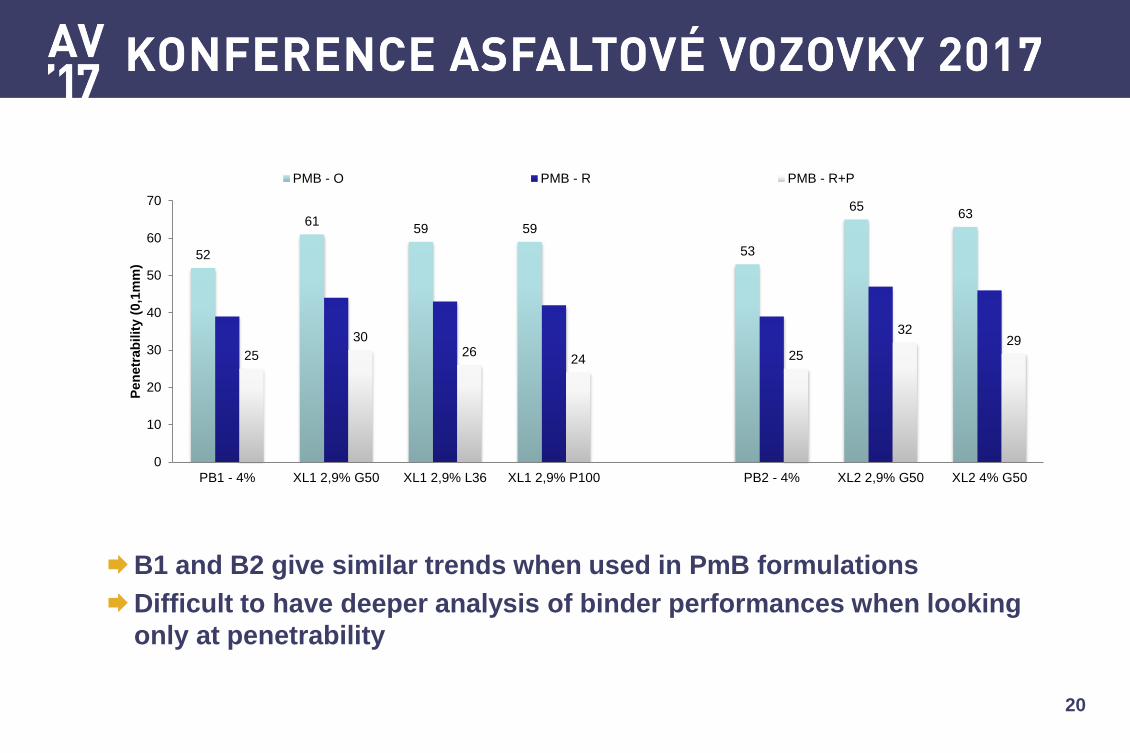
52
61 59 59
53
65 63
25
30 26
24 25
32 29
0
10
20
30
40
50
60
70
PB1 - 4% XL1 2,9% G50 XL1 2,9% L36 XL1 2,9% P100 PB2 - 4% XL2 2,9% G50 XL2 4% G50
Pen
etr
ab
ilit
y (
0,1
mm
)
PMB - O PMB - R PMB - R+P
B1 and B2 give similar trends when used in PmB formulations
Difficult to have deeper analysis of binder performances when looking
only at penetrability
21
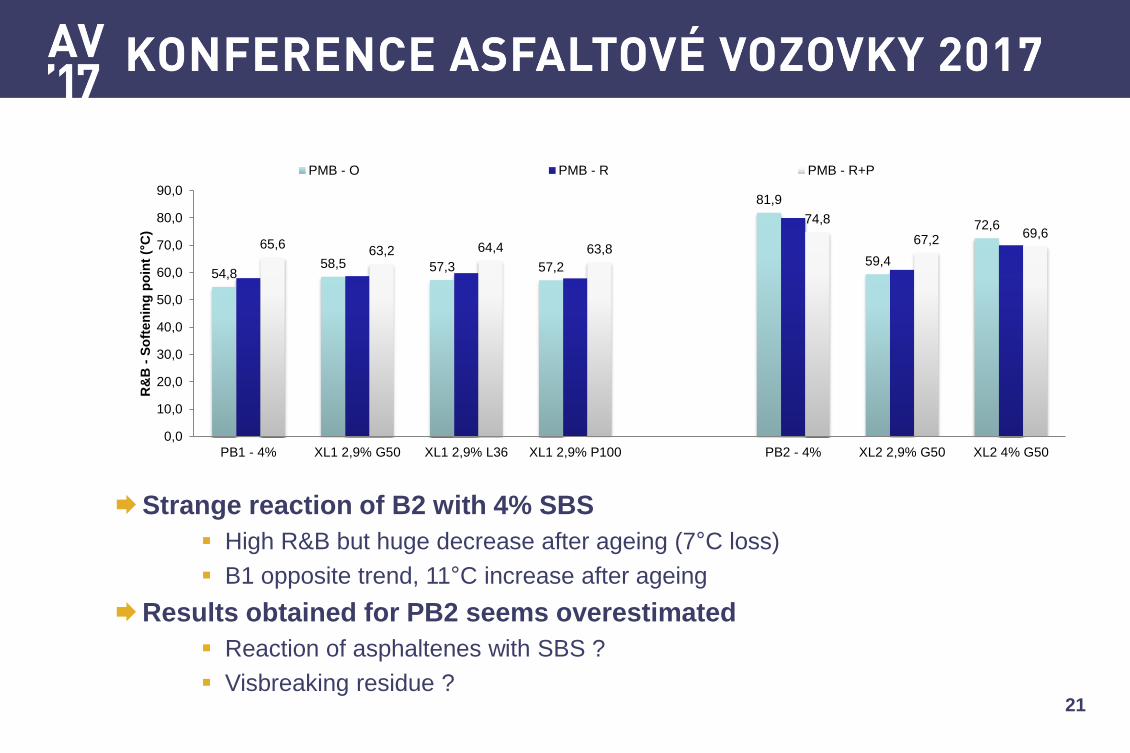
Strange reaction of B2 with 4% SBS
High R&B but huge decrease after ageing (7°C loss)
B1 opposite trend, 11°C increase after ageing
Results obtained for PB2 seems overestimated
Reaction of asphaltenes with SBS ?
Visbreaking residue ?
54,8 58,5 57,3 57,2
81,9
59,4
72,6
65,6 63,2 64,4 63,8
74,8
67,2 69,6
0,0
10,0
20,0
30,0
40,0
50,0
60,0
70,0
80,0
90,0
PB1 - 4% XL1 2,9% G50 XL1 2,9% L36 XL1 2,9% P100 PB2 - 4% XL2 2,9% G50 XL2 4% G50
R&
B -
So
ften
ing
po
int
(°C
)
PMB - O PMB - R PMB - R+P
22
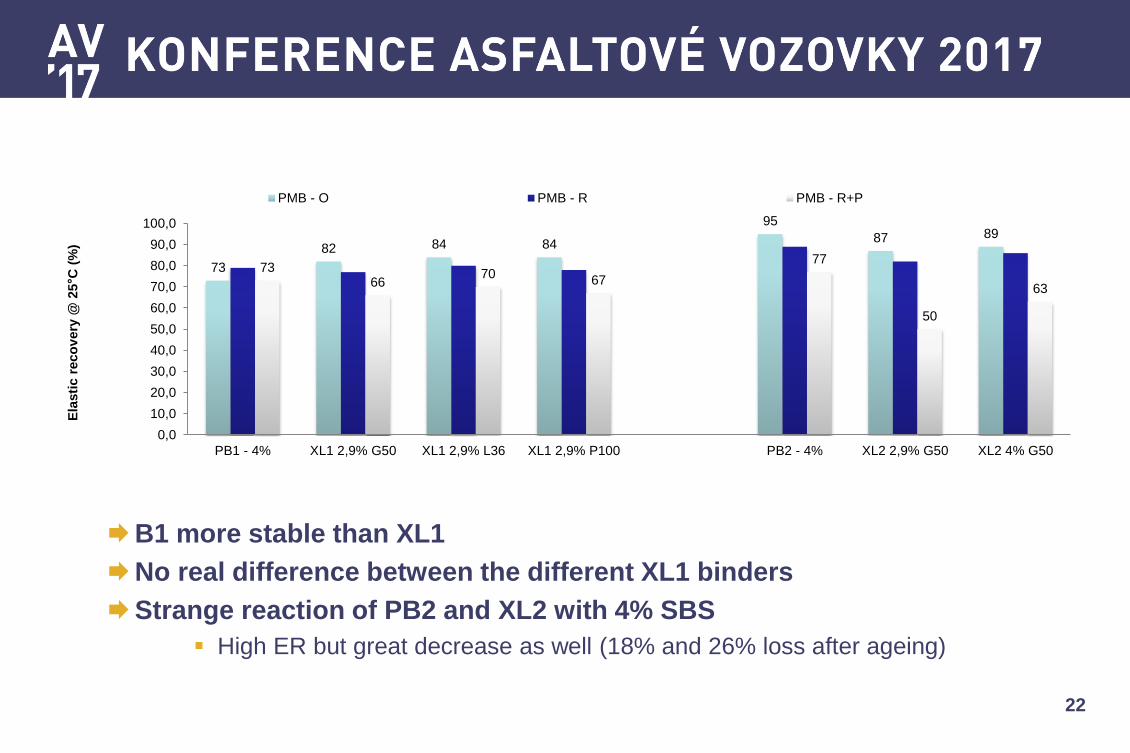
B1 more stable than XL1
No real difference between the different XL1 binders
Strange reaction of PB2 and XL2 with 4% SBS
High ER but great decrease as well (18% and 26% loss after ageing)
73
82 84 84
95
87 89
73 66
70 67
77
50
63
0,0
10,0
20,0
30,0
40,0
50,0
60,0
70,0
80,0
90,0
100,0
PB1 - 4% XL1 2,9% G50 XL1 2,9% L36 XL1 2,9% P100 PB2 - 4% XL2 2,9% G50 XL2 4% G50
Ela
sti
c r
eco
very
@ 2
5°C
(%
)
PMB - O PMB - R PMB - R+P
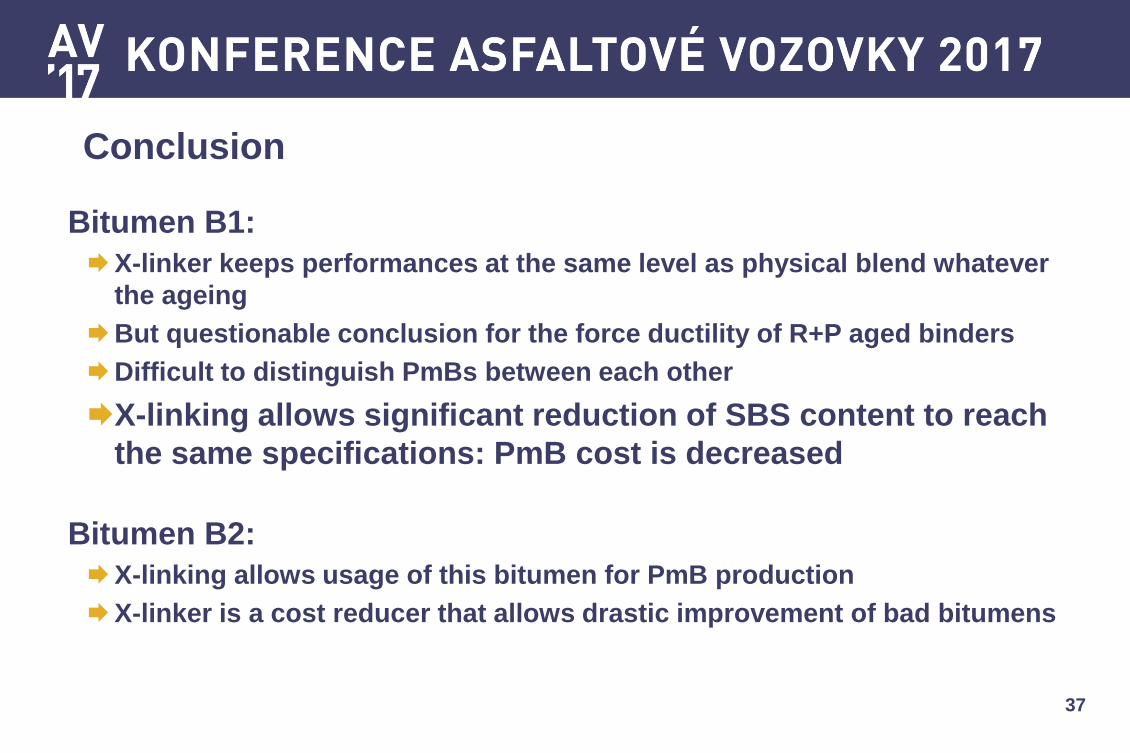
Bitumen B1:
X-linker keeps performances the same as physical blend whatever the
ageing
Questionable conclusion for Force Ductility on R+P aged binders
Difficult to distinguish PmBs between each other
X-linking allows significant reduction of SBS content to reach
the same specifications: PMB cost is decreased
Bitumen B2:
X-linking works differently than with B1
Need to keep SBS content the same to match PB2 characteristics
B2 bitumen is a difficult bitumen to use, not really compatible with polymer
modification
23
First findings: European standards
I. Past and future needs for transportation
II. How PmB and crosslinking meet those needs
III. Case study : European tests
IV.Case study : US tests
V. Conclusions
24
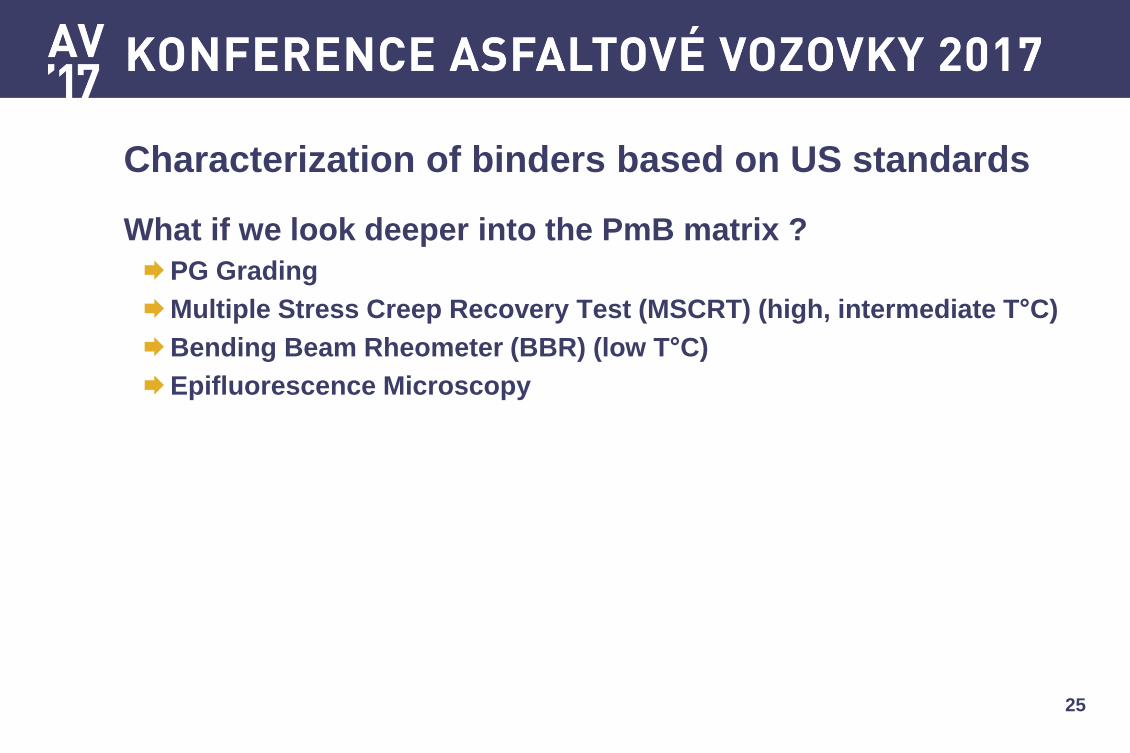
Characterization of binders based on US standards
25
What if we look deeper into the PmB matrix ?
PG Grading
Multiple Stress Creep Recovery Test (MSCRT) (high, intermediate T°C)
Bending Beam Rheometer (BBR) (low T°C)
Epifluorescence Microscopy
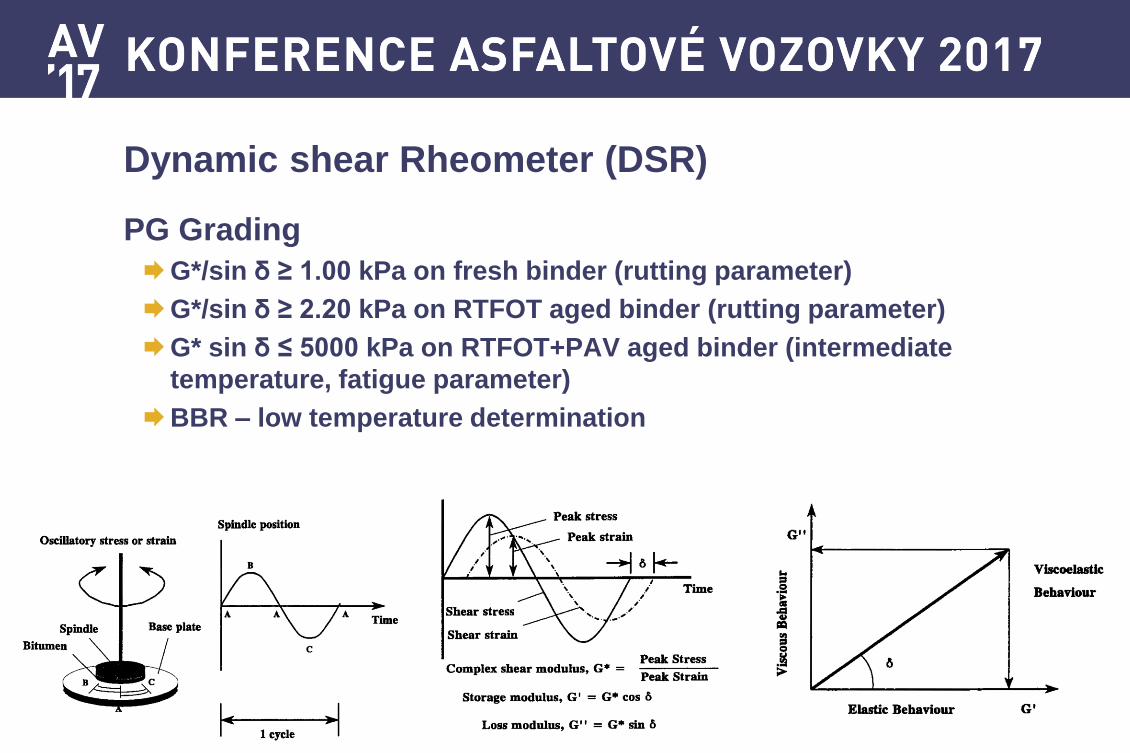
Dynamic shear Rheometer (DSR)
PG Grading
G*/sin δ ≥ 1.00 kPa on fresh binder (rutting parameter)
G*/sin δ ≥ 2.20 kPa on RTFOT aged binder (rutting parameter)
G* sin δ ≤ 5000 kPa on RTFOT+PAV aged binder (intermediate
temperature, fatigue parameter)
BBR – low temperature determination
26
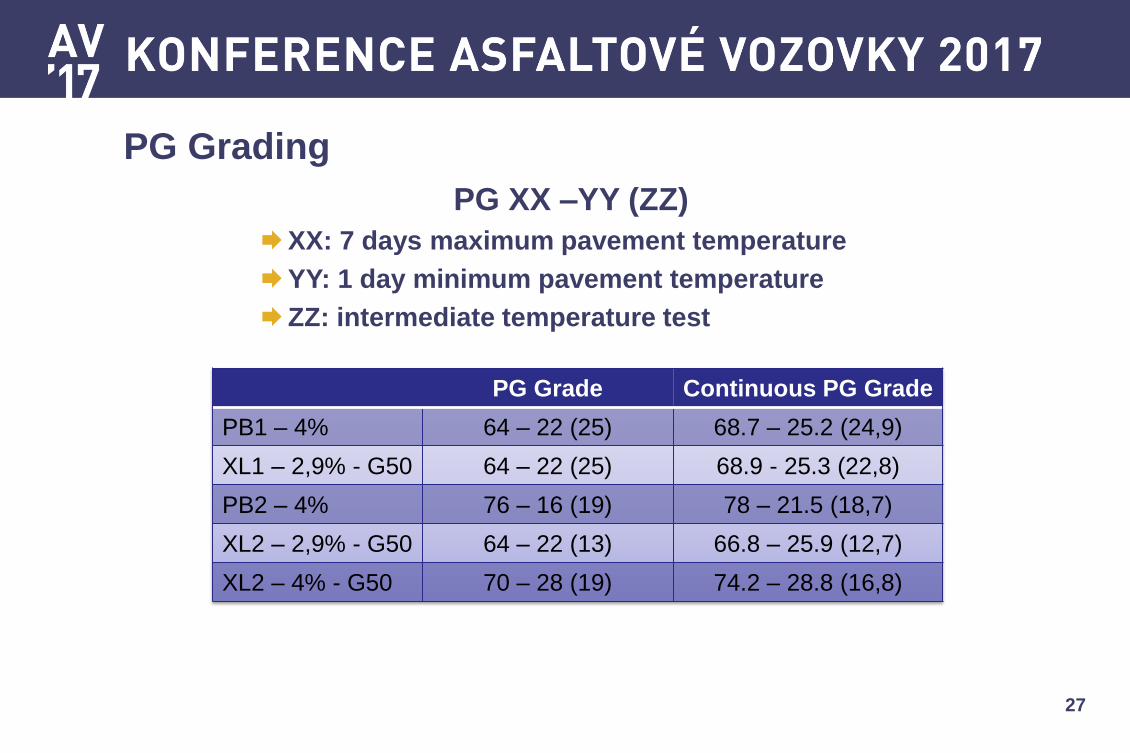
PG Grading
27
PG Grade Continuous PG Grade
PB1 – 4% 64 – 22 (25) 68.7 – 25.2 (24,9)
XL1 – 2,9% - G50 64 – 22 (25) 68.9 - 25.3 (22,8)
PB2 – 4% 76 – 16 (19) 78 – 21.5 (18,7)
XL2 – 2,9% - G50 64 – 22 (13) 66.8 – 25.9 (12,7)
XL2 – 4% - G50 70 – 28 (19) 74.2 – 28.8 (16,8)
PG XX –YY (ZZ)
XX: 7 days maximum pavement temperature
YY: 1 day minimum pavement temperature
ZZ: intermediate temperature test
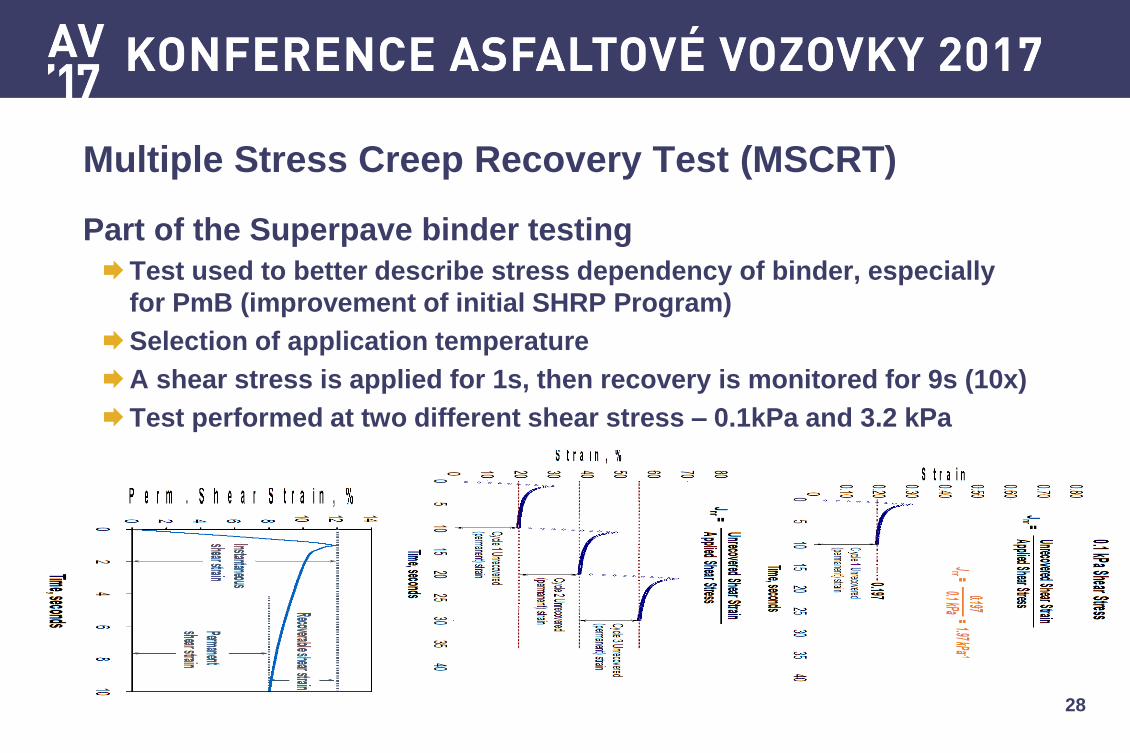
Multiple Stress Creep Recovery Test (MSCRT)
Part of the Superpave binder testing
Test used to better describe stress dependency of binder, especially
for PmB (improvement of initial SHRP Program)
Selection of application temperature
A shear stress is applied for 1s, then recovery is monitored for 9s (10x)
Test performed at two different shear stress – 0.1kPa and 3.2 kPa
28
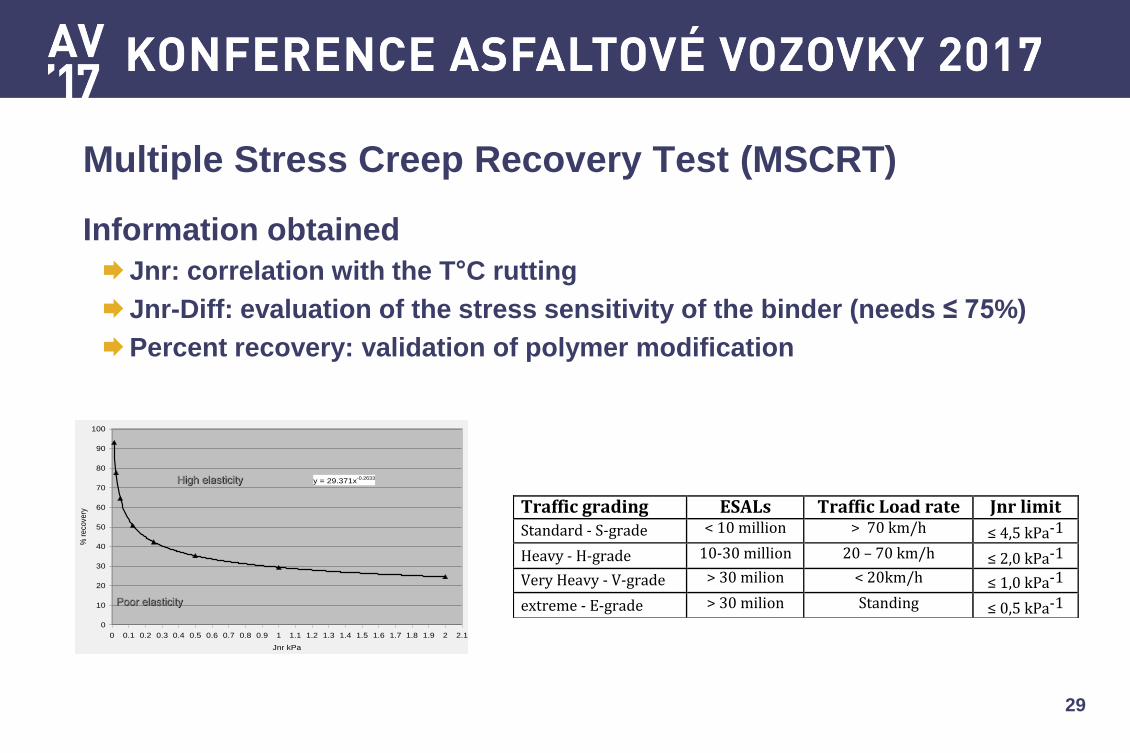
Multiple Stress Creep Recovery Test (MSCRT)
Information obtained
Jnr: correlation with the T°C rutting
Jnr-Diff: evaluation of the stress sensitivity of the binder (needs ≤ 75%)
Percent recovery: validation of polymer modification
29
y = 29.371x-0.2633
0
10
20
30
40
50
60
70
80
90
100
0 0.1 0.2 0.3 0.4 0.5 0.6 0.7 0.8 0.9 1 1.1 1.2 1.3 1.4 1.5 1.6 1.7 1.8 1.9 2 2.1
Jnr kPa
% r
eco
very
High elasticity
Poor elasticity
MSCR %Recovery:
Validate Polymer Modification
Trafficgrading ESALs TrafficLoadrate JnrlimitStandard-S-grade <10million >70km/h ≤4,5kPa-1
Heavy-H-grade 10-30million 20–70km/h ≤2,0kPa-1
VeryHeavy-V-grade >30milion <20km/h ≤1,0kPa-1
extreme-E-grade >30milion Standing ≤0,5kPa-1
30
E V H S
0
10
20
30
40
50
60
70
80
90
100
0 0,5 1 1,5 2 2,5 3 3,5 4
% R
eco
very
- 3
,2kP
a @
60°C
(%
)
Jnr - 3,2kPa @ 60°C (kPa-1)
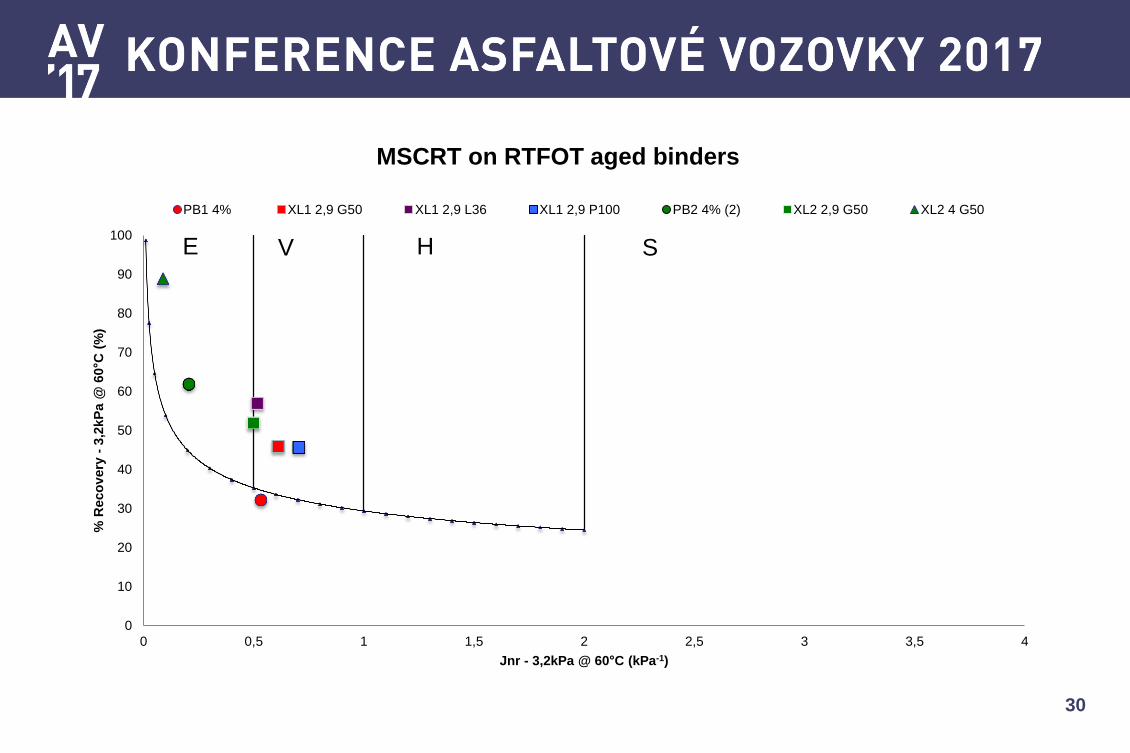
MSCRT on RTFOT aged binders
PB1 4% XL1 2,9 G50 XL1 2,9 L36 XL1 2,9 P100 PB2 4% (2) XL2 2,9 G50 XL2 4 G50
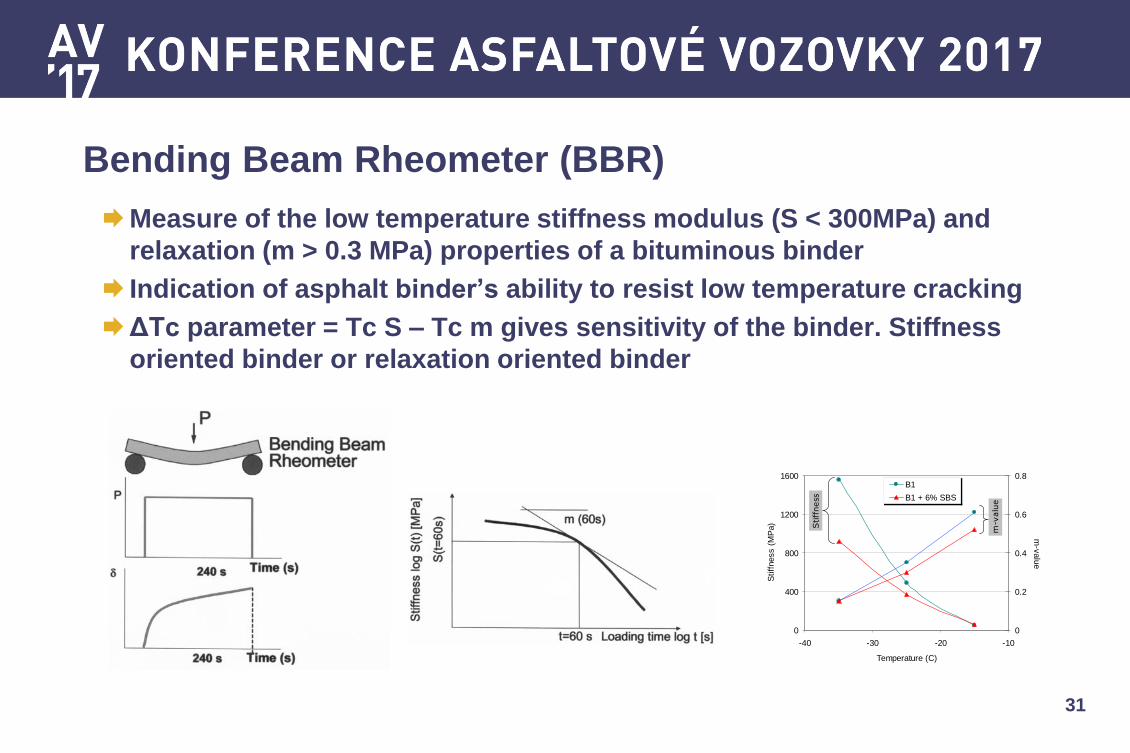
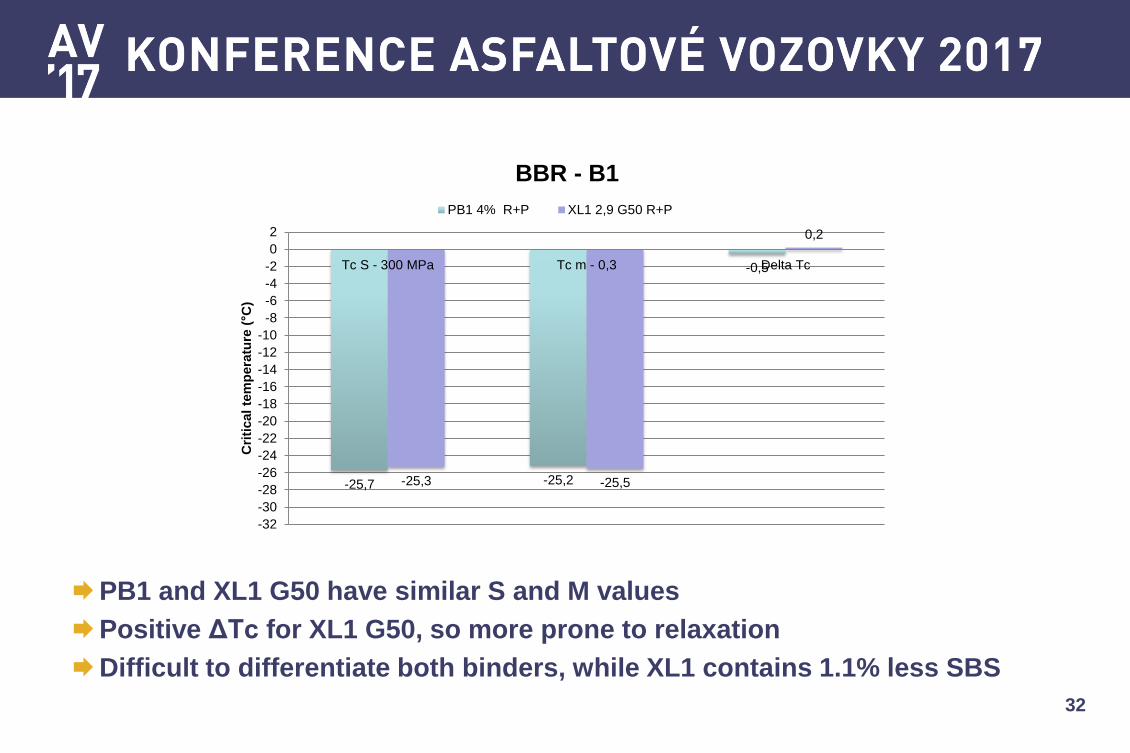
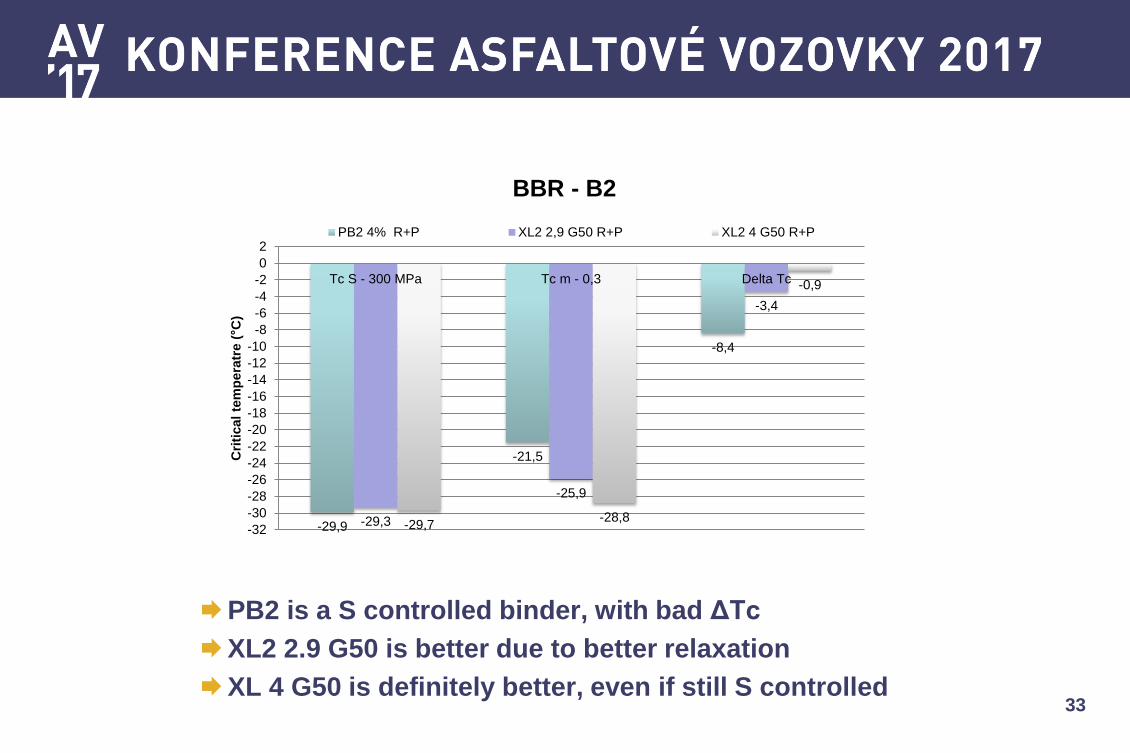
Bending Beam Rheometer (BBR)
Measure of the low temperature stiffness modulus (S < 300MPa) and
relaxation (m > 0.3 MPa) properties of a bituminous binder
Indication of asphalt binder’s ability to resist low temperature cracking
ΔTc parameter = Tc S – Tc m gives sensitivity of the binder. Stiffness
oriented binder or relaxation oriented binder
31
samples differ significantly in the DSR tests,
and the rheological differences are attributed
to different morphologies created in the
binder samples.
LOW TEMPERATURE PROPERTIES
In cold areas like the Nordic countries,
low-temperature cracking can be a serious
failure mode in the asphalt road pavement.
This type of failure occurs when the thermal
stress induced at low temperatures exceeds
the tensile strength of the asphalt mixture.
To reduce the risk of low temperature
cracking, bituminous binder should have
good flexibility, as reflected by low stiffness
and high ability of stress relaxation, at the
lowest pavement temperature. In this paper,
the low temperature properties are studied
by creep tests using BBR (Cannon
Instrument).
In the BBR test (Fig. 11), sample beam
was prepared by pouring hot binder (heated
ant stirred at 180˚C) to a mould of 125 mm
long, 12.5 mm wide and 6.25 mm thick.
After about 1.5 hours at room temperature,
de-moulding was made at approximately
0°C. The rectangular beam was conditioned
in a liquid bath at test temperature for 1
hour. Then a constant load of 100 g was
applied to the beam. The deflection of center
point was measured continuously for 240 s,
and stiffness (S) and creep rate (m-value)
were determined at different loading times.
The m-value is the slope of the curve of log
(stiffness) versus log (loading time), which
measures binder’s ability of stress
relaxation.
Figure 11. Schematic illustration of BBR.
Examples of the BBR results are shown
in Fig. 12 for B1, before and after polymer
modification. As indicated, at -25˚C, the
addition of 6% SBS to the bitumen reduces
the stiffness of the bitumen, at the same time
also decreases the m-value of the bitumen.
The same observation can be made when the
stiffness and m-value are examined at
different temperatures (see Fig. 13).
100
1000
1 10 100 1000
Loading time (sec)
Sti
ffness (
MP
a)
0.1
1
m-v
alu
e
B1
B1 + 6% SBSStiffness
m-value
Figure 12. BBR results obtained at -25˚C.
0
400
800
1200
1600
-40 -30 -20 -10
Temperature (C)
Stiff
ness (
MP
a)
0
0.2
0.4
0.6
0.8
m-v
alu
e
B1
B1 + 6% SBS
Stiffness
m-value
Figure 13. Stiffness and m-value at a
loading time of 60 s versus temperature.
From the plots of stiffness and m-value
at a loading time of 60s versus temperature,
the limiting temperatures at 300 MPa
stiffness (LST) and at m-value of 0.300
(LmT) are used to assess binders’ low
temperature properties10
. In most cases, the
limiting temperatures are found to depend
mainly on the base bitumen, while the
32
PB1 and XL1 G50 have similar S and M values
Positive ΔTc for XL1 G50, so more prone to relaxation
Difficult to differentiate both binders, while XL1 contains 1.1% less SBS
-25,7 -25,2
-0,5
-25,3 -25,5
0,2
-32
-30
-28
-26
-24
-22
-20
-18
-16
-14
-12
-10
-8
-6
-4
-2
0
2
Tc S - 300 MPa Tc m - 0,3 Delta Tc
Cri
tical
tem
pera
ture
(°C
)
BBR - B1
PB1 4% R+P XL1 2,9 G50 R+P
33
PB2 is a S controlled binder, with bad ΔTc
XL2 2.9 G50 is better due to better relaxation
XL 4 G50 is definitely better, even if still S controlled
-29,9
-21,5
-8,4
-29,3
-25,9
-3,4
-29,7 -28,8
-0,9
-32
-30
-28
-26
-24
-22
-20
-18
-16
-14
-12
-10
-8
-6
-4
-2
0
2
Tc S - 300 MPa Tc m - 0,3 Delta Tc
Cri
tical
tem
pera
tre (
°C)
BBR - B2
PB2 4% R+P XL2 2,9 G50 R+P XL2 4 G50 R+P
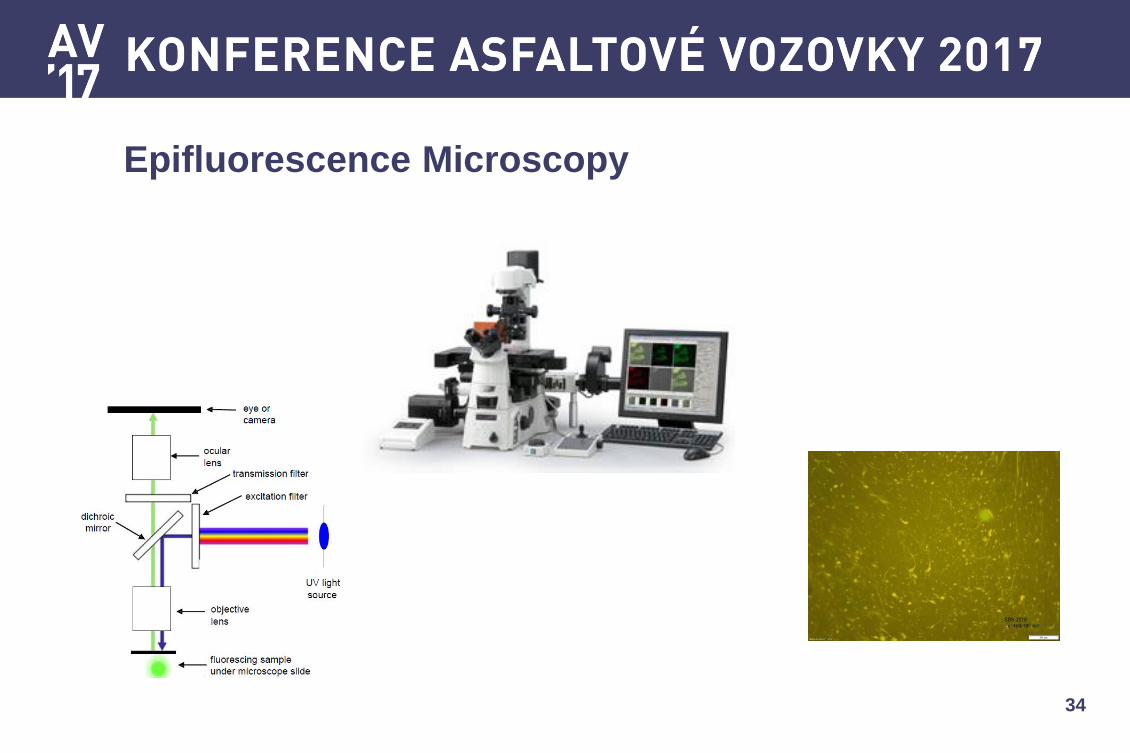
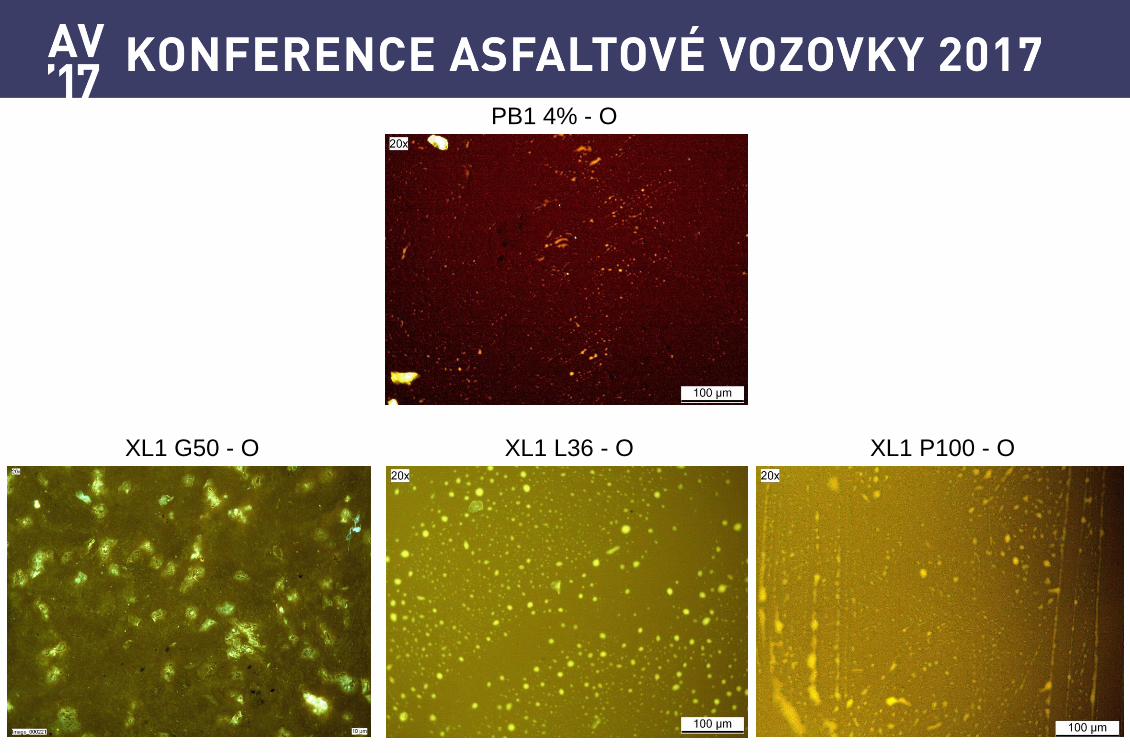
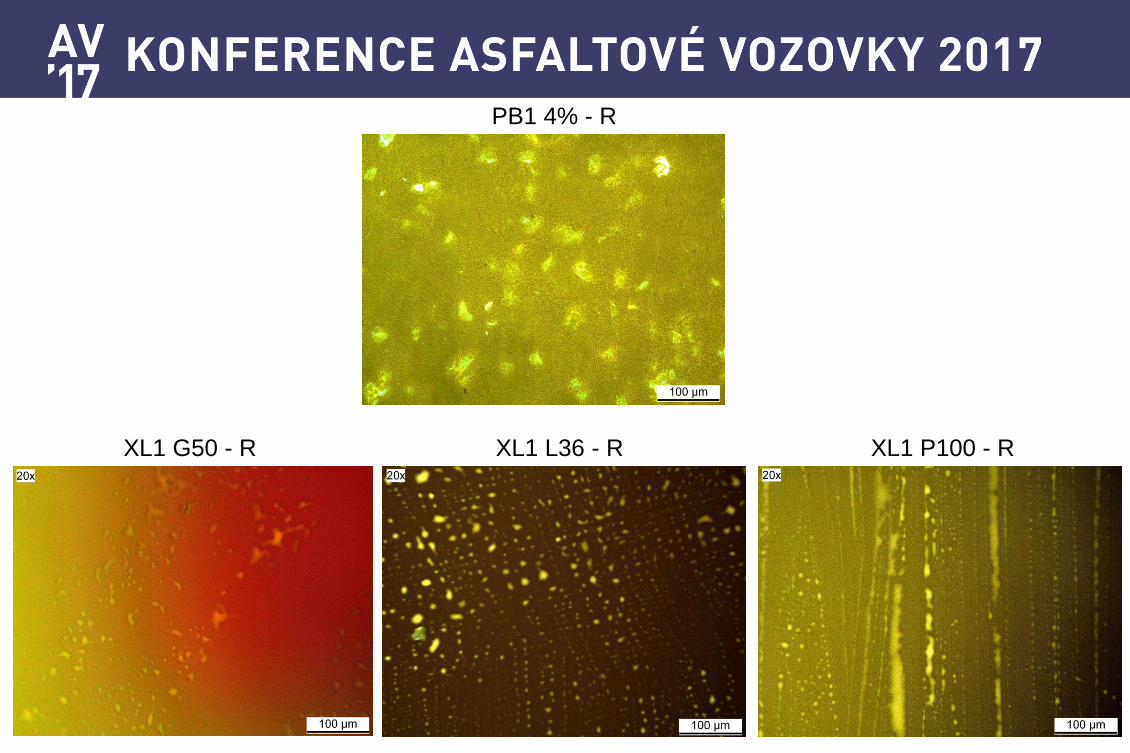
Epifluorescence Microscopy
34
Figure 2: Epi-fluorescence microscope (AP-T197-12, 2012).
2.3. Methodology
Different types of sample preparation methods for epi-fluorescence analysis were
investigated. But a method based on ASTM D36 (2006) sample preparation procedure
was found ideal. During microscopic analysis, the exposed surface started to flow with UV
exposure. The heat from the lens heats up the sample, which in turn flows. In order to
prevent the sample from flowing and prevent bitumen-air interaction, which has been
shown to affect PMB morphology (Soenen et al., 2008), two glass slides were used to
sandwich the sample (see Figure 3).
Figure 3: Bitumen inside a brass ring.
Like the European standardised freeze fracture method (DIN EN 13632, 2010), this
method was considered repeatable. However, it resulted in a slightly different morphology
of the tested blend given the difference in cooling. It was still preferred over the others for
PMB morphology investigations due to the following reasons:
285
colour (Mturi et al., 2016). However, given the fact that these polymer rich domains also
fluoresce with high energy visible light in bitumen, whereas the pure polymers hardly show
any absorbance at these wavelengths (Mturi et al., 2016), does support the argument.
Figure 4: Fluorescent images of pure bitumen (using different microscopes).
Figure 5: Fluorescent images of SBS (Vector® 2518) in bitumen.
Figure 6: Fluorescent images of SBS (Kraton® D1184 ASM) in bitumen.
Figure 7: Fluorescent images of SBR (Lipaton® SB 2540) in bitumen.
287
35
PB2 4% - O PB2 4% - R PB2 4% - R+P
XL2 4% G50 - O XL2 4% G50 - R XL2 4% G50 – R+P
I. Past and future needs for transportation
II. How PmB and crosslinking meet those needs
III. Case study : European tests
IV. Case study : US tests
V. Conclusions
36
Bitumen B1:
X-linker keeps performances at the same level as physical blend whatever
the ageing
But questionable conclusion for the force ductility of R+P aged binders
Difficult to distinguish PmBs between each other
X-linking allows significant reduction of SBS content to reach
the same specifications: PmB cost is decreased
Bitumen B2:
X-linking allows usage of this bitumen for PmB production
X-linker is a cost reducer that allows drastic improvement of bad bitumens
37
Conclusion

38
Thank You for your attention
Any question ?
39
PB1 4% - O
XL1 G50 - O XL1 L36 - O XL1 P100 - O
40
PB1 4% - R
XL1 G50 - R XL1 L36 - R XL1 P100 - R
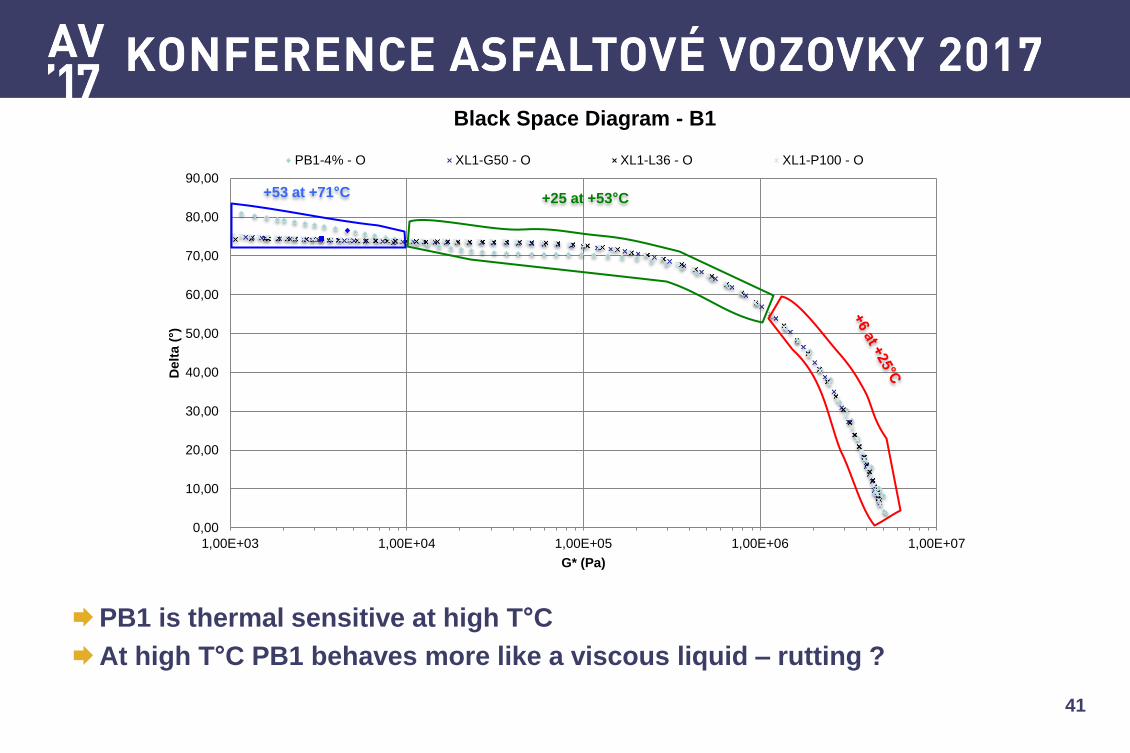
41
0,00
10,00
20,00
30,00
40,00
50,00
60,00
70,00
80,00
90,00
1,00E+03 1,00E+04 1,00E+05 1,00E+06 1,00E+07
Delt
a (
°)
G* (Pa)
Black Space Diagram - B1
PB1-4% - O XL1-G50 - O XL1-L36 - O XL1-P100 - O
+53 at +71°C +25 at +53°C
PB1 is thermal sensitive at high T°C
At high T°C PB1 behaves more like a viscous liquid – rutting ?
42
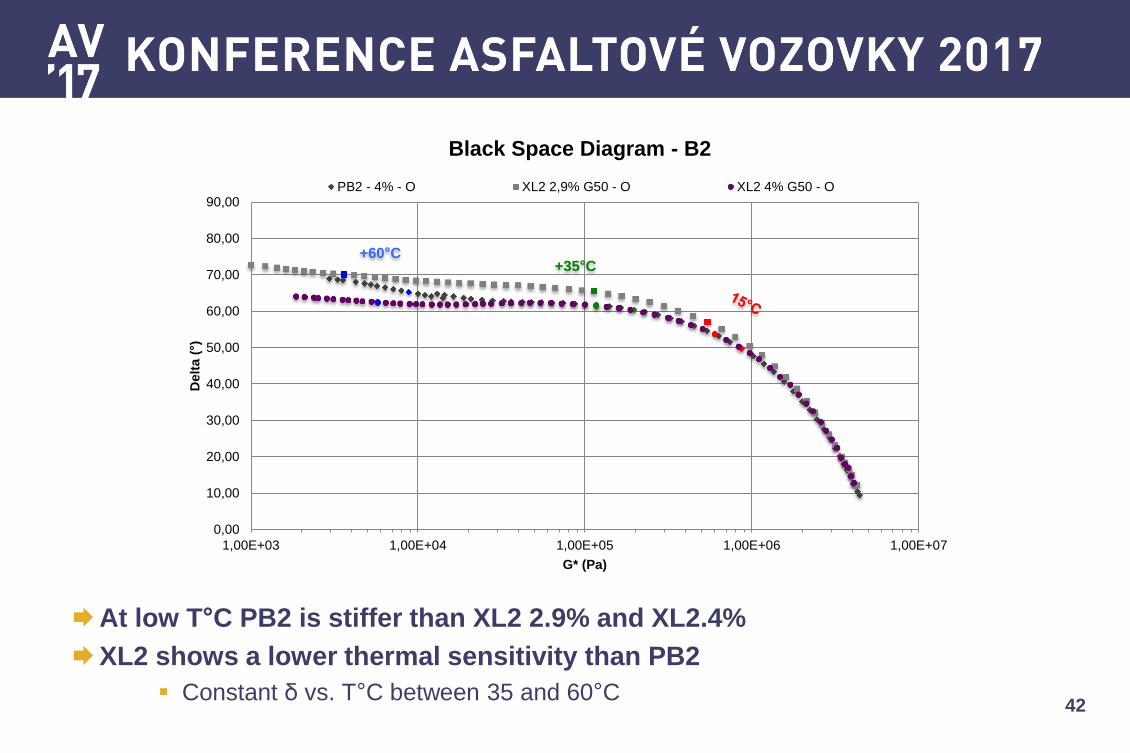
0,00
10,00
20,00
30,00
40,00
50,00
60,00
70,00
80,00
90,00
1,00E+03 1,00E+04 1,00E+05 1,00E+06 1,00E+07
Delt
a (
°)
G* (Pa)
Black Space Diagram - B2
PB2 - 4% - O XL2 2,9% G50 - O XL2 4% G50 - O
+60°C +35°C
At low T°C PB2 is stiffer than XL2 2.9% and XL2.4%
XL2 shows a lower thermal sensitivity than PB2
Constant δ vs. T°C between 35 and 60°C