Embed Size (px)
Citation preview
Better Measuring Global Value Chains
• Overview: • Growth and Benefits of Globalization
• Architecture of Extended System
• Application of SEIGA to Analysis of Possible Changes in U.S. Policy on Trade and Investment
• GDP, GDI, Finance, Productivity, and Growth • GDP: Net exports; Trade in value added, Consumption, Investment, G and T
• GDI: Compensation (and employment), profits and other returns
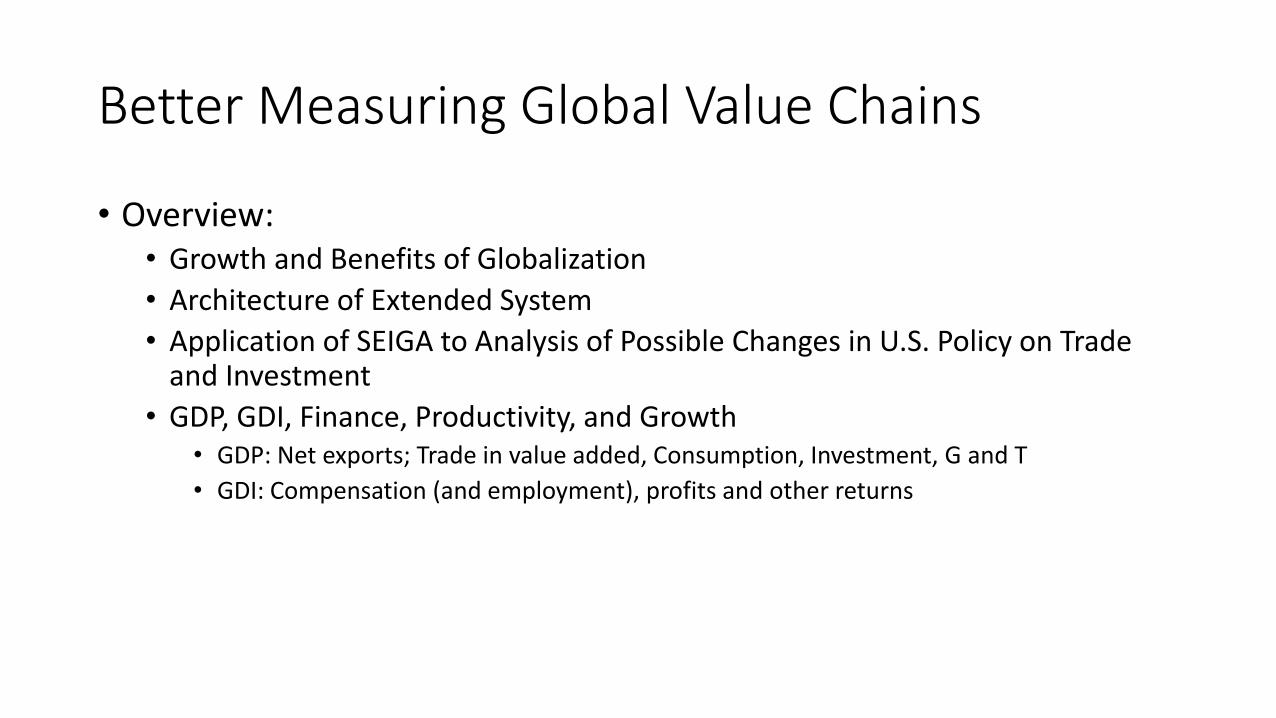
Growth and Benefits of GVCs and Trade • The Silk Road, developed circa 200BC, connected the East and West in
what has been described as the first global supply chain.
• A more recent example that conformed more closely to what we today think of as global value chain was textile trade in the 1800s.
• Cotton merchants and manufacturers in England bought raw cotton from around the world and transformed it into textile products that they had finished and marketed around the world.
• Trends in Trade and GVCs driven by long-term trends in resources, technology, efficiency, competition, comparative advantage and markets.
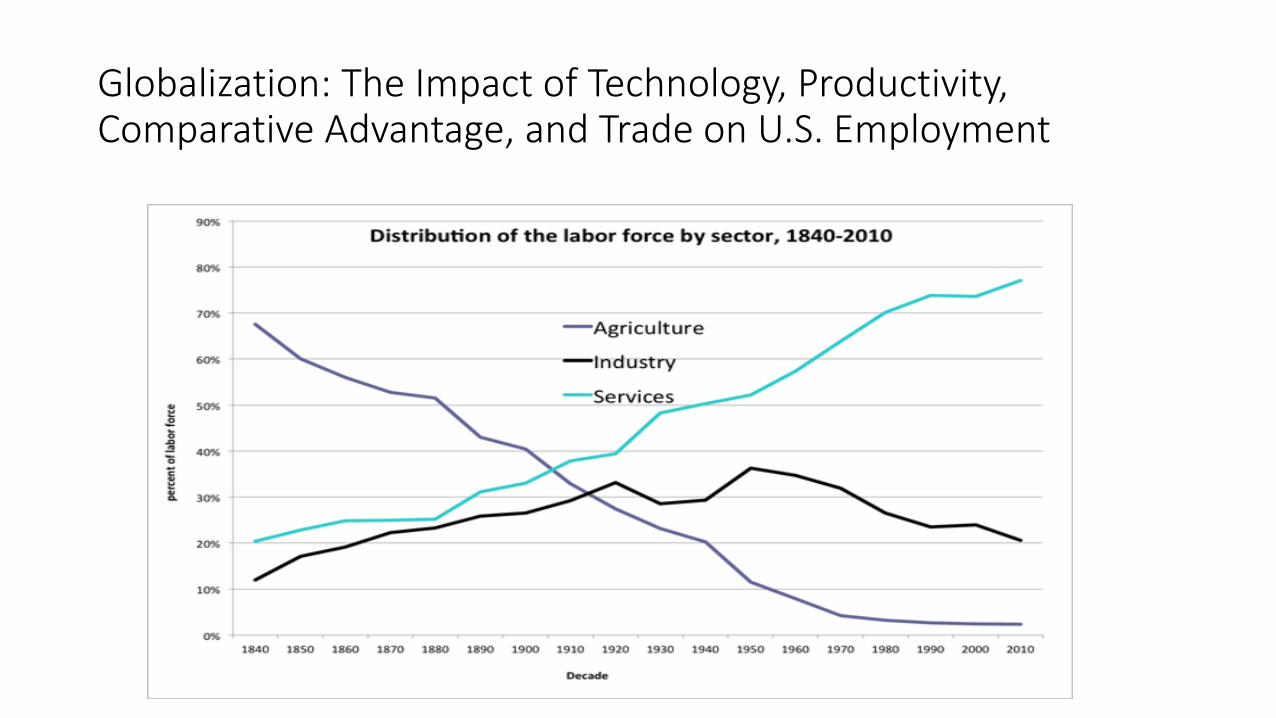
Globalization: The Impact of Technology, Productivity, Comparative Advantage, and Trade on U.S. Employment
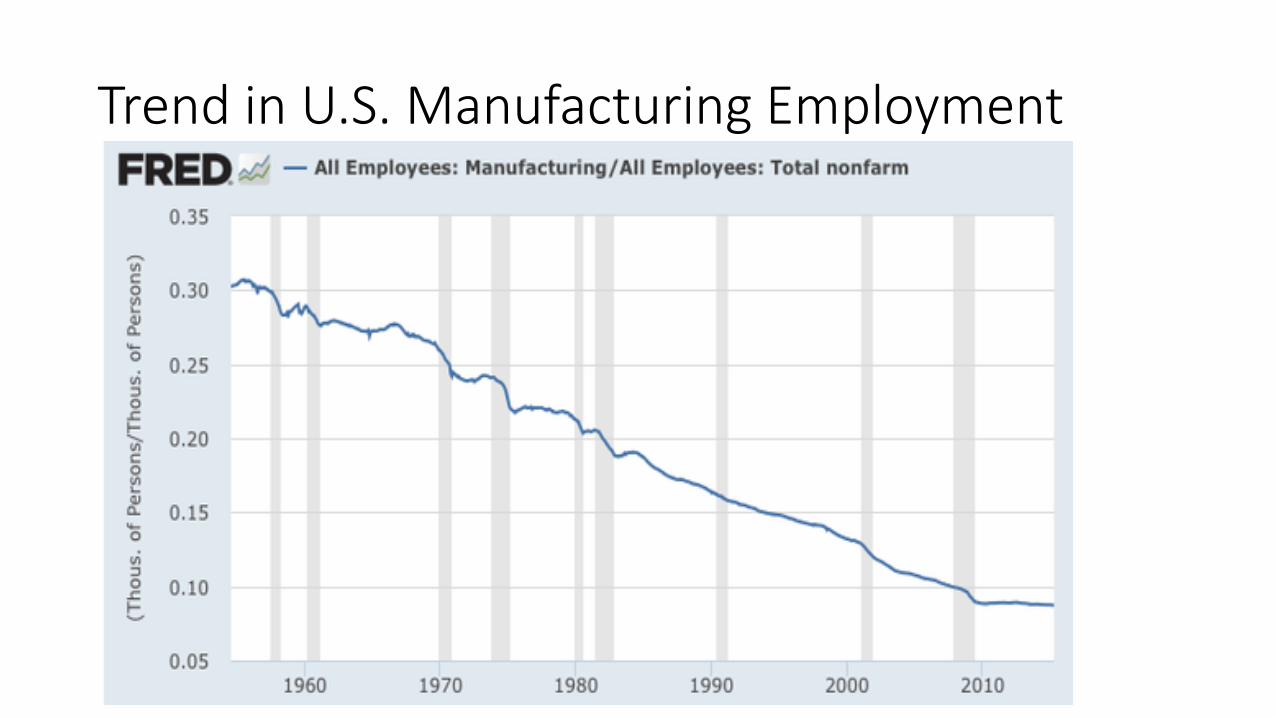
Trend in U.S. Manufacturing Employment
Growth and Benefits of GVCs and Trade
• GVCs have accounted for a large share of growth in trade and the benefits created by that trade during the post war era.
• Throughout the post war era, firms have sought to maximize production efficiency, minimize global tax burden and maximize sales and profits by organizing their business across national boundaries around the world.
• Advances in technology and communications, trade liberalization, reductions in shipping costs, and the integration of financial markets have accelerated the pace of globalization.
Growth and Benefits of GVCs and Trade • The United Nations Conference on Trade and Development (UNCTAD)
has estimated that “GVCs shaped by Trans National Corporations (TNCs) account for some 80% of global trade.”
• UNCTAD’s index of countries’ participation in global value chains -- which is a measure of their participation in upstream and downstream global value chains -- illustrates that there is strong and widespread growth in both developed and developing countries’ participation in GVCs (Figure 1.2). • The global GVC participation rate is 52 percent. Among developed economies
it is 57 percent and amongst developing economies it is 52 percent.
• Since 1970, global FDI grew at a rate of 10.7 percent while over the same period global GDP grew at an annual rate of 5.6 percent.
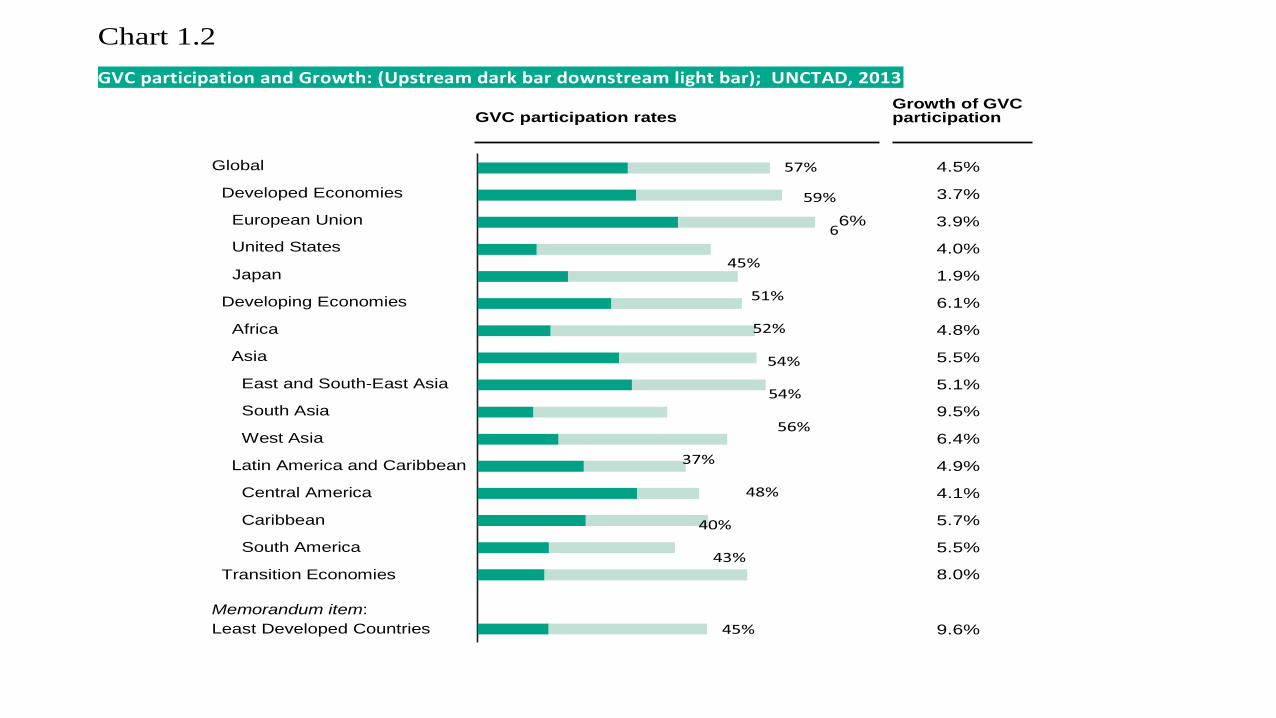
Chart 1.2
GVC participation and Growth: (Upstream dark bar downstream light bar); UNCTAD, 2013
GVC participation rates
Growth of GVC participation
Global
Developed Economies
European Union
United States
Japan
Developing Economies
Africa
Asia
East and South-East Asia
South Asia
West Asia
Latin America and Caribbean
Central America
Caribbean
South America
Transition Economies
Memorandum item:
Least Developed Countries
4.5%
3.7%
6% 3.9%
4.0%
1.9%
6.1%
4.8%
5.5%
5.1%
9.5%
6.4%
4.9%
4.1%
5.7%
5.5%
8.0%
9.6%
Growth and Benefits of GVCs and Trade
• GVCs have integrated developing and developed economies, increased the volume of trade across countries, and contributed to productivity growth, job creation, and higher standards of living.
• GVCs take advantage of the economies of scale brought by expanding to global markets, the lower costs and greater efficiency brought by specialization and outsourcing, use of IT advances and technology transfer, and lower shipping costs.
• GVCs raise productivity, lower costs and prices, thereby raising real incomes, growth, and jobs.
Growth and Benefits of GVCs and Trade
• Trade has long been shown to be key to economic growth. Recent examples include:
• Warner and Sachs (1995), that found that between 1970 and 1989 developed economies that were more open to trade grew at a rate three times faster than closed economies, and among developing economies open economies grew more than six times faster than closed economies.
• Frankel and Romer (1999) found that an increase in the ratio of trade to GDP raises income per capita by at least one-half percentage point.
Benefits of GVCs and Trade
• GVCs and the net benefits associated with expanded trade are large, but globalization has produced backlash in developed economies among workers whose jobs are a offshored.
• Losses of manufacturing workers more than offset by gains of managers, engineers, financiers, marketers, and other workers in GVCs as well as the benefits to consumers in the form of lower prices.
• In addition, globalization and trade has raised incomes in developing countries thereby reducing cross-country inequality
Benefits of GVCs and Trade
• Despite these net gains, globalization often seen as key culprit in increasing inequality of income in developed economies. • As suggested by UK/BREXIT and the recent U.S. election, the
losers’ losses from globalization are large and concentrated making the losers a potent political force.
• Extended international accounts should probably focus on measures of inclusive growth, such as measures of the distribution of income to provide a more relevant picture of the full effects of globalization. • Better data on the price of imported goods could also provide better
measures of the gains to consumers of globalization (as well as better macro data on productivity and real GDP; see below)
Need for System of Extended International Accounts and Business Statistics • Existing international statistics have not kept up with
globalization • Remain invaluable, but need extension to improve
understanding and public policy
• Critical need to “look-through” complex global production and financial transactions
• Based on: • SNA and BPM
• Integration and reconciliation of business statistics
• New accounting concepts and measures including global supply and use tables and integrated real and financial accounts
Value-Added Trade
• Increasing globalization has led to increasing volume of double counting in both the real and financial sector. • Traditional trade measures count gross flows as exports and imports each
time they cross international borders
• Gross flows often do not reflect the value-added of the exporting country in the production of the goods or services.
Integrated Financial Accounts
• Similarly, in the financial sector, increasing complexity and the global nature of financial transactions has resulted in a system where official statistics can provide a misleading picture of the ultimate cross-country financial risk.
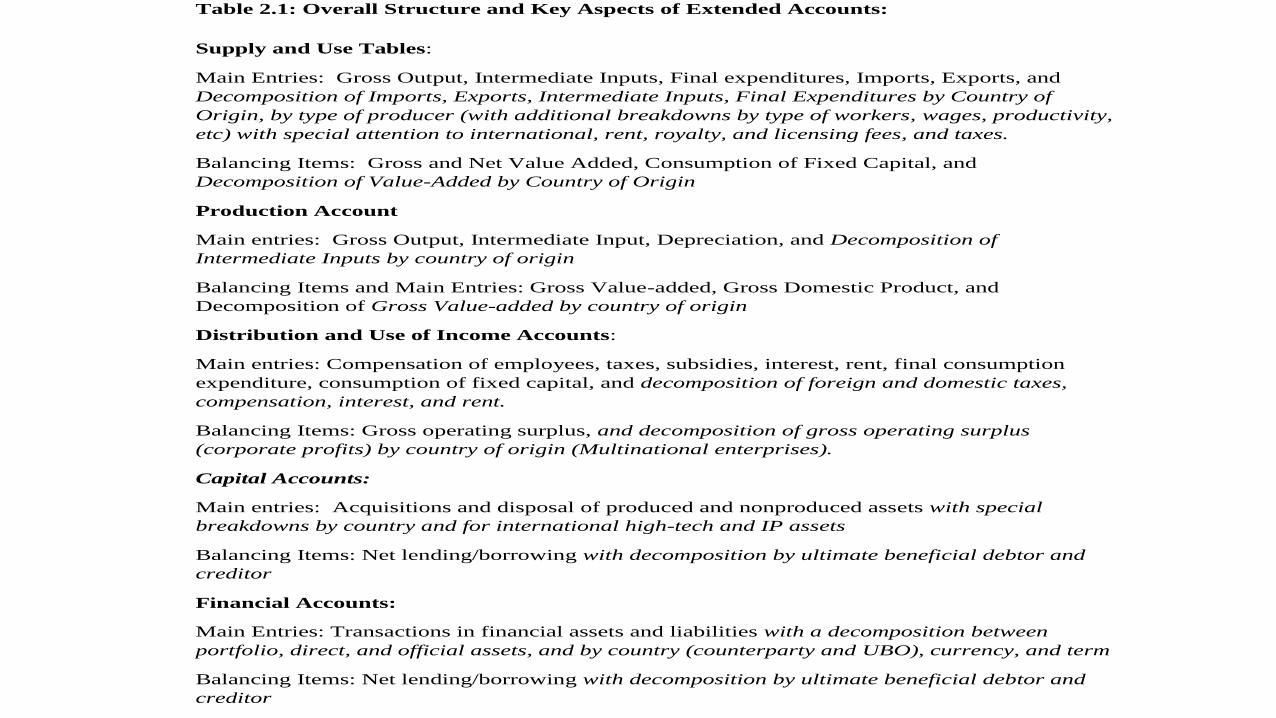
Table 2.1: Overall Structure and Key Aspects of Extended Accounts:
Supply and Use Tables:
Main Entries: Gross Output, Intermediate Inputs, Final expenditures, Imports, Exports, and
Decomposition of Imports, Exports, Intermediate Inputs, Final Expenditures by Country of
Origin, by type of producer (with additional breakdowns by type of workers, wages, productivity,
etc) with special attention to international, rent, royalty, and licensing fees, and taxes.
Balancing Items: Gross and Net Value Added, Consumption of Fixed Capital, and
Decomposition of Value-Added by Country of Origin
Production Account
Main entries: Gross Output, Intermediate Input, Depreciation, and Decomposition of
Intermediate Inputs by country of origin
Balancing Items and Main Entries: Gross Value-added, Gross Domestic Product, and
Decomposition of Gross Value-added by country of origin
Distribution and Use of Income Accounts:
Main entries: Compensation of employees, taxes, subsidies, interest, rent, final consumption
expenditure, consumption of fixed capital, and decomposition of foreign and domestic taxes,
compensation, interest, and rent.
Balancing Items: Gross operating surplus, and decomposition of gross operating surplus
(corporate profits) by country of origin (Multinational enterprises).
Capital Accounts:
Main entries: Acquisitions and disposal of produced and nonproduced assets with special
breakdowns by country and for international high-tech and IP assets
Balancing Items: Net lending/borrowing with decomposition by ultimate beneficial debtor and
creditor
Financial Accounts:
Main Entries: Transactions in financial assets and liabilities with a decomposition between
portfolio, direct, and official assets, and by country (counterparty and UBO), currency, and term
Balancing Items: Net lending/borrowing with decomposition by ultimate beneficial debtor and
creditor
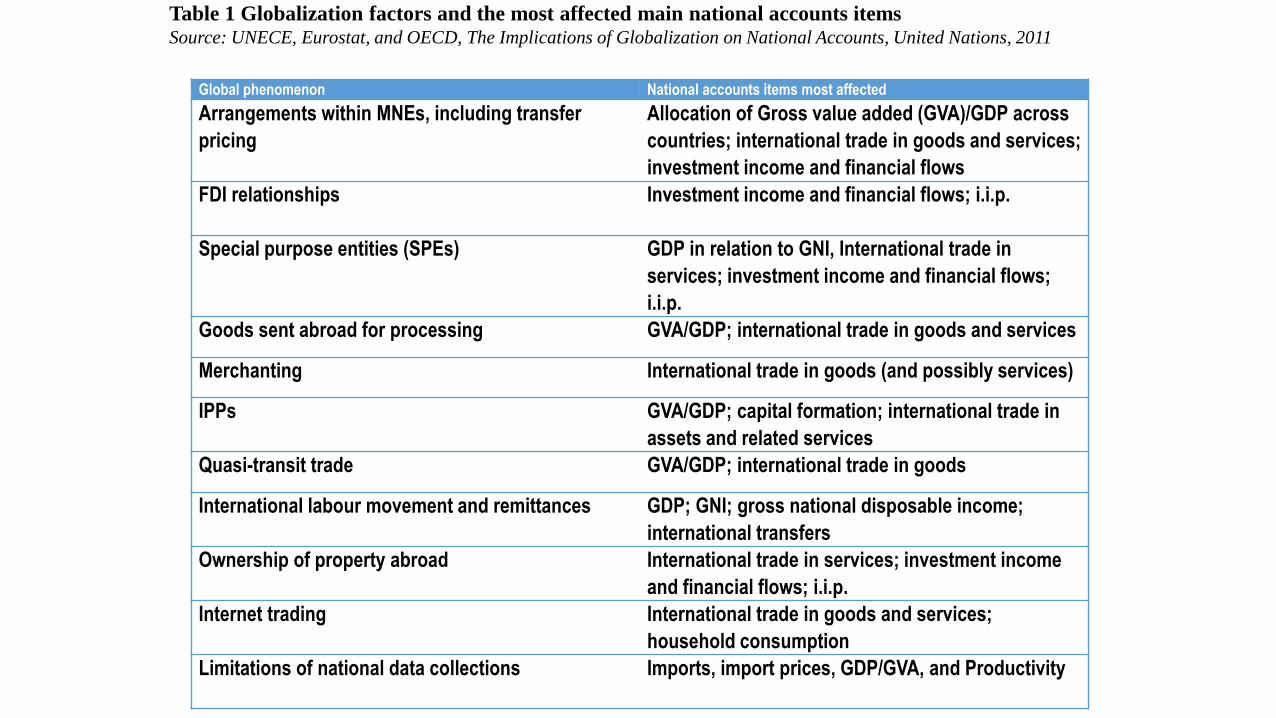
Global phenomenon National accounts items most affected
Arrangements within MNEs, including transfer
pricing
Allocation of Gross value added (GVA)/GDP across
countries; international trade in goods and services;
investment income and financial flows
FDI relationships
Investment income and financial flows; i.i.p.
Special purpose entities (SPEs) GDP in relation to GNI, International trade in
services; investment income and financial flows;
i.i.p.
Goods sent abroad for processing GVA/GDP; international trade in goods and services
Merchanting International trade in goods (and possibly services)
IPPs GVA/GDP; capital formation; international trade in
assets and related services
Quasi-transit trade GVA/GDP; international trade in goods
International labour movement and remittances GDP; GNI; gross national disposable income;
international transfers
Ownership of property abroad International trade in services; investment income
and financial flows; i.i.p.
Internet trading International trade in goods and services;
household consumption
Limitations of national data collections
Imports, import prices, GDP/GVA, and Productivity
Table 1 Globalization factors and the most affected main national accounts items Source: UNECE, Eurostat, and OECD, The Implications of Globalization on National Accounts, United Nations, 2011
Encouraging Trade, Data, Growth, and Competiveness Through More Relevant and Accurate Data
• Better target public policy and inform public perceptions • Drilling down beneath gross/counterparty trade and investment flows
provides a more accurate, and relevant picture of the underlying pattern of economic activity across countries.
• A fuller picture of the critical dependencies and benefits that arise from global production and trade provides an improved basis for public understanding of the dynamics of global trade and investment and for public policy.
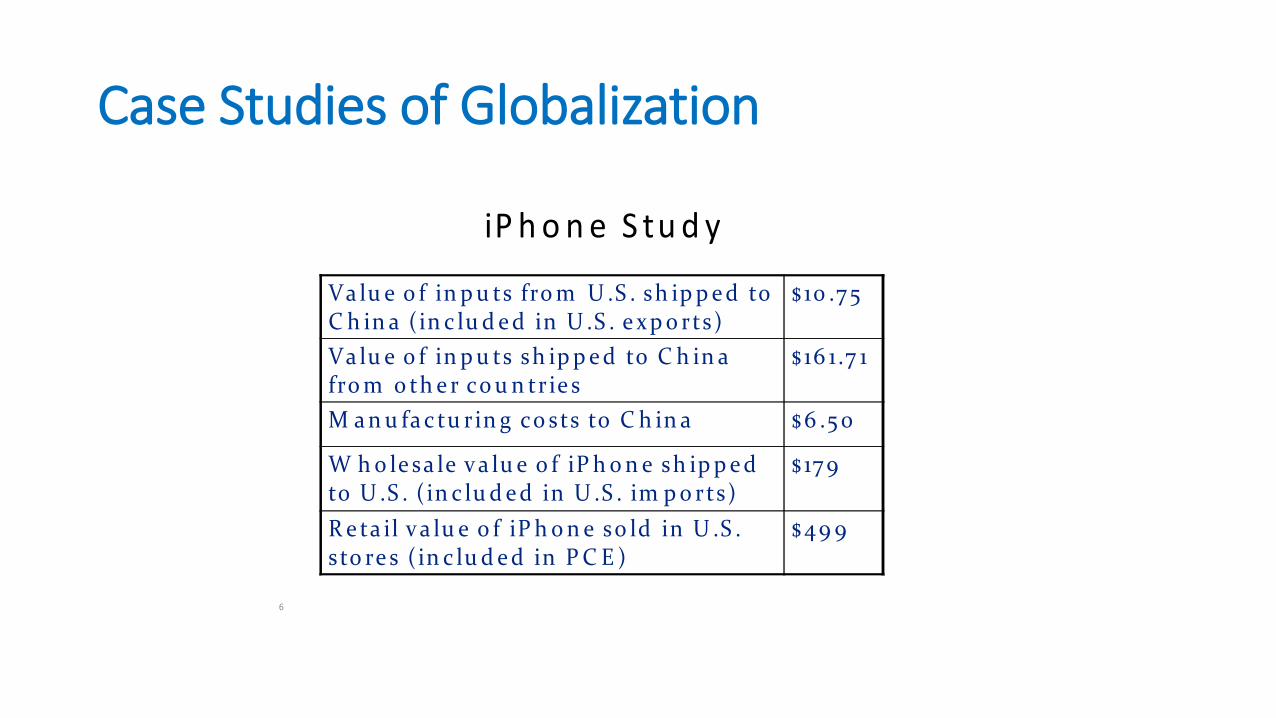
Case Studies of Globalization
6
iP h o n e S tu d y
Va lu e o f in p u ts fro m U .S . sh ip p e d to C h in a ( in c lu d e d in U .S . e x p o rts)
$ 10 .7 5
Va lu e o f in p u ts sh ip p e d to C h in a fro m o th e r co u n tr ie s
$ 16 1 .7 1
M a n u fa c tu r in g co sts to C h in a $6 .5 0
W h o le sa le v a lu e o f iP h o n e sh ip p e d to U .S . ( in c lu d e d in U .S . im p o rts)
$ 17 9
R e ta il v a lu e o f iP h o n e so ld in U .S . s to re s ( in c lu d e d in P C E )
$49 9
Case Studies of Globalization
• Gap Inc. imports 100% of the clothing that it sells in the United States.
• Yet an estimated 67 – 71 percent of the final sales value of Gap’s “products” are U.S. domestic value-added. (Christa Perez, United States Naval Academy, May, 2016)
The Need for Consistent Aggregate Estimates: Incomplete Picture of Dependencies and of “Lost” Jobs, Incomes, and Taxes
• Exporting jobs to China? (OECD estimates) • China's bilateral trade with the United States 1/3 smaller on a value-added
basis than on official gross flows
• One third of the content of China's exports comes from foreign inputs. • Assembly and processing of electronic components and products contributed to rise in
the foreign content of Chinese exports from 12 percent in 1995 to 33 percent in 2009
Importance of Global Trade to Domestic Non-Export Industries
• Services account for over half of total value-added exports for the United States, the United Kingdom, France, Germany and Italy (OECD). • Includes management, design, R&D, logistical, legal,
financial, and other services that are inputs into exports.
• Also, significant domestic transportation, wholesaling, advertising, and financing services involved in selling imported final goods and services imports.
• Profits from domestic sales of imports and from overseas affiliates account for a disproportionate share of U.S. MNC profits.
• Examples where value-added data would help • EU trade sanctions against footwear made in Asia when as much as 80% of
the valued-added from Asian-made footwear estimated to originate in EU.
• Current policy debate on tariffs, trade agreements, and taxation of overseas operations might be better informed by better information on the global interdependencies that are likely to be affected.
• Development policies that are overly focused on manufacturing may overlook the benefits of exploiting global supply chain services activities.
Trade, Investment, Tax and Development Policy
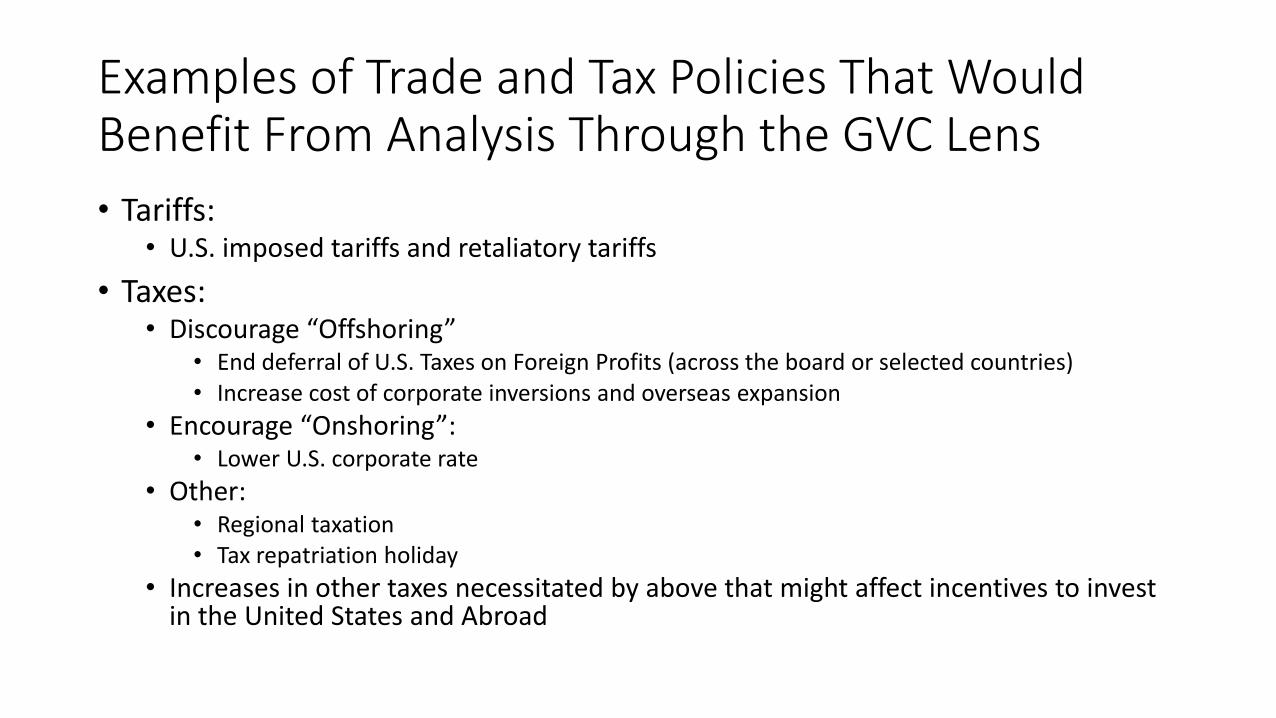
Examples of Trade and Tax Policies That Would Benefit From Analysis Through the GVC Lens
• Tariffs: • U.S. imposed tariffs and retaliatory tariffs
• Taxes: • Discourage “Offshoring”
• End deferral of U.S. Taxes on Foreign Profits (across the board or selected countries) • Increase cost of corporate inversions and overseas expansion
• Encourage “Onshoring”: • Lower U.S. corporate rate
• Other: • Regional taxation • Tax repatriation holiday
• Increases in other taxes necessitated by above that might affect incentives to invest in the United States and Abroad
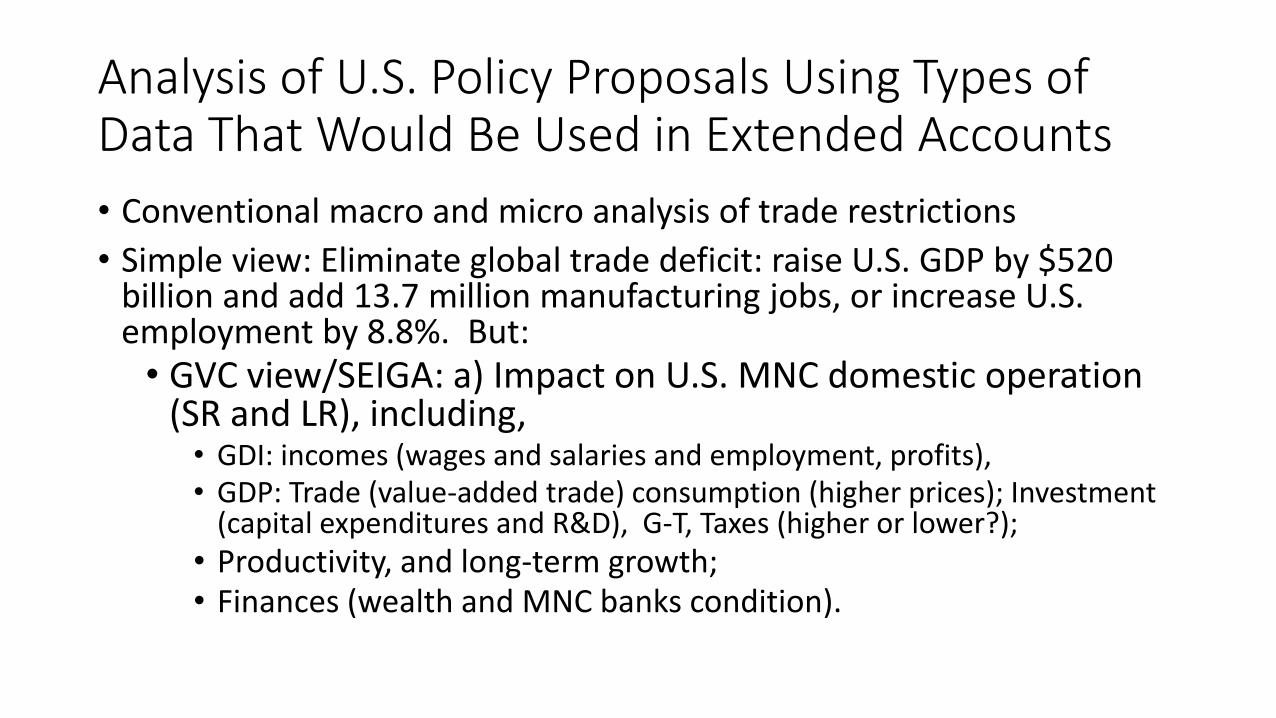
Analysis of U.S. Policy Proposals Using Types of Data That Would Be Used in Extended Accounts
• Conventional macro and micro analysis of trade restrictions
• Simple view: Eliminate global trade deficit: raise U.S. GDP by $520 billion and add 13.7 million manufacturing jobs, or increase U.S. employment by 8.8%. But: • GVC view/SEIGA: a) Impact on U.S. MNC domestic operation
(SR and LR), including, • GDI: incomes (wages and salaries and employment, profits), • GDP: Trade (value-added trade) consumption (higher prices); Investment
(capital expenditures and R&D), G-T, Taxes (higher or lower?); • Productivity, and long-term growth; • Finances (wealth and MNC banks condition).
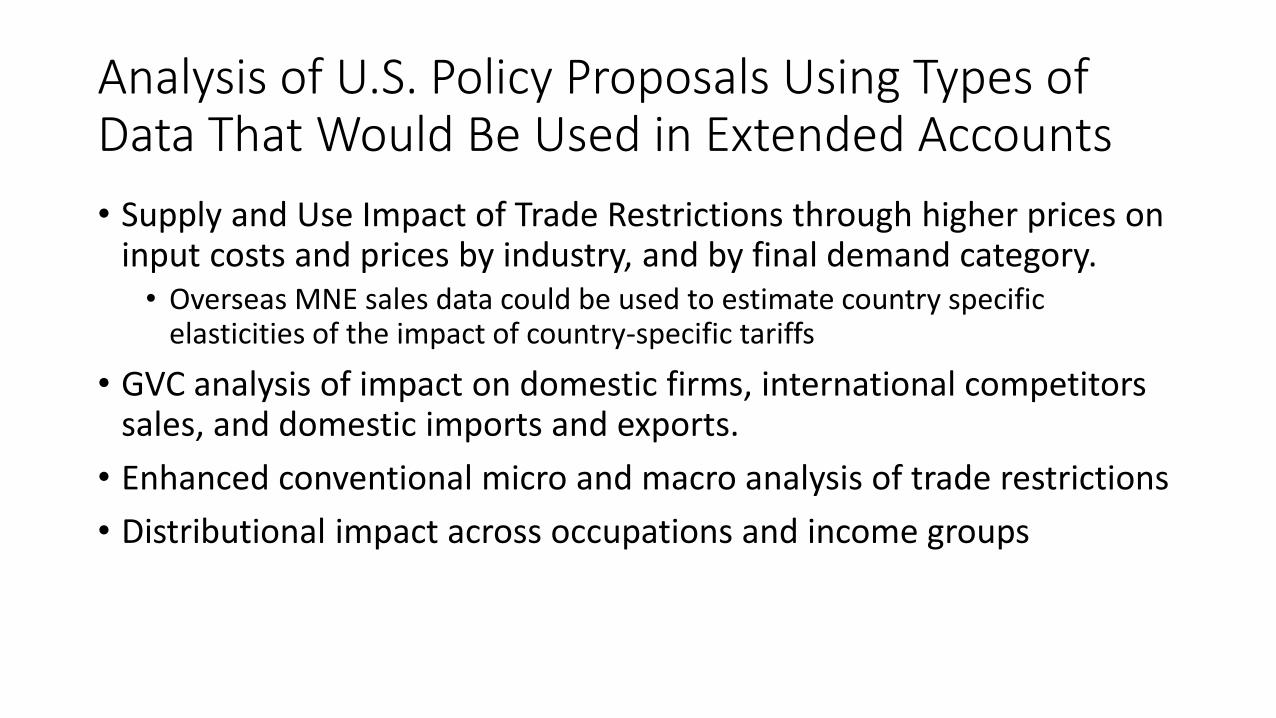
Analysis of U.S. Policy Proposals Using Types of Data That Would Be Used in Extended Accounts
• Supply and Use Impact of Trade Restrictions through higher prices on input costs and prices by industry, and by final demand category. • Overseas MNE sales data could be used to estimate country specific
elasticities of the impact of country-specific tariffs
• GVC analysis of impact on domestic firms, international competitors sales, and domestic imports and exports.
• Enhanced conventional micro and macro analysis of trade restrictions
• Distributional impact across occupations and income groups
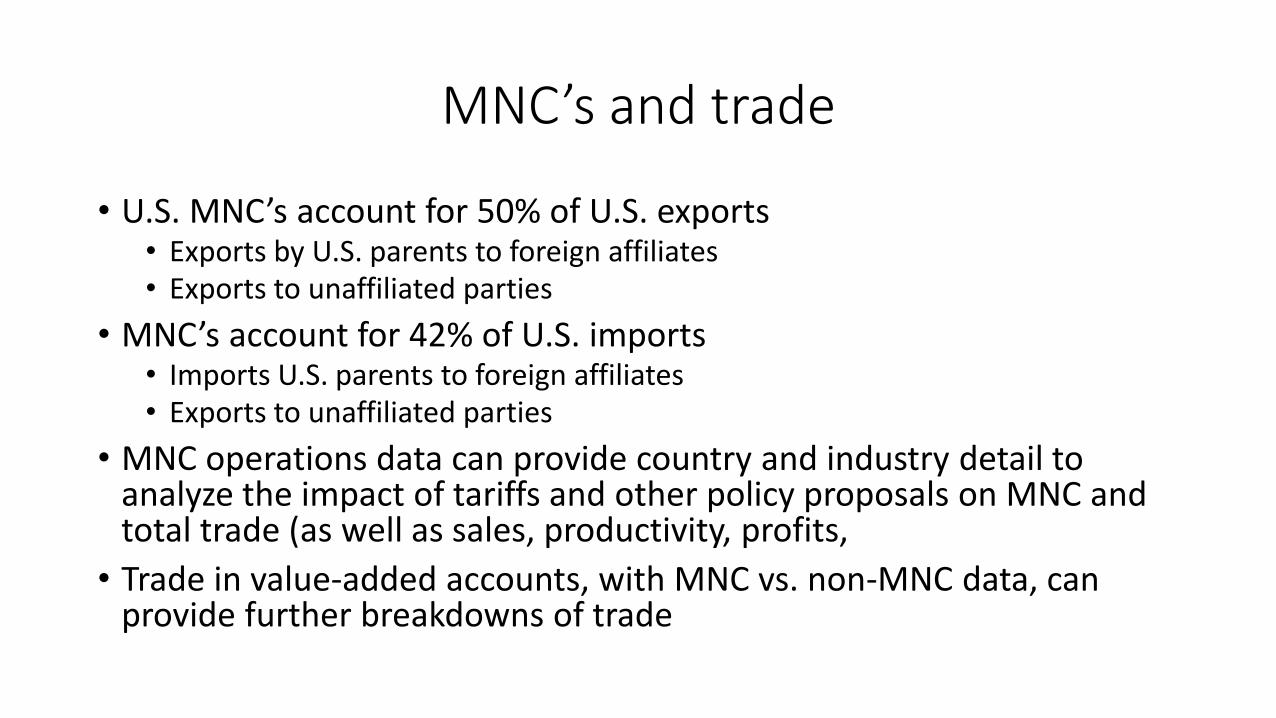
MNC’s and trade
• U.S. MNC’s account for 50% of U.S. exports • Exports by U.S. parents to foreign affiliates • Exports to unaffiliated parties
• MNC’s account for 42% of U.S. imports • Imports U.S. parents to foreign affiliates • Exports to unaffiliated parties
• MNC operations data can provide country and industry detail to analyze the impact of tariffs and other policy proposals on MNC and total trade (as well as sales, productivity, profits,
• Trade in value-added accounts, with MNC vs. non-MNC data, can provide further breakdowns of trade
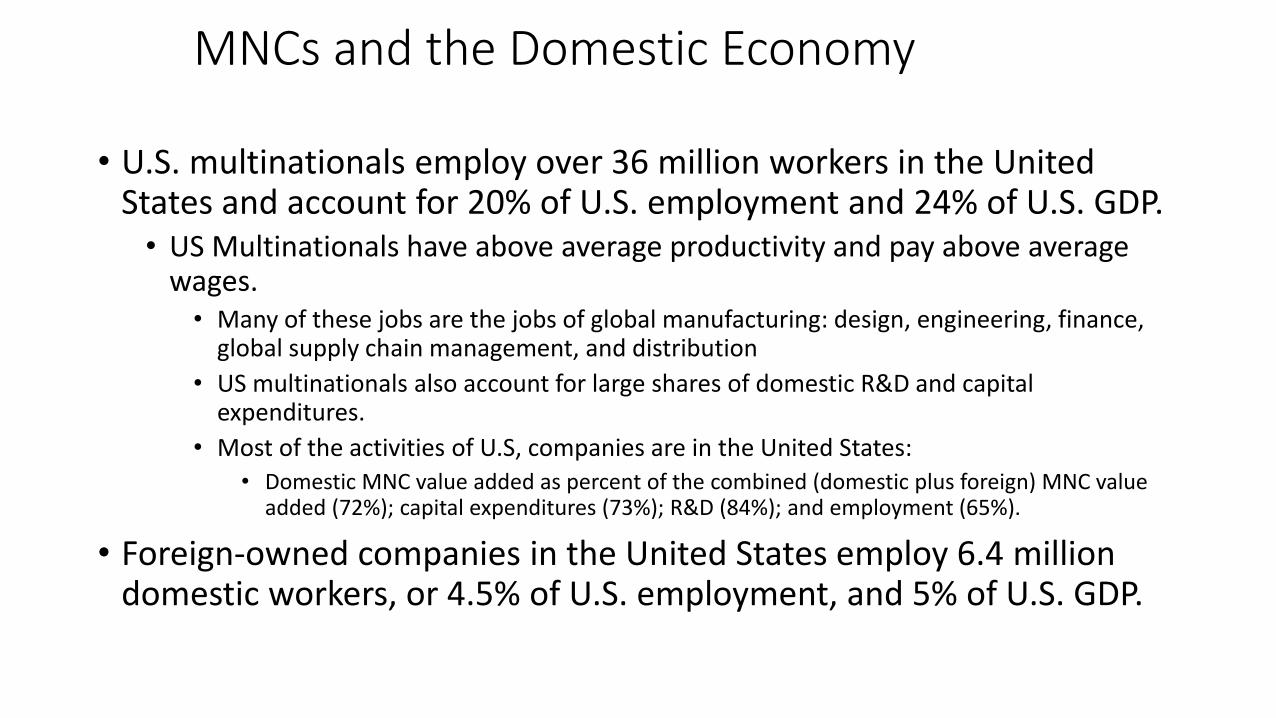
MNCs and the Domestic Economy • U.S. multinationals employ over 36 million workers in the United
States and account for 20% of U.S. employment and 24% of U.S. GDP. • US Multinationals have above average productivity and pay above average
wages. • Many of these jobs are the jobs of global manufacturing: design, engineering, finance,
global supply chain management, and distribution
• US multinationals also account for large shares of domestic R&D and capital expenditures.
• Most of the activities of U.S, companies are in the United States: • Domestic MNC value added as percent of the combined (domestic plus foreign) MNC value
added (72%); capital expenditures (73%); R&D (84%); and employment (65%).
• Foreign-owned companies in the United States employ 6.4 million domestic workers, or 4.5% of U.S. employment, and 5% of U.S. GDP.
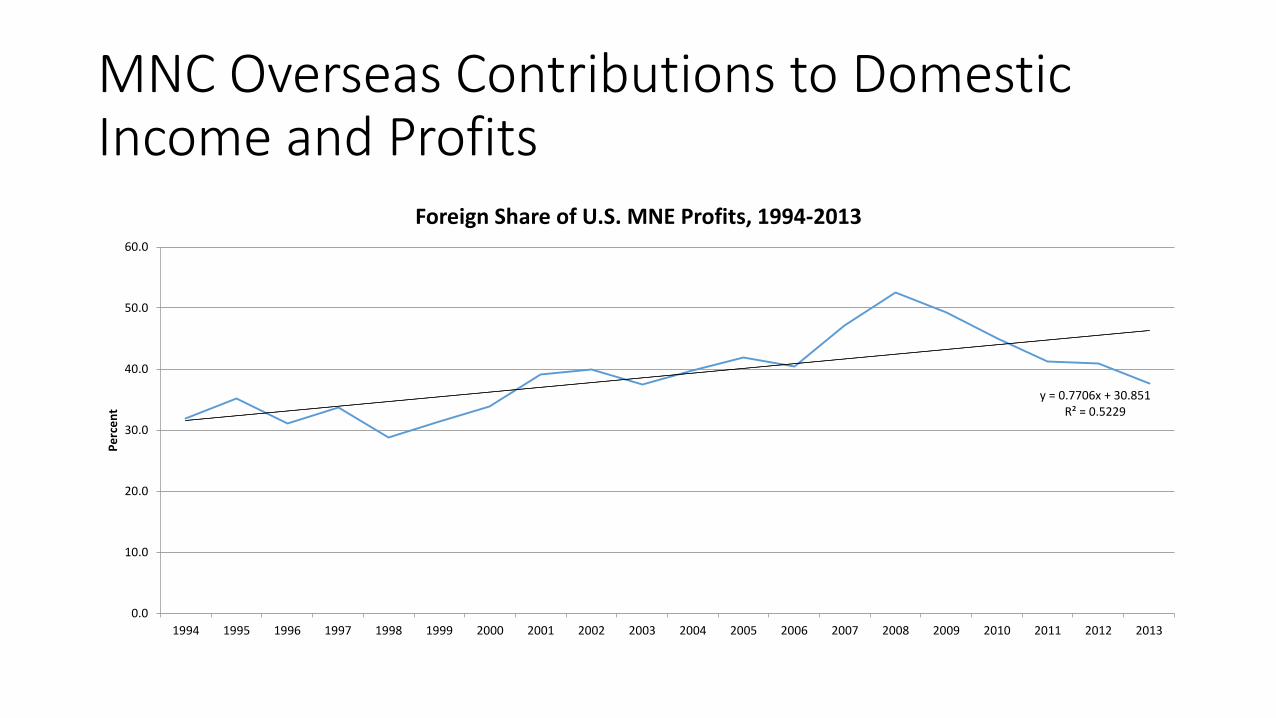
MNC Overseas Contributions to Domestic Income and Profits
y = 0.7706x + 30.851 R² = 0.5229
0.0
10.0
20.0
30.0
40.0
50.0
60.0
1994 1995 1996 1997 1998 1999 2000 2001 2002 2003 2004 2005 2006 2007 2008 2009 2010 2011 2012 2013
Pe
rce
nt
Foreign Share of U.S. MNE Profits, 1994-2013
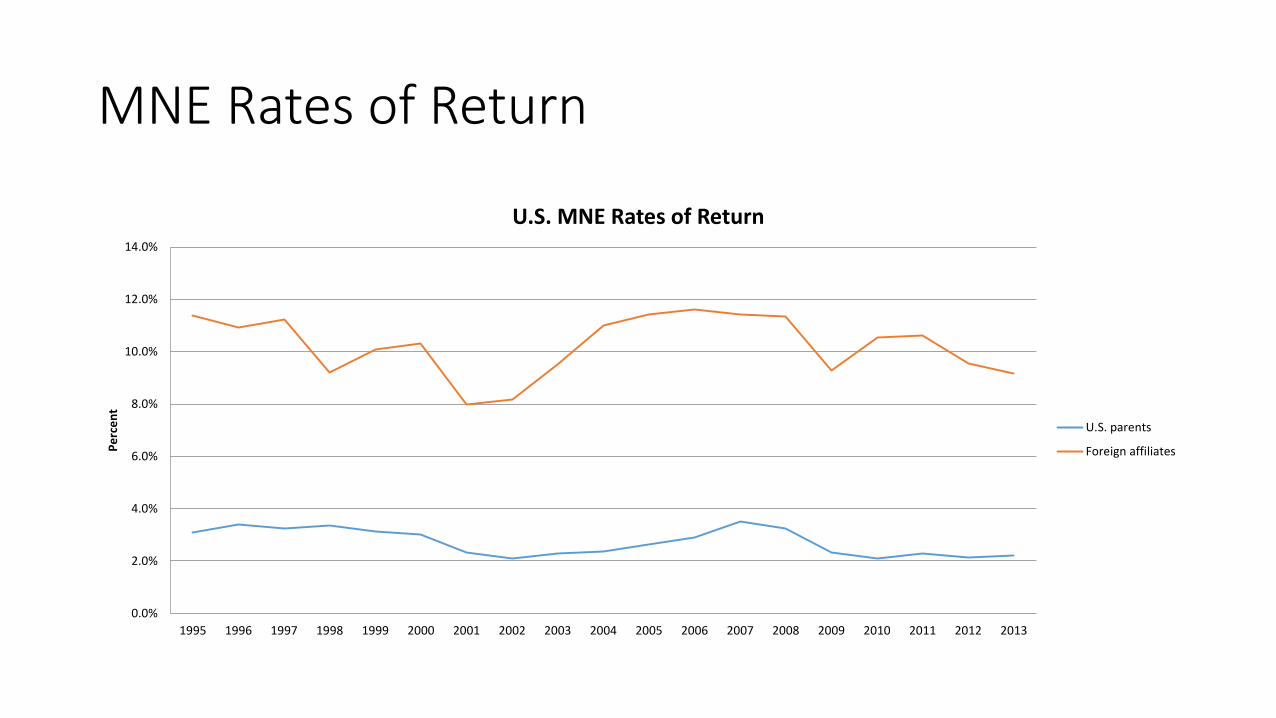
MNE Rates of Return
0.0%
2.0%
4.0%
6.0%
8.0%
10.0%
12.0%
14.0%
1995 1996 1997 1998 1999 2000 2001 2002 2003 2004 2005 2006 2007 2008 2009 2010 2011 2012 2013
Pe
rce
nt
U.S. MNE Rates of Return
U.S. parents
Foreign affiliates
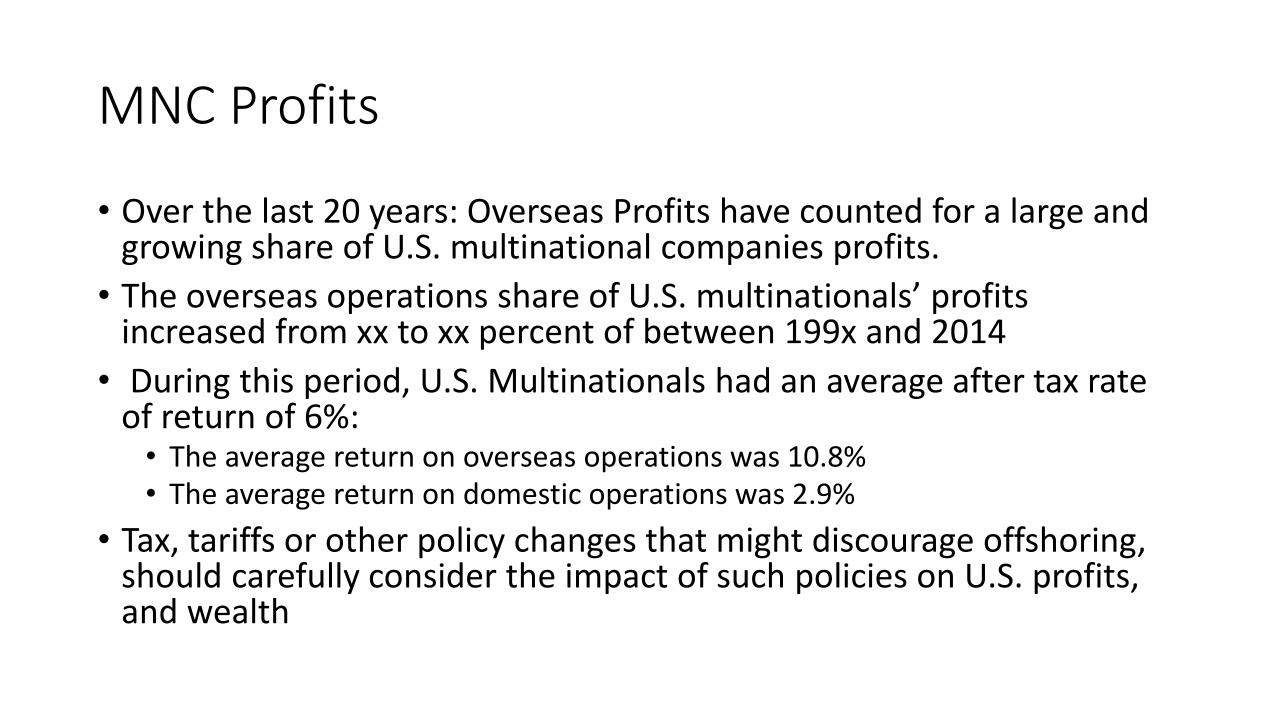
MNC Profits
• Over the last 20 years: Overseas Profits have counted for a large and growing share of U.S. multinational companies profits.
• The overseas operations share of U.S. multinationals’ profits increased from xx to xx percent of between 199x and 2014
• During this period, U.S. Multinationals had an average after tax rate of return of 6%: • The average return on overseas operations was 10.8% • The average return on domestic operations was 2.9%
• Tax, tariffs or other policy changes that might discourage offshoring, should carefully consider the impact of such policies on U.S. profits, and wealth
Jeffrey D. Sachs and Andrew Warner, “Economic Performance and the Process of Global Integration,” Brookings Papers on Economic Activity, (1995); pp Jeffrey A. Frankel and David Romer, “Does Trade Cause Growth?” American Economic Review, (June 1999); pp 379-399; pp 1-95.
United Nations Conference on Trade and Development, “Global Value Chains and Development: Investment and Value Added Trade in the Global Economy, 2013