Embed Size (px)
Citation preview

B E T T E R CROPS
W i l l P 1 A N I f i l l
I N T H I S I S S U I Nutrient Management Following CRP
Late-Season Potassium Deficiency in Soybeans
Starter Fertilizers for No-till Corn
and much more

B E T T E R CROPS
W I T H P I A N T F O O D
Vol. LXXX (80) 1996, No. 2
Our Cover: Planting corn with conservation tillage. Photo: Debra L. Ferguson Design: DesignRT
Editor: Donald L. Armstrong Assistant Editor: Katherine P. Griffin Editorial Assistant: Kari A. Couch Circulation Manager: Carol Mees
Potash & Phosphate Institute (PPI) J.U. Huber, Chairman of the Board
Kalium Chemicals CO. Dunn, Vice Chairman of the Board
Mississippi Chemical Corporation
HEADQUARTERS: NORCROSS, GEORGIA, U.S.A. D.W. Dibb, President B. C. Darst, Executive Vice President R.T. Roberts, Vice President C. V. Holcomb, Asst. Treasurer S.O. Fox, Executive Secretary W.R. Agerton, Communications Specialist S.K. Rogers, Statistics/Accounting
REGIONAL DIRECTORS-North America T.W. Bruulsema, Guelph, Ontario P.E. Fixen, Brookings, South Dakota A.E. Ludwick, Mil l Valley, California H.F. Reetz, Jr., Monticello, Illinois T.L. Roberts, Saskatoon, Saskatchewan C.S. Snyder, Conway, Arkansas W.M. Stewart, Lubbock, Texas N.R. Usherwood, Norcross, Georgia
INTERNATIONAL PROGRAMS Saskatoon, Saskatchewan, Canada
M.D. Stauffer, Senior Vice President, International Programs (PPI), and President, Potash & Phosphate Institute of Canada (PPIC)
J. Gautier, Dir., Admin. Serv.
INTERNATIONAL PROGRAM LOCATIONS Brazil-POTAFOS T. Yamada, Piracicaba China S.S. Portch, Hong Kong
J. Wang, Hong Kong Jin Ji-yun, Beijing Wu Ronggui, Beijing
India G. Dev, Dundahera, Gurgaon T.N. Rao, Dundahera, Gurgaon
Latin America J. Espinosa, Quito, Ecuador Mexico I . Lazcano-Ferrat, Queretaro Southeast Asia E. Mutert, Singapore
T.H. Fairhurst, Singapore
BETTER CROPS WITH PLANT FOOD (ISSN:0006-0089) is published quarterly by the Potash & Phosphate Institute (PPI). Second-Class postage paid at Norcross, GA, and at additional mailing offices (USPS 012-713). Subscription free on request to qualified individuals; others $8.00 per year or $2.00 per issue. POSTMASTER: Send address changes to Better Crops with Plant Food, 655 Engineering Drive, Suite 110, Norcross, GA 30092-2843. Phone (770) 447-0335; fax (770) 448-0439. Copyright 1996 by Potash & Phosphate Institute
C O N T E N T S
Potassium Research Boosts Cotton Production (California)
Robert 0. Miller, Bill Weir, Bruce Roberts, Ron Vargas, Dan Munk, Steve Wright, Doug Munier and Mark Keeley
3
Starter Fertilizers for No-till Corn (Illinois) K.B. Ritchie, R.G. Hoeft, E.D. Nafziger, L.C. Gonzini, J.J. Warren and W.L. Banwart
6
Research Notes: Phosphate Fertilizer Management
9
Late-Season Potassium Deficiency Symptoms in Southern Soybeans (Midsouth)
Cliff Snyder and Lanny 0. Ashlock
10
Conservation Tillage and Filter Strips Trap Potential Water Contaminants (Kentucky)
WO. Thorn and R.L. Blevins
12
Second Edition of Southern Forages Now Available
15
Proceedings Available • Nutrient Cycling in Forage
Systems Conference • Great Plains Soil Fertility Conference
15
Nutrient Management Following Conservation Reserve Program (Multi-Region)
Paul E. Fixen
16
Information Agriculture Conference Planned for July 30 - August 1, 1996
19
J . Fielding Reed PPI Fellowships Awarded to Seven Graduate Students
20
T.H. Fairhurst Named to PPI Staff in Singapore
22
T.N. Rao Joins PPIC-India Programme Staff as Agronomist
22
W.M. Stewart Now with PPI as Great Plains Regional Director
23
Dr. L . S . Murphy Resigns from PPI 23
PPI Communications Staff Changes Announced 23
Potassium Status and Soil Water Content of Grapevines on Fine Textured Soils (California)
M.A. Matthews, MJ. Sipiora and M.M. Anderson
24
International Soil Fertility Manual Now Available
27
Conversion Factors for Metric and U.S. Units 28
Research Shows Benefits of Liming to Correct Deep Soil Acidity (Australia)
Mark K. Conyers
29
Feast or Famine? J. Fielding Reed
32
Members: Agrium Inc. • Cargill, Incorporated • CF Industries, Inc. • Farmland Hydro, Inc. • Great Salt Lake Minerals Corporation
IMC Global Inc. • Kalium Chemicals • Mississippi Chemical Corporation • Potash Company of Canada Limited
Potash Corporation of Saskatchewan Inc. • Western Ag-Minerals Company

C A L I F O R N I A
Potassium Research Boosts Cotton Production By Rober t 0 . M i l l e r , B i l l Wei r , Bruce Robe r t s , Ron Vargas ,
Dan M u n k , Steve W r i g h t , Doug M u n i e r and M a r k Kee ley
Irrigated cotton is a major crop in California's San Joaquin Valley. In the past 20 years, new cultural production
techniques and cultivars have substantially increased yields. Recent research has focused on updating fertility management of the current high yielding Acala cotton varieties. A primary research focus has been late-season K deficiencies which limit lint yield on approximately one-fifth of the annual acreage (1.1 million acres in 1994).
Potassium deficiency has been identified as a compound problem, partially the result of the mineralogy of the subsoils of the San Joaquin Valley and partly related to cotton root physiology. Earlier California studies have associated cotton K deficiency with vermiculitic soils which strongly adsorb K, making fertilizer or crop residue K relatively unavailable.
Cotton root densities are significantly lower in the surface soil than crops such as barley, soybeans and corn. Studies have indicated that cotton root density and surface area are significantly greater at a soil depth of approximately 5 to 15 inches. For these reasons, late-season cotton K deficiency is attributed to high vermiculitic clay content and low available K in subsoils as well as cotton root systems of relatively low surface root density.
California studies show the
value of soil and plant peti
ole testing in predicting
potassium (K) response by
cotton in the San Joaquin
Valley. Subsoil samples (5 to
15 inches) provided the best
relationship. Greater than 60
percent K fixation in labora
tory studies was indicative
of K responding soils.
California Studies Field experiments were conducted at
a total of 30 locations in 1993 and 1994 in Merced, Kings, Fresno, Madera, Kern, and Tulare counties to evaluate seed/lint yield response to K fertilization. A l l loca
tions were planted to the Acala cotton variety Maxxa. Cultural production practices followed those of the individual producer. Fertilizer treatments were 0 and 400 lb/A of K 2 0 asKCl banded to a depth of six inches adjacent to the row at squaring. Previous research indicated significant lint yield responses to K 2 0 rates of this magnitude.
Preplant soil samples at each location at depths of 0 to 5, 5 to 15, and 15 to 30 inches were evaluated for available K using the following tests: 1.0 N ammonium acetate; Mehlich 3; ammonium bicarbonate-DTPA (AB-DTPA); 1.0 N boiling nitric acid; 1.0 N barium acetate; Unocal release rate test (a proprietary procedure); 0.02 N calcium chloride; sequential water washing; saturated paste water extraction; and resin exchange. Soil K fixation potential was measured by a method developed by California researchers.
Cotton petiole samples were taken for analysis at three phenological growth stages beginning at first bloom. The plots were harvested at maturity. Seed and lint yield and lint quality were determined.
Better Crops/Vol 80 (1996, No. 2) 3

TABLE 1. Effects of fertilizer K on Acala cotton i lint yields (partial listing).
Location Lint yield, lb/A
Control 400 lb K20/A
Yield change due to K, lb/A
93-4 1,643 1,761 118 93-6 1,143 1,438 295 * 93-10 1,567 1,815 248 * 93-11 1,370 1,509 139 93-12 762 1,131 369 * 93-13 1,107 1,263 156 * 94-1 1,475 1,645 170 94-5 983 1,085 102 94-7 1,419 1,664 245 * 94-9 1,373 1,529 156 * 94-10 1,396 1,578 182 * 94-11 1,436 1,558 122
San Joaquin Valley, CA ^Significant at P<0.05
Results There were significant l int yield
responses (P<0.05) to K fertilization at 4 of 16 locations in 1993 (Table 1). Control plot yields ranged from 747 to 1,728 lb/A. Average yield increase to 400 lb/A of K 2 0 on the responsive sites was 174 lb/A. Three of 14 locations produced a significant lint yield response (P<0.05) to K fertilization in 1994. The yield increase on the responsive sites averaged 165 lb/A.
The extractants that gave the best prediction of cotton yield response were 1.0 N ammonium acetate, Mehlich 3, 0.5 N AB-DTPA, and 1.0 N barium acetate. The extractants that did not correlate with yield in this study were nitric acid, saturated paste, resin exchange, and the Unocal procedure. Lint yield response was best predicted using soil samples from 5 to 15 inches, independent of the soil extractant utilized. The higher correlations of yield response to extractable K in subsurface samples is attributed to higher root density at this depth compared to surface samples, indicating the importance of this soil depth to K nutrition of cotton and probably to other nutrients as well. These results confirm previous research of Dr. Ken Cassman on similar soils in the San
Joaquin Valley. Based on Cate-Nelson sta
tistical analysis, the soil cr i t i cal value for the 5 to 15 inch depth separating responsive from non-responsive soils (95 percent maximum yield) is 110 parts per million (ppm) using the 1.0 N ammonium acetate (Figure 1) or the Mehlich 3 extractant. These two methods predicted l in t responses on approximately 80 percent of the responding sites. The AB-DTPA and barium acetate soil K extractants were equally good predictors of cotton lint yield response
based on the Cate-Nelson statistical analysis. The critical levels for these latter two extractants were 65 and 75 ppm, respectively. It is hypothesized that these four extractants are generally better due to their decreased propensity for extracting K from the clay minerals that is unavailable to the plants.
Cotton petiole concentrations of K at peak bloom were highly correlated with
o
2
"3
o DC
•
• •
• •
•
FIGURE 1.
Soil extractable K, 5 to 15 i n c h e s , ppm
Lint yield response of cotton to
fertilizer K relative to soil K
extractable by ammonium acetate,
5 to 15 inch depth.
San Joaquin Valley, CA.
4 Better Cmps/Vol. 80 (1996, No. 2)

MID-SEASON K deficiency is shown in this cotton
field in the San Joaquin Valley.
the subsoil (5 to 15 inch depth) K extracted with 1.0 N ammonium acetate and Mehlich 3. The relationship was best described using quadratic functions (data not shown).
The K fixing capacity of soil is also related to lint yield response. Soils that were capable of fixing more than 60 percent of applied K under laboratory conditions showed lint yield responses at a majority of responding locations (Figure 2). Soils with a K fixing capacity less than 60 percent, except for three site-year locations, did not have significant lint yield responses to K fertilizer. The one responding site which had less than 20 percent K fixation was also very low in clay and in ammonium acetate extractable K throughout its profile. These results suggest that subsoil K fixation is indicative of sites likely to respond to K fertilization. Further studies involving particle size analysis suggest that K fixation is generally associated with the fine silt fraction of these subsoils and is attributed to vermiculitic minerals.
Summary This research strongly supports an
integrated soil-plant analysis program which evaluates both soil K availability and K fixation potential in conjunction with in-
O O 20 40 60 80 100 BE
K fixation, %
FIGURE 2. Lint yield response of cotton to
fertilizer K relative to soil K fixation,
5 to 15 inch depth.
San Joaquin Valley, CA.
season petiole analysis in developing a K fertilizer management program for Acala cotton in the San Joaquin Valley of California. A soil testing strategy using pre-plant subsoil samples representative of the cotton root zone using standard soil K extractants is useful in predicting the probability of crop response to K fertilization.
This project is continuing with emphasis on fertilizer rate calibration. Additional work is planned to evaluate residual soil fertilizer K on subsequent cotton petiole K and lint yields and on K fixation by subsoils across the San Joaquin Valley.
Dr. Miller is Extension Soils Specialist, University of
California-Davis; Dr. Weir, Mr. Roberts, Mr. Vargas,
Mr. Munk, Mr. Wright and Mr. Munier are Extension
Farm Advisors, San Joaquin Valley, California. Mr.
Keeley is a research technician.
Acknowledgments — This work is supported by PPI,
Cotton Incorporated, and the California Department of
Food and Agriculture Fertilizer Research and Education
Program. The authors acknowledge the efforts of Mark
Keeley and Victor Huey in the collection and analysis of
plant and soil samples.
Better Crops/Vol. 80 (1996, No. 2) 5

Starter Fertilizers for No-till Corn
By K . B . R i t c h i e , R . G . H o e f t , E . D . N a f z i g e r , L . C . G o n z i n i ,
J.J. War ren and W . L . Banwar t
Illinois researchers recently investigated the potential for different starter fertilizer applications to enhance early
plant growth and yield in no-till corn in a three-year study at four locations. Their data confirm the value of starter fertilizer in no-till corn production in the central Corn Belt showing a high probability of a yield response, especially under adverse growing conditions.
The four study sites represented different climate/soil type/ crop rotation/soil test regimes (Table 1). Corn was planted at 35,000 seeds/A and stands were hand-thinned to 29,000 plants/A at the V6 growth stage.
Banded Starter Starter fertilizer, banded 2 inches to
Illinois studies add emphasis to
the value of starter fertilization
for no-till corn even when initial
soil phosphorus (P) and potas
sium (K) soil tests are high.
the side and 2 inches below the seed row (2x2) increased yields in 8 of the 9 site-years, regardless of the previous crop (Tables 2-4). When early season P and K soil test levels were near recommended minimums (or broadcast K was applied
preplant to bring soil test K to recommended levels), average yield increases were 8 bu/A for nitrogen (N) alone (25+0+0), 13 bu/A for N and P (25+30+0) and 14 bu/A for
N, P and K (25+30+20). Because starter fertilizer leads to more
vigorous early growth and earlier maturity, yield benefits from starter were more evident in the late-planted 1995 crop. Poor root growth in the top soil, plus low K levels deeper in the profile, probably caused the greater response to starter K at Ashton and
TABLE 1. Description of starter study 1 ocations.
Soil test, lb/A Site Soil type Previous crop pH Pi K Ashton Typic Argiudoll (sil) Corn 6.2 91 385 Grid ley Typic Argiudoll (sil) Soybean 6.4 31 245
Pana Udollic Ochraqualf (sil) Soybean 7.2 50 276
Oblong Aerie Ochraqualf (sil) Soybean 6.7 31 148
TABLE 2. Effect of 2x2 banded starter fertilizer on no-till i com grain yield (1993).
Starter, lb/A Location/Yield, bu/A N P 2 0 5 K 20 Ashton Gridley1 Pana Oblong 0 0 0 122 171 187
25 0 0 131 175 194
25 30 0 142 185 196
25 30 20 138 178 196
1Gridley location lost due to herbicide injury.
6 Better Crops/Vol 80 (1996, No. 2)

STARTER FERTILIZER provides an important boost for early season growth
of no-till corn, even when soil test P and K levels are high. In these
plots, the center four rows received no starter, but areas on left and
right show increased growth with starter.
Gridley in 1995. These locations did not receive preplant broadcast K.
Seed-placed Starter The comparison of 2x2-placed and
seed-placed (direct seed contact) starter fertilizers is summarized in Table 5. Plant growth and grain yield were more consistently increased when starter fertilizer was 2x2-banded instead of seed-placed. There was no difference between dry and liquid fertilizer materials when they were applied at equivalent nutrient rates. Nitrogen fertilizer with a high salt
content (ammonium nitrate) or ammonia-releasing compounds (urea, DAP) slowed emergence with seed-placement. Potassium chloride and potassium sulfate gave similar results. Yield responses to dry starter occurred when at least 10 lb/A of N plus P 2 0 5 were applied, but these rates slowed emergence in 1994 and 1995 at some locations. Seed-
placed 10-34-0 and 9-18-9 liquid fertilizers applied at rates of 10+34+0 and 10+20+10, respectively, did not adversely affect emergence, and yielded the same as 2x2-banded 25+30+20 in 1993 and 1994, but yielded 12 bu/A less at 2 of 3 locations in 1995.
Seed-placed fertilizers should be used with caution. Injury from seed-placed fertilizer was greatest in 1995 when weather was warm and dry after planting. Even though the liquid materials did not slow emergence, there was some
TABLE 3. Effect of 2x2 banded starter fertilizer on no-till I corn grain yields I 1994).
Starter, lb/A Location/Yield, bu/A N P 2 0 5 K20 Ashton Gridley Pana1 Oblong2
0 0 0 177 128 136 136 25 0 0 189 139 152 129 25 30 0 191 142 151 136 25 30 20 189 146 141 150
Severe flooding at Pana. 2Soil test K at Oblong was very low; no broadcast K in 1994.
TABLE 4. Effect of 2x2 banded starter fertilizer on corn grain yield (1995).
Starter, lb/A Location/Yield, bu/A N P 2 O 5
K 2 0 Ashton Gridley Pana1 Oblong 0 0 0 95 111 77 116
25 0 0 104 107 81 127 25 30 0 108 117 81 134 25 30 20 112 128 80 134
1Severe flooding at Pana.
Better Crops/Vol 80 (1996, No. 2) 7

THE AREA in the center of this photo received 10 lb/A N as urea in direct
seed contact. Note the reduced stand compared to adjacent areas
which received no urea N. Urea should be avoided in seed-placed
starters for corn.
growth stunting at the V I growth stage. Greenhouse studies have also shown leaf tip burning and twisting with both 10-34-0 and 9-18-9 at rates of 10+34+0 and 5+10+5, respectively. The lower rates of seed-placed fertilizer (10-15 lb/A N + K 2 0 ) that can be safely used are not always
enough to provide maximum yield benefits.
Surface-applied Starter Dribbling (surface
bands) or broadcasting N (25+0+0) or N + P (25+64+0) improved yields by the same amount as liquid seed-placed fertilizers at 4 of 6 site-years. However, l iq uid seed-placed treatments out yielded the surface applications by more than 8 bu/A at 2 of the 6 site-years, and the
2x2 banded 25+30+20 yielded 11 bu/A more than the surface-applied starter treatments in 4 of 6 site-years.
Conclusions 1. Inclusion of both N and P (25+30+0)
in a 2x2-banded starter increased
TABLE 5. Effect of seed-placed and banded starter fertilizer on no-till corn grain yields (1993-1995).
Starter, lb/A Ashton P 2 0 5 K 20 Source1 3 years
Location/Yield, bu/A Gridley Pana 2 years 1993
Oblong2
3 years
No starter 0 0 124 122 138 142
Dry starter 10 10 0 AN TSP 135 128 143 149 10 10 10 AN TSP KCI 136 126 139 152 10 26 0 DAP 141 126 134 150
Liquid starter 5 10 5 9-18-9 133 128 140 149
10 20 10 9-18-9 135 130 126 152 5 17 0 10-34-0 132 124 134 152
10 34 0 10-34-0 141 120 141 155
2x2 Banded 10 10 10 AN TSP KCI 143 131 135 150 25 30 20 AN TSP KCI 142 138 137 150
1 AN = Ammonium nitrate; TSP = triple superphosphate; KCI = potassium chloride; DAP = diammonium phosphate. 2Soil Ktest at Oblong was very low, no broadcast K applied in 1994.
8 Better Crops/Vol. 80 (1996, No. 2)

early season plant growth and corn yield, even when initial soil P and K tests were high. About two-thirds of the increase could be attributed to N. The starter response was greatest and most consistent in 1995, when late planting and adverse growing season conditions were experienced.
2. Seed-placed fertilizers increased early growth and yield, but increases were not as great as for banded starter fertilizer. Liquid starter fertilizers with low salt indices did not slow emergence. Seed placed fertilizers should not be used in sandy soils, but can be used in heavier soils at rates less than 10-15 lb/A of N + K 2 0 . Urea or urea-containing formulations should not be placed near the seed.
3. Dribbling fertilizers on the soil surface near the seed furrow resulted in
higher average yields than no starter controls, but yield increases were not statistically significant and were not as high or as consistent as the 2x2 banded or seed-placed fertilizers.
4. Yield ranking of the starter treatments tested, averaged over all locations was: 2x2 banded>seed-placed liquid>surface dribble>no starter. D9
KB. Ritchie, R.G. Hoeft, E.D. Nafziger, L.C. Gonzini
and J.J. Warren are with the Department of Crop
Sciences, and W.L. Banwart is with The Department of
Natural Resources and Crop Sciences, University of
Illinois, Urbana-Champaign.
Funding for this research was provided by the
Fertilizer Research and Education Council, Illinois
Department of Agriculture, from the state fertilizer
check-off program. Adapted from 1996 Illinois
Fertilizer Conference Proceedings, January 29-31,
1996, Peoria, IL.
Phosphate Fertilizer Management for Soybeans in Two Tillage Systems Management of phosphorus (P) fertilizer
for soybean production on calcareous soils that have low or very low soil P test levels has not been fully researched. The possibility of applying P prior to the soybean crop instead of the corn crop may offer potential for added profit. A study at the University of Minnesota West-Central Experiment Station, begun in the fall of 1994, is evaluating the impact of major factors (tillage system, row spacing, P placement, P rate, frequency of P application) on the yield of both soybeans and corn in rotation. Soil test P levels prior to the study were 2.3 parts per million (ppm) Bray P- l and 4.3 ppm Olsen. Soil pH was 7.8.
Higher yields were recorded with the fall chisel tillage system and the use
TABLE 1. Relevant soil test values for the experiment site.
pH 7.8
Phosphorus (Bray), ppm 2.3
Phosphorus (Olsen), ppm 4.3
Potassium, ppm 166.0
of narrow (7-inch) rows. For both tillage systems, broadcast rather than fa l l banded P produced the higher yield. Regardless of P placement, row spacing and tillage system, yields increased as rate of applied P increased. Residual effect of the biennial application wil l be measured with corn.
Source: Dr. George Rehm, Extension Soil Scientist,
Department of Soil, Water, and Climate,
University of Minnesota, St. Paul, MN.
Better Crops/Vol. 80 (1996, No. 2) 9

M I D S O U T H
Late-Season Potassium Deficiency Symptoms in Southern Soybeans
Soybeans are exhibiting
changes in potassium (K) defi
ciency symptoms that result
from heavy K demand later in
the growing season.
By C l i f f Snyder and Lanny 0 . A s h l o c k
Symptoms of K deficiency in soybeans have characteristically occurred on lower leaves because K is redistrib
uted from older plant parts to newer ones throughout the season. As the severity increases, the symptoms extend up the plants. Potassium deficiency has also been shown to occur in the young leaves at the top of high-yielding, fast maturing crops such as cotton and wheat. In recent years, symptoms of K shortage have also been observed in the middle and upper canopy of soybeans on soils testing low in K (below 100 lb/A Mehlich 3 K). This should not be too surprising since soybeans accumulate 60 to 80 percent of their K needs after flowering, and higher crop yields are placing an increased demand on the available soil K supply.
Soybeans are often planted earlier now in the South, with the adoption of more reduced tillage systems and increased pro ducer accep-
and early seed development. Planting of early-maturing varieties in Apri l results in an earlier maturity and harvest. Most of these newer early-maturing soybean varieties used in the South also have semi-determinate and/or indeterminate charac
teristics, which means that the plants wi l l continue to make some vegetative growth after they begin to flower. Continued vegetative growth at the time of reproductive growth may
affect the K redistribution in plants that are low in K. The end result can be K deficiency in the upper leaves of plants instead of the lower leaves. This situation can be intensified i f there is limited seed development in the lower canopy and a heavy, rapid seed development occurs in the upper canopy. Periodic intervals of drought stress during rapid seed development can contribute to the late-season K deficiency.
Upper-leaf K deficiency should not be confused with chloride
tance of the Early Soybean P r o d u c t i o n System (ESPS). The ESPS allows the grower to reduce the risk of damage from summer droughts during peak blooming SOYBEAN FIELD in eastern Arkansas with late-season K deficiency.
(CI) toxicity, which has very similar symptoms. Chloride t o x i c i t y appears as marginal leaf y e l l o w i n g , often beginning at the leaf tips, turning
10 Better CropsWol. 80 (1996, No. 2)

POTASSIUM-DEFICIENT leaves from the four uppermost
nodes of a late season affected soybean plant. Leaf
K was 0.45 percent; leaf CI was 2,265 ppm.
rapidly to brown, dry leaves which prematurely drop. Leaf CI levels of about 20,000 parts per million (ppm) are considered toxic to most varieties. Field documentation of Cl-toxicity in the Midsouth has shown that irrigation wells are the principal sources of CI. The application of waters high in CI, on soils with poor internal drainage, can allow CI to build to levels that can be toxic to certain soybean varieties classified as Cl-includers. Chloride-excluding varieties usually have leaf CI levels below 10,000 to 20,000 ppm and are less sensitive to CI toxicity. Potassium deficiency is a much greater hazard than CI toxicity on the vast majority of silt loam soils supporting soybeans, rice and wheat.
Potassium deficient plants may suffer these complications: 1) reduced photosynthesis, 2) reduced transpiration and reduced leaf cooling, which results in great susceptibility to drought stress; and 3) increased leaf sugar levels, which invite disease. Low K can lead to reduced yields and seed quality from pod and stem blight, caused by the fungus Diaporthe sojae L., and purple seed stain caused by Cercospora kikuchii L.
Soil testing and plant analysis should
COMPARE K-DEFICIENT leaves with these healthier
leaves from four uppermost nodes of soybean
plants in same field. Leaf K was 0.67 percent; leaf CI
was 2,007 ppm in the healthier plants.
be used to confirm K deficiency. Research has shown that K can be applied as late as early pod development (R3-R4) on a soil testing low in K and still increase yields as much as 7 to 9 bu/A with adequate rainfall or irrigation.
Prevent K deficiency by applying pre-plant and/or side-dressed K according to soil tests. If deficiency symptoms begin to develop, conduct diagnostic soil and leaf tests to identify the problem. Remember to consider factors such as soil acidity, compaction, nematodes, and root diseases. Once deficiency symptoms occur, some yield potential has already been lost.
Good growing conditions in the South in 1992 and 1994 resulted in record soybean yields on well-managed fields. High yields remove large quantities of K...a 60 bu/A yield removes more than 80 lb of K 2 0 . The harvested K must be replaced by fertilization to sustain future soil productivity and crop production. Potassium needs should be provided in balance with other required plant nutrients. 113
Dr. Cliff Snyder is PPI Midsouth Director, Conway,
AR. Dr. Lanny Ashlock is Extension Agronomist -
Soybeans, Arkansas Cooperative Extension Service,
Little Rock.
Better Crops/Vol. 80 (1996, No. 2) 11

K E N T U C K Y
Conservation Tillage and Filter Strips Trap Potential Water Contaminants
By W.O. Thorn and R . L . B l e v i n s
The question of potential contamination of rivers, streams and other natural water bodies with sediment,
nutrients and pesticides in agricultural runoff is an important water quality issue. Conservation tillage is effective in decreasing soil exposure to rainfall, thus decreasing runoff and sediment. Vegetative filters slow runoff, thus allowing sediment, nutrients and pesticides to deposit. Combining the advantages of both should lead to maximum contaminant removal.
Kentucky Studies Two studies were conducted on land
with 9 percent slope to evaluate the movement of sediment, nutrients and pesticides from cropland and trapping by vegetative filters under simulated rainfall conditions. In the first study, 150 lb/A nitrogen (N) as ammonium nitrate, 92 lb/A P2O5, and 2 lb a.i. atrazine/A were broadcast 24 hours before a rainfall simulator applied 2.5 in/hour for 2 hours total (1 hour rain, 24 hours rest, 30 min. rain, 30 min. rest, and 30 min. rain). Tillage treatments were no-till (NT), chisel plow (CP), and conventional tillage (CT). In the second study, trapping efficiency of a fes-cue-bluegrass mixture was evaluated with three filter lengths (15, 30 and 45 feet) below either no-till or conventional tillage areas receiving 150 lb N/A as ammonium nitrate and 2 lb a.i. atrazine/A 24 hours
Recent research shows that
conservation tillage and vege
tative filter strips are highly
effective in reducing sediment,
nutrient and pesticide losses
in runoff.
before 2.5 inches of simulated rain, then three weeks rest, and 2.5 inches more rain.
In the first study, runoff volume, sediment, nitrate-nitrogen (NO3-N) , ammonium-nitrogen (NH 4-N), phosphorus (P) and atrazine were reduced with decreased
tillage intensity (Table 1). The NT had no runoff and no sediment during the first rain event (R l ) . During the second rain event (R2) the NT had some runoff but still no sediment. Compared with
CT, the NT reduced sediment by 98 percent, and the CP reduced it by 79 percent.
Lower runoff volumes with decreased tillage intensity reduced the losses of NO3-N, NH 4 -N , P and atrazine. The NT system reduced NO3-N losses by 86 percent and 71 percent compared with CT and CP, respectively. More modest reductions in N H 4 - N loss were evident for NT compared to CT (58 percent) and CP (38 percent). Total N loss, related to that applied, ranged from 0.6 percent for NT to about 2.9 percent for CT.
Total P loss was greatest from CT even though P concentration in the runoff was higher from the NT system, clearly indicating that the greater P loss from CT was due to the higher runoff volume. The total P loss for CT was 75 percent and 125 percent greater than CP and NT, respectively. The N and P losses expressed as a percentage of the total N and P fertilizer applied could have come from: (1) N and P loosely bound to the sediment that was
1 2 Better Crops/Vol. 80 (1996, No. 2)

TABLE 1. Runoff volume and losses of sediment, nitrate-nitrogen, ammonium-nitrogen, P and atrazine as affected by tillage and simulated rainfall.
Tillage system Rainfall event R1 R2 R3 Total
runoff volume, inches NT — 0.05 0.25 0.30a CP 0.12 0.32 0.70 1.14b CT 0.37 0.60 0.80 1.77b
sediment loss, tons/A NT — 0.00 0.13 0.13a CP 0.22 0.62 0.67 1.51b CT 1.47 2.27 3.17 6.91c
nitrate-nitrogen loss, lb N/A NT — 0.09 0.36 0.45a CP 0.27 0.45 0.80 1.52b CT 0.98 1.07 1.16 3.21c
ammonium-nitrogen loss, lb N/A NT — 0.09 0.36 0.45A CP 0.27 0.18 0.27 0.72B CT 0.45 0.36 0.27 1.08C
P loss, lb/A NT — <.01 0.27 0.28a CP 0.09 0.09 0.18 0.36ab CT 0.27 0.18 0.18 0.63b
atrazine loss, g/A NT — 1.40 5.40 6.8a CP 4.2 3.10 4.70 12.0ab CT 10.9 2.60 3.10 16.6b
Totals followed by small letters are significantly different at P<.05; totals followed by capital letters are significantly different at P<.10.
lost, but that was readily exchanged, (2) N and P loosely associated with organic matter or exchanged from organic matter, and/or (3) N and P from the applied fertilizer. So the actual percentage loss from the fertilizer applied may have been slightly less than the numbers shown when one considers the other sources of soluble ammonium, nitrate, and P loss in the system.
The total soluble NH 4 -N and N 0 3 - N loss in the CT treatment was 2.9 percent of the total N applied as ammonium nitrate. This loss was nearly two-fold greater than in the CP treatment and nearly five-fold greater than in the NT treatment. The actual soluble P loss (as phosphate) was 1.6 percent of the total P
applied with the fertilizer in the CT, 0.9 percent in the CP, and 0.7 percent in the no-till treatment. The higher total atrazine loss from CT was related to the higher runoff volume. The NT system reduced atrazine losses by 43 percent compared with CP, and 60 percent compared with CT.
In the second study, the vegetative filter strips were very effective in trapping sediment, water, N O 3 - N and atrazine that left either NT or CT areas above the filters when channelization in the filters was not present (Table 2). A l l efficiencies were above 90 percent for the four parameters, indicating a high trapping capacity for all lengths. The 30 foot filters were slightly more effective with time than the 15 foot
Better Cwps/Vol. 80 (1996, No. 2) 13

length, which was attributed to the greater length and area. The development of rivulets in the 45 foot filters directed runoff into a few prominent small channels which had the most noticeable effect on water trapping. Overall, the 30 foot f i l ters had the greatest trapping efficiency for water and all contaminants. However, it appeared that the most effective combination of tillage and filter was NT with the 45 foot filter (data not shown).
The small reductions or no change in trapping of contaminants, compared to a larger change in water trapped, suggested that the contaminants were filtered out more effectively than water. Even though N 0 3 - N fertilizer and pesticides were broadcast just before simulated rainfall, very little of these components left the f i l ters regardless of length, and particularly when grass height was maintained at 2 inches. On-farm vegetative filters are more likely to be maintained at greater heights with longer time intervals between clipping.
Summary In conclusion, these studies indicate
that as tillage intensity decreased (CT>CP>NT), the losses of runoff water, sediment, NO3-N, NH 4 -N , P and atrazine were significantly decreased. The 30 foot filters were more consistent than 15 foot filters in reducing water volume, sediment, NO3-N and atrazine.
As crop producers embrace no-till systems these data suggest that contaminants
RESEARCH with a rainfall simulator has found sig
nificant benefits from use of vegetative filter
strips to reduce runoff of potential water contam
inants from crop fields.
in runoff water will be significantly reduced compared to more conventional tillage systems. Vegetative filters can be highly useful in removing additional contaminants from cropland using any type of tillage system but should provide the cleanest runoff when combined with no-till. D9
Dr. Thorn is Extension Specialist and Dr. Blevins is
Professor, Department of Agronomy, University of
Kentucky, Lexington, KY 40546.
TABLE 2. Mean trapping efficiency of vegetative filters for four components lost from cropped plots (mean of NT and CT).
Filter width Sediment Water
15 ft 96 96 30 ft 99 97 45 ft 99 91
Nitrate-nitrogen
94 98 97
Atrazine
93 99
1 4 Better Crops/Vol. 80 (1996, No. 2)

Second Edition of Southern Forages Now Available
S outhern Forages, Second Edition, was released in March 1996 and updates
and expands the information presented in the first edition (1991). It remains a modern, practical book which focuses on forage crops. The book emphasizes practical aspects of forage production and is written for a variety of audiences. It can be used by individuals or as a text for forage courses in colleges and universities to provide students with a better understanding of forage production.
Authors of the book are: Dr. Donald M. Ball, Extension Agronomist/Professor, Auburn University; Dr. Carl S. Hoveland, Terrell Distinguished Professor of Agronomy, University of Georgia; and Dr. Garry D. Lacefield, Extension Agronomist/
Professor, University of Kentucky. While the content is focused
on forages for the southern area of the U.S., many of the principles and species are also adapted for other regions. Chapters discuss beef, dairy, sheep, horses and other livestock/forage systems. Wildlife, soil conserva
tion, and environmental benefits of forages are also emphasized.
Individual copies of Southern Forages are $25.00 plus $4.00 shipping and handling. To order a single copy, send a check payable to Potash & Phosphate Institute for $29.00 to: PPI, 655 Engineering Drive, Suite 110, Norcross, GA 30092-2843. Please call (770) 447-0335, ext. 213 or 214 for multiple copy orders. EI
Proceedings Available Nutrient Cycling in Forage Systems Conference: A conference sponsored by the Center for Pasture Management, Utilization and Ecology of the University of Missouri was held in Columbia, MO, March 7-8, 1996. Program topics included recycling livestock manure, fertilization and nutrient utilization in harvested forage systems, nitrogen cycling in pasture systems, inorganic nutrient availability and utilization by grazing livestock, and environmental impacts of pasture systems on surface water quality.
Copies of the proceedings are available at a price of $15.00 (U.S. funds).
Great Plains Soil Fertility Conference: Focal topics at the biennial Conference held in Denver, CO, March 5-6, 1996 included precision farming and site-spe
cific management; fertilizer management for Great Plains dryland cropping systems; cadmium issues and concerns; residue distribution in soils with varying cropping intensity; row spacing, seeding rates and phosphorus in cereals; the importance of phosphorus in wheat forage production; long-term tillage and fertilization effects on crop production in dryland systems; and influence of cropping/tillage management on soil fertility on former CRP land.
Copies of the proceedings are available at a cost of $20.00 (U.S. funds).
To order either of the proceedings described above, send payment to: PPI, 655 Engineering Drive, Suite 110, Norcross, GA 30092-2843, phone (770) 447-0335, ext. 213 or 214. ^ El
Better Crops/Vol 80 (1996, No. 2) 15

M U L T I - R E G I O N
Nutrient Management Following Conservation Reserve Program
By Pau l E. F i x e n
The major nutrient concern for reactivated CRP land is the effect of plant residues on nitrogen (N)
management. The quantity of residue accumulated in CRP fields can be large. For example, researchers have estimated above-ground levels of 4 to 5 tons/A for a bromegrass CRP field in northeast Nebraska.
Grass residues grown in low nitrogen (N) environments usually have wide carbon to nitrogen ratios (C:N) compared to soil microorganisms or stable organic matter (Table 1). I f the C:N ratio is greater than 30:1, soil or fertilizer N can be temporarily immobilized during residue decomposition.
The traditional illustration of this concept was developed by Sabey (Figure 1). Initially, the increase in energy supply caused by the residue addition stimulates
TABLE 1. Carbon to nitrogen ratios of organic materials.
Nutrient management wil l be
just one of the challenges
faced by farmers in bringing
Conservation Reserve
Program (CRP) land back into
production. The potential for
crop nutritional problems does
exist and could reduce yields
and profitability.
microbial activity as indicated by the increased C 0 2 evolution. The growing population of heterotrophic microorganisms removes nitrate-N (N0 3 -N) from the soil and the N 0 3 - N level is depressed until the energy supply is exhausted. At
this point, the microbes die and their decomposing bodies gradually return soil NO3-N to a level higher than it was initially.
The overall contribution of the residue to plant available N is positive, but a period of depressed N availability occurs along the way. The critical ques
tion related to N management following CRP is: How deep is the depression period and how long does it last? Even though Figure 1 shows 4 to 8 weeks, the actual duration is probably much more variable. Depth and duration wi l l depend primarily on the quantity of residue, the actual C:N ratio of the above- and below-ground
4 to 8 w e e k s
Organic substances C:N
Soil microorganisms 8:1
Soil organic matter 10:1 Young sweet clover 12:1
Rotted barnyard manure 20:1 Clover residues 23:1
Green rye 36:1 Corn/sorghum stalks 60:1
Grain straw 80:1
Timothy 80:1
Sawdust 400:1
T i m e
Figure 1. Changes in soil nitrate levels during
decomposition of low N residues.
Source: B.R. Sabey, Univ. of Illinois
1 6 Better Crops/Vol 80 (1996, No. 2)

residue as well as its particle size, degree of soil incorporation or tillage, and soil moisture and temperature conditions following sod-kill. Fortunately, some studies are far enough along to offer examples of the timing of the process for specific sets of conditions. Much more data wil l be available during the next few years.
Primary tillage had a marked effect on fertilizer response by corn following six years of an alfalfa/smooth brome sod in east central South Dakota. If the sod was plowed (MP), no yield response was measured to use of a starter fertilizer plus sidedressed N solution (UAN), modest response was measured with a chisel system (CP) and a 32 bu/A response occurred under no-till (NT) (Table 2). By the spring of the second year, soil NO3-N levels had increased to approximately 200 lb/A in the top 2 feet in MP and CH systems where fertilizer had been applied. Second year responses were similar to the first year responses even though no N was sidedressed on MP and CH systems and only 20 lb N/A was sidedressed in NT. A second no-till treatment was initiated in 1991 and again showed good fertilizer response. Successful no-till breakout was very dependent on fertilization at this location where the initial sod was composed of more alfalfa than grass and plowed plots showed no fertilizer response.
When differences in initial soil
NO3-N were taken into account, continuous corn and first year corn following CRP appeared to have similar N fertilizer requirements in a study being conducted by the University of Minnesota (Table 3). Somewhat greater N was applied following CRP than following continuous corn due to the lower initial NO3-N levels of the CRP plots. The cropping systems were established in 1988 with the CRP sod consisting of nearly all grass for the last three years. A l l corn received 15 lb/A of starter N at planting with the remaining N broadcast as urea in early June and incorporated by cultivation. Nitrate-N measured in tile drainage was the lowest following CRP. A calculated rotation effect was similar for CRP and continuous corn, both being negative. Negative numbers indicate that either net immobilization occurred or that N losses exceeded the contribution from organic matter for the season. Preliminary evaluation of this ongoing study indicates that N rates following CRP for similar soil/climate conditions could be based on the preplant NO3-N test.
Management Guidelines The following set of guidelines was
developed from scientists in several states regarding their views of nutrient management following CRP.
TABLE 2. Influence of tillage on response to fertilizer for corn following CRP (east central
South Dakota).
1990 Spring 1991 Fertilizer1 1991 Fertilizer1
No Yes P lesponse NO3-N 2 No Yes Rc jsponj Tillage Yield, bu/A lb/A-2 ft. Yield, bu/A MP 122 124 +2 210 156 158 +2 CH 112 126 +14 196 143 161 +18 NT1 82 114 +32 124 120 161 +41 NT2 CRP CRP CRP 58 160 183 +23
113-33-13 as a starter in 1990 and 1991; in 1990,48 lb/A N sidedress on all tillage, in 1991 none on MP and CH,
20 on NT1 and 40 on NT2 2From fertilized treatments. Bly, SDSU
Better Crops/Vol 80 (1996, No. 2) 17

TABLE 3. Rotation effects on corn yield and N relationships in southwest Minnesota in 1994.
Primary Fert. N, Yield, Rotation tillage lb/A bu/A Cont. corn MP 147 164 Corn/soy none 95 172 Soy/corn MP 0 45 Corn/alfalfa MP 15 170 Corn/CRP MP 158 177 LSD 0.05 8
Y I E L D G O A L . Anticipated yield is frequently a factor in determining N needs and is critical in developing an economically sound management plan. It needs to be realistic, taking into account the challenges of pest management and surface roughness for the specific field, but should also consider the positive changes that have likely occurred in soil physical properties during the 10 years of sod. In most cases, improvements in surface organic matter, infiltration rate, field water holding capacity, aggregate stability, and air fil led porosity are likely. Subsoil properties may have improved in some cases. In more arid areas, depletion of water in the soil profile by the deep-rooted sod may be a negative factor i f precipitation is insufficient for profile recharge.
S O I L T E S T I N G . After a decade of CRP, the status of immobile nutrients like phosphorus (P), potassium (K), or zinc (Zn) can only be determined with a soil test. Soil test levels wil l likely be similar to the levels before CRP, however, haying or grazing without fertilization or manuring could cause levels to decline.
L I M I N G . I f soil tests indicated a need for aglime it should be applied before the land is taken out of CRP. For no-till , finely ground aglime should be applied as soon as possible. Depth of tillage
Rotation Fall N03-N, lb/A-10 ft. Tile effect,1
1993 1994 loss N, lb/A 150 165 13 -15 118 103 12 +6 94 99 12 — 46 36 3 +73 41 58 1
0.7 -22
Klossner et al., 1995. Univ. of Minn.
should always be taken into account when lime needs are estimated. In no-t i l l , assume a 2-inch depth i f no cultivation is used for weeds or a 3-inch depth i f cultivation is used.
S T A R T E R . Use of a starter containing N, P and K wil l provide nutrients early in the season when roots may not be able to obtain adequate nutrition from the soil or decaying residues.
P AND K . I f a single tillage operation is planned for the first year out of CRP followed by no-till, a single large P and K application to increase soil test levels to the optimum prior to the tillage operation is recommended. If the CRP land is to be no-tilled and P and/or K soil tests are low or very low, band application is recommended. At higher soil test levels, method of application is less important but use of a starter is still advisable.
I N O C U L A T I O N . Soybeans should be inoculated the first time they are grown following CRP.
N I T R O G E N . Knife applications of N are often recommended for no-till to reduce N immobilization and ammonia volatilization losses. Considerable uncertainty exists as to the appropriate N rate adjustment following CRP. The potential exists for significant regional variation due to
MN uptake + Tile loss + Fall 1994 nitrate - Fall 1993 nitrate - Fertilizer N).
i n Better CropsAbl. 80 (1996, No. 2)

soil, cultural and climatic factors. However, three general approaches have emerged for making N rate decisions:
1. Use standard recommendations based on soil N 0 3 present at planting unless significant legumes were present in the sod. This approach usually results in higher N rates than normal due to very low spring N 0 3 - N levels.
2. Apply a conservative N rate and use the late spring soil N test or some other approach to determine
sidedress N need. 3. Reduce N rate by 50 lb/A or more
depending on nature of the sod and other factors considered for standard forage N credit determination.
Local studies and experience should be used to determine the most appropriate approach on a site-specific basis. El
Dr. Fixen is Northcentral Director, PPI, P.O. Box
682, Brookings, SD 57006.
Information Agriculture Conference P L A N N E D F O R J U L Y 3 0 - A U G U S T 1 , 1 9 9 6
Dates for the 1996 Information Agriculture Conference are now set for Tuesday, July 30 through
Thursday, August 1. The event wil l take place at the Krannert Center for the Performing Arts, University of Illinois, Urbana.
Dr. Harold F. Reetz, Jr., PPI Midwest Director, Monticello, IL , wil l serve as chairman of the coordinating committee for the conference. Organizers include PPI, the Foundation for Agronomic Research (FAR), National Center for Supercomputer Applications, University of Illinois College of Agricultural, Consumer and Environmental Sciences, Dealer PROGRESS Magazine, and CCNet Agribusiness Task Force, Champaign-Urbana Chamber of Commerce.
The conference will focus on site-specific crop and soil management technology and computer communication systems for agriculture. Program features wil l include yield mapping and interpretation, variable rate systems, data management, remote sensing, global positioning system potential, geographic information systems, and communication developments.
An exhibit hall wil l allow space for companies and organizations to display products and services related to modern crop production and information. An area wil l also be available for volunteer "poster" presentations where researchers and others can share results of studies and field experience.
Registration fees are $200 per individual before July 15, 1996 (students $100). Exhibitor fee is $300 for a standard booth area. The fee includes conference registration for one person.
For registration and lodging information, contact:
Mary Hughes, P P I 2805 Claflin Road, Suite 200 Manhattan, KS 66502 Phone (913) 776-0273 Fax (913) 776-8347 E-mail: 72253.114 @ compuserve.com
Additional details will be available on the Information
Agriculture Conference Home Page on the Internet at:
http://w3.ag.uiuc.edu/lNF0AG/
or the PPI Home Page at:
http://www.agriculture.coin/conteii1s/ppi/
Better Crops/Vol. 80 (1996, No. 2) 19

JT. Fielding Reed PPI Fellowships Awarded to Seven Graduate Students
Seven outstanding graduate students have been announced as the 1996 winners of the "J. Fielding Reed PPI
Fellowship" awards. Grants of $2,000 each are presented to the individuals. A l l are candidates for either the Master of Science (M.S.) or the Doctor of Philosophy (Ph.D) degree in soil fertility and related sciences.
The seven are: Albert E . Cox, Purdue University, West Lafayette, Indiana; Caragh B . Fitzgerald, University of Maine, Orono; Cheryl F. Fletcher, University of Alberta, Canada; Devon D . Liston, University of Nebraska, Lincoln; Martha Mamo, University of Minnesota, St. Paul; Rodrigo Augusto Ortega Blu , Colorado State University, Ft. Collins; and Jeff A. Yockey, University of Illinois, Urbana-Champaign.
Funding for the Fellowships is provided through support by potash and phosphate producers who are member companies of PPI.
Scholastic record, excellence in original research, and leadership are among the important criteria evaluated for the Fellowships. Following is a brief summary of information for each of the winners:
Albert E . Cox received his B.S. degree at Alabama A & M University in 1991, then earned his M.S. degree from Clemson University in 1993. He is presently studying for his Ph.D. degree at Purdue University. Mr. Cox
was born in Grenada in the West Indies.
The overall objective of his research is to evaluate the potential of some soils to 'fix' and release ammonium (Nl£) and potassium (K ) and to estimate the plant availability of fixed N H 4 and K . His long-term career goal is to work in research, Extension and teaching, including research or collaboration in nutrient management and land application of by-products.
Caragh B . Fitzgerald grew up in Presque Isle, Maine. She earned a B.A. degree from Bowdoin College in 1990, and then attended the University of Maine, Fort Kent, while working for the University of
Maine Cooperative Extension. She is currently studying for her M.S. degree at the University of Maine, Orono. Ms. Fitzgerald's research is being conducted to determine the amount of phosphorus (P) needed for optimal potato yields on soils with high plant-available P. Her career goals may include pursuit of a Ph.D. degree.
Cheryl F. Fletcher is a native of B e a v e r l o d g e , Alberta, Canada. She earned her B.S. degree at the University of A l berta, where she is currently working on her M.S. degree. Her research wil l use site-spe
cific crop management techniques to
20 Better CropsMl. 80 (1996, No. 2)
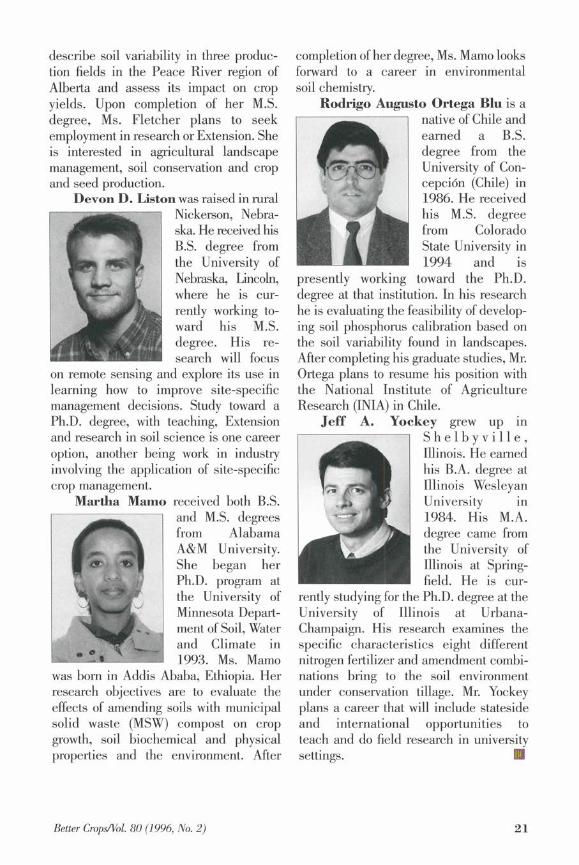
describe soil variability in three production fields in the Peace River region of Alberta and assess its impact on crop yields. Upon completion of her M.S. degree, Ms. Fletcher plans to seek employment in research or Extension. She is interested in agricultural landscape management, soil conservation and crop and seed production.
Devon D . Liston was raised in rural Nickerson, Nebraska. He received his B.S. degree from the University of Nebraska, Lincoln, where he is currently working toward his M.S. degree. His research wil l focus
on remote sensing and explore its use in learning how to improve site-specific management decisions. Study toward a Ph.D. degree, with teaching, Extension and research in soil science is one career option, another being work in industry involving the application of site-specific crop management.
Martha Mamo received both B.S. ^ ^ ^ ^ ~~1 and M.S. degrees
from Alabama
m** A & M University. She began her Ph.D. program at the University of Minnesota Department of Soil, Water and Climate in 1993. Ms. Mamo
was born in Addis Ababa, Ethiopia. Her research objectives are to evaluate the effects of amending soils with municipal solid waste (MSW) compost on crop growth, soil biochemical and physical properties and the environment. After
completion of her degree, Ms. Mamo looks forward to a career in environmental soil chemistry.
Rodrigo Augusto Ortega Blu is a native of Chile and earned a B.S. degree from the University of Con-cepcion (Chile) in 1986. He received his M.S. degree from Colorado State University in 1994 and is
presently working toward the Ph.D. degree at that institution. In his research he is evaluating the feasibility of developing soil phosphorus calibration based on the soil variability found in landscapes. After completing his graduate studies, Mr. Ortega plans to resume his position with the National Institute of Agriculture Research (INIA) in Chile.
Jeff A. Yockey grew up in S h e l b y v i l l e , Illinois. He earned his B.A. degree at Illinois Wesleyan University in 1984. His M.A. degree came from the University of Illinois at Springfield. He is cur
rently studying for the Ph.D. degree at the University of Illinois at Urbana-Champaign. His research examines the specific characteristics eight different nitrogen fertilizer and amendment combinations bring to the soil environment under conservation tillage. Mr. Yockey plans a career that wil l include stateside and international opportunities to teach and do field research in university settings. 03
Better Crops/Vol 80 (1996, No. 2) 21

T.H. Fairhurst Named to PPI Staff in Singapore
Dr. Thomas H . Fairhurst was recently named to the position of Agronomist
with the international staff of the Potash & Phosphate Institute (PPI)/Potash & Phosphate Institute of Canada (PPIC). He wil l be located in the Singapore office with Dr. Ernst Mutert, Director of the East and Southeast Asia Program of PPI/PPIC.
"Dr. Fairhurst is well respected for his earlier work in international agriculture," said Dr. David W. Dibb, President of PPI. "His abilities wil l be well adapted to the many opportunities for agronomic market development in East and Southeast Asia.
After receiving his B.Sc. from the University of Wales in 1979, Dr. Fairhurst attended the Royal Agriculture College,
receiving the Diploma in Advanced Farm Management in 1980. Following assignments as an agronomist in Ghana, Papua New Guinea, Solomon Islands and Indonesia, where he was involved in tree crops and upland agricultural development, he
returned to complete his Ph.D. in Soils and Agronomy at the University of London in 1996.
The PPI/PPIC effort in East and Southeast Asia includes cooperation in Indonesia, Malaysia, Philippines, Myanmar, Thailand, Vietnam and other countries of the region. With fast-growing populations and demand for increased production, there is also growing need for improved agronomic management and balanced fertilization.
T.N. Rao Joins PPIC-India Programme Staff as Agronomist
Dr. T. Nagendra Rao has joined the international staff of the Potash & Phosphate
Institute (PPI)/Potash & Phosphate Institute of Canada (PPIC).
He will work with Dr. Gautam Dev, Director of the PPIC-India Programme. With the title of Agronomist, he will be located at the office of the PPIC-India Programme at Dundahera, Gurgaon, in the state of Haryana.
"Dr. Rao has a strong academic background and practical experience in soil testing and plant analysis," said Dr. David W. Dibb, President of PPI. "His expertise will be beneficial in furthering our efforts in
agronomic research and education in India."
In his new responsibilities, Dr. Rao will be involved in promoting the use of phosphate and potash in improving productivity by encouraging more balanced nutrient use for crops in India. His
knowledge of several Indian languages will be valuable in translating publications and reaching diverse audiences.
Dr. Rao holds B.S. and M.S. degrees from Andhra Pradesh Agricultural University (1984 and 1986) and completed his Ph.D. in Soil Science at Himachal Pradesh Agricultural University in 1995.
22 Better Crops/Vol 80 (1996, No. 2)

W.M. Stewart Now with PPI as Great Plains Regional Director
W .M. "Mike" Stewart has joined the staff of PPI as Great Plains
Director. He is responsible for the agronomic research and education programs of the Institute in the region, effective May 1, 1996.
"Mike Stewart has just completed his doctorate degree program in soil chemistry and earlier worked in the fertilizer and turf industries for several years," said Dr. David W. Dibb, President of PPI. "He brings extensive experience and educational background to our organization and we at PPI welcome him."
In 1980, Dr. Stewart received his B.S. in Soil Science from Texas Tech University. He went on to Texas A & M
University to earn his M.S. in Soil Science in 1983 and then his Ph.D. in Soil Chemistry this year. Between his M.S. and his Ph.D., Dr. Stewart worked in various facets of the industry developing his capabilities in consulting and management.
Over the past 11 years, he has been involved in research, consulting, sales and management. Through this experience, he has refined knowledge of fertilization, soil amendment and pesticide usage, and other agronomic principles.
In his new responsibilities, Dr. Stewart wi l l direct PPI programs in Colorado, Kansas, Oklahoma, western Texas and New Mexico. He is located in Lubbock, Texas.
Dr. L.S. Murphy Resigns from PPI
Dr. Larry S. Murphy, Senior Vice President of PPI, resigned effective April 19 to accept the position
of Vice President for Research, AmiLar International. During his 19 years at PPI,
Dr. Murphy was totally dedicated to potash and phosphate market development and service to the Institute s membership. M
PPI Communications Staff Changes Announced
Katherine P. Griffin has been promoted to Assistant Editor and Kari A. Couch has joined the PPI com
munications group staff. Ms. Griffin has been with PPI since 1992 and has responsibilities related to Better Crops with Plant Food and various other publications and communications projects. Ms. Couch is a recent graduate of Utah State
University with a major in Journalism. She wil l handle projects involving desktop publishing for PPI, as well as responsibilities related to the Foundation for Agronomic Research. Kathy A. Hefner, formerly Assistant Editor, has left PPI and moved with her husband to North Carolina following his promotion to a new position. D9
Better Crops/VoL 80 (1996, No. 2) 2 3

C A L I F O R N I A
Potassium Status and Soil Water Content of Grapevines on Fine Textured Soils By M . A . M a t t h e w s , M . J . S i p i o r a and M . M . A n d e r s o n
Potassium deficiencies occur more often on sandy soils than on soils with moderate to high clay content.
Accordingly, much of the research used to establish criteria for K requirements of grapevines has been conducted on those light soils, common to California's San Joaquin Valley. Yet, K deficiencies also occur on heavier soils of the North Coast region where there is significant premium winegrape production, but where there has been little or no research on K nutrition for over 50 years.
Irrigation has for some time been known to influence the K status of grapevines. Irrigation regimes may also differ among viticulture regions. Therefore, we have been investigating soil, water and vine characteristics that may be important in vineyard K nutrition in the North Coast.
California Studies Experiments were conducted in a
commercial vineyard which had been planted in 1977 to grapevine, Vitis vinifera cv. Pinot noir (Gamay beaujaolais clone) on Vitis rupestris cv. St. George root-stock on a gravelly clay loam (Haire series). This experiment was designed as a 2 by 2 factorial with rates of irrigation and K 2 S 0 4 fertilizer as factors and five
Supplemental irrigation above
the standard practice main
tained high soil water content
(SWC) in the rooting zone and
increased both the uptake of
applied and indigenous soil
potassium (K). The benefit of
increased K uptake late in one
season was apparent in vine K
status early in the subsequent
season. Applying 8 lb of potas
sium sulfate (K 2 S0 4 ) per vine
under the drip emitter of both
irrigation regimes resulted in
movement of significant K to a
depth of 36 inches in this clay
loam soil.
replications. The two rates of K 2 S 0 4 were zero (control) and 8 lb/vine. Fertilizer was applied in the spring of 1988 by shoveling it into the drip irrigation basin next to the vine. Two rates of drip irrigation were begun in 1989: 10 gal/vine/week (stan
dard irrigationrSTD) and 40 gal/vine/week (supplemental irrigation: SUPP) applied one day each week. Irrigation was begun 2 weeks after bloom and discontinued 2 weeks prior to harvest. (See Table 1 for specific treatment combinations).
Soil samples were taken from depths of 0-12, 12-24 and 24-36 inches in the spring of 1988 and again after harvest in 1989. The SWC was monitored during 1989 and 1990 using a neutron probe. Access tubes were installed at dis
tances of 8, 30 and 60 inches from a representative vine in each irrigation treatment perpendicular to the vine row. Moisture readings were taken at intervals of 2 inches to a depth of 48 inches.
The cation exchange capacity (CEC)
TABLE 1. Specific treatment combinations included.
K 20 fertilization level Irrigation level Code
0 lb/vine Standard 0-STD
8 lb/vine Standard K-STD
0 lb/vine Supplemental 0-SUPP
8 lb/vine Supplemental K-SUPP
2 4 Better Crops/Vol 80 (1996, No. 2)

THIS VINEYARD is in the North Coast area of California, where premium winegrapes are grown.
of the soil was above 20 meq/100 g to a depth of 24 inches, and 16.7 meq/100 g below that. X-ray diffraction analysis indicated that the clays are composed of smectite, kaolinite, and vermiculite. The presence of both smectite and vermiculite indicated that K fixation could be a concern. One of the consequences of such fixation is a reduced infiltration of K fertilizers into the soils profile. This can be a problem with deep rooted crops, such as prunes or grapes, where high doses of K fertilizers have normally been recommended to overcome high K fixation. It is estimated that 1,070 lb K/A could potentially be fixed by a soil with 1 percent vermiculite and a CEC of 15.4 meq/100 g. This would be equivalent to 3.5 lb K 2S0 4/vine, or 40 percent of the applied K at the vine spacing (6.5 x 10 ft.) in this trial.
SOIL K STATUS. The exchangeable soil K was initially between 100 and 200 parts per million (ppm) and decreased with depth (Table 2). During the experiment the exchangeable K in the drip zone (nearest to the vine) of the non-fertilized plots (0-STD and 0-SUPP) decreased at all depths by about 30 percent, indicating
that periodic K applications are needed to maintain K availability in this soil type. The K in the drip zone was greatly increased to a depth of 36 inches with application of K 2 S 0 4 under both STD and SUPP irrigation treatments. Possible leaching of some K below the root zone was not investigated but may have occurred with the high rate of water applied in the SUPP irrigation treatment. The K in the top 12 inches was substantially lower in K-SUPP compared to K-STD (Table 2).
SOIL WATER STATUS. With SUPP irrigation, SWC next to the vine row and 30 inches away was maintained higher to a depth of 48 inches. At a distance of 60 inches from the row, SWC was depleted during the season similarly under both irrigation rates, indicating that the lateral movement of the water applied through the drip system did not reach the middle of the rows. The depletion value for SWC during the season indicated that the majority of water uptake occurred between 12 and 36 inches for both water treatments.
The rootstock variety (Rupestris St. George) is vigorous, deep rooted, and has
Better CropsWol. 80 (1996, No. 2) 2 5

TABLE 2. Exchangeable soil K (ppm) in drip zone before and two years after fertilization with potassium sulfate.
Depth, Initial sample Sample in Fall 1989, inches Spring 1988 OSTD OSUPP 8 STD 8 SUPP
ppm exchangeable K
Oto 12 199 129 131 4,430 1,270 12 to 24 148 83 71 1,910 1,130 24 to 36 101 50 46 730 630
a high root density. The effective rooting depth for all treatments was approximately 48 inches and there were no significant differences among treatments in the total number of root intercepts measured at any depth.
V I N E K STATUS. Vine K status (percent K in petioles) was not affected by applied K during the first year (1988) under STD irrigation practices. Complete correction of K deficiency (leaf symptoms, petiole K, yield etc.) in grapevines, even with large K doses such as those in this trial, often does not occur until the second or third season after application. There were also no appreciable differences in K status at bloom in 1989 (Figure 1). Vine K status declined throughout the postbloom 1989 season in 0-STD vines. The concentration of K in the petioles is usually highest at bloom, followed by a decrease between bloom and veraison. The decrease was avoided, however, in vines that had K applied such that by veraison the concentration of petiole K was significantly higher for fertilized vines under both STD and SUPP irrigation.
In 1990, the petiole K at bloom was significantly higher in the K-SUPP, K-STD, and 0-SUPP treatments than in the 0-STD treatment (Figure 1). This was due to differences in vine K status established by harvest of 1989 since irrigation was not begun until two weeks after bloom in both years. This carry-over effect could be attributed to an increase in root
growth due to K application, which was not obvious here, or to increased K stored in permanent parts of the vine.
Petiole K concentration in 1990 declined for all treatments between bloom and the onset of veraison in 1990. Petiole K differences between STD and SUPP treatments once
again indicated that the uptake of K was increased at higher soil water content. Also, the application of K maintained petiole K at veraison (both in 1989 and 1990) closer to bloom time levels, and supplemental irrigation further increased K status of fertilized vines.
Y I E L D . There were no significant yield increases due to K applications in any year. The lack of a positive yield response for vines with bloom petiole K below 1 percent (the established critical level in the San Joaquin Valley) has implications
3.0
2.5
2.0
1.5
1.0
0.5
O STD (No K, standard irrigation) • O SUPP (No K, supplemental irrigation)
8 STD (8 lb K^D/vine, standard irrigation) • 8 SUPP (8 lb ICp/vine, supplemental irrigation
1989
1990
40 80
Days after bloom
120
Figure 1. Fertilizer K and supplemental
irrigation improve K nutrition of
grapevines.
26 Better Crops/Vol 80 (1996, No. 2)

for the critical levels used to evaluate winegrape nutrient status. The failure to obtain increased yields on vines that were clearly K deficient by existing criteria and that greatly increased K status following treatments raises at least two questions that require further study. First, the extent of genetic differences in vine K requirements needs to be better established. There is also evidence of differences in petiole K concentration and yield response to K among rootstocks (see Better Crops, Winter 1992-93, pp. 19-21). In a separate experiment, Chardonnay grapes on St. George rootstock (used in this experiment) responded poorly to K fertilization.
Second, the standard of K status, bloomtime petiole K of basal leaves, may not give accurate estimates for some genotypes or growing conditions. I f K deficiencies develop later than bloom due to soil drying and K fixation on certain clay soils, for example, the standard sampling approach may not detect the ensuing deficiency.
uptake of applied and indigenous soil K. The benefit of increased K uptake late in one season was apparent in vine K status early in the subsequent season.
Potassium fixation may be a concern on many North Coast soils such as at this site with K fixing clays, but the application of 8 lb K 2 S 0 4 under the drip emitter resulted in movement of significant K to a depth of at least 36 inches under both irr i gation regimes. Significant differences in root distribution caused by irrigation and K fertilizer treatments were not detected. About 75 to 80 percent of the root intercepts were encountered at the top 36 inches of the soil in all treatments.
Although bloom petiole K of 0-STD (control) grapevines was near the previous established critical level of 1.0 percent dry weight, the application of K did not significantly increase yields one, two, or three years after applications. Further studies to evaluate the role of varieties and rootstocks relative to yield responses and in interpretation of petiole values is recommended.
Summary Supplemental irrigation above the
STD practice maintained high SWC in the rooting zone and increased both the
Dr. Matthews is Associate Professor, Mr. Sipiora is a
former Graduate Student, and Mr. Anderson is a
Research Associate, Dept. of Viticulture & Enology,
University of California-Davis.
International Soil Fertility Manual Now Available
Since 1978, PPI has distributed over 75,000 copies of the Soil Fertility Manual. In recent years,
there has been growing interest in a version of the manual adapted to international audiences and presented in metric units. Now, PPI is pleased to announce that the 114-page International Soil Fertility Manual is available.
To order a single copy, send $30.00 in U.S. funds ($15.00 for PPI member companies) payable to "Potash & Phosphate Institute." U.S. and Canada orders add $4.00 shipping, all other countries add $7.00. I f ordering multiple copies contact: Potash & Phosphate Institute, 655 Engineering Drive, Suite 110, Norcross, GA 30092-2843; phone (770) 447-0335, extension 213 or 214; fax (770) 448-0439. •
Better Crops/Vol. 80 (1996, No. 2) 2 7
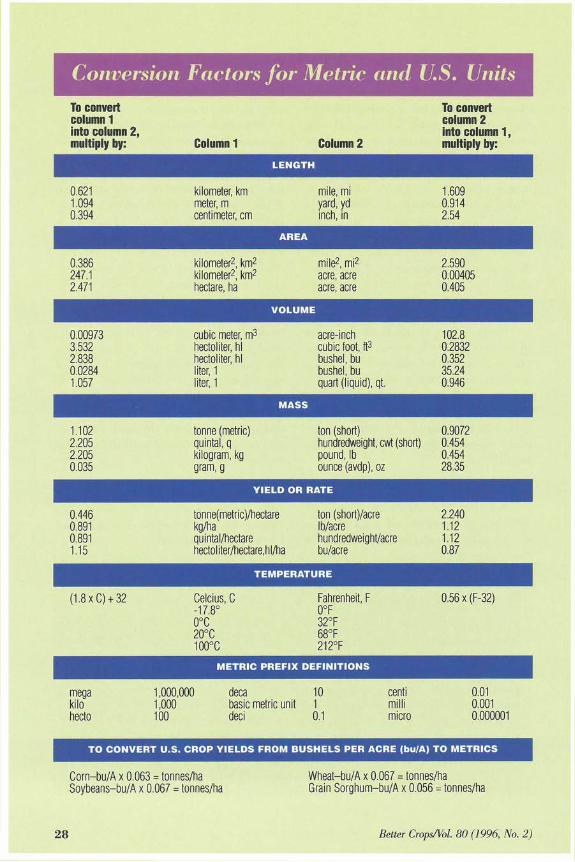
Conversion Factors for Metric and U.S. Units
To convert To convert column 1 column 2 into column 2, into column 1, multiply by: Column 1 Column 2 multiply by:
LENGTH
0.621 kilometer, km mile, mi 1.609 1.094 meter, m yard, yd 0.914 0.394 centimeter, cm inch, in 2.54
AREA
0.386 kilometer 2, k m 2 mile 2 , m i 2 2.590 247.1 kilometer 2, k m 2 acre, acre 0.00405 2.471 hectare, ha acre, acre 0.405
VOLUME
0.00973 cubic meter, m 3 acre-inch 102.8 3.532 hectoliter, hi cubic foot, f t 3 0.2832 2.838 hectoliter, hi bushel, bu 0.352 0.0284 liter, 1 bushel, bu 35.24 1.057 liter, 1 quart (l iquid), qt. 0.946
MASS
1.102 tonne (metric) ton (short) 0.9072 2.205 quintal, q hundredweight, cwt (short) 0.454 2.205 kilogram, kg pound, lb 0.454 0.035 gram, g ounce (avdp), oz 28.35
YIELD OR RATE
0.446 tonne(metric)/hectare ton (short)/acre 2.240 0.891 kg/ha lb/acre 1.12 0.891 quintal/hectare hundredweight/acre 1.12 1.15 hectoliter/hectare,hl/ha bu/acre 0.87
TEMPERATURE
(1.8x0 + 32 Celcius, C Fahrenheit, F 0.56 x (F-32) (1.8x0 + 32 -17.8° 0°F
0.56 x (F-32)
0°C 32°F 20°C 68°F 100°C 212°F
METRIC PREFIX DEFINITIONS
mega 1,000,0 00 deca 10 centi 0.01 kilo 1,000 basic metric unit 1 mill i 0.001 hecto 100 deci 0.1 micro 0.000001
TO CONVERT U.S. CROP Y I E L D S FROM B U S H E L S PER A C R E (bu/A) TO METRICS
Corn -bu /A x 0.063 = tonnes/ha Wheat -bu/A x 0.067 = tonnes/ha Soybeans-bu/A x 0.067 = tonnes/ha Grain So rghum-bu /A x 0.056 = tonnes/ha
28 Better Crops/VoL 80 (1996, No. 2)

A U S T R A L I A
Research Shows Benefits of Liming to Correct Deep Soil Acidity
By Mark K. Conyers
Soil acidification is a problem of increasing importance in Australian agriculture. This is particularly so in
the zone receiving 500 mm to 850 mm rainfall in central New South Wales (NSW) to the central Victorian areas. In the more severe cases, soil pH levels low enough to adversely affect plant growth have extended deeper than 50 cm into the soil profile.
The application of lime to cropping soils in this key farming area has been shown to be profitable for the farming community. However, the use of lime in the permanent pasture areas of the region has not been widely adopted because it is much more difficult to demonstrate its value in the grazing industries, even
Soil acidification and its con
trol are significant problems in
Australia. Research data
emphasize benefits of liming.
though small plot experiments have shown significant responses to the application of lime.
While the correction of soil acidity is important in the cropping areas, it is equally important in the permanent
pasture areas, i f the land's productivity is to be maintained and the soil base is to be protected. However, in these situations treatment is difficult to justify
on an economic basis, and is also technically difficult to do, particularly when deeper soil is affected.
New South Wales Study A long-term experiment was estab
lished to address the problems of acidification deep in the soil and specific
TABLE 1. Annual rainfall at Brooklyn, Wagga Wagga, NSW.
Month 1992 1993 1994 Long-term average Annual rainfall, mm
January na 16 23 49 February 20 9 135 1 43 March 1 45 50 49 April 96 5 15 50 May 36 30 12 62 June 53 30 45 51 July 50 97 15 62 August 142 38 14 62 September 7 116 8 57 October 82 89 38 70 November 56 71 — 49 December 87 54 — 47 Total 630 600 370 650
1Rainfall in February 1994 occurred as a heavy summer storm with heavy runoff and little benefit to the farming program.
Better Crops/VoL 80 (1996, No. 2) 2 9

pH, 0.01 M C a C I 2
4.0 4.5 5.0 5.5 6.0 0 0 l
10
20
30
E 40
0 50
£ 60 \ TV .
a 70 ®
80
90
100 Red Podzolic 'Brooklyn' \
100 — Red Earth
110 — Podzolized Red Earth \
110 Yellow Solodic
120 Yellow Podzolic/Solodic \
FIGURE 1. Profiles of the pH trial site and other
strongly acid soils in the Wagga
Wagga area.
aspects of soil acidification. Objectives of the study were:
• to test whether perennial pasture is less acidifying than an annual pasture;
• to demonstrate the economics of using lime for the long-term benefit of the pasture, grazing animals and the crops grown in rotation; and
• to demonstrate the time required to ameliorate acid subsurface soils through surface applications of lime.
The trial was established in 1991, on "Brooklyn", a property 40 km southeast of Wagga Wagga, owned and operated by the Hurstmead Pastoral Company.
The first objective was to characterize the site and enable a long-term experiment to be established, so that the real extent and causes of any changes that wil l take place in subsequent years wi l l be known with certainty.
Results After Two Years Two years into the pro
gramme, the chemical characteristics of the plots have been thoroughly defined, changes in the soil characteristics as a result of treatments since the start of the trial have
been recorded and there are now 2.5 years of animal and pasture data as well as two years of crop data available.
While results to date are very interesting and give good pointers to future effects, seasonal conditions have been generally very dry, particularly in 1994. In view of the very large part that rainfall plays in Australian agriculture, it is useful to know the pattern of rainfall in the trial area. Rainfall recorded during that time is shown in Table 1, together with the long term average annual rainfall.
Figure 1 shows pH profiles of the site and other strongly acid soils in the Wagga Wagga region.
Soil pH levels ranged from about 4.1 (CaCl2), in the surface 10 cm, to about 6.2 at 100 to 120 cm deep.
Aluminum (Al) saturation of the exchangeable cations ranged from about 30 to 40 percent at the soil surface to less than 5 percent at depths greater than 30 cm. There were, however, some large and significant "bulges" at some sampling sites, at various points down the profile.
Soil manganese (Mn) levels were about 0.1 to 0.12 meq/lOOg in the surface 30 cm and declined to levels below 0.01 meq/lOOg at greater depths.
Soil potassium (K) levels ranged from about 0.24 meq/lOOg (9.3 percent K saturation), at the surface to 0.126 meq/lOOg (3 percent saturation) at 30 cm, and then a small increase in K levels at lower depths in the profile.
There was a systematic variation in the soil K levels across the site. Reasons
TABLE 2. Effects of rotation anc yields in 1993.
I treatments on crop grain
Grain yield, kg/ha No lime Plus lime
Rotation pH 4.0 pH 5.0 Perennial pasture/crop — Oats 1,552 1,641
Peas 368 1,431 Wheat 1,872 4,187
Annual pasture/crop — Wheat 2,592 4,008
30 Better Crops/VoL 80 (1996, No. 2)

for this variation are thought to be due to nutrient transfer during the previous history of the trial site. The variability was taken out by an application of 200 kg/ha of potassium chloride to the whole site, and this is being monitored by annual soil and plant analyses to check on the need for further applications of K.
There were significant larger responses to K by wheat in the limed plots than in the unlimed plots, indicating that acidity inhibited response to K. Lime had little effect on the response to K by the pastures. Table 2 shows the response of the crops to lime.
Pasture and animal responses to the application of lime of around 33 percent have been demonstrated, with the value of increased wool production being sufficient to pay for the initial capital cost of the lime in a 2 to 3 year period. These responses are also about seven times the cost of annual applications of lime required to prevent acidification.
The application of lime has led to an
INCREASING soil acidification is a concern in the area of central
New South Wales to central Victoria in Australia. The zone
receives 500 to 850 mm annual rainfall.
INCREASNG soil acidity is a significant production problem
in wheat-pasture production systems in New South
Wales. Liming is a key to maintenance of production and
prof itability in both crop and animal production.
increase in the pH of surface soil. However, a much longer time is necessary to determine how long it wil l take for the increase in soil pH to become significant at depth.
Animal production has been quite markedly affected by the type of pasture being grazed. Animal liveweight gains were fastest on the limed perennial pas
ture treatments. In the cropping rotations, animal production was also affected by the clover regeneration under wheat stubble. There were some unexpected results, however. For example, clover regeneration was more vigorous under the sparse stubble from the no lime treatments in early 1994 which led to faster liveweight gains in these treatments than in the limed treatments where heavy stubble led to less clover regeneration. IBB
Dr. Conyers is a Senior Chemist with
NSW Agriculture, Agricultural
Research Institute, Private Mail Bag,
Wagga Wagga, NSW, 2650, Australia.
Better Crops/VoL 80 (1996, No. 2) 31

Progress is all around us. Everything is changing. Vast improvements are happening in
production agriculture. However, throughout the past 50 years, and even earlier in history,
experts predicted world famine. Famine 1975 and The Hungry Planet did not materialize.
Now some say starvation-in the next century-for sure. World grain production is currently
short of consumption and world reserves are enough for just 48 days. The Food and
Agriculture Organization (FAO) of the United Nations considers 64 days supply the mini
mum to safeguard world food security.
Do they underrate the scientists and statesmen of the world? What is there to encour
age us? Here are some points to consider:
New Technology It defies our imagination...precision application, computer
capabilities, improved cultural practices, new machinery, genetic miracles.
Changing Curriculum at Agricultural Schools Students seek a strong
background in science, genetics and computer technology.
Soil Testing Grid soil sampling and more attention to soil type are helping to
build maps and data bases for site-specific nutrient management. Improved
methods will further enhance yields, profits and efficiency.
Environmentalists Some are recognizing the role of modern high-tech farming
in protecting and improving the environment.
Farm Legislation A nearly complete rewriting could result in a whole new
farming concept. This could be the most far-reaching factor of all.
Will all this forestall famine? Despite the doomsayers, there is promise. We can feed
the 2.5 billion more people predicted by the year 2025. M
SECOND-CLASS
POSTAGE W I T H P 1 A N T F O O D
Potash & Phosphate Institute Suite 110, 655 Engineering Drive
Norcross, Georgia 30092-2843