Embed Size (px)
Citation preview

LATERAL LOADS ON REENTRANT CORNER STRUCTURES
By
BETHANY MARIE BROWN
A thesis submitted in partial fulfillment of the requirements for degree of
MASTER OF SCIENCE IN CIVIL ENGINEERING
WASHINGTON STATE UNIVERSITY Department of Civil and Environmental Engineering
MAY 2014
© Copyright by BETHANY MARIE BROWN, 2014
All Rights Reserved
ii
To the Faculty of Washington State University: The members of the Committee appointed to examine the thesis of BETHANY MARIE BROWN find it satisfactory and recommend that it be accepted.
__________________________ Daniel J. Dolan, Ph.D., Chair.
__________________________
William Cofer, Ph.D.
__________________________ Don Bender, Ph.D.
__________________________ Steve Pryor, P.E., S.E.

iii
ACKNOWLEDGEMENTS
The author would like to extend her warmest thanks to Dr. Daniel Dolan for his
guidance and support. A special thanks also goes to Dr. William Cofer, Dr. Donald
Bender, and Steve Pryor for serving as a committee members.
The author would also like to thank her loving and supportive mother and family
for their dedication and patience through this process.
iv
LATERAL LOADS ON REENTRANT CORNER STRUCTURES
Abstract
by Bethany Marie Brown, M.S. Washington State University
May 2014
Chair: Daniel J. Dolan
For this study, the effect of lateral loads on the forces in the reentrant corner of
structures was examined so as to better understand why damage occurs in this location
after major wind or seismic events. Thirty models were analyzed using finite element
analysis in SAP2000 with varying dimensions and wall locations. Theses changing
parameters were used to see how the axial forces in the reentrant corner also changed
accordingly. The models were configured so as to mimic light-framed timber
construction. In each case the models were subjected to the same load conditions with
the only variation between the models being either the dimensions or locations of walls.
The study found that the axial force for the interior and exterior struts acted linearly, as
the length of the diaphragm increased so did the axial force. The results for the interior
and exterior chord showed that the analog for the diaphragm transition is from a propped
cantilever to a simply supported beam as the length of the diaphragm increased. Finally
it was also found that the addition of walls, both exterior shear walls and interior shear
walls, greatly decreases the axial forces for both the interior and exterior strut and interior
and exterior chords in the reentrant corner.

v
TABLE OF CONTENTS
ACKNOWLEDGEMENTS iii
ABTRACT iv
TABLE OF CONTENTS v
TABLE OF FIGURES vii
TABLE OF TABLES ix
CHAPTER
I. INTRODUCTION 1
1.1 Introduction 1 1.2 Objectives and Scope of Research 5 1.3 Literature Review 8
II. ANALYSIS PROCEDURE 12
2.1 Scope of Testing 12 2.2 Parameters of Parametric Study 12 2.3 Development of Models 14
2.3.1 Development of Material Properties 15 2.3.2 Development of material Cross Sections 15 2.3.3 Development of Non-linear Links 16 2.3.4 Development of Models 17
2.4 Development and Application of Lateral Loads 20 2.5 Verification of Models 21
III. RESULTS AND DISCUSSION 35
3.1 Introduction 35 3.2 Parametric Study Results 35
3.2.1 Exterior and Interior Strut Results 36 3.2.2 Exterior and Interior Chord Results 37 3.2.3 Interior Wall Results 42 3.2.4 Impact of Shear Walls on Axial forces in Reentrant Corner 50
3.3 Discrepancies with Results 56 3.4 Discussion 58
3.4.1 How the Height of the Structure Affects the Force 58 3.4.2 Comparison is Determination of Chord Forces 59 3.4.3 Trend in the Results for the Interior and Exterior Chord 62
vi
IV. SUMMARY AND CONCLUSIONS 65
4.1 Summary 65 4.2 Conclusion 65
REFERENCES 69 APPENDIX
A: TJI Joist Specifications 71 B: Diaphragm Deflection 73 C: Wind Load Calculations 78 D: Non-Linear Link Development 80 E: Model Results 84

vii
TABLE OF FIGURES
Figure Page
1.1 Rigidity of Separate Buildings 2
1.2 Stress concentration in L-Shape Building 3
1.3 Center of Mass verses Center of Rigidity 4
1.4 Damage to Ministry of Telecommunications Building 6
2.1 Magnitude and Location of Point Loads on Models 21
2.2 Model Configuration for Diaphragm Deflection Check 22
2.3 300% Model Configured as a Shear Wall 24
2.4 300% Model without any modifications 25
2.5 Deformed shape verse undeformed shape of 300% Model 26
2.6 Labeled Axial Members at Reentrant Corner, mid-span and end 27
2.7 300% Model with Uniform Load going left to right 28
2.8 300% Model with End Wall Removed 30
2.9 300% Model without non-linear Links removed in side walls 31
2.10 300% Model with roof diaphragm only 32
3.1 Labeled interior and exterior chords and struts 36
3.2 Maximum Axial Forces in Exterior and Interior Struts 37
3.3 Maximum Axial Forces in Exterior and Interior Chords 39
3.4 Location of Nodes Used to Compare Relative Displacements 39
3.5 Comparison of Maximum Axial Forces vs. Relative Displacements 40
3.6 1:6 Aspect Ratio in Variable Leg 43
3.7 1:3 Aspect Ratio in Variable Leg with One Interior Wall 44
viii
3.8 Load path of 300% model without any interior shear walls 45
3.9 Load Path with one interior shear wall 46
3.10 Axial Forces in Reentrant Corner vs. Number of Interior Shear walls 47
3.11 Maximum Axial Forces vs. Number of Interior Shear Walls 49
3.12 300% Model without any modifications 50
3.13 300% Model without non-linear Lines in side walls 51
3.14 300% Model with roof diaphragm only 51
3.15 Location of nodes for comparing relative displacements 54
3.16 One Link per sheet of sheathing and Axial Force in Top Chord 56
3.17 Two Links per sheet of sheathing and Axial Force in Top Chord 57
3.18 Comparison between Interior and Exterior Chord Force and 61 Calculated Chord Forces based on different analogs 3.19 Comparison of Axial Forces in Exterior Chord with and without 64 Non-linear Links at the Reentrant Corner
ix
TABLE OF TABLES
Table Page
2.1 Axial Forces at reentrant corner, mid-span, and end of 300% Model 27
2.2 Axial Forces in 300% Model with Load going from Left to Right 28
2.3 Axial Forces in 300% Model without end wall 30
2.4 Compared Axial Forces between Models 33
3.1 Maximum Axial Forces in Exterior and Interior Struts 37
3.2 Maximum Axial Forces in Exterior and Interior Chords 38
3.3 Maximum Axial Forces with Additional Interior Shear Walls 47
3.4 Maximum Axial Forces with Additional Interior Shear Walls 49
3.5 Compared Axial forces between Models 52
3.6 Comparison of Relative Displacements between Models 55
3.7 Comparison between Interior and Exterior Chord Force and 60 Calculated Chord Forces based on different analogs 3.8 Comparison of Axial Forces in Exterior Chord with and without 63 Non-linear Links at the Reentrant Corner

1
CHAPTER 1: INTRODUCTION
1.1 INTRODUCTION
In recent years there has been a change in the complexity of residential and
commercial structures from that of a few decades ago. It used to be that residential and
commercial structures were primarily rectangular in shape and thus followed traditional
lateral load paths. With advances in technology, these structures are now more complex
in shape and contain multiple irregularities. Such irregularities include, but are not
limited to, nonparallel systems, diaphragm discontinuities, torsional effects and reentrant
corners (ASCE 2010) which make following the traditional lateral load paths more
difficult. These complex diaphragms require more in-depth analysis to determine the
complete lateral load path. In the case of this study, only the issue of reentrant corners
will be examined.
According to ASCE 7-10 a “reentrant corner irregularity is defined to exist where
both plan projections of the structure beyond a reentrant corner are greater than 15% of
the plan dimension of the structure in the given direction.” A reentrant corner can also be
referred to as a notched diaphragm. A notched diaphragm occurs when a disruption in
the diaphragm chord or strut is caused by the main wall line being offset by a portion of
the exterior wall line (Malone, 2012.) When a discontinuity, like a reentrant corner,
occurs, the code requires that the force must be transferred across the discontinuity via an
alternative load path. The difficulty with reentrant corners is in determining the actual
magnitude of the force that is being transferred.
There are a couple of reasons why it is difficult to determine the magnitude of
forces in reentrant corners. The first is the difference in the rigidity due to the general
2
layout of the structure. The second major difficulty is that the torsional forces imposed
on the structure cause deflection amplifications at various locations on the entire
structure. Both of these issues occur simultaneously which compounds the difficulty.
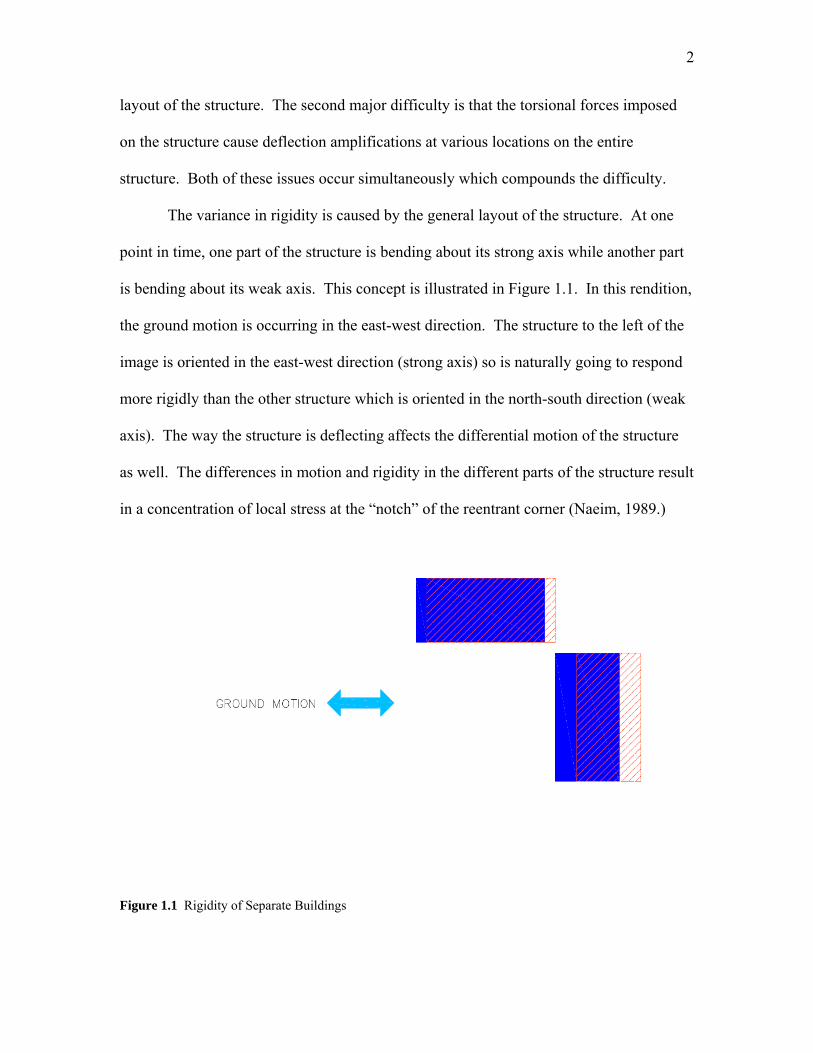
The variance in rigidity is caused by the general layout of the structure. At one
point in time, one part of the structure is bending about its strong axis while another part
is bending about its weak axis. This concept is illustrated in Figure 1.1. In this rendition,
the ground motion is occurring in the east-west direction. The structure to the left of the
image is oriented in the east-west direction (strong axis) so is naturally going to respond
more rigidly than the other structure which is oriented in the north-south direction (weak
axis). The way the structure is deflecting affects the differential motion of the structure
as well. The differences in motion and rigidity in the different parts of the structure result
in a concentration of local stress at the “notch” of the reentrant corner (Naeim, 1989.)
Figure 1.1 Rigidity of Separate Buildings
3
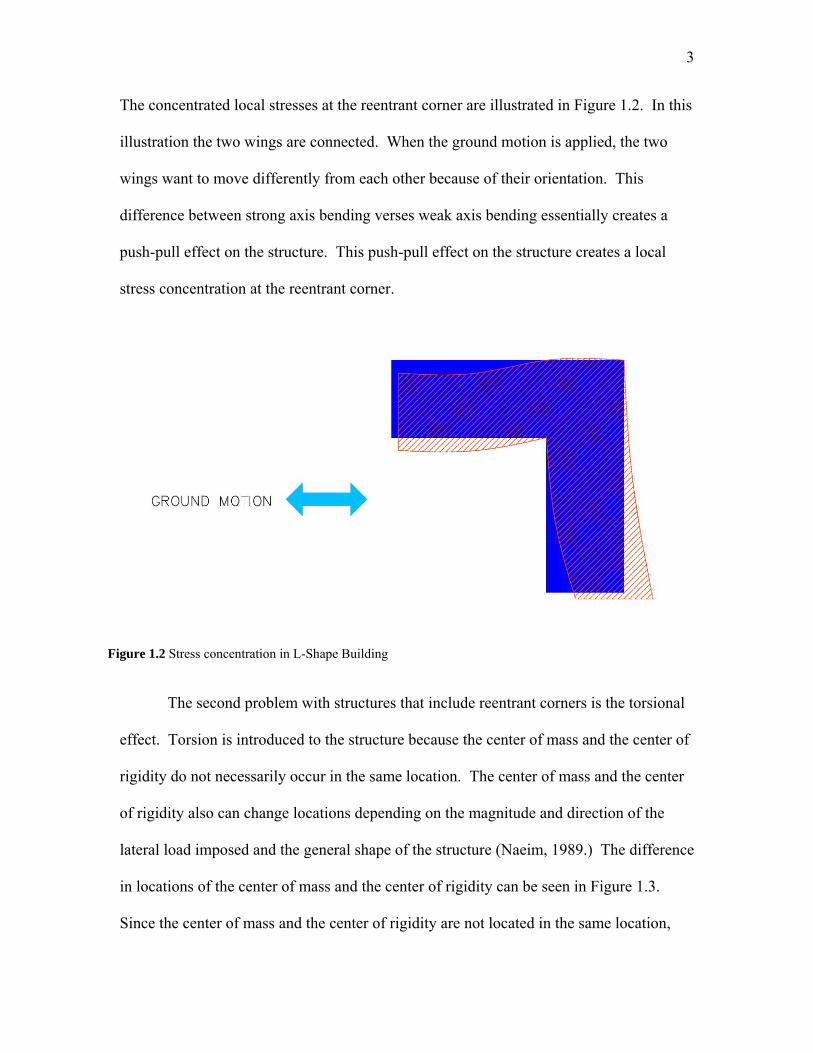
The concentrated local stresses at the reentrant corner are illustrated in Figure 1.2. In this
illustration the two wings are connected. When the ground motion is applied, the two
wings want to move differently from each other because of their orientation. This
difference between strong axis bending verses weak axis bending essentially creates a
push-pull effect on the structure. This push-pull effect on the structure creates a local
stress concentration at the reentrant corner.
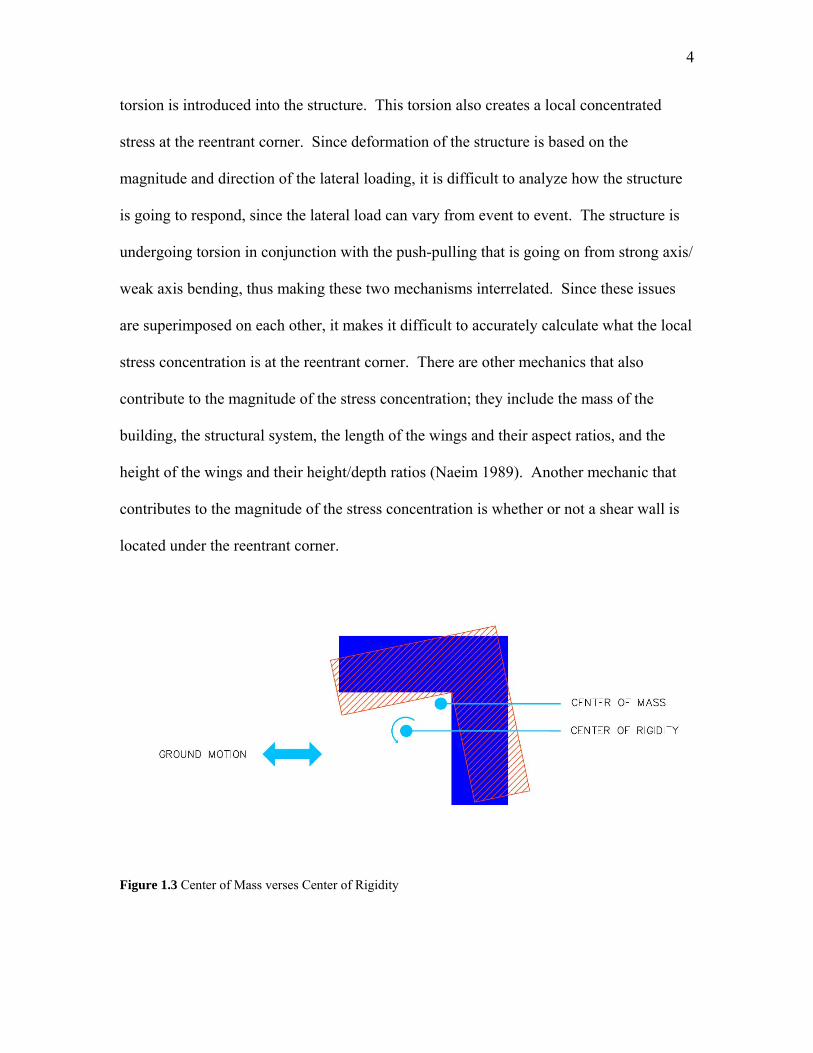
The second problem with structures that include reentrant corners is the torsional
effect. Torsion is introduced to the structure because the center of mass and the center of
rigidity do not necessarily occur in the same location. The center of mass and the center
of rigidity also can change locations depending on the magnitude and direction of the
lateral load imposed and the general shape of the structure (Naeim, 1989.) The difference
in locations of the center of mass and the center of rigidity can be seen in Figure 1.3.
Since the center of mass and the center of rigidity are not located in the same location,
Figure 1.2 Stress concentration in L-Shape Building
4
torsion is introduced into the structure. This torsion also creates a local concentrated
stress at the reentrant corner. Since deformation of the structure is based on the
magnitude and direction of the lateral loading, it is difficult to analyze how the structure
is going to respond, since the lateral load can vary from event to event. The structure is
undergoing torsion in conjunction with the push-pulling that is going on from strong axis/
weak axis bending, thus making these two mechanisms interrelated. Since these issues
are superimposed on each other, it makes it difficult to accurately calculate what the local
stress concentration is at the reentrant corner. There are other mechanics that also
contribute to the magnitude of the stress concentration; they include the mass of the
building, the structural system, the length of the wings and their aspect ratios, and the
height of the wings and their height/depth ratios (Naeim 1989). Another mechanic that
contributes to the magnitude of the stress concentration is whether or not a shear wall is
located under the reentrant corner.
Figure 1.3 Center of Mass verses Center of Rigidity
5
1.2 OBJECTIVES AND SCOPE OF RESEARCH
The objective of this study is to evaluate lateral loads on a reentrant corner
structure, specifically an L-shaped structure via finite element analysis, to develop a
better estimation of the local stress concentration in the reentrant corner and a better
concept of the load path in the reentrant corner area of the structure. Determining the
stress concentration would give a better understanding as to what is occurring in the
structure in a lateral loading event. The capability to better estimate the local stress
concentration would allow for structures to be more appropriately designed and thus
enhance the safety of the structure as well.
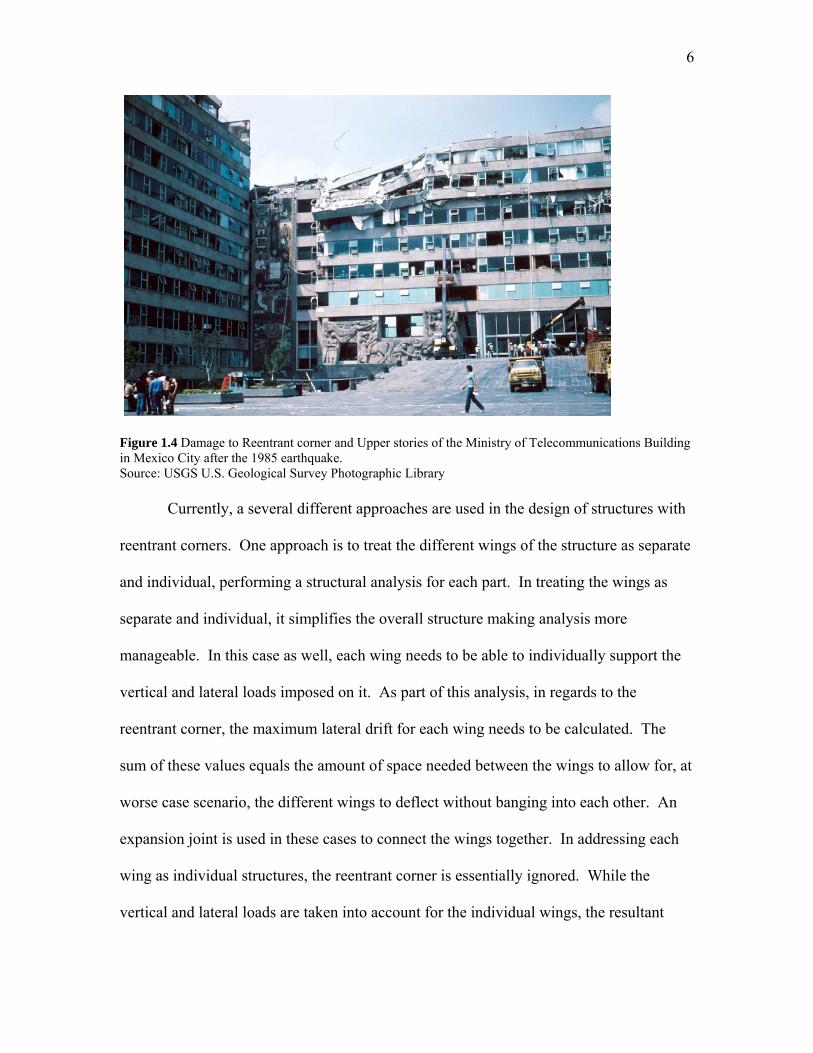
Historically, since before the turn of the twentieth century and even in modern
structures, significant damage has been observed in structures with reentrant corners after
a lateral loading events, such as an earthquake. Damage in the reentrant corners of
structures was significantly noted after the 1923 Kanto earthquake, the 1925 Santa
Barbara earthquake, the 1964 Alaska earthquakes, and the 1985 Mexico City earthquake
(Naeim, 1989.) In some of these significant events, it was noted that damage to the
structure occurred in the reentrant corner first, and then traveled to other parts of the
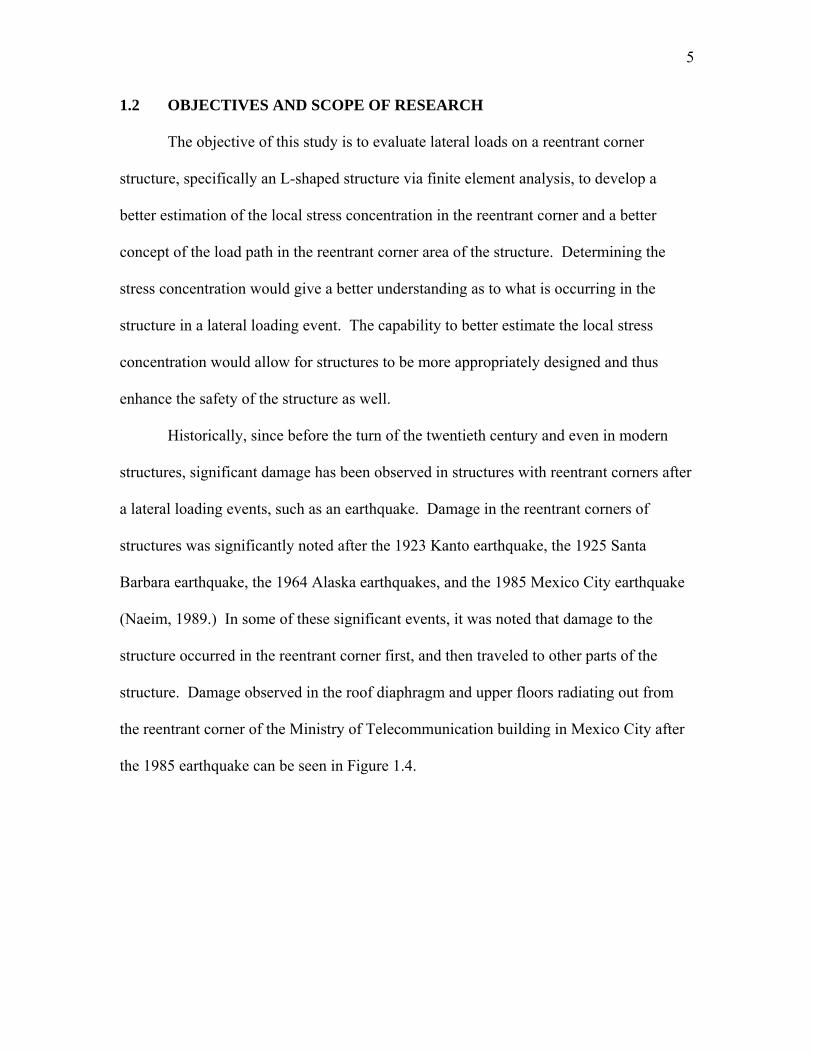
structure. Damage observed in the roof diaphragm and upper floors radiating out from
the reentrant corner of the Ministry of Telecommunication building in Mexico City after
the 1985 earthquake can be seen in Figure 1.4.
6
Figure 1.4 Damage to Reentrant corner and Upper stories of the Ministry of Telecommunications Building in Mexico City after the 1985 earthquake. Source: USGS U.S. Geological Survey Photographic Library Currently, a several different approaches are used in the design of structures with
reentrant corners. One approach is to treat the different wings of the structure as separate
and individual, performing a structural analysis for each part. In treating the wings as
separate and individual, it simplifies the overall structure making analysis more
manageable. In this case as well, each wing needs to be able to individually support the
vertical and lateral loads imposed on it. As part of this analysis, in regards to the
reentrant corner, the maximum lateral drift for each wing needs to be calculated. The
sum of these values equals the amount of space needed between the wings to allow for, at
worse case scenario, the different wings to deflect without banging into each other. An
expansion joint is used in these cases to connect the wings together. In addressing each
wing as individual structures, the reentrant corner is essentially ignored. While the
vertical and lateral loads are taken into account for the individual wings, the resultant
7
force in the reentrant corner is not addressed, but the differential displacements in the
corner are difficult to accommodate without special seals and expansion joints being
incorporated into the design.
Another design approach that is currently used to address the forces in the
reentrant corner is to use a splay instead of the traditional 90 ̊ angle of a reentrant corner.
In changing the degree of the angle in the reentrant corner the resultant force is
decreased. The splays “tie the building together strongly at lines of stress concentrations
and locate resistant elements to reduce torsion” (Naiem 1989.) While this approach more
directly addresses the reentrant corner than the other approach stated above, neither
approach fully takes into account the total resultant forces. That is because current
design approaches do not determine the total resultant forces in reentrant corners that
develop under lateral loads. These design approaches and simplifications to the structure
are allowed by current building codes because they aid in the development of a
reasonable or rational design.
In this study, several light-framed L-shape structures are subjected to a lateral
load using finite element analysis to which the results are analyzed afterwards. The
overall objective of the finite element modeling is to develop a method that better
estimates what the local stress concentration at the reentrant corner of a given structure
under a lateral load really is and determine what the plausible load paths in the corner
might be.
This specific task is accomplished by a series of finite element models that is
succeeded by a careful analysis of the resulting data. The finite element modeling and
8
procedure is discussed in detail in Chapter 2. Data collected from the finite element
modeling is evaluated in Chapter 3 for numerical trends.
1.3 LITERATURE REVIEW
While damage in the reentrant corner after a lateral loading event has been noted
for over a hundred years now, it is only in the last twenty years that research has been
done to try to better understand and determine the magnitude of forces in the reentrant
corner. Since it is difficult to determine analytically the magnitudes of the forces, as
explained previously, models have been developed and tested either in wind tunnels or on
shake tables to investigate the forces in reentrant corner structures.
In an article published by the Journal of Structural Engineering, (Songlai,
Chengmou, & Jinglong, 2010) a team investigated the behavior of engineered light-frame
wood construction under lateral loads. Part of the investigation was to examine
diaphragm action with reentrant corners. A uniformly distributed load was applied to the
model through the use of gasbags set along the exterior floor edges. As a part of their
investigation, a series of tests were executed, one of which was an ultimate load test.
After the ultimate load test was performed, the reentrant corner of the model was
examined. It was found that no visible damage had been done. They concluded that
lateral loads could be successfully resisted without continuous end chord if the reentrant
corner of the diaphragm was less than 1.0 meter (Songlai, Chengmou, & Jinglong, 2010.)
Their decision to have a reentrant corner in their model less than 1.0 meter was based on
a finite element analysis study on openings and offsets in buildings (Prion, 2000.) Their
results confirmed some of the data presented in that study.

9
Swaminathan Kishnan from the Seismological Laboratory of the California
Institute of Technology did a case study of damage to 19-story irregular steel moment-
frame buildings under near-source ground motion (Krishnan, 2007.) The purpose of his
study was to compare the performance of buildings that do not adhere to wind drift limits
to those that do, by comparing 3 19-story irregular steel moment-frame buildings. Two
of the buildings had reentrant corner irregularities, while the third had a plan torsional
irregularity. Kishnan used the UBC97 and assumed that each structure was located in a
Seismic Zone 4 with soil Type Sb. Kishnan also selected three different sets of three-
component ground motion records so as to compare results. He concluded that none of
the buildings, whether they adhered to wind drift limits or not, would satisfy the life-
safety performance level for existing buildings as given by FEMA-356 (Kishnan, 2007.)
Kishnan also concluded that the results from his investigation were similar to results
found in structures after the 1994 Northridge earthquake. While the stress concentration
in reentrant corners was not a part of his primary investigation, he did comment on it.
Kishnan concluded that the specific stress concentrations were averaged out over a large
area near the reentrant corners. The results were also inconclusive in regards to an
increase in stress concentration in the reentrant corners since a stress concentration
increase in the reentrant corners was only noticed in one of the two models containing
reentrant corners. A more rigorous and detailed analysis is required to conclusively rule
out the incidence of stress concentration at the reentrant corners (Kishnan 2007.)
J.A. Amin and A.K. Ahuja, of the Department of Civil Engineering, Sardar
Vallbhbhai Patel Institute of Technology, Vasad, India, investigated the effects of wind
induced pressures on buildings of various geometries (Amin and Ahuja, 2011.) The
10
purpose of their investigation was to determine the efficiency of irregular building plan
shapes in which the wind pressure distribution changed, depending on the wind direction.
A secondary purpose was to provide information on wind pressure distributions, as well
as mean and peak pressure coefficients over an extended range of incidence wind
directions (Amin & Ahuja, 2011.) Their study consisted of two L-shaped and two T-
shaped models of varying heights and dimensions. Pressure tape was then placed
strategically on the different models so that on all sides of the models a good pressure
distribution could be obtained (Amin & Ahuja, 2011.) The models were tested using a
wind tunnel so as to simulate actual conditions that a structure might encounter if it was
located in an area of open country terrain. In their results they noted that, unlike
structures that are purely rectangular in shape where symmetry is observed over the
vertical centerline for the wind pressure coefficient distribution, this was not the case
with the irregular shaped models. Instead they noted that as one neared the reentrant
corners of the structures the pressures increased due to the blockage of wind flow and
subsequent stagnation of the flow (Amin & Ahuja, 2011.) This was observed and noted
across all of their models. They also concluded that the amount of pressure and the size
of the stagnation zone were based on the dimensions of the structure and the angle at
which the wind was coming from.
Results from these experiments conclude that size of the reentrant corner, based
on the dimensions of the building, has an impact on the forces seen in the reentrant corner
region. From Songlai, Chengmou, and Jinglong’s study (Songlai, Chengmou, &
Jinglong, 2010), if the reentrant corner is less than a certain dimension, based off of other
criteria, it can adequately withstand lateral loads without visible damage being observed.

11
Again, their results confirmed a pervious finite element study by Prion (Prion and Lam,
2000), which gave parameters to a maximum size reentrant corner that a structure could
have without visible damage being observed in the reentrant corner under lateral loading.
In Amin and Ahuja’s study (Amin & Ahuja, 2011), they found that they dimensions of
the structure and the direction that the wind was coming had a direct correlation to the
size of the stagnation zone and the magnitude of the pressure in the reentrant corner. As
the height of the structure or the length of the projection increased, so did the stagnation
zone and the pressure. While both of these studies comment more globally about the
impacts of lateral loads on reentrant corners, they do not look actually look at the forces
in the structure at the reentrant corner. Kishnan (Kishnan, 2007) addressed this issue
more in his study but concluded that his results were inconclusive and that a detailed
finite element approach needed to be taken in order understand stress concentrations that
develop in the reentrant corner region.

12
CHAPTER 2: ANALYSIS PROCEDURE
2.1 Scope of Testing
A parametric study was performed to understand lateral loads’ effect on reentrant
corners using finite element analysis and SAP2000 (Computers and Structures, 2011).
Specifically, the purpose of the study was to examine the resulting force concentration in
the reentrant corner caused by a lateral loading event so as to improve understanding that
would eventually help lead to designing and constructing more robust structures.
The study consisted of light-frame, timber models that were developed in
SAP2000. The building configuration used to investigate the forces in the reentrant
corner consisted of an L-shaped building; one leg was kept at a fixed dimension and the
other leg was given variable dimensions. All of the models were based on the planar
dimensions of the constant leg, which were 48 x 24 ft. In this study, each model was
loaded under the same uniformly distributed load. The response parameters that were
investigated to quantify the effects of lateral loads on reentrant corners were: 1) the
change in chord and strut forces with respect to the length of the variable leg of the
building, and 2) the change in chord and strut forces when interior walls were added
along the length of the variable leg of the building.
2.2 Parameters of Parametric Study
There were two main parts of the parametric study of lateral loads on reentrant
corner structures. The first part of the study examined how the length of the leg of the
building wing perpendicular to the loading affected the diaphragm chord and strut force
concentrations observed at the reentrant corner. The second part of the study examined
how the addition of interior shear walls in the leg perpendicular to the loading affected
13
the diaphragm chord and strut forces in the reentrant corner. These parametric studies
were designed in such a way so as to bring new understanding to potential damage
problems seen in reentrant corner structures after major lateral loading events.
The first part of the parametric study examines how relative size affects forces in
the reentrant corner. The dimensions of one of the legs of the structure (main axis parallel
to the loading) was held constant while the dimensions for the other leg (main axis
perpendicular to the loading) were varied. The dimensions of the varied length were
based off of the dimensions of the constant leg. For this particular study, the constant
leg’s plan dimensions were 48 x 24 ft. The dimensions for the variable leg were then set
as a percentage of the constant leg’s length.
The dimensions for the variable leg were defined as a percentage of the length of
the constant leg because of how ASCE 7-10 defines a reentrant corner. In its definition,
so as to make it applicable to any structure, ASCE 7-10 uses percentages of lengths to
define dimensions of a structure. This same concept of using percentages of length to
define the dimensions of the building was used in this study so as to make the results
applicable beyond the scope of the models used to analyze the building. For this study,
the minimum length of the variable length leg was 15% of the long dimension of the
constant leg. This dimension was less than the minimum requirement for a reentrant
corner as defined in ASCE 7-10. From the minimum defined length, the dimensions of
the variable leg increased to 25% of the long dimension of the constant leg. After this
point the dimensions of the variable leg were increased at intervals of 25%, ending at
300% of the long dimension of the constant leg. All of the models in the study were
14
loaded under the same distributed load, from the same direction, so that the only variable
in this part of the study was the dimensions of the variable leg.
In the second part of the parametric study, interior shear walls were added to
examine how the forces in the reentrant corner are affected by the additional paths for
extraction of the diaphragm loads. For this part of the study, the variable length leg of
the diaphragm was held at 300% of the fixed length leg. Its selection was based on it
being the largest model used in the first part of the study, and it allowed for the addition
of more interior shear walls than the other models. Interior shear walls were added one at
a time, at equal intervals, up to eight interior shear walls. For instance, when one shear
wall was added, it was located approximately at the one-half point of the longer leg of the
diaphragm. When two shear walls were included, they were located approximately at the
one-third points of the longer diaphragm leg. When three shear walls were used, they
were located approximately at the one-quarter points of the longer diaphragm leg, and so
on for the remainder of the study. Again, like the first part of the parametric study, each
of the models was loaded under the same distributed load, from the same direction so that
the only variable parameter was the number of interior shear walls. Again, the purpose of
adding the interior shear walls was to examine how the addition of alternate load paths, in
the form of shear walls, affects the forces in the reentrant corner.
2.3 DEVELOPMENT OF MODELS
SAP2000 was the modeling software chosen for this study. It was chosen based
on its availability and the fact that it is a commonly used program for structural modeling
and finite element analysis. The main difficulty with using SAP2000 is that it comes
preprogrammed with concrete and steel cross sections and materials, but not timber.
15
Since the focus of this study was light-frame timber structures, each of the cross sections
of members and material properties had to be manually programmed into SAP2000. A
detailed description of how material cross sections and material properties were
programmed into the software can be found in the following sections. A description of
how these parts were then combined to develop the models for the parametric study also
follows.
2.3.1 Development of Material Properties
In order to define a member’s cross sectional parameters, its material property
must be defined first. In SAP2000, material properties are defined through the Define
Materials command located in the Define menu. For this particular study, the material
properties for Number 2 grade Douglas-Fir Larch, and manufactured I-joists are defined.
Douglas-Fir Larch was chosen as a material for the wall studs based on it use and
availability as a building material on the West Coast. I-joists are used as roof joists
because of their ability to span long distances.
Material property values for the Douglas-Fir Larch came from Table 4A of the
NDS and material properties for the I-joist came from the manufacturer’s specifications,
which can be found in Appendix A.
2.3.2 Development of Material Cross Sections
The cross-sections for new materials were developed in a similar manner to how
the new material properties were set up in SAP2000. For the purpose of this study, the
cross section properties for a 2 x 4 and an I-Joist were programmed into the software.
Section property values for the 2 x 4 were taken from Table 1B of the NDS, and the
16
section properties for the I-Joist were taken from manufacturer’s specifications which can
be found in Appendix A.
2.3.3 Development of Non-linear Links
Instead of using areas to simulate sheathing for the models, it was proposed to use
non-linear links or springs. This was proposed based on modeling work previously done
for the NEESWood Capstone Building. (Pryor, van de Lindt, & Pei, 2010) The
development of links in SAP2000 is similar to that of developing material cross sections.
To generate links, the Link/Support Properties command, found under Define, Section
Properties, is used. For this study, a Multi-Linear Plastic Link type was chosen. By
choosing Multi-Linear Link type it allows links to simulate the nonlinear response of
each sheathing panel in a shear wall or diaphragm under lateral loads. The values for the
force and displacement are based on height and width of wall or roof segments, nailing
schedule, stiffness, inter-story drift, and angle of inclination for the link.
For this study, two different links were developed: one for the wall panels and one
for the roof panels. The links for the walls were based on wall segments that were 12 x 4
ft. Four feet was chosen as the width of the wall segment based on the nominal width of
a sheet of wood structural panel (WSP) sheathing. Twelve feet was chosen as the height
based on the height of the structure and could be constructed using oversized OSB wall
sheathing in reality, or the segment could represent 1.5 sheets of sheathing and after
being blocked and nailed properly. Since it was the main part of the diaphragm, it was
decided to keep the links in the roofs as similar to standard WSP sheathing dimensions as
possible. For that reason the roof links represented 4 x 8 ft panels. Two links were used
17
to simulate each sheet of sheathing so as to take into account both the tensile and
compressive capacities of the sheathing.
As previously stated, the development of the links was based off of work done for
computer modeling of the NEESWood Capstone Building. As part of the shear wall
calculations, Pang, et al, (2010) determined the shear wall backbone curves (force versus
displacement). The modified Stewart hysteretic model, which is a five-parameter
equation, was used to define the shear wall backbone curve. From here they were able to
develop a displacement-based shear wall design table per unit wall length. These forces
compared the backbone forces to different drift levels to the type of sheathing, edge nail
spacing and height of the wall. With this table defined, other correlating parameters such
as secant stiffness (Ks) and apparent shear stiffness (Ga) can be derived. By knowing Ks
and Ga, as well as the nailing schedule and dimensions of wall segments, the Multi-
Linear Force-Deformation definition for the links can be developed. The same procedure
as used for the NEESWood Capstone Building was used in this study, but modified to fit
the parameters of this study. The data for the Multi-Linear Force-Deformation definition
was obtained from tests conducted by Steve Pryor (2009) can be found in Appendix D.
2.3.4 Development of Models
As previously stated in the description of the parametric study, this study focused
on the effects of lateral loads on the reentrant corner of L-Shaped structures. To maintain
uniformity and consistency between the models, one leg of the L-Shape structures
remained constant. The dimensions of the variable leg were based on this constant leg’s
dimensions. The dimensions for the constant leg were 48 x 24 x 12 ft. The plan
dimensions of 48 x 24 ft. were chosen based on the standard size of sheathing of 4 x 8 ft.

18
Since 48 and 24 are both divisible by 4 and 8, “whole” sheets of sheathing can be used on
the diaphragm, thus simplifying the model. The models’ wall heights of 12 ft. were
based on engineering judgment that the appropriate height for a single story structure is
12 ft.
The purpose of leaving one leg constant was so the dimensions of the other
variable leg could be changed without changing the fixity experienced at the reentrant
corner. As previously stated, the dimensions of the variable leg were percentage lengths
of the plan projection of the constant leg’s length so that the results of the study should be
applicable beyond the results for the particular building used for this study. A length of
15% of the long dimension of the constant leg was chosen as the minimum length for the
variable leg. For this particular case, the plan dimensions of the variable leg were 7.2 x
24 ft. The next interval length for the variable leg was 25% of the plan length of the
constant leg. From this point, the length of the variable leg increased at intervals of 25%
up to 300% of the plan length of the constant leg. At a length of 300% of the plan length
of the constant leg, the dimensions of the variable leg were 144 x 24 ft. Again, the
lengths of the variable leg were based on percentages of the length of the constant leg so
that the results would be applicable beyond the scope of the study.
The walls supporting the legs of the diaphragm were modeled as being 2 x 4’s, 2
ft. on center. Each stud in the model was constrained as if it was pinned at both ends in
both horizontal directions to simulate the lack of fixity for end-grain nailed connections.
The bottom and top plates were also modeled as 2 x 4’s. In the model, the plates were
only 2 ft. long, each going from stud to stud. However, the end constraints for the plates
were assigned to be continuous along the length of the wall. So while they consisted of
19
2- ft. segments, all together they acted like one unit. For the roof joists, I-joists were
selected since they would have the ability to span a 24 ft. distance without any
intermediate support. As described in the last section, non-linear links or springs were
used to simulate the sheathing in the models.
Between the constant leg and the variable leg, there existed a 24 x 24 ft. box that
connected the two legs together. This box was not considered in the length or dimensions
of either of the legs. However, for the purpose of the roof diaphragm, the roof was
sheathed as a continuation of the variable leg. The two interior wall faces of the block
were set up so that their lateral mechanical properties were essentially zero. Assigning
these wall segments to have essentially zero lateral stiffness and strength properties
forces the roof diaphragm to act either as a strut or a chord, depending on direction, under
loading at the reentrant corner. This configuration, therefore, allows one to study the
effects of lateral loads in the diaphragm at the reentrant corner. The mechanical
properties of the interior wall sharing its face with the variable leg were later set to match
the mechanical properties of the exterior walls when the effects of how the addition of
interior shear walls affects the forces in the reentrant corner was examined.
Unlike an actual structure that one would build, no openings exist in any of the
models to avoid the added complication that the openings would cause in affecting the
load path of the diaphragm or shear walls. Again, the purpose of this particular study is
to examine how lateral loads affect forces in reentrant corners and to gain base level
knowledge on the matter. Once this has been achieved, additional parameters can be
added or modified to widen that knowledge. This is the same reason why a flat roof was
chosen instead of the common pitched roof associated with gable roofs.
20
2.4 DEVELOPMENT AND APPLICATION OF LATERAL LOADS
Since the focus of this study is to quantify how lateral loads affect reentrant
corner structures, an appropriate lateral load needed to be developed. For the purpose of
keeping the computer models as realistic as possible, it was decided to apply a wind load
to the structure instead of applying just an arbitrary load for testing. Based on wind load
requirements from Chapter 26 of ASCE 7-10 (ASCE, 2010), the models were designated
as Risk Category II thus making the basic wind speed on the west coast 100 mph. The
models were also designated to be in Exposure Category B. With this information and
using the procedures for the Main Wind Force Resisting System from Chapter 28 of
ASCE 7-10 (ASCE, 2010) a pressure of 19.2 psf was calculated. To determine the
distributed load, half of the height of the structure was taken and multiplied against the
wind pressure. This gave a distributed load of 115.2 plf. A full calculation of the
distributed load can be found in Appendix C.
It was found in the development of the models that the distributed load needed to
be applied at nodes where the springs intersected with the exterior of the structure in
order to be transferred throughout the structure correctly. Tributary area was used to
determine the appropriate point load to be applied at each of the nodes. Figure 2.1 shows
the value and location of the point loads. Calculations for these point loads can be found
in Appendix C.

21
Figure 2.1 Magnitude and Location of Point Loads on Models
2.5 VERIFICATION OF MODELS
To verify the models and to determine if the models behaved similarly to actual
structures, the defection of the diaphragm as predicted by SAP2000 was compared to the
deflection calculated using the Special Design Provisions for Wind and Seismic
(SDPWS) (2005). The model with the variable leg at 300% of the constant leg was
chosen to compare values, since it had the greatest deflection of any of the models due to
Non-Linear Links
Framing Members
22
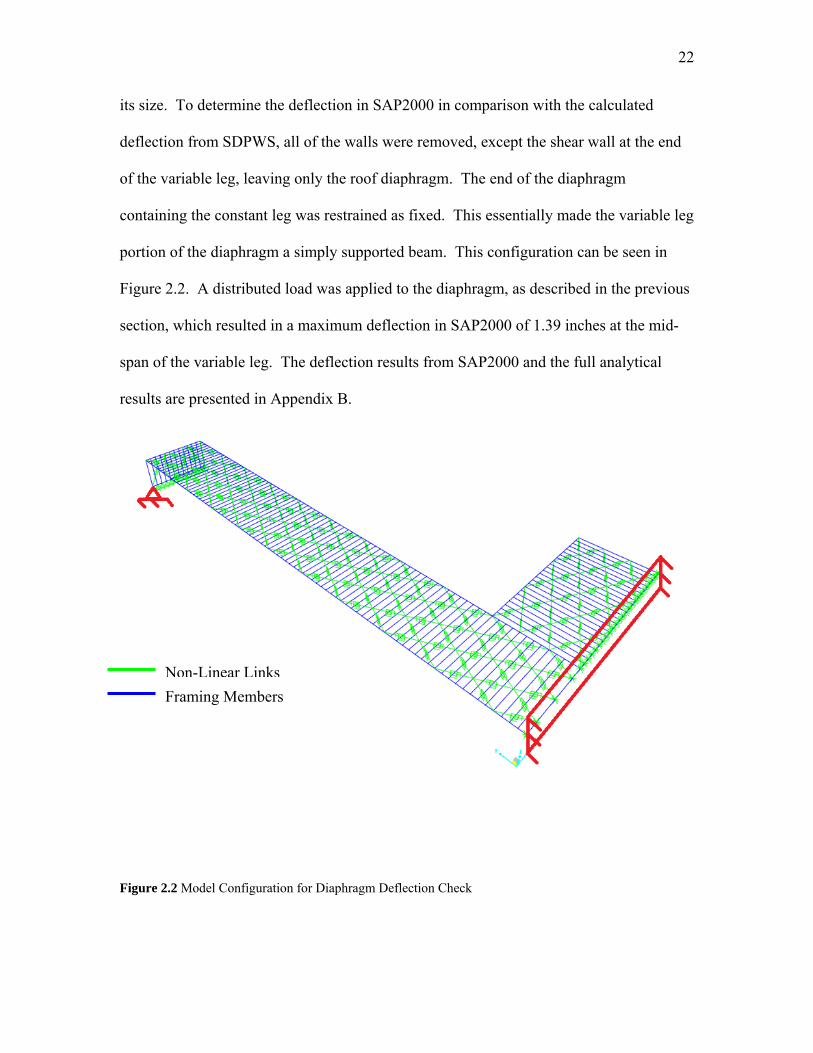
its size. To determine the deflection in SAP2000 in comparison with the calculated
deflection from SDPWS, all of the walls were removed, except the shear wall at the end
of the variable leg, leaving only the roof diaphragm. The end of the diaphragm
containing the constant leg was restrained as fixed. This essentially made the variable leg
portion of the diaphragm a simply supported beam. This configuration can be seen in
Figure 2.2. A distributed load was applied to the diaphragm, as described in the previous
section, which resulted in a maximum deflection in SAP2000 of 1.39 inches at the mid-
span of the variable leg. The deflection results from SAP2000 and the full analytical
results are presented in Appendix B.
Figure 2.2 Model Configuration for Diaphragm Deflection Check
Non-Linear Links
Framing Members
23
Equation 4.2.2-2 from SDPWS was used to manually calculate the deflection of
the diaphragm. It was assumed that no chord connection slip would occur, thus making
that part of the equation zero. Values for the rest of the variables came from either the
model itself or from manufacture’s specifications. The diaphragm deflection was
calculated to be 1.37 inches. A full calculation of the diaphragm deflection can be found
in Appendix B. Since there is only a 0.02 inch or 1.5% difference between the
diaphragm deflection given by SAP2000 and the calculated diaphragm deflection from
SDPWS it was presumed that the models were acting reasonably.
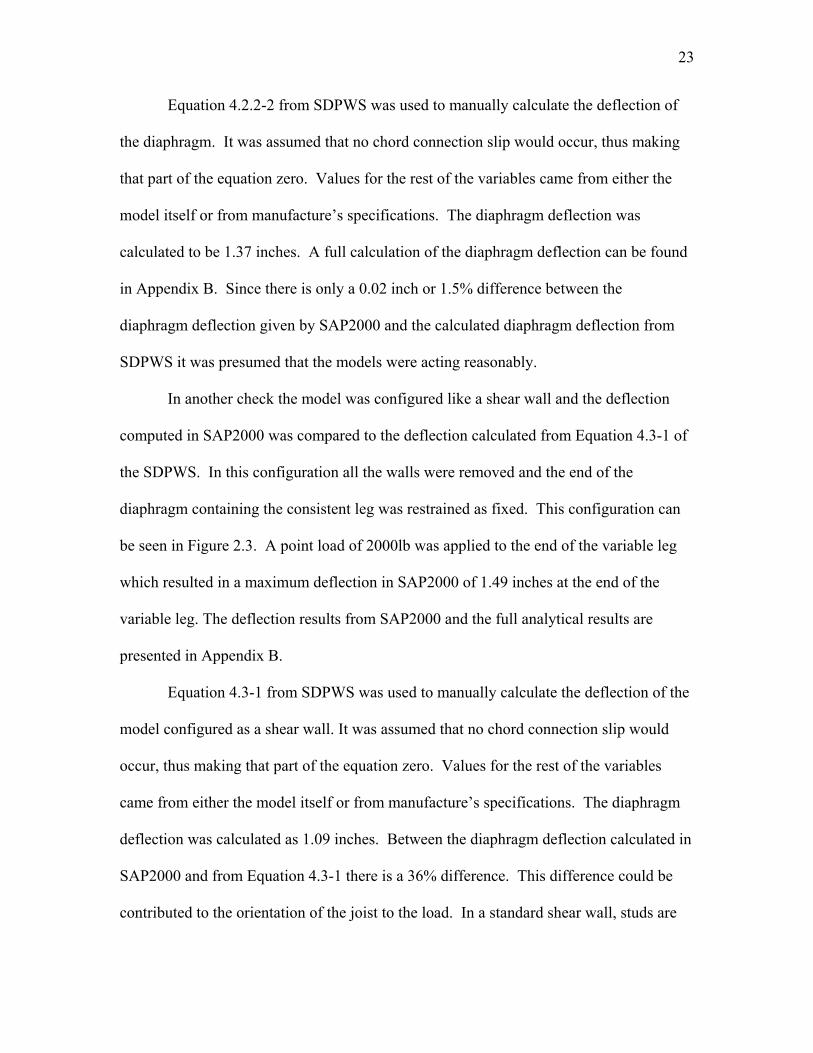
In another check the model was configured like a shear wall and the deflection
computed in SAP2000 was compared to the deflection calculated from Equation 4.3-1 of
the SDPWS. In this configuration all the walls were removed and the end of the
diaphragm containing the consistent leg was restrained as fixed. This configuration can
be seen in Figure 2.3. A point load of 2000lb was applied to the end of the variable leg
which resulted in a maximum deflection in SAP2000 of 1.49 inches at the end of the
variable leg. The deflection results from SAP2000 and the full analytical results are
presented in Appendix B.
Equation 4.3-1 from SDPWS was used to manually calculate the deflection of the
model configured as a shear wall. It was assumed that no chord connection slip would
occur, thus making that part of the equation zero. Values for the rest of the variables
came from either the model itself or from manufacture’s specifications. The diaphragm
deflection was calculated as 1.09 inches. Between the diaphragm deflection calculated in
SAP2000 and from Equation 4.3-1 there is a 36% difference. This difference could be
contributed to the orientation of the joist to the load. In a standard shear wall, studs are
24
oriented perpendicular to the applied load. In this case, because of how the model was
set up, the joist are oriented parallel to the applied load. With the joist oriented parallel to
the applied load instead of perpendicular when the model is analyzed as a shear wall it is
going to be more flexible and thus deform more. Equation 4.3-1 assumes
Figure2.3 300% Model Configured as a Shear Wall

25
that the joist or studs are configured perpendicular to the applied load. This explains why
the deflection in SAP2000 is greater than the deflection calculated from Equation 4.3-1.
Having shown that the models acted similarly to real structures, the parametric study was
initiated.
Another way the model was verified was by comparing the deflected shapes and
forces in the model to what you would expect from beam analysis. The model with the
variable leg being 300% of the constant leg was again used in this comparison. In the
model’s original condition, without any modifications, it was assumed that under loading,
the model would behave like a simply supported beam with one support being the end
wall at the end of the variable leg and the other support being at the reentrant corner
where the variable leg comes into the constant leg. This configuration can be seen in
Figure 2.4.
Figure 2.4 300% Model without any modifications

26
In a simply supported beam, the maximum deflection and moment occurs at the mid-span
of the beam and are zero at either end of the beam. The model loaded with a 115 plf
uniform load going right to left. In this configuration, the model deformed similarly to
how a simply supported beam deforms. The undeformed shape verses the deformed
shape can be seen in Figure 2.5.
Figure 2.5 Deformed shape verses undeformed shape of 300% model
27
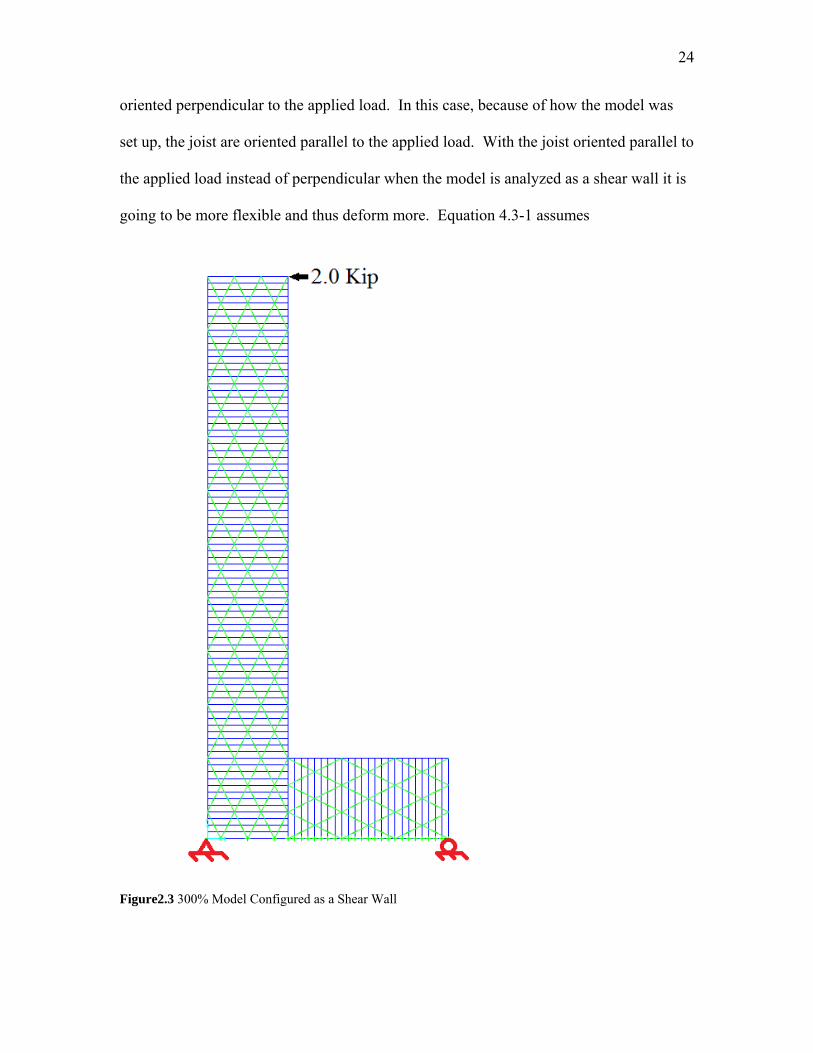
The maximum axial forces in the chords of the diaphragm in the model at the mid-span,
the end of the variable leg, and at the reentrant corner were compared to determine where
the maximum forces were occurring. As with a simply supported beam, where the
maximum moment is at the mid-span, the maximum axial forces in the model chords
were found at the mid-span and decreased in value as you moved to the supports. The
comparison of the axial forces can be seen in Figure 2.6 and Table 2.1.
Figure 2.6 Labeled Axial Members at reentrant corner, mid-span, and end of 300% Model Table 2.1 Axial forces at reentrant corner, mid-span, and end of 300% Model
It was also noted that the axial forces at the end of the variable leg, and at the reentrant
corner were not zero as you would expect with a simply supported beam. This was found
305
4 1 551
344
343
342
341
340
339
338
337
338
337
339
338
337
340
339
338
337
341
340
339
338
337
342
341
340
339
338
337
343
342
341
340
339
338
337
344
343
342
341
340
339
338
337
878
877
876
875
873
872
871
803

28
to be from the non-linear links and the residual force left in them. With the addition of
more links in the roof diaphragm to reduce the residual effect, the forces at the end of the
variable leg and at the reentrant corner did decrease and were more inline with the simply
supported beam theory. This test was rerun with the uniform load going from left to
right instead. The results were again consistent with the simple beam theory. The model
deformed similarly to a simply supported beam with the maximum axial force noted at
the mid-span. The results from this test can be found in Figure 2.7 and Table 2.2.
Figure 2.7 300% Model and deformed shape with Uniform load going from left to right Table 2.2 Axial forces in the 300% Model with uniform load going from Left to Right
305
4 1 551
344
343
342
341
340
339
338
337
338
337
339
338
337
340
339
338
337
341
340
339
338
337
342
341
340
339
338
337
343
342
341
340
339
338
337
344
343
342
341
340
339
338
337
878
877
876 875
873
872
871
803
29
Beyond comparing the model to a simply supported beam, it was also compared
to a cantilever beam. In order that the model might behave like a cantilever beam, the
end wall at the end of the variable leg was removed. The other end of the variable leg
that butts up to the consistent leg was assumed for comparison purposes to be the fixed
end. In this configuration it was assumed that the maximum deflection would be at the
end of the variable leg and the maximum axial forces would occur at the reentrant corner.
This would be consistent with cantilever beam theory where the maximum deflection
occurs at the free end and the maximum moment occurs at the fixed end. The model was
then loaded again from right to left with an 115plf uniform distributed load. As expected
the maximum deflection occurred at the end of the variable leg and the maximum axial
force was found to be in the reentrant corner. These results can be found in Figure 2.8
and Table 2.3.
30
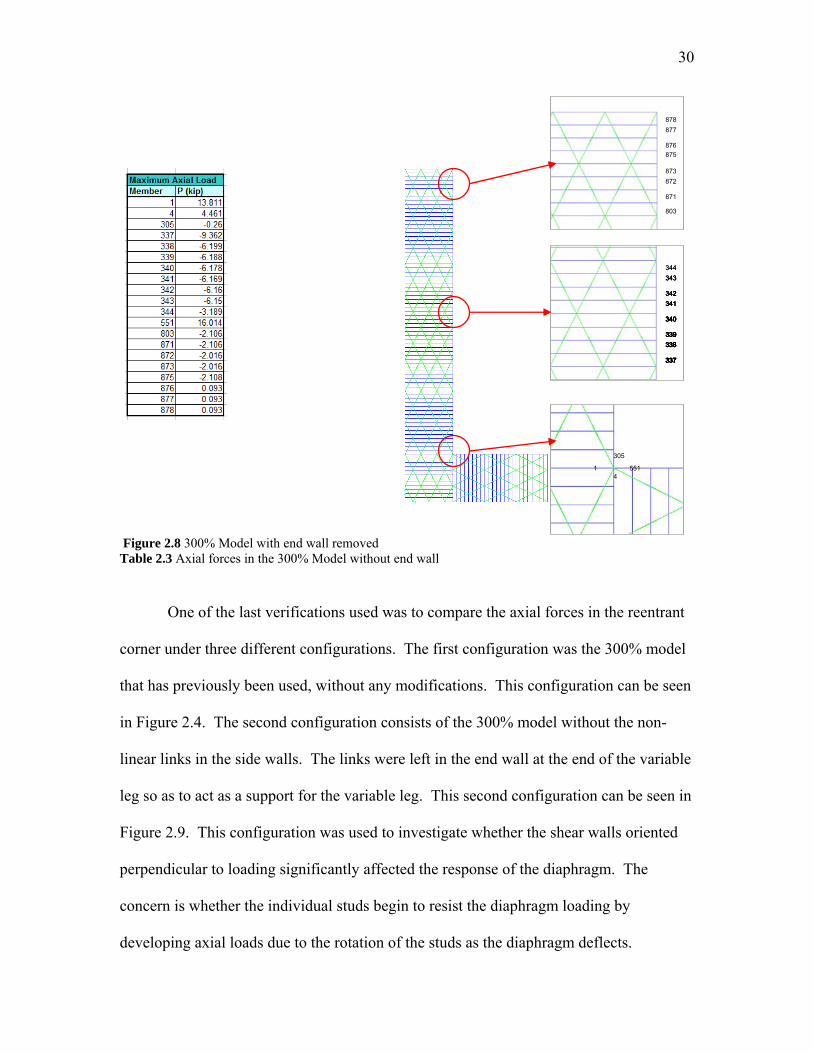
Figure 2.8 300% Model with end wall removed Table 2.3 Axial forces in the 300% Model without end wall
One of the last verifications used was to compare the axial forces in the reentrant
corner under three different configurations. The first configuration was the 300% model
that has previously been used, without any modifications. This configuration can be seen
in Figure 2.4. The second configuration consists of the 300% model without the non-
linear links in the side walls. The links were left in the end wall at the end of the variable
leg so as to act as a support for the variable leg. This second configuration can be seen in
Figure 2.9. This configuration was used to investigate whether the shear walls oriented
perpendicular to loading significantly affected the response of the diaphragm. The
concern is whether the individual studs begin to resist the diaphragm loading by
developing axial loads due to the rotation of the studs as the diaphragm deflects.
305
4 1 551
344
343
342
341
340
339
338
337
338
337
339
338
337
340
339
338
337
341
340
339
338
337
342
341
340
339
338
337
343
342
341
340
339
338
337
344
343
342
341
340
339
338
337
878
877
876
875
873
872
871
803
31
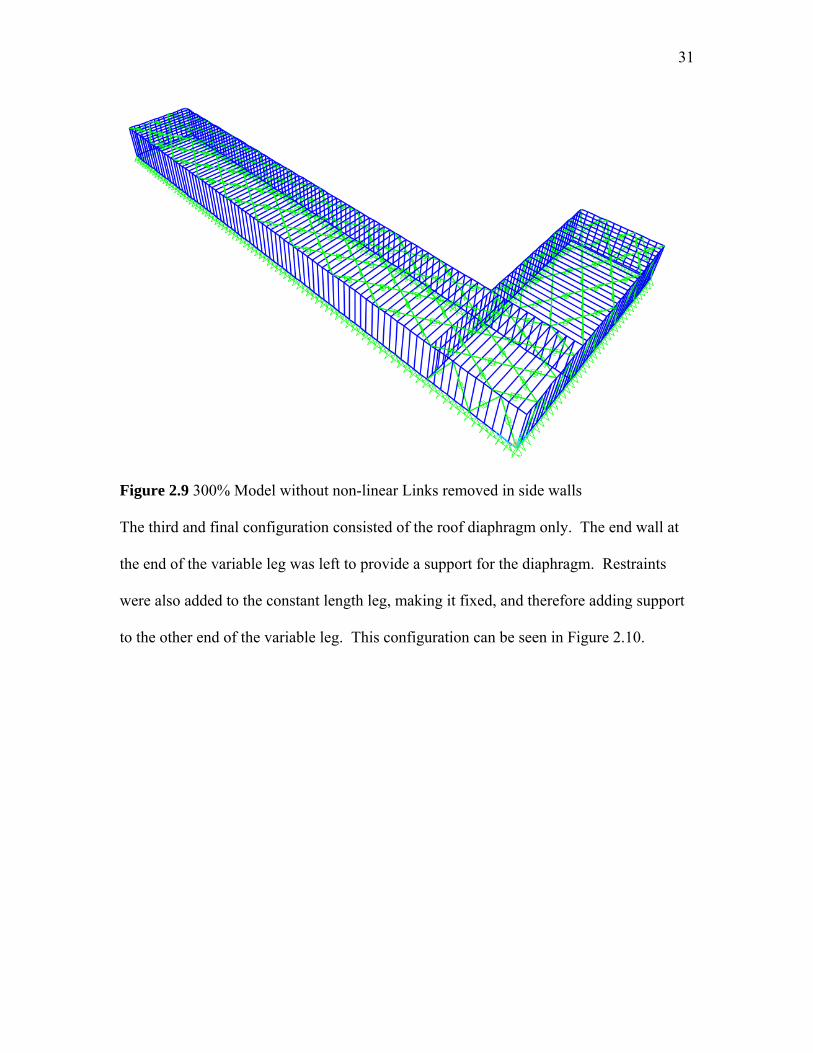
Figure 2.9 300% Model without non-linear Links removed in side walls
The third and final configuration consisted of the roof diaphragm only. The end wall at
the end of the variable leg was left to provide a support for the diaphragm. Restraints
were also added to the constant length leg, making it fixed, and therefore adding support
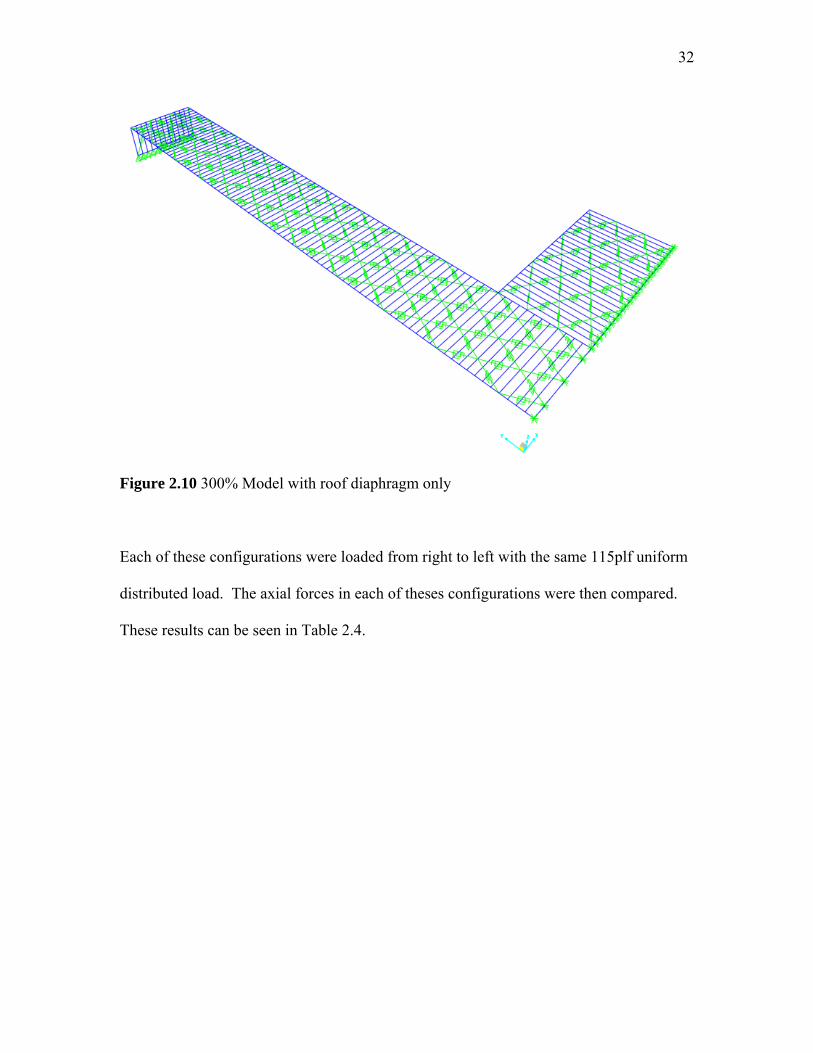
to the other end of the variable leg. This configuration can be seen in Figure 2.10.
32
Figure 2.10 300% Model with roof diaphragm only
Each of these configurations were loaded from right to left with the same 115plf uniform
distributed load. The axial forces in each of theses configurations were then compared.
These results can be seen in Table 2.4.
33
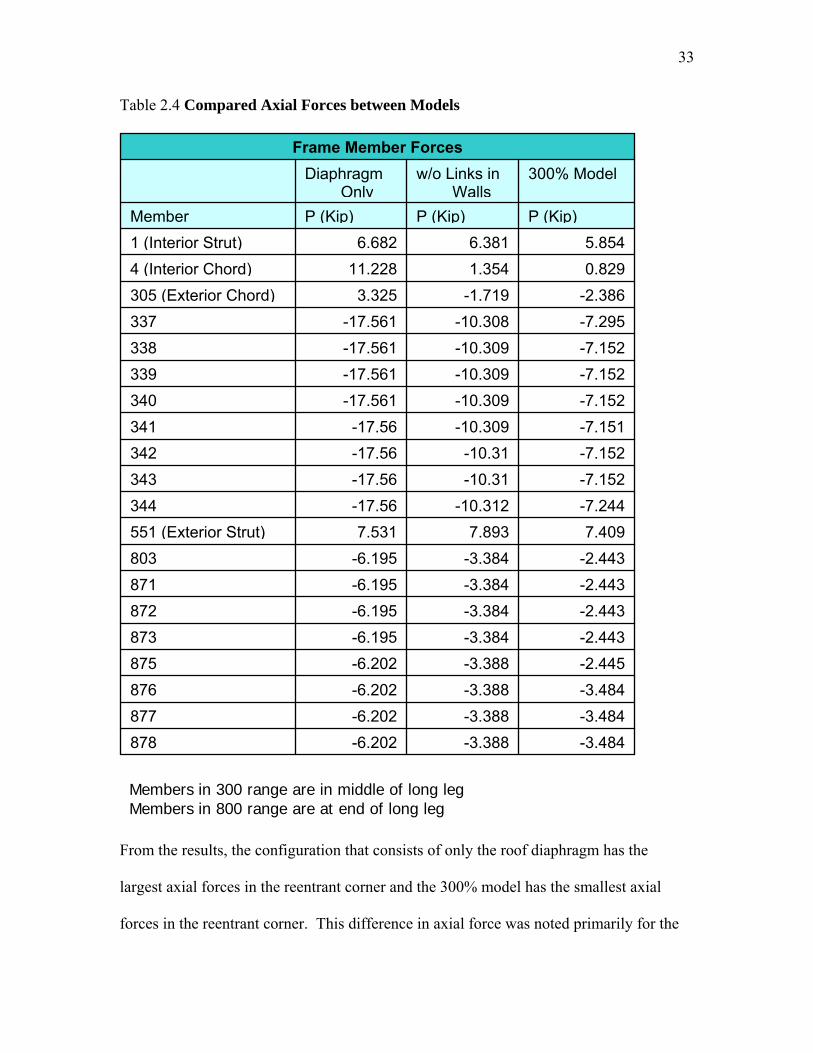
Table 2.4 Compared Axial Forces between Models
From the results, the configuration that consists of only the roof diaphragm has the
largest axial forces in the reentrant corner and the 300% model has the smallest axial
forces in the reentrant corner. This difference in axial force was noted primarily for the
Members in 300 range are in middle of long leg Members in 800 range are at end of long leg
-3.484 -3.388-6.202878 -3.484 -3.388-6.202877 -3.484 -3.388-6.202876 -2.445 -3.388-6.202875 -2.443 -3.384-6.195873 -2.443 -3.384-6.195872 -2.443 -3.384-6.195871 -2.443 -3.384-6.195803 7.409 7.8937.531551 (Exterior Strut)
-7.244 -10.312-17.56344 -7.152 -10.31-17.56343 -7.152 -10.31-17.56342 -7.151 -10.309-17.56341 -7.152 -10.309-17.561340 -7.152 -10.309-17.561339 -7.152 -10.309-17.561338 -7.295 -10.308-17.561337 -2.386 -1.7193.325305 (Exterior Chord) 0.829 1.35411.2284 (Interior Chord) 5.854 6.3816.6821 (Interior Strut)
P (Kip) P (Kip)P (Kip)Member
300% Model w/o Links in Walls
Diaphragm Only
Frame Member Forces

34
interior and exterior chord as there was no significant difference between the axial forces
in the interior and exterior strut between these different configurations. Based on the
results, the addition of stud-walls and sheathing (as represented by the non-linear links)
removes load from the top chord and transfers it to the foundation rather than transferring
the load through the diaphragm to the constant leg of the diaphragm. While in reality you
cannot have a “floating diaphragm” as configured in the diaphragm only model, the
results for the configuration without links in the walls, and for the 300% model are
consistent with what would be found in real structures. The addition of sheathing on a
stud wall in a real building stiffens the wall thus decreasing the deflection in the wall
under loading.
35
CHAPTER 3: RESULTS AND DISCUSSION
3.1 Introduction
The objective of this parametric study was to examine the force concentration
resulting in the reentrant corner under a lateral loading event, so as to improve
understanding on the issue. Combined, 30 different models were analyzed in this study.
Because of the high volume of data obtained from this study, a side-by-side analysis of
each of the models will not be preformed. A thorough explanation of how the data was
organized and arranged in general terms will be made. The remaining part of this chapter
focuses on the trends found in the data. Individual model results can be found in
Appendix E.
3.2 Parametric Study Results
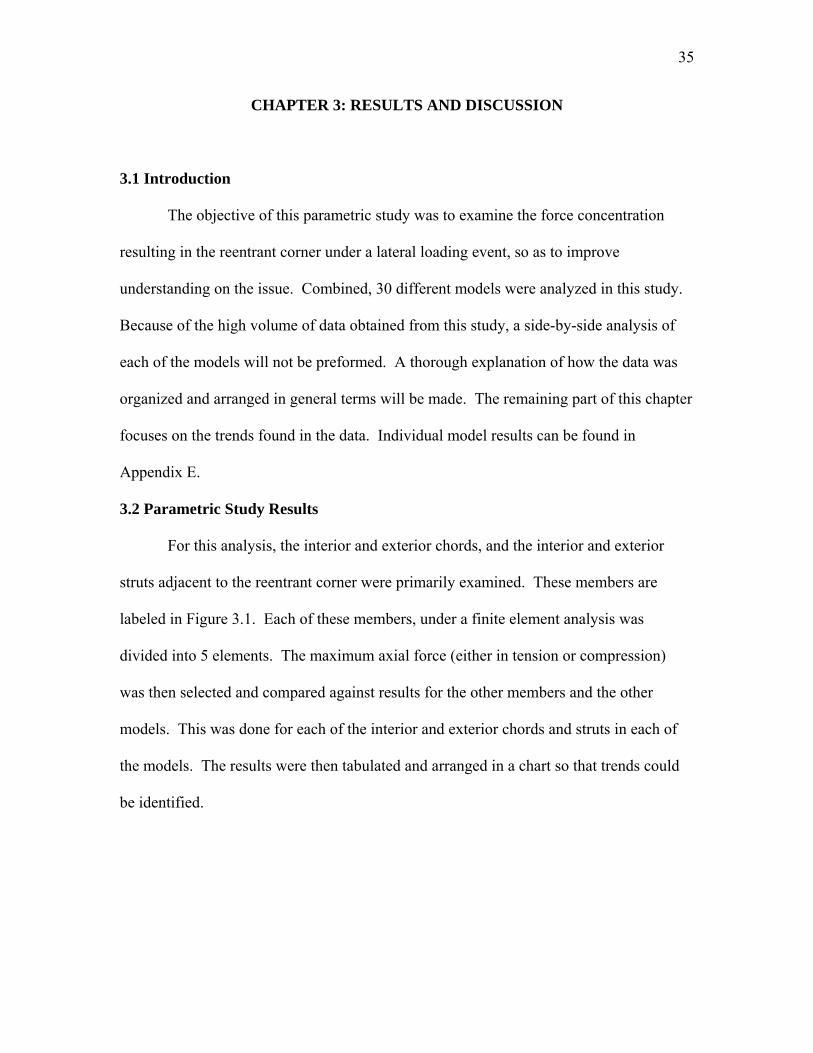
For this analysis, the interior and exterior chords, and the interior and exterior
struts adjacent to the reentrant corner were primarily examined. These members are
labeled in Figure 3.1. Each of these members, under a finite element analysis was
divided into 5 elements. The maximum axial force (either in tension or compression)
was then selected and compared against results for the other members and the other
models. This was done for each of the interior and exterior chords and struts in each of
the models. The results were then tabulated and arranged in a chart so that trends could
be identified.
36
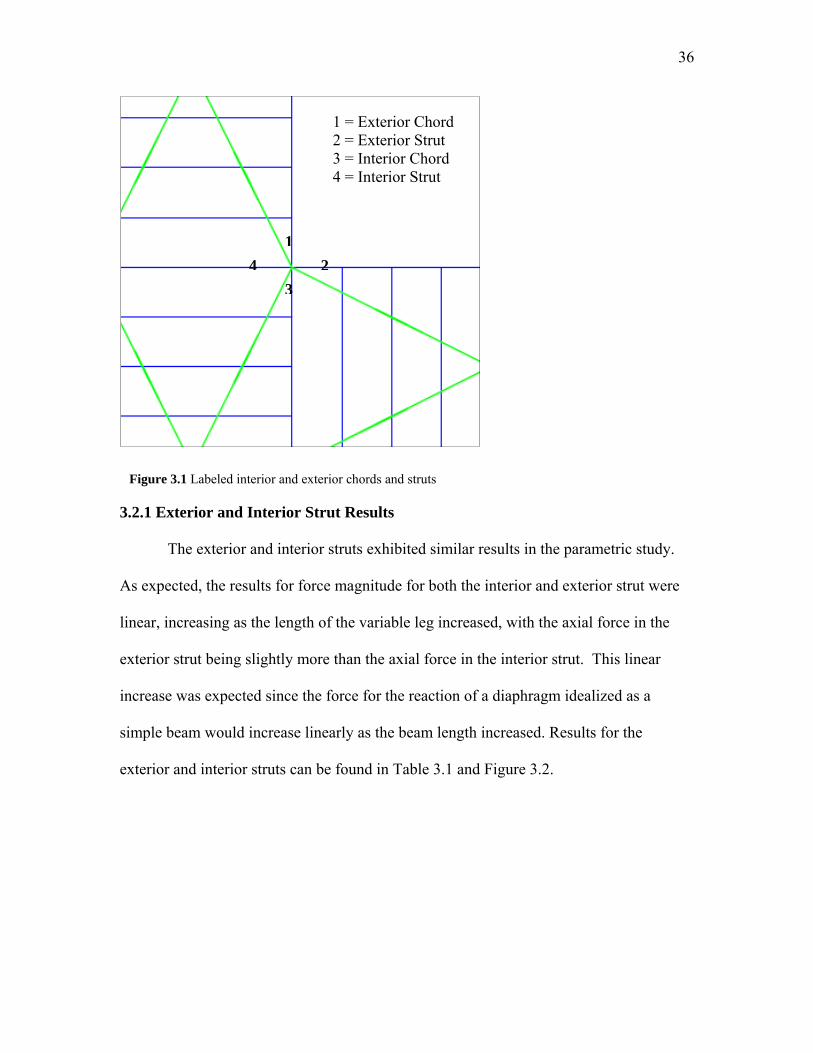
3.2.1 Exterior and Interior Strut Results
The exterior and interior struts exhibited similar results in the parametric study.
As expected, the results for force magnitude for both the interior and exterior strut were
linear, increasing as the length of the variable leg increased, with the axial force in the
exterior strut being slightly more than the axial force in the interior strut. This linear
increase was expected since the force for the reaction of a diaphragm idealized as a
simple beam would increase linearly as the beam length increased. Results for the
exterior and interior struts can be found in Table 3.1 and Figure 3.2.
1
4
3
2
1 = Exterior Chord 2 = Exterior Strut 3 = Interior Chord 4 = Interior Strut
Figure 3.1 Labeled interior and exterior chords and struts
37
Maximum Axial Force
Model Exterior Strut Interior Strut 15 0.008034 -0.32425 0.321 -0.03250 0.741 0.44475 1.351 1.118
100 1.768 1.581125 2.436 2.316150 2.925 2.856175 3.657 3.661200 4.234 4.295225 5.007 5.147250 5.621 5.825275 6.427 6.716
300 7.319 7.699
Maximum Axial Forces
-1
0
1
2
3
4
5
6
7
8
9
0 50 100 150 200 250 300 350
Model
Axi
al F
orc
e (k
ip)
Exterior Strut
Interior Strut
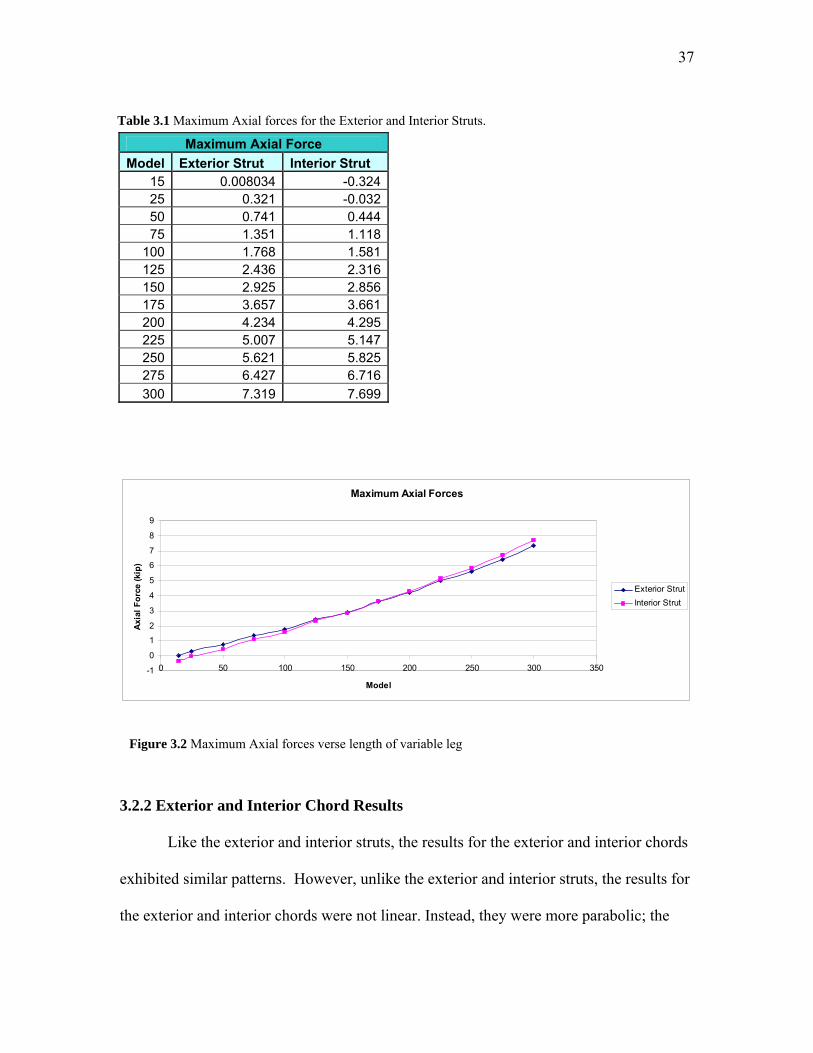
3.2.2 Exterior and Interior Chord Results
Like the exterior and interior struts, the results for the exterior and interior chords
exhibited similar patterns. However, unlike the exterior and interior struts, the results for
the exterior and interior chords were not linear. Instead, they were more parabolic; the
Figure 3.2 Maximum Axial forces verse length of variable leg
Table 3.1 Maximum Axial forces for the Exterior and Interior Struts.

38
axial forces in the interior chord were greater than the axial forces in the exterior chord.
Part of the reason why the exterior chord has slightly lower axial forces could be that the
exterior chord has a more direct load path than the interior chord. That is because the
exterior chord sits on top of an exterior wall, which also acts as a shear wall. The interior
chord, however, is not sitting over a shear wall. The interior chord is acting as a drag
strut, or collector, dragging the shear along its length until it reaches a point where the
load can be transferred down to the foundation; which, in this case, is at the reentrant
corner. Since the interior chord is dragging some of the shear from the diaphragm, the
resulting axial forces in it are going to be greater than those in the exterior chord. The
trends in the axial forces for both the exterior chord and interior chord can be seen in
Figure 3.3 and Table 3.2. It was initially assumed that the trend in the axial forces for the
interior and exterior chord would be linear, like the trend in the axial forces in the interior
and exterior struts. Since this was not the case, other aspects of beam theory were
examined. in order to understand the results for the interior and exterior chords.
Maximum Axial Force
Model Exterior Chord Interior Chord 15 -0.067 -0.10725 -0.152 -0.12150 -0.375 -0.24375 -0.511 -0.247
100 -0.705 -0.325125 -0.727 -0.218150 -0.808 -0.19175 -0.7 0.035200 -0.653 0.184225 -0.441 0.497250 -0.292 0.725275 -0.009607 1.092
300 0.298 1.489
Table 3.2 Maximum Axial forces for the Exterior and Interior Chords
39
Maximum Axial Force
-1
-0.5
0
0.5
1
1.5
2
0 50 100 150 200 250 300 350
Model
Axi
al F
orc
e (k
ips)
Exterior Chord
Interior Chord
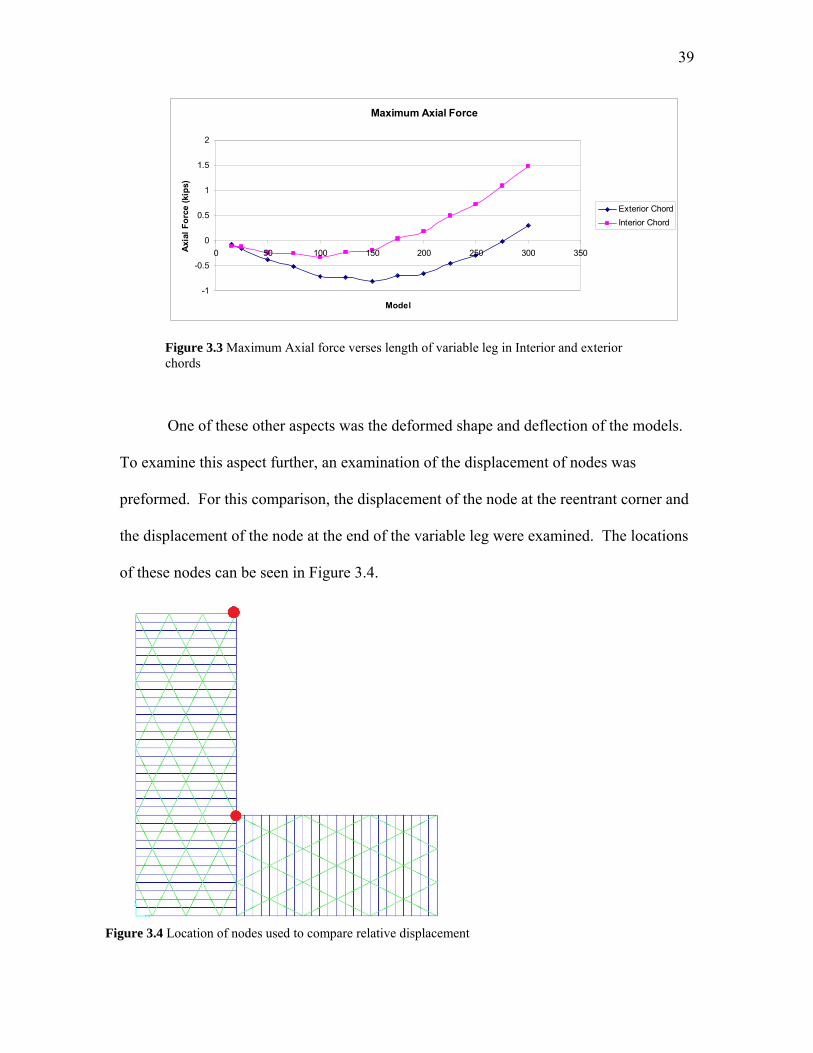
One of these other aspects was the deformed shape and deflection of the models.
To examine this aspect further, an examination of the displacement of nodes was
preformed. For this comparison, the displacement of the node at the reentrant corner and
the displacement of the node at the end of the variable leg were examined. The locations
of these nodes can be seen in Figure 3.4.
Figure 3.3 Maximum Axial force verses length of variable leg in Interior and exterior chords
Figure 3.4 Location of nodes used to compare relative displacement
40
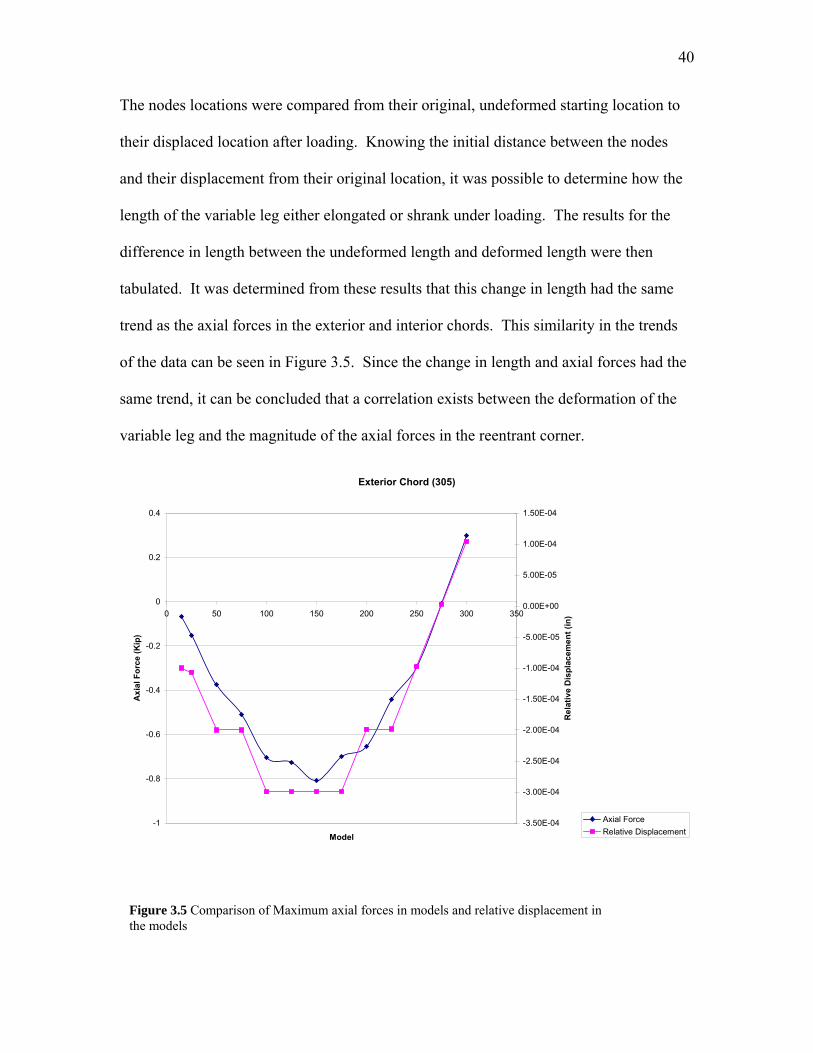
The nodes locations were compared from their original, undeformed starting location to
their displaced location after loading. Knowing the initial distance between the nodes
and their displacement from their original location, it was possible to determine how the
length of the variable leg either elongated or shrank under loading. The results for the
difference in length between the undeformed length and deformed length were then
tabulated. It was determined from these results that this change in length had the same
trend as the axial forces in the exterior and interior chords. This similarity in the trends
of the data can be seen in Figure 3.5. Since the change in length and axial forces had the
same trend, it can be concluded that a correlation exists between the deformation of the
variable leg and the magnitude of the axial forces in the reentrant corner.
Exterior Chord (305)
-1
-0.8
-0.6
-0.4
-0.2
0
0.2
0.4
0 50 100 150 200 250 300 350
Model
Ax
ial F
orc
e (
Kip
)
-3.50E-04
-3.00E-04
-2.50E-04
-2.00E-04
-1.50E-04
-1.00E-04
-5.00E-05
0.00E+00
5.00E-05
1.00E-04
1.50E-04
Re
lati
ve D
isp
lac
emen
t (i
n)
Axial Force
Relative Displacement
Figure 3.5 Comparison of Maximum axial forces in models and relative displacement in the models

41
Since the trend in the data between the axial forces in the interior and exterior
chords and the change in distance between the node at the reentrant corner and the end of
the variable leg were so similar, led to examining how chord forces are determined for a
diaphragm. Chord forces for the diaphragm are determined by dividing the bending
moment of the diaphragm by the depth of the diaphragm. In the 15% model, the smallest
model in this study, the bending moment near the reentrant corner is relatively minimal
compared to the depth of the diaphragm. In this case the diaphragm is quite stiff and
doesn’t deform as much. This results in low chord forces. Since the bending moment is
a function of the length of the diaphragm, as the length of the diaphragm changes so does
the bending moment. For the smaller models, such as the 15% model through 75%
model, the diaphragm acts more like a propped cantilever. In these cases the diaphragm
in the variable leg is quite stiff so almost acts in one unit with the constant leg under
loading. As the length of the variable leg increases it starts to become more flexible thus
starts to behave more like a simply supported beam than a propped cantilever. As it
transitions from a propped cantilever to a simply supported beam, the diaphragm in the
variable leg becomes more flexible and starts to act and deform separately from the
constant leg. It is this transition between the diaphragm acting like a propped cantilever
and a simply supported beam that causes the trend in the axial forces interior and exterior
chords to be more parabolic. In the 15% model through the 75% model the diaphragm
act more like a propped cantilever system leading to the negative trend in the data.
Between the 75% model and the 225% model the diaphragm is transitioning from a
propped cantilever system to a simply supported beam system. This is the area in the
data where the direction is changing from a negative slope to a positive slope. Finally,
42
from the 225% model to the 300% model the diaphragm acts like a simply supported
beam system. This causes the positive trend for the axial forces in the interior and
exterior chord.
3.2.3 Interior Wall Results
The second part of this study examined how the addition of interior shear walls, to
the variable leg of the building, affected the forces in the reentrant corner. As assumed,
the addition of interior walls decreased the axial forces in the reentrant corner, with the
most significant decrease in forces seen in the addition of just one interior shear wall.
After the addition of 4 interior shear walls, the change in the magnitude of the axial
forces in the members becomes insignificant. The decrease in axial forces in the interior
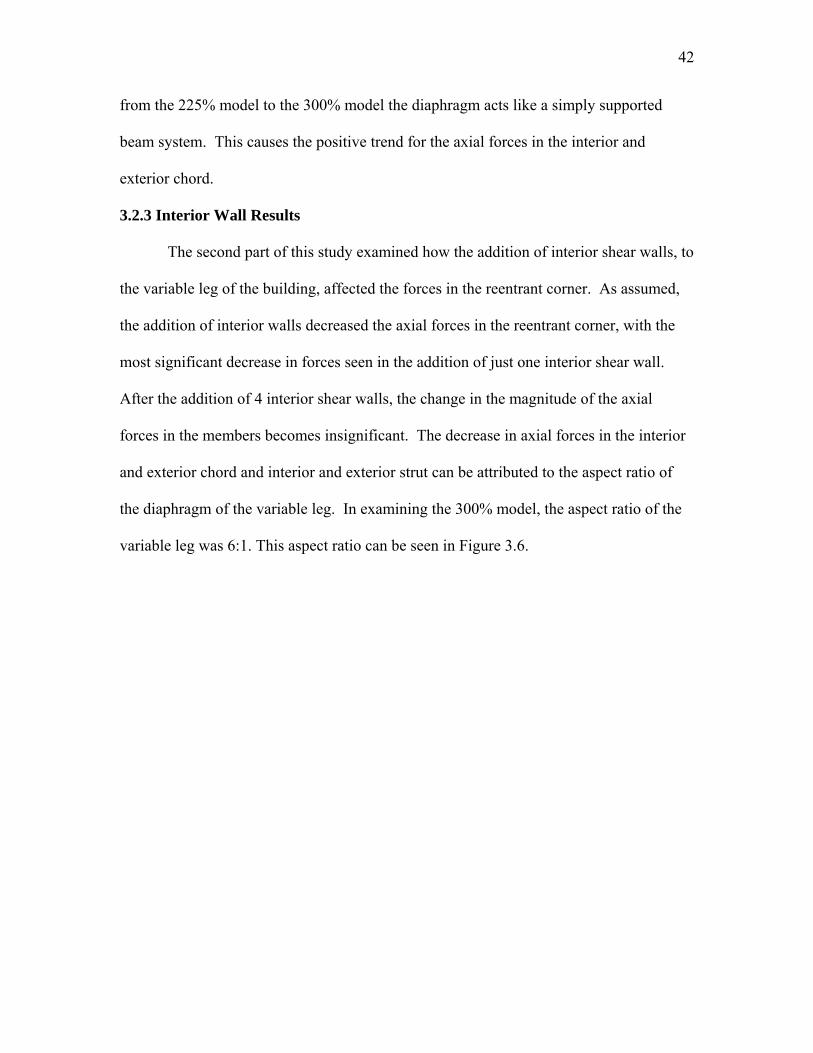
and exterior chord and interior and exterior strut can be attributed to the aspect ratio of
the diaphragm of the variable leg. In examining the 300% model, the aspect ratio of the
variable leg was 6:1. This aspect ratio can be seen in Figure 3.6.
43
Figure 3.6 1:6 Aspect Ratio in Variable leg In this situation, the variable leg can be compared to a long, slender, simply- supported
beam. By using a slender beam verses a deeper beam, the deflection and bending stresses
in the slender beam are going to be greater than those in the deeper beam under the same
loading. In the case of the beams, the deeper beam, which has a larger cross sectional
area resulting in a larger section modulus and moment of inertia, has more capacity for
shear and bending than the slender beam. Since the deeper beam has more capacity
because of its section properties, under the same loading as the slender beam, the deeper
beam will have lower stresses and lower deflection than the slender beam. This is
equivalent to aspect ratios in diaphragms. The 300% model with a 6:1 aspect ratio is
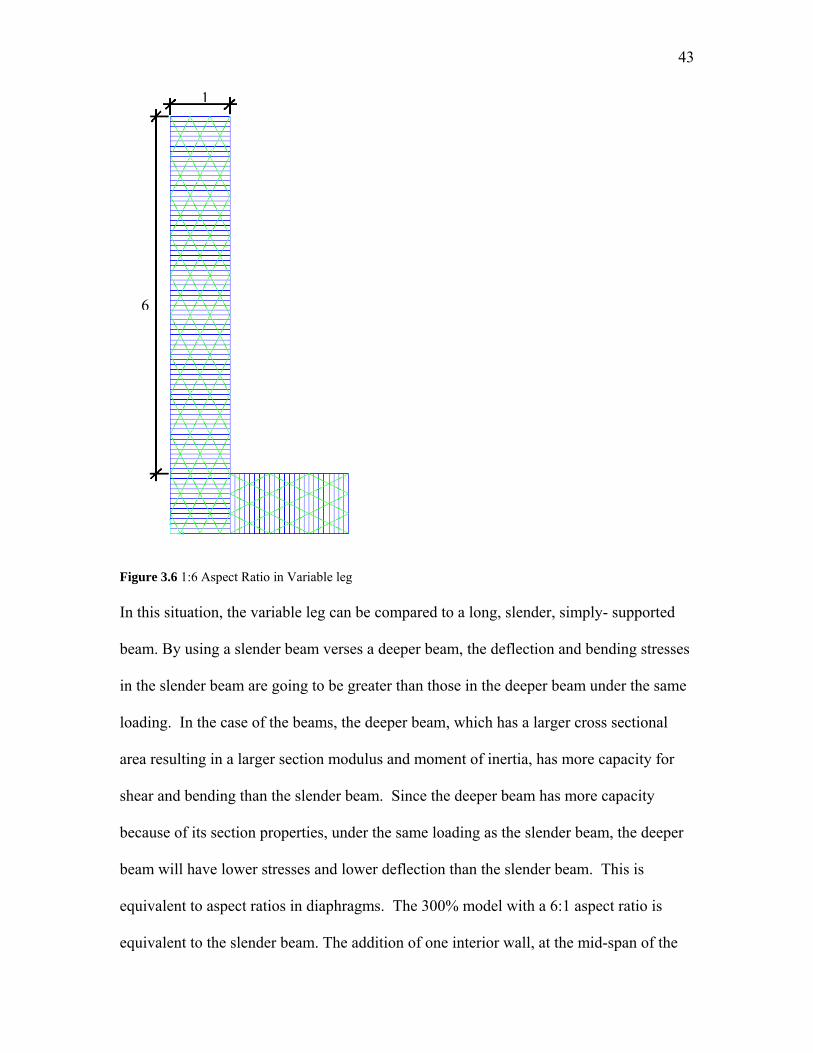
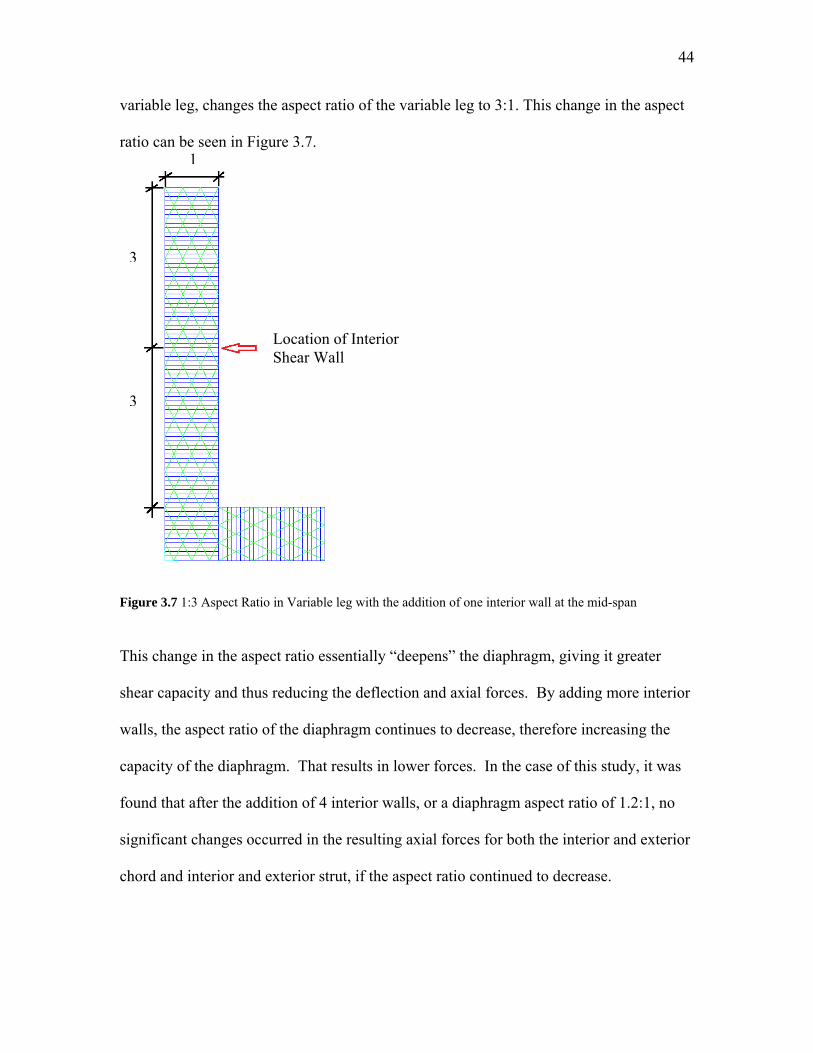
equivalent to the slender beam. The addition of one interior wall, at the mid-span of the
1
6
44
variable leg, changes the aspect ratio of the variable leg to 3:1. This change in the aspect
ratio can be seen in Figure 3.7.
Figure 3.7 1:3 Aspect Ratio in Variable leg with the addition of one interior wall at the mid-span
This change in the aspect ratio essentially “deepens” the diaphragm, giving it greater
shear capacity and thus reducing the deflection and axial forces. By adding more interior
walls, the aspect ratio of the diaphragm continues to decrease, therefore increasing the
capacity of the diaphragm. That results in lower forces. In the case of this study, it was
found that after the addition of 4 interior walls, or a diaphragm aspect ratio of 1.2:1, no
significant changes occurred in the resulting axial forces for both the interior and exterior
chord and interior and exterior strut, if the aspect ratio continued to decrease.
1
3
3
Location of Interior Shear Wall
45
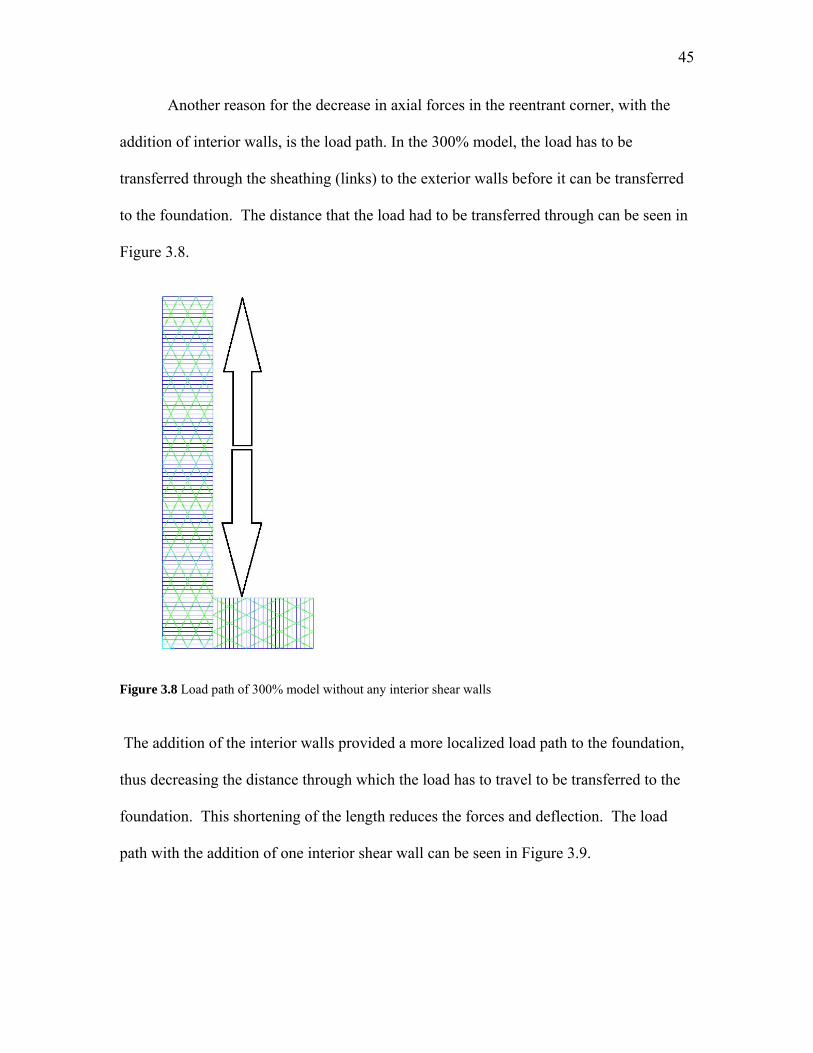
Another reason for the decrease in axial forces in the reentrant corner, with the
addition of interior walls, is the load path. In the 300% model, the load has to be
transferred through the sheathing (links) to the exterior walls before it can be transferred
to the foundation. The distance that the load had to be transferred through can be seen in
Figure 3.8.
Figure 3.8 Load path of 300% model without any interior shear walls
The addition of the interior walls provided a more localized load path to the foundation,
thus decreasing the distance through which the load has to travel to be transferred to the
foundation. This shortening of the length reduces the forces and deflection. The load
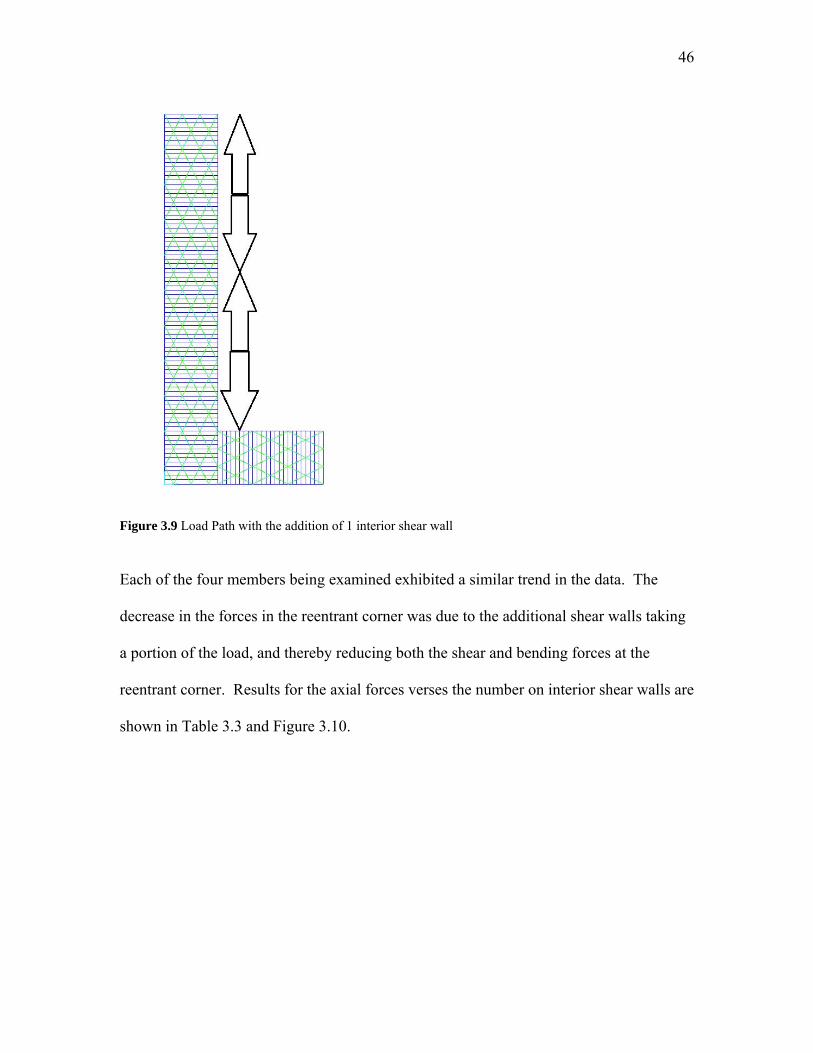
path with the addition of one interior shear wall can be seen in Figure 3.9.
46
Figure 3.9 Load Path with the addition of 1 interior shear wall
Each of the four members being examined exhibited a similar trend in the data. The
decrease in the forces in the reentrant corner was due to the additional shear walls taking
a portion of the load, and thereby reducing both the shear and bending forces at the
reentrant corner. Results for the axial forces verses the number on interior shear walls are
shown in Table 3.3 and Figure 3.10.

47
Table 3.3 Maximum Axial Force in reentrant corner with the addition of Interior Shear Walls
TABLE: Element Forces
# of Interior walls Axial Force (Kip)
Interior Strut Member 1
Interior Chord Member 4
Exterior Chord Member 305
Exterior Strut Member 551
0 7.699 1.489 0.298 7.3191 2.919 0.066 -0.498 2.9852 1.745 -0.11 -0.472 1.9223 1.306 -0.186 -0.475 1.5244 0.716 -0.108 -0.266 0.9945 0.615 -0.164 -0.313 0.9016 0.597 -0.191 -0.342 0.8847 0.504 -0.217 -0.353 0.798
8 0.203 -0.152 -0.23 0.533
Number of Interior Walls vs Axial Force
-1
0
1
2
3
4
5
6
7
8
9
0 1 2 3 4 5 6 7 8 9
Number of Interior Walls
Axi
al F
orc
e (
kip
)
Interior Strut
Interior Chord
Exterior Chord
Exterior Strut
Figure 3.10 Axial Forces in Reentrant Corner verses number of interior Shear walls
48
This study was conducted a second time with the addition of a shear wall at the
reentrant corner acting to supplement the interior strut. The results were almost identical
to the models that did not have a shear wall at the reentrant corner. The only difference
was that the axial forces were lower with the addition of the shear wall at the reentrant
corner. The reason why the axial forces were lower with the addition of a shear wall at
the reentrant corner was because the shear wall provided a more localized load path to the
foundation. Without the shear wall, the load path, that the resulting shear in the reentrant
corner would take, was through the diaphragm sheathing (or links, in this case) to the
exterior walls, before it could be transferred down to the foundation. In the case of the
shear wall at the reentrant corner, the shear forces could be transferred directly to the
foundation through the shear wall, instead of having to be transferred through all the
diaphragm sheathing first. The shorter load path results in lower axial forces in the
reentrant corner. Again, the most significant change in magnitude of the forces was seen
with the addition of just one interior shear wall in the variable leg. Also, the change in
magnitude of the forces is due to the aspect ratio of the variable leg. Starting with the
300% model, the aspect ratio is 6:1, and has the longest length between lateral lines of
support. By adding interior lines of shear, both the aspect ratio and length between lines
of support are decreased. Since the forces resulting in the diaphragm are related to aspect
ratio and length between supports, by decreasing the aspect ratio and length between
supports the forces are also decreased. The same can be said of the deflection in the
diaphragm, as well. After the addition of 4 interior shear walls, or an aspect ratio of
1.2:1, with the exception of the shear wall at the reentrant corner, the change in

49
magnitude in the axial forces became insignificant. Results for the axial forces verses the
number on interior shear walls can be found in Table 3.4 and Figure 3.11.
Table 3.4 Maximum Axial Force in reentrant corner with the addition of Interior Shear, including shear wall at reentrant corner
TABLE: Element Forces (Wall at Reentrant Corner)*
# of Interior walls Axial Force (Kip)
Interior Strut Member 1
Interior Chord Member 4
Exterior Chord Member 305
Exterior Strut Member 551
0 5.322 1.933 0.574 4.5151 1.837 0.421 -0.297 1.6442 0.985 0.183 -0.311 0.963 0.664 0.079 -0.332 0.7034 0.269 0.096 -0.168 0.3895 0.186 0.04 -0.214 0.3216 0.168 0.013 -0.243 0.3057 0.094 -0.018 -0.257 0.245
8 -0.095 0.015 -0.148 0.09Note: * Wall at Reentrant Corner is not counted as one of the Interior walls
Number of Interior Walls vs ForceIncludes Wall at Reentrant Corner
-1
0
1
2
3
4
5
6
0 1 2 3 4 5 6 7 8 9
Number Interior Walls
Axi
al F
orc
e (K
ip)
Interior Strut
Interior Chord
Exterior Chord
Exterior Strut
Figure 3.11 Maximum Axial Forces versus number of interior shear walls

50
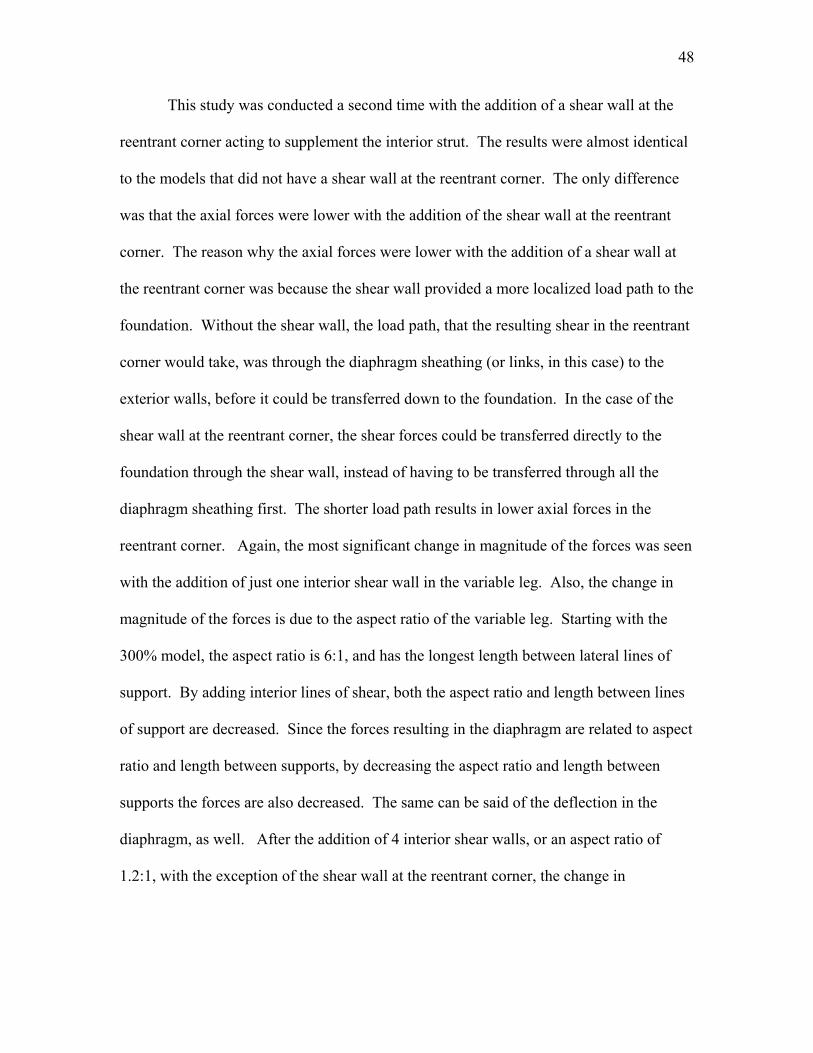
3.2.4 Impact of Shear Walls on Axial Forces in Reentrant Corner
One result that was noticed in the verification of the models was how the addition
of the side walls to the diaphragm significantly reduced the forces in the interior and
exterior chords. In this verification three models were compared: the 300% model, the
300% model without the non-linear links, and a model that consisted only of the
diaphragm. The configuration of these models can be seen again in Figure 3.12, Figure
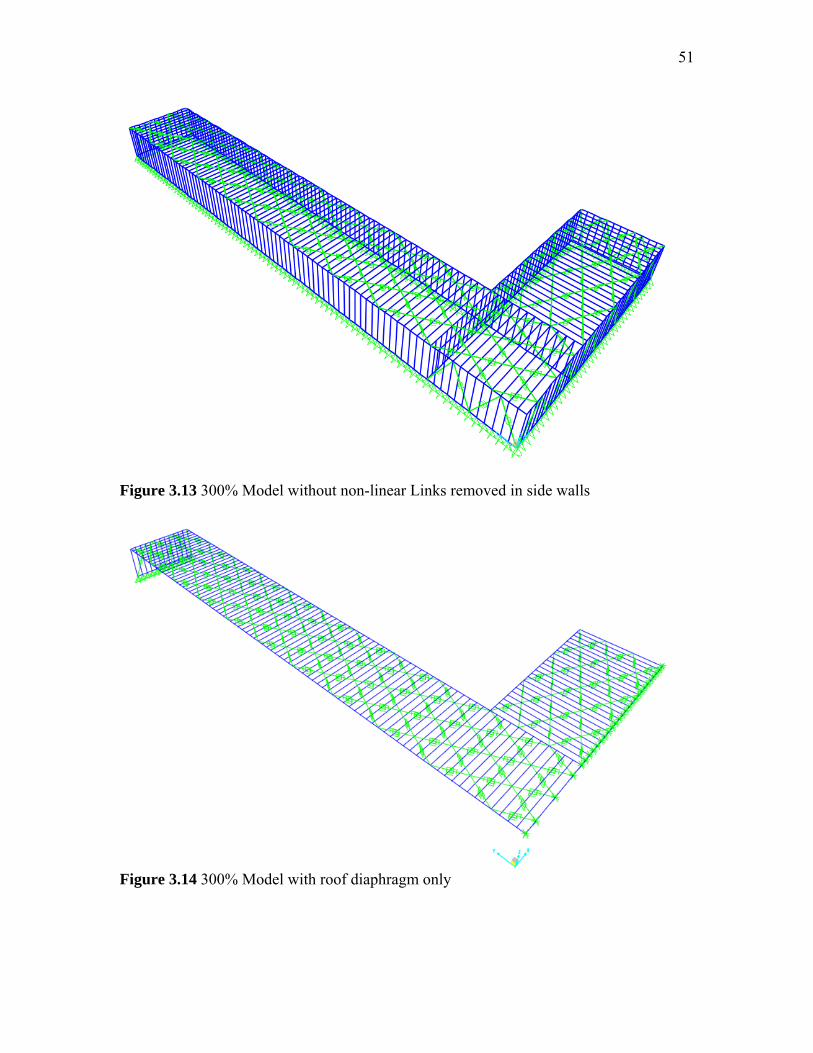
3.13, and Figure 3.14 respectfully.
Figure 3.12 300% Model without any modifications
51
Figure 3.13 300% Model without non-linear Links removed in side walls
Figure 3.14 300% Model with roof diaphragm only
52
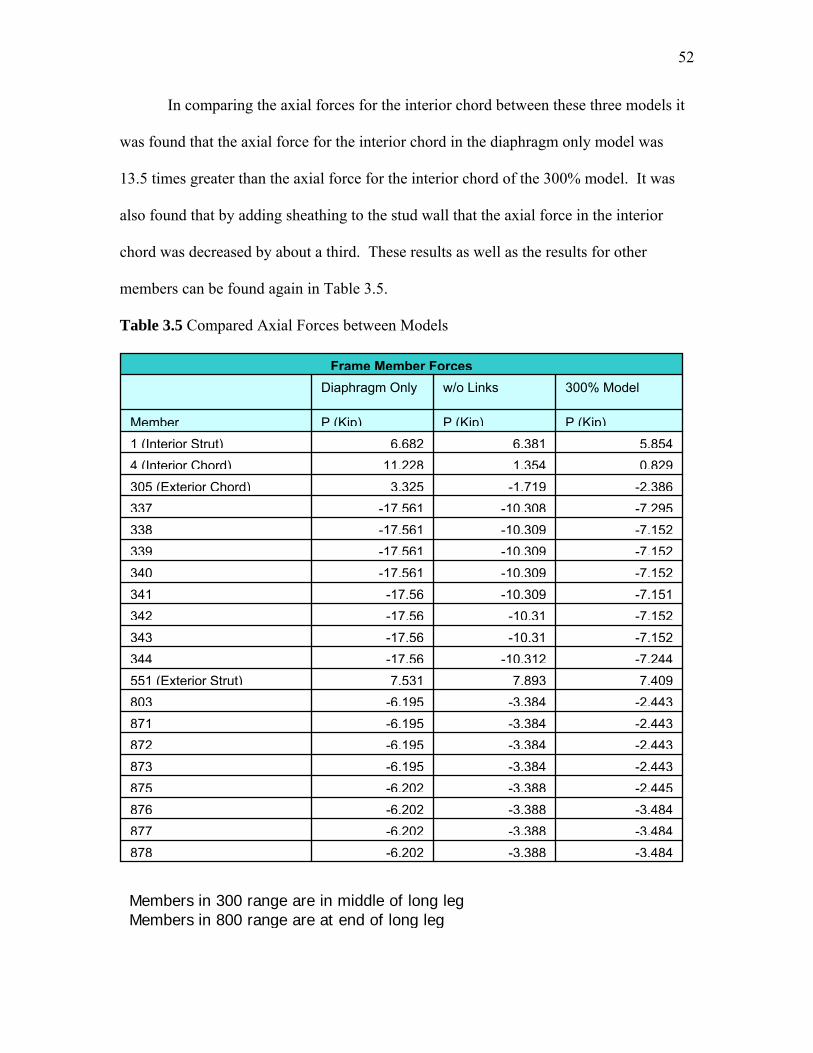
In comparing the axial forces for the interior chord between these three models it
was found that the axial force for the interior chord in the diaphragm only model was
13.5 times greater than the axial force for the interior chord of the 300% model. It was
also found that by adding sheathing to the stud wall that the axial force in the interior
chord was decreased by about a third. These results as well as the results for other
members can be found again in Table 3.5.
Table 3.5 Compared Axial Forces between Models
-3.484-3.388-6.202878
-3.484-3.388-6.202877
-3.484-3.388-6.202876
-2.445-3.388-6.202875
-2.443-3.384-6.195873
-2.443-3.384-6.195872
-2.443-3.384-6.195871
-2.443-3.384-6.195803
7.4097.8937.531551 (Exterior Strut)
-7.244-10.312-17.56344
-7.152-10.31-17.56343
-7.152-10.31-17.56342
-7.151-10.309-17.56341
-7.152-10.309-17.561340
-7.152-10.309-17.561339
-7.152-10.309-17.561338
-7.295-10.308-17.561337
-2.386-1.7193.325305 (Exterior Chord)
0.8291.35411.2284 (Interior Chord)
5.8546.3816.6821 (Interior Strut)
P (Kip)P (Kip)P (Kip)Member
300% Model w/o Links Diaphragm Only Frame Member Forces
Members in 300 range are in middle of long leg Members in 800 range are at end of long leg
53
As was found in the previous section, the addition of interior shear walls dramatically
reduces the axial forces in the interior and exterior chords and the interior and exterior
struts in the reentrant corner. However the comparison between the diaphragm only
model, the 300% model without the non-linear links, and the 300% model also shows
how dramatically the addition of walls reduces the axial forces in the interior chord.
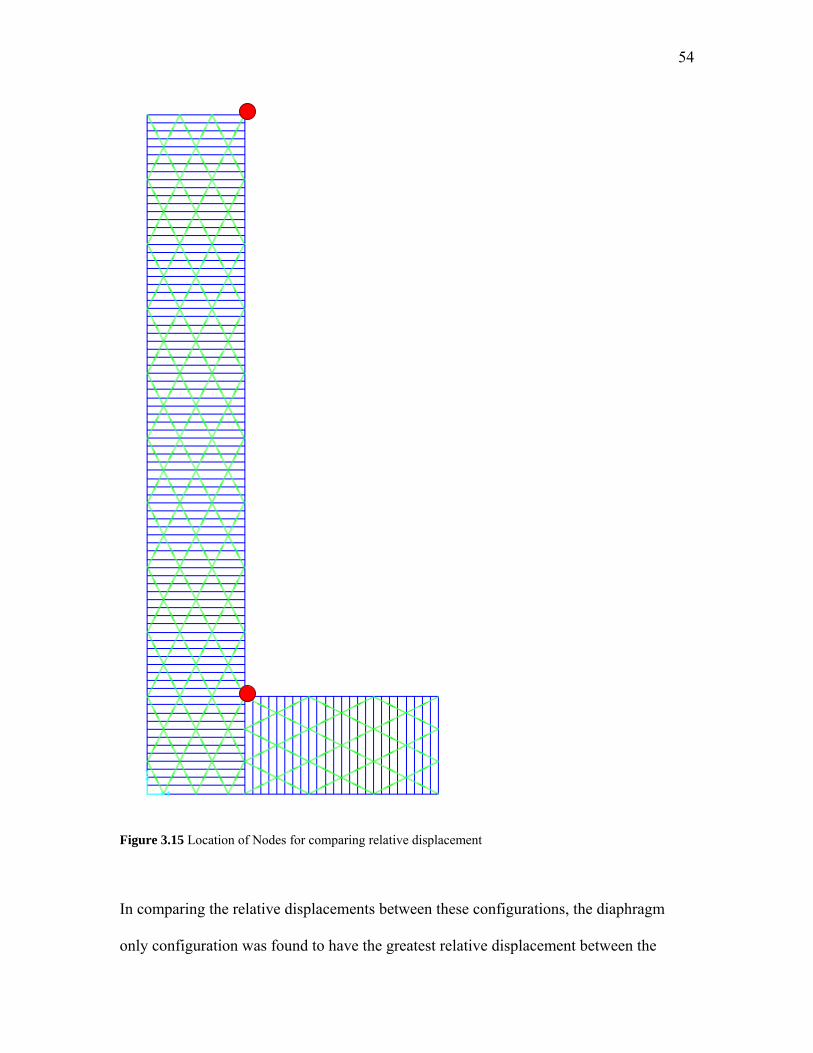
In following up with this, the deflections of these three models were also
compared. For this the relative displacement between the node at the reentrant corner
and the node at the end of the variable leg were compared to their original location. The
location of these nodes can be seen in Figure 2.10.
54
Figure 3.15 Location of Nodes for comparing relative displacement
In comparing the relative displacements between these configurations, the diaphragm
only configuration was found to have the greatest relative displacement between the
55
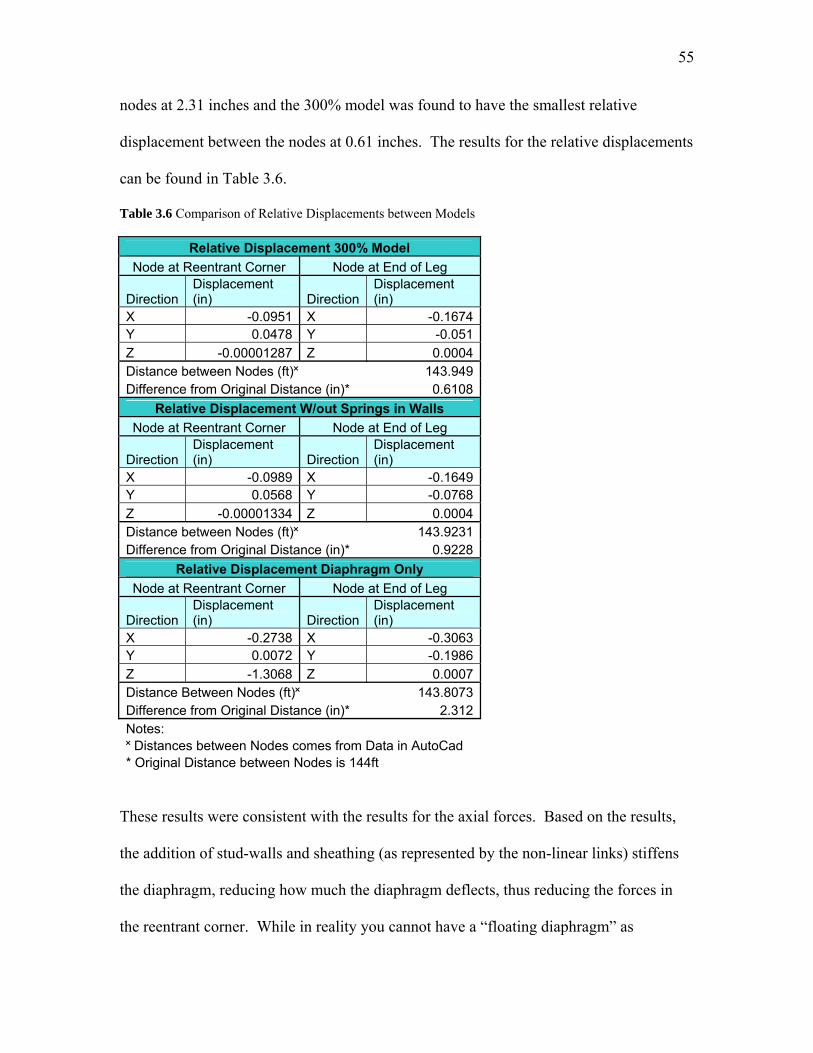
nodes at 2.31 inches and the 300% model was found to have the smallest relative
displacement between the nodes at 0.61 inches. The results for the relative displacements
can be found in Table 3.6.
Table 3.6 Comparison of Relative Displacements between Models
Relative Displacement 300% Model
Node at Reentrant Corner Node at End of Leg
Direction Displacement (in) Direction
Displacement (in)
X -0.0951 X -0.1674Y 0.0478 Y -0.051
Z -0.00001287 Z 0.0004Distance between Nodes (ft)˟ 143.949Difference from Original Distance (in)* 0.6108
Relative Displacement W/out Springs in Walls
Node at Reentrant Corner Node at End of Leg
Direction Displacement (in) Direction
Displacement (in)
X -0.0989 X -0.1649Y 0.0568 Y -0.0768
Z -0.00001334 Z 0.0004Distance between Nodes (ft)˟ 143.9231Difference from Original Distance (in)* 0.9228
Relative Displacement Diaphragm Only
Node at Reentrant Corner Node at End of Leg
Direction Displacement (in) Direction
Displacement (in)
X -0.2738 X -0.3063Y 0.0072 Y -0.1986
Z -1.3068 Z 0.0007Distance Between Nodes (ft)˟ 143.8073Difference from Original Distance (in)* 2.312Notes: ˟ Distances between Nodes comes from Data in AutoCad * Original Distance between Nodes is 144ft
These results were consistent with the results for the axial forces. Based on the results,
the addition of stud-walls and sheathing (as represented by the non-linear links) stiffens
the diaphragm, reducing how much the diaphragm deflects, thus reducing the forces in
the reentrant corner. While in reality you cannot have a “floating diaphragm” as
56
configured in the diaphragm only model, the results for the configuration without links in
the walls, and for the 300% model are consistent with what would be found in real
structures.
3.3 Discrepancies with Results
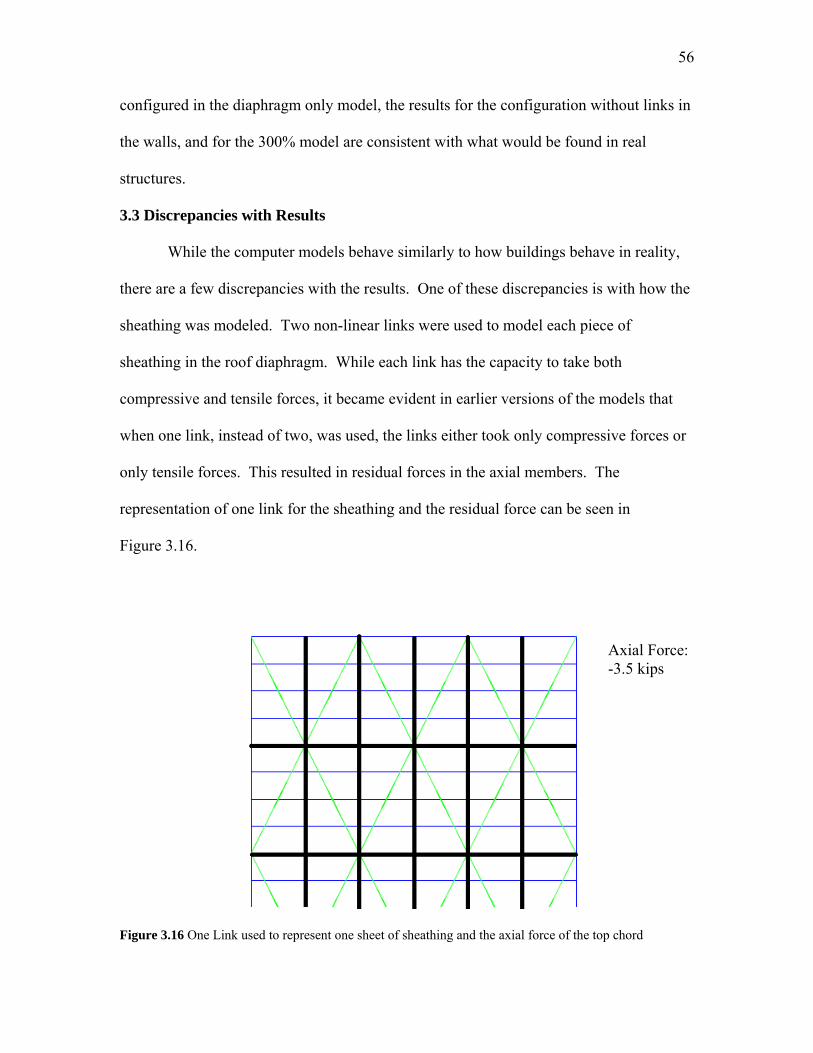
While the computer models behave similarly to how buildings behave in reality,
there are a few discrepancies with the results. One of these discrepancies is with how the
sheathing was modeled. Two non-linear links were used to model each piece of
sheathing in the roof diaphragm. While each link has the capacity to take both
compressive and tensile forces, it became evident in earlier versions of the models that
when one link, instead of two, was used, the links either took only compressive forces or
only tensile forces. This resulted in residual forces in the axial members. The
representation of one link for the sheathing and the residual force can be seen in
Figure 3.16.
Figure 3.16 One Link used to represent one sheet of sheathing and the axial force of the top chord
Axial Force: -3.5 kips

57
Instead of in a simple beam, where the shear force is zero at the ends of the beam, the
results in the models showed shear forces not equaling zero at the ends of the variable
leg. The shear forces at the ends of the variable leg were found to be caused by the links
and a tensile or compressive force in them. The links would then act on the top chord,
which resulted in the shear forces at the ends of the beam. By adding a second link to
represent each sheet of sheathing, the amount of shear that each link was trying to
transfer was decreased, therefore decreasing the added load applied on the top chord of
the diaphragm. This resulted in reduced shear forces at the end of the variable leg. The
use of two links for a sheet of sheathing and the reduced axial force can be seen in
Figure 3.17.
Figure 3.17 Two Links used to represent one sheet of sheathing and the reduction in the axial force of the top chord
Axial Force: -1.8 kips
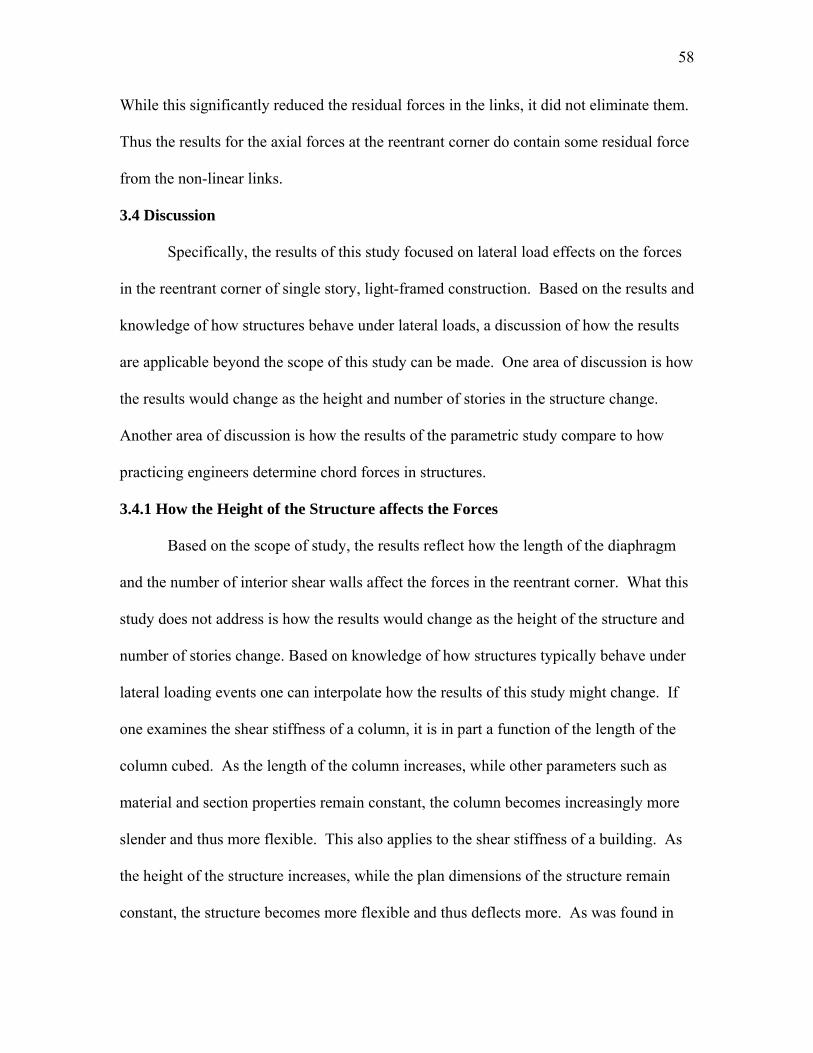
58
While this significantly reduced the residual forces in the links, it did not eliminate them.
Thus the results for the axial forces at the reentrant corner do contain some residual force
from the non-linear links.
3.4 Discussion
Specifically, the results of this study focused on lateral load effects on the forces
in the reentrant corner of single story, light-framed construction. Based on the results and
knowledge of how structures behave under lateral loads, a discussion of how the results
are applicable beyond the scope of this study can be made. One area of discussion is how
the results would change as the height and number of stories in the structure change.
Another area of discussion is how the results of the parametric study compare to how
practicing engineers determine chord forces in structures.
3.4.1 How the Height of the Structure affects the Forces
Based on the scope of study, the results reflect how the length of the diaphragm
and the number of interior shear walls affect the forces in the reentrant corner. What this
study does not address is how the results would change as the height of the structure and
number of stories change. Based on knowledge of how structures typically behave under
lateral loading events one can interpolate how the results of this study might change. If
one examines the shear stiffness of a column, it is in part a function of the length of the
column cubed. As the length of the column increases, while other parameters such as
material and section properties remain constant, the column becomes increasingly more
slender and thus more flexible. This also applies to the shear stiffness of a building. As
the height of the structure increases, while the plan dimensions of the structure remain
constant, the structure becomes more flexible and thus deflects more. As was found in
59
this study, deflection has a direct correlation to the magnitude of the axial forces in the
chord members at the reentrant corner. Since the top story of a multi-story building is
going to deflect more than a single story building, as represented in the models, the axial
forces in the chord members of the reentrant corner are also going to be greater in the top
story of a multi-story building than the axial forces in the chord members in a single story
building. And while the bottom story of a multi-story building won’t deflect as much as
the top story, again a function of height, it will have greater axial forces in the chord
members since the loads are compounded as they are transferred down through the
building. So while the deflection of the bottom story of a multi-story building might be
more similar to the deflection of a single story building, the axial forces are going to be
greater since they are compounded from above.
3.4.2 Comparison in determination of Chord Forces
In practice, most engineers idealize the diaphragm of structures to act as a simply
supported beam. They then use the analog of a simply supported beam to determine the
chord forces in the reentrant corner. As was found in the results of this parametric study
that analog of a simply supported beam isn’t always the correct analog when determining
the chord forces in the reentrant corner. The results found that for most practical
applications the diaphragm acts more like a propped cantilever system instead. (The
simply supported beam analog worked for the 225% model and larger, however all of the
models to which the simply supported beam analog was more appropriate exceeded the
code maximum allowable aspect ratio of 1:3 for a diaphragm.) The axial forces for the
interior and exterior chord were compared to calculated chord forces based on the simply
supported beam analog and the propped cantilever analog. In comparing the calculated
60
chord force to the chord forces determined in SAP2000 it can be seen that the calculated
chord force based on the simply supported beam analog is un-conservative. In
comparing the axial forces of the interior and exterior chord to the chord forces
determined by the propped cantilever analog it can be seen that in some cases the
calculated chord force is un-conservative while in other cases the calculated chord force
is extremely conservative. The comparison between the interior and exterior chord forces
and the calculated chord forces based on the different analogs can be found in Table 3.7
and Figure 3.18.
Table 3.7 Comparison between Interior and Exterior Chord Force and Calculated Chord Forces based on different analogs.
Comparison of Chord Forces
Aspect Ratio
15% 25% 50% 75% 100% 125% 150%
Analog Chord Force (Kips)
Simply Supported Beam -0.025 -0.048 -0.105 -0.163 -0.220 -0.228 -0.335
Propped Cantilever 0.002 -0.024 -0.211 -0.570 -1.102 -1.806 -2.683
Exterior Chord -0.067 -0.152 -0.375 -0.511 -0.705 -0.727 -0.808
Interior Chord -0.107 -0.121 -0.243 -0.247 -0.325 -0.218 -0.190
Combined -0.074 -0.150 -0.369 -0.468 -0.716 -0.680 -1.006
Aspect Ratio 1:0.3 1:0.5 1:1 1:1.5 1:2 1:2.5 1:3
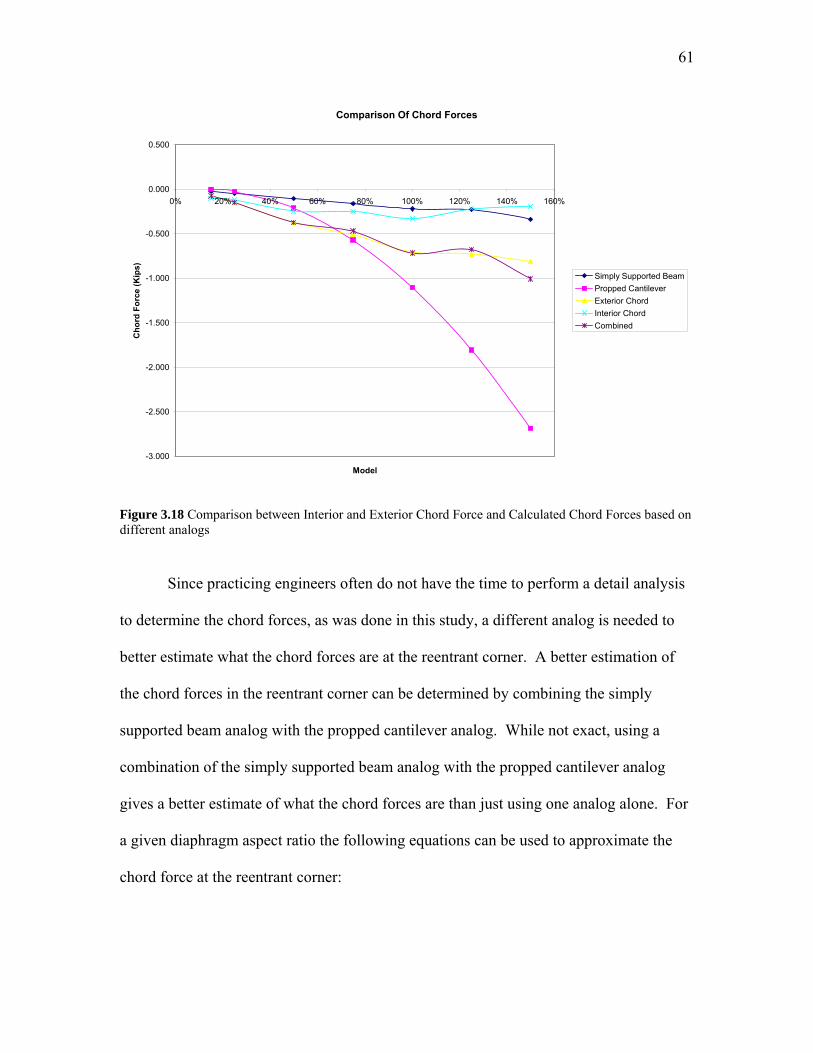
61
Comparison Of Chord Forces
-3.000
-2.500
-2.000
-1.500
-1.000
-0.500
0.000
0.500
0% 20% 40% 60% 80% 100% 120% 140% 160%
Model
Ch
ord
Fo
rce
(Kip
s)
Simply Supported Beam
Propped Cantilever
Exterior Chord
Interior Chord
Combined
Figure 3.18 Comparison between Interior and Exterior Chord Force and Calculated Chord Forces based on different analogs
Since practicing engineers often do not have the time to perform a detail analysis
to determine the chord forces, as was done in this study, a different analog is needed to
better estimate what the chord forces are at the reentrant corner. A better estimation of
the chord forces in the reentrant corner can be determined by combining the simply
supported beam analog with the propped cantilever analog. While not exact, using a
combination of the simply supported beam analog with the propped cantilever analog
gives a better estimate of what the chord forces are than just using one analog alone. For
a given diaphragm aspect ratio the following equations can be used to approximate the
chord force at the reentrant corner:
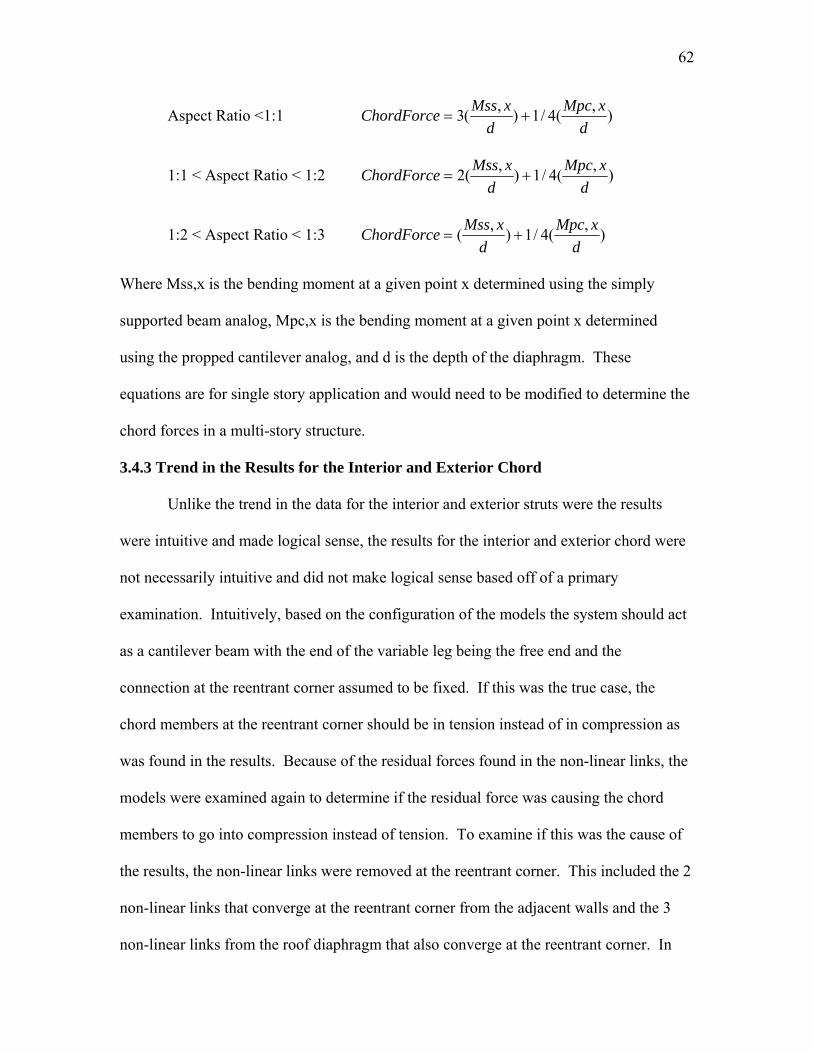
62
Aspect Ratio <1:1 ),
(4/1),
(3d
xMpc
d
xMssChordForce
1:1 < Aspect Ratio < 1:2 ),
(4/1),
(2d
xMpc
d
xMssChordForce
1:2 < Aspect Ratio < 1:3 ),
(4/1),
(d
xMpc
d
xMssChordForce
Where Mss,x is the bending moment at a given point x determined using the simply
supported beam analog, Mpc,x is the bending moment at a given point x determined
using the propped cantilever analog, and d is the depth of the diaphragm. These
equations are for single story application and would need to be modified to determine the
chord forces in a multi-story structure.
3.4.3 Trend in the Results for the Interior and Exterior Chord
Unlike the trend in the data for the interior and exterior struts were the results
were intuitive and made logical sense, the results for the interior and exterior chord were
not necessarily intuitive and did not make logical sense based off of a primary
examination. Intuitively, based on the configuration of the models the system should act
as a cantilever beam with the end of the variable leg being the free end and the
connection at the reentrant corner assumed to be fixed. If this was the true case, the
chord members at the reentrant corner should be in tension instead of in compression as
was found in the results. Because of the residual forces found in the non-linear links, the
models were examined again to determine if the residual force was causing the chord
members to go into compression instead of tension. To examine if this was the cause of
the results, the non-linear links were removed at the reentrant corner. This included the 2
non-linear links that converge at the reentrant corner from the adjacent walls and the 3
non-linear links from the roof diaphragm that also converge at the reentrant corner. In

63
examining the results of the axial forces in the exterior chord between the models that do
contain non-linear links at the reentrant corner to the models that do not contain non-
linear links at the reentrant corner it was found that with the addition of non-linear links
(or sheathing) that the forces are reduced in the reentrant corner since the diaphragm is
stiffer. This was consistent with results found in previous examinations. Other than
stiffening the diaphragm and thus reducing the axial forces in the exterior chord the
results were inconclusive as to where the non-linear links forced the exterior chord into
compression instead of tension. The comparison of the axial forces in the exterior chord
between the two different groups of models can be found in Table 3.8 and Figure 3.19.
Table 3.8 Comparison of Axial Forces in Exterior Chord with and with out non-linear links at the reentrant corner
Exterior Chord Axial Force
Model Links at Corner No Links 15 -0.067 -0.11325 -0.152 -0.14850 -0.375 -0.32175 -0.511 -0.372
100 -0.705 -0.505125 -0.727 -0.439150 -0.808 -0.451175 -0.7 -0.253200 -0.653 -0.131225 -0.441 0.17250 -0.292 0.394275 -0.009607 0.767
300 0.298 1.176
64
Comparison of Exterior Chord forces with and with out links at Reentrant Corner
-1
-0.5
0
0.5
1
1.5
0 50 100 150 200 250 300 350
Model
Axi
al F
orc
e (K
ips)
Exterior Chord AxialForce Links at Corner
Exterior Chord AxialForce No Links
Figure 3.19 Comparison of Axial Forces in Exterior Chord with and with out non-linear links at the reentrant corner
Since the non-linear links did not contribute to the axial forces in the exterior
chord being in compression, the models were looked at more globally to understand what
was going on. It was found in model that the top chord of the loaded face of the variable
leg was in compression. Since this was the case, it can be determined that the diaphragm
of the variable leg does not act solely as a simply supported beam system or solely as a
propped cantilever system. Instead it acts as a combination of the two systems. This is
consistent with the equations that were developed in the previous section for determining
the chord forces. Since the diaphragm acts as combination of the two systems it explains
while the results for the axial forces in the chord members do not necessarily fit into all
of the ideologies of either the propped cantilever system or the simply supported beam
system.
65
CHAPTER 4: SUMMARY AND CONCLUSIONS
4.1 Summary
The objective of this study was to examine how lateral loads affect forces in the
reentrant corner of structures so as to gain better understanding on the issue. For this
study 30 models were analyzed using finite element analysis with varying dimensions
and wall locations. Specifically, these varying parameters of length and number of
interior walls were used to see how the axial forces in the reentrant corner changed
accordingly. In order to obtain realistic results, the models were set up to mimic how
light-framed timber construction is set up in reality. This included developing different
member and material properties in SAP2000.
For analysis, each model was loaded under the same loading conditions, thus
making the only variable parameter either the length of the variable leg of the building
with a reentrant corner or the number of interior shear walls. Chapter 3 summarizes the
results of the 30 models used and the maximum axial forces found the in the reentrant
corner. Based on the results of the study, conclusions can be drawn on the affect of
lateral loads on reentrant corners.
4.2 Conclusion
Based on numerical analysis of the results from the finite element study,
conclusions can be made on the effect of lateral loads on reentrant corner of single story,
light-framed timber structures:
The length of the legs of a structure has a direct correlation to the magnitude of
the axial forces in the struts in the reentrant corner. The longer the leg is
66
perpendicular to the strut, the higher the axial force will be in the strut. This is
due to the diaphragm being idealized as a simple beam.
As the length of the variable leg increases, it becomes increasingly more flexible
than the constant leg. This results in the connection between the variable leg and
the constant leg acting more like a fixed connection instead of a pinned
connection. The analog for the diaphragm also changes then from a propped
cantilever to a simply supported beam. This transition between these two analogs
occurs between the 75% model and the 225% model.
The axial forces in the interior and exterior chords follow the trend of the bending
moment diagram as the length of the variable leg increases. Since it was found
that the variable leg acts more similarly to a propped cantilever than a simply
supported beam, the axial forces in the interior and exterior chords follow the
trend of the bending moment diagram for a propped cantilever instead of a simply
supported beam as initially assumed.
There is a correlation between how the diaphragm deforms and the axial forces in
the chord members in the reentrant corner. By limiting the diaphragm deflection,
the axial forces in the chord members are also limited and reduced.
The addition of interior lines of shear greatly reduces the magnitude of the axial
forces in the interior and exterior strut as well as the interior and exterior chord.
The decrease in the magnitude of the axial force in the struts and chords is
attributed to the aspect ratio of the diaphragm. As the aspect ratio of the
diaphragm decreases so do the axial forces in the struts and chords in the reentrant
corner.

67
The addition of an interior shear wall at the reentrant corner reduces the axial
forces in the interior and exterior strut and the interior and exterior chord. The
most significant change occurred after the addition of one interior shear wall.
After the addition of four interior shear walls there was no significant change in
the axial forces in the interior and exterior strut and the interior and exterior
chord. The interior shear wall provides a line of support at the reentrant corner
that transfers the load directly to the foundation. This reduces the axial forces in
the struts and chords since the applied load does not need to be transferred to the
exterior shear walls.
A significant reduction of the axial force in the interior chord was found when
stud walls and sheathing was added to the diaphragm. The sheathed exterior
walls stiffen the roof diaphragm causing less deflection. The decrease in
deflection leads to the decreased axial forces in the interior chord.
The height and number of stories in a structure will affect the magnitude of the
axial forces in the interior and exterior strut and the interior and exterior chord.
The top story of a multi-story building is going to deflect more and therefore
going to have higher axial forces in the interior and exterior strut and the interior
and exterior chord than a single story structure. While the deflect will decrease in
lower stories of a multi-story building the axial forces in the interior and exterior
strut and the interior and exterior chord will increase since they are being
compounded from the stories above.
The diaphragm of the variable leg acts as a combination of the simply supported
beam analog and the propped cantilever analog. Since the diaphragm behaves as
68
a combination of these two analogs and not simply as one or another it explains
why the results for the axial forces in the exterior chord are not intuitive. This
combination of systems also led to the development of equations that better
estimate what the chord forces are in the reentrant corner.

69
References American Society of Civil Engineers. (2010) Minimum design loads for buildings and
other structures (ASCE 7-10). Reston, VA. American Society of Civil Engineers. American Wood Council. (2005) National Design Specifications for Wood Construction
(NDS 2005). Washington D.C. American Forest & Paper Association, Inc. February 2010
American Wood Council. (2005) Special Desing Provisions for Wind and Seismic
(SDPWS 2005). Washington D.C. American Forest & Paper Association, Inc. February 2010
Amin, J.A.,& Ahuja, A.K. (2011) Experimental study of wind-induced pressures on
buildings of various geometries. International Journal of Engineering, Science, and Technology, Vol 3, No. 5. 1-19.
APA. (1997) Plywood Design Specification The Engineered Wood Association. January
1997 Computers and Structures, Inc. (2011) SAP2000 (Version 15) [Computer software].
Berkeley, CA. FEMA. (2006) Risk Management Series Design for Earthquakes (FEMA 454) Krishnan, Swaminathan. (2007) Case studies of damage to 19-story irregular steel
moment-frame buildings under near-source ground motion. Earthquake Engineering and Structural Dynamics 36. 861-885.
Malone, R. Terry., & Rice, Robert W. (2012) The Analysis of Irregular Shaped
Structures. New York: McGraw Hill Naeim, Farzad. (1989) The Seismic Design Handbook. New York: Chapman & Hall Pang, WeiChiang., Rosowsky, David., van de Lindt, John., Pei, Shiling. (2010)
Simplified Direct Displacement Design of Six-story NEESwood Capstone Building and Pre-test Seismic Performance Assessment. World Conference on Timber Engineering 2010
Prion, H., and Lam, F. (2000). “Finite element analysis of diaphragms with openings and
offsets.” Rep. Prepared for to the Canadian Wood Council, Dept. of Wood Science, UBC, Vancouver, B.C.
Pryor, Steve. (2009) Equivalent Rod Area

70
Songlai, Chen., Chengmou, Fan., & Jinglong, Pan. (2010) Experimental Study on Full-Scale Light-Frame Wood House under Lateral Load. Journal of Structural Engineering. July 2010. 805-812
USGS. (1985) ID. Celebi, M. 7ct. Retrieved from http://libraryphoto.cr.usgs.gov/cgi-
bin/search.cgi?search_mode=exact&selection=Mexico+City+Earthquake+1985|Mexico+City|Earthquake|1985
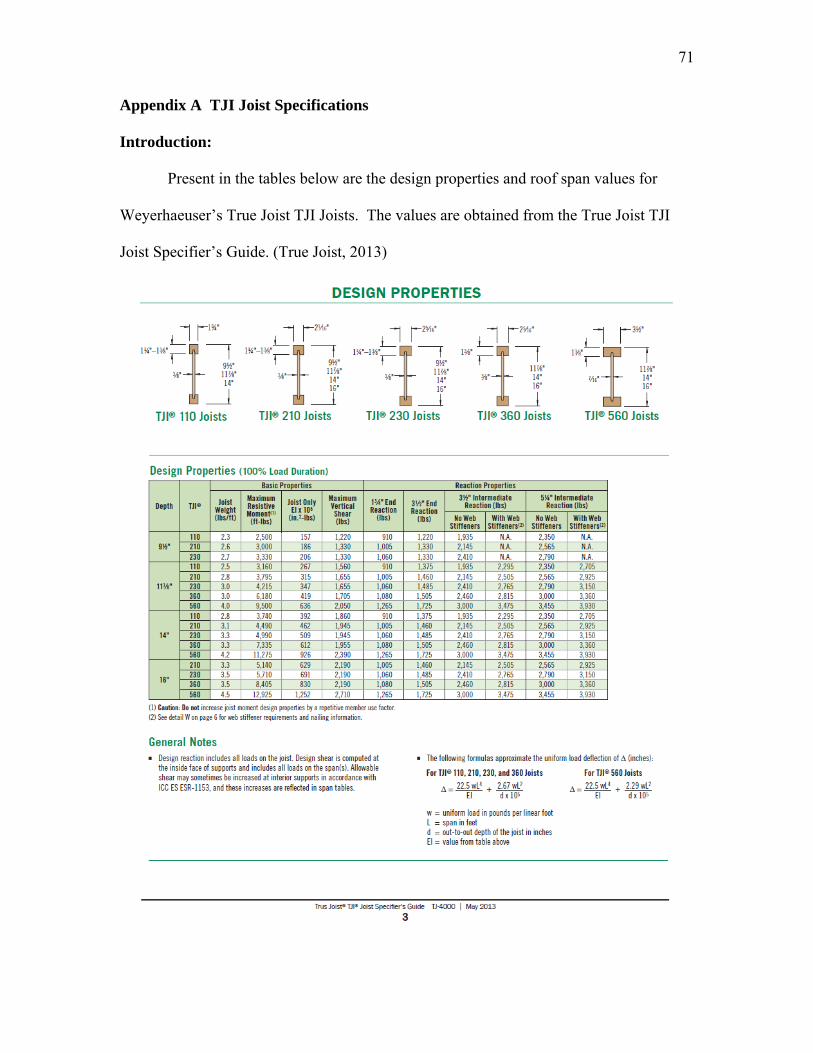
71
Appendix A TJI Joist Specifications
Introduction:
Present in the tables below are the design properties and roof span values for
Weyerhaeuser’s True Joist TJI Joists. The values are obtained from the True Joist TJI
Joist Specifier’s Guide. (True Joist, 2013)

72
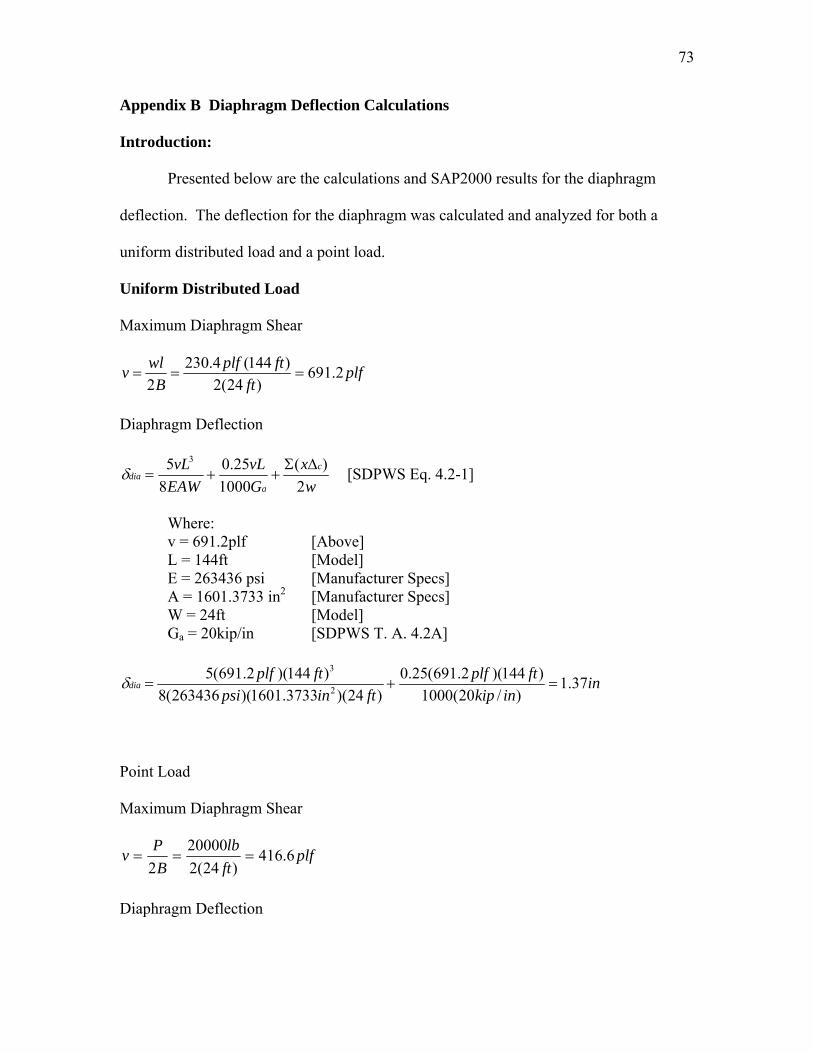
73
Appendix B Diaphragm Deflection Calculations
Introduction:
Presented below are the calculations and SAP2000 results for the diaphragm
deflection. The deflection for the diaphragm was calculated and analyzed for both a
uniform distributed load and a point load.
Uniform Distributed Load Maximum Diaphragm Shear
plfft
ftplf
B
wlv 2.691
)24(2
)144(4.230
2
Diaphragm Deflection
w
x
G
vL
EAW
vL c
adia
2
)(
1000
25.0
8
5 3 [SDPWS Eq. 4.2-1]
Where: v = 691.2plf [Above] L = 144ft [Model] E = 263436 psi [Manufacturer Specs] A = 1601.3733 in2 [Manufacturer Specs] W = 24ft [Model] Ga = 20kip/in [SDPWS T. A. 4.2A]
ininkip
ftplf
ftinpsi
ftplfdia 37.1
)/20(1000
)144)(2.691(25.0
)24)(3733.1601)(263436(8
)144)(2.691(52
3
Point Load Maximum Diaphragm Shear
plfft
lb
B
Pv 6.416
)24(2
20000
2
Diaphragm Deflection
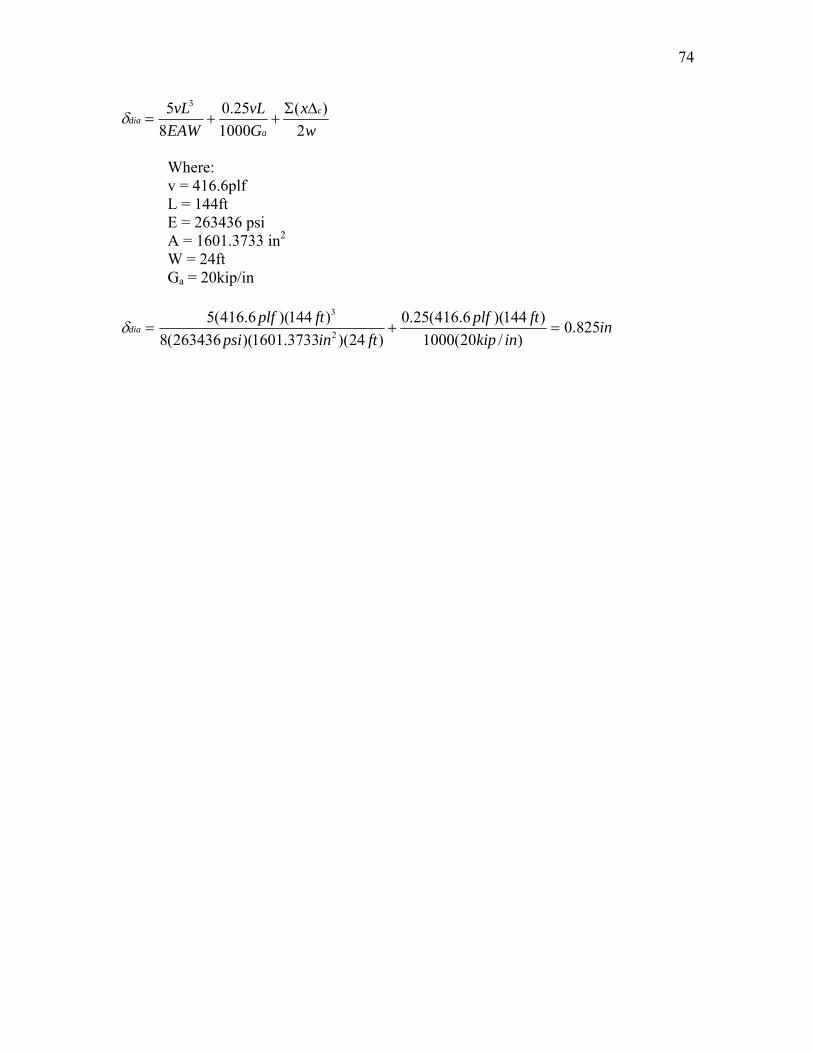
74
w
x
G
vL
EAW
vL c
adia
2
)(
1000
25.0
8
5 3
Where: v = 416.6plf L = 144ft E = 263436 psi A = 1601.3733 in2 W = 24ft Ga = 20kip/in
ininkip
ftplf
ftinpsi
ftplfdia 825.0
)/20(1000
)144)(6.416(25.0
)24)(3733.1601)(263436(8
)144)(6.416(52
3
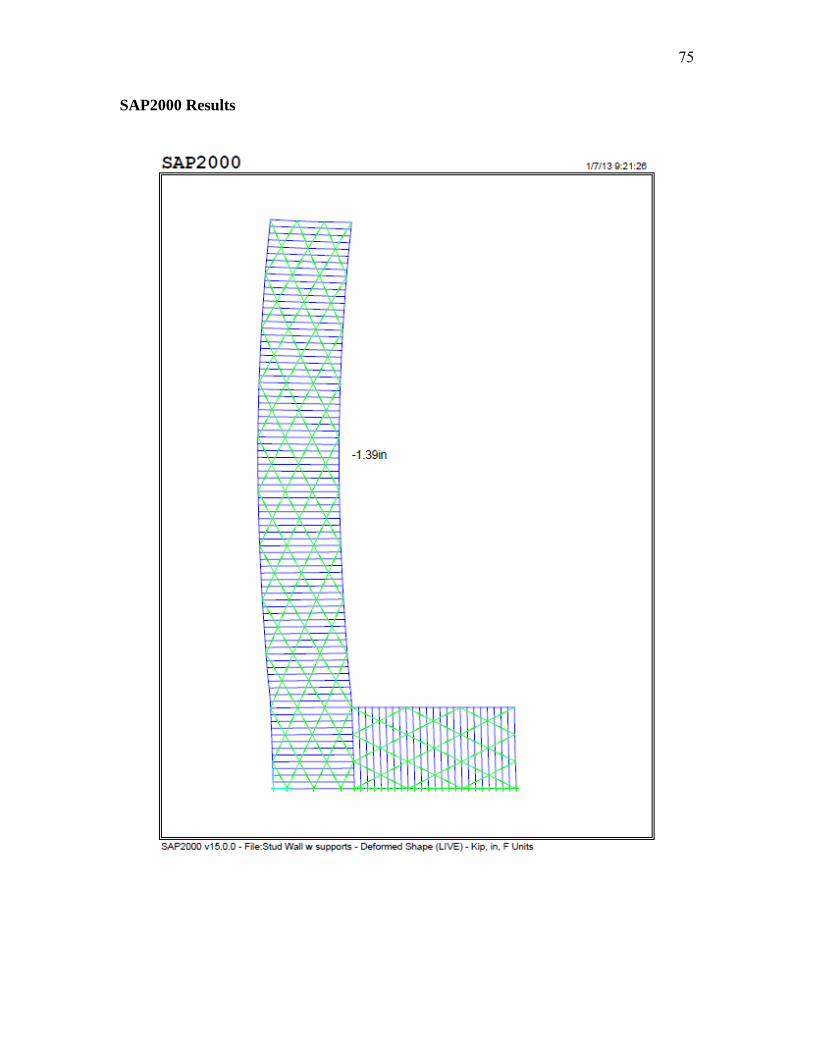
75
SAP2000 Results
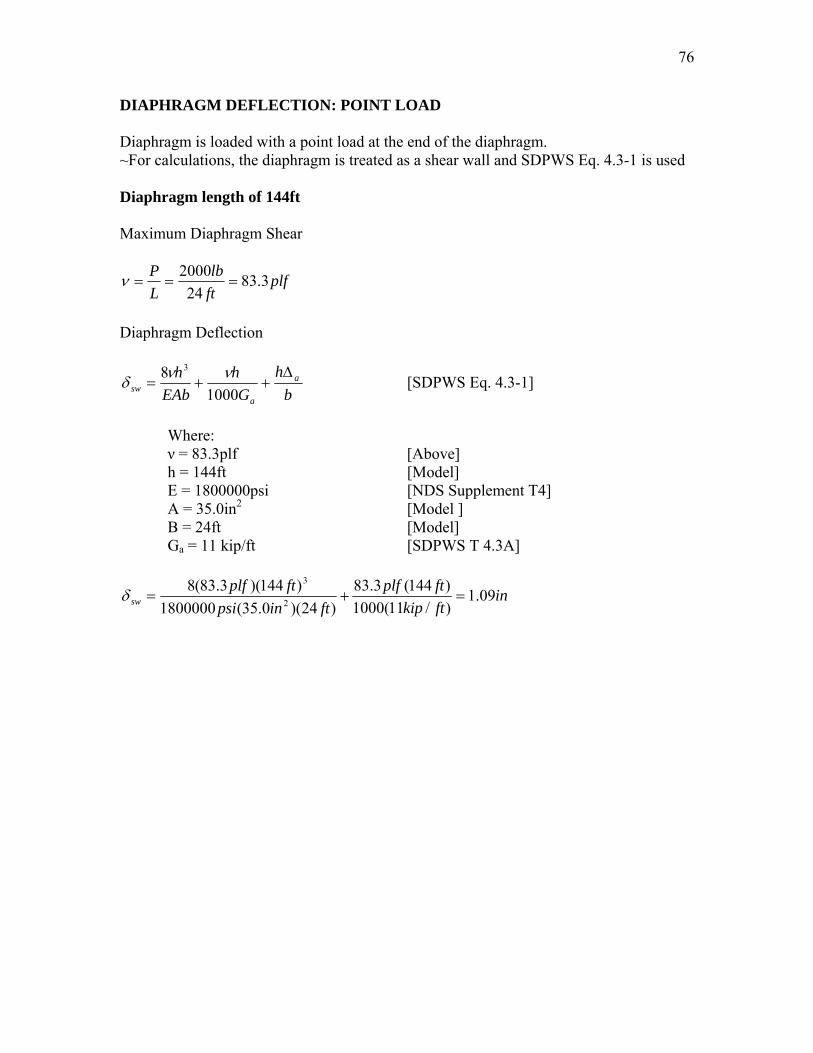
76
DIAPHRAGM DEFLECTION: POINT LOAD Diaphragm is loaded with a point load at the end of the diaphragm. ~For calculations, the diaphragm is treated as a shear wall and SDPWS Eq. 4.3-1 is used Diaphragm length of 144ft Maximum Diaphragm Shear
plfft
lb
L
P3.83
24
2000
Diaphragm Deflection
b
h
G
h
EAb
h a
asw
1000
8 3 [SDPWS Eq. 4.3-1]
Where: ν = 83.3plf [Above] h = 144ft [Model] E = 1800000psi [NDS Supplement T4] A = 35.0in2 [Model ] B = 24ft [Model] Ga = 11 kip/ft [SDPWS T 4.3A]
inftkip
ftplf
ftinpsi
ftplfsw 09.1
)/11(1000
)144(3.83
)24)(0.35(1800000
)144)(3.83(82
3
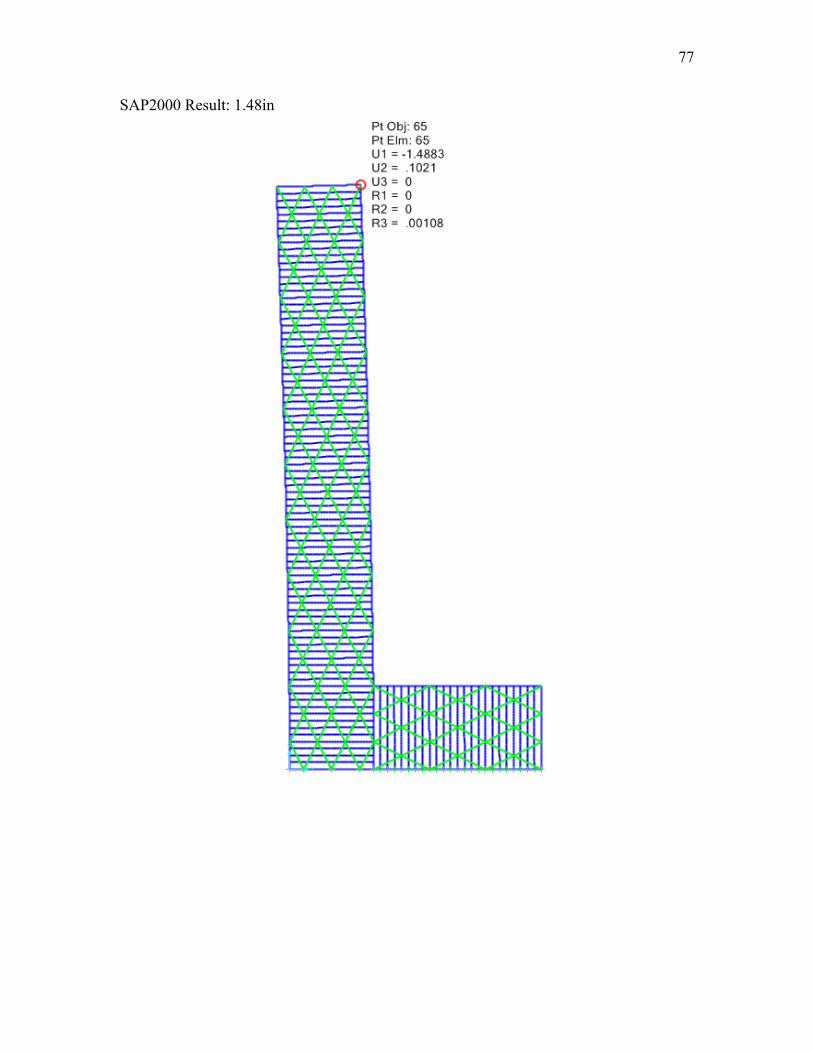
77
SAP2000 Result: 1.48in
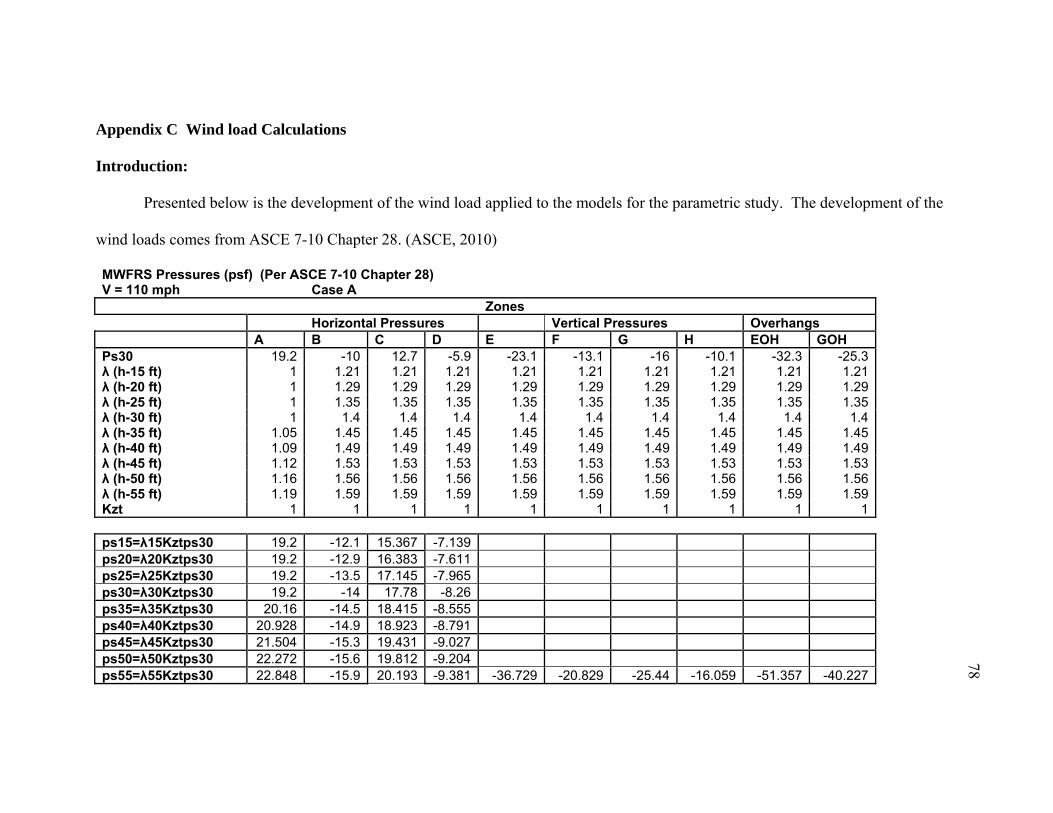
78
Appendix C Wind load Calculations
Introduction:
Presented below is the development of the wind load applied to the models for the parametric study. The development of the
wind loads comes from ASCE 7-10 Chapter 28. (ASCE, 2010)
MWFRS Pressures (psf) (Per ASCE 7-10 Chapter 28) V = 110 mph Case A Zones Horizontal Pressures Vertical Pressures Overhangs A B C D E F G H EOH GOH Ps30 19.2 -10 12.7 -5.9 -23.1 -13.1 -16 -10.1 -32.3 -25.3λ (h-15 ft) 1 1.21 1.21 1.21 1.21 1.21 1.21 1.21 1.21 1.21λ (h-20 ft) 1 1.29 1.29 1.29 1.29 1.29 1.29 1.29 1.29 1.29λ (h-25 ft) 1 1.35 1.35 1.35 1.35 1.35 1.35 1.35 1.35 1.35λ (h-30 ft) 1 1.4 1.4 1.4 1.4 1.4 1.4 1.4 1.4 1.4λ (h-35 ft) 1.05 1.45 1.45 1.45 1.45 1.45 1.45 1.45 1.45 1.45λ (h-40 ft) 1.09 1.49 1.49 1.49 1.49 1.49 1.49 1.49 1.49 1.49λ (h-45 ft) 1.12 1.53 1.53 1.53 1.53 1.53 1.53 1.53 1.53 1.53λ (h-50 ft) 1.16 1.56 1.56 1.56 1.56 1.56 1.56 1.56 1.56 1.56λ (h-55 ft) 1.19 1.59 1.59 1.59 1.59 1.59 1.59 1.59 1.59 1.59Kzt 1 1 1 1 1 1 1 1 1 1 ps15=λ15Kztps30 19.2 -12.1 15.367 -7.139 ps20=λ20Kztps30 19.2 -12.9 16.383 -7.611 ps25=λ25Kztps30 19.2 -13.5 17.145 -7.965 ps30=λ30Kztps30 19.2 -14 17.78 -8.26 ps35=λ35Kztps30 20.16 -14.5 18.415 -8.555 ps40=λ40Kztps30 20.928 -14.9 18.923 -8.791 ps45=λ45Kztps30 21.504 -15.3 19.431 -9.027 ps50=λ50Kztps30 22.272 -15.6 19.812 -9.204 ps55=λ55Kztps30 22.848 -15.9 20.193 -9.381 -36.729 -20.829 -25.44 -16.059 -51.357 -40.227
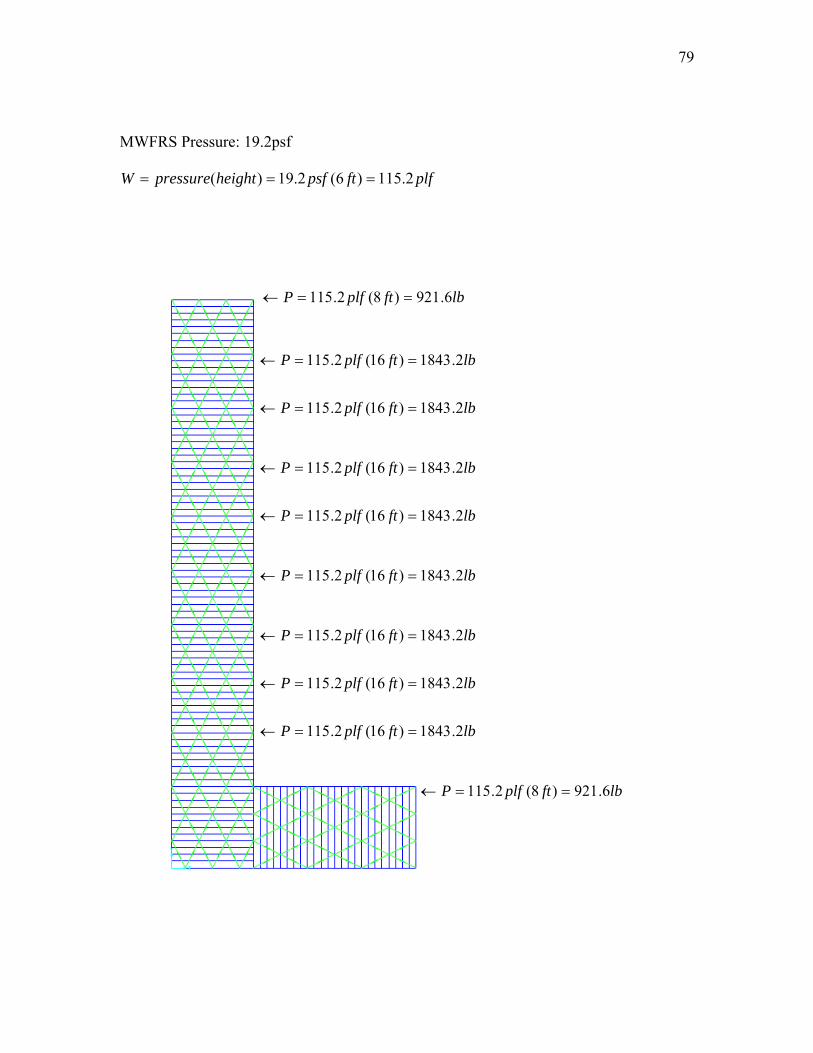
79
MWFRS Pressure: 19.2psf
plfftpsfheightpressureW 2.115)6(2.19)(
lbftplfP 2.1843)16(2.115
lbftplfP 2.1843)16(2.115
lbftplfP 2.1843)16(2.115
lbftplfP 2.1843)16(2.115
lbftplfP 2.1843)16(2.115
lbftplfP 2.1843)16(2.115
lbftplfP 2.1843)16(2.115
lbftplfP 2.1843)16(2.115
lbftplfP 6.921)8(2.115
lbftplfP 6.921)8(2.115

80
Appendix D Non-linear Link Development Introduction: Presented in the tables below is the development of the values for the non-linear
links that were used to represent sheathing in the models.

81
Secant Stiffness, Ks, 9' Walls (kip/in per ft) Secant Stiffness, Ks, 8' Walls (kip/in per ft)
Elastic Wall Drift Wall Drift
Ga 0.5% 1.0% 2.0% 3.0% 4.0% 0.5% 1.0% 2.0% 3.0% 4.0% 6/12 Sing 22 0.772 0.482 0.262 0.150 0.094 1.191 0.735 0.402 0.230 0.143
3/12 D 74 2.744 1.785 1.010 0.573 0.354 4.225 2.736 1.561 0.890 0.554
Gyp 2.223333 0.185 0.088 0.033 0.014 0.005 0.291 0.134 0.047 0.017 0.003 6/12 Dbl 44 1.545 0.964 0.524 0.299 0.187 2.383 1.470 0.805 0.459 0.287
Applied Force, 12' Walls (kip per ft) Applied Force, 8' Walls (kip per ft)
Wall Drift, inches Wall Drift, inches
0.54 1.08 2.16 3.24 4.32 0.48 0.96 1.92 2.88 3.84
6/12 Sing 0.417 0.521 0.566 0.485 0.404 0.572 0.706 0.772 0.661 0.550
3/12 D 1.482 1.928 2.181 1.855 1.529 2.028 2.627 2.997 2.562 2.127
Gyp 0.100 0.095 0.070 0.045 0.020 0.140 0.129 0.089 0.050 0.011
6/12 Dbl 0.834 1.041 1.132 0.970 0.809 1.144 1.411 1.545 1.323 1.101
Ga effective, 9' Walls (kips/in) Ga effective, 8' Walls (kips/in) (except at 0.5% nonGyp)
Wall Drift, % of height Wall Drift, % of height
0.5% 1.0% 2.0% 3.0% 4.0% 0.5% 1.0% 2.0% 3.0% 4.0%
6/12 Sing 9.268 5.783 3.145 1.797 1.123 9.530 5.881 3.218 1.837 1.146
3/12 D 32.923 21.418 12.115 6.871 4.248 33.800 21.892 12.488 7.117 4.432
Gyp 2.223 1.058 0.390 0.167 0.056 2.325 1.073 0.373 0.139 0.022
6/12 Dbl 18.537 11.567 6.289 3.594 2.247 19.060 11.762 6.437 3.674 2.293

82
Equivalent Steel Rod Area Calculator Note: All wood sheathing was 15/32 'Rated Sheathing' (not Struct 1) with 10d common nails 6 6/12 6/12 6/12 6/12 6/12 6/12 6/12 6/12 6/12 6/12 6/12 6/12 6/12
5 6/12‐D
6/12‐D
6/12‐D
3/12‐D 6/12‐D
6/12‐D 6/12‐D 6/12‐D
6/12‐D
3/12‐D
6/12‐D
6/12‐D
3/12‐D
4 6/12‐D
6/12‐D
6/12‐D
3/12‐D 6/12‐D
6/12‐D 6/12‐D 6/12‐D
6/12‐D
3/12‐D
6/12‐D
6/12‐D
3/12‐D
3 6/12‐D
6/12‐D
6/12‐D
3/12‐D 6/12‐D
6/12‐D 6/12‐D 6/12‐D
6/12‐D
3/12‐D
6/12‐D
6/12‐D
3/12‐D
2 6/12‐D
6/12‐D
6/12‐D
3/12‐D 6/12‐D
6/12‐D 6/12‐D 6/12‐D
6/12‐D
3/12‐D
6/12‐D
6/12‐D
3/12‐D
1 6/12‐D
6/12‐D
6/12‐D
3/12‐D 6/12‐D
6/12‐D 6/12‐D 6/12‐D
6/12‐D
3/12‐D
6/12‐D
6/12‐D
3/12‐D
East‐West Elast. Elast. Elast. Hor. Force for Shear Only, at Disp.
Indicated, kips
FLOOR WALL h, ft b, ft b', ft Nailing Cosine Ga, k/in Khor, k/in
Kslope, k/in 0.50% 1% 2% 3% 4%
1 S1 12 4 6/12 Sing 0.316228 11 3.67 36.67 4.98 6.06 6.41 5.42 4.42 1 S1 12 4 6/12 Sing 0.316228 11 3.67 36.67 4.98 6.06 6.41 5.42 4.42 1 Dia1 8 4 6/12 Sing 0.447214 11 5.50 27.50 5.13 6.16 6.54 5.49 4.45 1 Dia1 8 4 6/12 Sing 0.447214 11 5.50 27.50 5.13 6.16 6.54 5.49 4.45
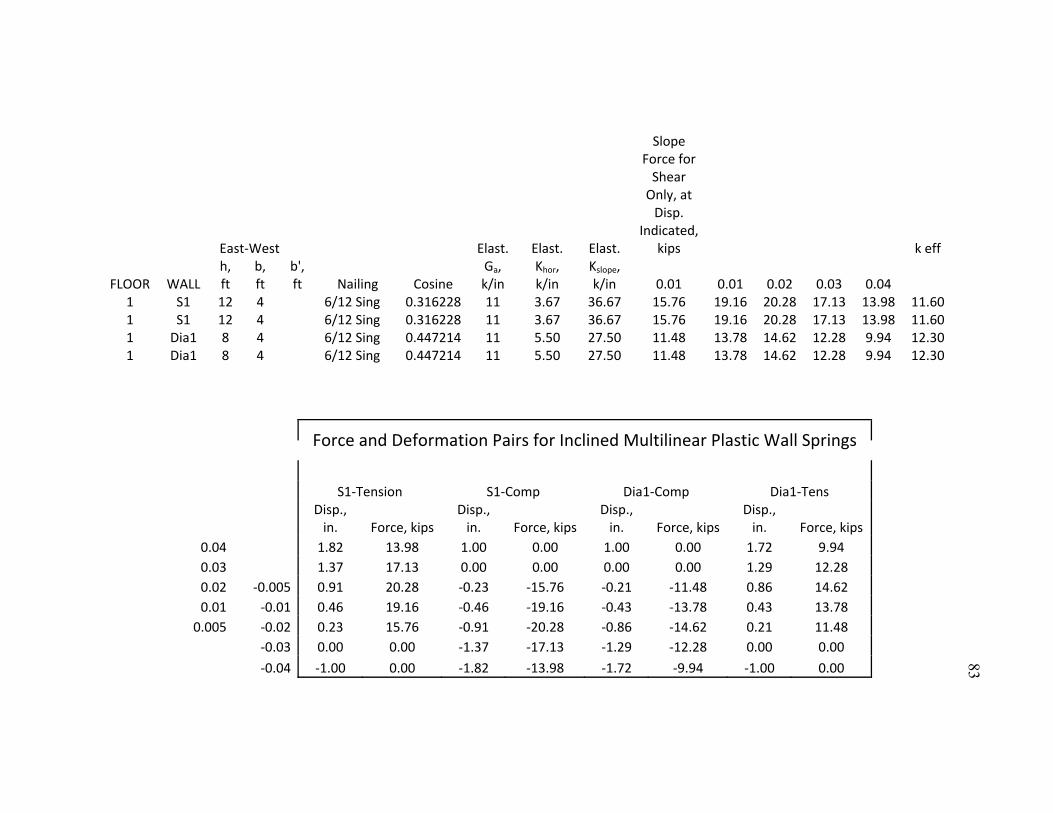
83
Force and Deformation Pairs for Inclined Multilinear Plastic Wall Springs
S1‐Tension S1‐Comp Dia1‐Comp Dia1‐Tens
Disp., in. Force, kips
Disp., in. Force, kips
Disp., in. Force, kips
Disp., in. Force, kips
0.04 1.82 13.98 1.00 0.00 1.00 0.00 1.72 9.94 0.03 1.37 17.13 0.00 0.00 0.00 0.00 1.29 12.28 0.02 ‐0.005 0.91 20.28 ‐0.23 ‐15.76 ‐0.21 ‐11.48 0.86 14.62 0.01 ‐0.01 0.46 19.16 ‐0.46 ‐19.16 ‐0.43 ‐13.78 0.43 13.78
0.005 ‐0.02 0.23 15.76 ‐0.91 ‐20.28 ‐0.86 ‐14.62 0.21 11.48 ‐0.03 0.00 0.00 ‐1.37 ‐17.13 ‐1.29 ‐12.28 0.00 0.00 ‐0.04 ‐1.00 0.00 ‐1.82 ‐13.98 ‐1.72 ‐9.94 ‐1.00 0.00
East‐West Elast. Elast. Elast.
Slope Force for Shear Only, at Disp.
Indicated, kips k eff
FLOOR WALL h, ft
b, ft
b', ft Nailing Cosine
Ga, k/in
Khor, k/in
Kslope, k/in 0.01 0.01 0.02 0.03 0.04
1 S1 12 4 6/12 Sing 0.316228 11 3.67 36.67 15.76 19.16 20.28 17.13 13.98 11.60 1 S1 12 4 6/12 Sing 0.316228 11 3.67 36.67 15.76 19.16 20.28 17.13 13.98 11.60 1 Dia1 8 4 6/12 Sing 0.447214 11 5.50 27.50 11.48 13.78 14.62 12.28 9.94 12.30 1 Dia1 8 4 6/12 Sing 0.447214 11 5.50 27.50 11.48 13.78 14.62 12.28 9.94 12.30
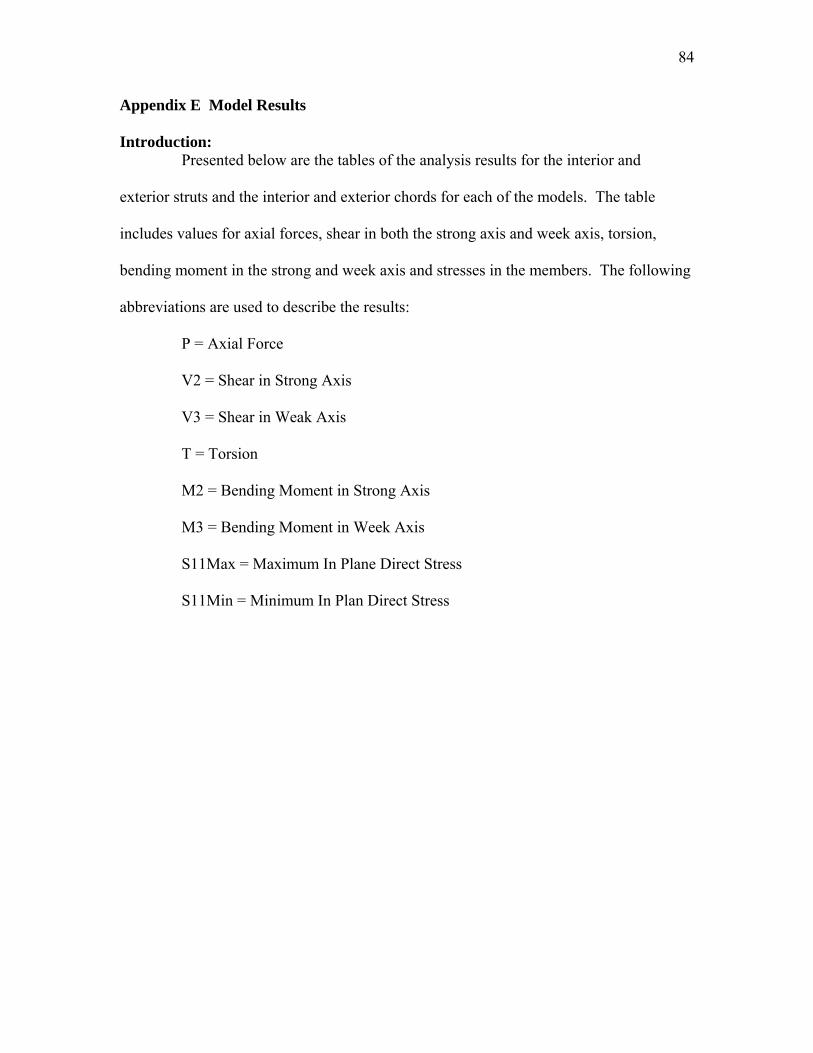
84
Appendix E Model Results Introduction: Presented below are the tables of the analysis results for the interior and
exterior struts and the interior and exterior chords for each of the models. The table
includes values for axial forces, shear in both the strong axis and week axis, torsion,
bending moment in the strong and week axis and stresses in the members. The following
abbreviations are used to describe the results:
P = Axial Force
V2 = Shear in Strong Axis
V3 = Shear in Weak Axis
T = Torsion
M2 = Bending Moment in Strong Axis
M3 = Bending Moment in Week Axis
S11Max = Maximum In Plane Direct Stress
S11Min = Minimum In Plan Direct Stress
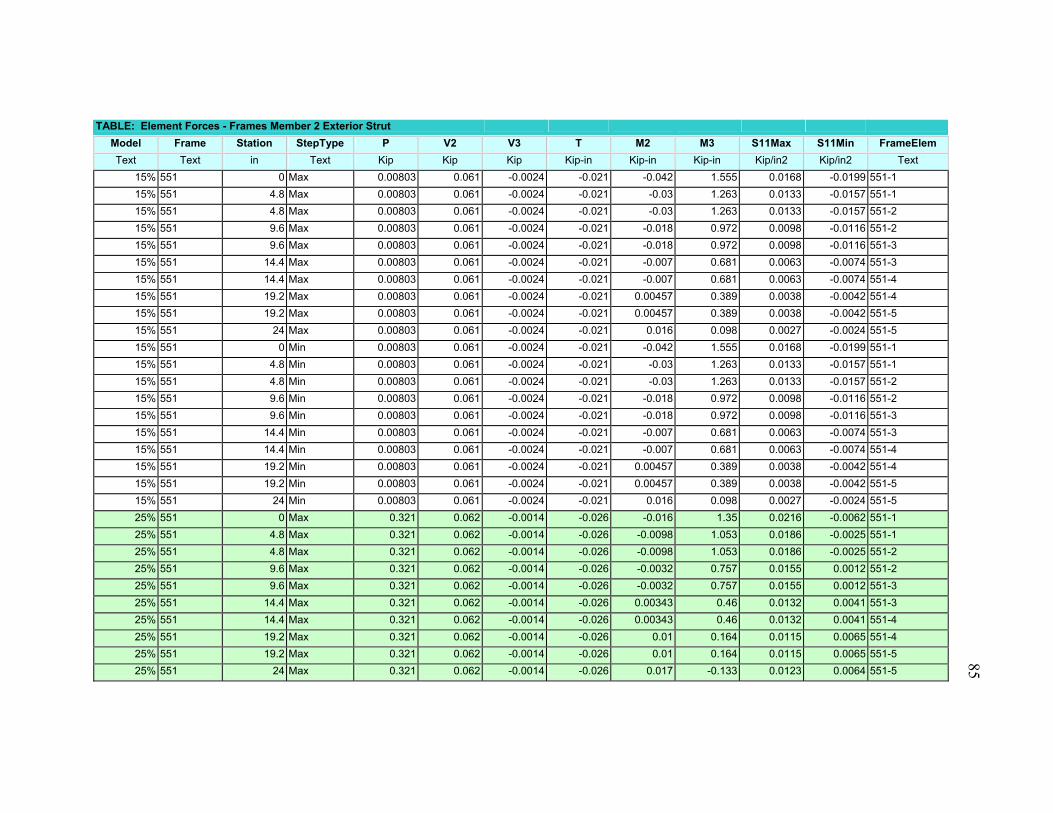
85
TABLE: Element Forces - Frames Member 2 Exterior Strut
Model Frame Station StepType P V2 V3 T M2 M3 S11Max S11Min FrameElem
Text Text in Text Kip Kip Kip Kip-in Kip-in Kip-in Kip/in2 Kip/in2 Text
15% 551 0 Max 0.00803 0.061 -0.0024 -0.021 -0.042 1.555 0.0168 -0.0199 551-1
15% 551 4.8 Max 0.00803 0.061 -0.0024 -0.021 -0.03 1.263 0.0133 -0.0157 551-1
15% 551 4.8 Max 0.00803 0.061 -0.0024 -0.021 -0.03 1.263 0.0133 -0.0157 551-2
15% 551 9.6 Max 0.00803 0.061 -0.0024 -0.021 -0.018 0.972 0.0098 -0.0116 551-2
15% 551 9.6 Max 0.00803 0.061 -0.0024 -0.021 -0.018 0.972 0.0098 -0.0116 551-3
15% 551 14.4 Max 0.00803 0.061 -0.0024 -0.021 -0.007 0.681 0.0063 -0.0074 551-3
15% 551 14.4 Max 0.00803 0.061 -0.0024 -0.021 -0.007 0.681 0.0063 -0.0074 551-4
15% 551 19.2 Max 0.00803 0.061 -0.0024 -0.021 0.00457 0.389 0.0038 -0.0042 551-4
15% 551 19.2 Max 0.00803 0.061 -0.0024 -0.021 0.00457 0.389 0.0038 -0.0042 551-5
15% 551 24 Max 0.00803 0.061 -0.0024 -0.021 0.016 0.098 0.0027 -0.0024 551-5
15% 551 0 Min 0.00803 0.061 -0.0024 -0.021 -0.042 1.555 0.0168 -0.0199 551-1
15% 551 4.8 Min 0.00803 0.061 -0.0024 -0.021 -0.03 1.263 0.0133 -0.0157 551-1
15% 551 4.8 Min 0.00803 0.061 -0.0024 -0.021 -0.03 1.263 0.0133 -0.0157 551-2
15% 551 9.6 Min 0.00803 0.061 -0.0024 -0.021 -0.018 0.972 0.0098 -0.0116 551-2
15% 551 9.6 Min 0.00803 0.061 -0.0024 -0.021 -0.018 0.972 0.0098 -0.0116 551-3
15% 551 14.4 Min 0.00803 0.061 -0.0024 -0.021 -0.007 0.681 0.0063 -0.0074 551-3
15% 551 14.4 Min 0.00803 0.061 -0.0024 -0.021 -0.007 0.681 0.0063 -0.0074 551-4
15% 551 19.2 Min 0.00803 0.061 -0.0024 -0.021 0.00457 0.389 0.0038 -0.0042 551-4
15% 551 19.2 Min 0.00803 0.061 -0.0024 -0.021 0.00457 0.389 0.0038 -0.0042 551-5
15% 551 24 Min 0.00803 0.061 -0.0024 -0.021 0.016 0.098 0.0027 -0.0024 551-5
25% 551 0 Max 0.321 0.062 -0.0014 -0.026 -0.016 1.35 0.0216 -0.0062 551-1
25% 551 4.8 Max 0.321 0.062 -0.0014 -0.026 -0.0098 1.053 0.0186 -0.0025 551-1
25% 551 4.8 Max 0.321 0.062 -0.0014 -0.026 -0.0098 1.053 0.0186 -0.0025 551-2
25% 551 9.6 Max 0.321 0.062 -0.0014 -0.026 -0.0032 0.757 0.0155 0.0012 551-2
25% 551 9.6 Max 0.321 0.062 -0.0014 -0.026 -0.0032 0.757 0.0155 0.0012 551-3
25% 551 14.4 Max 0.321 0.062 -0.0014 -0.026 0.00343 0.46 0.0132 0.0041 551-3
25% 551 14.4 Max 0.321 0.062 -0.0014 -0.026 0.00343 0.46 0.0132 0.0041 551-4
25% 551 19.2 Max 0.321 0.062 -0.0014 -0.026 0.01 0.164 0.0115 0.0065 551-4
25% 551 19.2 Max 0.321 0.062 -0.0014 -0.026 0.01 0.164 0.0115 0.0065 551-5
25% 551 24 Max 0.321 0.062 -0.0014 -0.026 0.017 -0.133 0.0123 0.0064 551-5
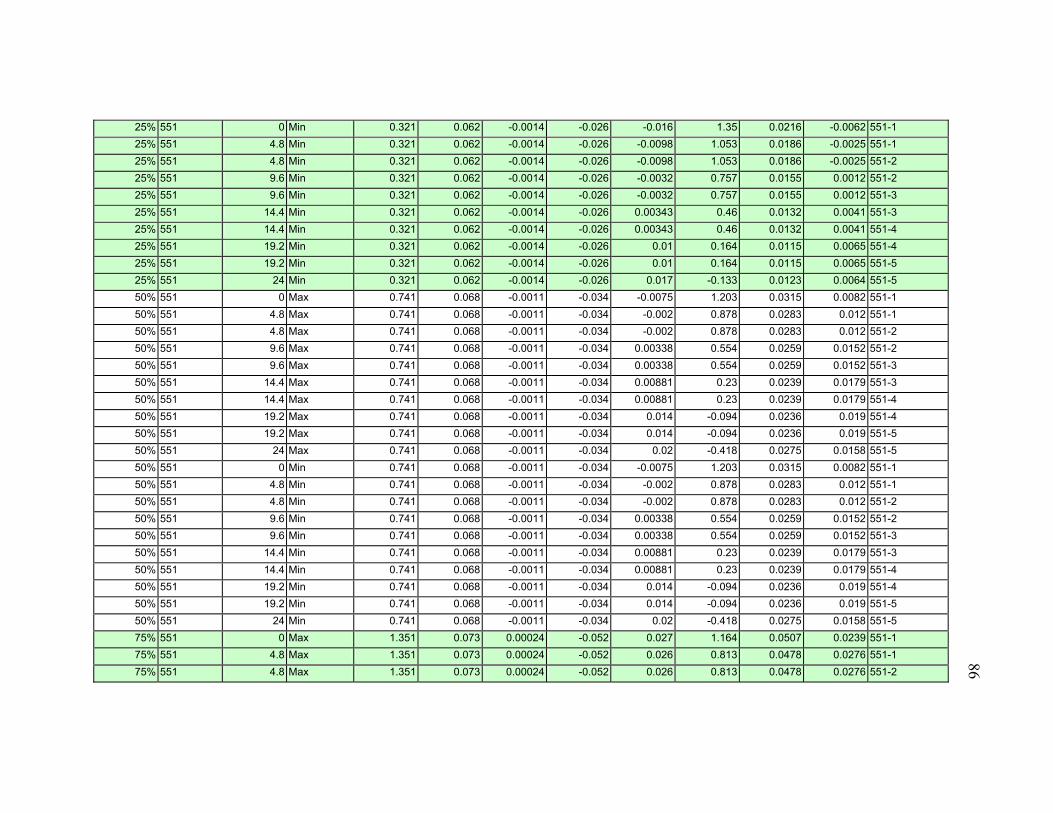
86
25% 551 0 Min 0.321 0.062 -0.0014 -0.026 -0.016 1.35 0.0216 -0.0062 551-1
25% 551 4.8 Min 0.321 0.062 -0.0014 -0.026 -0.0098 1.053 0.0186 -0.0025 551-1
25% 551 4.8 Min 0.321 0.062 -0.0014 -0.026 -0.0098 1.053 0.0186 -0.0025 551-2
25% 551 9.6 Min 0.321 0.062 -0.0014 -0.026 -0.0032 0.757 0.0155 0.0012 551-2
25% 551 9.6 Min 0.321 0.062 -0.0014 -0.026 -0.0032 0.757 0.0155 0.0012 551-3
25% 551 14.4 Min 0.321 0.062 -0.0014 -0.026 0.00343 0.46 0.0132 0.0041 551-3
25% 551 14.4 Min 0.321 0.062 -0.0014 -0.026 0.00343 0.46 0.0132 0.0041 551-4
25% 551 19.2 Min 0.321 0.062 -0.0014 -0.026 0.01 0.164 0.0115 0.0065 551-4
25% 551 19.2 Min 0.321 0.062 -0.0014 -0.026 0.01 0.164 0.0115 0.0065 551-5
25% 551 24 Min 0.321 0.062 -0.0014 -0.026 0.017 -0.133 0.0123 0.0064 551-5
50% 551 0 Max 0.741 0.068 -0.0011 -0.034 -0.0075 1.203 0.0315 0.0082 551-1
50% 551 4.8 Max 0.741 0.068 -0.0011 -0.034 -0.002 0.878 0.0283 0.012 551-1
50% 551 4.8 Max 0.741 0.068 -0.0011 -0.034 -0.002 0.878 0.0283 0.012 551-2
50% 551 9.6 Max 0.741 0.068 -0.0011 -0.034 0.00338 0.554 0.0259 0.0152 551-2
50% 551 9.6 Max 0.741 0.068 -0.0011 -0.034 0.00338 0.554 0.0259 0.0152 551-3
50% 551 14.4 Max 0.741 0.068 -0.0011 -0.034 0.00881 0.23 0.0239 0.0179 551-3
50% 551 14.4 Max 0.741 0.068 -0.0011 -0.034 0.00881 0.23 0.0239 0.0179 551-4
50% 551 19.2 Max 0.741 0.068 -0.0011 -0.034 0.014 -0.094 0.0236 0.019 551-4
50% 551 19.2 Max 0.741 0.068 -0.0011 -0.034 0.014 -0.094 0.0236 0.019 551-5
50% 551 24 Max 0.741 0.068 -0.0011 -0.034 0.02 -0.418 0.0275 0.0158 551-5
50% 551 0 Min 0.741 0.068 -0.0011 -0.034 -0.0075 1.203 0.0315 0.0082 551-1
50% 551 4.8 Min 0.741 0.068 -0.0011 -0.034 -0.002 0.878 0.0283 0.012 551-1
50% 551 4.8 Min 0.741 0.068 -0.0011 -0.034 -0.002 0.878 0.0283 0.012 551-2
50% 551 9.6 Min 0.741 0.068 -0.0011 -0.034 0.00338 0.554 0.0259 0.0152 551-2
50% 551 9.6 Min 0.741 0.068 -0.0011 -0.034 0.00338 0.554 0.0259 0.0152 551-3
50% 551 14.4 Min 0.741 0.068 -0.0011 -0.034 0.00881 0.23 0.0239 0.0179 551-3
50% 551 14.4 Min 0.741 0.068 -0.0011 -0.034 0.00881 0.23 0.0239 0.0179 551-4
50% 551 19.2 Min 0.741 0.068 -0.0011 -0.034 0.014 -0.094 0.0236 0.019 551-4
50% 551 19.2 Min 0.741 0.068 -0.0011 -0.034 0.014 -0.094 0.0236 0.019 551-5
50% 551 24 Min 0.741 0.068 -0.0011 -0.034 0.02 -0.418 0.0275 0.0158 551-5
75% 551 0 Max 1.351 0.073 0.00024 -0.052 0.027 1.164 0.0507 0.0239 551-1
75% 551 4.8 Max 1.351 0.073 0.00024 -0.052 0.026 0.813 0.0478 0.0276 551-1
75% 551 4.8 Max 1.351 0.073 0.00024 -0.052 0.026 0.813 0.0478 0.0276 551-2
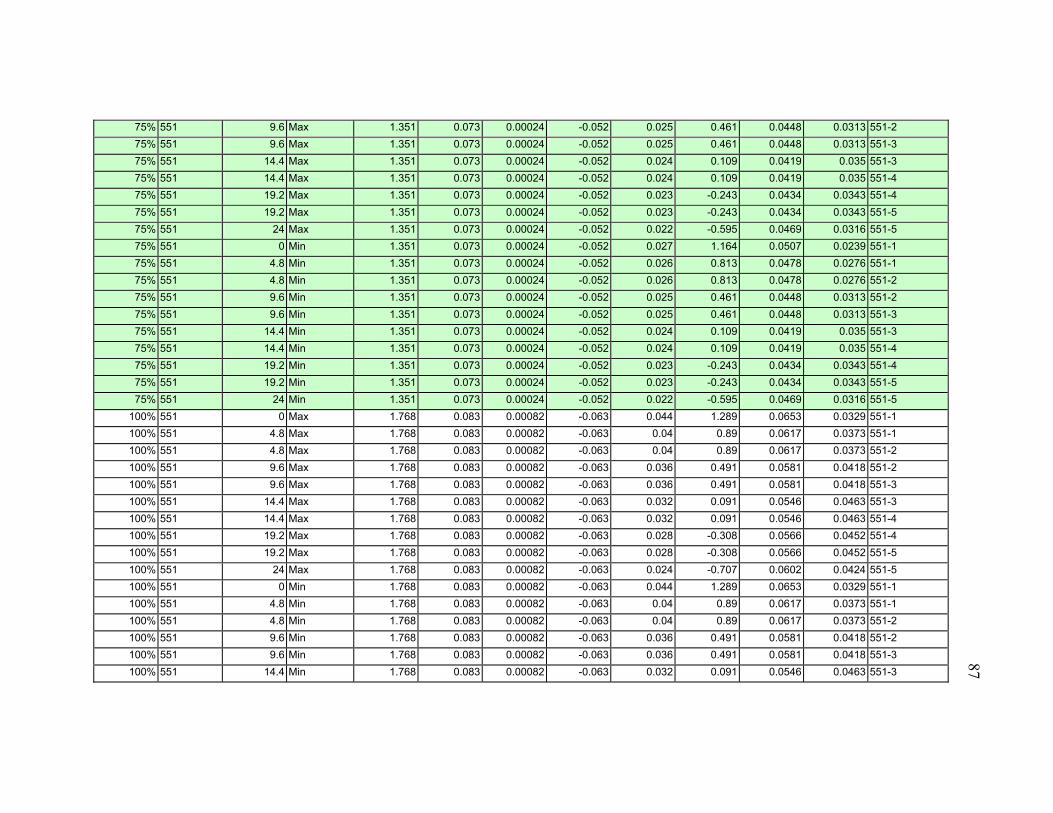
87
75% 551 9.6 Max 1.351 0.073 0.00024 -0.052 0.025 0.461 0.0448 0.0313 551-2
75% 551 9.6 Max 1.351 0.073 0.00024 -0.052 0.025 0.461 0.0448 0.0313 551-3
75% 551 14.4 Max 1.351 0.073 0.00024 -0.052 0.024 0.109 0.0419 0.035 551-3
75% 551 14.4 Max 1.351 0.073 0.00024 -0.052 0.024 0.109 0.0419 0.035 551-4
75% 551 19.2 Max 1.351 0.073 0.00024 -0.052 0.023 -0.243 0.0434 0.0343 551-4
75% 551 19.2 Max 1.351 0.073 0.00024 -0.052 0.023 -0.243 0.0434 0.0343 551-5
75% 551 24 Max 1.351 0.073 0.00024 -0.052 0.022 -0.595 0.0469 0.0316 551-5
75% 551 0 Min 1.351 0.073 0.00024 -0.052 0.027 1.164 0.0507 0.0239 551-1
75% 551 4.8 Min 1.351 0.073 0.00024 -0.052 0.026 0.813 0.0478 0.0276 551-1
75% 551 4.8 Min 1.351 0.073 0.00024 -0.052 0.026 0.813 0.0478 0.0276 551-2
75% 551 9.6 Min 1.351 0.073 0.00024 -0.052 0.025 0.461 0.0448 0.0313 551-2
75% 551 9.6 Min 1.351 0.073 0.00024 -0.052 0.025 0.461 0.0448 0.0313 551-3
75% 551 14.4 Min 1.351 0.073 0.00024 -0.052 0.024 0.109 0.0419 0.035 551-3
75% 551 14.4 Min 1.351 0.073 0.00024 -0.052 0.024 0.109 0.0419 0.035 551-4
75% 551 19.2 Min 1.351 0.073 0.00024 -0.052 0.023 -0.243 0.0434 0.0343 551-4
75% 551 19.2 Min 1.351 0.073 0.00024 -0.052 0.023 -0.243 0.0434 0.0343 551-5
75% 551 24 Min 1.351 0.073 0.00024 -0.052 0.022 -0.595 0.0469 0.0316 551-5
100% 551 0 Max 1.768 0.083 0.00082 -0.063 0.044 1.289 0.0653 0.0329 551-1
100% 551 4.8 Max 1.768 0.083 0.00082 -0.063 0.04 0.89 0.0617 0.0373 551-1
100% 551 4.8 Max 1.768 0.083 0.00082 -0.063 0.04 0.89 0.0617 0.0373 551-2
100% 551 9.6 Max 1.768 0.083 0.00082 -0.063 0.036 0.491 0.0581 0.0418 551-2
100% 551 9.6 Max 1.768 0.083 0.00082 -0.063 0.036 0.491 0.0581 0.0418 551-3
100% 551 14.4 Max 1.768 0.083 0.00082 -0.063 0.032 0.091 0.0546 0.0463 551-3
100% 551 14.4 Max 1.768 0.083 0.00082 -0.063 0.032 0.091 0.0546 0.0463 551-4
100% 551 19.2 Max 1.768 0.083 0.00082 -0.063 0.028 -0.308 0.0566 0.0452 551-4
100% 551 19.2 Max 1.768 0.083 0.00082 -0.063 0.028 -0.308 0.0566 0.0452 551-5
100% 551 24 Max 1.768 0.083 0.00082 -0.063 0.024 -0.707 0.0602 0.0424 551-5
100% 551 0 Min 1.768 0.083 0.00082 -0.063 0.044 1.289 0.0653 0.0329 551-1
100% 551 4.8 Min 1.768 0.083 0.00082 -0.063 0.04 0.89 0.0617 0.0373 551-1
100% 551 4.8 Min 1.768 0.083 0.00082 -0.063 0.04 0.89 0.0617 0.0373 551-2
100% 551 9.6 Min 1.768 0.083 0.00082 -0.063 0.036 0.491 0.0581 0.0418 551-2
100% 551 9.6 Min 1.768 0.083 0.00082 -0.063 0.036 0.491 0.0581 0.0418 551-3
100% 551 14.4 Min 1.768 0.083 0.00082 -0.063 0.032 0.091 0.0546 0.0463 551-3
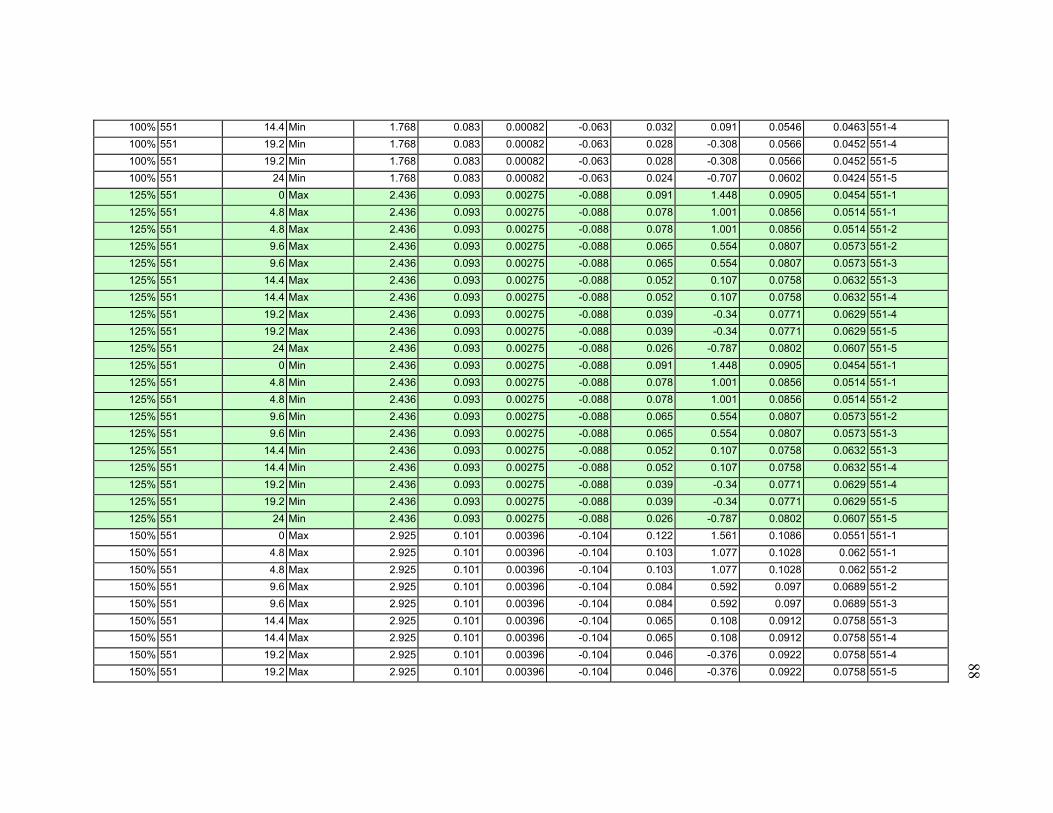
88
100% 551 14.4 Min 1.768 0.083 0.00082 -0.063 0.032 0.091 0.0546 0.0463 551-4
100% 551 19.2 Min 1.768 0.083 0.00082 -0.063 0.028 -0.308 0.0566 0.0452 551-4
100% 551 19.2 Min 1.768 0.083 0.00082 -0.063 0.028 -0.308 0.0566 0.0452 551-5
100% 551 24 Min 1.768 0.083 0.00082 -0.063 0.024 -0.707 0.0602 0.0424 551-5
125% 551 0 Max 2.436 0.093 0.00275 -0.088 0.091 1.448 0.0905 0.0454 551-1
125% 551 4.8 Max 2.436 0.093 0.00275 -0.088 0.078 1.001 0.0856 0.0514 551-1
125% 551 4.8 Max 2.436 0.093 0.00275 -0.088 0.078 1.001 0.0856 0.0514 551-2
125% 551 9.6 Max 2.436 0.093 0.00275 -0.088 0.065 0.554 0.0807 0.0573 551-2
125% 551 9.6 Max 2.436 0.093 0.00275 -0.088 0.065 0.554 0.0807 0.0573 551-3
125% 551 14.4 Max 2.436 0.093 0.00275 -0.088 0.052 0.107 0.0758 0.0632 551-3
125% 551 14.4 Max 2.436 0.093 0.00275 -0.088 0.052 0.107 0.0758 0.0632 551-4
125% 551 19.2 Max 2.436 0.093 0.00275 -0.088 0.039 -0.34 0.0771 0.0629 551-4
125% 551 19.2 Max 2.436 0.093 0.00275 -0.088 0.039 -0.34 0.0771 0.0629 551-5
125% 551 24 Max 2.436 0.093 0.00275 -0.088 0.026 -0.787 0.0802 0.0607 551-5
125% 551 0 Min 2.436 0.093 0.00275 -0.088 0.091 1.448 0.0905 0.0454 551-1
125% 551 4.8 Min 2.436 0.093 0.00275 -0.088 0.078 1.001 0.0856 0.0514 551-1
125% 551 4.8 Min 2.436 0.093 0.00275 -0.088 0.078 1.001 0.0856 0.0514 551-2
125% 551 9.6 Min 2.436 0.093 0.00275 -0.088 0.065 0.554 0.0807 0.0573 551-2
125% 551 9.6 Min 2.436 0.093 0.00275 -0.088 0.065 0.554 0.0807 0.0573 551-3
125% 551 14.4 Min 2.436 0.093 0.00275 -0.088 0.052 0.107 0.0758 0.0632 551-3
125% 551 14.4 Min 2.436 0.093 0.00275 -0.088 0.052 0.107 0.0758 0.0632 551-4
125% 551 19.2 Min 2.436 0.093 0.00275 -0.088 0.039 -0.34 0.0771 0.0629 551-4
125% 551 19.2 Min 2.436 0.093 0.00275 -0.088 0.039 -0.34 0.0771 0.0629 551-5
125% 551 24 Min 2.436 0.093 0.00275 -0.088 0.026 -0.787 0.0802 0.0607 551-5
150% 551 0 Max 2.925 0.101 0.00396 -0.104 0.122 1.561 0.1086 0.0551 551-1
150% 551 4.8 Max 2.925 0.101 0.00396 -0.104 0.103 1.077 0.1028 0.062 551-1
150% 551 4.8 Max 2.925 0.101 0.00396 -0.104 0.103 1.077 0.1028 0.062 551-2
150% 551 9.6 Max 2.925 0.101 0.00396 -0.104 0.084 0.592 0.097 0.0689 551-2
150% 551 9.6 Max 2.925 0.101 0.00396 -0.104 0.084 0.592 0.097 0.0689 551-3
150% 551 14.4 Max 2.925 0.101 0.00396 -0.104 0.065 0.108 0.0912 0.0758 551-3
150% 551 14.4 Max 2.925 0.101 0.00396 -0.104 0.065 0.108 0.0912 0.0758 551-4
150% 551 19.2 Max 2.925 0.101 0.00396 -0.104 0.046 -0.376 0.0922 0.0758 551-4
150% 551 19.2 Max 2.925 0.101 0.00396 -0.104 0.046 -0.376 0.0922 0.0758 551-5
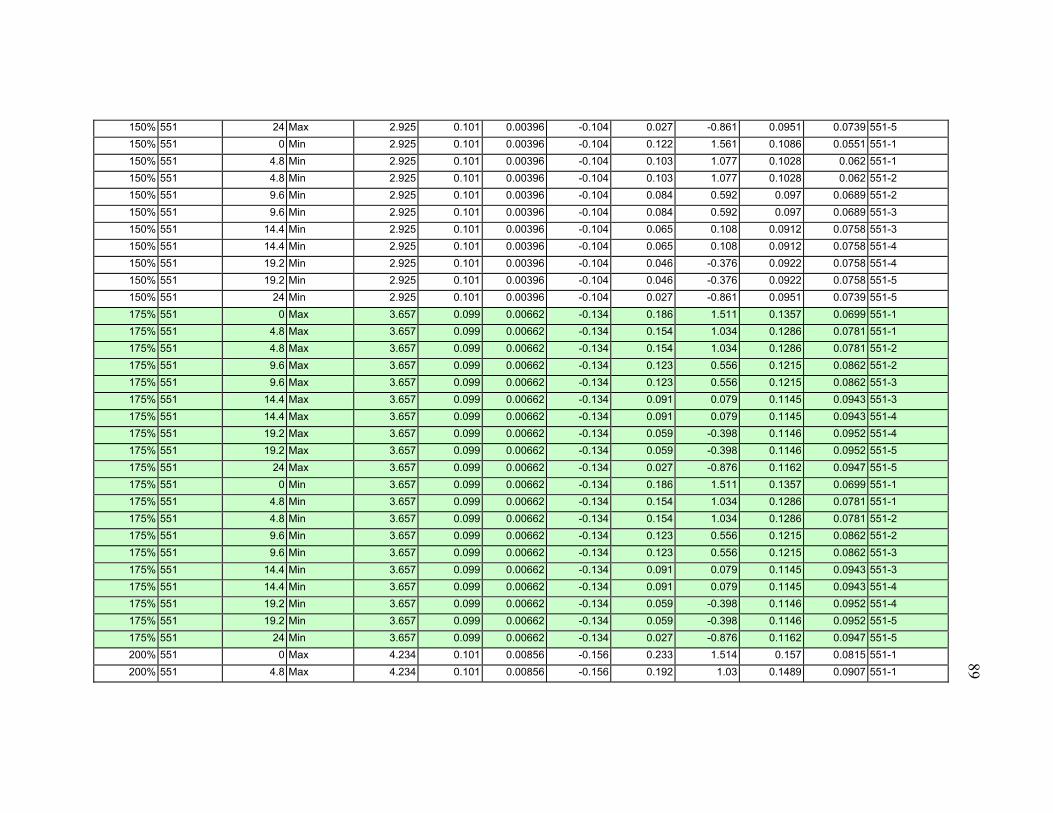
89
150% 551 24 Max 2.925 0.101 0.00396 -0.104 0.027 -0.861 0.0951 0.0739 551-5
150% 551 0 Min 2.925 0.101 0.00396 -0.104 0.122 1.561 0.1086 0.0551 551-1
150% 551 4.8 Min 2.925 0.101 0.00396 -0.104 0.103 1.077 0.1028 0.062 551-1
150% 551 4.8 Min 2.925 0.101 0.00396 -0.104 0.103 1.077 0.1028 0.062 551-2
150% 551 9.6 Min 2.925 0.101 0.00396 -0.104 0.084 0.592 0.097 0.0689 551-2
150% 551 9.6 Min 2.925 0.101 0.00396 -0.104 0.084 0.592 0.097 0.0689 551-3
150% 551 14.4 Min 2.925 0.101 0.00396 -0.104 0.065 0.108 0.0912 0.0758 551-3
150% 551 14.4 Min 2.925 0.101 0.00396 -0.104 0.065 0.108 0.0912 0.0758 551-4
150% 551 19.2 Min 2.925 0.101 0.00396 -0.104 0.046 -0.376 0.0922 0.0758 551-4
150% 551 19.2 Min 2.925 0.101 0.00396 -0.104 0.046 -0.376 0.0922 0.0758 551-5
150% 551 24 Min 2.925 0.101 0.00396 -0.104 0.027 -0.861 0.0951 0.0739 551-5
175% 551 0 Max 3.657 0.099 0.00662 -0.134 0.186 1.511 0.1357 0.0699 551-1
175% 551 4.8 Max 3.657 0.099 0.00662 -0.134 0.154 1.034 0.1286 0.0781 551-1
175% 551 4.8 Max 3.657 0.099 0.00662 -0.134 0.154 1.034 0.1286 0.0781 551-2
175% 551 9.6 Max 3.657 0.099 0.00662 -0.134 0.123 0.556 0.1215 0.0862 551-2
175% 551 9.6 Max 3.657 0.099 0.00662 -0.134 0.123 0.556 0.1215 0.0862 551-3
175% 551 14.4 Max 3.657 0.099 0.00662 -0.134 0.091 0.079 0.1145 0.0943 551-3
175% 551 14.4 Max 3.657 0.099 0.00662 -0.134 0.091 0.079 0.1145 0.0943 551-4
175% 551 19.2 Max 3.657 0.099 0.00662 -0.134 0.059 -0.398 0.1146 0.0952 551-4
175% 551 19.2 Max 3.657 0.099 0.00662 -0.134 0.059 -0.398 0.1146 0.0952 551-5
175% 551 24 Max 3.657 0.099 0.00662 -0.134 0.027 -0.876 0.1162 0.0947 551-5
175% 551 0 Min 3.657 0.099 0.00662 -0.134 0.186 1.511 0.1357 0.0699 551-1
175% 551 4.8 Min 3.657 0.099 0.00662 -0.134 0.154 1.034 0.1286 0.0781 551-1
175% 551 4.8 Min 3.657 0.099 0.00662 -0.134 0.154 1.034 0.1286 0.0781 551-2
175% 551 9.6 Min 3.657 0.099 0.00662 -0.134 0.123 0.556 0.1215 0.0862 551-2
175% 551 9.6 Min 3.657 0.099 0.00662 -0.134 0.123 0.556 0.1215 0.0862 551-3
175% 551 14.4 Min 3.657 0.099 0.00662 -0.134 0.091 0.079 0.1145 0.0943 551-3
175% 551 14.4 Min 3.657 0.099 0.00662 -0.134 0.091 0.079 0.1145 0.0943 551-4
175% 551 19.2 Min 3.657 0.099 0.00662 -0.134 0.059 -0.398 0.1146 0.0952 551-4
175% 551 19.2 Min 3.657 0.099 0.00662 -0.134 0.059 -0.398 0.1146 0.0952 551-5
175% 551 24 Min 3.657 0.099 0.00662 -0.134 0.027 -0.876 0.1162 0.0947 551-5
200% 551 0 Max 4.234 0.101 0.00856 -0.156 0.233 1.514 0.157 0.0815 551-1
200% 551 4.8 Max 4.234 0.101 0.00856 -0.156 0.192 1.03 0.1489 0.0907 551-1
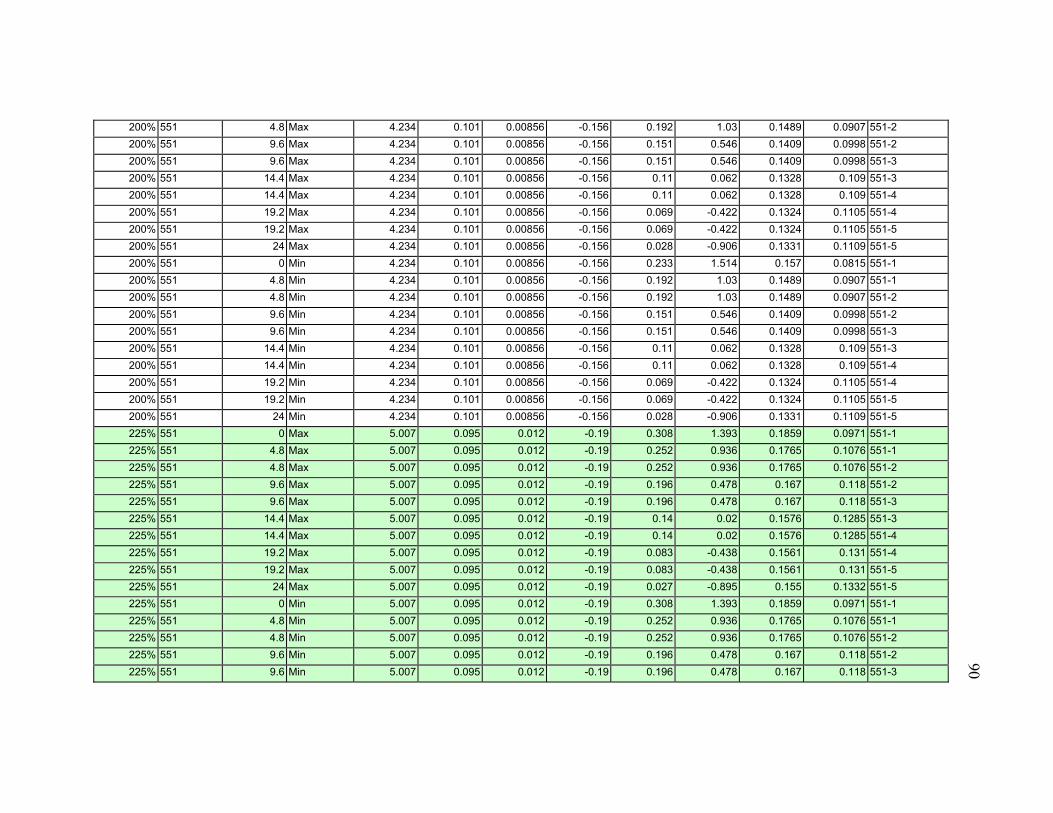
90
200% 551 4.8 Max 4.234 0.101 0.00856 -0.156 0.192 1.03 0.1489 0.0907 551-2
200% 551 9.6 Max 4.234 0.101 0.00856 -0.156 0.151 0.546 0.1409 0.0998 551-2
200% 551 9.6 Max 4.234 0.101 0.00856 -0.156 0.151 0.546 0.1409 0.0998 551-3
200% 551 14.4 Max 4.234 0.101 0.00856 -0.156 0.11 0.062 0.1328 0.109 551-3
200% 551 14.4 Max 4.234 0.101 0.00856 -0.156 0.11 0.062 0.1328 0.109 551-4
200% 551 19.2 Max 4.234 0.101 0.00856 -0.156 0.069 -0.422 0.1324 0.1105 551-4
200% 551 19.2 Max 4.234 0.101 0.00856 -0.156 0.069 -0.422 0.1324 0.1105 551-5
200% 551 24 Max 4.234 0.101 0.00856 -0.156 0.028 -0.906 0.1331 0.1109 551-5
200% 551 0 Min 4.234 0.101 0.00856 -0.156 0.233 1.514 0.157 0.0815 551-1
200% 551 4.8 Min 4.234 0.101 0.00856 -0.156 0.192 1.03 0.1489 0.0907 551-1
200% 551 4.8 Min 4.234 0.101 0.00856 -0.156 0.192 1.03 0.1489 0.0907 551-2
200% 551 9.6 Min 4.234 0.101 0.00856 -0.156 0.151 0.546 0.1409 0.0998 551-2
200% 551 9.6 Min 4.234 0.101 0.00856 -0.156 0.151 0.546 0.1409 0.0998 551-3
200% 551 14.4 Min 4.234 0.101 0.00856 -0.156 0.11 0.062 0.1328 0.109 551-3
200% 551 14.4 Min 4.234 0.101 0.00856 -0.156 0.11 0.062 0.1328 0.109 551-4
200% 551 19.2 Min 4.234 0.101 0.00856 -0.156 0.069 -0.422 0.1324 0.1105 551-4
200% 551 19.2 Min 4.234 0.101 0.00856 -0.156 0.069 -0.422 0.1324 0.1105 551-5
200% 551 24 Min 4.234 0.101 0.00856 -0.156 0.028 -0.906 0.1331 0.1109 551-5
225% 551 0 Max 5.007 0.095 0.012 -0.19 0.308 1.393 0.1859 0.0971 551-1
225% 551 4.8 Max 5.007 0.095 0.012 -0.19 0.252 0.936 0.1765 0.1076 551-1
225% 551 4.8 Max 5.007 0.095 0.012 -0.19 0.252 0.936 0.1765 0.1076 551-2
225% 551 9.6 Max 5.007 0.095 0.012 -0.19 0.196 0.478 0.167 0.118 551-2
225% 551 9.6 Max 5.007 0.095 0.012 -0.19 0.196 0.478 0.167 0.118 551-3
225% 551 14.4 Max 5.007 0.095 0.012 -0.19 0.14 0.02 0.1576 0.1285 551-3
225% 551 14.4 Max 5.007 0.095 0.012 -0.19 0.14 0.02 0.1576 0.1285 551-4
225% 551 19.2 Max 5.007 0.095 0.012 -0.19 0.083 -0.438 0.1561 0.131 551-4
225% 551 19.2 Max 5.007 0.095 0.012 -0.19 0.083 -0.438 0.1561 0.131 551-5
225% 551 24 Max 5.007 0.095 0.012 -0.19 0.027 -0.895 0.155 0.1332 551-5
225% 551 0 Min 5.007 0.095 0.012 -0.19 0.308 1.393 0.1859 0.0971 551-1
225% 551 4.8 Min 5.007 0.095 0.012 -0.19 0.252 0.936 0.1765 0.1076 551-1
225% 551 4.8 Min 5.007 0.095 0.012 -0.19 0.252 0.936 0.1765 0.1076 551-2
225% 551 9.6 Min 5.007 0.095 0.012 -0.19 0.196 0.478 0.167 0.118 551-2
225% 551 9.6 Min 5.007 0.095 0.012 -0.19 0.196 0.478 0.167 0.118 551-3
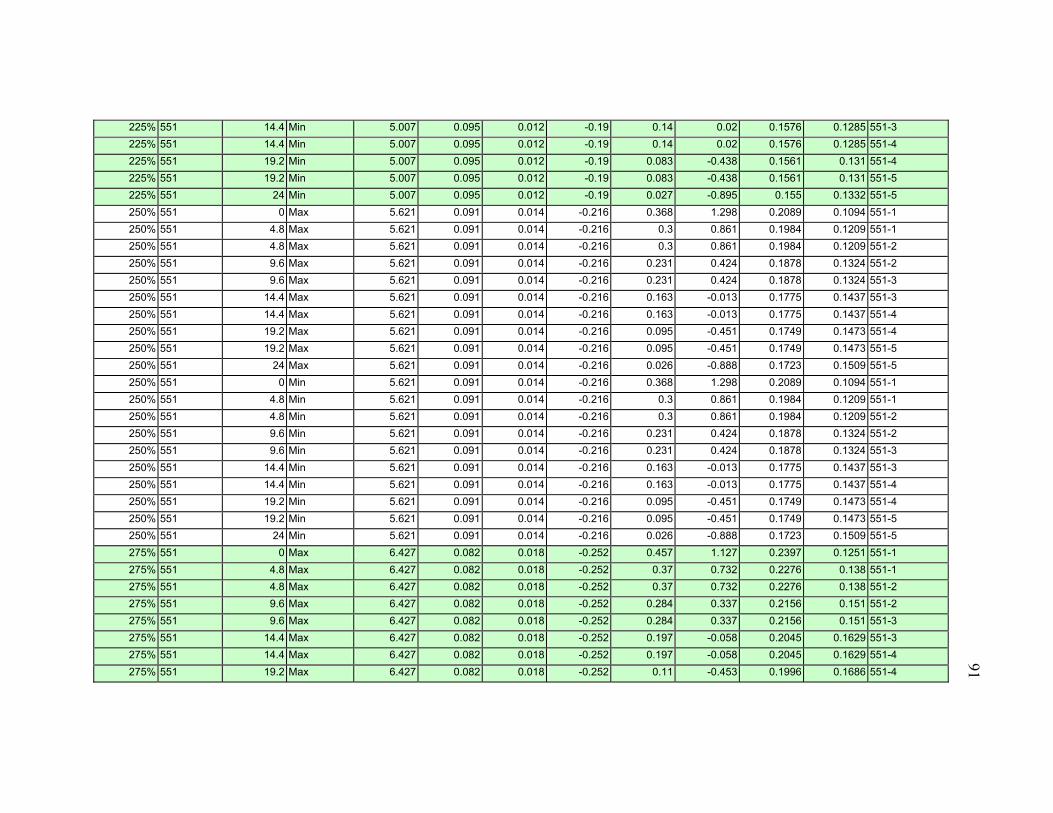
91
225% 551 14.4 Min 5.007 0.095 0.012 -0.19 0.14 0.02 0.1576 0.1285 551-3
225% 551 14.4 Min 5.007 0.095 0.012 -0.19 0.14 0.02 0.1576 0.1285 551-4
225% 551 19.2 Min 5.007 0.095 0.012 -0.19 0.083 -0.438 0.1561 0.131 551-4
225% 551 19.2 Min 5.007 0.095 0.012 -0.19 0.083 -0.438 0.1561 0.131 551-5
225% 551 24 Min 5.007 0.095 0.012 -0.19 0.027 -0.895 0.155 0.1332 551-5
250% 551 0 Max 5.621 0.091 0.014 -0.216 0.368 1.298 0.2089 0.1094 551-1
250% 551 4.8 Max 5.621 0.091 0.014 -0.216 0.3 0.861 0.1984 0.1209 551-1
250% 551 4.8 Max 5.621 0.091 0.014 -0.216 0.3 0.861 0.1984 0.1209 551-2
250% 551 9.6 Max 5.621 0.091 0.014 -0.216 0.231 0.424 0.1878 0.1324 551-2
250% 551 9.6 Max 5.621 0.091 0.014 -0.216 0.231 0.424 0.1878 0.1324 551-3
250% 551 14.4 Max 5.621 0.091 0.014 -0.216 0.163 -0.013 0.1775 0.1437 551-3
250% 551 14.4 Max 5.621 0.091 0.014 -0.216 0.163 -0.013 0.1775 0.1437 551-4
250% 551 19.2 Max 5.621 0.091 0.014 -0.216 0.095 -0.451 0.1749 0.1473 551-4
250% 551 19.2 Max 5.621 0.091 0.014 -0.216 0.095 -0.451 0.1749 0.1473 551-5
250% 551 24 Max 5.621 0.091 0.014 -0.216 0.026 -0.888 0.1723 0.1509 551-5
250% 551 0 Min 5.621 0.091 0.014 -0.216 0.368 1.298 0.2089 0.1094 551-1
250% 551 4.8 Min 5.621 0.091 0.014 -0.216 0.3 0.861 0.1984 0.1209 551-1
250% 551 4.8 Min 5.621 0.091 0.014 -0.216 0.3 0.861 0.1984 0.1209 551-2
250% 551 9.6 Min 5.621 0.091 0.014 -0.216 0.231 0.424 0.1878 0.1324 551-2
250% 551 9.6 Min 5.621 0.091 0.014 -0.216 0.231 0.424 0.1878 0.1324 551-3
250% 551 14.4 Min 5.621 0.091 0.014 -0.216 0.163 -0.013 0.1775 0.1437 551-3
250% 551 14.4 Min 5.621 0.091 0.014 -0.216 0.163 -0.013 0.1775 0.1437 551-4
250% 551 19.2 Min 5.621 0.091 0.014 -0.216 0.095 -0.451 0.1749 0.1473 551-4
250% 551 19.2 Min 5.621 0.091 0.014 -0.216 0.095 -0.451 0.1749 0.1473 551-5
250% 551 24 Min 5.621 0.091 0.014 -0.216 0.026 -0.888 0.1723 0.1509 551-5
275% 551 0 Max 6.427 0.082 0.018 -0.252 0.457 1.127 0.2397 0.1251 551-1
275% 551 4.8 Max 6.427 0.082 0.018 -0.252 0.37 0.732 0.2276 0.138 551-1
275% 551 4.8 Max 6.427 0.082 0.018 -0.252 0.37 0.732 0.2276 0.138 551-2
275% 551 9.6 Max 6.427 0.082 0.018 -0.252 0.284 0.337 0.2156 0.151 551-2
275% 551 9.6 Max 6.427 0.082 0.018 -0.252 0.284 0.337 0.2156 0.151 551-3
275% 551 14.4 Max 6.427 0.082 0.018 -0.252 0.197 -0.058 0.2045 0.1629 551-3
275% 551 14.4 Max 6.427 0.082 0.018 -0.252 0.197 -0.058 0.2045 0.1629 551-4
275% 551 19.2 Max 6.427 0.082 0.018 -0.252 0.11 -0.453 0.1996 0.1686 551-4

92
275% 551 19.2 Max 6.427 0.082 0.018 -0.252 0.11 -0.453 0.1996 0.1686 551-5
275% 551 24 Max 6.427 0.082 0.018 -0.252 0.024 -0.848 0.1947 0.1744 551-5
275% 551 0 Min 6.427 0.082 0.018 -0.252 0.457 1.127 0.2397 0.1251 551-1
275% 551 4.8 Min 6.427 0.082 0.018 -0.252 0.37 0.732 0.2276 0.138 551-1
275% 551 4.8 Min 6.427 0.082 0.018 -0.252 0.37 0.732 0.2276 0.138 551-2
275% 551 9.6 Min 6.427 0.082 0.018 -0.252 0.284 0.337 0.2156 0.151 551-2
275% 551 9.6 Min 6.427 0.082 0.018 -0.252 0.284 0.337 0.2156 0.151 551-3
275% 551 14.4 Min 6.427 0.082 0.018 -0.252 0.197 -0.058 0.2045 0.1629 551-3
275% 551 14.4 Min 6.427 0.082 0.018 -0.252 0.197 -0.058 0.2045 0.1629 551-4
275% 551 19.2 Min 6.427 0.082 0.018 -0.252 0.11 -0.453 0.1996 0.1686 551-4
275% 551 19.2 Min 6.427 0.082 0.018 -0.252 0.11 -0.453 0.1996 0.1686 551-5
275% 551 24 Min 6.427 0.082 0.018 -0.252 0.024 -0.848 0.1947 0.1744 551-5
300% 551 0 Max 7.319 0.074 0.022 -0.291 0.555 0.974 0.274 0.142 551-1
300% 551 4.8 Max 7.319 0.074 0.022 -0.291 0.448 0.616 0.2602 0.1566 551-1
300% 551 4.8 Max 7.319 0.074 0.022 -0.291 0.448 0.616 0.2602 0.1566 551-2
300% 551 9.6 Max 7.319 0.074 0.022 -0.291 0.342 0.259 0.2464 0.1713 551-2
300% 551 9.6 Max 7.319 0.074 0.022 -0.291 0.342 0.259 0.2464 0.1713 551-3
300% 551 14.4 Max 7.319 0.074 0.022 -0.291 0.235 -0.099 0.2343 0.1841 551-3
300% 551 14.4 Max 7.319 0.074 0.022 -0.291 0.235 -0.099 0.2343 0.1841 551-4
300% 551 19.2 Max 7.319 0.074 0.022 -0.291 0.128 -0.457 0.227 0.1922 551-4
300% 551 19.2 Max 7.319 0.074 0.022 -0.291 0.128 -0.457 0.227 0.1922 551-5
300% 551 24 Max 7.319 0.074 0.022 -0.291 0.022 -0.814 0.2196 0.2004 551-5
300% 551 0 Min 7.319 0.074 0.022 -0.291 0.555 0.974 0.274 0.142 551-1
300% 551 4.8 Min 7.319 0.074 0.022 -0.291 0.448 0.616 0.2602 0.1566 551-1
300% 551 4.8 Min 7.319 0.074 0.022 -0.291 0.448 0.616 0.2602 0.1566 551-2
300% 551 9.6 Min 7.319 0.074 0.022 -0.291 0.342 0.259 0.2464 0.1713 551-2
300% 551 9.6 Min 7.319 0.074 0.022 -0.291 0.342 0.259 0.2464 0.1713 551-3
300% 551 14.4 Min 7.319 0.074 0.022 -0.291 0.235 -0.099 0.2343 0.1841 551-3
300% 551 14.4 Min 7.319 0.074 0.022 -0.291 0.235 -0.099 0.2343 0.1841 551-4
300% 551 19.2 Min 7.319 0.074 0.022 -0.291 0.128 -0.457 0.227 0.1922 551-4
300% 551 19.2 Min 7.319 0.074 0.022 -0.291 0.128 -0.457 0.227 0.1922 551-5
300% 551 24 Min 7.319 0.074 0.022 -0.291 0.022 -0.814 0.2196 0.2004 551-5
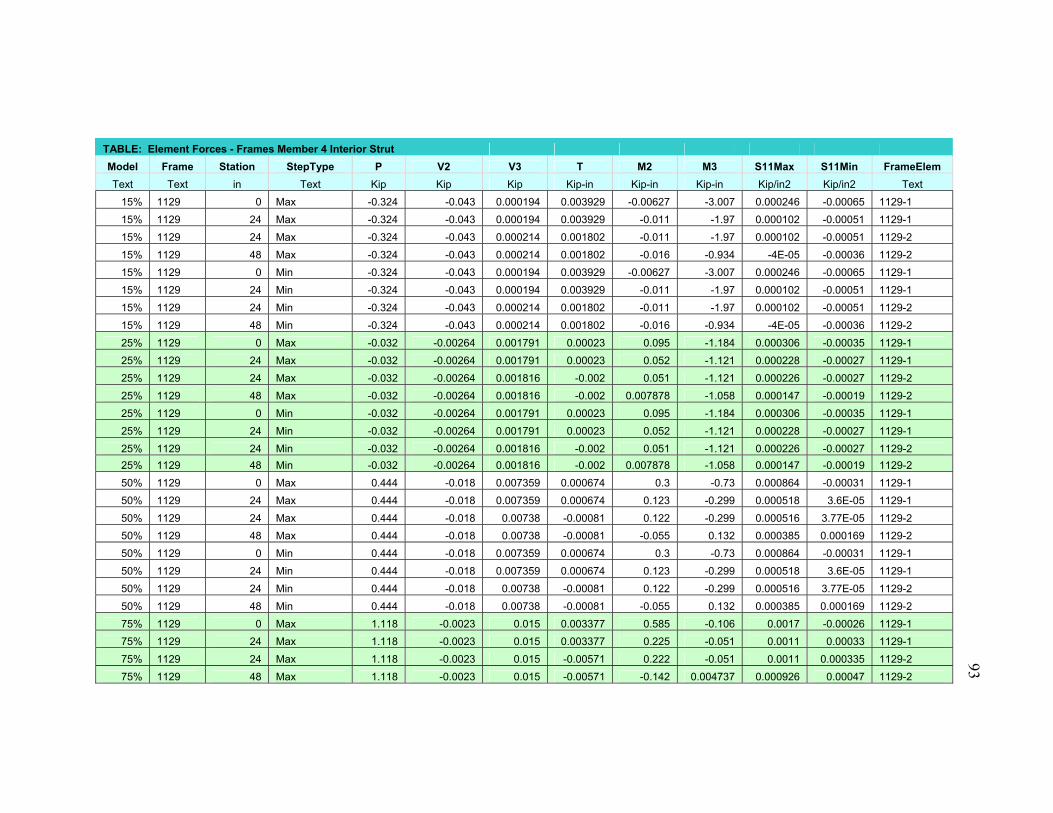
93
TABLE: Element Forces - Frames Member 4 Interior Strut
Model Frame Station StepType P V2 V3 T M2 M3 S11Max S11Min FrameElem
Text Text in Text Kip Kip Kip Kip-in Kip-in Kip-in Kip/in2 Kip/in2 Text
15% 1129 0 Max -0.324 -0.043 0.000194 0.003929 -0.00627 -3.007 0.000246 -0.00065 1129-1
15% 1129 24 Max -0.324 -0.043 0.000194 0.003929 -0.011 -1.97 0.000102 -0.00051 1129-1
15% 1129 24 Max -0.324 -0.043 0.000214 0.001802 -0.011 -1.97 0.000102 -0.00051 1129-2
15% 1129 48 Max -0.324 -0.043 0.000214 0.001802 -0.016 -0.934 -4E-05 -0.00036 1129-2
15% 1129 0 Min -0.324 -0.043 0.000194 0.003929 -0.00627 -3.007 0.000246 -0.00065 1129-1
15% 1129 24 Min -0.324 -0.043 0.000194 0.003929 -0.011 -1.97 0.000102 -0.00051 1129-1
15% 1129 24 Min -0.324 -0.043 0.000214 0.001802 -0.011 -1.97 0.000102 -0.00051 1129-2
15% 1129 48 Min -0.324 -0.043 0.000214 0.001802 -0.016 -0.934 -4E-05 -0.00036 1129-2
25% 1129 0 Max -0.032 -0.00264 0.001791 0.00023 0.095 -1.184 0.000306 -0.00035 1129-1
25% 1129 24 Max -0.032 -0.00264 0.001791 0.00023 0.052 -1.121 0.000228 -0.00027 1129-1
25% 1129 24 Max -0.032 -0.00264 0.001816 -0.002 0.051 -1.121 0.000226 -0.00027 1129-2
25% 1129 48 Max -0.032 -0.00264 0.001816 -0.002 0.007878 -1.058 0.000147 -0.00019 1129-2
25% 1129 0 Min -0.032 -0.00264 0.001791 0.00023 0.095 -1.184 0.000306 -0.00035 1129-1
25% 1129 24 Min -0.032 -0.00264 0.001791 0.00023 0.052 -1.121 0.000228 -0.00027 1129-1
25% 1129 24 Min -0.032 -0.00264 0.001816 -0.002 0.051 -1.121 0.000226 -0.00027 1129-2
25% 1129 48 Min -0.032 -0.00264 0.001816 -0.002 0.007878 -1.058 0.000147 -0.00019 1129-2
50% 1129 0 Max 0.444 -0.018 0.007359 0.000674 0.3 -0.73 0.000864 -0.00031 1129-1
50% 1129 24 Max 0.444 -0.018 0.007359 0.000674 0.123 -0.299 0.000518 3.6E-05 1129-1
50% 1129 24 Max 0.444 -0.018 0.00738 -0.00081 0.122 -0.299 0.000516 3.77E-05 1129-2
50% 1129 48 Max 0.444 -0.018 0.00738 -0.00081 -0.055 0.132 0.000385 0.000169 1129-2
50% 1129 0 Min 0.444 -0.018 0.007359 0.000674 0.3 -0.73 0.000864 -0.00031 1129-1
50% 1129 24 Min 0.444 -0.018 0.007359 0.000674 0.123 -0.299 0.000518 3.6E-05 1129-1
50% 1129 24 Min 0.444 -0.018 0.00738 -0.00081 0.122 -0.299 0.000516 3.77E-05 1129-2
50% 1129 48 Min 0.444 -0.018 0.00738 -0.00081 -0.055 0.132 0.000385 0.000169 1129-2
75% 1129 0 Max 1.118 -0.0023 0.015 0.003377 0.585 -0.106 0.0017 -0.00026 1129-1
75% 1129 24 Max 1.118 -0.0023 0.015 0.003377 0.225 -0.051 0.0011 0.00033 1129-1
75% 1129 24 Max 1.118 -0.0023 0.015 -0.00571 0.222 -0.051 0.0011 0.000335 1129-2
75% 1129 48 Max 1.118 -0.0023 0.015 -0.00571 -0.142 0.004737 0.000926 0.00047 1129-2

94
75% 1129 0 Min 1.118 -0.0023 0.015 0.003377 0.585 -0.106 0.0017 -0.00026 1129-1
75% 1129 24 Min 1.118 -0.0023 0.015 0.003377 0.225 -0.051 0.0011 0.00033 1129-1
75% 1129 24 Min 1.118 -0.0023 0.015 -0.00571 0.222 -0.051 0.0011 0.000335 1129-2
75% 1129 48 Min 1.118 -0.0023 0.015 -0.00571 -0.142 0.004737 0.000926 0.00047 1129-2
100% 1129 0 Max 1.581 0.005045 0.021 0.004463 0.824 0.045 0.0023 -0.00034 1129-1
100% 1129 24 Max 1.581 0.005045 0.021 0.004463 0.313 -0.077 0.0015 0.000474 1129-1
100% 1129 24 Max 1.581 0.005045 0.021 -0.00764 0.309 -0.077 0.0015 0.00048 1129-2
100% 1129 48 Max 1.581 0.005045 0.021 -0.00764 -0.206 -0.198 0.0013 0.000628 1129-2
100% 1129 0 Min 1.581 0.005045 0.021 0.004463 0.824 0.045 0.0023 -0.00034 1129-1
100% 1129 24 Min 1.581 0.005045 0.021 0.004463 0.313 -0.077 0.0015 0.000474 1129-1
100% 1129 24 Min 1.581 0.005045 0.021 -0.00764 0.309 -0.077 0.0015 0.00048 1129-2
100% 1129 48 Min 1.581 0.005045 0.021 -0.00764 -0.206 -0.198 0.0013 0.000628 1129-2
125% 1129 0 Max 2.316 0.012 0.03 0.01 1.13 0.077 0.0033 -0.00038 1129-1
125% 1129 24 Max 2.316 0.012 0.03 0.01 0.404 -0.216 0.0021 0.000767 1129-1
125% 1129 24 Max 2.316 0.012 0.031 -0.015 0.397 -0.216 0.0021 0.000777 1129-2
125% 1129 48 Max 2.316 0.012 0.031 -0.015 -0.336 -0.509 0.0021 0.000833 1129-2
125% 1129 0 Min 2.316 0.012 0.03 0.01 1.13 0.077 0.0033 -0.00038 1129-1
125% 1129 24 Min 2.316 0.012 0.03 0.01 0.404 -0.216 0.0021 0.000767 1129-1
125% 1129 24 Min 2.316 0.012 0.031 -0.015 0.397 -0.216 0.0021 0.000777 1129-2
125% 1129 48 Min 2.316 0.012 0.031 -0.015 -0.336 -0.509 0.0021 0.000833 1129-2
150% 1129 0 Max 2.856 0.016 0.037 0.014 1.379 0.089 0.004 -0.00044 1129-1
150% 1129 24 Max 2.856 0.016 0.037 0.014 0.483 -0.286 0.0026 0.000966 1129-1
150% 1129 24 Max 2.856 0.016 0.038 -0.019 0.475 -0.286 0.0026 0.000979 1129-2
150% 1129 48 Max 2.856 0.016 0.038 -0.019 -0.43 -0.66 0.0026 0.000998 1129-2
150% 1129 0 Min 2.856 0.016 0.037 0.014 1.379 0.089 0.004 -0.00044 1129-1
150% 1129 24 Min 2.856 0.016 0.037 0.014 0.483 -0.286 0.0026 0.000966 1129-1
150% 1129 24 Min 2.856 0.016 0.038 -0.019 0.475 -0.286 0.0026 0.000979 1129-2
150% 1129 48 Min 2.856 0.016 0.038 -0.019 -0.43 -0.66 0.0026 0.000998 1129-2
175% 1129 0 Max 3.661 0.02 0.047 0.022 1.693 0.021 0.005 -0.00043 1129-1
175% 1129 24 Max 3.661 0.02 0.047 0.022 0.564 -0.459 0.0033 0.0013 1129-1
175% 1129 24 Max 3.661 0.02 0.048 -0.028 0.552 -0.459 0.0032 0.0013 1129-2
175% 1129 48 Max 3.661 0.02 0.048 -0.028 -0.592 -0.939 0.0034 0.0012 1129-2

95
175% 1129 0 Min 3.661 0.02 0.047 0.022 1.693 0.021 0.005 -0.00043 1129-1
175% 1129 24 Min 3.661 0.02 0.047 0.022 0.564 -0.459 0.0033 0.0013 1129-1
175% 1129 24 Min 3.661 0.02 0.048 -0.028 0.552 -0.459 0.0032 0.0013 1129-2
175% 1129 48 Min 3.661 0.02 0.048 -0.028 -0.592 -0.939 0.0034 0.0012 1129-2
200% 1129 0 Max 4.295 0.023 0.055 0.028 1.949 -0.016 0.0058 -0.00045 1129-1
200% 1129 24 Max 4.295 0.023 0.055 0.028 0.634 -0.576 0.0038 0.0016 1129-1
200% 1129 24 Max 4.295 0.023 0.056 -0.035 0.619 -0.576 0.0038 0.0016 1129-2
200% 1129 48 Max 4.295 0.023 0.056 -0.035 -0.713 -1.136 0.004 0.0014 1129-2
200% 1129 0 Min 4.295 0.023 0.055 0.028 1.949 -0.016 0.0058 -0.00045 1129-1
200% 1129 24 Min 4.295 0.023 0.055 0.028 0.634 -0.576 0.0038 0.0016 1129-1
200% 1129 24 Min 4.295 0.023 0.056 -0.035 0.619 -0.576 0.0038 0.0016 1129-2
200% 1129 48 Min 4.295 0.023 0.056 -0.035 -0.713 -1.136 0.004 0.0014 1129-2
225% 1129 0 Max 5.147 0.028 0.064 0.038 2.249 -0.103 0.0068 -0.00041 1129-1
225% 1129 24 Max 5.147 0.028 0.064 0.038 0.704 -0.776 0.0045 0.002 1129-1
225% 1129 24 Max 5.147 0.028 0.065 -0.045 0.684 -0.776 0.0044 0.002 1129-2
225% 1129 48 Max 5.147 0.028 0.065 -0.045 -0.884 -1.448 0.0048 0.0016 1129-2
225% 1129 0 Min 5.147 0.028 0.064 0.038 2.249 -0.103 0.0068 -0.00041 1129-1
225% 1129 24 Min 5.147 0.028 0.064 0.038 0.704 -0.776 0.0045 0.002 1129-1
225% 1129 24 Min 5.147 0.028 0.065 -0.045 0.684 -0.776 0.0044 0.002 1129-2
225% 1129 48 Min 5.147 0.028 0.065 -0.045 -0.884 -1.448 0.0048 0.0016 1129-2
250% 1129 0 Max 5.825 0.032 0.072 0.046 2.487 -0.173 0.0077 -0.00038 1129-1
250% 1129 24 Max 5.825 0.032 0.072 0.046 0.754 -0.933 0.005 0.0023 1129-1
250% 1129 24 Max 5.825 0.032 0.073 -0.053 0.731 -0.933 0.0049 0.0023 1129-2
250% 1129 48 Max 5.825 0.032 0.073 -0.053 -1.03 -1.693 0.0055 0.0017 1129-2
250% 1129 0 Min 5.825 0.032 0.072 0.046 2.487 -0.173 0.0077 -0.00038 1129-1
250% 1129 24 Min 5.825 0.032 0.072 0.046 0.754 -0.933 0.005 0.0023 1129-1
250% 1129 24 Min 5.825 0.032 0.073 -0.053 0.731 -0.933 0.0049 0.0023 1129-2
250% 1129 48 Min 5.825 0.032 0.073 -0.053 -1.03 -1.693 0.0055 0.0017 1129-2
275% 1129 0 Max 6.716 0.035 0.081 0.058 2.741 -0.353 0.0086 -0.00026 1129-1
275% 1129 24 Max 6.716 0.035 0.081 0.058 0.809 -1.198 0.0057 0.0027 1129-1
275% 1129 24 Max 6.716 0.035 0.082 -0.065 0.78 -1.198 0.0056 0.0028 1129-2
275% 1129 48 Max 6.716 0.035 0.082 -0.065 -1.187 -2.043 0.0064 0.002 1129-2
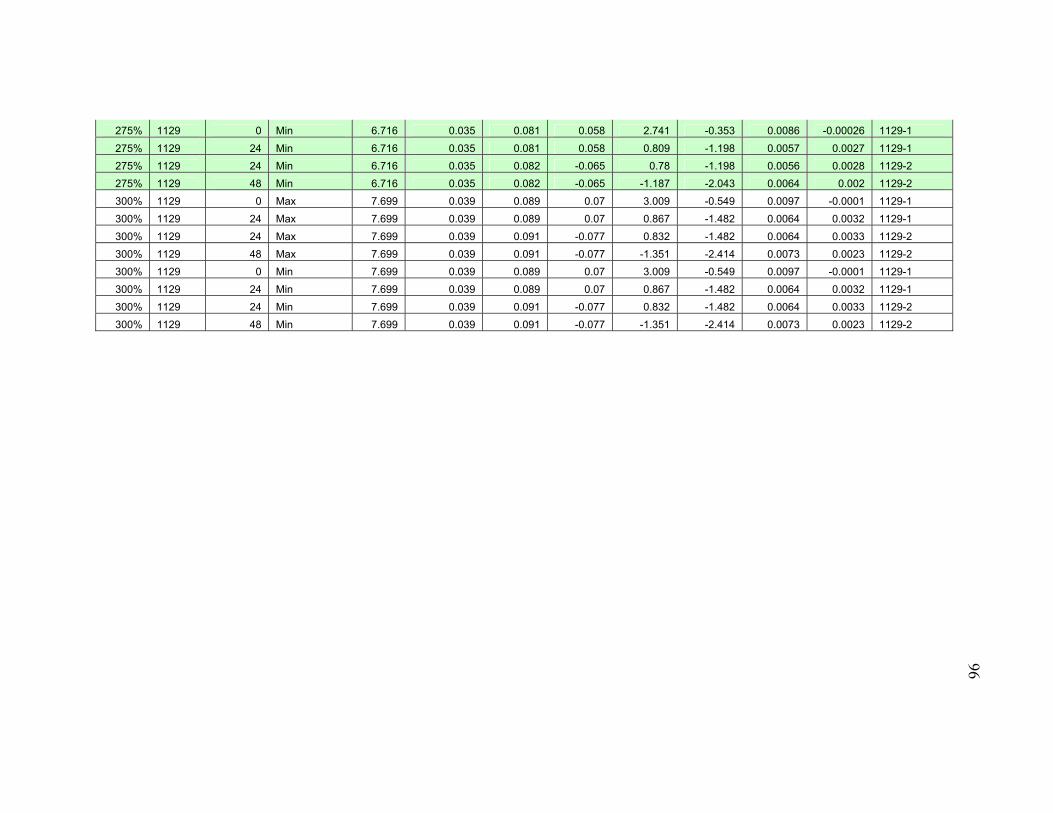
96
275% 1129 0 Min 6.716 0.035 0.081 0.058 2.741 -0.353 0.0086 -0.00026 1129-1
275% 1129 24 Min 6.716 0.035 0.081 0.058 0.809 -1.198 0.0057 0.0027 1129-1
275% 1129 24 Min 6.716 0.035 0.082 -0.065 0.78 -1.198 0.0056 0.0028 1129-2
275% 1129 48 Min 6.716 0.035 0.082 -0.065 -1.187 -2.043 0.0064 0.002 1129-2
300% 1129 0 Max 7.699 0.039 0.089 0.07 3.009 -0.549 0.0097 -0.0001 1129-1
300% 1129 24 Max 7.699 0.039 0.089 0.07 0.867 -1.482 0.0064 0.0032 1129-1
300% 1129 24 Max 7.699 0.039 0.091 -0.077 0.832 -1.482 0.0064 0.0033 1129-2
300% 1129 48 Max 7.699 0.039 0.091 -0.077 -1.351 -2.414 0.0073 0.0023 1129-2
300% 1129 0 Min 7.699 0.039 0.089 0.07 3.009 -0.549 0.0097 -0.0001 1129-1
300% 1129 24 Min 7.699 0.039 0.089 0.07 0.867 -1.482 0.0064 0.0032 1129-1
300% 1129 24 Min 7.699 0.039 0.091 -0.077 0.832 -1.482 0.0064 0.0033 1129-2
300% 1129 48 Min 7.699 0.039 0.091 -0.077 -1.351 -2.414 0.0073 0.0023 1129-2

97
TABLE: Element Forces - Frames Member 1 Exterior Chord
Model Frame Station StepType P V2 V3 T M2 M3 S11Max S11Min FrameElem
Text Text in Text Kip Kip Kip Kip-in Kip-in Kip-in Kip/in2 Kip/in2 Text
15% 305 0 Max -0.067 0.016 0.001858 -0.00285 0.046 0.916 0.0101 -0.016 305-1
15% 305 4.8 Max -0.067 0.016 0.001858 -0.00285 0.037 0.838 0.0086 -0.0143 305-1
15% 305 4.8 Max -0.067 0.016 0.001858 -0.00285 0.037 0.838 0.0086 -0.0143 305-2
15% 305 9.6 Max -0.067 0.016 0.001858 -0.00285 0.028 0.759 0.007 -0.0126 305-2
15% 305 9.6 Max -0.067 0.016 0.001858 -0.00285 0.028 0.759 0.007 -0.0126 305-3
15% 305 14.4 Max -0.067 0.016 0.001858 -0.00285 0.019 0.681 0.0055 -0.0108 305-3
15% 305 14.4 Max -0.067 0.016 0.001858 -0.00285 0.019 0.681 0.0055 -0.0108 305-4
15% 305 19.2 Max -0.067 0.016 0.001858 -0.00285 0.011 0.602 0.004 -0.0091 305-4
15% 305 19.2 Max -0.067 0.016 0.001858 -0.00285 0.011 0.602 0.004 -0.0091 305-5
15% 305 24 Max -0.067 0.016 0.001858 -0.00285 0.001657 0.523 0.0024 -0.0074 305-5
15% 305 0 Min -0.067 0.016 0.001858 -0.00285 0.046 0.916 0.0101 -0.016 305-1
15% 305 4.8 Min -0.067 0.016 0.001858 -0.00285 0.037 0.838 0.0086 -0.0143 305-1
15% 305 4.8 Min -0.067 0.016 0.001858 -0.00285 0.037 0.838 0.0086 -0.0143 305-2
15% 305 9.6 Min -0.067 0.016 0.001858 -0.00285 0.028 0.759 0.007 -0.0126 305-2
15% 305 9.6 Min -0.067 0.016 0.001858 -0.00285 0.028 0.759 0.007 -0.0126 305-3
15% 305 14.4 Min -0.067 0.016 0.001858 -0.00285 0.019 0.681 0.0055 -0.0108 305-3
15% 305 14.4 Min -0.067 0.016 0.001858 -0.00285 0.019 0.681 0.0055 -0.0108 305-4
15% 305 19.2 Min -0.067 0.016 0.001858 -0.00285 0.011 0.602 0.004 -0.0091 305-4
15% 305 19.2 Min -0.067 0.016 0.001858 -0.00285 0.011 0.602 0.004 -0.0091 305-5
15% 305 24 Min -0.067 0.016 0.001858 -0.00285 0.001657 0.523 0.0024 -0.0074 305-5
25% 305 0 Max -0.152 0.007378 -0.00119 0.024 -0.044 0.349 0.003 -0.0125 305-1
25% 305 4.8 Max -0.152 0.007378 -0.00119 0.024 -0.039 0.314 0.0021 -0.0115 305-1
25% 305 4.8 Max -0.152 0.007378 -0.00119 0.024 -0.039 0.314 0.0021 -0.0115 305-2
25% 305 9.6 Max -0.152 0.007378 -0.00119 0.024 -0.033 0.278 0.0013 -0.0106 305-2
25% 305 9.6 Max -0.152 0.007378 -0.00119 0.024 -0.033 0.278 0.0013 -0.0106 305-3
25% 305 14.4 Max -0.152 0.007378 -0.00119 0.024 -0.027 0.243 0.000383 -0.0096 305-3
25% 305 14.4 Max -0.152 0.007378 -0.00119 0.024 -0.027 0.243 0.000383 -0.0096 305-4
25% 305 19.2 Max -0.152 0.007378 -0.00119 0.024 -0.022 0.208 -0.00049 -0.0087 305-4
25% 305 19.2 Max -0.152 0.007378 -0.00119 0.024 -0.022 0.208 -0.00049 -0.0087 305-5

98
25% 305 24 Max -0.152 0.007378 -0.00119 0.024 -0.016 0.172 -0.0014 -0.0077 305-5
25% 305 0 Min -0.152 0.007378 -0.00119 0.024 -0.044 0.349 0.003 -0.0125 305-1
25% 305 4.8 Min -0.152 0.007378 -0.00119 0.024 -0.039 0.314 0.0021 -0.0115 305-1
25% 305 4.8 Min -0.152 0.007378 -0.00119 0.024 -0.039 0.314 0.0021 -0.0115 305-2
25% 305 9.6 Min -0.152 0.007378 -0.00119 0.024 -0.033 0.278 0.0013 -0.0106 305-2
25% 305 9.6 Min -0.152 0.007378 -0.00119 0.024 -0.033 0.278 0.0013 -0.0106 305-3
25% 305 14.4 Min -0.152 0.007378 -0.00119 0.024 -0.027 0.243 0.000383 -0.0096 305-3
25% 305 14.4 Min -0.152 0.007378 -0.00119 0.024 -0.027 0.243 0.000383 -0.0096 305-4
25% 305 19.2 Min -0.152 0.007378 -0.00119 0.024 -0.022 0.208 -0.00049 -0.0087 305-4
25% 305 19.2 Min -0.152 0.007378 -0.00119 0.024 -0.022 0.208 -0.00049 -0.0087 305-5
25% 305 24 Min -0.152 0.007378 -0.00119 0.024 -0.016 0.172 -0.0014 -0.0077 305-5
50% 305 0 Max -0.375 0.037 -0.00204 0.008029 -0.061 0.664 0.000844 -0.0238 305-1
50% 305 4.8 Max -0.375 0.037 -0.00204 0.008029 -0.051 0.486 -0.0016 -0.0209 305-1
50% 305 4.8 Max -0.375 0.037 -0.00204 0.008029 -0.051 0.486 -0.0016 -0.0209 305-2
50% 305 9.6 Max -0.375 0.037 -0.00204 0.008029 -0.041 0.308 -0.004 -0.0181 305-2
50% 305 9.6 Max -0.375 0.037 -0.00204 0.008029 -0.041 0.308 -0.004 -0.0181 305-3
50% 305 14.4 Max -0.375 0.037 -0.00204 0.008029 -0.032 0.129 -0.0064 -0.0153 305-3
50% 305 14.4 Max -0.375 0.037 -0.00204 0.008029 -0.032 0.129 -0.0064 -0.0153 305-4
50% 305 19.2 Max -0.375 0.037 -0.00204 0.008029 -0.022 -0.049 -0.008 -0.0134 305-4
50% 305 19.2 Max -0.375 0.037 -0.00204 0.008029 -0.022 -0.049 -0.008 -0.0134 305-5
50% 305 24 Max -0.375 0.037 -0.00204 0.008029 -0.012 -0.227 -0.0072 -0.0138 305-5
50% 305 0 Min -0.375 0.037 -0.00204 0.008029 -0.061 0.664 0.000844 -0.0238 305-1
50% 305 4.8 Min -0.375 0.037 -0.00204 0.008029 -0.051 0.486 -0.0016 -0.0209 305-1
50% 305 4.8 Min -0.375 0.037 -0.00204 0.008029 -0.051 0.486 -0.0016 -0.0209 305-2
50% 305 9.6 Min -0.375 0.037 -0.00204 0.008029 -0.041 0.308 -0.004 -0.0181 305-2
50% 305 9.6 Min -0.375 0.037 -0.00204 0.008029 -0.041 0.308 -0.004 -0.0181 305-3
50% 305 14.4 Min -0.375 0.037 -0.00204 0.008029 -0.032 0.129 -0.0064 -0.0153 305-3
50% 305 14.4 Min -0.375 0.037 -0.00204 0.008029 -0.032 0.129 -0.0064 -0.0153 305-4
50% 305 19.2 Min -0.375 0.037 -0.00204 0.008029 -0.022 -0.049 -0.008 -0.0134 305-4
50% 305 19.2 Min -0.375 0.037 -0.00204 0.008029 -0.022 -0.049 -0.008 -0.0134 305-5
50% 305 24 Min -0.375 0.037 -0.00204 0.008029 -0.012 -0.227 -0.0072 -0.0138 305-5
75% 305 0 Max -0.511 0.054 -0.00582 0.009263 -0.153 1.179 0.0106 -0.0424 305-1
75% 305 4.8 Max -0.511 0.054 -0.00582 0.009263 -0.125 0.922 0.0056 -0.0369 305-1
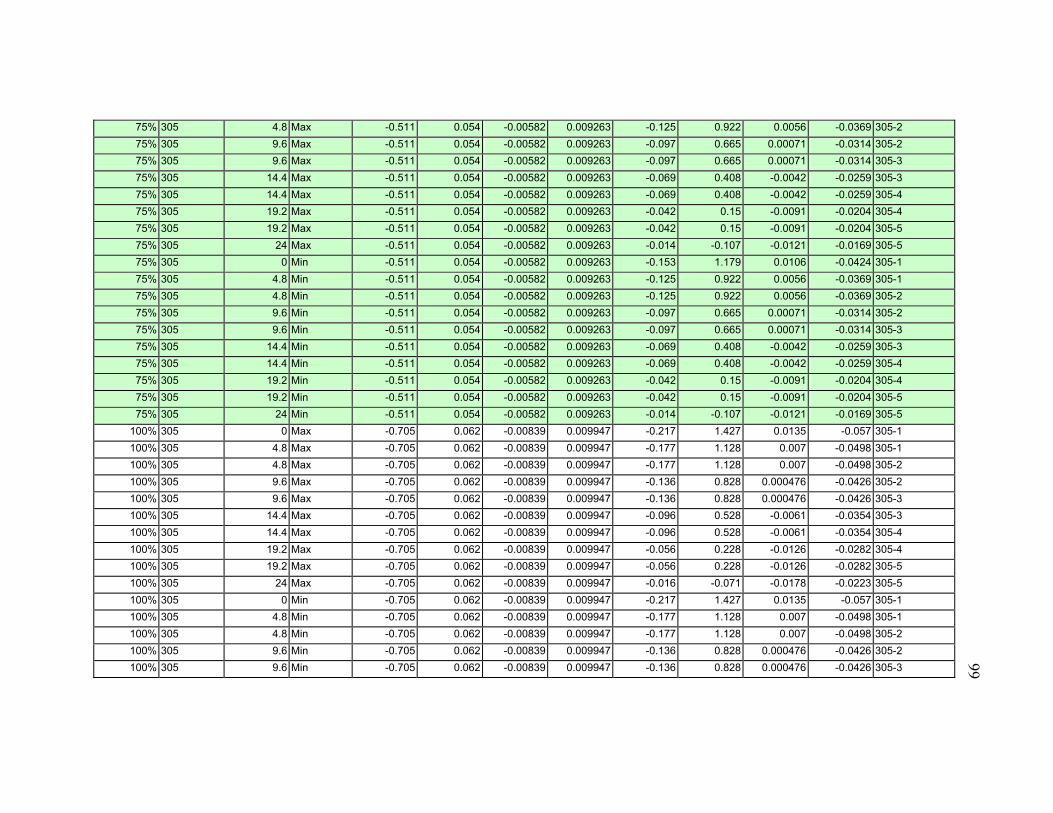
99
75% 305 4.8 Max -0.511 0.054 -0.00582 0.009263 -0.125 0.922 0.0056 -0.0369 305-2
75% 305 9.6 Max -0.511 0.054 -0.00582 0.009263 -0.097 0.665 0.00071 -0.0314 305-2
75% 305 9.6 Max -0.511 0.054 -0.00582 0.009263 -0.097 0.665 0.00071 -0.0314 305-3
75% 305 14.4 Max -0.511 0.054 -0.00582 0.009263 -0.069 0.408 -0.0042 -0.0259 305-3
75% 305 14.4 Max -0.511 0.054 -0.00582 0.009263 -0.069 0.408 -0.0042 -0.0259 305-4
75% 305 19.2 Max -0.511 0.054 -0.00582 0.009263 -0.042 0.15 -0.0091 -0.0204 305-4
75% 305 19.2 Max -0.511 0.054 -0.00582 0.009263 -0.042 0.15 -0.0091 -0.0204 305-5
75% 305 24 Max -0.511 0.054 -0.00582 0.009263 -0.014 -0.107 -0.0121 -0.0169 305-5
75% 305 0 Min -0.511 0.054 -0.00582 0.009263 -0.153 1.179 0.0106 -0.0424 305-1
75% 305 4.8 Min -0.511 0.054 -0.00582 0.009263 -0.125 0.922 0.0056 -0.0369 305-1
75% 305 4.8 Min -0.511 0.054 -0.00582 0.009263 -0.125 0.922 0.0056 -0.0369 305-2
75% 305 9.6 Min -0.511 0.054 -0.00582 0.009263 -0.097 0.665 0.00071 -0.0314 305-2
75% 305 9.6 Min -0.511 0.054 -0.00582 0.009263 -0.097 0.665 0.00071 -0.0314 305-3
75% 305 14.4 Min -0.511 0.054 -0.00582 0.009263 -0.069 0.408 -0.0042 -0.0259 305-3
75% 305 14.4 Min -0.511 0.054 -0.00582 0.009263 -0.069 0.408 -0.0042 -0.0259 305-4
75% 305 19.2 Min -0.511 0.054 -0.00582 0.009263 -0.042 0.15 -0.0091 -0.0204 305-4
75% 305 19.2 Min -0.511 0.054 -0.00582 0.009263 -0.042 0.15 -0.0091 -0.0204 305-5
75% 305 24 Min -0.511 0.054 -0.00582 0.009263 -0.014 -0.107 -0.0121 -0.0169 305-5
100% 305 0 Max -0.705 0.062 -0.00839 0.009947 -0.217 1.427 0.0135 -0.057 305-1
100% 305 4.8 Max -0.705 0.062 -0.00839 0.009947 -0.177 1.128 0.007 -0.0498 305-1
100% 305 4.8 Max -0.705 0.062 -0.00839 0.009947 -0.177 1.128 0.007 -0.0498 305-2
100% 305 9.6 Max -0.705 0.062 -0.00839 0.009947 -0.136 0.828 0.000476 -0.0426 305-2
100% 305 9.6 Max -0.705 0.062 -0.00839 0.009947 -0.136 0.828 0.000476 -0.0426 305-3
100% 305 14.4 Max -0.705 0.062 -0.00839 0.009947 -0.096 0.528 -0.0061 -0.0354 305-3
100% 305 14.4 Max -0.705 0.062 -0.00839 0.009947 -0.096 0.528 -0.0061 -0.0354 305-4
100% 305 19.2 Max -0.705 0.062 -0.00839 0.009947 -0.056 0.228 -0.0126 -0.0282 305-4
100% 305 19.2 Max -0.705 0.062 -0.00839 0.009947 -0.056 0.228 -0.0126 -0.0282 305-5
100% 305 24 Max -0.705 0.062 -0.00839 0.009947 -0.016 -0.071 -0.0178 -0.0223 305-5
100% 305 0 Min -0.705 0.062 -0.00839 0.009947 -0.217 1.427 0.0135 -0.057 305-1
100% 305 4.8 Min -0.705 0.062 -0.00839 0.009947 -0.177 1.128 0.007 -0.0498 305-1
100% 305 4.8 Min -0.705 0.062 -0.00839 0.009947 -0.177 1.128 0.007 -0.0498 305-2
100% 305 9.6 Min -0.705 0.062 -0.00839 0.009947 -0.136 0.828 0.000476 -0.0426 305-2
100% 305 9.6 Min -0.705 0.062 -0.00839 0.009947 -0.136 0.828 0.000476 -0.0426 305-3
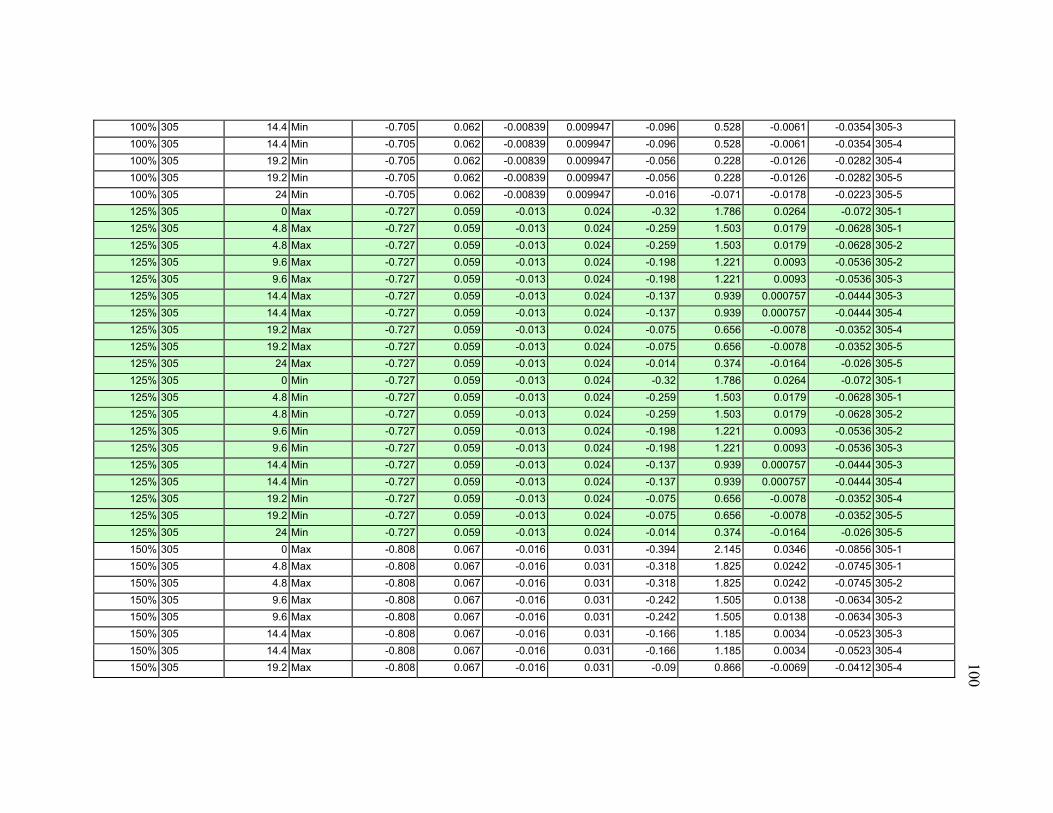
100
100% 305 14.4 Min -0.705 0.062 -0.00839 0.009947 -0.096 0.528 -0.0061 -0.0354 305-3
100% 305 14.4 Min -0.705 0.062 -0.00839 0.009947 -0.096 0.528 -0.0061 -0.0354 305-4
100% 305 19.2 Min -0.705 0.062 -0.00839 0.009947 -0.056 0.228 -0.0126 -0.0282 305-4
100% 305 19.2 Min -0.705 0.062 -0.00839 0.009947 -0.056 0.228 -0.0126 -0.0282 305-5
100% 305 24 Min -0.705 0.062 -0.00839 0.009947 -0.016 -0.071 -0.0178 -0.0223 305-5
125% 305 0 Max -0.727 0.059 -0.013 0.024 -0.32 1.786 0.0264 -0.072 305-1
125% 305 4.8 Max -0.727 0.059 -0.013 0.024 -0.259 1.503 0.0179 -0.0628 305-1
125% 305 4.8 Max -0.727 0.059 -0.013 0.024 -0.259 1.503 0.0179 -0.0628 305-2
125% 305 9.6 Max -0.727 0.059 -0.013 0.024 -0.198 1.221 0.0093 -0.0536 305-2
125% 305 9.6 Max -0.727 0.059 -0.013 0.024 -0.198 1.221 0.0093 -0.0536 305-3
125% 305 14.4 Max -0.727 0.059 -0.013 0.024 -0.137 0.939 0.000757 -0.0444 305-3
125% 305 14.4 Max -0.727 0.059 -0.013 0.024 -0.137 0.939 0.000757 -0.0444 305-4
125% 305 19.2 Max -0.727 0.059 -0.013 0.024 -0.075 0.656 -0.0078 -0.0352 305-4
125% 305 19.2 Max -0.727 0.059 -0.013 0.024 -0.075 0.656 -0.0078 -0.0352 305-5
125% 305 24 Max -0.727 0.059 -0.013 0.024 -0.014 0.374 -0.0164 -0.026 305-5
125% 305 0 Min -0.727 0.059 -0.013 0.024 -0.32 1.786 0.0264 -0.072 305-1
125% 305 4.8 Min -0.727 0.059 -0.013 0.024 -0.259 1.503 0.0179 -0.0628 305-1
125% 305 4.8 Min -0.727 0.059 -0.013 0.024 -0.259 1.503 0.0179 -0.0628 305-2
125% 305 9.6 Min -0.727 0.059 -0.013 0.024 -0.198 1.221 0.0093 -0.0536 305-2
125% 305 9.6 Min -0.727 0.059 -0.013 0.024 -0.198 1.221 0.0093 -0.0536 305-3
125% 305 14.4 Min -0.727 0.059 -0.013 0.024 -0.137 0.939 0.000757 -0.0444 305-3
125% 305 14.4 Min -0.727 0.059 -0.013 0.024 -0.137 0.939 0.000757 -0.0444 305-4
125% 305 19.2 Min -0.727 0.059 -0.013 0.024 -0.075 0.656 -0.0078 -0.0352 305-4
125% 305 19.2 Min -0.727 0.059 -0.013 0.024 -0.075 0.656 -0.0078 -0.0352 305-5
125% 305 24 Min -0.727 0.059 -0.013 0.024 -0.014 0.374 -0.0164 -0.026 305-5
150% 305 0 Max -0.808 0.067 -0.016 0.031 -0.394 2.145 0.0346 -0.0856 305-1
150% 305 4.8 Max -0.808 0.067 -0.016 0.031 -0.318 1.825 0.0242 -0.0745 305-1
150% 305 4.8 Max -0.808 0.067 -0.016 0.031 -0.318 1.825 0.0242 -0.0745 305-2
150% 305 9.6 Max -0.808 0.067 -0.016 0.031 -0.242 1.505 0.0138 -0.0634 305-2
150% 305 9.6 Max -0.808 0.067 -0.016 0.031 -0.242 1.505 0.0138 -0.0634 305-3
150% 305 14.4 Max -0.808 0.067 -0.016 0.031 -0.166 1.185 0.0034 -0.0523 305-3
150% 305 14.4 Max -0.808 0.067 -0.016 0.031 -0.166 1.185 0.0034 -0.0523 305-4
150% 305 19.2 Max -0.808 0.067 -0.016 0.031 -0.09 0.866 -0.0069 -0.0412 305-4

101
150% 305 19.2 Max -0.808 0.067 -0.016 0.031 -0.09 0.866 -0.0069 -0.0412 305-5
150% 305 24 Max -0.808 0.067 -0.016 0.031 -0.014 0.546 -0.0173 -0.0301 305-5
150% 305 0 Min -0.808 0.067 -0.016 0.031 -0.394 2.145 0.0346 -0.0856 305-1
150% 305 4.8 Min -0.808 0.067 -0.016 0.031 -0.318 1.825 0.0242 -0.0745 305-1
150% 305 4.8 Min -0.808 0.067 -0.016 0.031 -0.318 1.825 0.0242 -0.0745 305-2
150% 305 9.6 Min -0.808 0.067 -0.016 0.031 -0.242 1.505 0.0138 -0.0634 305-2
150% 305 9.6 Min -0.808 0.067 -0.016 0.031 -0.242 1.505 0.0138 -0.0634 305-3
150% 305 14.4 Min -0.808 0.067 -0.016 0.031 -0.166 1.185 0.0034 -0.0523 305-3
150% 305 14.4 Min -0.808 0.067 -0.016 0.031 -0.166 1.185 0.0034 -0.0523 305-4
150% 305 19.2 Min -0.808 0.067 -0.016 0.031 -0.09 0.866 -0.0069 -0.0412 305-4
150% 305 19.2 Min -0.808 0.067 -0.016 0.031 -0.09 0.866 -0.0069 -0.0412 305-5
150% 305 24 Min -0.808 0.067 -0.016 0.031 -0.014 0.546 -0.0173 -0.0301 305-5
175% 305 0 Max -0.7 0.103 -0.021 0.051 -0.507 3.232 0.0579 -0.1052 305-1
175% 305 4.8 Max -0.7 0.103 -0.021 0.051 -0.408 2.74 0.0438 -0.0899 305-1
175% 305 4.8 Max -0.7 0.103 -0.021 0.051 -0.408 2.74 0.0438 -0.0899 305-2
175% 305 9.6 Max -0.7 0.103 -0.021 0.051 -0.308 2.247 0.0296 -0.0747 305-2
175% 305 9.6 Max -0.7 0.103 -0.021 0.051 -0.308 2.247 0.0296 -0.0747 305-3
175% 305 14.4 Max -0.7 0.103 -0.021 0.051 -0.209 1.755 0.0155 -0.0594 305-3
175% 305 14.4 Max -0.7 0.103 -0.021 0.051 -0.209 1.755 0.0155 -0.0594 305-4
175% 305 19.2 Max -0.7 0.103 -0.021 0.051 -0.11 1.263 0.0013 -0.0442 305-4
175% 305 19.2 Max -0.7 0.103 -0.021 0.051 -0.11 1.263 0.0013 -0.0442 305-5
175% 305 24 Max -0.7 0.103 -0.021 0.051 -0.01 0.77 -0.0128 -0.0289 305-5
175% 305 0 Min -0.7 0.103 -0.021 0.051 -0.507 3.232 0.0579 -0.1052 305-1
175% 305 4.8 Min -0.7 0.103 -0.021 0.051 -0.408 2.74 0.0438 -0.0899 305-1
175% 305 4.8 Min -0.7 0.103 -0.021 0.051 -0.408 2.74 0.0438 -0.0899 305-2
175% 305 9.6 Min -0.7 0.103 -0.021 0.051 -0.308 2.247 0.0296 -0.0747 305-2
175% 305 9.6 Min -0.7 0.103 -0.021 0.051 -0.308 2.247 0.0296 -0.0747 305-3
175% 305 14.4 Min -0.7 0.103 -0.021 0.051 -0.209 1.755 0.0155 -0.0594 305-3
175% 305 14.4 Min -0.7 0.103 -0.021 0.051 -0.209 1.755 0.0155 -0.0594 305-4
175% 305 19.2 Min -0.7 0.103 -0.021 0.051 -0.11 1.263 0.0013 -0.0442 305-4
175% 305 19.2 Min -0.7 0.103 -0.021 0.051 -0.11 1.263 0.0013 -0.0442 305-5
175% 305 24 Min -0.7 0.103 -0.021 0.051 -0.01 0.77 -0.0128 -0.0289 305-5
200% 305 0 Max -0.653 0.128 -0.024 0.064 -0.595 4 0.0745 -0.1207 305-1
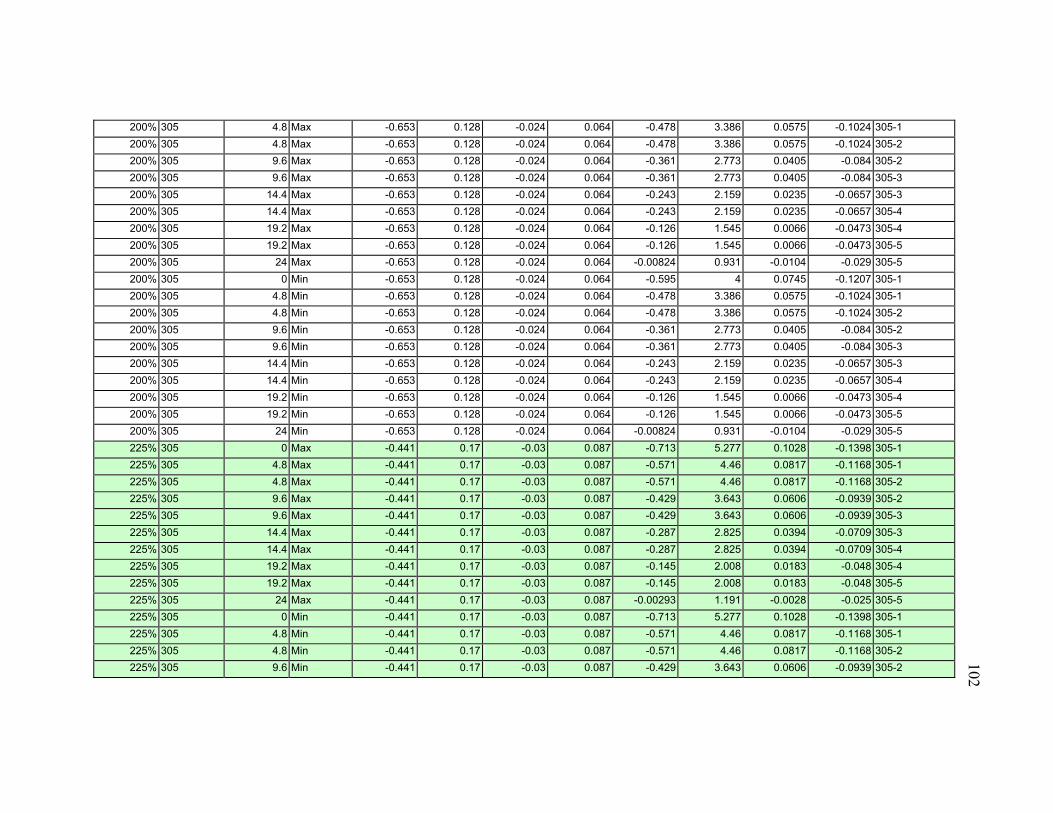
102
200% 305 4.8 Max -0.653 0.128 -0.024 0.064 -0.478 3.386 0.0575 -0.1024 305-1
200% 305 4.8 Max -0.653 0.128 -0.024 0.064 -0.478 3.386 0.0575 -0.1024 305-2
200% 305 9.6 Max -0.653 0.128 -0.024 0.064 -0.361 2.773 0.0405 -0.084 305-2
200% 305 9.6 Max -0.653 0.128 -0.024 0.064 -0.361 2.773 0.0405 -0.084 305-3
200% 305 14.4 Max -0.653 0.128 -0.024 0.064 -0.243 2.159 0.0235 -0.0657 305-3
200% 305 14.4 Max -0.653 0.128 -0.024 0.064 -0.243 2.159 0.0235 -0.0657 305-4
200% 305 19.2 Max -0.653 0.128 -0.024 0.064 -0.126 1.545 0.0066 -0.0473 305-4
200% 305 19.2 Max -0.653 0.128 -0.024 0.064 -0.126 1.545 0.0066 -0.0473 305-5
200% 305 24 Max -0.653 0.128 -0.024 0.064 -0.00824 0.931 -0.0104 -0.029 305-5
200% 305 0 Min -0.653 0.128 -0.024 0.064 -0.595 4 0.0745 -0.1207 305-1
200% 305 4.8 Min -0.653 0.128 -0.024 0.064 -0.478 3.386 0.0575 -0.1024 305-1
200% 305 4.8 Min -0.653 0.128 -0.024 0.064 -0.478 3.386 0.0575 -0.1024 305-2
200% 305 9.6 Min -0.653 0.128 -0.024 0.064 -0.361 2.773 0.0405 -0.084 305-2
200% 305 9.6 Min -0.653 0.128 -0.024 0.064 -0.361 2.773 0.0405 -0.084 305-3
200% 305 14.4 Min -0.653 0.128 -0.024 0.064 -0.243 2.159 0.0235 -0.0657 305-3
200% 305 14.4 Min -0.653 0.128 -0.024 0.064 -0.243 2.159 0.0235 -0.0657 305-4
200% 305 19.2 Min -0.653 0.128 -0.024 0.064 -0.126 1.545 0.0066 -0.0473 305-4
200% 305 19.2 Min -0.653 0.128 -0.024 0.064 -0.126 1.545 0.0066 -0.0473 305-5
200% 305 24 Min -0.653 0.128 -0.024 0.064 -0.00824 0.931 -0.0104 -0.029 305-5
225% 305 0 Max -0.441 0.17 -0.03 0.087 -0.713 5.277 0.1028 -0.1398 305-1
225% 305 4.8 Max -0.441 0.17 -0.03 0.087 -0.571 4.46 0.0817 -0.1168 305-1
225% 305 4.8 Max -0.441 0.17 -0.03 0.087 -0.571 4.46 0.0817 -0.1168 305-2
225% 305 9.6 Max -0.441 0.17 -0.03 0.087 -0.429 3.643 0.0606 -0.0939 305-2
225% 305 9.6 Max -0.441 0.17 -0.03 0.087 -0.429 3.643 0.0606 -0.0939 305-3
225% 305 14.4 Max -0.441 0.17 -0.03 0.087 -0.287 2.825 0.0394 -0.0709 305-3
225% 305 14.4 Max -0.441 0.17 -0.03 0.087 -0.287 2.825 0.0394 -0.0709 305-4
225% 305 19.2 Max -0.441 0.17 -0.03 0.087 -0.145 2.008 0.0183 -0.048 305-4
225% 305 19.2 Max -0.441 0.17 -0.03 0.087 -0.145 2.008 0.0183 -0.048 305-5
225% 305 24 Max -0.441 0.17 -0.03 0.087 -0.00293 1.191 -0.0028 -0.025 305-5
225% 305 0 Min -0.441 0.17 -0.03 0.087 -0.713 5.277 0.1028 -0.1398 305-1
225% 305 4.8 Min -0.441 0.17 -0.03 0.087 -0.571 4.46 0.0817 -0.1168 305-1
225% 305 4.8 Min -0.441 0.17 -0.03 0.087 -0.571 4.46 0.0817 -0.1168 305-2
225% 305 9.6 Min -0.441 0.17 -0.03 0.087 -0.429 3.643 0.0606 -0.0939 305-2

103
225% 305 9.6 Min -0.441 0.17 -0.03 0.087 -0.429 3.643 0.0606 -0.0939 305-3
225% 305 14.4 Min -0.441 0.17 -0.03 0.087 -0.287 2.825 0.0394 -0.0709 305-3
225% 305 14.4 Min -0.441 0.17 -0.03 0.087 -0.287 2.825 0.0394 -0.0709 305-4
225% 305 19.2 Min -0.441 0.17 -0.03 0.087 -0.145 2.008 0.0183 -0.048 305-4
225% 305 19.2 Min -0.441 0.17 -0.03 0.087 -0.145 2.008 0.0183 -0.048 305-5
225% 305 24 Min -0.441 0.17 -0.03 0.087 -0.00293 1.191 -0.0028 -0.025 305-5
250% 305 0 Max -0.292 0.203 -0.034 0.105 -0.806 6.279 0.1246 -0.1553 305-1
250% 305 4.8 Max -0.292 0.203 -0.034 0.105 -0.645 5.303 0.1002 -0.1287 305-1
250% 305 4.8 Max -0.292 0.203 -0.034 0.105 -0.645 5.303 0.1002 -0.1287 305-2
250% 305 9.6 Max -0.292 0.203 -0.034 0.105 -0.483 4.326 0.0758 -0.1022 305-2
250% 305 9.6 Max -0.292 0.203 -0.034 0.105 -0.483 4.326 0.0758 -0.1022 305-3
250% 305 14.4 Max -0.292 0.203 -0.034 0.105 -0.322 3.349 0.0514 -0.0756 305-3
250% 305 14.4 Max -0.292 0.203 -0.034 0.105 -0.322 3.349 0.0514 -0.0756 305-4
250% 305 19.2 Max -0.292 0.203 -0.034 0.105 -0.16 2.373 0.027 -0.049 305-4
250% 305 19.2 Max -0.292 0.203 -0.034 0.105 -0.16 2.373 0.027 -0.049 305-5
250% 305 24 Max -0.292 0.203 -0.034 0.105 0.001049 1.396 0.0028 -0.0227 305-5
250% 305 0 Min -0.292 0.203 -0.034 0.105 -0.806 6.279 0.1246 -0.1553 305-1
250% 305 4.8 Min -0.292 0.203 -0.034 0.105 -0.645 5.303 0.1002 -0.1287 305-1
250% 305 4.8 Min -0.292 0.203 -0.034 0.105 -0.645 5.303 0.1002 -0.1287 305-2
250% 305 9.6 Min -0.292 0.203 -0.034 0.105 -0.483 4.326 0.0758 -0.1022 305-2
250% 305 9.6 Min -0.292 0.203 -0.034 0.105 -0.483 4.326 0.0758 -0.1022 305-3
250% 305 14.4 Min -0.292 0.203 -0.034 0.105 -0.322 3.349 0.0514 -0.0756 305-3
250% 305 14.4 Min -0.292 0.203 -0.034 0.105 -0.322 3.349 0.0514 -0.0756 305-4
250% 305 19.2 Min -0.292 0.203 -0.034 0.105 -0.16 2.373 0.027 -0.049 305-4
250% 305 19.2 Min -0.292 0.203 -0.034 0.105 -0.16 2.373 0.027 -0.049 305-5
250% 305 24 Min -0.292 0.203 -0.034 0.105 0.001049 1.396 0.0028 -0.0227 305-5
275% 305 0 Max -0.00961 0.251 -0.039 0.132 -0.921 7.704 0.1558 -0.1736 305-1
275% 305 4.8 Max -0.00961 0.251 -0.039 0.132 -0.736 6.499 0.1272 -0.1423 305-1
275% 305 4.8 Max -0.00961 0.251 -0.039 0.132 -0.736 6.499 0.1272 -0.1423 305-2
275% 305 9.6 Max -0.00961 0.251 -0.039 0.132 -0.551 5.294 0.0985 -0.1109 305-2
275% 305 9.6 Max -0.00961 0.251 -0.039 0.132 -0.551 5.294 0.0985 -0.1109 305-3
275% 305 14.4 Max -0.00961 0.251 -0.039 0.132 -0.365 4.089 0.0698 -0.0795 305-3
275% 305 14.4 Max -0.00961 0.251 -0.039 0.132 -0.365 4.089 0.0698 -0.0795 305-4
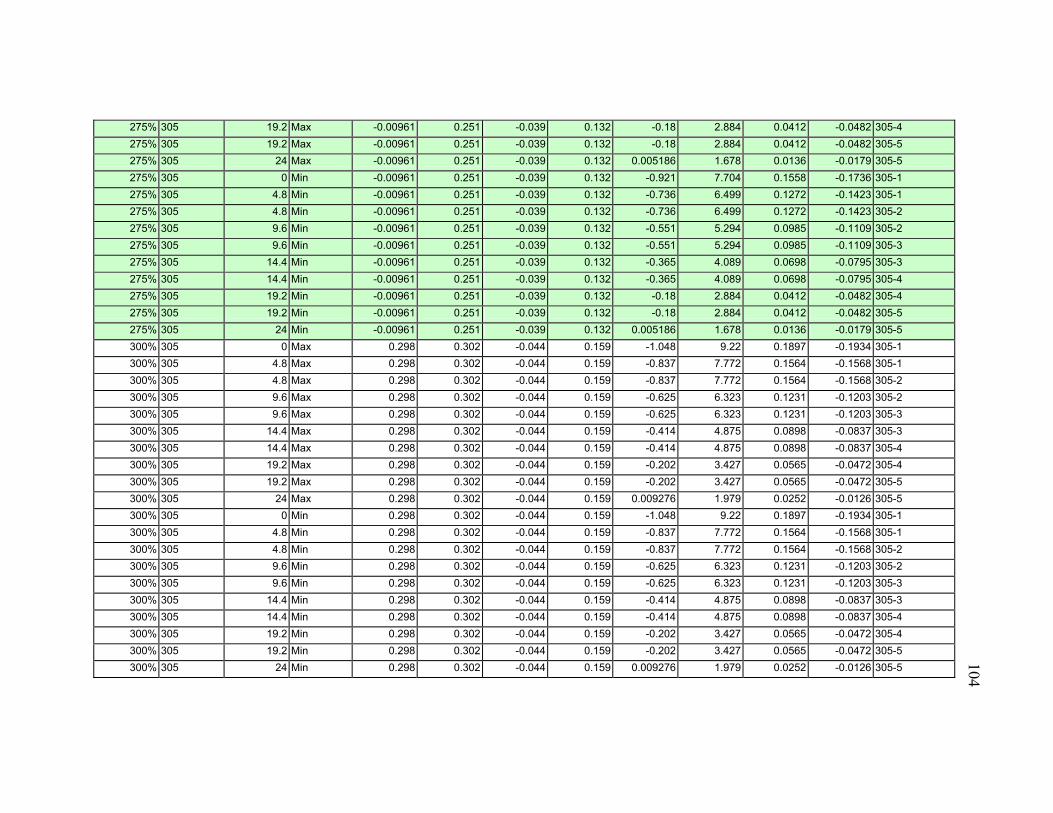
104
275% 305 19.2 Max -0.00961 0.251 -0.039 0.132 -0.18 2.884 0.0412 -0.0482 305-4
275% 305 19.2 Max -0.00961 0.251 -0.039 0.132 -0.18 2.884 0.0412 -0.0482 305-5
275% 305 24 Max -0.00961 0.251 -0.039 0.132 0.005186 1.678 0.0136 -0.0179 305-5
275% 305 0 Min -0.00961 0.251 -0.039 0.132 -0.921 7.704 0.1558 -0.1736 305-1
275% 305 4.8 Min -0.00961 0.251 -0.039 0.132 -0.736 6.499 0.1272 -0.1423 305-1
275% 305 4.8 Min -0.00961 0.251 -0.039 0.132 -0.736 6.499 0.1272 -0.1423 305-2
275% 305 9.6 Min -0.00961 0.251 -0.039 0.132 -0.551 5.294 0.0985 -0.1109 305-2
275% 305 9.6 Min -0.00961 0.251 -0.039 0.132 -0.551 5.294 0.0985 -0.1109 305-3
275% 305 14.4 Min -0.00961 0.251 -0.039 0.132 -0.365 4.089 0.0698 -0.0795 305-3
275% 305 14.4 Min -0.00961 0.251 -0.039 0.132 -0.365 4.089 0.0698 -0.0795 305-4
275% 305 19.2 Min -0.00961 0.251 -0.039 0.132 -0.18 2.884 0.0412 -0.0482 305-4
275% 305 19.2 Min -0.00961 0.251 -0.039 0.132 -0.18 2.884 0.0412 -0.0482 305-5
275% 305 24 Min -0.00961 0.251 -0.039 0.132 0.005186 1.678 0.0136 -0.0179 305-5
300% 305 0 Max 0.298 0.302 -0.044 0.159 -1.048 9.22 0.1897 -0.1934 305-1
300% 305 4.8 Max 0.298 0.302 -0.044 0.159 -0.837 7.772 0.1564 -0.1568 305-1
300% 305 4.8 Max 0.298 0.302 -0.044 0.159 -0.837 7.772 0.1564 -0.1568 305-2
300% 305 9.6 Max 0.298 0.302 -0.044 0.159 -0.625 6.323 0.1231 -0.1203 305-2
300% 305 9.6 Max 0.298 0.302 -0.044 0.159 -0.625 6.323 0.1231 -0.1203 305-3
300% 305 14.4 Max 0.298 0.302 -0.044 0.159 -0.414 4.875 0.0898 -0.0837 305-3
300% 305 14.4 Max 0.298 0.302 -0.044 0.159 -0.414 4.875 0.0898 -0.0837 305-4
300% 305 19.2 Max 0.298 0.302 -0.044 0.159 -0.202 3.427 0.0565 -0.0472 305-4
300% 305 19.2 Max 0.298 0.302 -0.044 0.159 -0.202 3.427 0.0565 -0.0472 305-5
300% 305 24 Max 0.298 0.302 -0.044 0.159 0.009276 1.979 0.0252 -0.0126 305-5
300% 305 0 Min 0.298 0.302 -0.044 0.159 -1.048 9.22 0.1897 -0.1934 305-1
300% 305 4.8 Min 0.298 0.302 -0.044 0.159 -0.837 7.772 0.1564 -0.1568 305-1
300% 305 4.8 Min 0.298 0.302 -0.044 0.159 -0.837 7.772 0.1564 -0.1568 305-2
300% 305 9.6 Min 0.298 0.302 -0.044 0.159 -0.625 6.323 0.1231 -0.1203 305-2
300% 305 9.6 Min 0.298 0.302 -0.044 0.159 -0.625 6.323 0.1231 -0.1203 305-3
300% 305 14.4 Min 0.298 0.302 -0.044 0.159 -0.414 4.875 0.0898 -0.0837 305-3
300% 305 14.4 Min 0.298 0.302 -0.044 0.159 -0.414 4.875 0.0898 -0.0837 305-4
300% 305 19.2 Min 0.298 0.302 -0.044 0.159 -0.202 3.427 0.0565 -0.0472 305-4
300% 305 19.2 Min 0.298 0.302 -0.044 0.159 -0.202 3.427 0.0565 -0.0472 305-5
300% 305 24 Min 0.298 0.302 -0.044 0.159 0.009276 1.979 0.0252 -0.0126 305-5
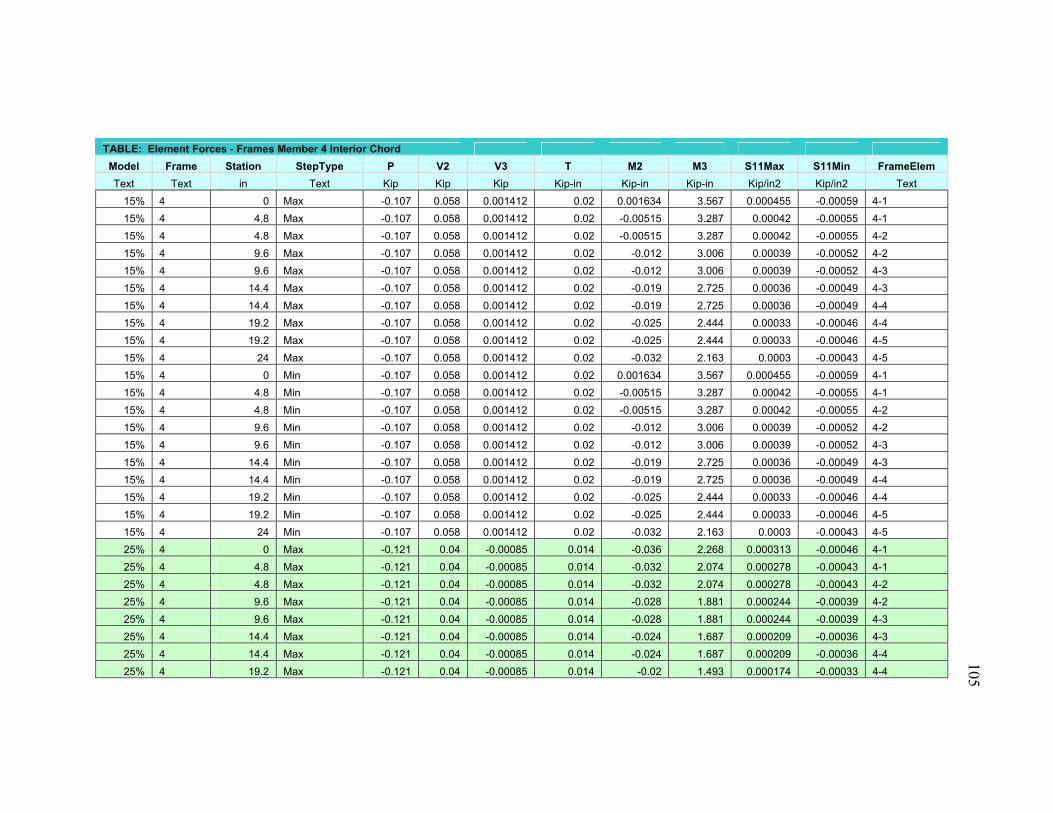
105
TABLE: Element Forces - Frames Member 4 Interior Chord
Model Frame Station StepType P V2 V3 T M2 M3 S11Max S11Min FrameElem
Text Text in Text Kip Kip Kip Kip-in Kip-in Kip-in Kip/in2 Kip/in2 Text
15% 4 0 Max -0.107 0.058 0.001412 0.02 0.001634 3.567 0.000455 -0.00059 4-1
15% 4 4.8 Max -0.107 0.058 0.001412 0.02 -0.00515 3.287 0.00042 -0.00055 4-1
15% 4 4.8 Max -0.107 0.058 0.001412 0.02 -0.00515 3.287 0.00042 -0.00055 4-2
15% 4 9.6 Max -0.107 0.058 0.001412 0.02 -0.012 3.006 0.00039 -0.00052 4-2
15% 4 9.6 Max -0.107 0.058 0.001412 0.02 -0.012 3.006 0.00039 -0.00052 4-3
15% 4 14.4 Max -0.107 0.058 0.001412 0.02 -0.019 2.725 0.00036 -0.00049 4-3
15% 4 14.4 Max -0.107 0.058 0.001412 0.02 -0.019 2.725 0.00036 -0.00049 4-4
15% 4 19.2 Max -0.107 0.058 0.001412 0.02 -0.025 2.444 0.00033 -0.00046 4-4
15% 4 19.2 Max -0.107 0.058 0.001412 0.02 -0.025 2.444 0.00033 -0.00046 4-5
15% 4 24 Max -0.107 0.058 0.001412 0.02 -0.032 2.163 0.0003 -0.00043 4-5
15% 4 0 Min -0.107 0.058 0.001412 0.02 0.001634 3.567 0.000455 -0.00059 4-1
15% 4 4.8 Min -0.107 0.058 0.001412 0.02 -0.00515 3.287 0.00042 -0.00055 4-1
15% 4 4.8 Min -0.107 0.058 0.001412 0.02 -0.00515 3.287 0.00042 -0.00055 4-2
15% 4 9.6 Min -0.107 0.058 0.001412 0.02 -0.012 3.006 0.00039 -0.00052 4-2
15% 4 9.6 Min -0.107 0.058 0.001412 0.02 -0.012 3.006 0.00039 -0.00052 4-3
15% 4 14.4 Min -0.107 0.058 0.001412 0.02 -0.019 2.725 0.00036 -0.00049 4-3
15% 4 14.4 Min -0.107 0.058 0.001412 0.02 -0.019 2.725 0.00036 -0.00049 4-4
15% 4 19.2 Min -0.107 0.058 0.001412 0.02 -0.025 2.444 0.00033 -0.00046 4-4
15% 4 19.2 Min -0.107 0.058 0.001412 0.02 -0.025 2.444 0.00033 -0.00046 4-5
15% 4 24 Min -0.107 0.058 0.001412 0.02 -0.032 2.163 0.0003 -0.00043 4-5
25% 4 0 Max -0.121 0.04 -0.00085 0.014 -0.036 2.268 0.000313 -0.00046 4-1
25% 4 4.8 Max -0.121 0.04 -0.00085 0.014 -0.032 2.074 0.000278 -0.00043 4-1
25% 4 4.8 Max -0.121 0.04 -0.00085 0.014 -0.032 2.074 0.000278 -0.00043 4-2
25% 4 9.6 Max -0.121 0.04 -0.00085 0.014 -0.028 1.881 0.000244 -0.00039 4-2
25% 4 9.6 Max -0.121 0.04 -0.00085 0.014 -0.028 1.881 0.000244 -0.00039 4-3
25% 4 14.4 Max -0.121 0.04 -0.00085 0.014 -0.024 1.687 0.000209 -0.00036 4-3
25% 4 14.4 Max -0.121 0.04 -0.00085 0.014 -0.024 1.687 0.000209 -0.00036 4-4
25% 4 19.2 Max -0.121 0.04 -0.00085 0.014 -0.02 1.493 0.000174 -0.00033 4-4
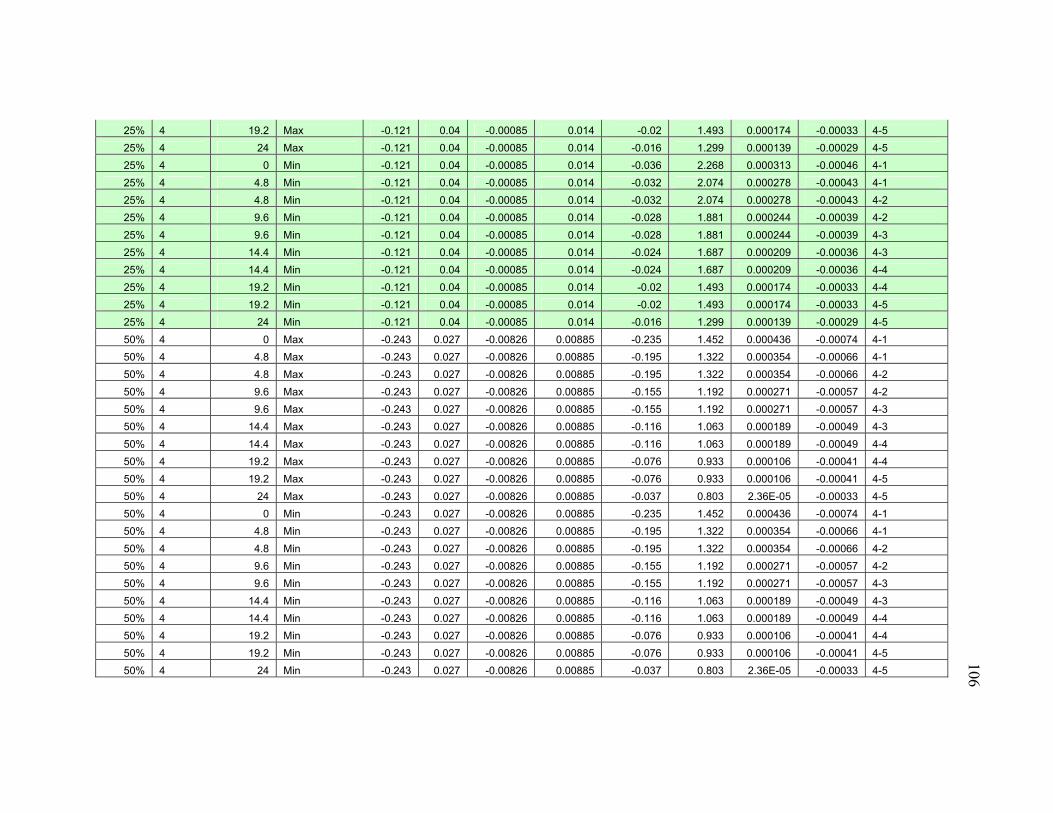
106
25% 4 19.2 Max -0.121 0.04 -0.00085 0.014 -0.02 1.493 0.000174 -0.00033 4-5
25% 4 24 Max -0.121 0.04 -0.00085 0.014 -0.016 1.299 0.000139 -0.00029 4-5
25% 4 0 Min -0.121 0.04 -0.00085 0.014 -0.036 2.268 0.000313 -0.00046 4-1
25% 4 4.8 Min -0.121 0.04 -0.00085 0.014 -0.032 2.074 0.000278 -0.00043 4-1
25% 4 4.8 Min -0.121 0.04 -0.00085 0.014 -0.032 2.074 0.000278 -0.00043 4-2
25% 4 9.6 Min -0.121 0.04 -0.00085 0.014 -0.028 1.881 0.000244 -0.00039 4-2
25% 4 9.6 Min -0.121 0.04 -0.00085 0.014 -0.028 1.881 0.000244 -0.00039 4-3
25% 4 14.4 Min -0.121 0.04 -0.00085 0.014 -0.024 1.687 0.000209 -0.00036 4-3
25% 4 14.4 Min -0.121 0.04 -0.00085 0.014 -0.024 1.687 0.000209 -0.00036 4-4
25% 4 19.2 Min -0.121 0.04 -0.00085 0.014 -0.02 1.493 0.000174 -0.00033 4-4
25% 4 19.2 Min -0.121 0.04 -0.00085 0.014 -0.02 1.493 0.000174 -0.00033 4-5
25% 4 24 Min -0.121 0.04 -0.00085 0.014 -0.016 1.299 0.000139 -0.00029 4-5
50% 4 0 Max -0.243 0.027 -0.00826 0.00885 -0.235 1.452 0.000436 -0.00074 4-1
50% 4 4.8 Max -0.243 0.027 -0.00826 0.00885 -0.195 1.322 0.000354 -0.00066 4-1
50% 4 4.8 Max -0.243 0.027 -0.00826 0.00885 -0.195 1.322 0.000354 -0.00066 4-2
50% 4 9.6 Max -0.243 0.027 -0.00826 0.00885 -0.155 1.192 0.000271 -0.00057 4-2
50% 4 9.6 Max -0.243 0.027 -0.00826 0.00885 -0.155 1.192 0.000271 -0.00057 4-3
50% 4 14.4 Max -0.243 0.027 -0.00826 0.00885 -0.116 1.063 0.000189 -0.00049 4-3
50% 4 14.4 Max -0.243 0.027 -0.00826 0.00885 -0.116 1.063 0.000189 -0.00049 4-4
50% 4 19.2 Max -0.243 0.027 -0.00826 0.00885 -0.076 0.933 0.000106 -0.00041 4-4
50% 4 19.2 Max -0.243 0.027 -0.00826 0.00885 -0.076 0.933 0.000106 -0.00041 4-5
50% 4 24 Max -0.243 0.027 -0.00826 0.00885 -0.037 0.803 2.36E-05 -0.00033 4-5
50% 4 0 Min -0.243 0.027 -0.00826 0.00885 -0.235 1.452 0.000436 -0.00074 4-1
50% 4 4.8 Min -0.243 0.027 -0.00826 0.00885 -0.195 1.322 0.000354 -0.00066 4-1
50% 4 4.8 Min -0.243 0.027 -0.00826 0.00885 -0.195 1.322 0.000354 -0.00066 4-2
50% 4 9.6 Min -0.243 0.027 -0.00826 0.00885 -0.155 1.192 0.000271 -0.00057 4-2
50% 4 9.6 Min -0.243 0.027 -0.00826 0.00885 -0.155 1.192 0.000271 -0.00057 4-3
50% 4 14.4 Min -0.243 0.027 -0.00826 0.00885 -0.116 1.063 0.000189 -0.00049 4-3
50% 4 14.4 Min -0.243 0.027 -0.00826 0.00885 -0.116 1.063 0.000189 -0.00049 4-4
50% 4 19.2 Min -0.243 0.027 -0.00826 0.00885 -0.076 0.933 0.000106 -0.00041 4-4
50% 4 19.2 Min -0.243 0.027 -0.00826 0.00885 -0.076 0.933 0.000106 -0.00041 4-5
50% 4 24 Min -0.243 0.027 -0.00826 0.00885 -0.037 0.803 2.36E-05 -0.00033 4-5
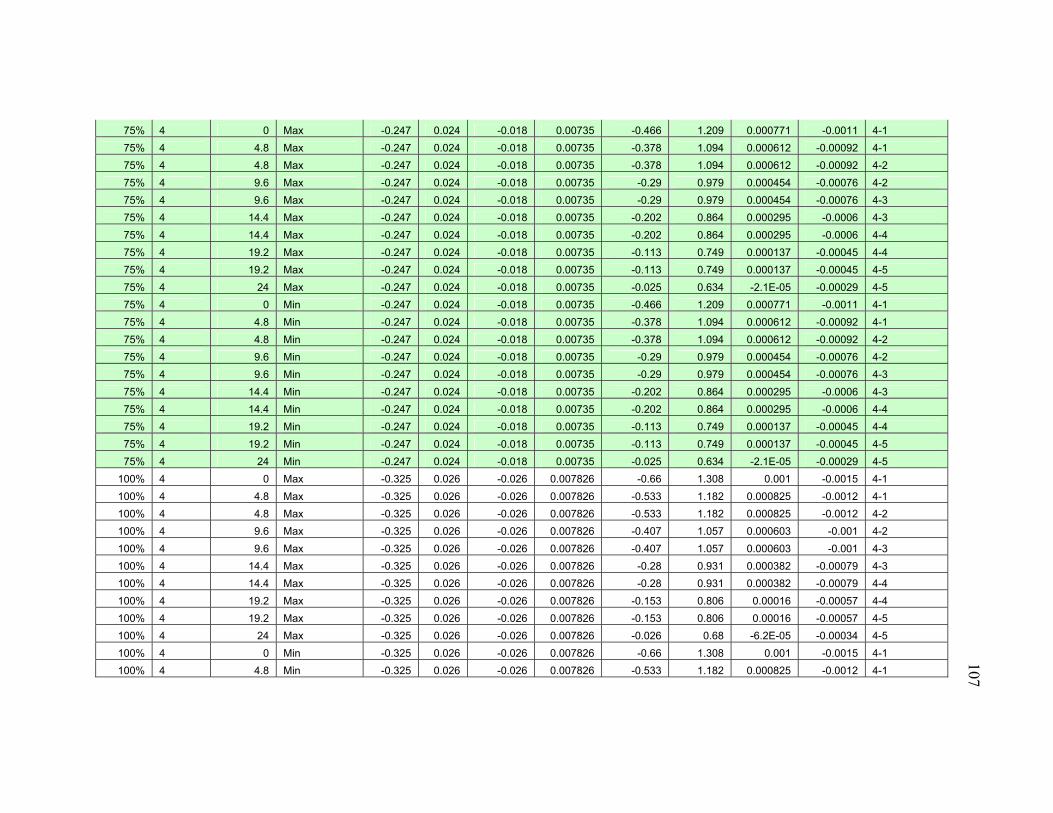
107
75% 4 0 Max -0.247 0.024 -0.018 0.00735 -0.466 1.209 0.000771 -0.0011 4-1
75% 4 4.8 Max -0.247 0.024 -0.018 0.00735 -0.378 1.094 0.000612 -0.00092 4-1
75% 4 4.8 Max -0.247 0.024 -0.018 0.00735 -0.378 1.094 0.000612 -0.00092 4-2
75% 4 9.6 Max -0.247 0.024 -0.018 0.00735 -0.29 0.979 0.000454 -0.00076 4-2
75% 4 9.6 Max -0.247 0.024 -0.018 0.00735 -0.29 0.979 0.000454 -0.00076 4-3
75% 4 14.4 Max -0.247 0.024 -0.018 0.00735 -0.202 0.864 0.000295 -0.0006 4-3
75% 4 14.4 Max -0.247 0.024 -0.018 0.00735 -0.202 0.864 0.000295 -0.0006 4-4
75% 4 19.2 Max -0.247 0.024 -0.018 0.00735 -0.113 0.749 0.000137 -0.00045 4-4
75% 4 19.2 Max -0.247 0.024 -0.018 0.00735 -0.113 0.749 0.000137 -0.00045 4-5
75% 4 24 Max -0.247 0.024 -0.018 0.00735 -0.025 0.634 -2.1E-05 -0.00029 4-5
75% 4 0 Min -0.247 0.024 -0.018 0.00735 -0.466 1.209 0.000771 -0.0011 4-1
75% 4 4.8 Min -0.247 0.024 -0.018 0.00735 -0.378 1.094 0.000612 -0.00092 4-1
75% 4 4.8 Min -0.247 0.024 -0.018 0.00735 -0.378 1.094 0.000612 -0.00092 4-2
75% 4 9.6 Min -0.247 0.024 -0.018 0.00735 -0.29 0.979 0.000454 -0.00076 4-2
75% 4 9.6 Min -0.247 0.024 -0.018 0.00735 -0.29 0.979 0.000454 -0.00076 4-3
75% 4 14.4 Min -0.247 0.024 -0.018 0.00735 -0.202 0.864 0.000295 -0.0006 4-3
75% 4 14.4 Min -0.247 0.024 -0.018 0.00735 -0.202 0.864 0.000295 -0.0006 4-4
75% 4 19.2 Min -0.247 0.024 -0.018 0.00735 -0.113 0.749 0.000137 -0.00045 4-4
75% 4 19.2 Min -0.247 0.024 -0.018 0.00735 -0.113 0.749 0.000137 -0.00045 4-5
75% 4 24 Min -0.247 0.024 -0.018 0.00735 -0.025 0.634 -2.1E-05 -0.00029 4-5
100% 4 0 Max -0.325 0.026 -0.026 0.007826 -0.66 1.308 0.001 -0.0015 4-1
100% 4 4.8 Max -0.325 0.026 -0.026 0.007826 -0.533 1.182 0.000825 -0.0012 4-1
100% 4 4.8 Max -0.325 0.026 -0.026 0.007826 -0.533 1.182 0.000825 -0.0012 4-2
100% 4 9.6 Max -0.325 0.026 -0.026 0.007826 -0.407 1.057 0.000603 -0.001 4-2
100% 4 9.6 Max -0.325 0.026 -0.026 0.007826 -0.407 1.057 0.000603 -0.001 4-3
100% 4 14.4 Max -0.325 0.026 -0.026 0.007826 -0.28 0.931 0.000382 -0.00079 4-3
100% 4 14.4 Max -0.325 0.026 -0.026 0.007826 -0.28 0.931 0.000382 -0.00079 4-4
100% 4 19.2 Max -0.325 0.026 -0.026 0.007826 -0.153 0.806 0.00016 -0.00057 4-4
100% 4 19.2 Max -0.325 0.026 -0.026 0.007826 -0.153 0.806 0.00016 -0.00057 4-5
100% 4 24 Max -0.325 0.026 -0.026 0.007826 -0.026 0.68 -6.2E-05 -0.00034 4-5
100% 4 0 Min -0.325 0.026 -0.026 0.007826 -0.66 1.308 0.001 -0.0015 4-1
100% 4 4.8 Min -0.325 0.026 -0.026 0.007826 -0.533 1.182 0.000825 -0.0012 4-1
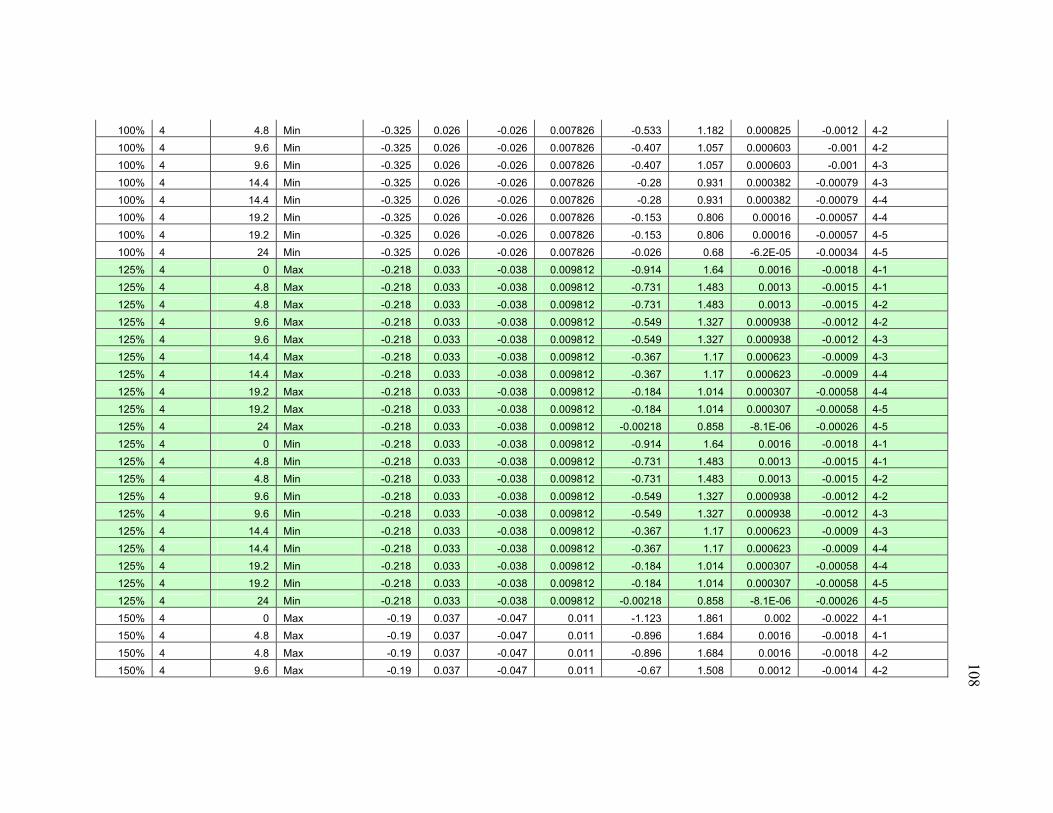
108
100% 4 4.8 Min -0.325 0.026 -0.026 0.007826 -0.533 1.182 0.000825 -0.0012 4-2
100% 4 9.6 Min -0.325 0.026 -0.026 0.007826 -0.407 1.057 0.000603 -0.001 4-2
100% 4 9.6 Min -0.325 0.026 -0.026 0.007826 -0.407 1.057 0.000603 -0.001 4-3
100% 4 14.4 Min -0.325 0.026 -0.026 0.007826 -0.28 0.931 0.000382 -0.00079 4-3
100% 4 14.4 Min -0.325 0.026 -0.026 0.007826 -0.28 0.931 0.000382 -0.00079 4-4
100% 4 19.2 Min -0.325 0.026 -0.026 0.007826 -0.153 0.806 0.00016 -0.00057 4-4
100% 4 19.2 Min -0.325 0.026 -0.026 0.007826 -0.153 0.806 0.00016 -0.00057 4-5
100% 4 24 Min -0.325 0.026 -0.026 0.007826 -0.026 0.68 -6.2E-05 -0.00034 4-5
125% 4 0 Max -0.218 0.033 -0.038 0.009812 -0.914 1.64 0.0016 -0.0018 4-1
125% 4 4.8 Max -0.218 0.033 -0.038 0.009812 -0.731 1.483 0.0013 -0.0015 4-1
125% 4 4.8 Max -0.218 0.033 -0.038 0.009812 -0.731 1.483 0.0013 -0.0015 4-2
125% 4 9.6 Max -0.218 0.033 -0.038 0.009812 -0.549 1.327 0.000938 -0.0012 4-2
125% 4 9.6 Max -0.218 0.033 -0.038 0.009812 -0.549 1.327 0.000938 -0.0012 4-3
125% 4 14.4 Max -0.218 0.033 -0.038 0.009812 -0.367 1.17 0.000623 -0.0009 4-3
125% 4 14.4 Max -0.218 0.033 -0.038 0.009812 -0.367 1.17 0.000623 -0.0009 4-4
125% 4 19.2 Max -0.218 0.033 -0.038 0.009812 -0.184 1.014 0.000307 -0.00058 4-4
125% 4 19.2 Max -0.218 0.033 -0.038 0.009812 -0.184 1.014 0.000307 -0.00058 4-5
125% 4 24 Max -0.218 0.033 -0.038 0.009812 -0.00218 0.858 -8.1E-06 -0.00026 4-5
125% 4 0 Min -0.218 0.033 -0.038 0.009812 -0.914 1.64 0.0016 -0.0018 4-1
125% 4 4.8 Min -0.218 0.033 -0.038 0.009812 -0.731 1.483 0.0013 -0.0015 4-1
125% 4 4.8 Min -0.218 0.033 -0.038 0.009812 -0.731 1.483 0.0013 -0.0015 4-2
125% 4 9.6 Min -0.218 0.033 -0.038 0.009812 -0.549 1.327 0.000938 -0.0012 4-2
125% 4 9.6 Min -0.218 0.033 -0.038 0.009812 -0.549 1.327 0.000938 -0.0012 4-3
125% 4 14.4 Min -0.218 0.033 -0.038 0.009812 -0.367 1.17 0.000623 -0.0009 4-3
125% 4 14.4 Min -0.218 0.033 -0.038 0.009812 -0.367 1.17 0.000623 -0.0009 4-4
125% 4 19.2 Min -0.218 0.033 -0.038 0.009812 -0.184 1.014 0.000307 -0.00058 4-4
125% 4 19.2 Min -0.218 0.033 -0.038 0.009812 -0.184 1.014 0.000307 -0.00058 4-5
125% 4 24 Min -0.218 0.033 -0.038 0.009812 -0.00218 0.858 -8.1E-06 -0.00026 4-5
150% 4 0 Max -0.19 0.037 -0.047 0.011 -1.123 1.861 0.002 -0.0022 4-1
150% 4 4.8 Max -0.19 0.037 -0.047 0.011 -0.896 1.684 0.0016 -0.0018 4-1
150% 4 4.8 Max -0.19 0.037 -0.047 0.011 -0.896 1.684 0.0016 -0.0018 4-2
150% 4 9.6 Max -0.19 0.037 -0.047 0.011 -0.67 1.508 0.0012 -0.0014 4-2
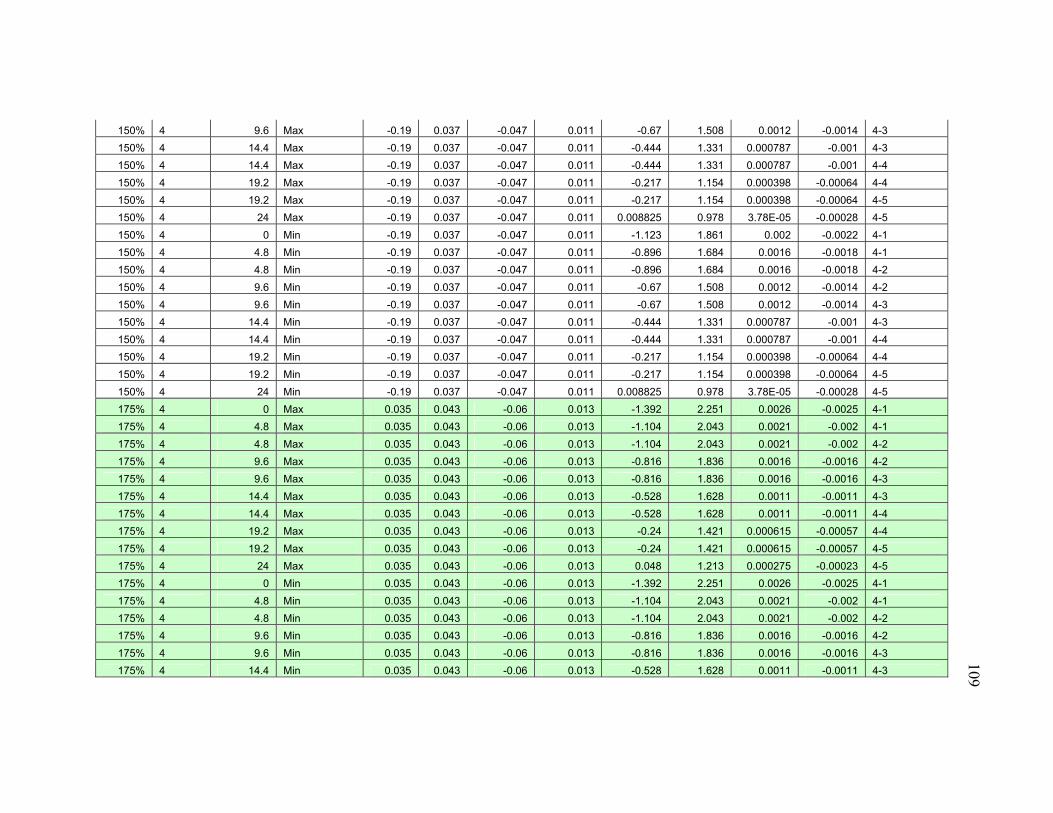
109
150% 4 9.6 Max -0.19 0.037 -0.047 0.011 -0.67 1.508 0.0012 -0.0014 4-3
150% 4 14.4 Max -0.19 0.037 -0.047 0.011 -0.444 1.331 0.000787 -0.001 4-3
150% 4 14.4 Max -0.19 0.037 -0.047 0.011 -0.444 1.331 0.000787 -0.001 4-4
150% 4 19.2 Max -0.19 0.037 -0.047 0.011 -0.217 1.154 0.000398 -0.00064 4-4
150% 4 19.2 Max -0.19 0.037 -0.047 0.011 -0.217 1.154 0.000398 -0.00064 4-5
150% 4 24 Max -0.19 0.037 -0.047 0.011 0.008825 0.978 3.78E-05 -0.00028 4-5
150% 4 0 Min -0.19 0.037 -0.047 0.011 -1.123 1.861 0.002 -0.0022 4-1
150% 4 4.8 Min -0.19 0.037 -0.047 0.011 -0.896 1.684 0.0016 -0.0018 4-1
150% 4 4.8 Min -0.19 0.037 -0.047 0.011 -0.896 1.684 0.0016 -0.0018 4-2
150% 4 9.6 Min -0.19 0.037 -0.047 0.011 -0.67 1.508 0.0012 -0.0014 4-2
150% 4 9.6 Min -0.19 0.037 -0.047 0.011 -0.67 1.508 0.0012 -0.0014 4-3
150% 4 14.4 Min -0.19 0.037 -0.047 0.011 -0.444 1.331 0.000787 -0.001 4-3
150% 4 14.4 Min -0.19 0.037 -0.047 0.011 -0.444 1.331 0.000787 -0.001 4-4
150% 4 19.2 Min -0.19 0.037 -0.047 0.011 -0.217 1.154 0.000398 -0.00064 4-4
150% 4 19.2 Min -0.19 0.037 -0.047 0.011 -0.217 1.154 0.000398 -0.00064 4-5
150% 4 24 Min -0.19 0.037 -0.047 0.011 0.008825 0.978 3.78E-05 -0.00028 4-5
175% 4 0 Max 0.035 0.043 -0.06 0.013 -1.392 2.251 0.0026 -0.0025 4-1
175% 4 4.8 Max 0.035 0.043 -0.06 0.013 -1.104 2.043 0.0021 -0.002 4-1
175% 4 4.8 Max 0.035 0.043 -0.06 0.013 -1.104 2.043 0.0021 -0.002 4-2
175% 4 9.6 Max 0.035 0.043 -0.06 0.013 -0.816 1.836 0.0016 -0.0016 4-2
175% 4 9.6 Max 0.035 0.043 -0.06 0.013 -0.816 1.836 0.0016 -0.0016 4-3
175% 4 14.4 Max 0.035 0.043 -0.06 0.013 -0.528 1.628 0.0011 -0.0011 4-3
175% 4 14.4 Max 0.035 0.043 -0.06 0.013 -0.528 1.628 0.0011 -0.0011 4-4
175% 4 19.2 Max 0.035 0.043 -0.06 0.013 -0.24 1.421 0.000615 -0.00057 4-4
175% 4 19.2 Max 0.035 0.043 -0.06 0.013 -0.24 1.421 0.000615 -0.00057 4-5
175% 4 24 Max 0.035 0.043 -0.06 0.013 0.048 1.213 0.000275 -0.00023 4-5
175% 4 0 Min 0.035 0.043 -0.06 0.013 -1.392 2.251 0.0026 -0.0025 4-1
175% 4 4.8 Min 0.035 0.043 -0.06 0.013 -1.104 2.043 0.0021 -0.002 4-1
175% 4 4.8 Min 0.035 0.043 -0.06 0.013 -1.104 2.043 0.0021 -0.002 4-2
175% 4 9.6 Min 0.035 0.043 -0.06 0.013 -0.816 1.836 0.0016 -0.0016 4-2
175% 4 9.6 Min 0.035 0.043 -0.06 0.013 -0.816 1.836 0.0016 -0.0016 4-3
175% 4 14.4 Min 0.035 0.043 -0.06 0.013 -0.528 1.628 0.0011 -0.0011 4-3
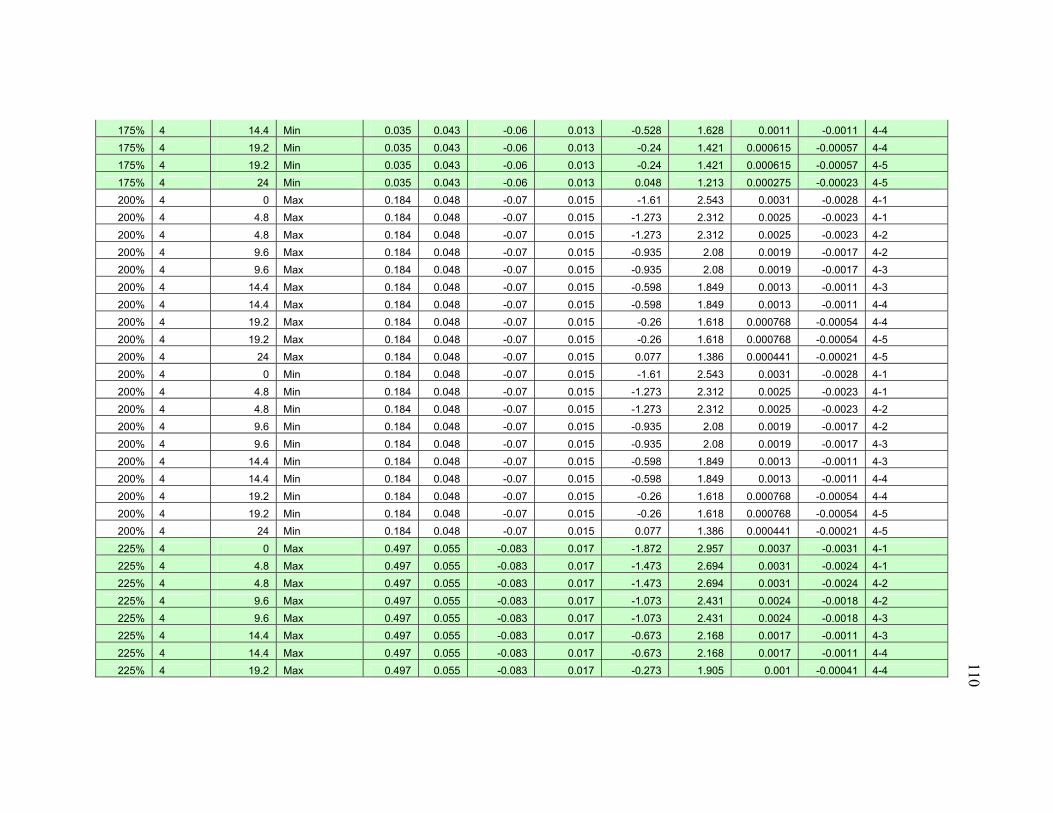
110
175% 4 14.4 Min 0.035 0.043 -0.06 0.013 -0.528 1.628 0.0011 -0.0011 4-4
175% 4 19.2 Min 0.035 0.043 -0.06 0.013 -0.24 1.421 0.000615 -0.00057 4-4
175% 4 19.2 Min 0.035 0.043 -0.06 0.013 -0.24 1.421 0.000615 -0.00057 4-5
175% 4 24 Min 0.035 0.043 -0.06 0.013 0.048 1.213 0.000275 -0.00023 4-5
200% 4 0 Max 0.184 0.048 -0.07 0.015 -1.61 2.543 0.0031 -0.0028 4-1
200% 4 4.8 Max 0.184 0.048 -0.07 0.015 -1.273 2.312 0.0025 -0.0023 4-1
200% 4 4.8 Max 0.184 0.048 -0.07 0.015 -1.273 2.312 0.0025 -0.0023 4-2
200% 4 9.6 Max 0.184 0.048 -0.07 0.015 -0.935 2.08 0.0019 -0.0017 4-2
200% 4 9.6 Max 0.184 0.048 -0.07 0.015 -0.935 2.08 0.0019 -0.0017 4-3
200% 4 14.4 Max 0.184 0.048 -0.07 0.015 -0.598 1.849 0.0013 -0.0011 4-3
200% 4 14.4 Max 0.184 0.048 -0.07 0.015 -0.598 1.849 0.0013 -0.0011 4-4
200% 4 19.2 Max 0.184 0.048 -0.07 0.015 -0.26 1.618 0.000768 -0.00054 4-4
200% 4 19.2 Max 0.184 0.048 -0.07 0.015 -0.26 1.618 0.000768 -0.00054 4-5
200% 4 24 Max 0.184 0.048 -0.07 0.015 0.077 1.386 0.000441 -0.00021 4-5
200% 4 0 Min 0.184 0.048 -0.07 0.015 -1.61 2.543 0.0031 -0.0028 4-1
200% 4 4.8 Min 0.184 0.048 -0.07 0.015 -1.273 2.312 0.0025 -0.0023 4-1
200% 4 4.8 Min 0.184 0.048 -0.07 0.015 -1.273 2.312 0.0025 -0.0023 4-2
200% 4 9.6 Min 0.184 0.048 -0.07 0.015 -0.935 2.08 0.0019 -0.0017 4-2
200% 4 9.6 Min 0.184 0.048 -0.07 0.015 -0.935 2.08 0.0019 -0.0017 4-3
200% 4 14.4 Min 0.184 0.048 -0.07 0.015 -0.598 1.849 0.0013 -0.0011 4-3
200% 4 14.4 Min 0.184 0.048 -0.07 0.015 -0.598 1.849 0.0013 -0.0011 4-4
200% 4 19.2 Min 0.184 0.048 -0.07 0.015 -0.26 1.618 0.000768 -0.00054 4-4
200% 4 19.2 Min 0.184 0.048 -0.07 0.015 -0.26 1.618 0.000768 -0.00054 4-5
200% 4 24 Min 0.184 0.048 -0.07 0.015 0.077 1.386 0.000441 -0.00021 4-5
225% 4 0 Max 0.497 0.055 -0.083 0.017 -1.872 2.957 0.0037 -0.0031 4-1
225% 4 4.8 Max 0.497 0.055 -0.083 0.017 -1.473 2.694 0.0031 -0.0024 4-1
225% 4 4.8 Max 0.497 0.055 -0.083 0.017 -1.473 2.694 0.0031 -0.0024 4-2
225% 4 9.6 Max 0.497 0.055 -0.083 0.017 -1.073 2.431 0.0024 -0.0018 4-2
225% 4 9.6 Max 0.497 0.055 -0.083 0.017 -1.073 2.431 0.0024 -0.0018 4-3
225% 4 14.4 Max 0.497 0.055 -0.083 0.017 -0.673 2.168 0.0017 -0.0011 4-3
225% 4 14.4 Max 0.497 0.055 -0.083 0.017 -0.673 2.168 0.0017 -0.0011 4-4
225% 4 19.2 Max 0.497 0.055 -0.083 0.017 -0.273 1.905 0.001 -0.00041 4-4

111
225% 4 19.2 Max 0.497 0.055 -0.083 0.017 -0.273 1.905 0.001 -0.00041 4-5
225% 4 24 Max 0.497 0.055 -0.083 0.017 0.126 1.642 0.000752 -0.00013 4-5
225% 4 0 Min 0.497 0.055 -0.083 0.017 -1.872 2.957 0.0037 -0.0031 4-1
225% 4 4.8 Min 0.497 0.055 -0.083 0.017 -1.473 2.694 0.0031 -0.0024 4-1
225% 4 4.8 Min 0.497 0.055 -0.083 0.017 -1.473 2.694 0.0031 -0.0024 4-2
225% 4 9.6 Min 0.497 0.055 -0.083 0.017 -1.073 2.431 0.0024 -0.0018 4-2
225% 4 9.6 Min 0.497 0.055 -0.083 0.017 -1.073 2.431 0.0024 -0.0018 4-3
225% 4 14.4 Min 0.497 0.055 -0.083 0.017 -0.673 2.168 0.0017 -0.0011 4-3
225% 4 14.4 Min 0.497 0.055 -0.083 0.017 -0.673 2.168 0.0017 -0.0011 4-4
225% 4 19.2 Min 0.497 0.055 -0.083 0.017 -0.273 1.905 0.001 -0.00041 4-4
225% 4 19.2 Min 0.497 0.055 -0.083 0.017 -0.273 1.905 0.001 -0.00041 4-5
225% 4 24 Min 0.497 0.055 -0.083 0.017 0.126 1.642 0.000752 -0.00013 4-5
250% 4 0 Max 0.725 0.06 -0.093 0.019 -2.083 3.283 0.0043 -0.0034 4-1
250% 4 4.8 Max 0.725 0.06 -0.093 0.019 -1.634 2.995 0.0035 -0.0026 4-1
250% 4 4.8 Max 0.725 0.06 -0.093 0.019 -1.634 2.995 0.0035 -0.0026 4-2
250% 4 9.6 Max 0.725 0.06 -0.093 0.019 -1.185 2.708 0.0027 -0.0018 4-2
250% 4 9.6 Max 0.725 0.06 -0.093 0.019 -1.185 2.708 0.0027 -0.0018 4-3
250% 4 14.4 Max 0.725 0.06 -0.093 0.019 -0.737 2.42 0.002 -0.0011 4-3
250% 4 14.4 Max 0.725 0.06 -0.093 0.019 -0.737 2.42 0.002 -0.0011 4-4
250% 4 19.2 Max 0.725 0.06 -0.093 0.019 -0.288 2.132 0.0012 -0.00032 4-4
250% 4 19.2 Max 0.725 0.06 -0.093 0.019 -0.288 2.132 0.0012 -0.00032 4-5
250% 4 24 Max 0.725 0.06 -0.093 0.019 0.161 1.845 0.000979 -7.3E-05 4-5
250% 4 0 Min 0.725 0.06 -0.093 0.019 -2.083 3.283 0.0043 -0.0034 4-1
250% 4 4.8 Min 0.725 0.06 -0.093 0.019 -1.634 2.995 0.0035 -0.0026 4-1
250% 4 4.8 Min 0.725 0.06 -0.093 0.019 -1.634 2.995 0.0035 -0.0026 4-2
250% 4 9.6 Min 0.725 0.06 -0.093 0.019 -1.185 2.708 0.0027 -0.0018 4-2
250% 4 9.6 Min 0.725 0.06 -0.093 0.019 -1.185 2.708 0.0027 -0.0018 4-3
250% 4 14.4 Min 0.725 0.06 -0.093 0.019 -0.737 2.42 0.002 -0.0011 4-3
250% 4 14.4 Min 0.725 0.06 -0.093 0.019 -0.737 2.42 0.002 -0.0011 4-4
250% 4 19.2 Min 0.725 0.06 -0.093 0.019 -0.288 2.132 0.0012 -0.00032 4-4
250% 4 19.2 Min 0.725 0.06 -0.093 0.019 -0.288 2.132 0.0012 -0.00032 4-5
250% 4 24 Min 0.725 0.06 -0.093 0.019 0.161 1.845 0.000979 -7.3E-05 4-5
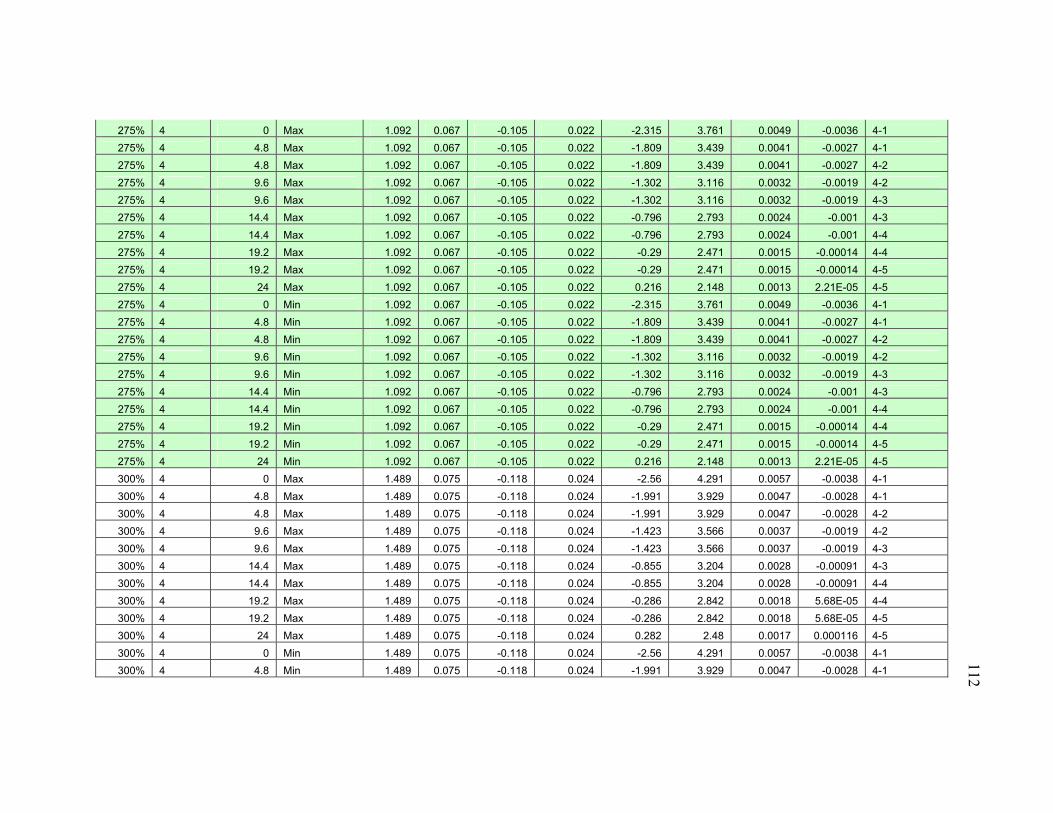
112
275% 4 0 Max 1.092 0.067 -0.105 0.022 -2.315 3.761 0.0049 -0.0036 4-1
275% 4 4.8 Max 1.092 0.067 -0.105 0.022 -1.809 3.439 0.0041 -0.0027 4-1
275% 4 4.8 Max 1.092 0.067 -0.105 0.022 -1.809 3.439 0.0041 -0.0027 4-2
275% 4 9.6 Max 1.092 0.067 -0.105 0.022 -1.302 3.116 0.0032 -0.0019 4-2
275% 4 9.6 Max 1.092 0.067 -0.105 0.022 -1.302 3.116 0.0032 -0.0019 4-3
275% 4 14.4 Max 1.092 0.067 -0.105 0.022 -0.796 2.793 0.0024 -0.001 4-3
275% 4 14.4 Max 1.092 0.067 -0.105 0.022 -0.796 2.793 0.0024 -0.001 4-4
275% 4 19.2 Max 1.092 0.067 -0.105 0.022 -0.29 2.471 0.0015 -0.00014 4-4
275% 4 19.2 Max 1.092 0.067 -0.105 0.022 -0.29 2.471 0.0015 -0.00014 4-5
275% 4 24 Max 1.092 0.067 -0.105 0.022 0.216 2.148 0.0013 2.21E-05 4-5
275% 4 0 Min 1.092 0.067 -0.105 0.022 -2.315 3.761 0.0049 -0.0036 4-1
275% 4 4.8 Min 1.092 0.067 -0.105 0.022 -1.809 3.439 0.0041 -0.0027 4-1
275% 4 4.8 Min 1.092 0.067 -0.105 0.022 -1.809 3.439 0.0041 -0.0027 4-2
275% 4 9.6 Min 1.092 0.067 -0.105 0.022 -1.302 3.116 0.0032 -0.0019 4-2
275% 4 9.6 Min 1.092 0.067 -0.105 0.022 -1.302 3.116 0.0032 -0.0019 4-3
275% 4 14.4 Min 1.092 0.067 -0.105 0.022 -0.796 2.793 0.0024 -0.001 4-3
275% 4 14.4 Min 1.092 0.067 -0.105 0.022 -0.796 2.793 0.0024 -0.001 4-4
275% 4 19.2 Min 1.092 0.067 -0.105 0.022 -0.29 2.471 0.0015 -0.00014 4-4
275% 4 19.2 Min 1.092 0.067 -0.105 0.022 -0.29 2.471 0.0015 -0.00014 4-5
275% 4 24 Min 1.092 0.067 -0.105 0.022 0.216 2.148 0.0013 2.21E-05 4-5
300% 4 0 Max 1.489 0.075 -0.118 0.024 -2.56 4.291 0.0057 -0.0038 4-1
300% 4 4.8 Max 1.489 0.075 -0.118 0.024 -1.991 3.929 0.0047 -0.0028 4-1
300% 4 4.8 Max 1.489 0.075 -0.118 0.024 -1.991 3.929 0.0047 -0.0028 4-2
300% 4 9.6 Max 1.489 0.075 -0.118 0.024 -1.423 3.566 0.0037 -0.0019 4-2
300% 4 9.6 Max 1.489 0.075 -0.118 0.024 -1.423 3.566 0.0037 -0.0019 4-3
300% 4 14.4 Max 1.489 0.075 -0.118 0.024 -0.855 3.204 0.0028 -0.00091 4-3
300% 4 14.4 Max 1.489 0.075 -0.118 0.024 -0.855 3.204 0.0028 -0.00091 4-4
300% 4 19.2 Max 1.489 0.075 -0.118 0.024 -0.286 2.842 0.0018 5.68E-05 4-4
300% 4 19.2 Max 1.489 0.075 -0.118 0.024 -0.286 2.842 0.0018 5.68E-05 4-5
300% 4 24 Max 1.489 0.075 -0.118 0.024 0.282 2.48 0.0017 0.000116 4-5
300% 4 0 Min 1.489 0.075 -0.118 0.024 -2.56 4.291 0.0057 -0.0038 4-1
300% 4 4.8 Min 1.489 0.075 -0.118 0.024 -1.991 3.929 0.0047 -0.0028 4-1
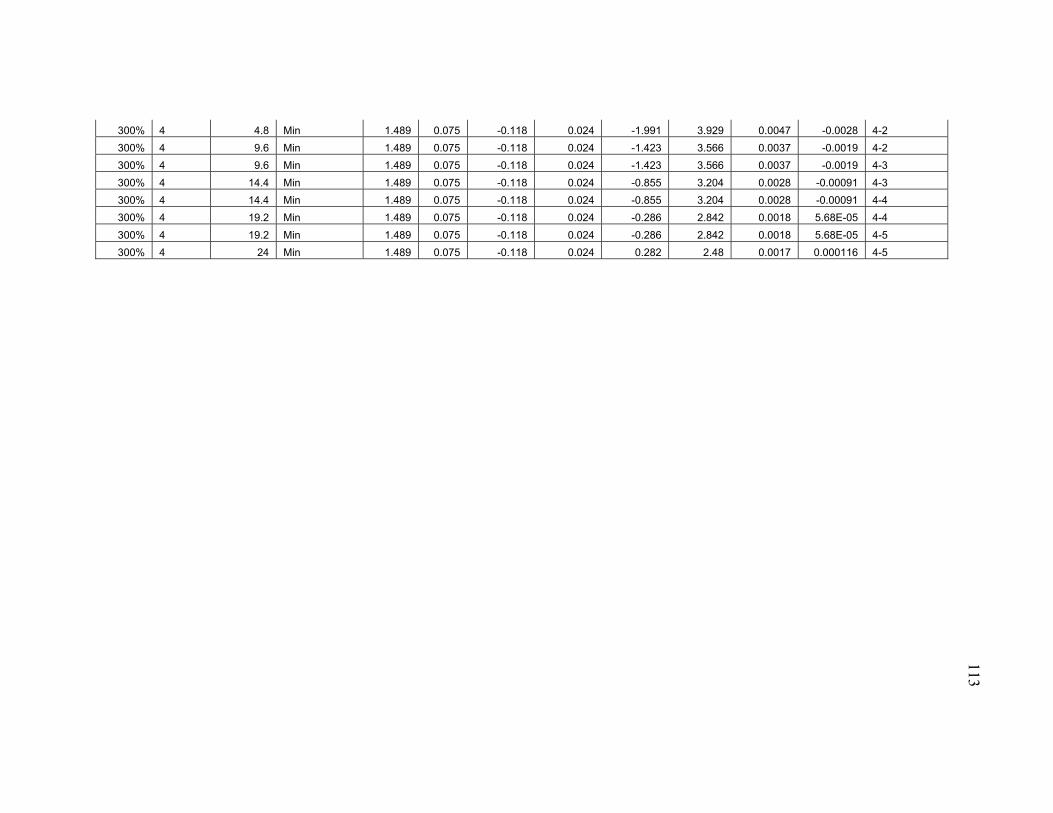
113
300% 4 4.8 Min 1.489 0.075 -0.118 0.024 -1.991 3.929 0.0047 -0.0028 4-2
300% 4 9.6 Min 1.489 0.075 -0.118 0.024 -1.423 3.566 0.0037 -0.0019 4-2
300% 4 9.6 Min 1.489 0.075 -0.118 0.024 -1.423 3.566 0.0037 -0.0019 4-3
300% 4 14.4 Min 1.489 0.075 -0.118 0.024 -0.855 3.204 0.0028 -0.00091 4-3
300% 4 14.4 Min 1.489 0.075 -0.118 0.024 -0.855 3.204 0.0028 -0.00091 4-4
300% 4 19.2 Min 1.489 0.075 -0.118 0.024 -0.286 2.842 0.0018 5.68E-05 4-4
300% 4 19.2 Min 1.489 0.075 -0.118 0.024 -0.286 2.842 0.0018 5.68E-05 4-5
300% 4 24 Min 1.489 0.075 -0.118 0.024 0.282 2.48 0.0017 0.000116 4-5