Embed Size (px)
Citation preview
Bestway (Holdings) Limited Annual Report & Accounts 2014
Bestway (Holdings) Limited was founded in 1963 by Sir Anwar Pervez. It is the UK’s 18th largest privately-owned company and 7th largest family-owned business. The Group consists of: Bestway Wholesale, the largest independent wholesaler in the UK; Bestway Cement, the 2nd largest cement manufacturer in Pakistan; United Bank Limited, the 2nd largest private bank in Pakistan. We continue to grow from strength to strength in all these areas. Welcome to the Bestway (Holdings) Limited 2013/14 Annual Report.
’14 24
18
02
96
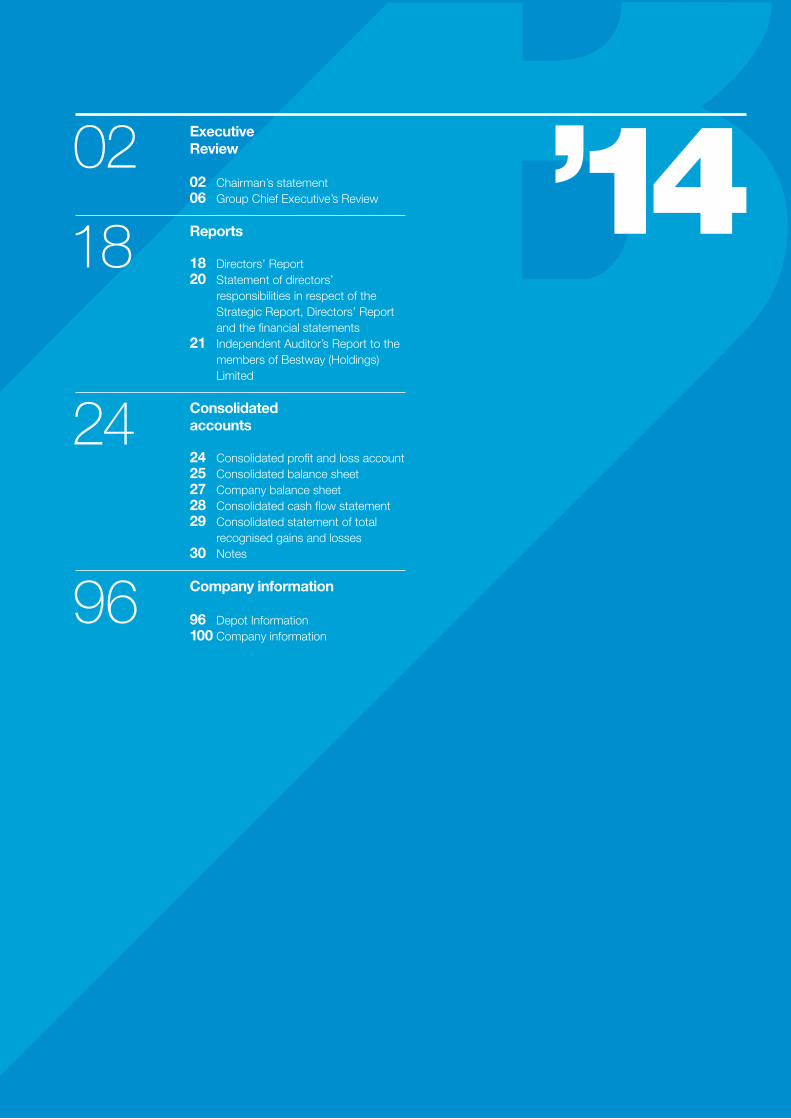
Executive Review
02 Chairman’s statement06 Group Chief Executive’s Review
Reports
18 Directors’ Report20 Statement of directors’ responsibilities in respect of the Strategic Report, Directors’ Report and the financial statements21 Independent Auditor’s Report to the members of Bestway (Holdings) Limited
Consolidated accounts
24 Consolidated profit and loss account25 Consolidated balance sheet27 Company balance sheet28 Consolidated cash flow statement29 Consolidated statement of total recognised gains and losses 30 Notes
Company information 96 Depot Information100 Company information
Bestway (Holdings) LtdAnnual Report & Accounts 2014
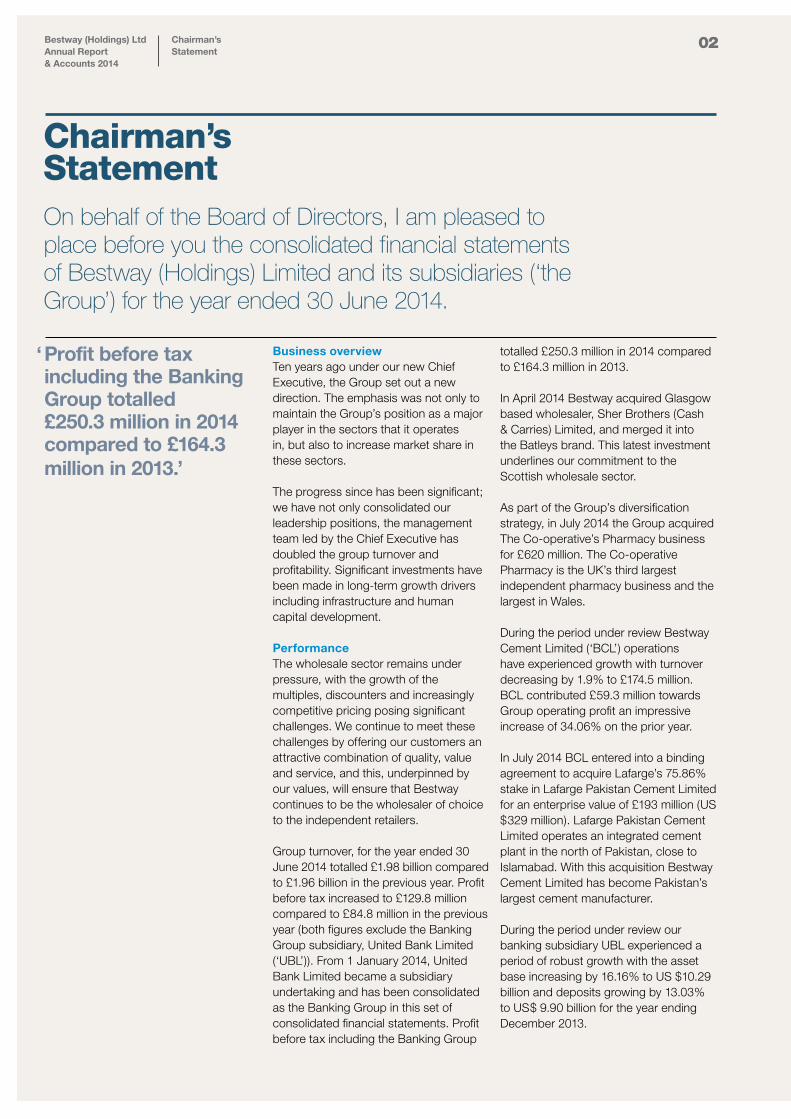
Chairman’sStatement
02
Business overview Ten years ago under our new Chief Executive, the Group set out a new direction. The emphasis was not only to maintain the Group’s position as a major player in the sectors that it operates in, but also to increase market share in these sectors.
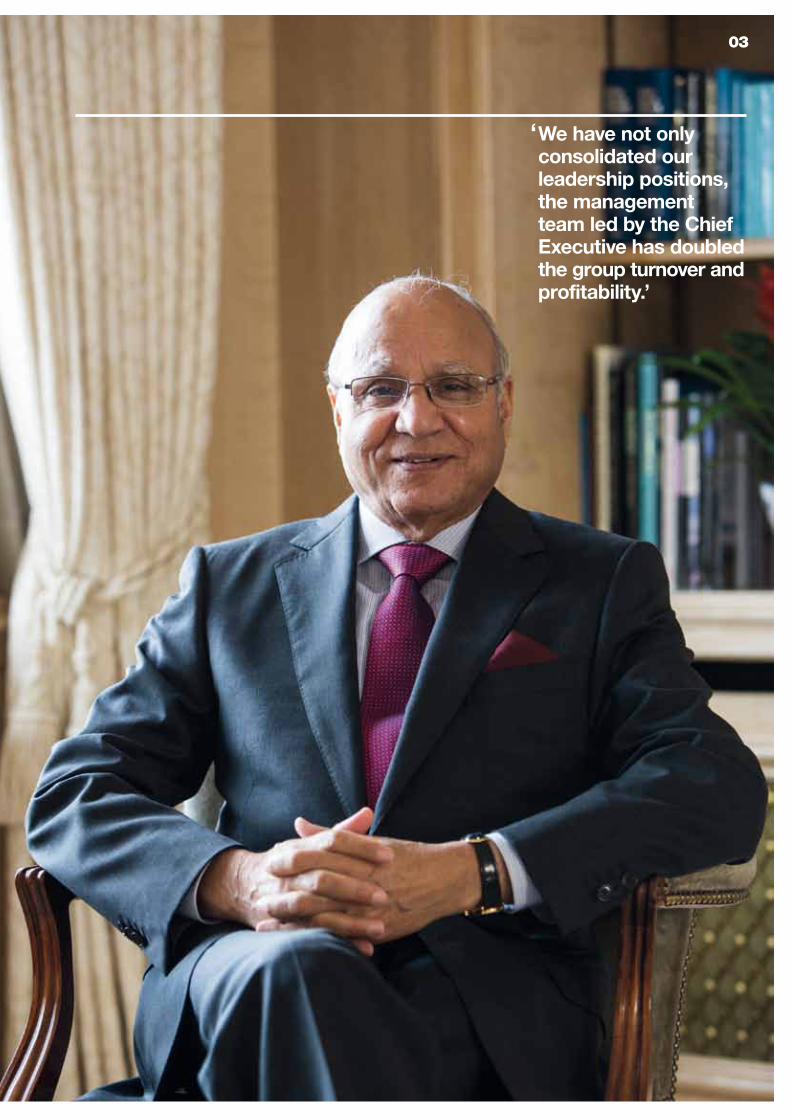
The progress since has been significant; we have not only consolidated our leadership positions, the management team led by the Chief Executive has doubled the group turnover and profitability. Significant investments have been made in long-term growth drivers including infrastructure and human capital development.
Performance The wholesale sector remains under pressure, with the growth of the multiples, discounters and increasingly competitive pricing posing significant challenges. We continue to meet these challenges by offering our customers an attractive combination of quality, value and service, and this, underpinned by our values, will ensure that Bestway continues to be the wholesaler of choice to the independent retailers.
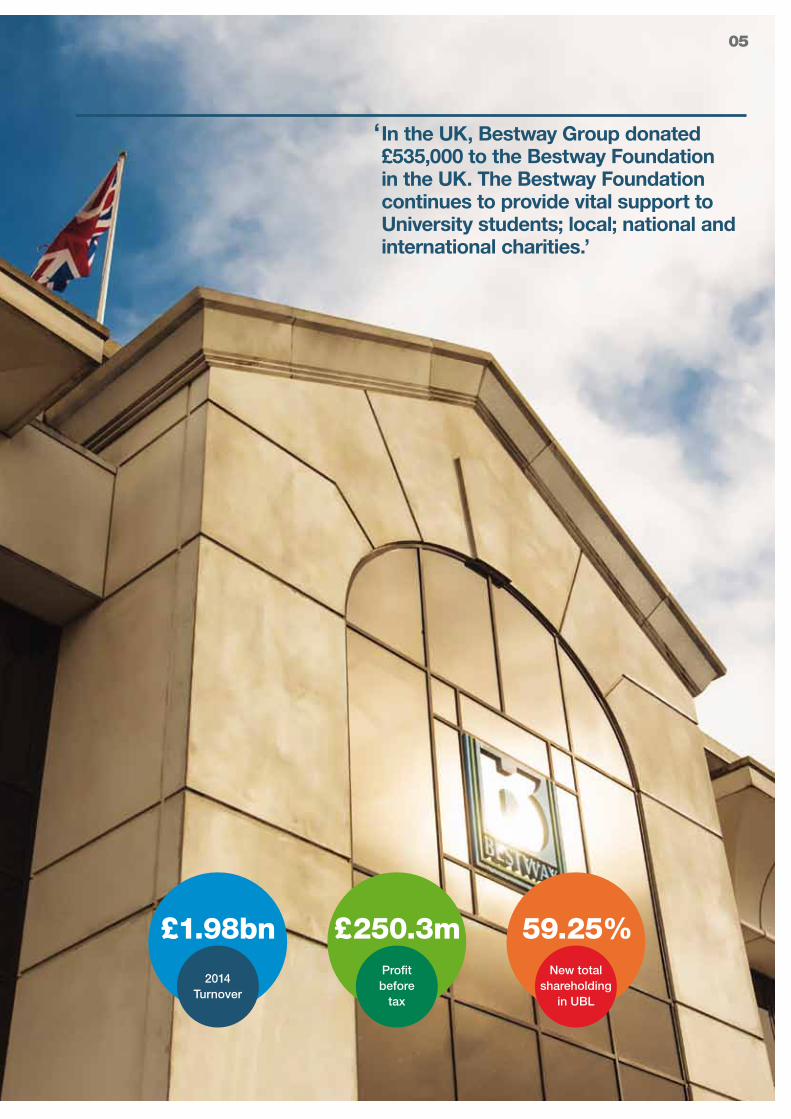
Group turnover, for the year ended 30 June 2014 totalled £1.98 billion compared to £1.96 billion in the previous year. Profit before tax increased to £129.8 million compared to £84.8 million in the previous year (both figures exclude the Banking Group subsidiary, United Bank Limited (‘UBL’)). From 1 January 2014, United Bank Limited became a subsidiary undertaking and has been consolidated as the Banking Group in this set of consolidated financial statements. Profit before tax including the Banking Group
totalled £250.3 million in 2014 compared to £164.3 million in 2013. In April 2014 Bestway acquired Glasgow based wholesaler, Sher Brothers (Cash & Carries) Limited, and merged it into the Batleys brand. This latest investment underlines our commitment to the Scottish wholesale sector.
As part of the Group’s diversification strategy, in July 2014 the Group acquired The Co-operative’s Pharmacy business for £620 million. The Co-operative Pharmacy is the UK’s third largest independent pharmacy business and the largest in Wales.
During the period under review Bestway Cement Limited (‘BCL’) operations have experienced growth with turnover decreasing by 1.9% to £174.5 million. BCL contributed £59.3 million towards Group operating profit an impressive increase of 34.06% on the prior year.
In July 2014 BCL entered into a binding agreement to acquire Lafarge’s 75.86% stake in Lafarge Pakistan Cement Limited for an enterprise value of £193 million (US $329 million). Lafarge Pakistan Cement Limited operates an integrated cement plant in the north of Pakistan, close to Islamabad. With this acquisition Bestway Cement Limited has become Pakistan’s largest cement manufacturer.
During the period under review our banking subsidiary UBL experienced a period of robust growth with the asset base increasing by 16.16% to US $10.29 billion and deposits growing by 13.03% to US$ 9.90 billion for the year ending December 2013.
On behalf of the Board of Directors, I am pleased to place before you the consolidated financial statements of Bestway (Holdings) Limited and its subsidiaries (‘the Group’) for the year ended 30 June 2014.
Chairman’s Statement
‘ Profit before tax including the Banking Group totalled £250.3 million in 2014 compared to £164.3 million in 2013.’
In June 2013 UBL established its first dedicated African subsidiary in Tanzania. Tanzania is one of the most under served markets in East Africa with only 12% of the country’s population having access to a bank account. The subsidiary was officially opened by the Vice-President of Tanzania Dr Mohamed Gharib Bilal in September 2013.
‘ We have not only consolidated our leadership positions, the management team led by the Chief Executive has doubled the group turnover and profitability.’
03
Bestway (Holdings) LtdAnnual Report & Accounts 2014
Chairman’sStatement
04
In June 2013 UBL established its first dedicated African subsidiary in Tanzania. Tanzania is one of the most underserved markets in East Africa with only 12% of the country’s population having access to a bank account. The subsidiary was officially opened by the Vice-President of Tanzania Dr Mohamed Gharib Bilal in September 2013.
For the second consecutive year in November 2013, UK’s Banker Magazine declared UBL ‘The Bank of the Year in Pakistan 2013’.
By 31 December 2013, the Group had increased its shareholding in UBL to 59.25% by acquiring an additional 8.30% of the shares of UBL from the Abu Dhabi Group. With this investment of over $120 million, Bestway Group acquired the last part of the remaining shareholding that its former joint venture partner (the Abu Dhabi Group) held in UBL.
In March 2014 UBL Omni was launched in the United Kingdom to facilitate remittances from the UK to the South Asian subcontinent.
Social responsibility I firmly believe that our commitment to good financial performance needs to be matched by a continued focus on corporate social responsibility, by working with integrity and delivering sustainable business development.
In February 2014 Bestway was awarded the Investors in People Bronze award for demonstrating a degree of excellence in the way they develop and support their staff. The Bronze award is achieved by just 5% of Investors in People recognised organisations in the UK. The Investors in People Standard is awarded to well-run organisations, which demonstrate good management practice with a high emphasis on best practice people management and development.
In May 2014 BCL was ranked 10th out of 478 Publically Listed Companies by volume of donations in Pakistan according to Pakistan Centre for Philanthropy’s (PCP) Philanthropy Survey 2012.
In June 2014 Bestway Group organised its 20th annual charity event at Royal Ascot. The chosen charity this year was Action for Children. This national charity works directly with over 300,000 children, young people, parents and carers. It provides 650 services across the country. It tackles issues such a child neglect and abuse.
In the UK, Bestway Group donated £535,000 to the Bestway Foundation in the UK. The Bestway Foundation continues to provide vital support to University students; local; national and international charities.
Outlook In 2015, our focus will be on continuing to drive margin improvement in our establis-hed businesses, together with delivering value from our recent acquisitions and achieving the synergies between them and other parts of the Group.
Overall, reflecting on a successful year, let me express my thanks and appreciation to our supplier partners; our loyal customers; my fellow directors; our Chief Executive Officer; Senior Management and to all the other 33,600 employees around the world. Looking ahead, I am confident that we have the strategy, people and resources to continue to deliver sustainable growth in the years ahead. Sir MA Pervez, OBE HPkChairman17 February 2015
Chairman’s Statement
05
£1.98bn
2014Turnover
£250.3mProfit before
tax
59.25%New total
shareholding in UBL
‘ In the UK, Bestway Group donated £535,000 to the Bestway Foundation in the UK. The Bestway Foundation continues to provide vital support to University students; local; national and international charities.’
Group Chief Executive’s Review
Bestway (Holdings) LtdAnnual Report & Accounts 2014
06
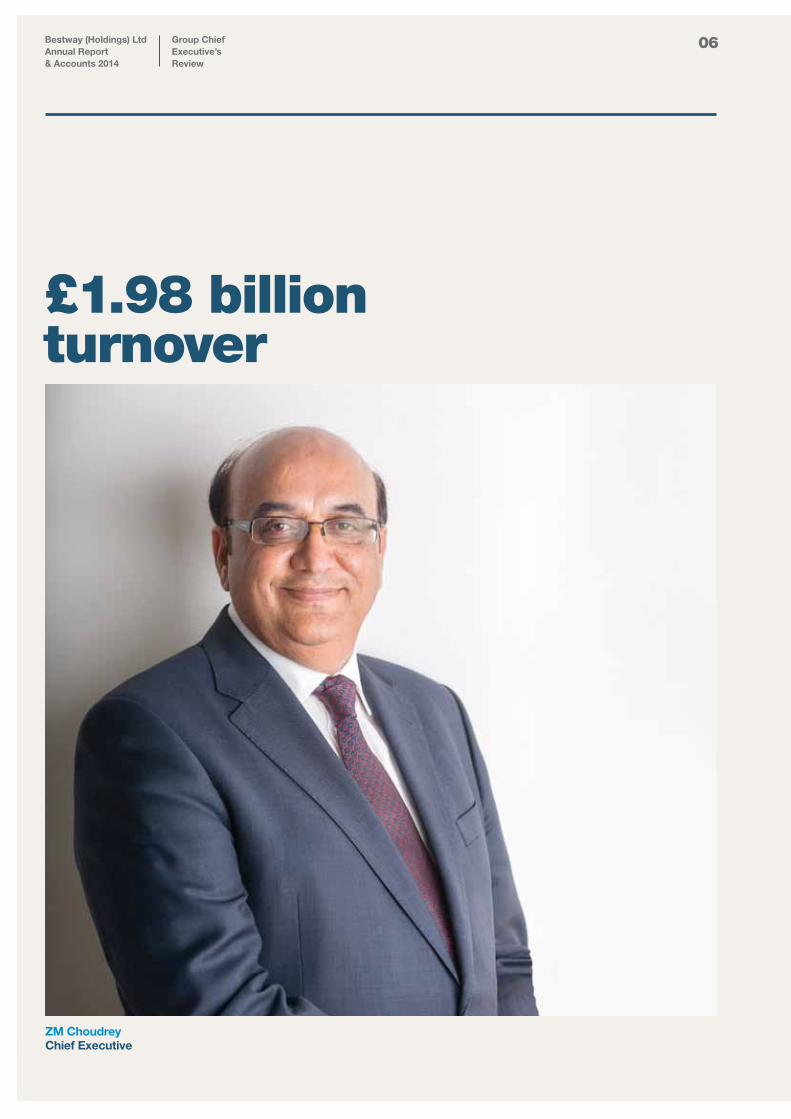
ZM Choudrey Chief Executive
£1.98 billion turnover
07
On behalf of the Board of Directors, I am pleased to present the audited financial statements for Bestway (Holdings) Limited for the year ended 30 June 2014.
Group Chief Executive’s Review
Review of business Despite a challenging business environment both in the UK and globally during the year under review, all the Group businesses continued to enhance their respective market share.
Group financial performance During the year under review, turnover for the wholesale business increased by 1.2% to £1.80 billion, while turnover for the cement business in Pakistan saw a decrease of 1.9% to £174.5 million. Overall, the Group’s turnover for the year ended 30 June 2014 increased by 0.9% to £1.98 billion from £1.96 billion in 2013.
All our businesses were profitable for the year under review, and the overall Group profit before tax increased by 51.5% to £250.3 million as compared to £164.3 million in 2013.
Profit before tax for the wholesale business was £32.0 million, an increase of 5.8% over last year. Bestway Cement Limited continued to trade well and saw its profit before tax increase by 14.3% from £49.8 million in 2013 to £56.9 million. This was due to improved gross profit margins together with a reduction in finance costs.
The Group’s share of operating profit from UBL during the year under review increased from £84.9 million in 2013 to £103.3 million. This increase of 21.7% on an equity accounting basis is mainly due to the fact that UBL has been consolidated for the first time in the Group accounts.
Tangible fixed assets after depreciation as at 30 June 2014 stood at £624.0 million, compared to £458.7 million in the previous year. These include fixed assets acquired due to the acquisition of UBL which is now consolidated within the Group. During the period under review, fixed asset additions amounted to £24.4 million; these included the acquisition and development of Sher Brothers (Cash & Carries) Limited and investment in the Waste Heat Recovery Power Plant being set up in Hattar, Pakistan.
The Group’s total loans and overdrafts decreased by £96.9 million during the period under review as the loans were repaid. The Group managed to reduce debt in the UK and Pakistan by £47.8 million and £48.9 million respectively, which consequently reduced the related financial charges for the Group.
Key highlights Overall, the Group’s turnover for the year ended 30 June 2014 increased by 0.9% to £1.98 billion from £1.96 billion in 2013.
All our businesses were profitable for the year under review, and the overall Group profit before tax increased by 51.5% to £250.3 million as compared to £164.3 million in 2013.
Tangible fixed assets after depreciation as at 30 June 2014 stood at £624.0 million, compared to £458.7 million in the previous year.
Group Chief Executive’s Review
Bestway (Holdings) LtdAnnual Report & Accounts 2014
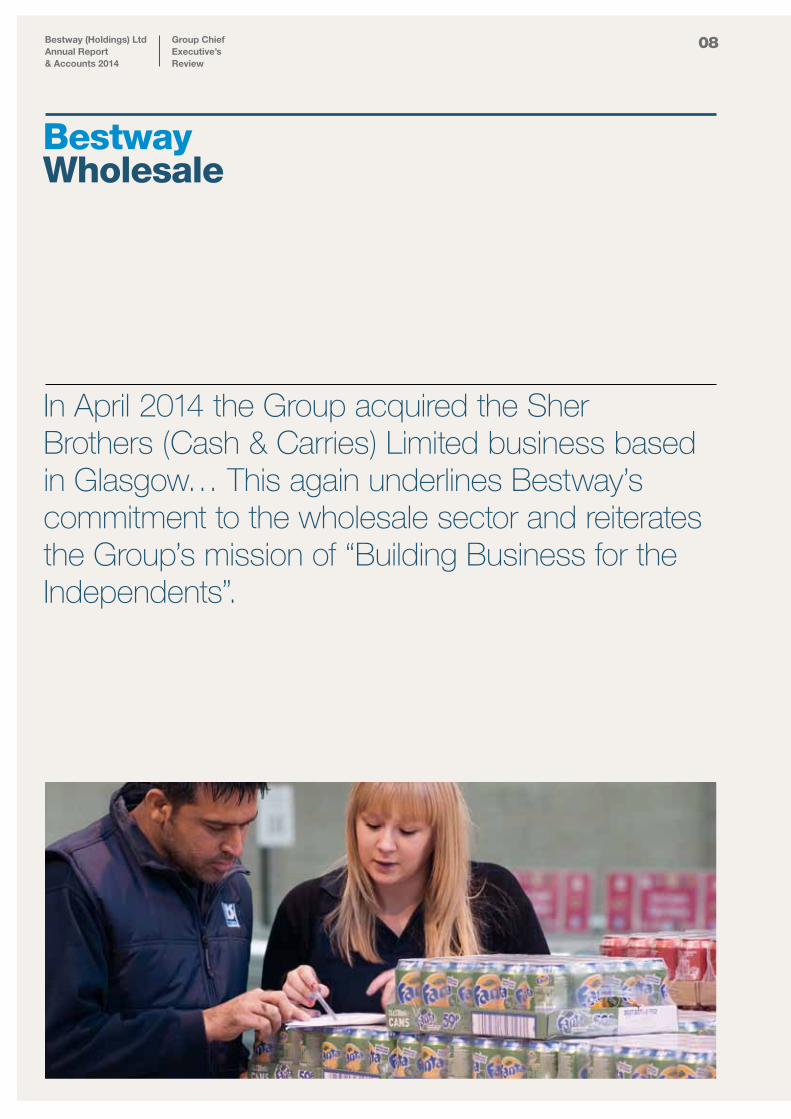
In April 2014 the Group acquired the Sher Brothers (Cash & Carries) Limited business based in Glasgow… This again underlines Bestway’s commitment to the wholesale sector and reiterates the Group’s mission of “Building Business for the Independents”.
08
Bestway Wholesale
09
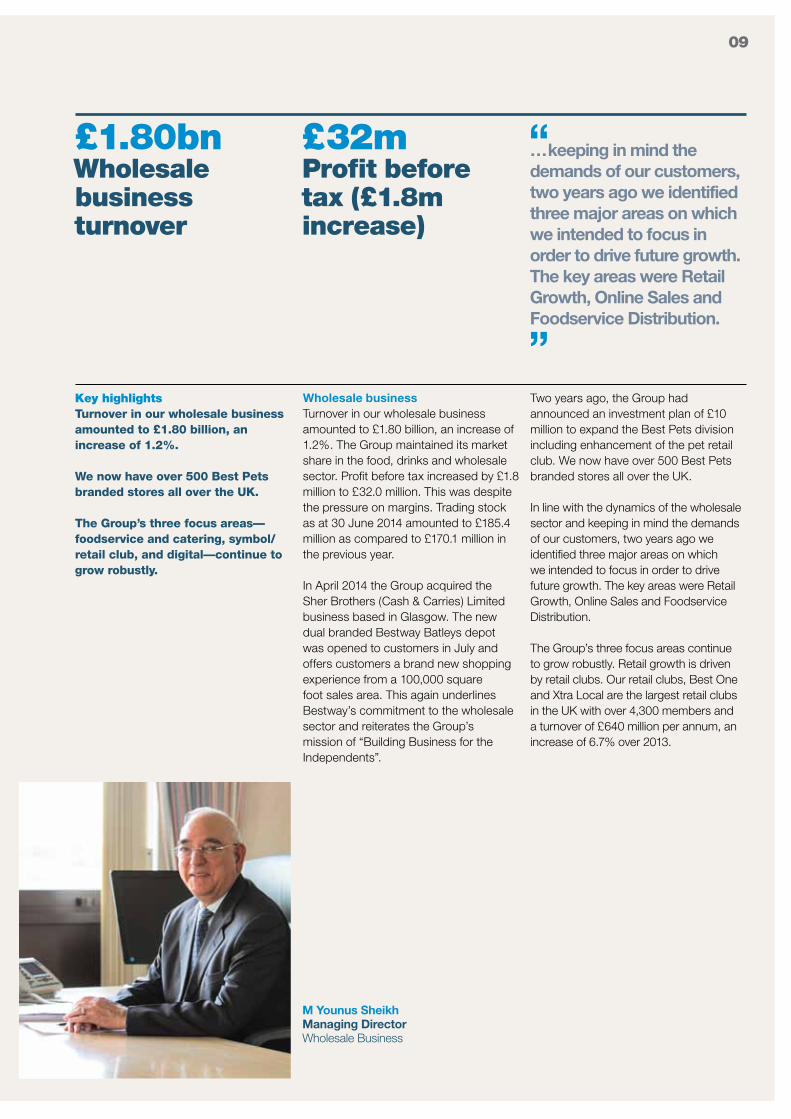
“ …keeping in mind the demands of our customers, two years ago we identified three major areas on which we intended to focus in order to drive future growth. The key areas were Retail Growth, Online Sales and Foodservice Distribution.
”
M Younus SheikhManaging DirectorWholesale Business
Wholesale business Turnover in our wholesale business amounted to £1.80 billion, an increase of 1.2%. The Group maintained its market share in the food, drinks and wholesale sector. Profit before tax increased by £1.8 million to £32.0 million. This was despite the pressure on margins. Trading stock as at 30 June 2014 amounted to £185.4 million as compared to £170.1 million in the previous year.
In April 2014 the Group acquired the Sher Brothers (Cash & Carries) Limited business based in Glasgow. The new dual branded Bestway Batleys depot was opened to customers in July and offers customers a brand new shopping experience from a 100,000 square foot sales area. This again underlines Bestway’s commitment to the wholesale sector and reiterates the Group’s mission of “Building Business for the Independents”.
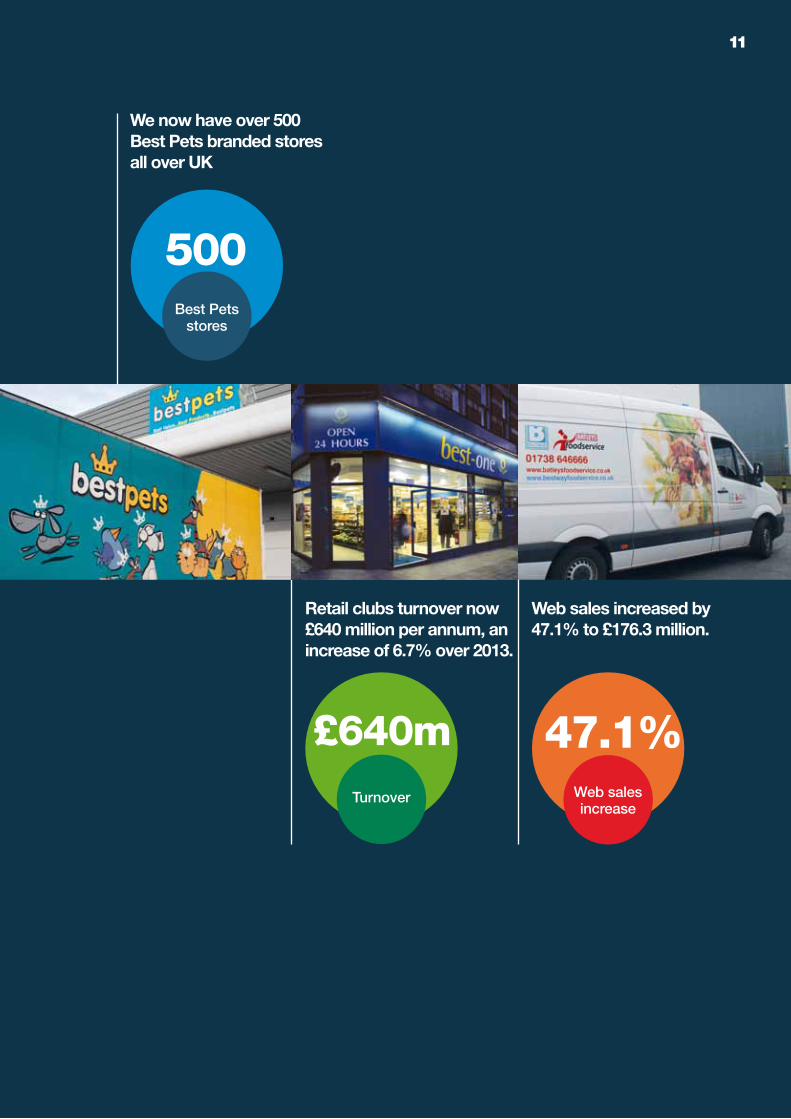
Two years ago, the Group had announced an investment plan of £10 million to expand the Best Pets division including enhancement of the pet retail club. We now have over 500 Best Pets branded stores all over the UK.
In line with the dynamics of the wholesale sector and keeping in mind the demands of our customers, two years ago we identified three major areas on which we intended to focus in order to drive future growth. The key areas were Retail Growth, Online Sales and Foodservice Distribution. The Group’s three focus areas continue to grow robustly. Retail growth is driven by retail clubs. Our retail clubs, Best One and Xtra Local are the largest retail clubs in the UK with over 4,300 members and a turnover of £640 million per annum, an increase of 6.7% over 2013.
Key highlightsTurnover in our wholesale business amounted to £1.80 billion, an increase of 1.2%. We now have over 500 Best Pets branded stores all over the UK. The Group’s three focus areas—foodservice and catering, symbol/retail club, and digital—continue to grow robustly.
£1.80bnWholesale businessturnover
£32mProfit before tax (£1.8m increase)
Bestway (Holdings) LtdAnnual Report & Accounts 2014
Group Chief Executive’s Review
10
Wholesale business (continued)In digital, our online business continues to grow with over 26,000 registered users of our websites. During the year under review, web sales increased by 47.1% to £176.3 million. We are the first wholesaler to introduce a fully functional smart phone app which quickly shot up the rankings to be amongst the top 10 apps in Apple’s [business section] App Store. The Group believes that the app will change customer shopping behaviour and to further reinforce our leadership in digital innovation, we are also now at the forefront of pioneering new technologies for the channel such as geo-fencing and ibeacons.
Bestway Batleys foodservice now has 23 contracts covering an extensive range of local authorities, NHS hospitals, schools, private ventures with another 22 tenders in place. During the year, the Group invested in re-launching its flagship catering own label brand, Essentially Catering. The new range includes over 50 everyday catering products and was made available to customers from February 2014. Foodservice turnover increased by 2.3% to £128.3 million.
Key highlightsOur retail clubs, Best One and Xtra Local are the largest retail clubs in the UK w h over 4,300 members and a turnover of £640 million per annum, an increase of 6.7% over 2013. During the year under review, web sales increased by 47.1% to £176.3 million. Foodservice turnover increased by 2.3% to £128.3 million.
We are the first wholesaler to introduce a fully functional smart phone app which quickly shot up the rankings to be amongst the top 10 apps in Apple’s [business section] App Store.
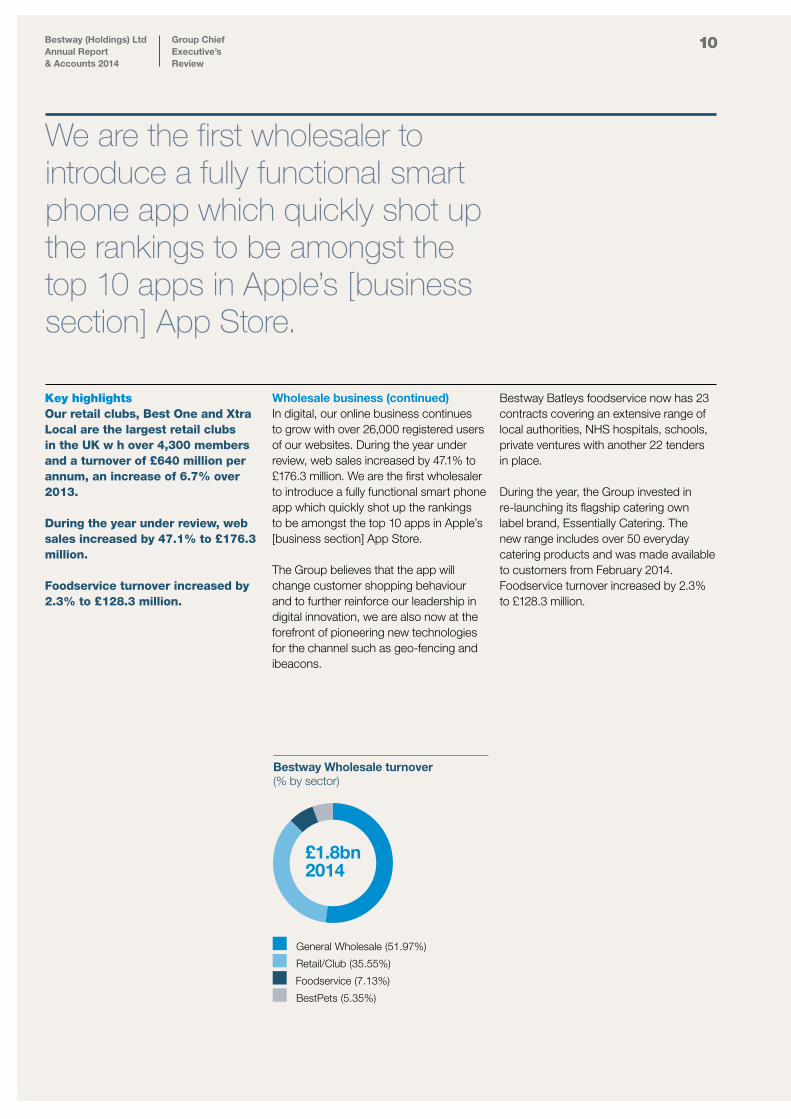
Bestway Wholesale turnover (% by sector)
Retail/Club (35.55%)
Foodservice (7.13%)
BestPets (5.35%)
General Wholesale (51.97%)
£1.8bn 2014
1111
Web sales increased by 47.1% to £176.3 million.
Retail clubs turnover now £640 million per annum, an increase of 6.7% over 2013.
500Best Pets
stores
47.1%Web sales increase
£640mTurnover
We now have over 500 Best Pets branded stores all over UK
12
Bestway Cement Limited (‘BCL’)During the period under review BCL despatches decreased by 1.5% to 4,371,841 tonnes from 4,437,731 tonnes in the corresponding prior period. Despite an increase in domestic demand, overall despatches decreased as export sales were adversely effected.
BCL’s domestic sales increased by 2.4% to 3,533,761 tonnes from 3,449,365 tonnes in 2013. Export sales decreased by 15.2% to 838,080 tonnes in 2014 as compared to 988,366 tonnes in 2013. Despite a decrease in exports to Afghanistan, we were able to maintain our position as the largest exporter of cement to Afghanistan.
Turnover net of excise duty, rebates and discounts to customers amounted to £174.5 million compared to £177.8 million for 2013, a decrease of 1.9%. Despite an increase in cement prices, overall turnover was down due to foreign exchange movements.
During the year, operating profits increased by 2.4% to £59.3 million as compared to £57.9 million in 2013.
BCL reduced its total debt by £48.9 million during the year. Consequently, financial charges decreased to £2.7 million from £6.0 million in 2013. Profit before tax registered an increase of 14.3% from £49.8 million in 2013 to £56.9 million for the year to 30 June 2014. For the year ended 30 June 2014, the company has paid a total dividend of £22.7 million. In July 2014, BCL entered into a binding agreement to acquire Lafarge Pakistan’s 2.4 million tonnes per annum cement plant located in Chakwal. Lafarge has an enterprise value of £193 million on a cash-free, debt-free basis. With this planned acquisition, BCL will become Pakistan’s largest cement manufacturer with an annual capacity of 8 million tonnes. We have recently launched a public tender and hope to complete this transaction by 27 April 2015.
Key highlightsDuring the year, operating profits increased by 2.4% to £59.3 million as compared to £57.9 million in 2013.
Profit before tax registered an increase of 14.3% from £49.8 million in 2013 to £56.9 million for the year to 30 June 2014.
£56.9m Profit before tax (14.3% increase)
Bestway (Holdings) LtdAnnual Report & Accounts 2014
Group Chief Executive’s Review
Bestway Cement Limited
“ BCL will become Pakistan’s largest cement manufacturer with an annual capacity of 8 million tonnes.
”
£59.3operating profit increased by 2.4%
m

13
“ In July 2014, BCL entered into a binding agreement to acquire Lafarge Pakistan’s 2.4 million tonnes per annum cement plant located in Chakwal.
”
14
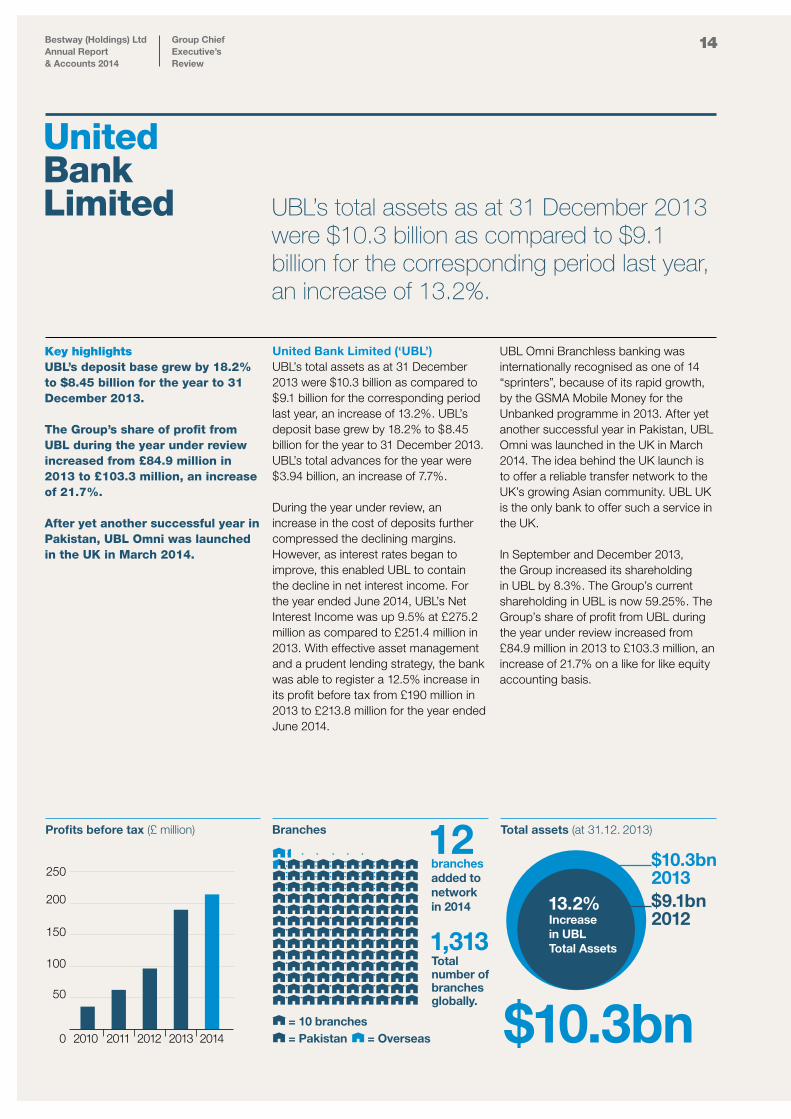
United Bank Limited (‘UBL’) UBL’s total assets as at 31 December 2013 were $10.3 billion as compared to $9.1 billion for the corresponding period last year, an increase of 13.2%. UBL’s deposit base grew by 18.2% to $8.45 billion for the year to 31 December 2013. UBL’s total advances for the year were $3.94 billion, an increase of 7.7%.
During the year under review, an increase in the cost of deposits further compressed the declining margins. However, as interest rates began to improve, this enabled UBL to contain the decline in net interest income. For the year ended June 2014, UBL’s Net Interest Income was up 9.5% at £275.2 million as compared to £251.4 million in 2013. With effective asset management and a prudent lending strategy, the bank was able to register a 12.5% increase in its profit before tax from £190 million in 2013 to £213.8 million for the year ended June 2014.
UBL Omni Branchless banking was internationally recognised as one of 14 “sprinters”, because of its rapid growth, by the GSMA Mobile Money for the Unbanked programme in 2013. After yet another successful year in Pakistan, UBL Omni was launched in the UK in March 2014. The idea behind the UK launch is to offer a reliable transfer network to the UK’s growing Asian community. UBL UK is the only bank to offer such a service in the UK. In September and December 2013, the Group increased its shareholding in UBL by 8.3%. The Group’s current shareholding in UBL is now 59.25%. The Group’s share of profit from UBL during the year under review increased from £84.9 million in 2013 to £103.3 million, an increase of 21.7% on a like for like equity accounting basis.
Key highlightsUBL’s deposit base grew by 18.2% to $8.45 billion for the year to 31 December 2013. The Group’s share of profit from UBL during the year under review increased from £84.9 million in 2013 to £103.3 million, an increase of 21.7%. After yet another successful year in Pakistan, UBL Omni was launched in the UK in March 2014.
Bestway (Holdings) LtdAnnual Report & Accounts 2014
Group Chief Executive’s Review
United Bank Limited UBL’s total assets as at 31 December 2013
were $10.3 billion as compared to $9.1 billion for the corresponding period last year, an increase of 13.2%.
Branches Total assets (at 31.12. 2013)
branches added to network in 2014
Total number of branchesglobally.
= 10 branches= Pakistan = Overseas
12
1,313
$10.3bn
$10.3bn 2013$9.1bn 2012
13.2%Increasein UBL Total Assets
Profits before tax (£ million)
200
250
150
100
50
0 2010 2011 2012 2013 2014
Bestway (Holdings) LtdAnnual report & Accounts 2014
Group Chief Executive’s
15
“ UBL Omni Branchless banking was internationally recognised as one of 14 “sprinters”, because of its rapid growth, by the GSMA Mobile Money for the Unbanked programme in 2013.
”
Group Chief Executive’s Review
Bestway (Holdings) LtdAnnual Report & Accounts 2014
16
The Co-operative Pharmacy The Group has ventured into the Pharmacy sector by acquiring The Co-operative Pharmacy for a purchase price of £620 million. The transaction was completed in October 2014. During the sale process, Bestway saw off competition from Lloyds Pharmacy and Alliance Boots. The Co-operative Pharmacy is the third largest pharmacy business in the UK. It has over 770 branches and over 7,000 employees. Our initial focus remains on rebranding the pharmacy brand, followed by capital investment in the renovation and relocation of existing branches as well as acquiring more pharmacies going forward.
Principal risks & uncertainties Working capital, capital expenditure and major acquisitions are funded by the Group’s cash flows and banking facilities. In light of the prevalent economic environment, regular monitoring of banking requirements, cash flow and net debt is undertaken.
One of the commercial risks faced by the Group is the increasing influence of multiples in the wholesale sector, which consequently imposes pressure on margins. Another risk faced by the Group’s wholesale business is the duty fraud on alcohol.
Due to the Group’s presence in Pakistan, it is exposed to foreign exchange risk. Additionally, the increase in power costs in Pakistan continues to pose a threat to the cement sector.
Key performance indicators The Board of Directors uses many performance indicators, both financial and non-financial, to monitor the Group’s position. Among the financial performance indicators within the wholesale business, the most important ones are gross profit margin, sales per depot, sales per department, wages per depot, stock availability and stock levels.
Financial performance indicators in the cement business are net retention price, daily despatches and cost of production. Financial performance indicators in the banking sector are return on assets, return on equity and net interest margin. The non-financial performance indicators are staff turnover, staff / supplier / customer satisfaction, health and safety reports, among others. The Board is of the belief that the monitoring of the above-mentioned indicators is an effective aspect of business performance review. Future outlook The focus of the Group’s wholesale business on organic growth is supported by investments in existing and new initiatives. Despite the tough trading conditions, we are confident that we will continue to provide maximum support to our customers by delivering the best prices, value and service to them. In Pakistan we remain committed to our long term investments. UBL continues its focus on managing its asset portfolio, improving asset quality
and expanding its network both through branches and through Omni branchless banking.
We see challenges ahead of us both in the UK and in Pakistan as the respective economies go through an economic stabilisation phase. We will continue to enhance our market share in UK who-lesale and pharmacy sectors and in the Pakistan cement and banking sectors whenever suitable opportunities arise.
In the last twelve months we have continued to demonstrate the strength of our business model and to create value for all our stakeholders. This has been accomplished with the continued support of our employees and our highly successful relationships with suppliers and customers.
I would like to thank all our suppliers and employees for their commitment to the business. I would also like to thank my fellow directors for their contribution to our strategic deliberations. Z M Choudrey, BA (Hons), FCAGroup Chief Executive17 February 2015
The Group has ventured into the Pharmacy sector by acquiring The Co-operative Pharmacy for a purchase price of £620 million.
17
Batleys
Central Distribution
Bestway New (2014)
BestPets
Bestway Wholesale: depots
Global presence
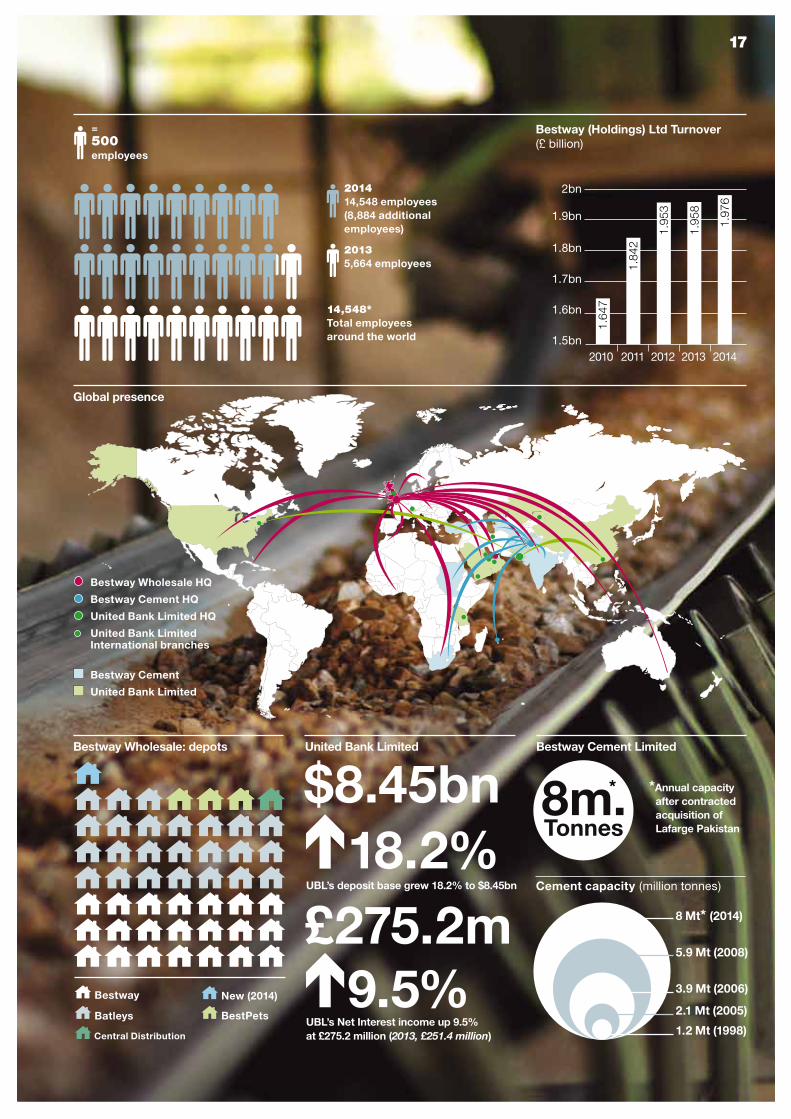
2013 5,664 employees
2014 14,548 employees (8,884 additional employees)
14,548* Total employees around the world
United Bank Limited
UBL’s deposit base grew 18.2% to $8.45bn
UBL’s Net Interest income up 9.5% at £275.2 million (2013, £251.4 million)
$8.45bn
£275.2m18.2%
9.5%
=500 employees
Bestway (Holdings) Ltd Turnover (£ billion)
1.9bn
2bn
1.8bn
1.7bn
1.6bn
1.5bn2010 2011 2012 2013 2014
1.97
6
1.95
8
1.95
3
1.84
2
1.64
7
*Annual capacity after contracted acquisition of Lafarge Pakistan
Bestway Cement Limited
Cement capacity (million tonnes)
8 Mt* (2014)
5.9 Mt (2008)
3.9 Mt (2006)
2.1 Mt (2005)
1.2 Mt (1998)
Bestway Wholesale HQ
Bestway Cement HQ
United Bank Limited HQ
United Bank Limited International branches
Bestway Cement
United Bank Limited
*
Director’s Report
18Bestway (Holdings) LtdAnnual Report & Accounts 2014
Director’s Report
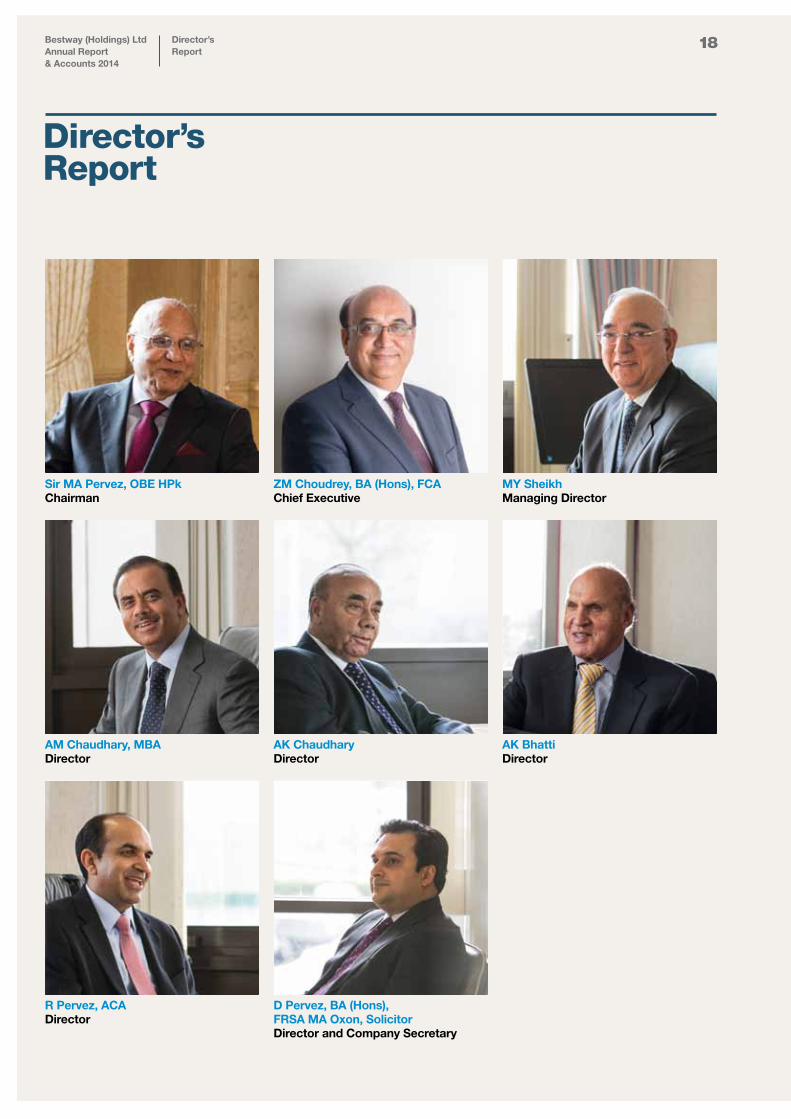
R Pervez, ACADirector
D Pervez, BA (Hons),FRSA MA Oxon, SolicitorDirector and Company Secretary
AM Chaudhary, MBADirector
AK ChaudharyDirector
AK Bhatti Director
Sir MA Pervez, OBE HPkChairman
ZM Choudrey, BA (Hons), FCAChief Executive
MY SheikhManaging Director
The directors submit their report and the financial statements of Bestway (Holdings) Limited for the year ended 30 June 2014.
Principal activities The principal activity of the Group during the year was the operation of cash and carry warehouses in the UK supplying groceries, tobacco, wines and spirits, beers, and other household goods, together with property investment in the UK, the production and sale of cement in Pakistan, commercial and retail banking primarily in Pakistan and the Gulf and general insurance through its subsidiary UBL Insurers Limited. Review of the business and future developments A detailed review of the business and an indication of likely future developments are contained in the Strategic Report on pages 2 to 17. Results and dividends The profit for the year after taxation was £168.2 million (2013: £109.4 million). The directors do not recommend the payment of a dividend (2013: £nil). DirectorsThe directors who held office during the year were as follows:
Sir MA Pervez, OBE HPkZM Choudrey, BA (Hons), FCA MY Sheikh AK Bhatti AK ChaudharyAM Chaudhary, MBAR Pervez, ACAD Pervez, BA (Hons), FRSA MA Oxon, Solicitor Financial instruments The Group’s policy is to finance its operations on a medium term basis from retained profits, inter-company borrowings and bank facilities. Additional uncommitted borrowing and overdraft facilities are utilised for short term financing requirements.
The financial instruments utilised by the Group are borrowings, short-term cash deposits and items such as trade creditors which arise directly from its operations. Borrowing and deposit facilities are on a floating rate basis. Further details are included in notes 16, 17 and 22. Employee involvement and disabled persons The Group informs and consults regularly with employees on matters affecting their interests with a view to achieving a common awareness of the financial and economic factors affecting its performance. The views expressed by employees have been taken into account when making decisions where appropriate.
The Group is an equal opportunities employer and its policies for the recruitment, training, career development and promotion of employees are based on the relevant merits and abilities of the individuals concerned. It recognises its responsibilities towards disabled persons and gives full and fair consideration to applications for employment from them and, so far as particular disabilities permit, will give continued employment to any existing employee who becomes disabled. It is the policy of the Group that the training, career development and promotion of disabled persons should, as far as possible, be identical to that of other employees. Policy and practice on payment of creditors The Group aims to settle supplier accounts in accordance with their individual terms of business, and as such no specific code or standard on payment practice is followed. At the year end there were 38 days (2013: 39 days) purchases in trade creditors.
Donations The Group made charitable donations of £705,000 (2013: £876,000) to the Bestway Foundation whose objectives are the advancement of education, the relief of sickness, the preservation and protection of health and the relief of suffering of the old, disabled and needy. Donations of £8,000 (2013: £11,300) were made to other charities. The Group made political donations of £71,000 (2013: £67,000) to the Conservative party.
Disclosure of information to auditors The directors who held office at the date of the approval of this directors’ report confirm that, so far as they are each aware, there is no relevant audit information of which the Company’s auditor is unaware, and each director has taken all steps that he ought to have taken as a director to make himself aware of any relevant audit information and to establish that the Company’s auditor is aware of that information. Auditor Pursuant to Section 487 of the Companies Act 2006, the auditor will be deemed to be reappointed and KPMG LLP will therefore continue in office.
By order of the board
Z M Choudrey, BA (Hons), FCA Director 17 February 2015 2 Abbey Road, Park RoyalLondon NW10 7BW
Bestway (Holdings) LtdAnnual Report & Accounts 2014
Director’s Report
19
The directors are responsible for preparing the Strategic Report, the Directors’ Report and the financial statements in accordance with applicable law and regulations.
Company law requires the directors to prepare financial statements for each financial year. Under that law they have elected to prepare the group and parent company financial statements in accordance with UK Accounting Standards and applicable law (UK Generally Accepted Accounting Practice).
Under company law the directors must not approve the financial statements unless they are satisfied that they give a true and fair view of the state of affairs of the group and parent company and of their profit or loss for that period.
In preparing each of the group and parent company financial statements, the directors are required to:
• selectsuitableaccountingpoliciesand then apply them consistently;
• makejudgmentsandestimatesthat are reasonable and prudent;
• statewhetherapplicableUK Accounting Standards have been followed, subject to any material departures disclosed and explained in the financial statements;
• preparethefinancialstatementson the going concern basis unless it is inappropriate to presume that the group and the parent company will continue in business.
The directors are responsible for keeping adequate accounting records that are sufficient to show and explain the parent company’s transactions and disclose with reasonable accuracy at any time the financial position of the parent company and enable them to ensure that its financial statements comply with the Companies Act 2006. They have general responsibility for taking such steps as are reasonably open to them to safeguard the assets of the group and to prevent and detect fraud and other irregularities.
20Bestway (Holdings) LtdAnnual Report & Accounts 2014
Statement of Directors’ responsibilities
Statement of directors’ responsibilities in respect of the Strategic Report, Directors’ Report and the financial statements
We have audited the financial statements of Bestway (Holdings) Limited for the year ended 30 June 2014 set out on pages 24 to 95. The financial reporting framework that has been applied in their preparation is applicable law and UK Accounting Standards (UK Generally Accepted Accounting Practice).
This report is made solely to the company’s members, as a body, in accordance with Chapter 3 of Part 16 of the Companies Act 2006. Our audit work has been undertaken so that we might state to the company’s members those matters we are required to state to them in an auditor’s report and for no other purpose. To the fullest extent permitted by law, we do not accept or assume responsibility to anyone other than the company and the company’s members, as a body, for our audit work, for this report, or for the opinions we have formed.
Respective responsibilities of directors and auditor
As explained more fully in the Directors’ Responsibilities Statement set out on page 20, the directors are responsible for the preparation of the financial statements and for being satisfied that they give a true and fair view. Our responsibility is to audit, and express an opinion on, the financial statements in accordance with applicable law and International Standards on Auditing (UK
and Ireland). Those standards require us to comply with the Auditing Practices Board’s Ethical Standards for Auditors.
Scope of the audit of the financial statements
A description of the scope of an audit of financial statements is provided on the Financial Reporting Council’s website at www.frc.org.uk/auditscopeukprivate.
Opinion on financial statements
In our opinion the financial statements:
• giveatrueandfairviewofthestateof the group’s and of the parent company’s affairs as at 30 June 2014 and of the group’s profit for the year then ended;
• havebeenproperlypreparedin accordance with UK Generally Accepted Accounting Practice; and
• havebeenpreparedinaccordance with the requirements of the Companies Act 2006.
Opinion on other matter prescribed by the Companies Act 2006
In our opinion the information given in the Strategic Report and the Directors’ Report for the financial year for which the financial statements are prepared is consistent with the financial statements.
Matters on which we are required to report by exception
We have nothing to report in respect of the following matters where the Companies Act 2006 requires us to report to you if, in our opinion:
• adequateaccountingrecordshavenot been kept by the parent company, or returns adequate for our audit have not been received from branches not visited by us; or
• theparentcompanyfinancial statements are not in agreement with the accounting records and returns; or
• certaindisclosuresofdirectors’ remuneration specified by law are not made; or
• wehavenotreceivedalltheinformation and explanations we require for our audit.
KPMG LLP Statutory Auditor Chartered Accountants8 Salisbury SquareLondon EC4Y 8BB, United Kingdom
17th February 2015
Bestway (Holdings) LtdAnnual Report & Accounts 2014
Independent Auditor’s report
21
Independent Auditor’s Report to the members of Bestway (Holdings) Limited

Accounts
24Bestway (Holdings) LtdAnnual Report & Accounts 2014
Consolidated profit and loss account
Consolidated profit and loss accountfor the year ended 30 June 2014
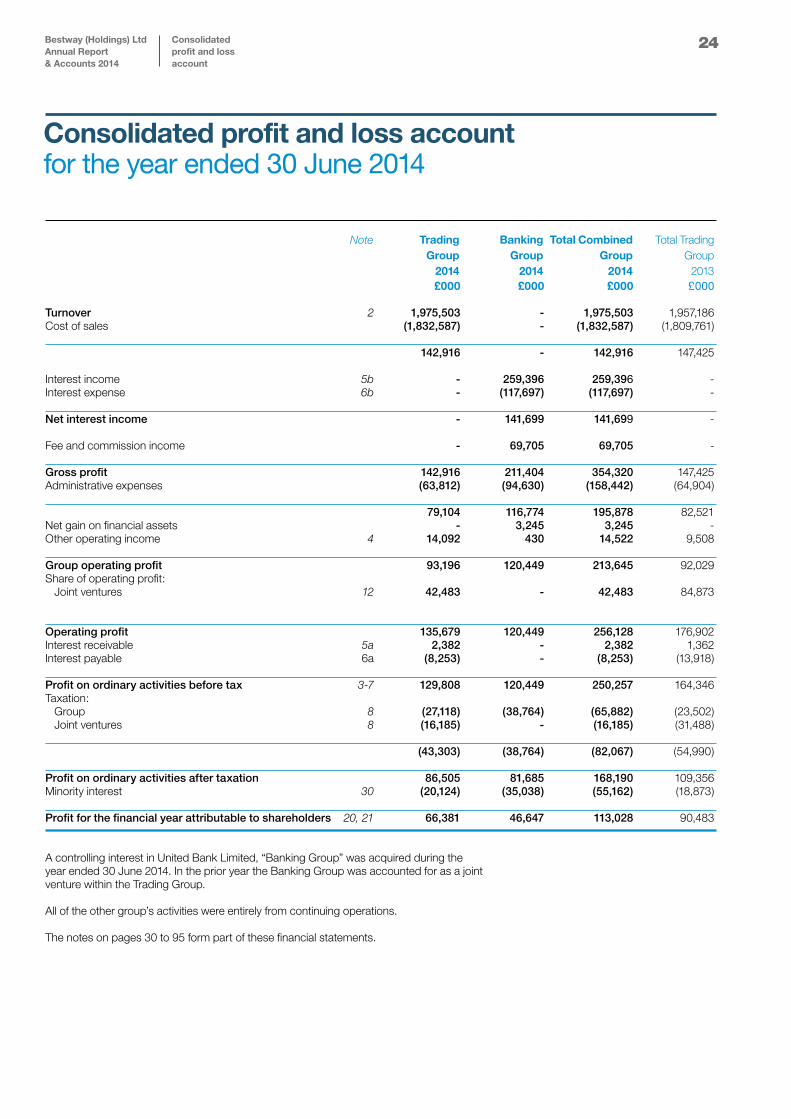
£000 £000 £000 £000 Turnover 2 1,975,503 - 1,975,503 1,957,186Cost of sales (1,832,587) - (1,832,587) (1,809,761) 142,916 - 142,916 147,425 Interest income 5b - 259,396 259,396 -Interest expense 6b - (117,697) (117,697) - Net interest income - 141,699 141,699 - Fee and commission income - 69,705 69,705 - Gross profit 142,916 211,404 354,320 147,425Administrative expenses (63,812) (94,630) (158,442) (64,904) 79,104 116,774 195,878 82,521Net gain on financial assets - 3,245 3,245 -Other operating income 4 14,092 430 14,522 9,508 Group operating profit 93,196 120,449 213,645 92,029Share of operating profit: Joint ventures 12 42,483 - 42,483 84,873 Operating profit 135,679 120,449 256,128 176,902Interest receivable 5a 2,382 - 2,382 1,362Interest payable 6a (8,253) - (8,253) (13,918) Profit on ordinary activities before tax 3-7 129,808 120,449 250,257 164,346Taxation: Group 8 (27,118) (38,764) (65,882) (23,502) Joint ventures 8 (16,185) - (16,185) (31,488) (43,303) (38,764) (82,067) (54,990) Profit on ordinary activities after taxation 86,505 81,685 168,190 109,356Minority interest 30 (20,124) (35,038) (55,162) (18,873) Profit for the financial year attributable to shareholders 20, 21 66,381 46,647 113,028 90,483
A controlling interest in United Bank Limited, “Banking Group” was acquired during the year ended 30 June 2014. In the prior year the Banking Group was accounted for as a joint venture within the Trading Group. All of the other group’s activities were entirely from continuing operations. The notes on pages 30 to 95 form part of these financial statements.
Note Trading Group
2014
Banking Group
2014
Total Combined Group
2014
Total Trading Group
2013
25Bestway (Holdings) LtdAnnual Report & Accounts 2014
Consolidated balance sheet
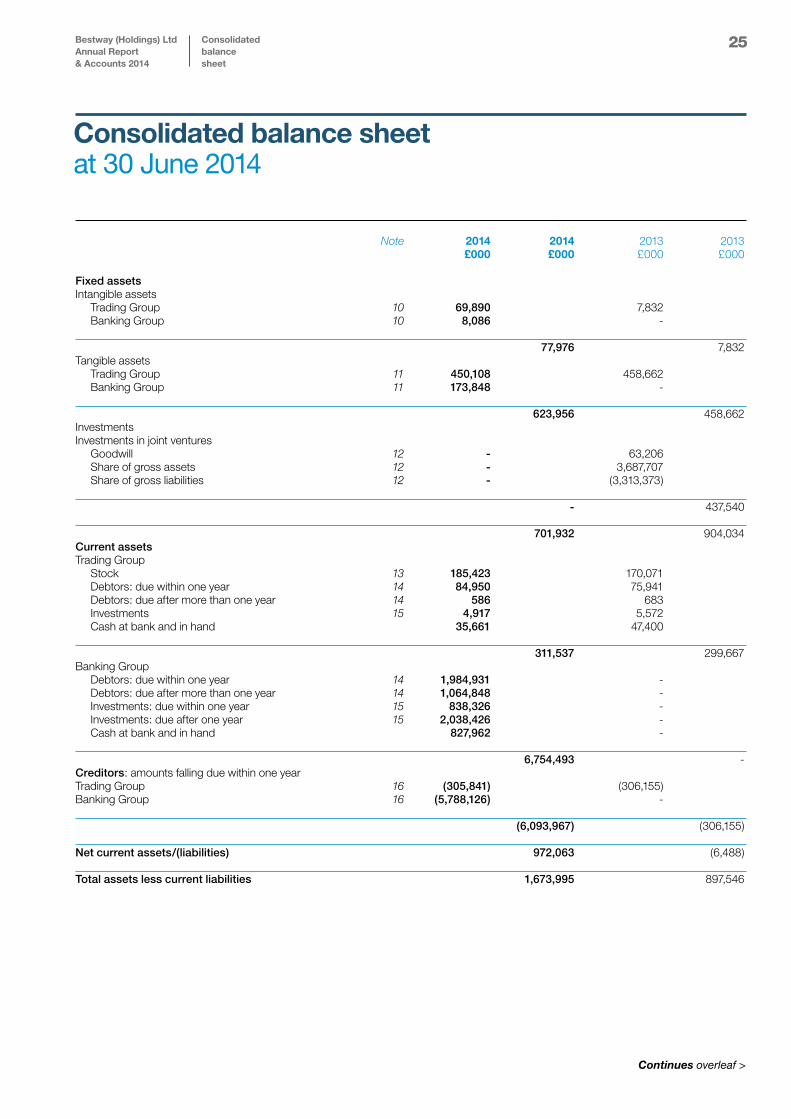
Consolidated balance sheetat 30 June 2014
Note 2014 2014 2013 2013 £000 £000 £000 £000 Fixed assets Intangible assets Trading Group 10 69,890 7,832 Banking Group 10 8,086 - 77,976 7,832Tangible assets Trading Group 11 450,108 458,662 Banking Group 11 173,848 - 623,956 458,662Investments Investments in joint ventures Goodwill 12 - 63,206 Share of gross assets 12 - 3,687,707 Share of gross liabilities 12 - (3,313,373) - 437,540 701,932 904,034Current assets Trading Group Stock 13 185,423 170,071 Debtors: due within one year 14 84,950 75,941 Debtors: due after more than one year 14 586 683 Investments 15 4,917 5,572 Cash at bank and in hand 35,661 47,400 311,537 299,667Banking Group Debtors: due within one year 14 1,984,931 - Debtors: due after more than one year 14 1,064,848 - Investments: due within one year 15 838,326 - Investments: due after one year 15 2,038,426 - Cash at bank and in hand 827,962 - 6,754,493 -Creditors: amounts falling due within one year Trading Group 16 (305,841) (306,155) Banking Group 16 (5,788,126) - (6,093,967) (306,155) Net current assets/(liabilities) 972,063 (6,488) Total assets less current liabilities 1,673,995 897,546
Continues overleaf >
26Bestway (Holdings) LtdAnnual Report & Accounts 2014
Consolidated balance sheet
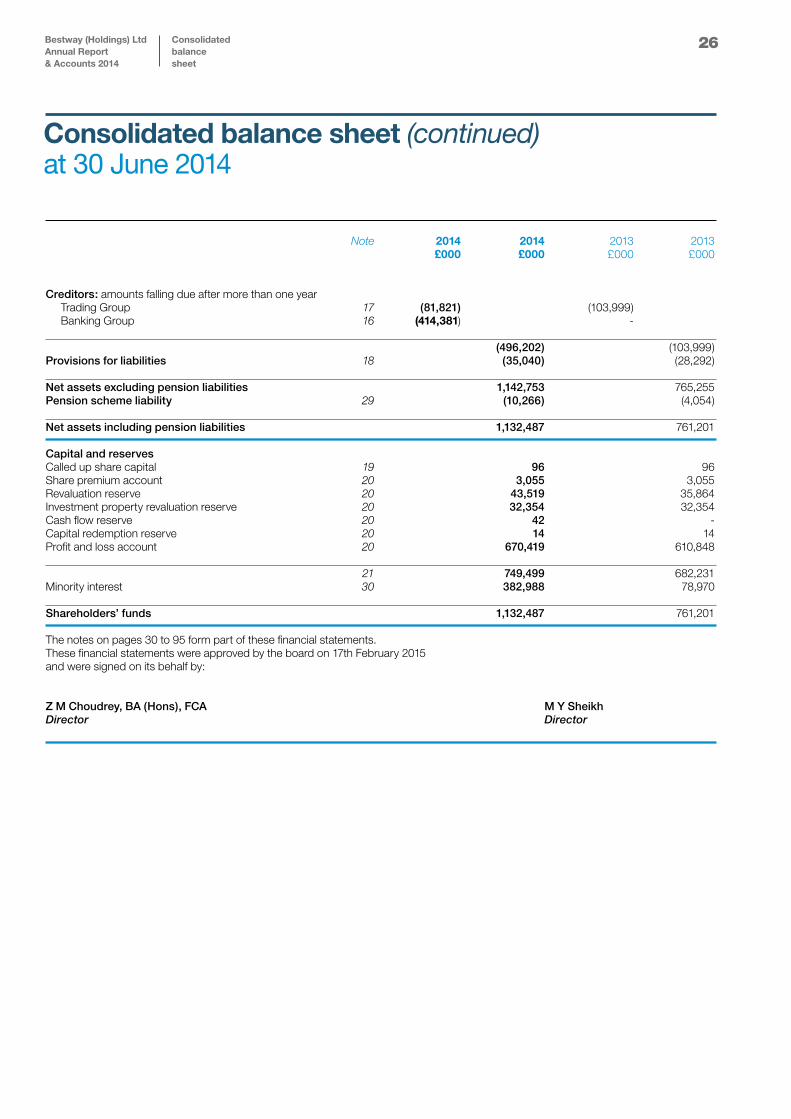
Consolidated balance sheet (continued)at 30 June 2014
Note 2014 2014 2013 2013 £000 £000 £000 £000
Creditors: amounts falling due after more than one year Trading Group 17 (81,821) (103,999) Banking Group 16 (414,381) - (496,202) (103,999)Provisions for liabilities 18 (35,040) (28,292) Net assets excluding pension liabilities 1,142,753 765,255Pension scheme liability 29 (10,266) (4,054) Net assets including pension liabilities 1,132,487 761,201 Capital and reserves Called up share capital 19 96 96Share premium account 20 3,055 3,055Revaluation reserve 20 43,519 35,864Investment property revaluation reserve 20 32,354 32,354Cash flow reserve 20 42 -Capital redemption reserve 20 14 14Profit and loss account 20 670,419 610,848 21 749,499 682,231Minority interest 30 382,988 78,970 Shareholders’ funds 1,132,487 761,201 The notes on pages 30 to 95 form part of these financial statements.These financial statements were approved by the board on 17th February 2015 and were signed on its behalf by: Z M Choudrey, BA (Hons), FCA M Y Sheikh Director Director
27Bestway (Holdings) LtdAnnual Report & Accounts 2014
Company balance sheet
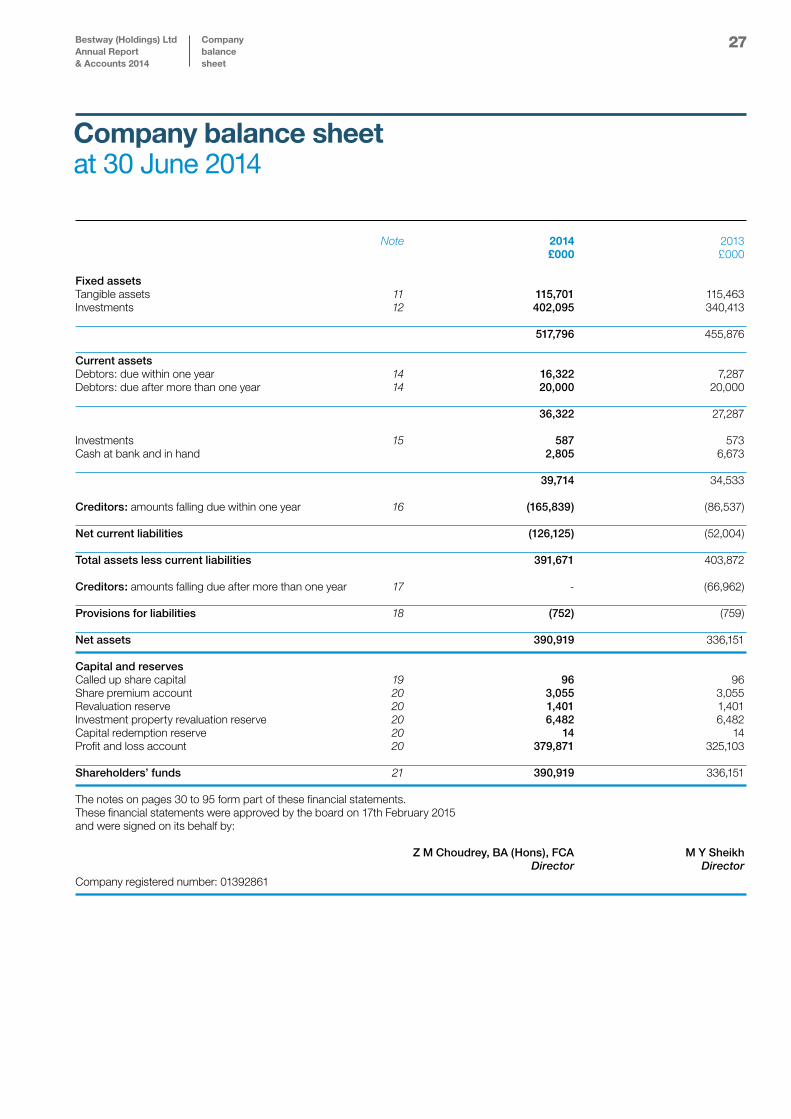
Company balance sheetat 30 June 2014
Note 2014 2013 £000 £000 Fixed assets Tangible assets 11 115,701 115,463Investments 12 402,095 340,413 517,796 455,876 Current assets Debtors: due within one year 14 16,322 7,287Debtors: due after more than one year 14 20,000 20,000 36,322 27,287 Investments 15 587 573Cash at bank and in hand 2,805 6,673 39,714 34,533 Creditors: amounts falling due within one year 16 (165,839) (86,537) Net current liabilities (126,125) (52,004) Total assets less current liabilities 391,671 403,872 Creditors: amounts falling due after more than one year 17 - (66,962) Provisions for liabilities 18 (752) (759) Net assets 390,919 336,151 Capital and reserves Called up share capital 19 96 96Share premium account 20 3,055 3,055Revaluation reserve 20 1,401 1,401Investment property revaluation reserve 20 6,482 6,482Capital redemption reserve 20 14 14Profit and loss account 20 379,871 325,103 Shareholders’ funds 21 390,919 336,151
The notes on pages 30 to 95 form part of these financial statements.These financial statements were approved by the board on 17th February 2015 and were signed on its behalf by:
Z M Choudrey, BA (Hons), FCA M Y Sheikh Director DirectorCompany registered number: 01392861
28Bestway (Holdings) LtdAnnual Report & Accounts 2014
Consolidated cash flow statement
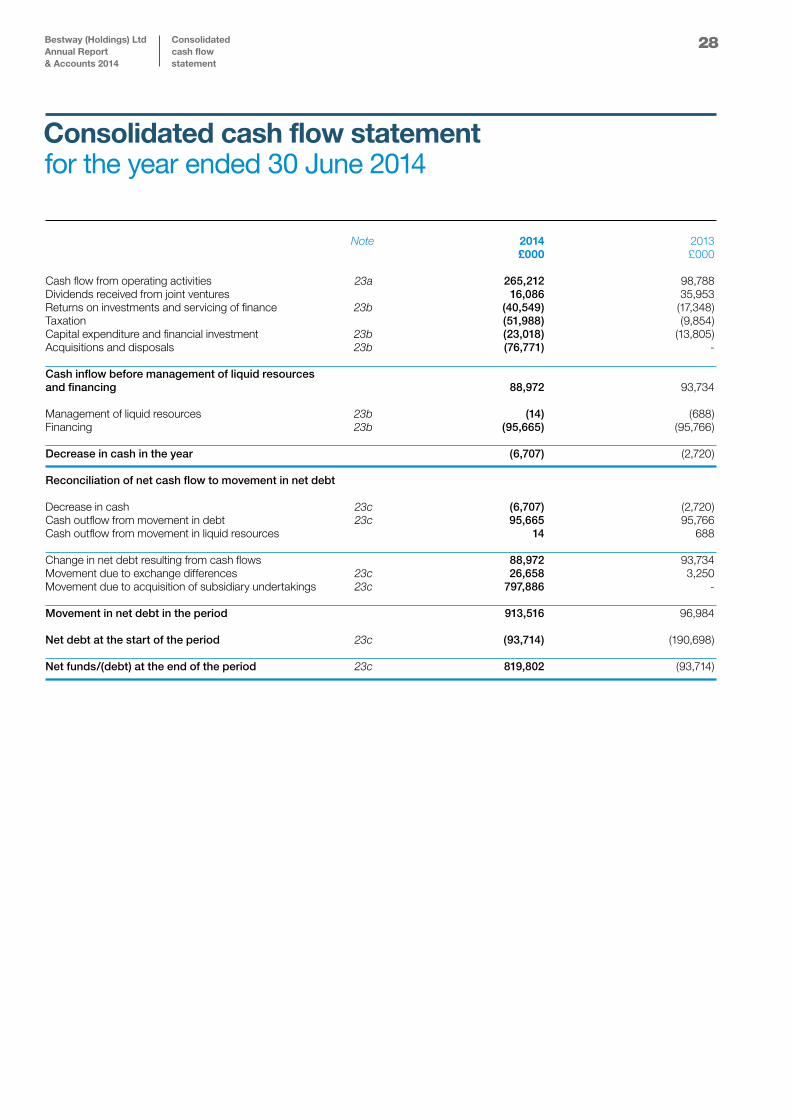
Consolidated cash flow statement for the year ended 30 June 2014
Note 2014 2013 £000 £000 Cash flow from operating activities 23a 265,212 98,788Dividends received from joint ventures 16,086 35,953Returns on investments and servicing of finance 23b (40,549) (17,348)Taxation (51,988) (9,854)Capital expenditure and financial investment 23b (23,018) (13,805)Acquisitions and disposals 23b (76,771) - Cash inflow before management of liquid resources and financing 88,972 93,734 Management of liquid resources 23b (14) (688)Financing 23b (95,665) (95,766) Decrease in cash in the year (6,707) (2,720) Reconciliation of net cash flow to movement in net debt Decrease in cash 23c (6,707) (2,720)Cash outflow from movement in debt 23c 95,665 95,766Cash outflow from movement in liquid resources 14 688 Change in net debt resulting from cash flows 88,972 93,734Movement due to exchange differences 23c 26,658 3,250Movement due to acquisition of subsidiary undertakings 23c 797,886 - Movement in net debt in the period 913,516 96,984 Net debt at the start of the period 23c (93,714) (190,698) Net funds/(debt) at the end of the period 23c 819,802 (93,714)
29Bestway (Holdings) LtdAnnual Report & Accounts 2014
Company balance sheet
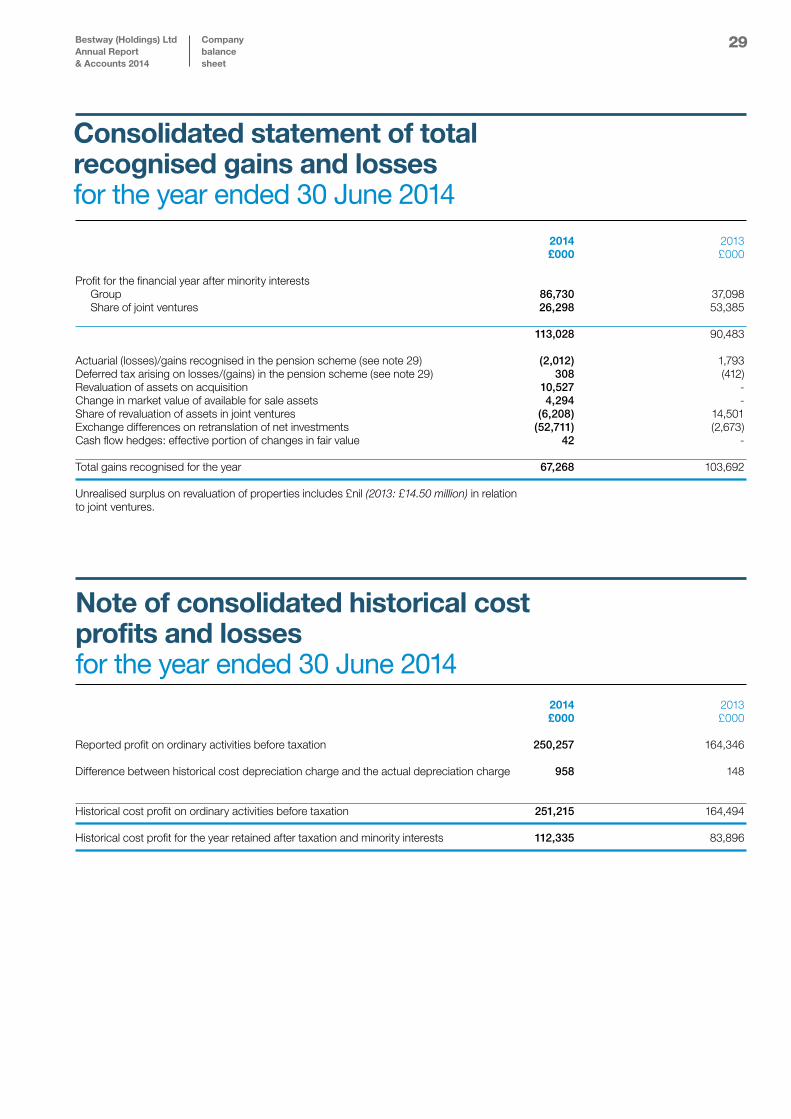
Consolidated statement of total recognised gains and lossesfor the year ended 30 June 2014
Note of consolidated historical cost profits and lossesfor the year ended 30 June 2014 2014 2013 £000 £000 Reported profit on ordinary activities before taxation 250,257 164,346 Difference between historical cost depreciation charge and the actual depreciation charge 958 148
Historical cost profit on ordinary activities before taxation 251,215 164,494 Historical cost profit for the year retained after taxation and minority interests 112,335 83,896
2014 2013 £000 £000 Profit for the financial year after minority interests Group 86,730 37,098 Share of joint ventures 26,298 53,385 113,028 90,483 Actuarial (losses)/gains recognised in the pension scheme (see note 29) (2,012) 1,793Deferred tax arising on losses/(gains) in the pension scheme (see note 29) 308 (412)Revaluation of assets on acquisition 10,527 -Change in market value of available for sale assets 4,294 -Share of revaluation of assets in joint ventures (6,208) 14,501Exchange differences on retranslation of net investments (52,711) (2,673)Cash flow hedges: effective portion of changes in fair value 42 - Total gains recognised for the year 67,268 103,692 Unrealised surplus on revaluation of properties includes £nil (2013: £14.50 million) in relation to joint ventures.
30
Overview Bestway (Holdings) Limited is a private company incorporated in the United Kingdom (Registration number 01392861). The company is domiciled in the United Kingdom and its registered address is 2 Abbey Road, Park Royal, London, NW10 7BW. The nature of the Group’s operations and its principal activities are set out in the Strategic and Directors’ Reports.
1. Accounting policies The following accounting policies have been applied consistently in dealing with items which are considered material in relation to the Group’s financial statements, except as noted below.
Basis of preparationThe financial statements have been prepared in accordance with UK Generally Accepted Accounting Practice and under the historical cost accounting rules, modified to include the revaluation of certain land and buildings/certain assets. The Group has applied the transitional rules contained in FRS 15 Tangible fixed assets to retain previous valuations as the basis on which certain of these assets are held. The Group has adopted FRS 26 Financial Instruments: Measurement and FRS 29 Financial Instruments Disclosures. The risks noted in the Strategic Report are those known to the Directors at the date of this Report which the Directors consider to be material to the Group, but these do not necessarily comprise all the risks to which the Group is exposed. In particular, the Group’s performance could be adversely affected by poor economic conditions. Additional risks and uncertainties currently unknown to the Directors, or which the Directors currently believe are immaterial, may also have a material adverse effect on the business, financial condition or prospects of the Group. The Group accounts have been prepared on a going concern basis. The directors are confident that the group has access to sufficient financial resources to meet its liabilities as they fall due. The Directors have considered compliance with covenants within certain UK loan agreements and are satisfied that no events of default have occurred. The Directors are confident that Bestway Cement Limited can meet capital and interest payments as they fall due, and that no default events will be experienced in the foreseeable future. Basis of consolidationThe Group financial statements consolidate the financial statements of Bestway (Holdings) Limited and all its subsidiaries made up to 30 June 2014. Under section 408 of the Companies Act 2006, the company is exempt from the requirement to present its own profit and loss account.
During the period, the Group acquired an additional shareholding in United Bank Limited. As at the period end, had a shareholding of 59.25%. Due to the size and significance of the United Bank Limited, in order to provide users of the financial statements within clarity the financial statements, the results have been separately disclosed between those of the “Trading Group” and those of the “Banking Group”.
Accounting for acquisitions and disposalsThe results of businesses acquired or disposed of are consolidated from or to the effective date of acquisition or disposal. On the acquisition of subsidiary undertakings or businesses, the acquisition cost is allocated against the fair value of net assets acquired, after adjustments to bring accounting policies into line with the Group. Joint ventureA joint venture is an undertaking in which the Group has a long-term interest and over which it exercises joint control. The Group’s share of the profits of the joint venture is included in the consolidated profit and loss account and its interest in their net assets is included in investments in the consolidated balance sheet. Goodwill arising on the acquisition of a joint venture is included in the carrying value of the investment but is accounted for as detailed below. Goodwill and amortisationGoodwill represents the excess or shortfall of the cost of an acquisition over the fair value attributed to the net assets at acquisition which is capitalised. The useful economic life of the goodwill arising on each acquisition is determined at the time of acquisition. In accordance with FRS 11, impairment of the goodwill is evaluated by comparing the present value of the expected future cash flows, excluding financing and tax, (the ‘value-in-use’) to the carrying value of the underlying goodwill. If the net assets and goodwill were to exceed the value-in-use, an impairment would be deemed to have occurred and the resulting write-down in the goodwill would be charged to the profit and loss account immediately. Goodwill arising on acquisitions is written off on a straight line basis over its useful economic life, which is expected not to exceed 20 years, or the period in which the assets acquired are recovered, whether through depreciation or sale. Provision is made for any impairment. Negative goodwill arising on business combinations in respect of acquisitions is included within fixed assets and released to the profit and loss account in the periods in which the fair values of the non-monetary assets purchased on the same acquisition are recovered, whether through depreciation or sale.
Notes(forming part of the financial statements)
Bestway (Holdings) LtdAnnual Report & Accounts 2014
Notes
31
1. Accounting policies (continued) Goodwill and amortisation (continued)Prior to becoming a subsidiary undertaking, United Bank Limited was accounted for as a joint venture. In accordance with FRS 2, and in order to give a true and fair view, purchased goodwill has been calculated as the sum of the goodwill arising on each purchase of shares in United Bank Limited, being the difference at the date of each purchase between the fair value of the consideration given and the fair value of the identifiable assets and liabilities attributable to the interest purchased. This represents a departure from the statutory method, under which goodwill is calculated as the difference between cost and fair value on the date that United Bank Limited became a subsidiary undertaking. The statutory method would not give a true and fair view because it would result in the group’s share of United Bank Limited’s retained reserves, during the period that it was a joint venture, being re-characterised as goodwill. The effect of this departure is to increase the revaluation reserve by £10,527,000 which is the difference generated from the change in value that has been previously equity accounted for and the related movement in the fair value of the investment. Tangible fixed assetsFixed assets include certain properties professionally valued in prior years by Chartered Surveyors on an existing use open market basis, in accordance with the Royal Institute of Chartered Surveyors Valuation – Professional Standards and the associated guidance notes. Other fixed assets are stated at historical cost. Depreciation is provided on all tangible fixed assets other than freehold and long leasehold land, and freehold and leasehold investment properties where the lease has over 20 years to run, at rates calculated to write each asset down to its estimated residual value over its expected useful life as follows:
Freehold and long leasehold properties 2% straight lineShort leasehold properties over life of leasePlant and machinery 5 - 25% straight line or reducing balanceFixtures, fittings and equipment 10 - 25% reducing balanceMotor vehicles 20 - 25% reducing balance The carrying values of tangible fixed assets are subject to annual review and any impairment is charged to the profit and loss account.
In accordance with Statement of Standard Accounting Practice No.19, the Group’s investment properties have been revalued in the current year to market valuations. In accordance with Statement of Standard Accounting Practice No.19, no depreciation is provided in respect of freehold investment properties and leasehold investment properties where the lease has over 20 years to run. This treatment, as regards certain of the Group’s investment properties, may be a departure from the requirements of the Companies Act concerning depreciation of fixed assets.
However, these properties are not held for consumption but for investment and the directors consider that systematic annual depreciation would be inappropriate. The accounting policy adopted is therefore necessary for the financial statements to give a true and fair view. Depreciation or amortisation is only one of the many factors reflected in the annual valuation and the amount which might otherwise have been shown cannot be separately identified or quantified.
Investment propertiesInvestment properties are initially recorded at open market value. Changes in the value of investment property are recognised in the statement of total recognised gains and losses; unless these are impaired in which case the impairment loss is recognised in profit and loss.
Rental incomeRental income from investment property leased out under an operating lease is recognised in the profit and loss account on a straight-line basis. Stocks and work in progressStocks and work in progress are valued at the lower of cost and net realisable value. Work in progress comprises the cost of direct materials, labour and appropriate manufacturing overheads. Provision is made for obsolete and slow moving items. Stores, spares and loose tools are valued at the lower of moving average cost and net realisable value, while items considered obsolete are carried at nil value. Net realisable value signifies estimated selling price less costs necessary to be incurred to affect such a sale.
Notes(continued)
Bestway (Holdings) LtdAnnual Report & Accounts 2014
Notes
32
1. Accounting policies (continued)
TaxationThe charge for taxation is based on the profit for the year and takes into account taxation deferred because of timing differences between the treatment of certain items for taxation and accounting purposes. Deferred tax is recognised in respect of all timing differences that have originated but not reversed at the balance sheet date where transactions or events that result in an obligation to pay more tax in the future or a right to pay less tax in the future have occurred at the balance sheet date. Timing differences are differences between the Group’s taxable profit and its results as stated in the financial statements that arise from the inclusion of gains and losses in tax assessments in periods different from those in which they are recognised in the financial statements. Deferred tax is recognised in the statement of total recognised gains and losses on revaluations where, at the balance sheet date, there is an agreement to sell the asset. Deferred tax is recognised in respect of the retained earnings of overseas subsidiaries and associates only to the extent that, at the balance sheet date, dividends have been accrued as receivable or a binding agreement to distribute past earnings in future has been entered into by the subsidiary or associate. Deferred tax is measured at the average tax rates that are expected to apply in the periods in which timing differences are expected to reverse, based on tax rates and laws that have been enacted or substantively enacted by the balance.
Leased assets and obligationsWhere assets are financed by leasing agreements that give rights approximating to ownership (“finance leases”), the assets are treated as if they had been purchased outright. The amount capitalised is the present value of the minimum lease payments payable during the lease term. The corresponding leasing commitments are shown as obligations to the lessor. Lease payments are treated as consisting of capital and interest elements and the interest is charged to the profit and loss account in proportion to the remaining balance outstanding. All other leases are “operating leases” and the annual rentals are charged to the profit and loss account on a straight line basis over the lease term.
Post-retirement benefits The Group makes contributions towards the personal money purchase pension schemes of certain directors and senior employees. Contributions to the defined contribution fund
are charged to the profit and loss account and represent a fixed percentage of pensionable salaries of scheme members. Contributions to both the defined contribution fund and the defined benefit fund continue to be made to separately administered trust funds. The Group operates a pension scheme providing benefits based on final pensionable pay. The assets of the scheme are held separately from those of the Group. Full details are disclosed in note 29.
Pension scheme assets are measured using market values which for quoted securities is the bid price. Pension scheme liabilities are measured using a projected unit method and discounted at the current rate of return on a high quality corporate bond of equivalent term and currency to the liability. The pension scheme deficit is recognised in full. The movement in the scheme deficit is split between operating charges, finance items and, in the statement of total recognised gains and losses, actuarial gains and losses.
TurnoverTurnover represents the invoiced value, net of Value Added Tax and discounts, of goods sold to customers. Turnover is recognised when goods are received by the customer and the risks and rewards of ownership have passed to them. Turnover is measured at the fair value of consideration received or receivable and represents amounts receivable for goods net of discounts, volume rebates and value added tax. Discounts are accounted for the in period they are earned.
Turnover from cement sales is recorded on despatch of goods to the customer.
Retrospective rebates and discountsThe Group’s cash and carry subsidiaries negotiate discounts directly with suppliers. These discounts are accounted for once the directors are confident that those companies are entitled to the discount. Supplier allowances and credits are recorded as a reduction of cost of sales as they are earned according to the underlying agreement. Allowances consist primarily of promotional allowances, quantity discounts and payments under merchandising agreements. Amounts received under promotional or other merchandising allowance agreements that require specific performance are recognised when the performance is satisfied, the amount is fixed and determinable and the collection is reasonably assured.
Notes(continued)
Bestway (Holdings) LtdAnnual Report & Accounts 2014
Notes
33
1. Accounting policies (continued) InvestmentsIn the Company’s financial statements, investments in subsidiary undertakings and joint ventures are stated at cost.
Foreign currency transactionsMonetary assets and liabilities denominated in foreign currencies are translated at the rates of exchange ruling at the balance sheet date. Transactions in foreign currencies are recorded at the rates ruling at the date of the transactions. All differences are taken to the profit and loss account. The assets and liabilities of overseas subsidiary, joint ventures and associates undertakings are translated at the closing exchange rates. Profit and loss accounts of such undertakings are consolidated at the average rates of exchange during the year. Gains and losses arising on these translations are taken to reserves.
Cash and liquid resourcesCash, for the purpose of the cash flow statement, comprises cash in hand and deposits repayable on demand, less overdrafts payable on demand.
Liquid resources are current asset investments which are disposable without curtailing or disrupting the business and are either readily convertible into known amounts of cash at or close to their carrying values or traded in an active market. Liquid resources comprise term deposits of less than one year (other than cash), and investments in money market managed funds. The Banking Group accounting policies Non-derivative financial instrumentsNon-derivative financial instruments comprise investments, trade and other debtors, cash and cash equivalents, loans and borrowings, and trade and other creditors.
Interest income Mark-up, return and interest on performing advances and investments is recognised on a time proportionate basis that takes into account the effective yield of the asset over the term of the advances and interest earning investments. Where debt securities are purchased at a premium or discount, such premium / discount is amortized through the profit and loss account over the remaining period of maturity of the debt securities.
Interest recoverable on non-performing advances and investments in debt securities is recognised on interest continues to accrue in a memorandum account. Mark up accrued after classification is not recognised in the books, as a result of the legal framework in Pakistan, the recoverability of such mark-up is highly uncertain and
it is not probable that the mark up as agreed at the time of financing will be recovered.
Mark-up is the agreed profit on cost plus basis for deferred sale of goods under which one party purchases goods from a supplier and sells the goods to another party at cost price plus an agreed mark-up. The delivery of the goods is immediate, payment is deferred. Murabaha contract has a variety of applications and is often used as an Islamic financing arrangement, for instance for working capital and trade finance.
Interest expenseInterest expense on borrowings and deposits is recognised on an effective interest rate method as an expense in the period in which it is incurred.
DiscountingIf the effect is material, other debtors are determined by discounting the expected, risk adjusted, future cash flows at a pre-tax risk-free rate.
Foreign currency transactions- Banking group Transactions in foreign currencies are translated at the foreign exchange rates prevailing on the transaction date. Monetary assets and liabilities in foreign currencies are expressed in rupee terms at the rates of exchange prevailing at the statement of financial position date. Forward foreign exchange contracts and foreign bills purchased are measured at fair value.
Non-monetary assets and liabilities in foreign currencies are expressed in rupee terms at the rates of exchange prevailing at the date of initial recognition of the non-monetary assets or liabilities. Foreign operations and subsidiaries- Banking groupThe assets and liabilities of foreign operations and subsidiaries are translated to rupees at exchange rates prevailing at the statement of financial position date. The results of foreign operations and subsidiaries are translated at the average rate of exchange for the year.
Translation gains and losses- Banking groupTranslation gains and losses are taken to the profit and loss account, except those arising on translation of the net investment in foreign branches and subsidiaries which are taken to reserves until the disposal of the net investment, at which time these are recognised in the profit and loss account.
Notes(continued)
Bestway (Holdings) LtdAnnual Report & Accounts 2014
Notes
34
1. Accounting policies (continued) Loans and advancesLoans and advances to banks/customers are initially measured at fair value and subsequently measured at their amortised cost (less impairment losses) using the effective interest method. For details pertaining to impairment, refer to accounting policy section on impairment.
Loans and advances to banks also include purchases under resale agreement. In this case, the amount advanced (being the purchase price) is classified as loans and advances while the differential between the purchase price and the resale price is amortized over the period of the agreement and recorded as income. Securities held as collateral are not recognized in the books, unless these are sold to third parties, in which case the obligation to return them is recorded at fair value as a trading liability under borrowings from financial institutions. Investment securitiesInvestments of the Bank, other than investments in subsidiaries and associates, are classified as held for trading, held to maturity and available for sale. Held for trading These are securities which are either acquired for generating a profit from short-term fluctuations in market prices, interest rate movements and dealer’s margin, or are securities included in a portfolio in which a pattern of short term profit taking exists.
Held to maturityThese are securities with fixed or determinable payments and fixed maturities, in respect of which the Bank has the positive intent and ability to hold to maturity.
Available for saleThese are investments, other than those in subsidiaries and associates that do not fall under the held for trading or held to maturity categories.
Initial measurementAll purchases and sales of investments are recognised on the trade date, i.e., the date that the Bank commits to purchase or sell the investment. Purchases or sales of investments that require delivery of investments within the time frame generally established by regulation or convention in the market place. Investments are initially recognised at fair value which, in the case of investments other than held for trading, includes transaction costs associated with the investments. Transaction costs on investments held for trading are expensed as incurred.
Subsequent measurement
Held for tradingThese are measured at subsequent reporting dates at fair value. Gains and losses on re-measurement are included in the profit and loss account.
Held to maturityThese are measured at amortized cost using the effective interest rate method, less any impairment loss recognized to reflect irrecoverable amounts.
Available for saleInvestments in debt and equity securities held by the Group are classified as being available-for-sale and are stated at fair value, with any resultant gain or loss being recognised directly in equity (in the revaluation reserve), except for impairment losses. When these investments are derecognised, the cumulative gain or loss previously recognised directly in equity is recognised in profit or loss.
Borrowings and depositsBorrowings and deposits from banks and deposits from customers are recorded at fair value which is the amount of proceeds received.
Borrowings from banks also include securities sold under repurchase agreements. Securities sold subject to a repurchase agreement are continued to be recorded as investments since the risk and rewards associated with the security is not transferred while the amount of cash advanced is reported as borrowings from financial institutions. The differential between the sale price and the repurchase price is amortized over the period of the agreement and recorded as an expense. Fee and commissionFee, brokerage and commission income is recognised on an accrual basis.
Dividend incomeDividend income is recognised when the right to receive the dividend is established.
Notes(continued)
Bestway (Holdings) LtdAnnual Report & Accounts 2014
Notes
35
1. Accounting policies (continued)
Impairment
Impairment of financial instruments carried at amortised cost or debt securitiesThe Group considers evidence of impairment for loans and advances, held-to-maturity and available for sale investment securities at both a specific asset and a collective level. All individually significant loans and advances and held-to-maturity investment securities are assessed for specific impairment. Those found not to be specifically impaired are then collectively assessed for any impairment that has been incurred but not yet identified. Loans and advances and held-to-maturity investment securities that are not individually significant are collectively assessed for impairment by grouping together loans and advances and held-to-maturity investment securities with similar risk characteristics. In assessing collective impairment, the Group uses statistical modelling of historical trends of the probability of default, the timing of recoveries and the amount of loss incurred, and makes an adjustment if current economic and credit conditions are such that the actual losses are likely to be greater or lesser than is suggested by historical trends. Default rates, loss rates and the expected timing of future recoveries are regularly benchmarked against actual outcomes to ensure that they remain appropriate.
Impairment losses on debt securities are calculated as the difference between the carrying amount and the present value of estimated future cash flows discounted at the asset’s original effective interest rate.
Impairment losses are recognised in profit or loss and reflected in an allowance account against loans and receivables or held-to-maturity investment securities If an event occurring after the impairment was recognised causes the amount of impairment loss to decrease, then the decrease in impairment loss is reversed through profit or loss. Impairment of available for sale equity investmentsAvailable for sale equity investments are impaired when there has been a significant or prolonged decline in their fair value below their cost. The determination of what is significant or prolonged requires judgment. In making this judgment, the Group evaluates, among other factors, the normal volatility in share price.
Impairment of investments in subsidiaries and associatesThe Banking Group considers that a decline in the recoverable value of the investment in a subsidiary or an associate below its cost may be evidence of impairment. Recoverable value is calculated as the higher of fair value less costs to sell and value in use. An impairment loss is recognised when the recoverable value
falls below the carrying value and is charged to the profit and loss account. A subsequent reversal of an impairment loss, up to the cost of the investment in the subsidiary or the associate, is credited to the profit and loss account. Impairment in non-financial assets (excluding deferred tax)The carrying amounts of non-financial assets are reviewed at each reporting date for impairment whenever events or changes in circumstances indicate that the carrying amounts of these assets may not be recoverable. If such indication exists, and where the carrying value exceeds the estimated recoverable amount, assets are written down to their recoverable amount. The resulting impairment loss is charged to the profit and loss account except for an impairment loss on revalued assets, which is adjusted against the related revaluation surplus to the extent that the impairment loss does not exceed the revaluation surplus.
ProvisionsProvisions are recognised when; the entity has a present obligation (legal or constructive) as a result of a past event, it is probable that a transfer of economic benefits will be required to settle the obligation, and a reliable estimate can be made of the amount of the obligation. If these conditions are not met, no provisions are recognised. Provision against identified non-funded losses is recognised when intimated and reasonable certainty exists that the Banking Group will be required to settle the obligation. The provision is charged to the profit and loss account net of expected recovery and the obligation is classified under other liabilities. Provisions are reviewed at each balance sheet date and are adjusted to reflect the current best estimate. Derivative financial instrumentsDerivative financial instruments are initially recognised at fair value on the date on which the derivative contract is entered into and are subsequently re-measured at fair value using appropriate valuation techniques. All derivative financial instruments are carried as assets when their fair value is positive and liabilities when their fair value is negative. Any change in the fair value of derivative financial instruments during the period is taken to the profit and loss account.
Notes(continued)
Bestway (Holdings) LtdAnnual Report & Accounts 2014
Notes
36
1. Accounting policies (continued)
Hedge accountingThe Banking Group makes use of derivative instruments to manage exposures to interest rate, foreign currency and credit risks. In order to manage particular risks, the Banking Group may undertake a hedge. The Banking Group applies hedge accounting for transactions which meet the specified criteria. At the inception of the hedging relationship, the Bank formally documents the relationship between the hedged item and the hedging instrument, including the nature of the risk, the objective and strategy for undertaking the hedge and the method that will be used to assess the effectiveness of the hedging relationship. A formal assessment is also undertaken to ascertain whether the hedging instrument is expected to be highly effective in offsetting the designated risk in the hedged item. A hedge is regarded as highly effective if, during the period for which the hedge is designated, changes in the fair value or cash flows attributable to the hedged item are expected to be offset by between 80% to 125% by corresponding changes in the fair value or cash flows attributable to the hedging instrument. Cash flow hedgesFor qualifying cash flow hedges, the fair value gain or loss associated with the effective portion of the cash flow hedge is recognised initially in the statement of changes in equity, and recycled through the profit and loss account in the periods when the hedged item will affect profit or loss. Any gain or loss on the ineffective portion of the hedging instrument is recognised in the profit and loss account immediately. When a hedging instrument expires or is sold, or when a hedge no longer meets the criteria for hedge accounting, any cumulative gain or loss existing in equity at that time remains in equity and is recognised when the hedged item is ultimately recognised in the profit and loss account. Offsetting financial instrumentsFinancial assets and financial liabilities are set off and the net amount is reported in the financial statements when there is a legally enforceable right to set off and the Bank intends to either settle on a net basis, or to realize the assets and to settle the liabilities simultaneously. Fair value measurementFair value is the price that would be received to sell an asset or paid to transfer a liability in an orderly transaction between market participants at the measurement date in the principal or, in its absence, the most advantageous market to which the Banking Group has access to at that date. The fair value of a liability reflects its non-performance risk.
When available, the Bank measures the fair value of an instrument using the quoted price in an active market for that instrument. A market is regarded as active if transactions for the asset or liability take place with sufficient frequency and volume to provide pricing information on an ongoing basis.
If there is no quoted price in an active market, then uses valuation techniques that maximise the use of relevant observable inputs and minimise the use of unobservable inputs.
The best evidence of the fair value of a financial instrument at initial recognition is normally the transaction price – i.e. the fair value of the consideration given or received.
The Banking Group recognises transfers between levels of the fair value hierarchy as of the end of the reporting period during which the change has occurred.
Notes(continued)
Bestway (Holdings) LtdAnnual Report & Accounts 2014
Notes
37
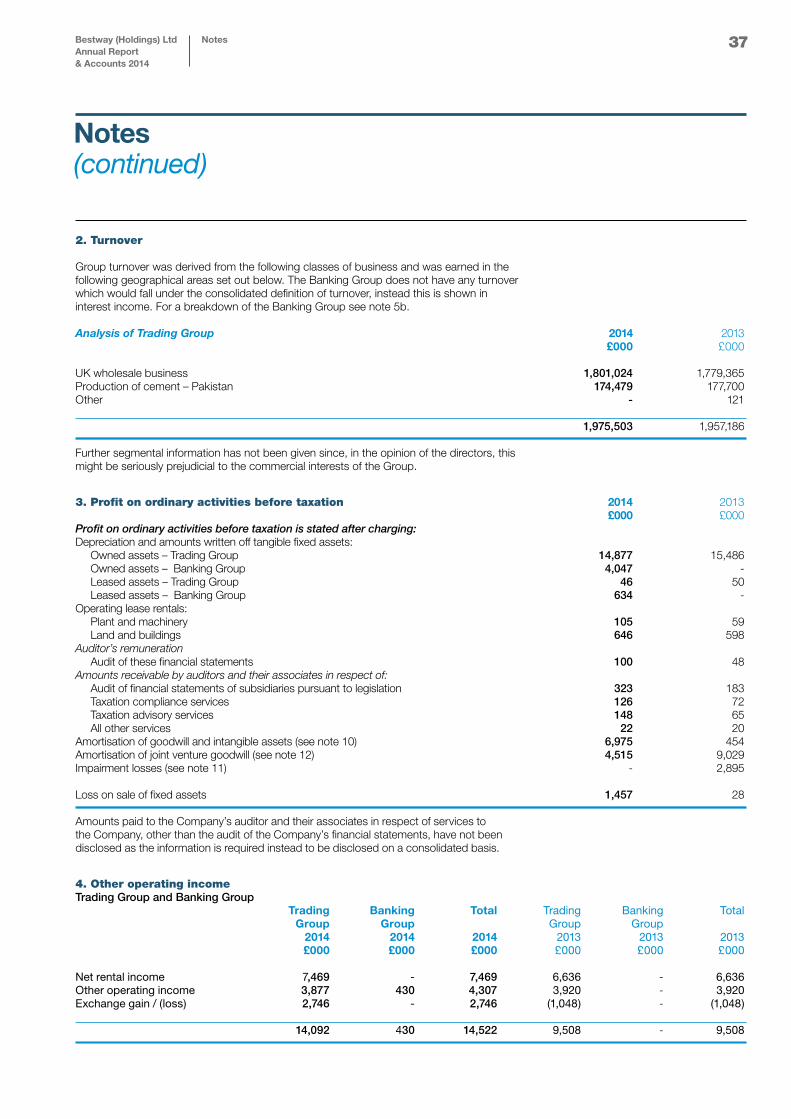
2. Turnover Group turnover was derived from the following classes of business and was earned in the following geographical areas set out below. The Banking Group does not have any turnover which would fall under the consolidated definition of turnover, instead this is shown in interest income. For a breakdown of the Banking Group see note 5b.
Analysis of Trading Group 2014 2013 £000 £000 UK wholesale business 1,801,024 1,779,365Production of cement – Pakistan 174,479 177,700Other - 121 1,975,503 1,957,186 Further segmental information has not been given since, in the opinion of the directors, this might be seriously prejudicial to the commercial interests of the Group.
3. Profit on ordinary activities before taxation 2014 2013 £000 £000Profit on ordinary activities before taxation is stated after charging: Depreciation and amounts written off tangible fixed assets: Owned assets – Trading Group 14,877 15,486 Owned assets – Banking Group 4,047 - Leased assets – Trading Group 46 50 Leased assets – Banking Group 634 -Operating lease rentals: Plant and machinery 105 59 Land and buildings 646 598Auditor’s remuneration Audit of these financial statements 100 48Amounts receivable by auditors and their associates in respect of: Audit of financial statements of subsidiaries pursuant to legislation 323 183 Taxation compliance services 126 72 Taxation advisory services 148 65 All other services 22 20Amortisation of goodwill and intangible assets (see note 10) 6,975 454Amortisation of joint venture goodwill (see note 12) 4,515 9,029Impairment losses (see note 11) - 2,895
Loss on sale of fixed assets 1,457 28
Amounts paid to the Company’s auditor and their associates in respect of services to the Company, other than the audit of the Company’s financial statements, have not been disclosed as the information is required instead to be disclosed on a consolidated basis.
4. Other operating income Trading Group and Banking Group Trading Banking Total Trading Banking Total Group Group Group Group 2014 2014 2014 2013 2013 2013 £000 £000 £000 £000 £000 £000 Net rental income 7,469 - 7,469 6,636 - 6,636Other operating income 3,877 430 4,307 3,920 - 3,920Exchange gain / (loss) 2,746 - 2,746 (1,048) - (1,048) 14,092 430 14,522 9,508 - 9,508
Notes(continued)
Bestway (Holdings) LtdAnnual Report & Accounts 2014
Notes
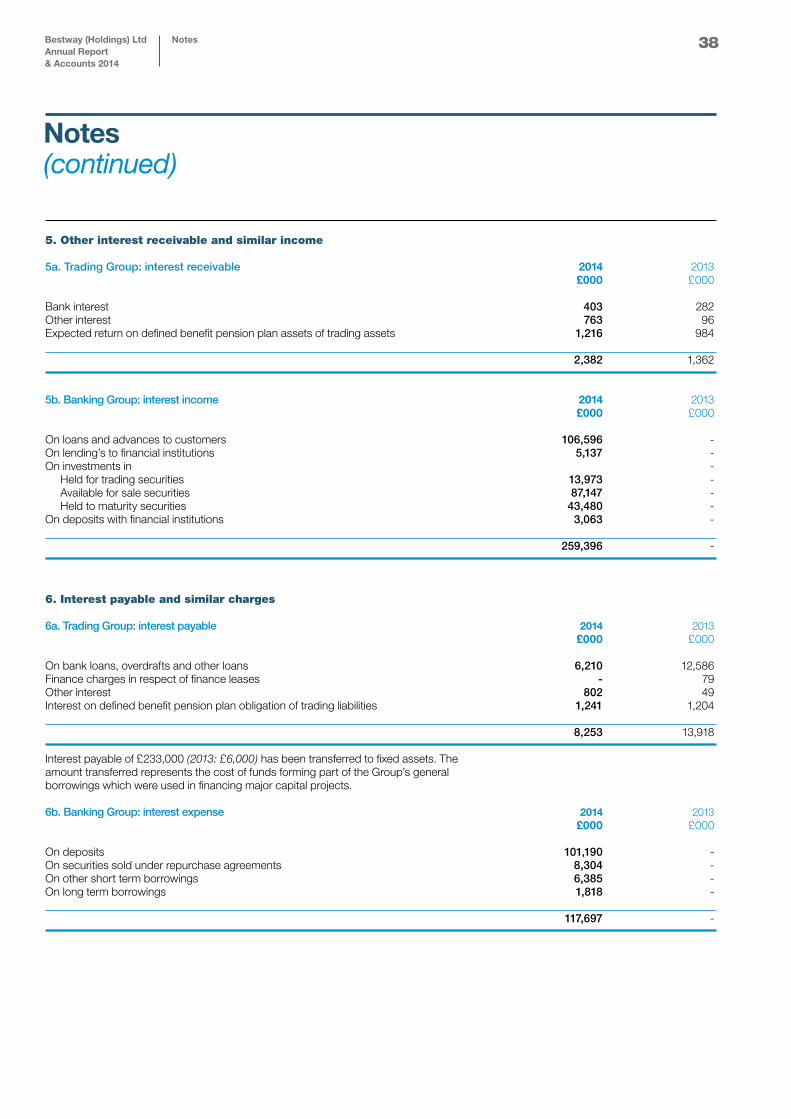
38
5. Other interest receivable and similar income 5a. Trading Group: interest receivable 2014 2013 £000 £000 Bank interest 403 282Other interest 763 96Expected return on defined benefit pension plan assets of trading assets 1,216 984 2,382 1,362
5b. Banking Group: interest income 2014 2013 £000 £000 On loans and advances to customers 106,596 - On lending’s to financial institutions 5,137 - On investments in - Held for trading securities 13,973 - Available for sale securities 87,147 - Held to maturity securities 43,480 -On deposits with financial institutions 3,063 - 259,396 -
6. Interest payable and similar charges 6a. Trading Group: interest payable 2014 2013 £000 £000 On bank loans, overdrafts and other loans 6,210 12,586Finance charges in respect of finance leases - 79Other interest 802 49Interest on defined benefit pension plan obligation of trading liabilities 1,241 1,204 8,253 13,918 Interest payable of £233,000 (2013: £6,000) has been transferred to fixed assets. The amount transferred represents the cost of funds forming part of the Group’s general borrowings which were used in financing major capital projects. 6b. Banking Group: interest expense 2014 2013 £000 £000 On deposits 101,190 -On securities sold under repurchase agreements 8,304 -On other short term borrowings 6,385 -On long term borrowings 1,818 - 117,697 -
Notes(continued)
Bestway (Holdings) LtdAnnual Report & Accounts 2014
Notes
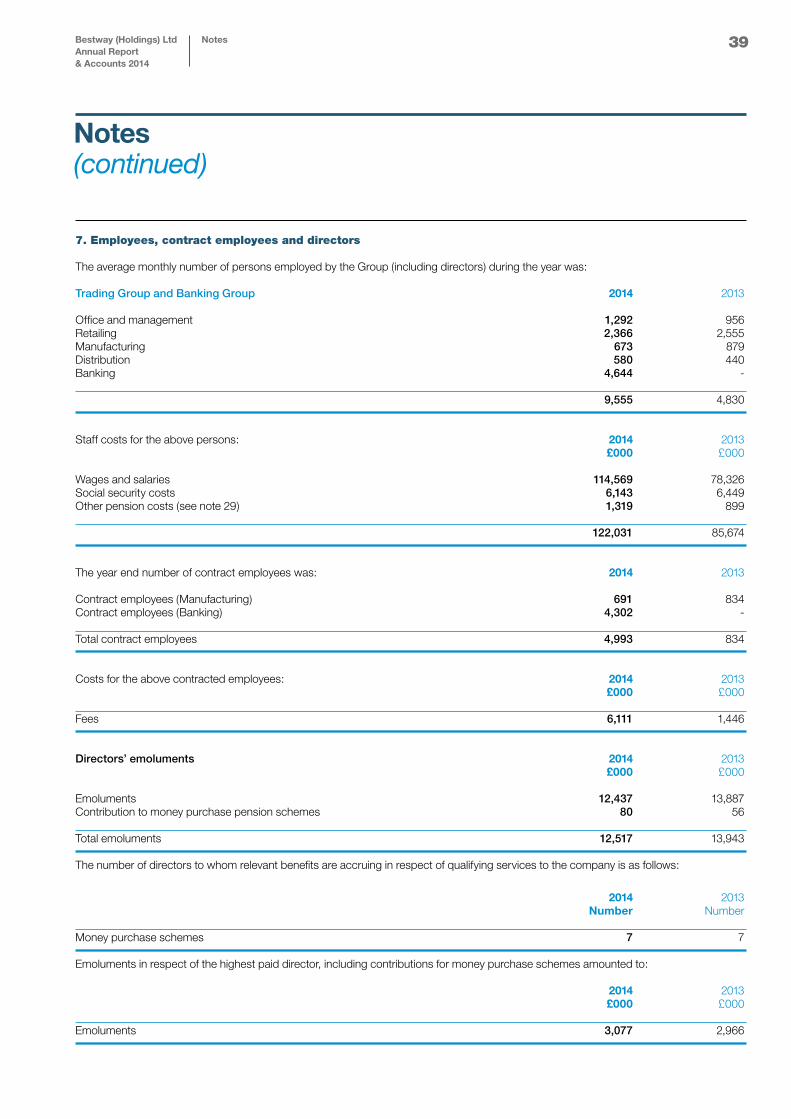
39
7. Employees, contract employees and directors The average monthly number of persons employed by the Group (including directors) during the year was:
Trading Group and Banking Group 2014 2013 Office and management 1,292 956Retailing 2,366 2,555Manufacturing 673 879Distribution 580 440Banking 4,644 - 9,555 4,830
Staff costs for the above persons: 2014 2013 £000 £000 Wages and salaries 114,569 78,326Social security costs 6,143 6,449Other pension costs (see note 29) 1,319 899 122,031 85,674
The year end number of contract employees was: 2014 2013 Contract employees (Manufacturing) 691 834 Contract employees (Banking) 4,302 - Total contract employees 4,993 834 Costs for the above contracted employees: 2014 2013 £000 £000 Fees 6,111 1,446
Directors’ emoluments 2014 2013 £000 £000 Emoluments 12,437 13,887Contribution to money purchase pension schemes 80 56 Total emoluments 12,517 13,943 The number of directors to whom relevant benefits are accruing in respect of qualifying services to the company is as follows:
2014 2013 Number Number Money purchase schemes 7 7 Emoluments in respect of the highest paid director, including contributions for money purchase schemes amounted to:
2014 2013 £000 £000 Emoluments 3,077 2,966
Notes(continued)
Bestway (Holdings) LtdAnnual Report & Accounts 2014
Notes
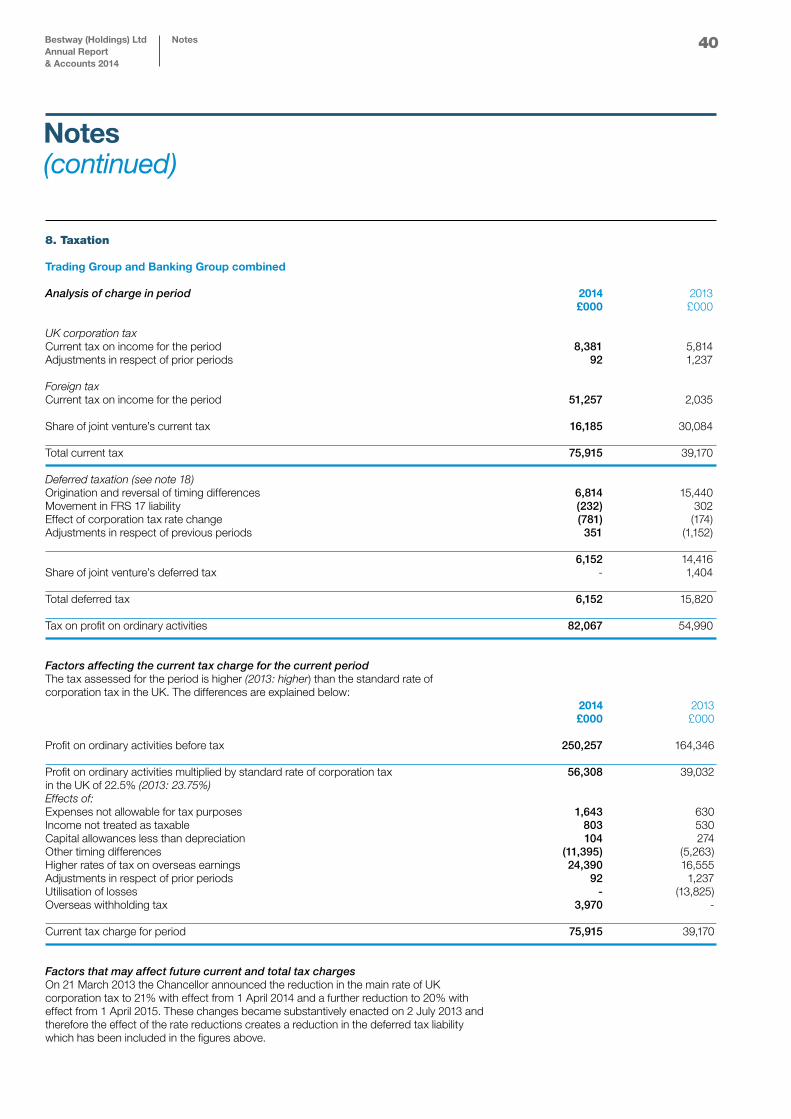
40
8. Taxation Trading Group and Banking Group combined Analysis of charge in period 2014 2013 £000 £000 UK corporation tax Current tax on income for the period 8,381 5,814Adjustments in respect of prior periods 92 1,237 Foreign tax Current tax on income for the period 51,257 2,035 Share of joint venture’s current tax 16,185 30,084 Total current tax 75,915 39,170 Deferred taxation (see note 18) Origination and reversal of timing differences 6,814 15,440Movement in FRS 17 liability (232) 302Effect of corporation tax rate change (781) (174)Adjustments in respect of previous periods 351 (1,152) 6,152 14,416Share of joint venture’s deferred tax - 1,404 Total deferred tax 6,152 15,820 Tax on profit on ordinary activities 82,067 54,990
Factors affecting the current tax charge for the current periodThe tax assessed for the period is higher (2013: higher) than the standard rate of corporation tax in the UK. The differences are explained below: 2014 2013 £000 £000 Profit on ordinary activities before tax 250,257 164,346 Profit on ordinary activities multiplied by standard rate of corporation tax 56,308 39,032 in the UK of 22.5% (2013: 23.75%) Effects of: Expenses not allowable for tax purposes 1,643 630Income not treated as taxable 803 530Capital allowances less than depreciation 104 274Other timing differences (11,395) (5,263)Higher rates of tax on overseas earnings 24,390 16,555Adjustments in respect of prior periods 92 1,237Utilisation of losses - (13,825)Overseas withholding tax 3,970 - Current tax charge for period 75,915 39,170
Factors that may affect future current and total tax chargesOn 21 March 2013 the Chancellor announced the reduction in the main rate of UK corporation tax to 21% with effect from 1 April 2014 and a further reduction to 20% with effect from 1 April 2015. These changes became substantively enacted on 2 July 2013 and therefore the effect of the rate reductions creates a reduction in the deferred tax liability which has been included in the figures above.
Notes(continued)
Bestway (Holdings) LtdAnnual Report & Accounts 2014
Notes
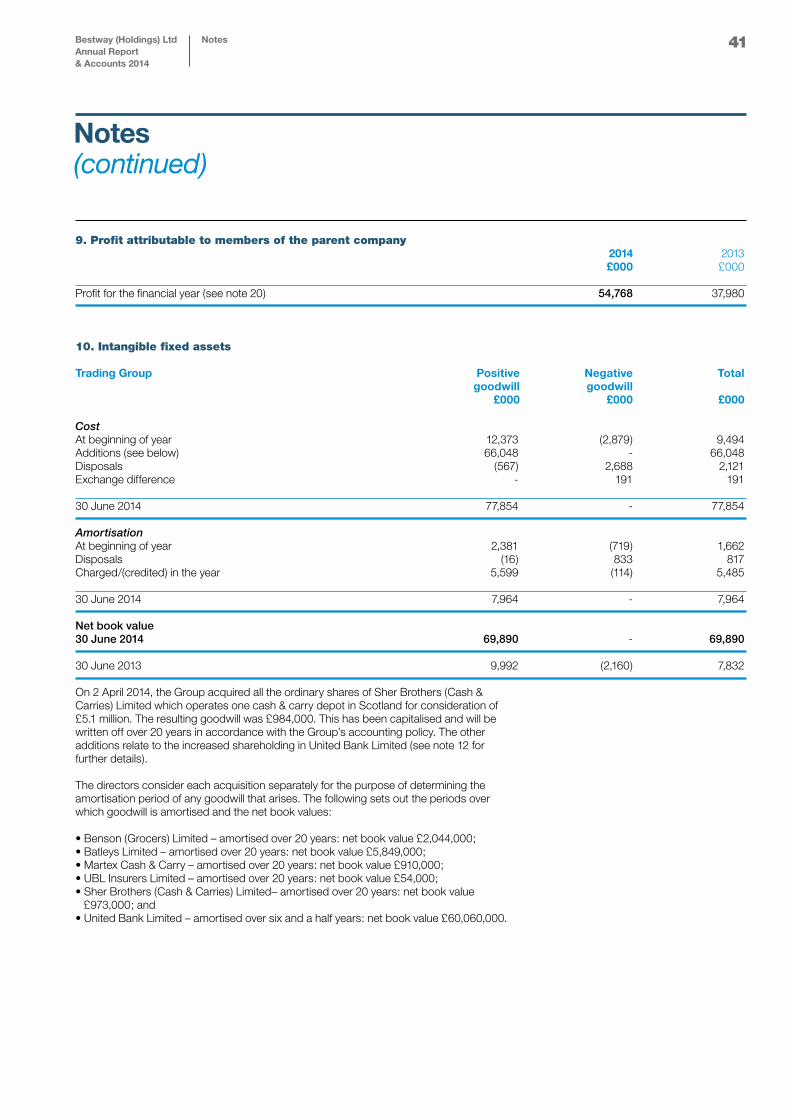
41
9. Profit attributable to members of the parent company 2014 2013 £000 £000 Profit for the financial year (see note 20) 54,768 37,980
10. Intangible fixed assets
Trading Group Positive Negative Total goodwill goodwill £000 £000 £000 Cost At beginning of year 12,373 (2,879) 9,494Additions (see below) 66,048 - 66,048Disposals (567) 2,688 2,121Exchange difference - 191 191 30 June 2014 77,854 - 77,854 Amortisation At beginning of year 2,381 (719) 1,662Disposals (16) 833 817Charged/(credited) in the year 5,599 (114) 5,485 30 June 2014 7,964 - 7,964 Net book value 30 June 2014 69,890 - 69,890 30 June 2013 9,992 (2,160) 7,832 On 2 April 2014, the Group acquired all the ordinary shares of Sher Brothers (Cash & Carries) Limited which operates one cash & carry depot in Scotland for consideration of £5.1 million. The resulting goodwill was £984,000. This has been capitalised and will be written off over 20 years in accordance with the Group’s accounting policy. The other additions relate to the increased shareholding in United Bank Limited (see note 12 for further details). The directors consider each acquisition separately for the purpose of determining the amortisation period of any goodwill that arises. The following sets out the periods over which goodwill is amortised and the net book values:
•Benson(Grocers)Limited–amortisedover20years:netbookvalue£2,044,000;•BatleysLimited–amortisedover20years:netbookvalue£5,849,000;•MartexCash&Carry–amortisedover20years:netbookvalue£910,000;•UBLInsurersLimited–amortisedover20years:netbookvalue£54,000;•SherBrothers(Cash&Carries)Limited–amortisedover20years:netbookvalue £973,000; and•UnitedBankLimited–amortisedoversixandahalfyears:netbookvalue£60,060,000.
Notes(continued)
Bestway (Holdings) LtdAnnual Report & Accounts 2014
Notes
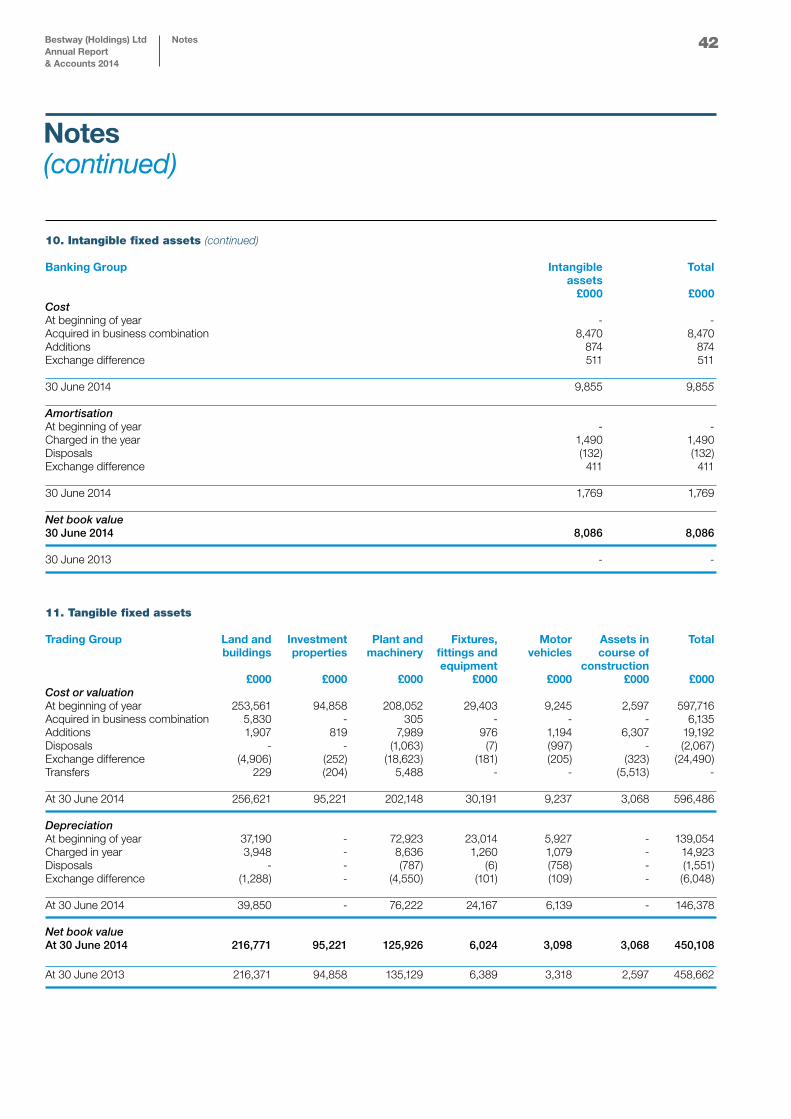
42
10. Intangible fixed assets (continued) Banking Group Intangible Total assets £000 £000 Cost At beginning of year - -Acquired in business combination 8,470 8,470Additions 874 874Exchange difference 511 511 30 June 2014 9,855 9,855 Amortisation At beginning of year - -Charged in the year 1,490 1,490Disposals (132) (132)Exchange difference 411 411 30 June 2014 1,769 1,769 Net book value 30 June 2014 8,086 8,086 30 June 2013 - -
11. Tangible fixed assets
Trading Group Land and Investment Plant and Fixtures, Motor Assets in Total buildings properties machinery fittings and vehicles course of equipment construction £000 £000 £000 £000 £000 £000 £000Cost or valuation At beginning of year 253,561 94,858 208,052 29,403 9,245 2,597 597,716Acquired in business combination 5,830 - 305 - - - 6,135Additions 1,907 819 7,989 976 1,194 6,307 19,192Disposals - - (1,063) (7) (997) - (2,067)Exchange difference (4,906) (252) (18,623) (181) (205) (323) (24,490)Transfers 229 (204) 5,488 - - (5,513) - At 30 June 2014 256,621 95,221 202,148 30,191 9,237 3,068 596,486 Depreciation At beginning of year 37,190 - 72,923 23,014 5,927 - 139,054Charged in year 3,948 - 8,636 1,260 1,079 - 14,923Disposals - - (787) (6) (758) - (1,551)Exchange difference (1,288) - (4,550) (101) (109) - (6,048) At 30 June 2014 39,850 - 76,222 24,167 6,139 - 146,378 Net book value At 30 June 2014 216,771 95,221 125,926 6,024 3,098 3,068 450,108 At 30 June 2013 216,371 94,858 135,129 6,389 3,318 2,597 458,662
Notes(continued)
Bestway (Holdings) LtdAnnual Report & Accounts 2014
Notes
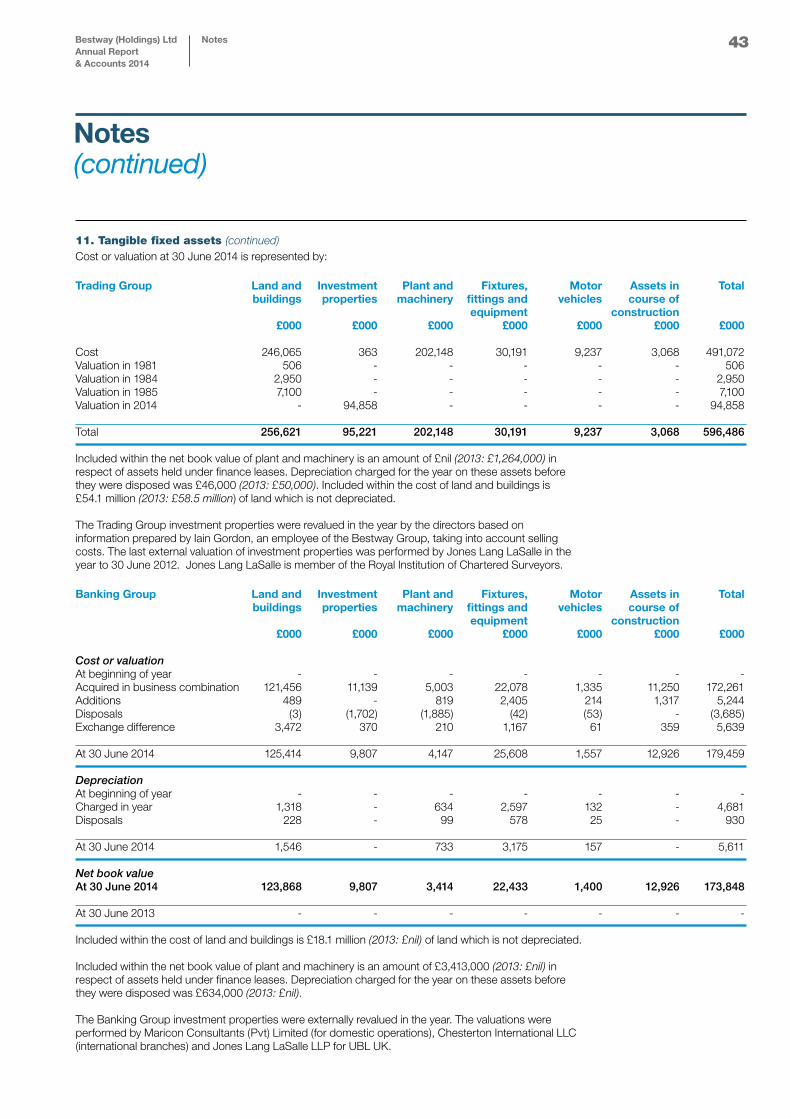
43
11. Tangible fixed assets (continued) Cost or valuation at 30 June 2014 is represented by:
Trading Group Land and Investment Plant and Fixtures, Motor Assets in Total buildings properties machinery fittings and vehicles course of equipment construction £000 £000 £000 £000 £000 £000 £000 Cost 246,065 363 202,148 30,191 9,237 3,068 491,072Valuation in 1981 506 - - - - - 506Valuation in 1984 2,950 - - - - - 2,950Valuation in 1985 7,100 - - - - - 7,100Valuation in 2014 - 94,858 - - - - 94,858 Total 256,621 95,221 202,148 30,191 9,237 3,068 596,486 Included within the net book value of plant and machinery is an amount of £nil (2013: £1,264,000) in respect of assets held under finance leases. Depreciation charged for the year on these assets before they were disposed was £46,000 (2013: £50,000). Included within the cost of land and buildings is £54.1 million (2013: £58.5 million) of land which is not depreciated.
The Trading Group investment properties were revalued in the year by the directors based on information prepared by Iain Gordon, an employee of the Bestway Group, taking into account selling costs. The last external valuation of investment properties was performed by Jones Lang LaSalle in the year to 30 June 2012. Jones Lang LaSalle is member of the Royal Institution of Chartered Surveyors.
Banking Group Land and Investment Plant and Fixtures, Motor Assets in Total buildings properties machinery fittings and vehicles course of equipment construction £000 £000 £000 £000 £000 £000 £000
Cost or valuation At beginning of year - - - - - - -Acquired in business combination 121,456 11,139 5,003 22,078 1,335 11,250 172,261Additions 489 - 819 2,405 214 1,317 5,244Disposals (3) (1,702) (1,885) (42) (53) - (3,685)Exchange difference 3,472 370 210 1,167 61 359 5,639 At 30 June 2014 125,414 9,807 4,147 25,608 1,557 12,926 179,459 Depreciation At beginning of year - - - - - - -Charged in year 1,318 - 634 2,597 132 - 4,681Disposals 228 - 99 578 25 - 930 At 30 June 2014 1,546 - 733 3,175 157 - 5,611 Net book value At 30 June 2014 123,868 9,807 3,414 22,433 1,400 12,926 173,848 At 30 June 2013 - - - - - - - Included within the cost of land and buildings is £18.1 million (2013: £nil) of land which is not depreciated.
Included within the net book value of plant and machinery is an amount of £3,413,000 (2013: £nil) in respect of assets held under finance leases. Depreciation charged for the year on these assets before they were disposed was £634,000 (2013: £nil).
The Banking Group investment properties were externally revalued in the year. The valuations were performed by Maricon Consultants (Pvt) Limited (for domestic operations), Chesterton International LLC (international branches) and Jones Lang LaSalle LLP for UBL UK.
Notes(continued)
Bestway (Holdings) LtdAnnual Report & Accounts 2014
Notes
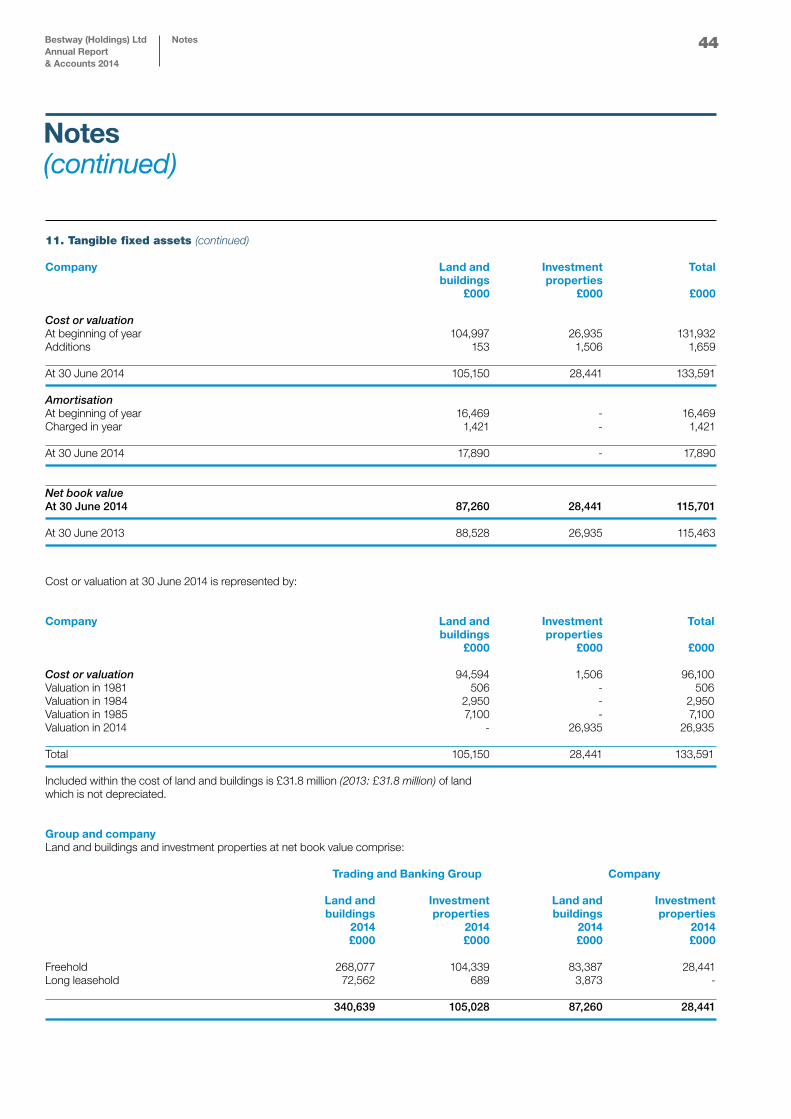
44
11. Tangible fixed assets (continued)
Company Land and Investment Total buildings properties £000 £000 £000 Cost or valuation At beginning of year 104,997 26,935 131,932Additions 153 1,506 1,659 At 30 June 2014 105,150 28,441 133,591 Amortisation At beginning of year 16,469 - 16,469Charged in year 1,421 - 1,421 At 30 June 2014 17,890 - 17,890
Net book value At 30 June 2014 87,260 28,441 115,701 At 30 June 2013 88,528 26,935 115,463
Cost or valuation at 30 June 2014 is represented by: Company Land and Investment Total buildings properties £000 £000 £000 Cost or valuation 94,594 1,506 96,100Valuation in 1981 506 - 506Valuation in 1984 2,950 - 2,950Valuation in 1985 7,100 - 7,100Valuation in 2014 - 26,935 26,935 Total 105,150 28,441 133,591 Included within the cost of land and buildings is £31.8 million (2013: £31.8 million) of land which is not depreciated.
Group and companyLand and buildings and investment properties at net book value comprise:
Trading and Banking Group Company
Land and Investment Land and Investment buildings properties buildings properties 2014 2014 2014 2014 £000 £000 £000 £000 Freehold 268,077 104,339 83,387 28,441Long leasehold 72,562 689 3,873 - 340,639 105,028 87,260 28,441
Notes(continued)
Bestway (Holdings) LtdAnnual Report & Accounts 2014
Notes
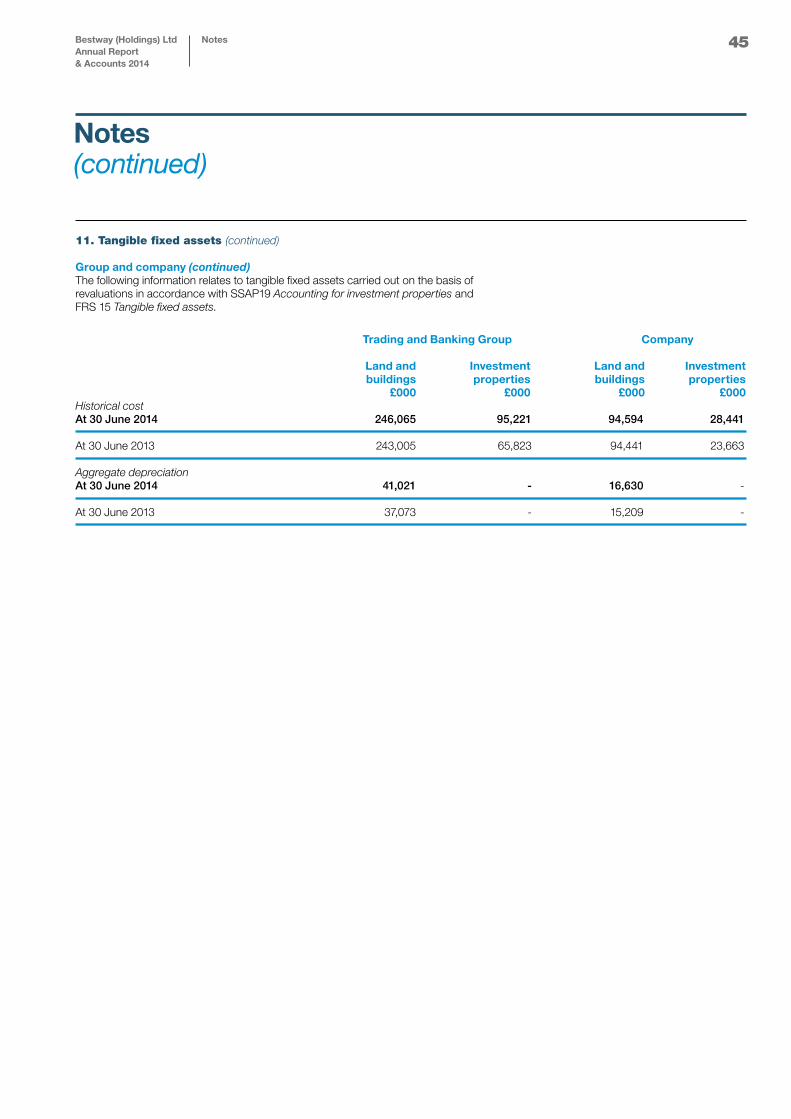
45
11. Tangible fixed assets (continued)
Group and company (continued)The following information relates to tangible fixed assets carried out on the basis of revaluations in accordance with SSAP19 Accounting for investment properties and FRS 15 Tangible fixed assets.
Trading and Banking Group Company
Land and Investment Land and Investment buildings properties buildings properties £000 £000 £000 £000Historical cost At 30 June 2014 246,065 95,221 94,594 28,441 At 30 June 2013 243,005 65,823 94,441 23,663 Aggregate depreciation At 30 June 2014 41,021 - 16,630 - At 30 June 2013 37,073 - 15,209 -
Notes(continued)
Bestway (Holdings) LtdAnnual Report & Accounts 2014
Notes
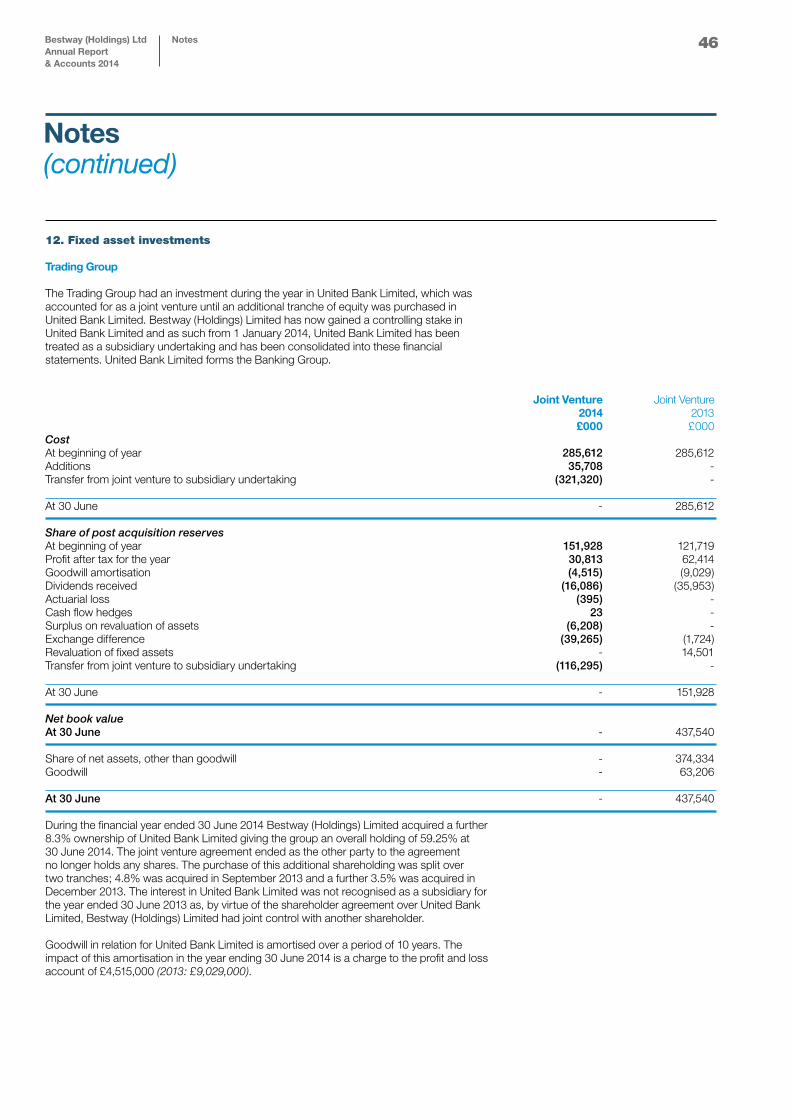
46
12. Fixed asset investments Trading Group The Trading Group had an investment during the year in United Bank Limited, which was accounted for as a joint venture until an additional tranche of equity was purchased in United Bank Limited. Bestway (Holdings) Limited has now gained a controlling stake in United Bank Limited and as such from 1 January 2014, United Bank Limited has been treated as a subsidiary undertaking and has been consolidated into these financial statements. United Bank Limited forms the Banking Group. Joint Venture Joint Venture 2014 2013 £000 £000 Cost At beginning of year 285,612 285,612Additions 35,708 -Transfer from joint venture to subsidiary undertaking (321,320) - At 30 June - 285,612 Share of post acquisition reserves At beginning of year 151,928 121,719Profit after tax for the year 30,813 62,414Goodwill amortisation (4,515) (9,029)Dividends received (16,086) (35,953)Actuarial loss (395) -Cash flow hedges 23 -Surplus on revaluation of assets (6,208) -Exchange difference (39,265) (1,724)Revaluation of fixed assets - 14,501Transfer from joint venture to subsidiary undertaking (116,295) - At 30 June - 151,928 Net book value At 30 June - 437,540 Share of net assets, other than goodwill - 374,334Goodwill - 63,206 At 30 June - 437,540 During the financial year ended 30 June 2014 Bestway (Holdings) Limited acquired a further 8.3% ownership of United Bank Limited giving the group an overall holding of 59.25% at 30 June 2014. The joint venture agreement ended as the other party to the agreement no longer holds any shares. The purchase of this additional shareholding was split over two tranches; 4.8% was acquired in September 2013 and a further 3.5% was acquired in December 2013. The interest in United Bank Limited was not recognised as a subsidiary for the year ended 30 June 2013 as, by virtue of the shareholder agreement over United Bank Limited, Bestway (Holdings) Limited had joint control with another shareholder. Goodwill in relation for United Bank Limited is amortised over a period of 10 years. The impact of this amortisation in the year ending 30 June 2014 is a charge to the profit and loss account of £4,515,000 (2013: £9,029,000).
Notes(continued)
Bestway (Holdings) LtdAnnual Report & Accounts 2014
Notes
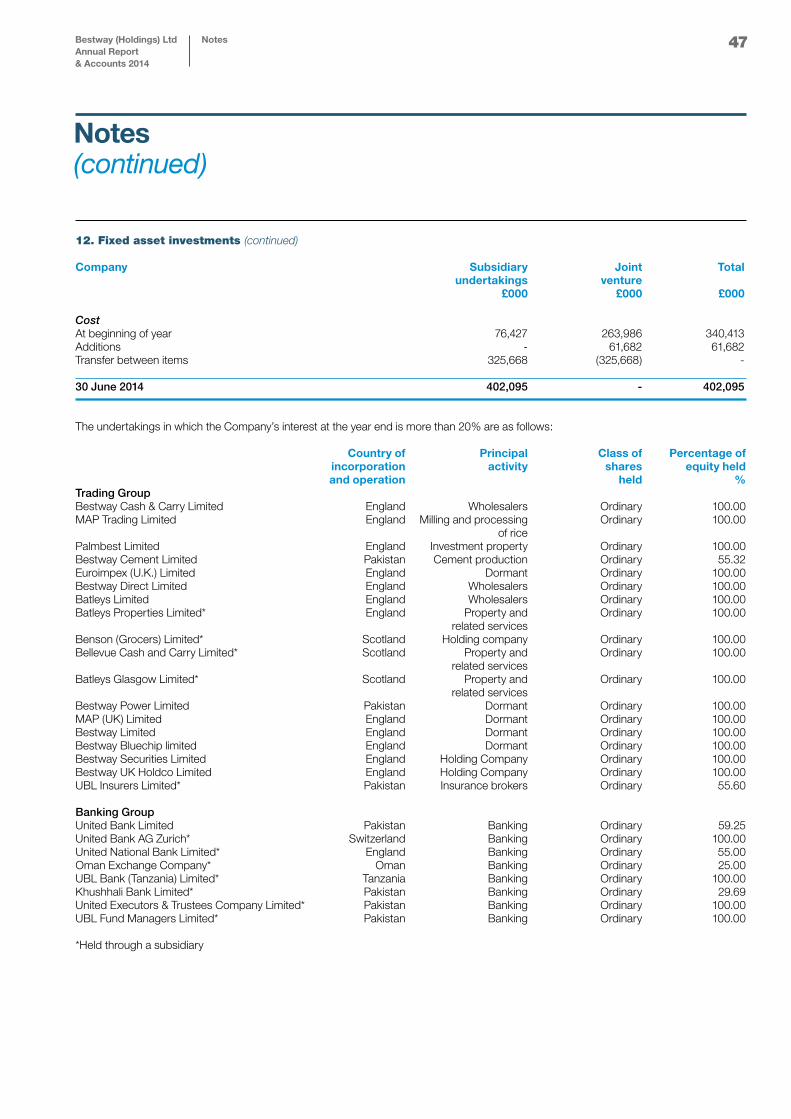
47
12. Fixed asset investments (continued) Company Subsidiary Joint Total undertakings venture £000 £000 £000 Cost At beginning of year 76,427 263,986 340,413Additions - 61,682 61,682Transfer between items 325,668 (325,668) - 30 June 2014 402,095 - 402,095 The undertakings in which the Company’s interest at the year end is more than 20% are as follows: Country of Principal Class of Percentage of incorporation activity shares equity held and operation held %Trading Group Bestway Cash & Carry Limited England Wholesalers Ordinary 100.00MAP Trading Limited England Milling and processing Ordinary 100.00 of ricePalmbest Limited England Investment property Ordinary 100.00Bestway Cement Limited Pakistan Cement production Ordinary 55.32Euroimpex (U.K.) Limited England Dormant Ordinary 100.00Bestway Direct Limited England Wholesalers Ordinary 100.00Batleys Limited England Wholesalers Ordinary 100.00Batleys Properties Limited* England Property and Ordinary 100.00 related services Benson (Grocers) Limited* Scotland Holding company Ordinary 100.00Bellevue Cash and Carry Limited* Scotland Property and Ordinary 100.00 related services Batleys Glasgow Limited* Scotland Property and Ordinary 100.00 related services Bestway Power Limited Pakistan Dormant Ordinary 100.00MAP (UK) Limited England Dormant Ordinary 100.00Bestway Limited England Dormant Ordinary 100.00Bestway Bluechip limited England Dormant Ordinary 100.00Bestway Securities Limited England Holding Company Ordinary 100.00Bestway UK Holdco Limited England Holding Company Ordinary 100.00UBL Insurers Limited* Pakistan Insurance brokers Ordinary 55.60 Banking Group United Bank Limited Pakistan Banking Ordinary 59.25 United Bank AG Zurich* Switzerland Banking Ordinary 100.00United National Bank Limited* England Banking Ordinary 55.00 Oman Exchange Company* Oman Banking Ordinary 25.00UBL Bank (Tanzania) Limited* Tanzania Banking Ordinary 100.00Khushhali Bank Limited* Pakistan Banking Ordinary 29.69 United Executors & Trustees Company Limited* Pakistan Banking Ordinary 100.00UBL Fund Managers Limited* Pakistan Banking Ordinary 100.00 *Held through a subsidiary
Notes(continued)
Bestway (Holdings) LtdAnnual Report & Accounts 2014
Notes
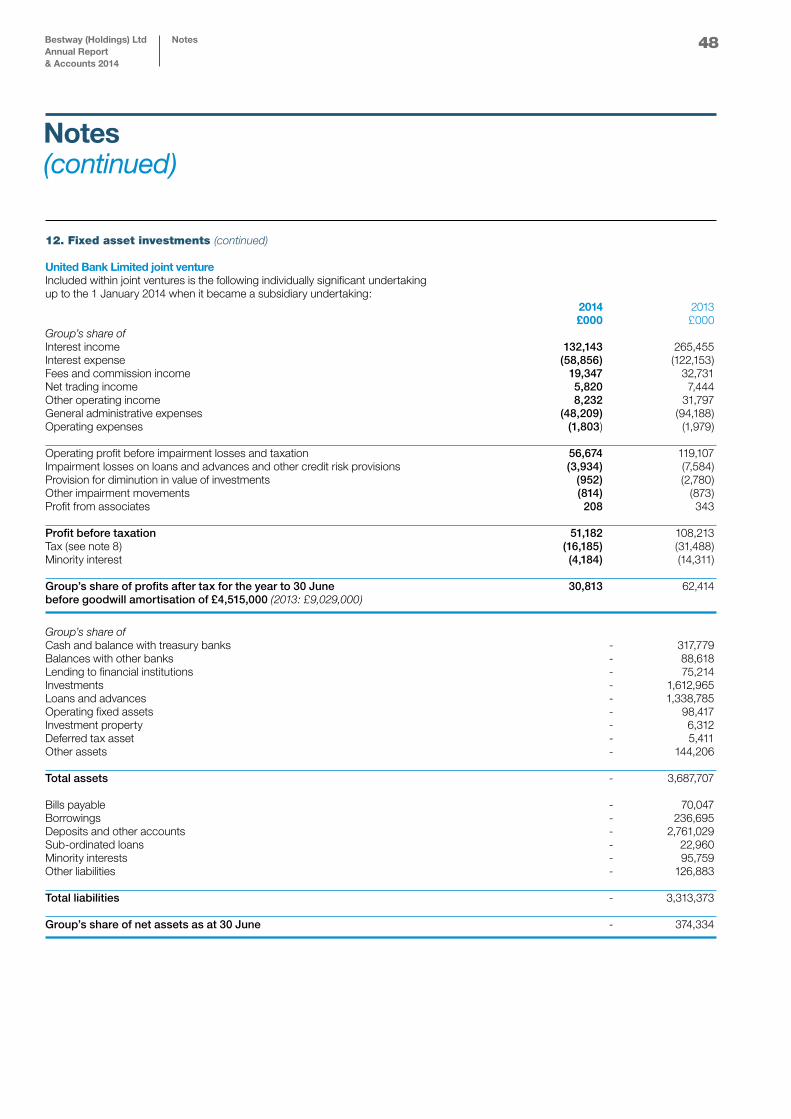
48
12. Fixed asset investments (continued)
United Bank Limited joint venture Included within joint ventures is the following individually significant undertaking up to the 1 January 2014 when it became a subsidiary undertaking: 2014 2013 £000 £000 Group’s share of Interest income 132,143 265,455Interest expense (58,856) (122,153)Fees and commission income 19,347 32,731 Net trading income 5,820 7,444 Other operating income 8,232 31,797 General administrative expenses (48,209) (94,188)Operating expenses (1,803) (1,979) Operating profit before impairment losses and taxation 56,674 119,107 Impairment losses on loans and advances and other credit risk provisions (3,934) (7,584)Provision for diminution in value of investments (952) (2,780)Other impairment movements (814) (873) Profit from associates 208 343 Profit before taxation 51,182 108,213 Tax (see note 8) (16,185) (31,488)Minority interest (4,184) (14,311) Group’s share of profits after tax for the year to 30 June 30,813 62,414before goodwill amortisation of £4,515,000 (2013: £9,029,000)
Group’s share of Cash and balance with treasury banks - 317,779Balances with other banks - 88,618Lending to financial institutions - 75,214Investments - 1,612,965Loans and advances - 1,338,785Operating fixed assets - 98,417Investment property - 6,312Deferred tax asset - 5,411Other assets - 144,206 Total assets - 3,687,707 Bills payable - 70,047Borrowings - 236,695Deposits and other accounts - 2,761,029Sub-ordinated loans - 22,960Minority interests - 95,759Other liabilities - 126,883 Total liabilities - 3,313,373 Group’s share of net assets as at 30 June - 374,334
Notes(continued)
Bestway (Holdings) LtdAnnual Report & Accounts 2014
Notes
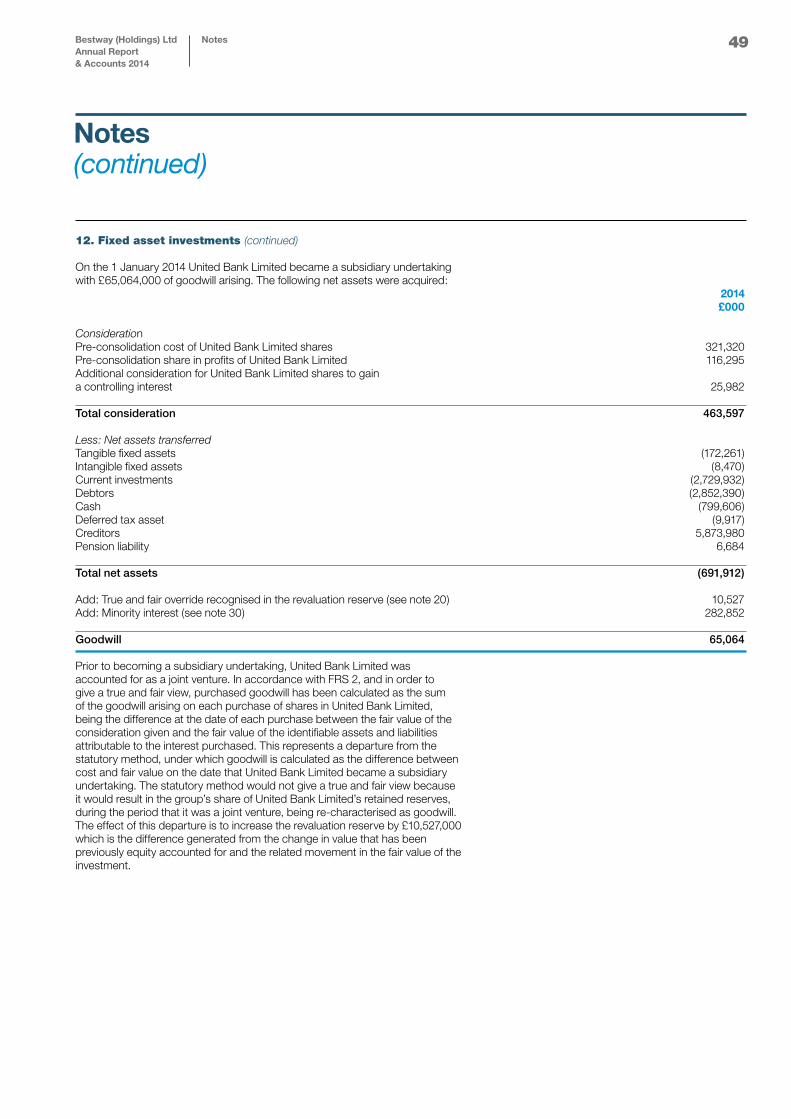
49
12. Fixed asset investments (continued) On the 1 January 2014 United Bank Limited became a subsidiary undertaking with £65,064,000 of goodwill arising. The following net assets were acquired: 2014 £000 Consideration Pre-consolidation cost of United Bank Limited shares 321,320 Pre-consolidation share in profits of United Bank Limited 116,295 Additional consideration for United Bank Limited shares to gain a controlling interest 25,982 Total consideration 463,597
Less: Net assets transferred Tangible fixed assets (172,261) Intangible fixed assets (8,470) Current investments (2,729,932) Debtors (2,852,390) Cash (799,606) Deferred tax asset (9,917) Creditors 5,873,980 Pension liability 6,684 Total net assets (691,912) Add: True and fair override recognised in the revaluation reserve (see note 20) 10,527 Add: Minority interest (see note 30) 282,852 Goodwill 65,064
Prior to becoming a subsidiary undertaking, United Bank Limited was accounted for as a joint venture. In accordance with FRS 2, and in order to give a true and fair view, purchased goodwill has been calculated as the sum of the goodwill arising on each purchase of shares in United Bank Limited, being the difference at the date of each purchase between the fair value of the consideration given and the fair value of the identifiable assets and liabilities attributable to the interest purchased. This represents a departure from the statutory method, under which goodwill is calculated as the difference between cost and fair value on the date that United Bank Limited became a subsidiary undertaking. The statutory method would not give a true and fair view because it would result in the group’s share of United Bank Limited’s retained reserves, during the period that it was a joint venture, being re-characterised as goodwill. The effect of this departure is to increase the revaluation reserve by £10,527,000 which is the difference generated from the change in value that has been previously equity accounted for and the related movement in the fair value of the investment.
Notes(continued)
Bestway (Holdings) LtdAnnual Report & Accounts 2014
Notes
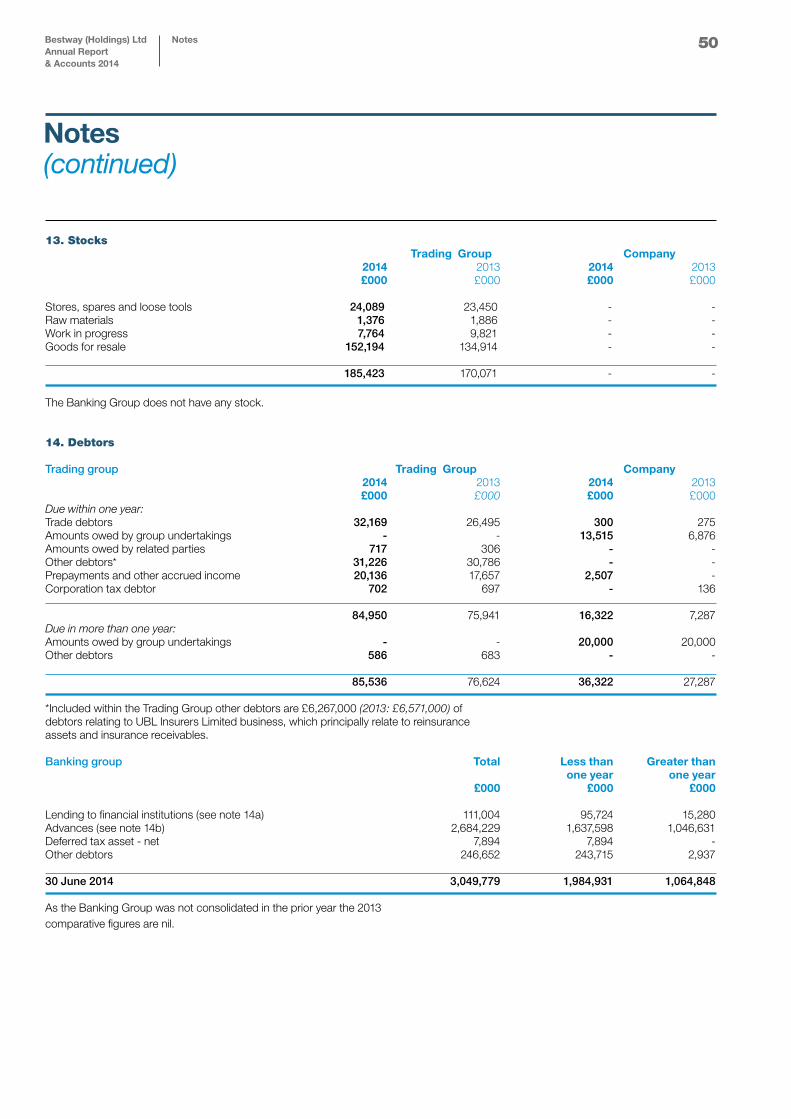
50
13. Stocks Trading Group Company 2014 2013 2014 2013 £000 £000 £000 £000 Stores, spares and loose tools 24,089 23,450 - -Raw materials 1,376 1,886 - -Work in progress 7,764 9,821 - -Goods for resale 152,194 134,914 - - 185,423 170,071 - - The Banking Group does not have any stock. 14. Debtors Trading group Trading Group Company 2014 2013 2014 2013 £000 £000 £000 £000 Due within one year: Trade debtors 32,169 26,495 300 275Amounts owed by group undertakings - - 13,515 6,876Amounts owed by related parties 717 306 - -Other debtors* 31,226 30,786 - -Prepayments and other accrued income 20,136 17,657 2,507 -Corporation tax debtor 702 697 - 136 84,950 75,941 16,322 7,287Due in more than one year: Amounts owed by group undertakings - - 20,000 20,000Other debtors 586 683 - - 85,536 76,624 36,322 27,287 *Included within the Trading Group other debtors are £6,267,000 (2013: £6,571,000) of debtors relating to UBL Insurers Limited business, which principally relate to reinsurance assets and insurance receivables. Banking group Total Less than Greater than one year one year £000 £000 £000 Lending to financial institutions (see note 14a) 111,004 95,724 15,280Advances (see note 14b) 2,684,229 1,637,598 1,046,631Deferred tax asset - net 7,894 7,894 -Other debtors 246,652 243,715 2,937 30 June 2014 3,049,779 1,984,931 1,064,848 As the Banking Group was not consolidated in the prior year the 2013 comparative figures are nil.
Notes(continued)
Bestway (Holdings) LtdAnnual Report & Accounts 2014
Notes
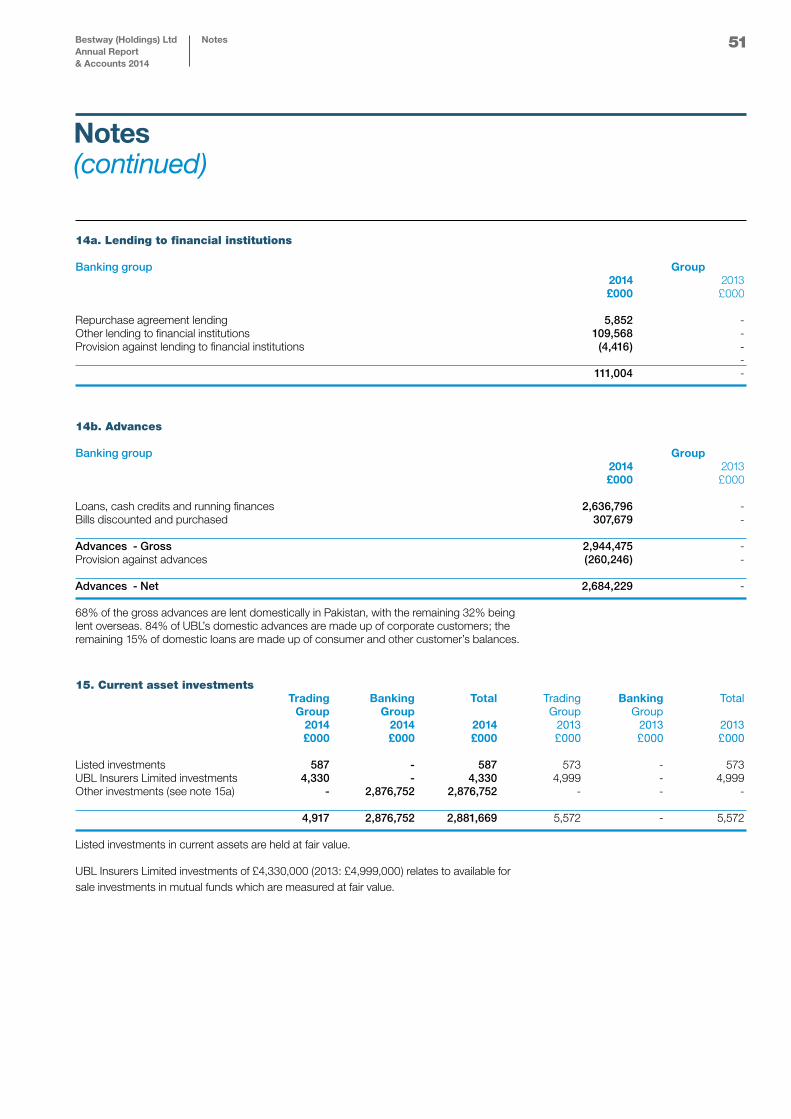
51
14a. Lending to financial institutions Banking group Group 2014 2013 £000 £000 Repurchase agreement lending 5,852 -Other lending to financial institutions 109,568 -Provision against lending to financial institutions (4,416) - - 111,004 -
14b. Advances Banking group Group 2014 2013 £000 £000 Loans, cash credits and running finances 2,636,796 -Bills discounted and purchased 307,679 - Advances - Gross 2,944,475 -Provision against advances (260,246) - Advances - Net 2,684,229 - 68% of the gross advances are lent domestically in Pakistan, with the remaining 32% being lent overseas. 84% of UBL’s domestic advances are made up of corporate customers; the remaining 15% of domestic loans are made up of consumer and other customer’s balances.
15. Current asset investments Trading Banking Total Trading Banking Total Group Group Group Group 2014 2014 2014 2013 2013 2013 £000 £000 £000 £000 £000 £000
Listed investments 587 - 587 573 - 573UBL Insurers Limited investments 4,330 - 4,330 4,999 - 4,999Other investments (see note 15a) - 2,876,752 2,876,752 - - - 4,917 2,876,752 2,881,669 5,572 - 5,572 Listed investments in current assets are held at fair value.
UBL Insurers Limited investments of £4,330,000 (2013: £4,999,000) relates to available for sale investments in mutual funds which are measured at fair value.
Notes(continued)
Bestway (Holdings) LtdAnnual Report & Accounts 2014
Notes
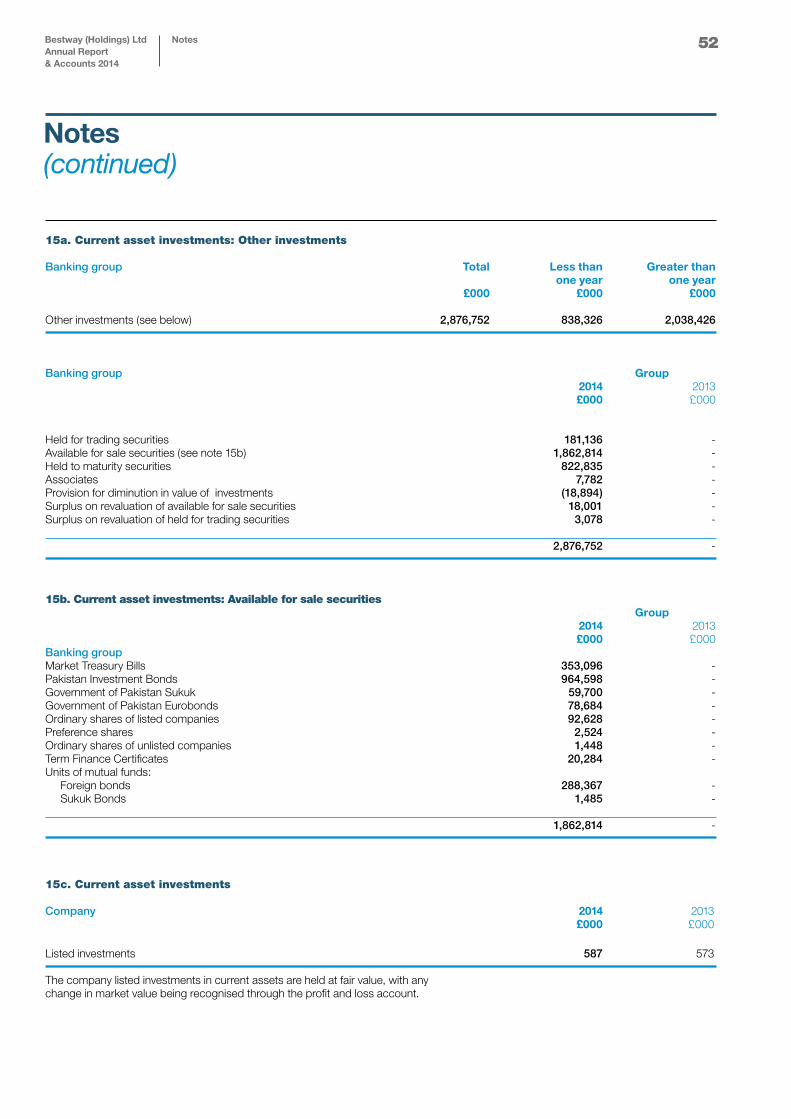
52
15a . Current asset investments: Other investments Banking group Total Less than Greater than one year one year £000 £000 £000 Other investments (see below) 2,876,752 838,326 2,038,426 Banking group Group 2014 2013 £000 £000
Held for trading securities 181,136 -Available for sale securities (see note 15b) 1,862,814 -Held to maturity securities 822,835 -Associates 7,782 -Provision for diminution in value of investments (18,894) -Surplus on revaluation of available for sale securities 18,001 -Surplus on revaluation of held for trading securities 3,078 - 2,876,752 -
15b. Current asset investments: Available for sale securities Group
2014 2013 £000 £000 Banking group Market Treasury Bills 353,096 -Pakistan Investment Bonds 964,598 -Government of Pakistan Sukuk 59,700 -Government of Pakistan Eurobonds 78,684 -Ordinary shares of listed companies 92,628 -Preference shares 2,524 -Ordinary shares of unlisted companies 1,448 -Term Finance Certificates 20,284 -Units of mutual funds: Foreign bonds 288,367 - Sukuk Bonds 1,485 - 1,862,814 -
15c. Current asset investments
Company 2014 2013 £000 £000
Listed investments 587 573 The company listed investments in current assets are held at fair value, with any change in market value being recognised through the profit and loss account.
Notes(continued)
Bestway (Holdings) LtdAnnual Report & Accounts 2014
Notes
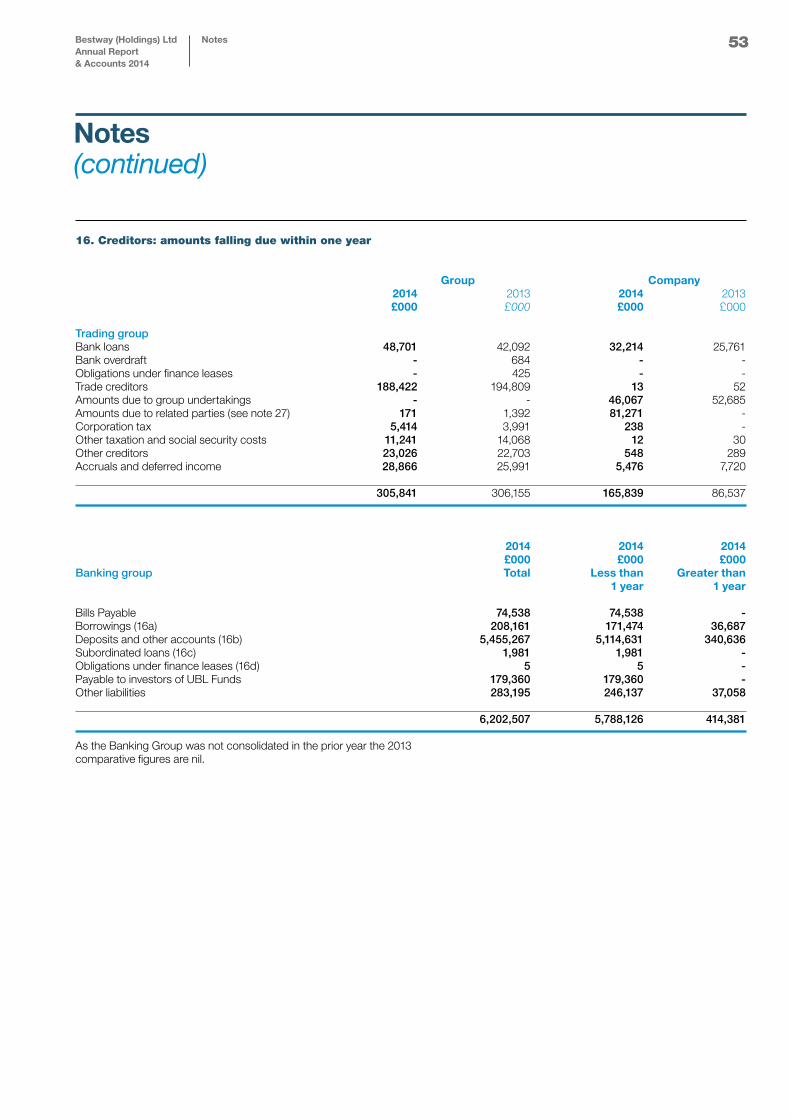
53
16. Creditors: amounts falling due within one year
Group Company 2014 2013 2014 2013 £000 £000 £000 £000
Trading groupBank loans 48,701 42,092 32,214 25,761Bank overdraft - 684 - -Obligations under finance leases - 425 - -Trade creditors 188,422 194,809 13 52Amounts due to group undertakings - - 46,067 52,685Amounts due to related parties (see note 27) 171 1,392 81,271 -Corporation tax 5,414 3,991 238 -Other taxation and social security costs 11,241 14,068 12 30Other creditors 23,026 22,703 548 289Accruals and deferred income 28,866 25,991 5,476 7,720 305,841 306,155 165,839 86,537 2014 2014 2014 £000 £000 £000Banking group Total Less than Greater than 1 year 1 year
Bills Payable 74,538 74,538 -Borrowings (16a) 208,161 171,474 36,687Deposits and other accounts (16b) 5,455,267 5,114,631 340,636Subordinated loans (16c) 1,981 1,981 -Obligations under finance leases (16d) 5 5 -Payable to investors of UBL Funds 179,360 179,360 -Other liabilities 283,195 246,137 37,058 6,202,507 5,788,126 414,381 As the Banking Group was not consolidated in the prior year the 2013 comparative figures are nil.
Notes(continued)
Bestway (Holdings) LtdAnnual Report & Accounts 2014
Notes
54
16. Creditors: amounts falling due within one year (continued)
a) At 30 June 2014 the Trading Group had total utilised bank and overdraft facilities of £49.5 million (2013: £146.86 million). At 30 June 2014 the Trading Group had total utilised term loan facilities with HSBC Bank plc of £35.35 million (2013: £97.95 million). The £34.56 million (2013: £96.67 million) bank loan from HSBC Bank plc is divided between Bestway (Holdings) Limited with £32.21 million (2013: £92.72 million) and Palmbest Limited with £2.35 million (2013: £3.95 million). This is shown after deduction of unamortised issue costs. The Palmbest Limited tranche of the bank loan is repayable by equal quarterly instalments until 30 June 2015 and bears an interest rate of LIBOR plus a margin of 0.7%. The loan is secured by a fixed charge on properties owned by Palmbest Limited. This loan was fully repaid in August 2014. Bestway (Holdings) Limited loans include bank loans from HSBC Bank Plc of £nil (2013: £37.5 million) denominated in US Dollars, £30.5 million (2013: £38.1 million) and £2.5 million (2013: £18.4 million). These loans are repayable by fixed quarterly instalments until 31 January 2016 and bears interest at rates between 1.50% and 2.50% per annum above the Bank of England base rate. The loans are secured by a fixed charge on properties owned by the Company. These loans were fully repaid in August 2014.
b) The Group has utilised £0.01 million (2013:£ 0.17 million) of a £1.79 million running finance facility (2013: £3.34 million) for a period of one year from Barclays Bank Limited. Interest is payable on quarterly basis at the rate of one months’ KIBOR plus 1.00% (2013: one months’ Karachi Interbank Offered Rate (KIBOR) plus 1.00%) per annum. The facility is secured by first pari passu hypothecation charge on all present and future current assets of Bestway Cement Limited for an amount of £3.97 million and ranking charge over fixed assets of the Bestway Cement Limited of the same amount. c) The Group has utilised £1.48 million (2013: £0.01 million) of a £1.79 million running finance facility (2013: £2.00 million) for a period of one year from Soneri Bank Limited. Interest is payable on a quarterly basis at the rate of three months’ KIBOR plus 0.40% (2013: three months’ KIBOR plus 0.6%) per annum. The facility is secured by first pari passu hypothecation charge on all present and future current assets of Bestway Cement Limited for an amount of £1.48 million.
d) The Group has utilised £6.01 million (2013: £4.37 million) of a £6.85 million running finance facility (2013: £6.68 million) for a period of one year from Allied Bank Limited. Interest is payable on quarterly basis at the rate of one months’ KIBOR plus 0.40% (2013: one month’s KIBOR plus 0.6%) per annum. The facility is secured by a lien over saving accounts and first pari passu hypothecation charge on all present and future assets excluding land and buildings of Bestway Cement Limited for an amount of £7.94 million. e) The Group has utilised £2.68 million (2013: £0.1 million) of a £5.78 million running finance facility (2013: £6.48 million) for a period of one year from Habib Bank Limited. Interest is payable on quarterly basis at the rate of three month’s KIBOR plus 0.60% (2013: three months’ KIBOR plus 0.6%) per annum. The facility is secured by first pari passu hypothecation charge over all present and future movables assets and current assets of Bestway Cement Limited for an amount £7.7 million. f) The Group has utilised £Nil (2013: £0.25 million) of a running finance facility from Allied Bank Limited for a period of one year. The facility has been fully paid down during the year. g) The Group has utilised £Nil (2013: £1.47 million) of a running finance facility from Habib Bank Limited for a period of one year. The facility has been fully paid down during the year. h) The group has utilised £0.99 million (2013: £Nil) of a £2.47 million running finance facility (2013: £Nil) for a period of one year from Askari Bank Limited. Mark up is payable on quarterly basis at the rate of three month’s KIBOR plus 0.40% per annum. The facility is secured by first pari passu hypothecation charge on all present and future current assets of the Bestway Cement Limited for an amount of £6.9 million.
Notes(continued)
Bestway (Holdings) LtdAnnual Report & Accounts 2014
Notes
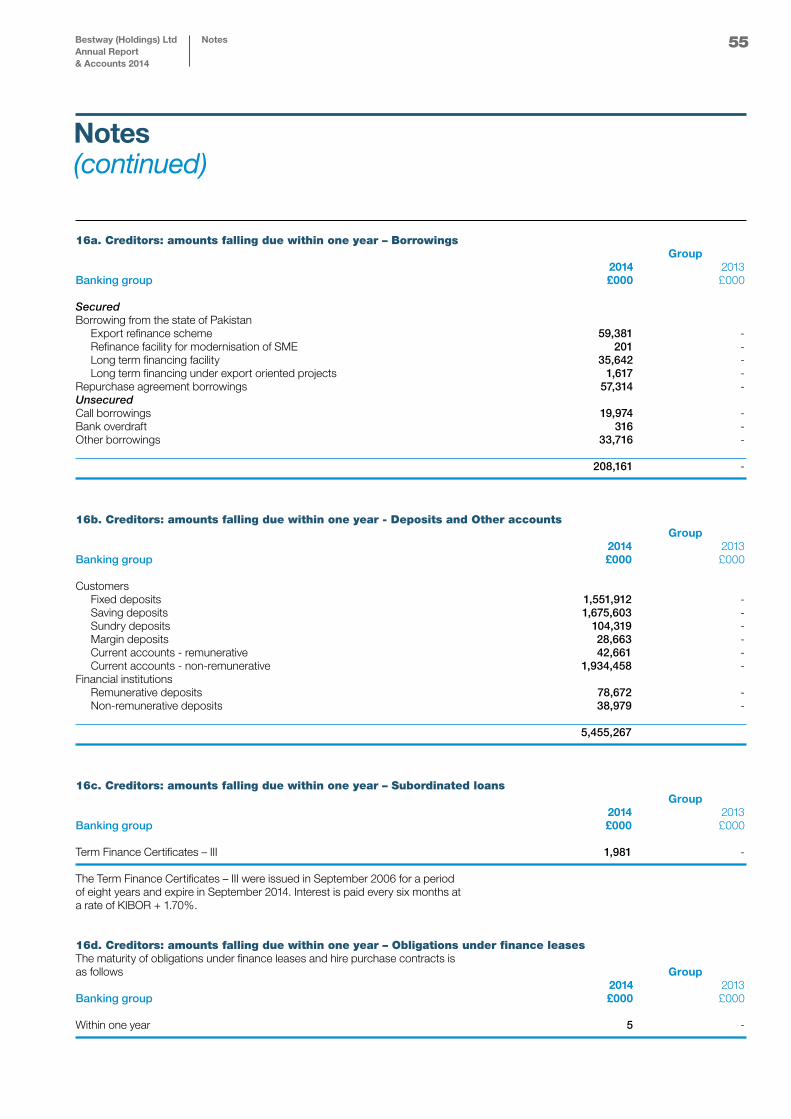
55
16a. Creditors: amounts falling due within one year – Borrowings Group 2014 2013Banking group £000 £000 Secured Borrowing from the state of Pakistan Export refinance scheme 59,381 - Refinance facility for modernisation of SME 201 - Long term financing facility 35,642 - Long term financing under export oriented projects 1,617 -Repurchase agreement borrowings 57,314 -Unsecured Call borrowings 19,974 -Bank overdraft 316 -Other borrowings 33,716 - 208,161 -
16b. Creditors: amounts falling due within one year - Deposits and Other accounts Group 2014 2013Banking group £000 £000 Customers Fixed deposits 1,551,912 - Saving deposits 1,675,603 - Sundry deposits 104,319 - Margin deposits 28,663 - Current accounts - remunerative 42,661 - Current accounts - non-remunerative 1,934,458 -Financial institutions Remunerative deposits 78,672 - Non-remunerative deposits 38,979 - 5,455,267
16c . Creditors: amounts falling due within one year – Subordinated loans Group 2014 2013Banking group £000 £000 Term Finance Certificates – III 1,981 -
The Term Finance Certificates – III were issued in September 2006 for a period of eight years and expire in September 2014. Interest is paid every six months at a rate of KIBOR + 1.70%.
16d. Creditors: amounts falling due within one year – Obligations under finance leasesThe maturity of obligations under finance leases and hire purchase contracts is as follows Group 2014 2013Banking group £000 £000 Within one year 5 -
Notes(continued)
Bestway (Holdings) LtdAnnual Report & Accounts 2014
Notes
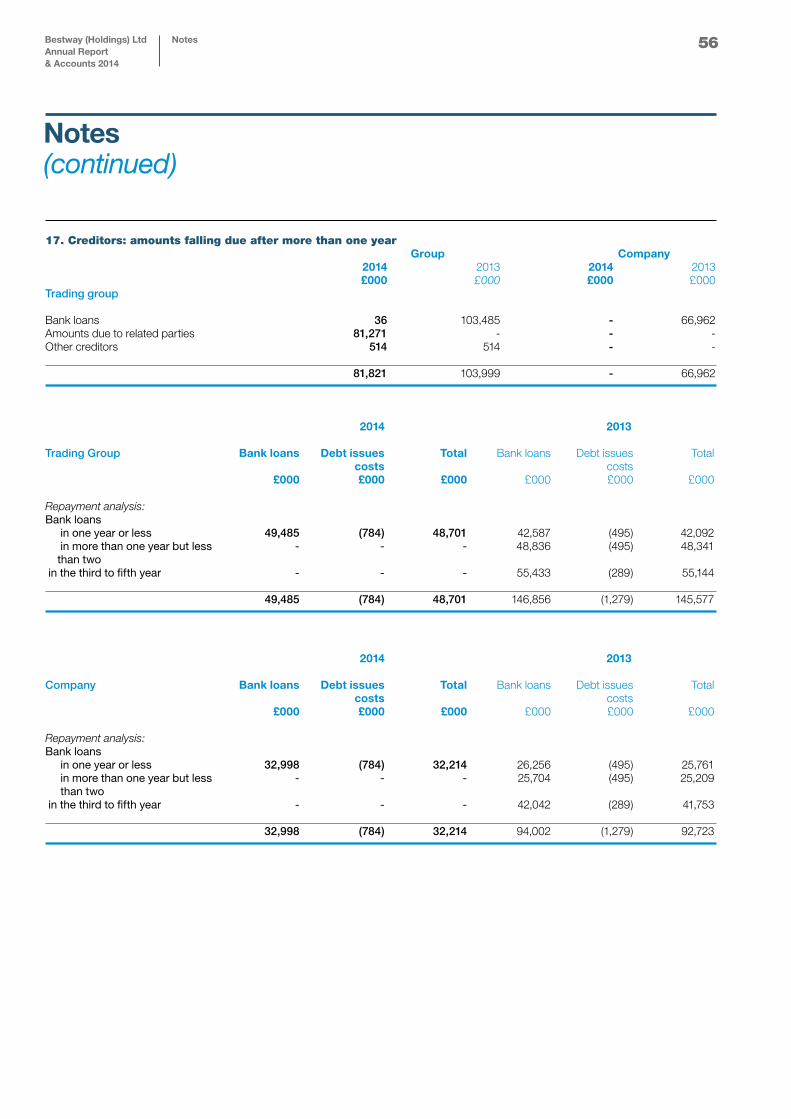
56
17. Creditors: amounts falling due after more than one year Group Company 2014 2013 2014 2013 £000 £000 £000 £000Trading group Bank loans 36 103,485 - 66,962Amounts due to related parties 81,271 - - -Other creditors 514 514 - - 81,821 103,999 - 66,962
2014 2013
Trading Group Bank loans Debt issues Total Bank loans Debt issues Total costs costs £000 £000 £000 £000 £000 £000 Repayment analysis:Bank loans in one year or less 49,485 (784) 48,701 42,587 (495) 42,092 in more than one year but less - - - 48,836 (495) 48,341 than two in the third to fifth year - - - 55,433 (289) 55,144 49,485 (784) 48,701 146,856 (1,279) 145,577
2014 2013
Company Bank loans Debt issues Total Bank loans Debt issues Total costs costs £000 £000 £000 £000 £000 £000 Repayment analysis:Bank loans in one year or less 32,998 (784) 32,214 26,256 (495) 25,761 in more than one year but less - - - 25,704 (495) 25,209 than two in the third to fifth year - - - 42,042 (289) 41,753 32,998 (784) 32,214 94,002 (1,279) 92,723
Notes(continued)
Bestway (Holdings) LtdAnnual Report & Accounts 2014
Notes
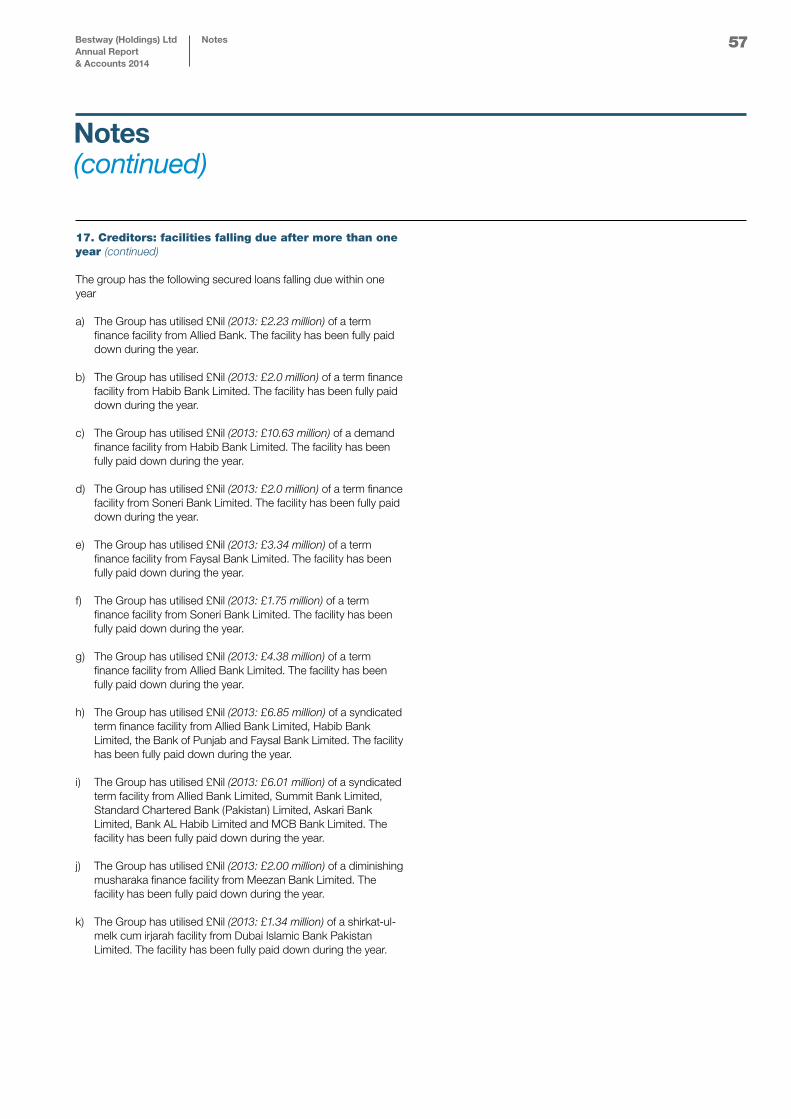
57
17. Creditors: facilities falling due after more than one year (continued)
The group has the following secured loans falling due within one year
a) The Group has utilised £Nil (2013: £2.23 million) of a term finance facility from Allied Bank. The facility has been fully paid down during the year.
b) The Group has utilised £Nil (2013: £2.0 million) of a term finance facility from Habib Bank Limited. The facility has been fully paid down during the year.
c) The Group has utilised £Nil (2013: £10.63 million) of a demand finance facility from Habib Bank Limited. The facility has been fully paid down during the year.
d) The Group has utilised £Nil (2013: £2.0 million) of a term finance facility from Soneri Bank Limited. The facility has been fully paid down during the year.
e) The Group has utilised £Nil (2013: £3.34 million) of a term finance facility from Faysal Bank Limited. The facility has been fully paid down during the year.
f) The Group has utilised £Nil (2013: £1.75 million) of a term finance facility from Soneri Bank Limited. The facility has been fully paid down during the year.
g) The Group has utilised £Nil (2013: £4.38 million) of a term finance facility from Allied Bank Limited. The facility has been fully paid down during the year.
h) The Group has utilised £Nil (2013: £6.85 million) of a syndicated term finance facility from Allied Bank Limited, Habib Bank Limited, the Bank of Punjab and Faysal Bank Limited. The facility has been fully paid down during the year.
i) The Group has utilised £Nil (2013: £6.01 million) of a syndicated term facility from Allied Bank Limited, Summit Bank Limited, Standard Chartered Bank (Pakistan) Limited, Askari Bank Limited, Bank AL Habib Limited and MCB Bank Limited. The facility has been fully paid down during the year.
j) The Group has utilised £Nil (2013: £2.00 million) of a diminishing musharaka finance facility from Meezan Bank Limited. The facility has been fully paid down during the year.
k) The Group has utilised £Nil (2013: £1.34 million) of a shirkat-ul- melk cum irjarah facility from Dubai Islamic Bank Pakistan Limited. The facility has been fully paid down during the year.
Notes(continued)
Bestway (Holdings) LtdAnnual Report & Accounts 2014
Notes
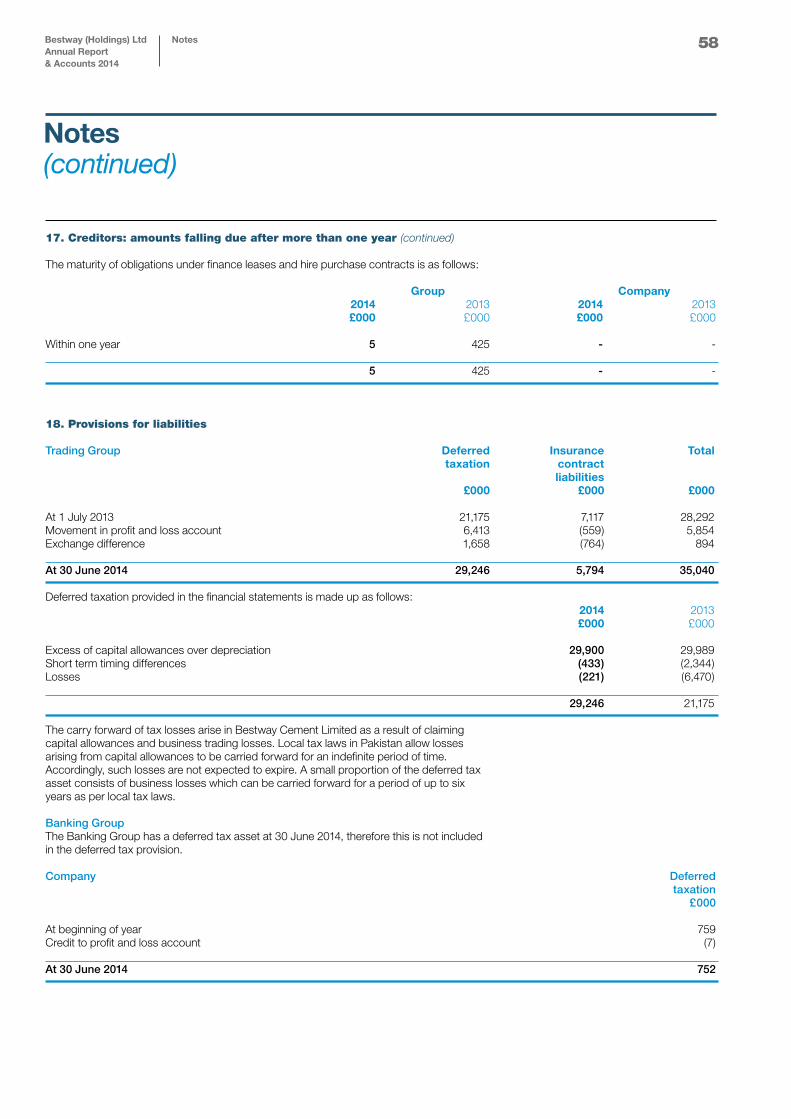
58
17. Creditors: amounts falling due after more than one year (continued) The maturity of obligations under finance leases and hire purchase contracts is as follows: Group Company 2014 2013 2014 2013 £000 £000 £000 £000 Within one year 5 425 - - 5 425 - -
18. Provisions for liabilities
Trading Group Deferred Insurance Total taxation contract liabilities £000 £000 £000 At 1 July 2013 21,175 7,117 28,292Movement in profit and loss account 6,413 (559) 5,854Exchange difference 1,658 (764) 894 At 30 June 2014 29,246 5,794 35,040 Deferred taxation provided in the financial statements is made up as follows: 2014 2013 £000 £000 Excess of capital allowances over depreciation 29,900 29,989Short term timing differences (433) (2,344)Losses (221) (6,470) 29,246 21,175 The carry forward of tax losses arise in Bestway Cement Limited as a result of claiming capital allowances and business trading losses. Local tax laws in Pakistan allow losses arising from capital allowances to be carried forward for an indefinite period of time. Accordingly, such losses are not expected to expire. A small proportion of the deferred tax asset consists of business losses which can be carried forward for a period of up to six years as per local tax laws. Banking Group The Banking Group has a deferred tax asset at 30 June 2014, therefore this is not included in the deferred tax provision. Company Deferred taxation £000 At beginning of year 759Credit to profit and loss account (7) At 30 June 2014 752
Notes(continued)
Bestway (Holdings) LtdAnnual Report & Accounts 2014
Notes
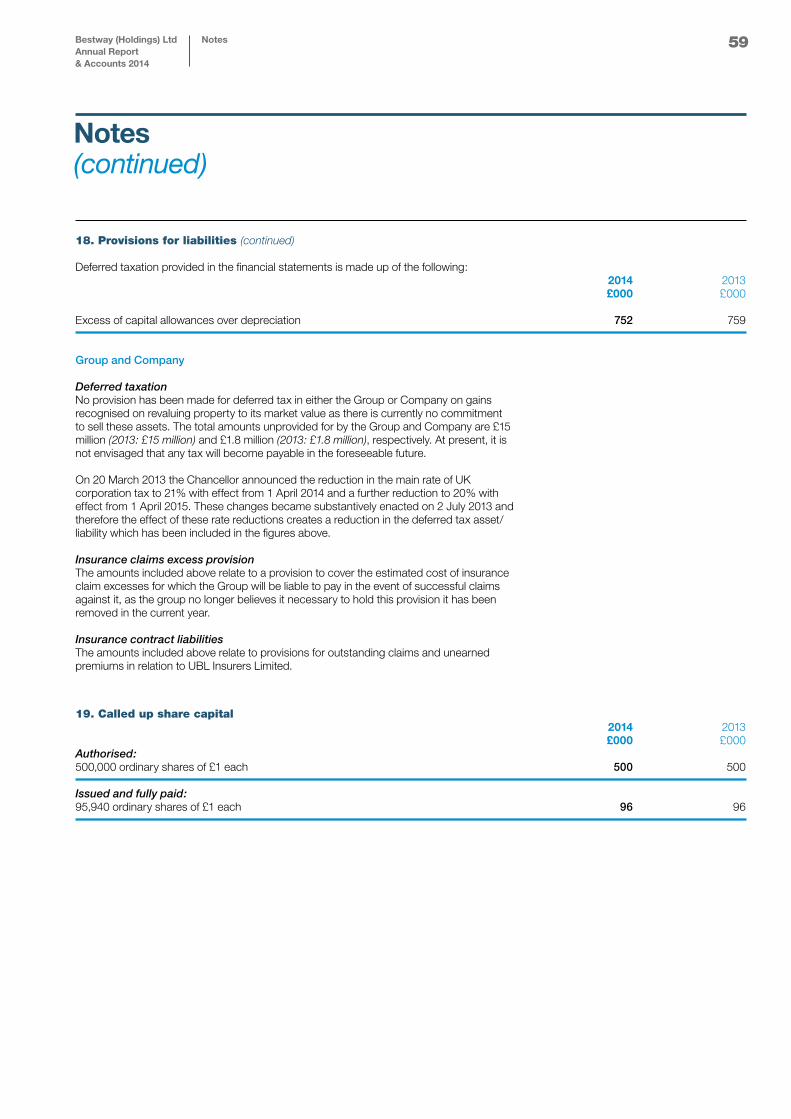
59
18. Provisions for liabilities (continued)
Deferred taxation provided in the financial statements is made up of the following: 2014 2013 £000 £000 Excess of capital allowances over depreciation 752 759
Group and Company Deferred taxationNo provision has been made for deferred tax in either the Group or Company on gains recognised on revaluing property to its market value as there is currently no commitment to sell these assets. The total amounts unprovided for by the Group and Company are £15 million (2013: £15 million) and £1.8 million (2013: £1.8 million), respectively. At present, it is not envisaged that any tax will become payable in the foreseeable future. On 20 March 2013 the Chancellor announced the reduction in the main rate of UK corporation tax to 21% with effect from 1 April 2014 and a further reduction to 20% with effect from 1 April 2015. These changes became substantively enacted on 2 July 2013 and therefore the effect of these rate reductions creates a reduction in the deferred tax asset/liability which has been included in the figures above.
Insurance claims excess provisionThe amounts included above relate to a provision to cover the estimated cost of insurance claim excesses for which the Group will be liable to pay in the event of successful claims against it, as the group no longer believes it necessary to hold this provision it has been removed in the current year.
Insurance contract liabilitiesThe amounts included above relate to provisions for outstanding claims and unearned premiums in relation to UBL Insurers Limited.
19. Called up share capital 2014 2013 £000 £000 Authorised: 500,000 ordinary shares of £1 each 500 500 Issued and fully paid: 95,940 ordinary shares of £1 each 96 96
Notes(continued)
Bestway (Holdings) LtdAnnual Report & Accounts 2014
Notes
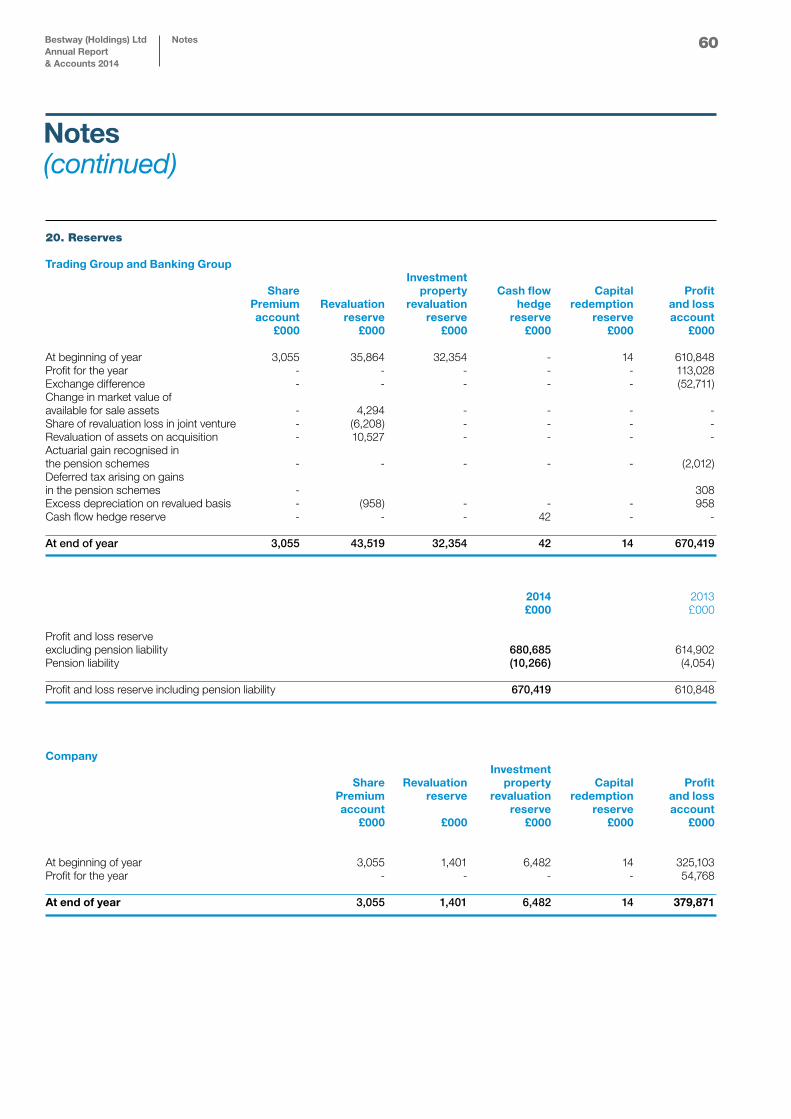
60
20. Reserves Trading Group and Banking Group Investment Share property Cash flow Capital Profit Premium Revaluation revaluation hedge redemption and loss account reserve reserve reserve reserve account £000 £000 £000 £000 £000 £000
At beginning of year 3,055 35,864 32,354 - 14 610,848Profit for the year - - - - - 113,028Exchange difference - - - - - (52,711)Change in market value of available for sale assets - 4,294 - - - -Share of revaluation loss in joint venture - (6,208) - - - -Revaluation of assets on acquisition - 10,527 - - - -Actuarial gain recognised in the pension schemes - - - - - (2,012)Deferred tax arising on gains in the pension schemes - 308Excess depreciation on revalued basis - (958) - - - 958Cash flow hedge reserve - - - 42 - - At end of year 3,055 43,519 32,354 42 14 670,419
2014 2013 £000 £000 Profit and loss reserve excluding pension liability 680,685 614,902Pension liability (10,266) (4,054) Profit and loss reserve including pension liability 670,419 610,848
Company Investment Share Revaluation property Capital Profit Premium reserve revaluation redemption and loss account reserve reserve account £000 £000 £000 £000 £000
At beginning of year 3,055 1,401 6,482 14 325,103Profit for the year - - - - 54,768 At end of year 3,055 1,401 6,482 14 379,871
Notes(continued)
Bestway (Holdings) LtdAnnual Report & Accounts 2014
Notes
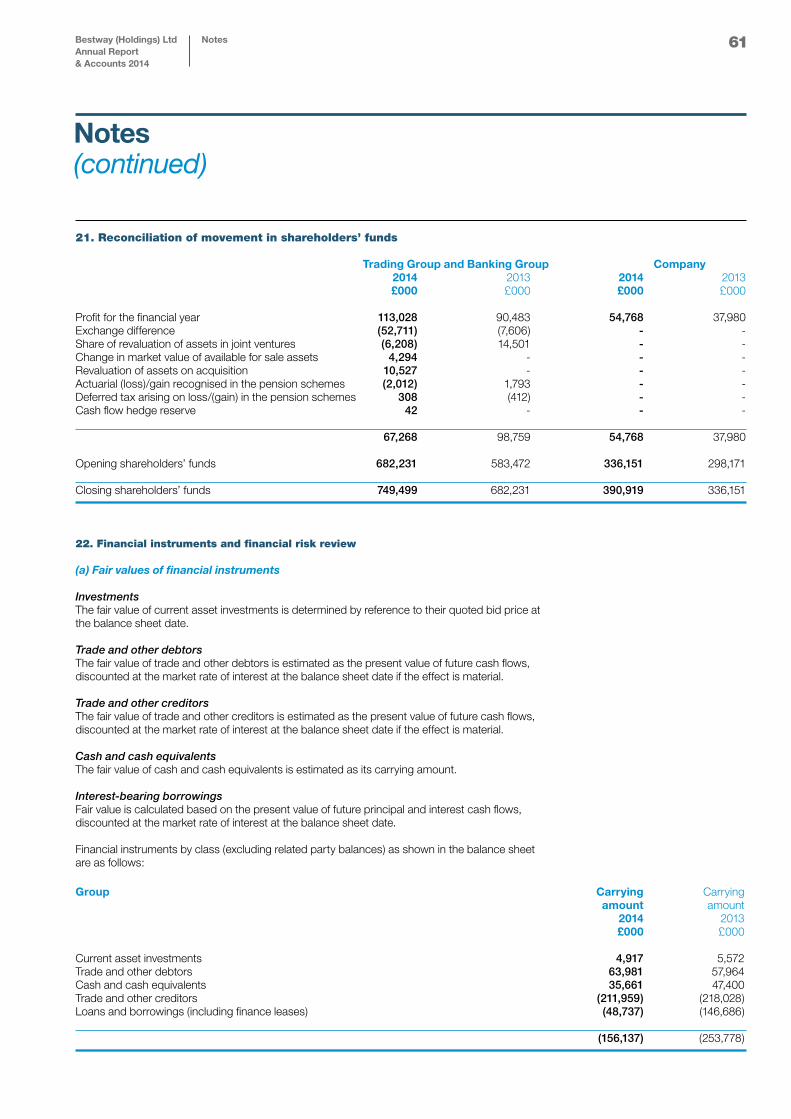
61
21. Reconciliation of movement in shareholders’ funds Trading Group and Banking Group Company 2014 2013 2014 2013 £000 £000 £000 £000
Profit for the financial year 113,028 90,483 54,768 37,980Exchange difference (52,711) (7,606) - -Share of revaluation of assets in joint ventures (6,208) 14,501 - -Change in market value of available for sale assets 4,294 - - -Revaluation of assets on acquisition 10,527 - - -Actuarial (loss)/gain recognised in the pension schemes (2,012) 1,793 - -Deferred tax arising on loss/(gain) in the pension schemes 308 (412) - -Cash flow hedge reserve 42 - - - 67,268 98,759 54,768 37,980 Opening shareholders’ funds 682,231 583,472 336,151 298,171 Closing shareholders’ funds 749,499 682,231 390,919 336,151
22. Financial instruments and financial risk review
(a) Fair values of financial instruments
Investments The fair value of current asset investments is determined by reference to their quoted bid price at the balance sheet date.
Trade and other debtorsThe fair value of trade and other debtors is estimated as the present value of future cash flows, discounted at the market rate of interest at the balance sheet date if the effect is material.
Trade and other creditorsThe fair value of trade and other creditors is estimated as the present value of future cash flows, discounted at the market rate of interest at the balance sheet date if the effect is material.
Cash and cash equivalentsThe fair value of cash and cash equivalents is estimated as its carrying amount.
Interest-bearing borrowingsFair value is calculated based on the present value of future principal and interest cash flows, discounted at the market rate of interest at the balance sheet date.
Financial instruments by class (excluding related party balances) as shown in the balance sheet are as follows:
Group Carrying Carrying amount amount 2014 2013 £000 £000
Current asset investments 4,917 5,572Trade and other debtors 63,981 57,964Cash and cash equivalents 35,661 47,400Trade and other creditors (211,959) (218,028)Loans and borrowings (including finance leases) (48,737) (146,686) (156,137) (253,778)
Notes(continued)
Bestway (Holdings) LtdAnnual Report & Accounts 2014
Notes
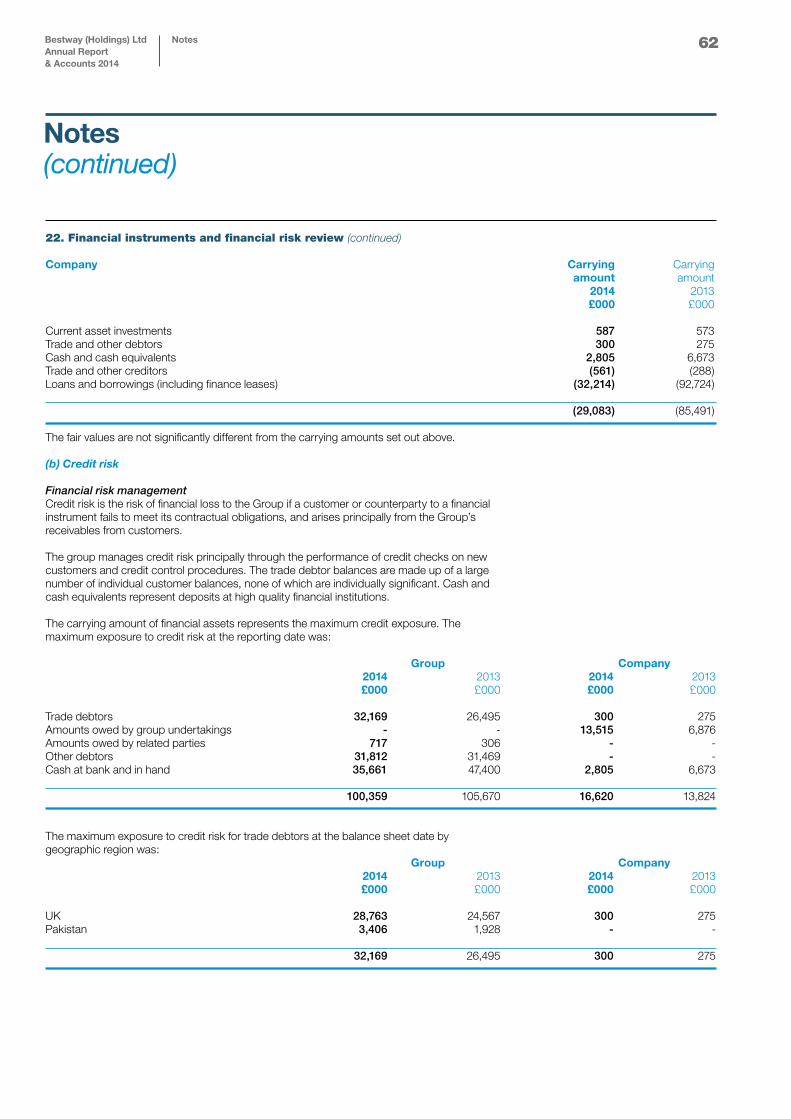
62
22. Financial instruments and financial risk review (continued)
Company Carrying Carrying amount amount 2014 2013 £000 £000
Current asset investments 587 573Trade and other debtors 300 275Cash and cash equivalents 2,805 6,673Trade and other creditors (561) (288)Loans and borrowings (including finance leases) (32,214) (92,724) (29,083) (85,491)
The fair values are not significantly different from the carrying amounts set out above. (b) Credit risk
Financial risk management Credit risk is the risk of financial loss to the Group if a customer or counterparty to a financial instrument fails to meet its contractual obligations, and arises principally from the Group’s receivables from customers. The group manages credit risk principally through the performance of credit checks on new customers and credit control procedures. The trade debtor balances are made up of a large number of individual customer balances, none of which are individually significant. Cash and cash equivalents represent deposits at high quality financial institutions. The carrying amount of financial assets represents the maximum credit exposure. The maximum exposure to credit risk at the reporting date was: Group Company 2014 2013 2014 2013 £000 £000 £000 £000
Trade debtors 32,169 26,495 300 275Amounts owed by group undertakings - - 13,515 6,876Amounts owed by related parties 717 306 - -Other debtors 31,812 31,469 - -Cash at bank and in hand 35,661 47,400 2,805 6,673 100,359 105,670 16,620 13,824
The maximum exposure to credit risk for trade debtors at the balance sheet date by geographic region was: Group Company 2014 2013 2014 2013 £000 £000 £000 £000
UK 28,763 24,567 300 275Pakistan 3,406 1,928 - - 32,169 26,495 300 275
Notes(continued)
Bestway (Holdings) LtdAnnual Report & Accounts 2014
Notes
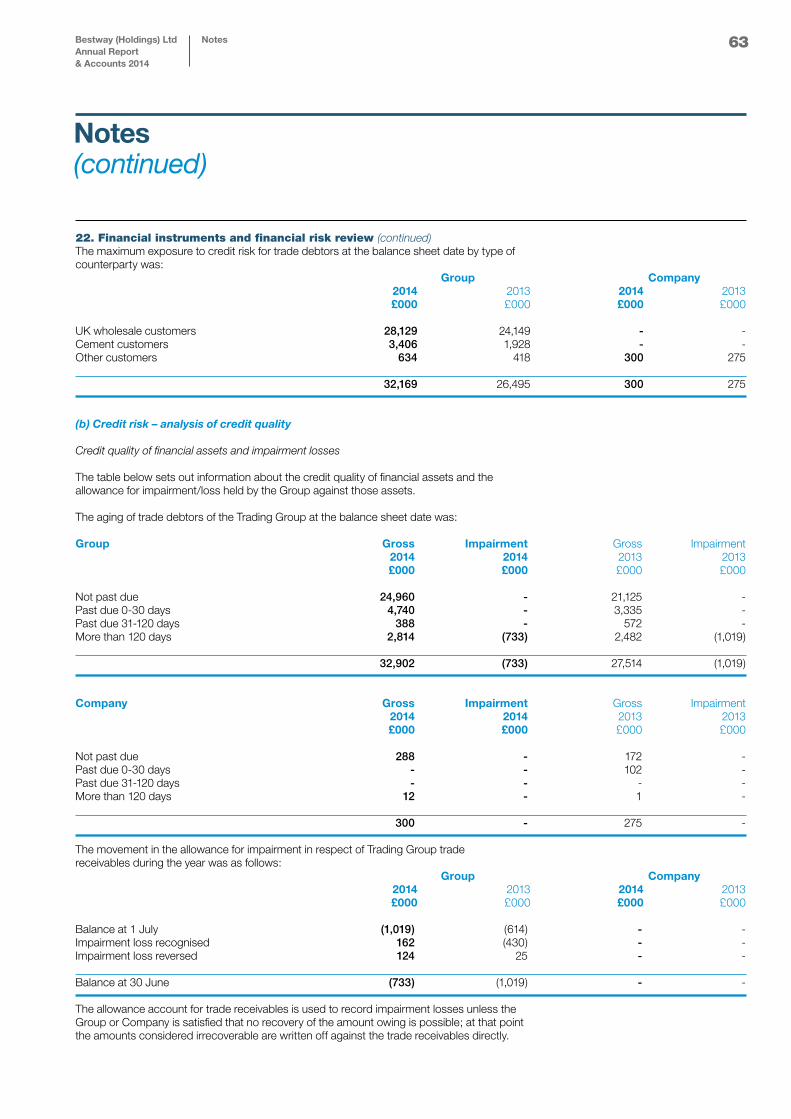
63
22. Financial instruments and financial risk review (continued) The maximum exposure to credit risk for trade debtors at the balance sheet date by type of counterparty was: Group Company 2014 2013 2014 2013 £000 £000 £000 £000
UK wholesale customers 28,129 24,149 - -Cement customers 3,406 1,928 - -Other customers 634 418 300 275 32,169 26,495 300 275
(b) Credit risk – analysis of credit quality
Credit quality of financial assets and impairment losses The table below sets out information about the credit quality of financial assets and the allowance for impairment/loss held by the Group against those assets.
The aging of trade debtors of the Trading Group at the balance sheet date was: Group Gross Impairment Gross Impairment 2014 2014 2013 2013 £000 £000 £000 £000
Not past due 24,960 - 21,125 -Past due 0-30 days 4,740 - 3,335 -Past due 31-120 days 388 - 572 -More than 120 days 2,814 (733) 2,482 (1,019) 32,902 (733) 27,514 (1,019) Company Gross Impairment Gross Impairment 2014 2014 2013 2013 £000 £000 £000 £000
Not past due 288 - 172 -Past due 0-30 days - - 102 -Past due 31-120 days - - - -More than 120 days 12 - 1 - 300 - 275 - The movement in the allowance for impairment in respect of Trading Group trade receivables during the year was as follows: Group Company 2014 2013 2014 2013 £000 £000 £000 £000
Balance at 1 July (1,019) (614) - -Impairment loss recognised 162 (430) - -Impairment loss reversed 124 25 - - Balance at 30 June (733) (1,019) - - The allowance account for trade receivables is used to record impairment losses unless the Group or Company is satisfied that no recovery of the amount owing is possible; at that point the amounts considered irrecoverable are written off against the trade receivables directly.
Notes(continued)
Bestway (Holdings) LtdAnnual Report & Accounts 2014
Notes
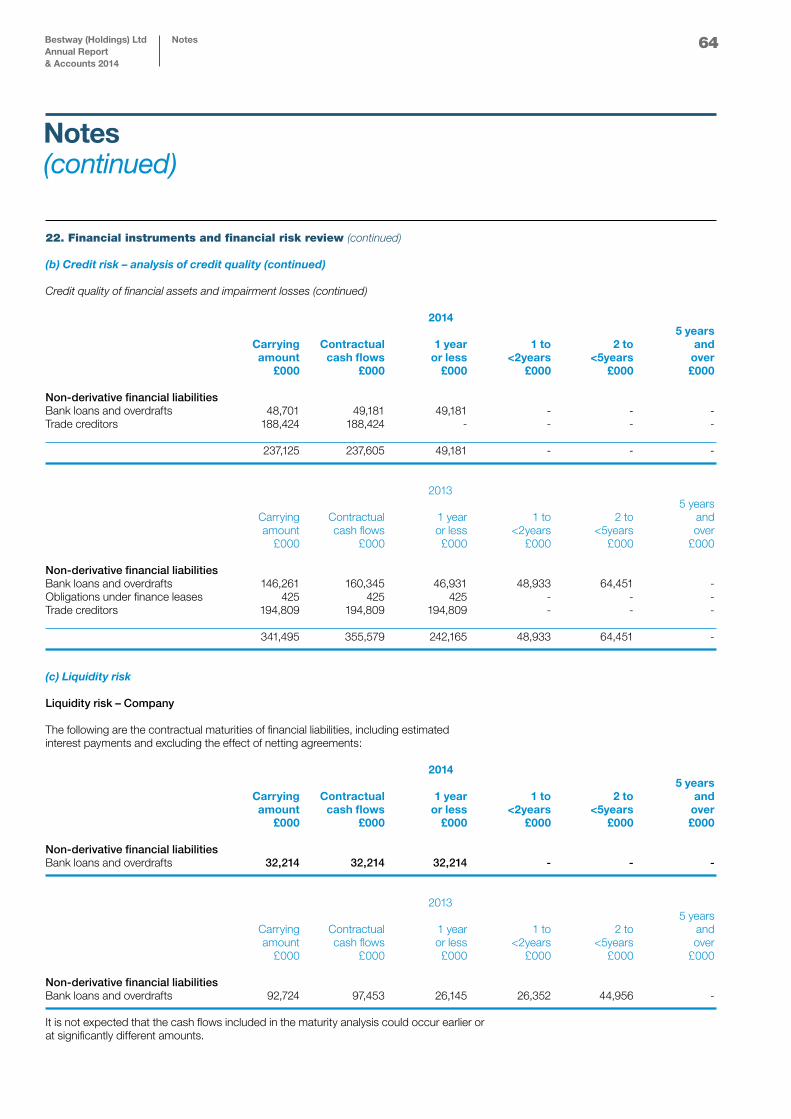
64
22. Financial instruments and financial risk review (continued)
(b) Credit risk – analysis of credit quality (continued)
Credit quality of financial assets and impairment losses (continued) 2014 5 years Carrying Contractual 1 year 1 to 2 to and amount cash flows or less <2years <5years over £000 £000 £000 £000 £000 £000 Non-derivative financial liabilities Bank loans and overdrafts 48,701 49,181 49,181 - - -Trade creditors 188,424 188,424 - - - - 237,125 237,605 49,181 - - -
2013 5 years Carrying Contractual 1 year 1 to 2 to and amount cash flows or less <2years <5years over £000 £000 £000 £000 £000 £000 Non-derivative financial liabilities Bank loans and overdrafts 146,261 160,345 46,931 48,933 64,451 -Obligations under finance leases 425 425 425 - - -Trade creditors 194,809 194,809 194,809 - - - 341,495 355,579 242,165 48,933 64,451 - (c) Liquidity risk Liquidity risk – Company The following are the contractual maturities of financial liabilities, including estimated interest payments and excluding the effect of netting agreements: 2014 5 years Carrying Contractual 1 year 1 to 2 to and amount cash flows or less <2years <5years over £000 £000 £000 £000 £000 £000 Non-derivative financial liabilities Bank loans and overdrafts 32,214 32,214 32,214 - - - 2013 5 years Carrying Contractual 1 year 1 to 2 to and amount cash flows or less <2years <5years over £000 £000 £000 £000 £000 £000 Non-derivative financial liabilities Bank loans and overdrafts 92,724 97,453 26,145 26,352 44,956 - It is not expected that the cash flows included in the maturity analysis could occur earlier or at significantly different amounts.
Notes(continued)
Bestway (Holdings) LtdAnnual Report & Accounts 2014
Notes
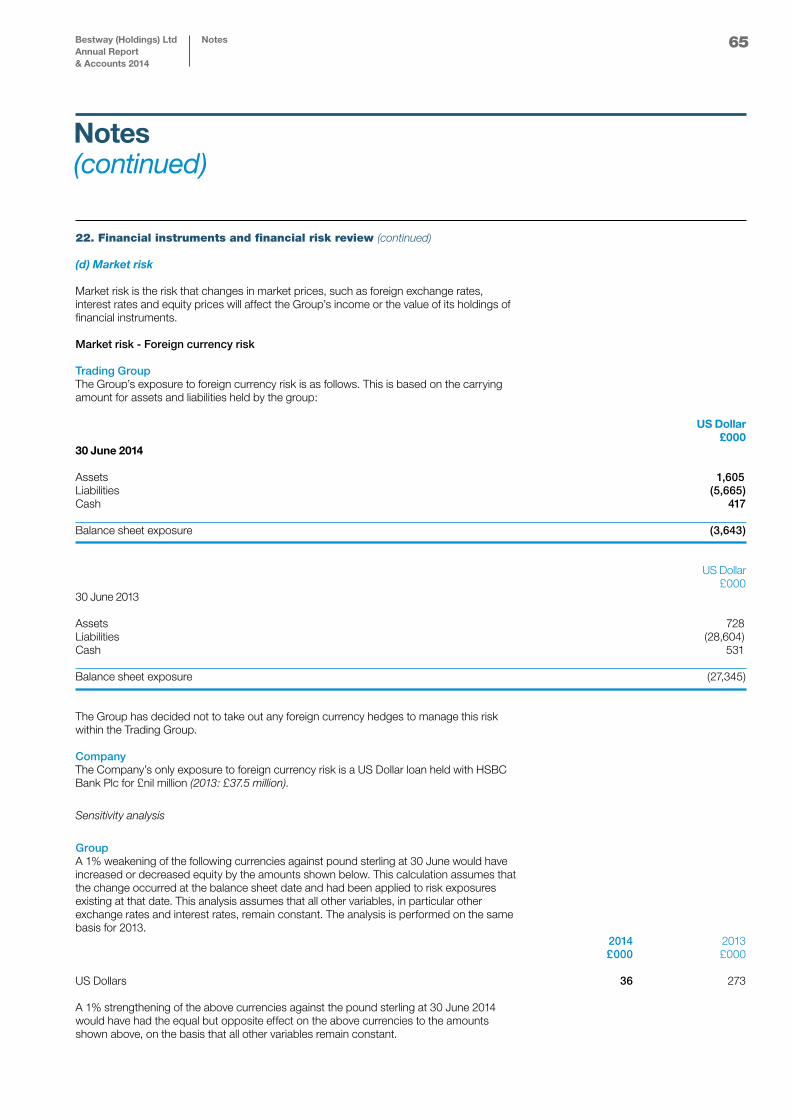
65
22. Financial instruments and financial risk review (continued)
(d) Market risk
Market risk is the risk that changes in market prices, such as foreign exchange rates, interest rates and equity prices will affect the Group’s income or the value of its holdings of financial instruments.
Market risk - Foreign currency risk
Trading Group The Group’s exposure to foreign currency risk is as follows. This is based on the carrying amount for assets and liabilities held by the group: US Dollar £000 30 June 2014 Assets 1,605Liabilities (5,665)Cash 417 Balance sheet exposure (3,643) US Dollar £000 30 June 2013 Assets 728Liabilities (28,604)Cash 531 Balance sheet exposure (27,345)
The Group has decided not to take out any foreign currency hedges to manage this risk within the Trading Group.
Company The Company’s only exposure to foreign currency risk is a US Dollar loan held with HSBC Bank Plc for £nil million (2013: £37.5 million).
Sensitivity analysis
GroupA 1% weakening of the following currencies against pound sterling at 30 June would have increased or decreased equity by the amounts shown below. This calculation assumes that the change occurred at the balance sheet date and had been applied to risk exposures existing at that date. This analysis assumes that all other variables, in particular other exchange rates and interest rates, remain constant. The analysis is performed on the same basis for 2013. 2014 2013 £000 £000 US Dollars 36 273 A 1% strengthening of the above currencies against the pound sterling at 30 June 2014 would have had the equal but opposite effect on the above currencies to the amounts shown above, on the basis that all other variables remain constant.
Notes(continued)
Bestway (Holdings) LtdAnnual Report & Accounts 2014
Notes
66
22. Financial instruments and financial risk review (continued) d) Market risk (continued) Market risk – Interest rate risk
The Group has exposure to interest rate risk on bank loans of £14.1 million which bear interest on a KIBOR plus basis. A 1.0% change in interest rates will increase or decrease equity by £14,100. The Group and Company have exposure to interest rate risk on bank loans of £35.4 million which bear interest on a Bank of England base rate plus basis. A 1.0% change in interest rates will increase or decrease equity by £35,400. The Group and Company have decided not to take out any interest rate hedges to manage this risk. Market risk – Equity price risk The Group’s and Company’s exposure to equity price risk arises from its investment in equity securities which are classified as available for sale financial assets or designated at fair value through profit or loss and are shown on the balance sheet as current asset investments (see note 15).
Banking Group This section presents information about the Banking Group’s expo-sure to and its management and control of risks, in particular, the primary risks associated with its use of financial instruments such as credit, market, liquidity, and operational risks.
Risk management The Banking Group has an integrated risk management structure in place. The Board Risk Management Committee (BMRC) over-sees the entire risk management process of the Bank. The Risk and Credit Policy Group is responsible for the development and implementation of all risks policies as approved by the BMRC/Board of Directors. The Group is organized into the functions of Market & Financial Institutions Risk, Credit Policy & research, Credit Risk Management and Operational Risk & Basel II. Each risk function is headed by a senior manager who reports directly to the Group Head, Risk and Credit Policy. The role of the Risk and Credit Policy Group include:
• DeterminingguidelinesrelatingtotheBankingGroup’srisk appetite;• Recommendingriskmanagementpoliciesinaccordancewith the Prudential Regulations, Basel II framework and international best practices;• Reviewingpolicies/manualsandensuringthattheseare in accordance with BMRC/Board of Directors approved risk management policies;• Developingsystemsandresourcestoreviewthekeyrisk exposures of the Banking Group;• Approvingcreditsandgrantingapprovalauthoritytoqualified and experienced individuals;• ReviewingtheadequacyofcredittrainingacrosstheBanking Group;• Organizingportfolioreviewsfocusingonqualityassessment,risk profiles, industry concentrations, etc.; and• Settingsystemstoidentifysignificantportfolioindicators, problem credits and level of provisioning required. (e) Fair value of financial instruments The fair values of financial assets and financial liabilities that are traded in active markets are based on quoted market prices or dealer price quotations. For all other financial instruments, the Group determines fair values using other valuation techniques. For financial instruments that trade infrequently and have little price transparency, fair value is less objective, and requires varying degrees of judgement depending on liquidity, concentration, uncertainty of market factors, pricing assumptions and other risks affecting the specific instrument. The table over the page analyses financial instruments, into a fair value hierarchy based on the valuation technique used to determine fair value. • Level1:quotedprices(unadjusted)inactivemarketsforidentical assets or liabilities;• Level2:inputsotherthanquotedpricesincludedwithinLevel 1 that are observable for the asset or liability, either directly (i.e., as prices) or indirectly (i.e., derived from prices); and• Level3:inputsfortheassetorliabilitythatarenotbasedon observable market data (unobservable inputs).
Notes(continued)
Bestway (Holdings) LtdAnnual Report & Accounts 2014
Notes
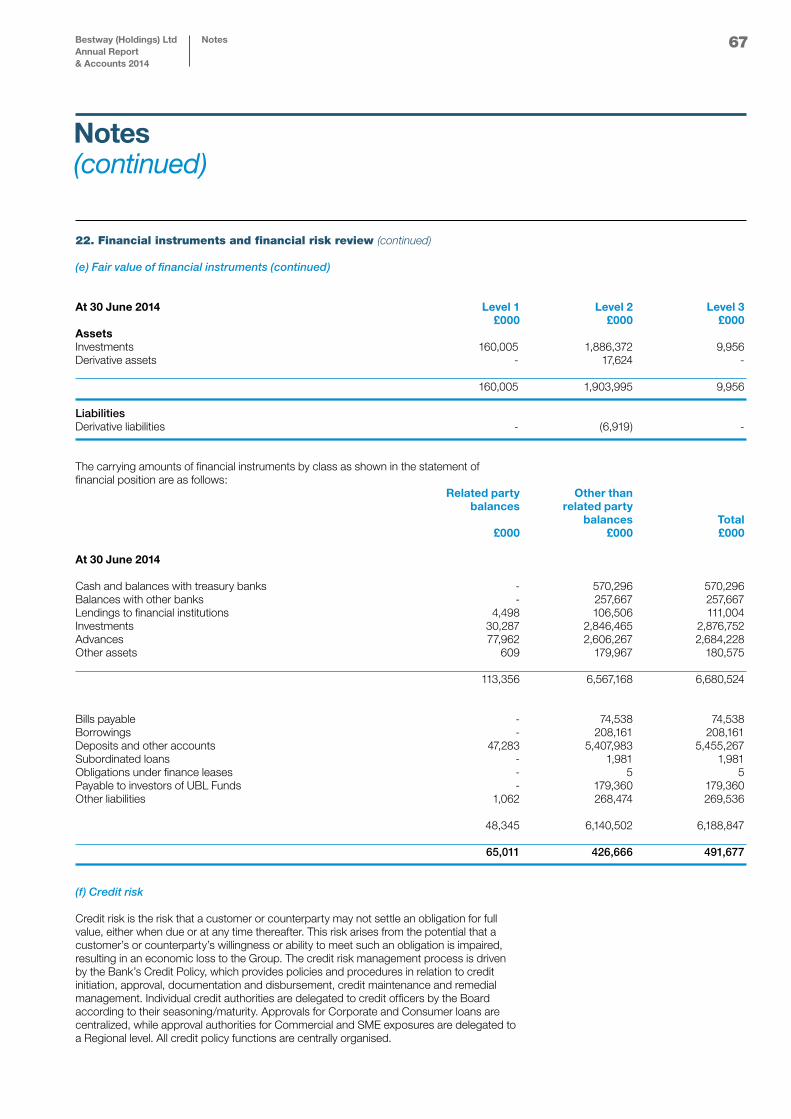
67
22. Financial instruments and financial risk review (continued)
(e) Fair value of financial instruments (continued)
At 30 June 2014 Level 1 Level 2 Level 3 £000 £000 £000Assets Investments 160,005 1,886,372 9,956Derivative assets - 17,624 - 160,005 1,903,995 9,956 Liabilities Derivative liabilities - (6,919) - The carrying amounts of financial instruments by class as shown in the statement of financial position are as follows: Related party Other than balances related party balances Total £000 £000 £000 At 30 June 2014 Cash and balances with treasury banks - 570,296 570,296Balances with other banks - 257,667 257,667Lendings to financial institutions 4,498 106,506 111,004Investments 30,287 2,846,465 2,876,752Advances 77,962 2,606,267 2,684,228Other assets 609 179,967 180,575 113,356 6,567,168 6,680,524
Bills payable - 74,538 74,538Borrowings - 208,161 208,161Deposits and other accounts 47,283 5,407,983 5,455,267Subordinated loans - 1,981 1,981Obligations under finance leases - 5 5Payable to investors of UBL Funds - 179,360 179,360Other liabilities 1,062 268,474 269,536 48,345 6,140,502 6,188,847
65,011 426,666 491,677 (f) Credit risk
Credit risk is the risk that a customer or counterparty may not settle an obligation for full value, either when due or at any time thereafter. This risk arises from the potential that a customer’s or counterparty’s willingness or ability to meet such an obligation is impaired, resulting in an economic loss to the Group. The credit risk management process is driven by the Bank’s Credit Policy, which provides policies and procedures in relation to credit initiation, approval, documentation and disbursement, credit maintenance and remedial management. Individual credit authorities are delegated to credit officers by the Board according to their seasoning/maturity. Approvals for Corporate and Consumer loans are centralized, while approval authorities for Commercial and SME exposures are delegated to a Regional level. All credit policy functions are centrally organised.
Notes(continued)
Bestway (Holdings) LtdAnnual Report & Accounts 2014
Notes
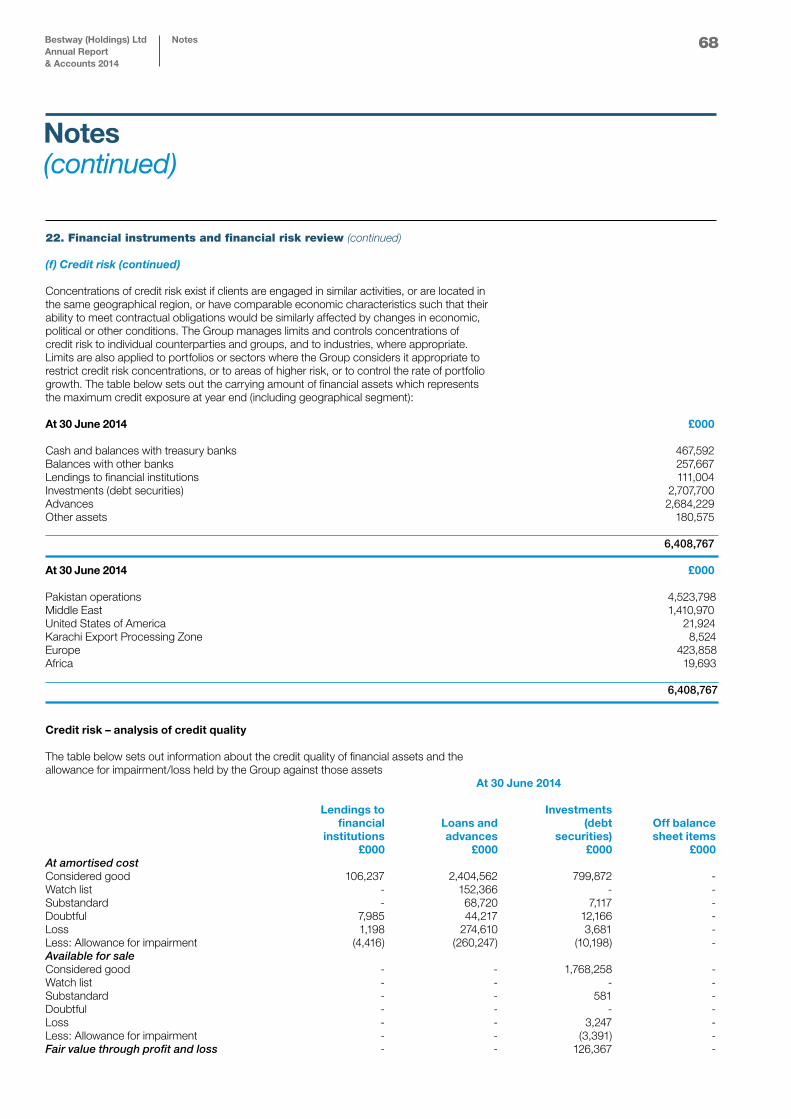
68
22. Financial instruments and financial risk review (continued)
(f) Credit risk (continued)
Concentrations of credit risk exist if clients are engaged in similar activities, or are located in the same geographical region, or have comparable economic characteristics such that their ability to meet contractual obligations would be similarly affected by changes in economic, political or other conditions. The Group manages limits and controls concentrations of credit risk to individual counterparties and groups, and to industries, where appropriate. Limits are also applied to portfolios or sectors where the Group considers it appropriate to restrict credit risk concentrations, or to areas of higher risk, or to control the rate of portfolio growth. The table below sets out the carrying amount of financial assets which represents the maximum credit exposure at year end (including geographical segment): At 30 June 2014 £000
Cash and balances with treasury banks 467,592Balances with other banks 257,667Lendings to financial institutions 111,004Investments (debt securities) 2,707,700Advances 2,684,229Other assets 180,575 6,408,767 At 30 June 2014 £000
Pakistan operations 4,523,798Middle East 1,410,970 United States of America 21,924 Karachi Export Processing Zone 8,524 Europe 423,858 Africa 19,693 6,408,767 Credit risk – analysis of credit quality
The table below sets out information about the credit quality of financial assets and the allowance for impairment/loss held by the Group against those assets At 30 June 2014 Lendings to Investments financial Loans and (debt Off balance institutions advances securities) sheet items £000 £000 £000 £000 At amortised costConsidered good 106,237 2,404,562 799,872 - Watch list - 152,366 - - Substandard - 68,720 7,117 - Doubtful 7,985 44,217 12,166 - Loss 1,198 274,610 3,681 - Less: Allowance for impairment (4,416) (260,247) (10,198) - Available for sale Considered good - - 1,768,258 - Watch list - - - - Substandard - - 581 - Doubtful - - - - Loss - - 3,247 - Less: Allowance for impairment - - (3,391) -Fair value through profit and loss - - 126,367 -
Notes(continued)
Bestway (Holdings) LtdAnnual Report & Accounts 2014
Notes
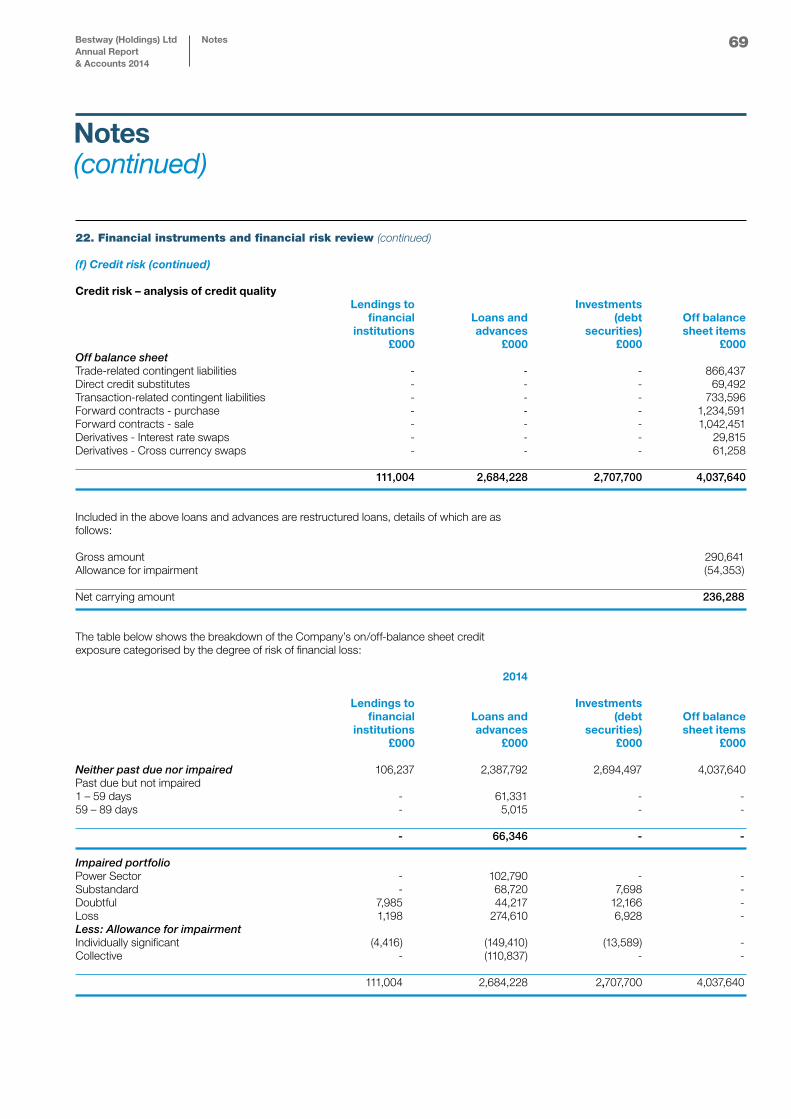
69
22. Financial instruments and financial risk review (continued)
(f) Credit risk (continued)
Credit risk – analysis of credit quality Lendings to Investments financial Loans and (debt Off balance institutions advances securities) sheet items £000 £000 £000 £000 Off balance sheet Trade-related contingent liabilities - - - 866,437 Direct credit substitutes - - - 69,492 Transaction-related contingent liabilities - - - 733,596 Forward contracts - purchase - - - 1,234,591 Forward contracts - sale - - - 1,042,451 Derivatives - Interest rate swaps - - - 29,815 Derivatives - Cross currency swaps - - - 61,258 111,004 2,684,228 2,707,700 4,037,640 Included in the above loans and advances are restructured loans, details of which are as follows:
Gross amount 290,641 Allowance for impairment (54,353) Net carrying amount 236,288 The table below shows the breakdown of the Company’s on/off-balance sheet credit exposure categorised by the degree of risk of financial loss: 2014 Lendings to Investments financial Loans and (debt Off balance institutions advances securities) sheet items £000 £000 £000 £000 Neither past due nor impaired 106,237 2,387,792 2,694,497 4,037,640 Past due but not impaired1 – 59 days - 61,331 - - 59 – 89 days - 5,015 - - - 66,346 - - Impaired portfolio Power Sector - 102,790 - -Substandard - 68,720 7,698 - Doubtful 7,985 44,217 12,166 - Loss 1,198 274,610 6,928 - Less: Allowance for impairment Individually significant (4,416) (149,410) (13,589) - Collective - (110,837) - - 111,004 2,684,228 2,707,700 4,037,640
Notes(continued)
Bestway (Holdings) LtdAnnual Report & Accounts 2014
Notes
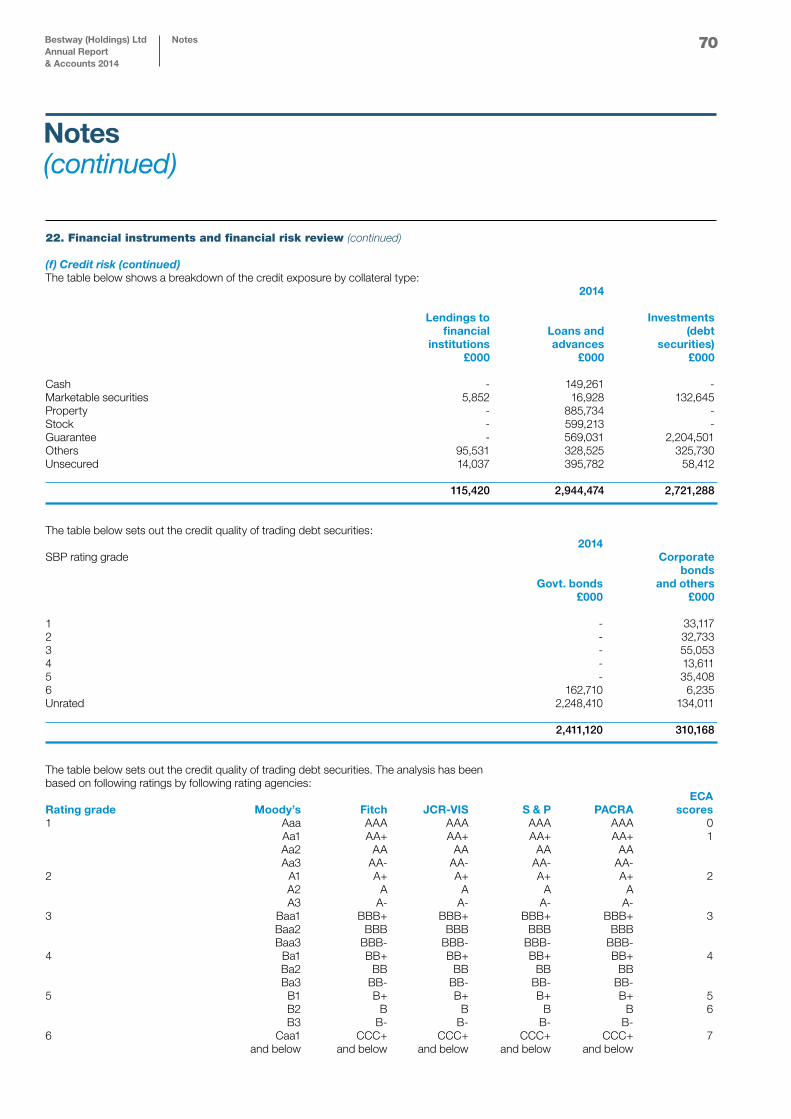
70
22. Financial instruments and financial risk review (continued)
(f) Credit risk (continued)The table below shows a breakdown of the credit exposure by collateral type: 2014 Lendings to Investments financial Loans and (debt institutions advances securities) £000 £000 £000 Cash - 149,261 - Marketable securities 5,852 16,928 132,645 Property - 885,734 - Stock - 599,213 - Guarantee - 569,031 2,204,501 Others 95,531 328,525 325,730 Unsecured 14,037 395,782 58,412 115,420 2,944,474 2,721,288 The table below sets out the credit quality of trading debt securities: 2014 SBP rating grade Corporate bonds Govt. bonds and others £000 £000 1 - 33,117 2 - 32,733 3 - 55,053 4 - 13,611 5 - 35,408 6 162,710 6,235 Unrated 2,248,410 134,011 2,411,120 310,168 The table below sets out the credit quality of trading debt securities. The analysis has been based on following ratings by following rating agencies: ECARating grade Moody’s Fitch JCR-VIS S & P PACRA scores1 Aaa AAA AAA AAA AAA 0 Aa1 AA+ AA+ AA+ AA+ 1 Aa2 AA AA AA AA Aa3 AA- AA- AA- AA- 2 A1 A+ A+ A+ A+ 2 A2 A A A A A3 A- A- A- A- 3 Baa1 BBB+ BBB+ BBB+ BBB+ 3 Baa2 BBB BBB BBB BBB Baa3 BBB- BBB- BBB- BBB- 4 Ba1 BB+ BB+ BB+ BB+ 4 Ba2 BB BB BB BB Ba3 BB- BB- BB- BB- 5 B1 B+ B+ B+ B+ 5 B2 B B B B 6 B3 B- B- B- B- 6 Caa1 CCC+ CCC+ CCC+ CCC+ 7 and below and below and below and below and below
Notes(continued)
Bestway (Holdings) LtdAnnual Report & Accounts 2014
Notes
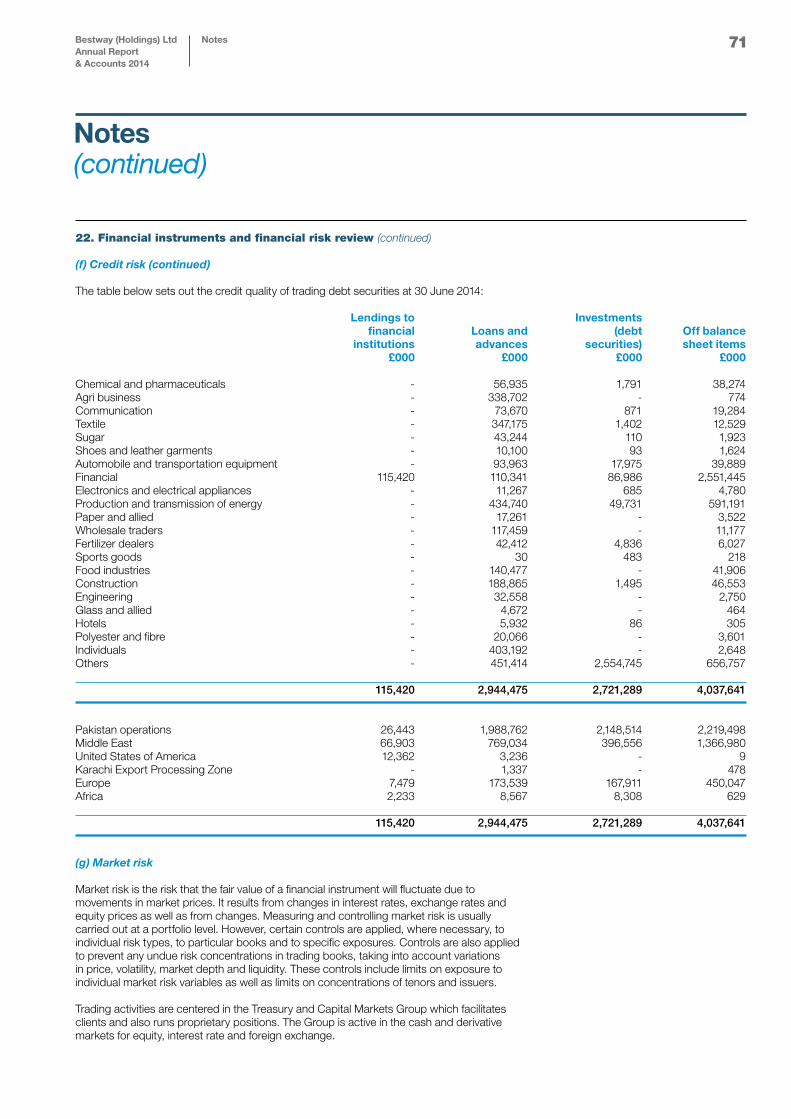
71
22. Financial instruments and financial risk review (continued)
(f) Credit risk (continued) The table below sets out the credit quality of trading debt securities at 30 June 2014: Lendings to Investments financial Loans and (debt Off balance institutions advances securities) sheet items £000 £000 £000 £000 Chemical and pharmaceuticals - 56,935 1,791 38,274 Agri business - 338,702 - 774 Communication - 73,670 871 19,284 Textile - 347,175 1,402 12,529 Sugar - 43,244 110 1,923 Shoes and leather garments - 10,100 93 1,624 Automobile and transportation equipment - 93,963 17,975 39,889 Financial 115,420 110,341 86,986 2,551,445 Electronics and electrical appliances - 11,267 685 4,780 Production and transmission of energy - 434,740 49,731 591,191 Paper and allied - 17,261 - 3,522 Wholesale traders - 117,459 - 11,177 Fertilizer dealers - 42,412 4,836 6,027 Sports goods - 30 483 218 Food industries - 140,477 - 41,906 Construction - 188,865 1,495 46,553 Engineering - 32,558 - 2,750 Glass and allied - 4,672 - 464 Hotels - 5,932 86 305 Polyester and fibre - 20,066 - 3,601 Individuals - 403,192 - 2,648 Others - 451,414 2,554,745 656,757 115,420 2,944,475 2,721,289 4,037,641 Pakistan operations 26,443 1,988,762 2,148,514 2,219,498Middle East 66,903 769,034 396,556 1,366,980 United States of America 12,362 3,236 - 9 Karachi Export Processing Zone - 1,337 - 478 Europe 7,479 173,539 167,911 450,047 Africa 2,233 8,567 8,308 629 115,420 2,944,475 2,721,289 4,037,641 (g) Market risk Market risk is the risk that the fair value of a financial instrument will fluctuate due to movements in market prices. It results from changes in interest rates, exchange rates and equity prices as well as from changes. Measuring and controlling market risk is usually carried out at a portfolio level. However, certain controls are applied, where necessary, to individual risk types, to particular books and to specific exposures. Controls are also applied to prevent any undue risk concentrations in trading books, taking into account variations in price, volatility, market depth and liquidity. These controls include limits on exposure to individual market risk variables as well as limits on concentrations of tenors and issuers.
Trading activities are centered in the Treasury and Capital Markets Group which facilitates clients and also runs proprietary positions. The Group is active in the cash and derivative markets for equity, interest rate and foreign exchange.
Notes(continued)
Bestway (Holdings) LtdAnnual Report & Accounts 2014
Notes
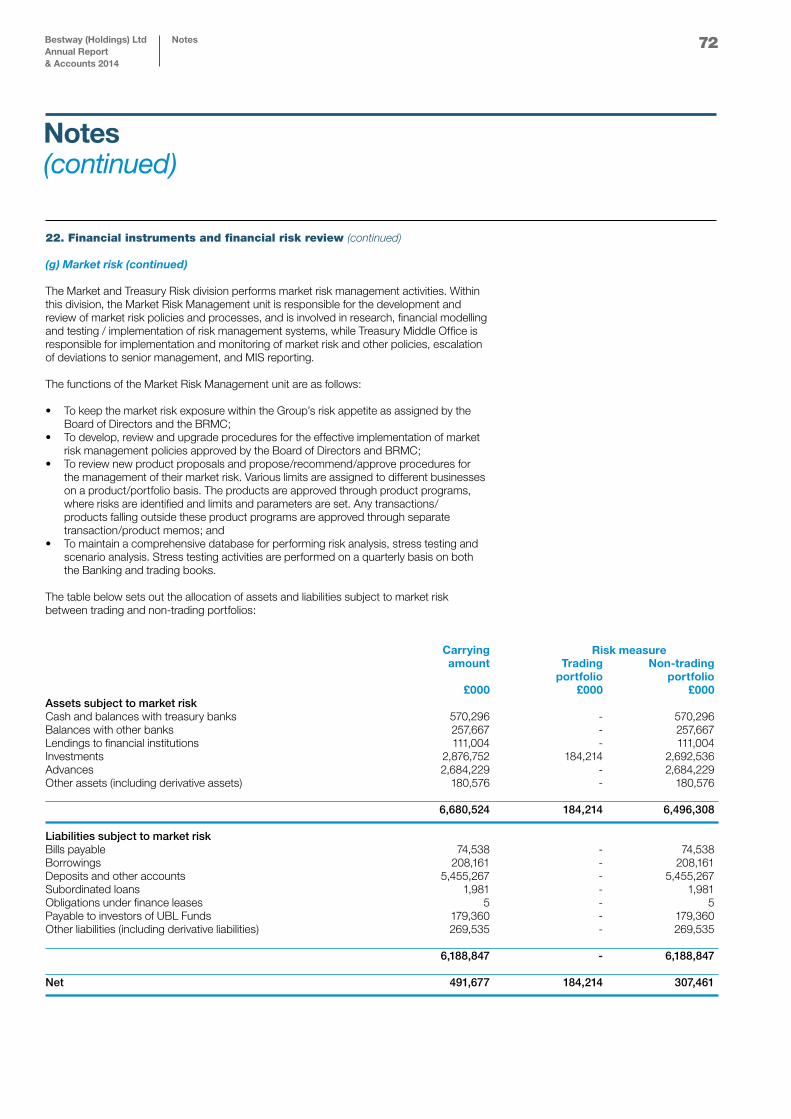
72
22. Financial instruments and financial risk review (continued)
(g) Market risk (continued)
The Market and Treasury Risk division performs market risk management activities. Within this division, the Market Risk Management unit is responsible for the development and review of market risk policies and processes, and is involved in research, financial modelling and testing / implementation of risk management systems, while Treasury Middle Office is responsible for implementation and monitoring of market risk and other policies, escalation of deviations to senior management, and MIS reporting.
The functions of the Market Risk Management unit are as follows:
• TokeepthemarketriskexposurewithintheGroup’sriskappetiteasassignedbythe Board of Directors and the BRMC;• Todevelop,reviewandupgradeproceduresfortheeffectiveimplementationofmarket risk management policies approved by the Board of Directors and BRMC;• Toreviewnewproductproposalsandpropose/recommend/approveproceduresfor the management of their market risk. Various limits are assigned to different businesses on a product/portfolio basis. The products are approved through product programs, where risks are identified and limits and parameters are set. Any transactions/ products falling outside these product programs are approved through separate transaction/product memos; and• Tomaintainacomprehensivedatabaseforperformingriskanalysis,stresstestingand scenario analysis. Stress testing activities are performed on a quarterly basis on both the Banking and trading books.
The table below sets out the allocation of assets and liabilities subject to market risk between trading and non-trading portfolios: Carrying amount Trading Non-trading portfolio portfolio £000 £000 £000 Assets subject to market risk Cash and balances with treasury banks 570,296 - 570,296 Balances with other banks 257,667 - 257,667 Lendings to financial institutions 111,004 - 111,004 Investments 2,876,752 184,214 2,692,536Advances 2,684,229 - 2,684,229 Other assets (including derivative assets) 180,576 - 180,576 6,680,524 184,214 6,496,308 Liabilities subject to market risk Bills payable 74,538 - 74,538 Borrowings 208,161 - 208,161 Deposits and other accounts 5,455,267 - 5,455,267 Subordinated loans 1,981 - 1,981 Obligations under finance leases 5 - 5 Payable to investors of UBL Funds 179,360 - 179,360 Other liabilities (including derivative liabilities) 269,535 - 269,535 6,188,847 - 6,188,847 Net 491,677 184,214 307,461
Risk measure
Notes(continued)
Bestway (Holdings) LtdAnnual Report & Accounts 2014
Notes
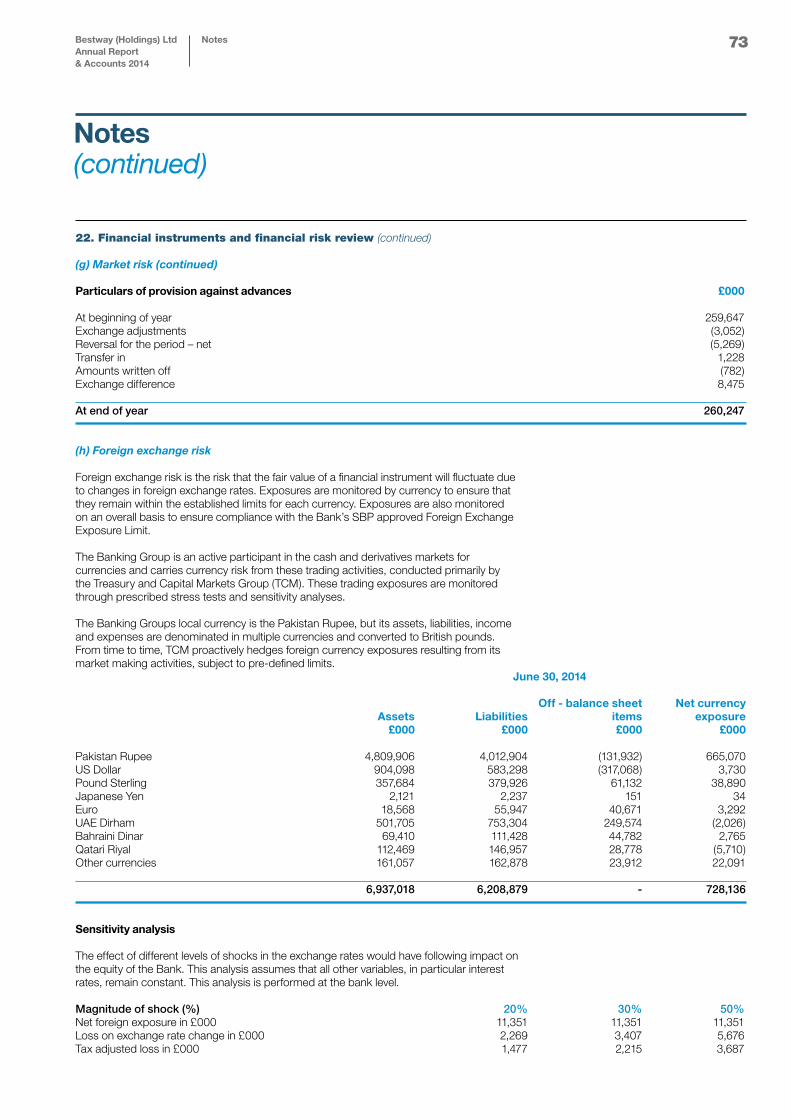
73
22. Financial instruments and financial risk review (continued)
(g) Market risk (continued) Particulars of provision against advances £000
At beginning of year 259,647Exchange adjustments (3,052)Reversal for the period – net (5,269)Transfer in 1,228Amounts written off (782) Exchange difference 8,475 At end of year 260,247 (h) Foreign exchange risk
Foreign exchange risk is the risk that the fair value of a financial instrument will fluctuate due to changes in foreign exchange rates. Exposures are monitored by currency to ensure that they remain within the established limits for each currency. Exposures are also monitored on an overall basis to ensure compliance with the Bank’s SBP approved Foreign Exchange Exposure Limit. The Banking Group is an active participant in the cash and derivatives markets for currencies and carries currency risk from these trading activities, conducted primarily by the Treasury and Capital Markets Group (TCM). These trading exposures are monitored through prescribed stress tests and sensitivity analyses. The Banking Groups local currency is the Pakistan Rupee, but its assets, liabilities, income and expenses are denominated in multiple currencies and converted to British pounds. From time to time, TCM proactively hedges foreign currency exposures resulting from its market making activities, subject to pre-defined limits. June 30, 2014 Off - balance sheet Net currency Assets Liabilities items exposure £000 £000 £000 £000 Pakistan Rupee 4,809,906 4,012,904 (131,932) 665,070 US Dollar 904,098 583,298 (317,068) 3,730 Pound Sterling 357,684 379,926 61,132 38,890 Japanese Yen 2,121 2,237 151 34 Euro 18,568 55,947 40,671 3,292 UAE Dirham 501,705 753,304 249,574 (2,026)Bahraini Dinar 69,410 111,428 44,782 2,765 Qatari Riyal 112,469 146,957 28,778 (5,710) Other currencies 161,057 162,878 23,912 22,091 6,937,018 6,208,879 - 728,136 Sensitivity analysis The effect of different levels of shocks in the exchange rates would have following impact on the equity of the Bank. This analysis assumes that all other variables, in particular interest rates, remain constant. This analysis is performed at the bank level. Magnitude of shock (%) 20% 30% 50%Net foreign exposure in £000 11,351 11,351 11,351 Loss on exchange rate change in £000 2,269 3,407 5,676 Tax adjusted loss in £000 1,477 2,215 3,687
Notes(continued)
Bestway (Holdings) LtdAnnual Report & Accounts 2014
Notes
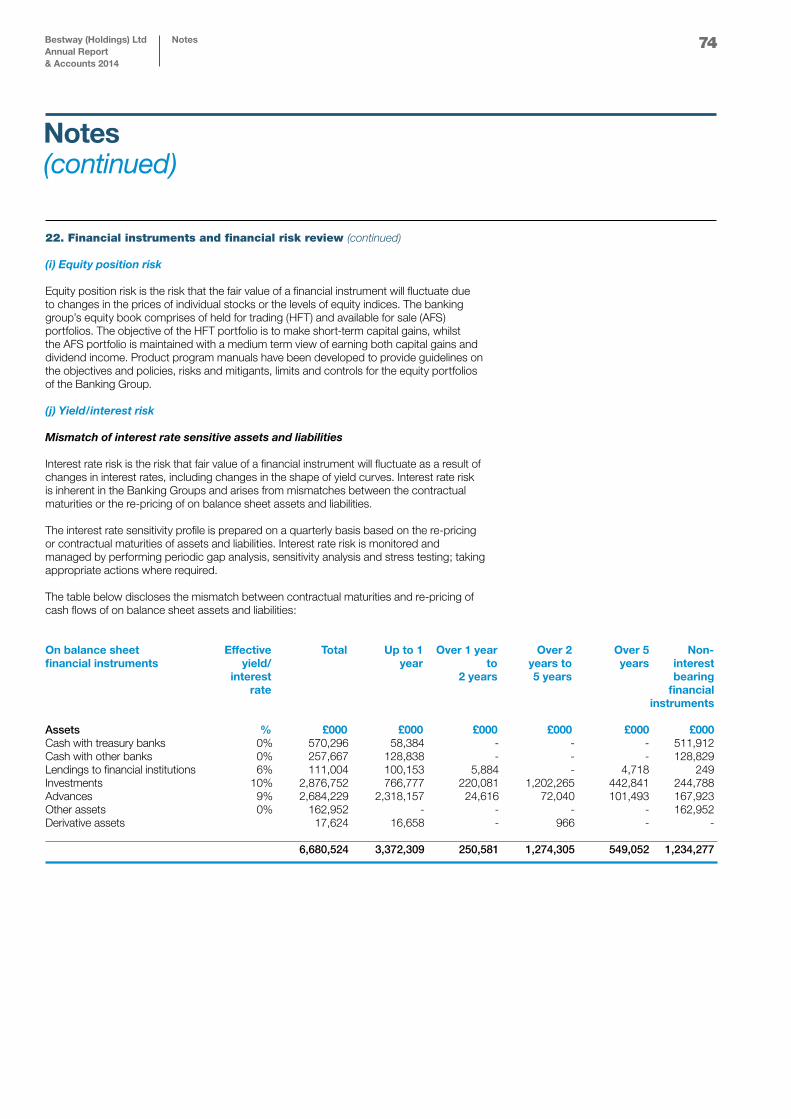
74
22. Financial instruments and financial risk review (continued)
(i) Equity position risk Equity position risk is the risk that the fair value of a financial instrument will fluctuate due to changes in the prices of individual stocks or the levels of equity indices. The banking group’s equity book comprises of held for trading (HFT) and available for sale (AFS) portfolios. The objective of the HFT portfolio is to make short-term capital gains, whilst the AFS portfolio is maintained with a medium term view of earning both capital gains and dividend income. Product program manuals have been developed to provide guidelines on the objectives and policies, risks and mitigants, limits and controls for the equity portfolios of the Banking Group.
(j) Yield/interest risk Mismatch of interest rate sensitive assets and liabilities Interest rate risk is the risk that fair value of a financial instrument will fluctuate as a result of changes in interest rates, including changes in the shape of yield curves. Interest rate risk is inherent in the Banking Groups and arises from mismatches between the contractual maturities or the re-pricing of on balance sheet assets and liabilities. The interest rate sensitivity profile is prepared on a quarterly basis based on the re-pricing or contractual maturities of assets and liabilities. Interest rate risk is monitored and managed by performing periodic gap analysis, sensitivity analysis and stress testing; taking appropriate actions where required. The table below discloses the mismatch between contractual maturities and re-pricing of cash flows of on balance sheet assets and liabilities:
On balance sheet Effective Total Up to 1 Over 1 year Over 2 Over 5 Non- financial instruments yield/ year to years to years interest interest 2 years 5 years bearing rate financial instruments Assets % £000 £000 £000 £000 £000 £000Cash with treasury banks 0% 570,296 58,384 - - - 511,912Cash with other banks 0% 257,667 128,838 - - - 128,829Lendings to financial institutions 6% 111,004 100,153 5,884 - 4,718 249Investments 10% 2,876,752 766,777 220,081 1,202,265 442,841 244,788Advances 9% 2,684,229 2,318,157 24,616 72,040 101,493 167,923Other assets 0% 162,952 - - - - 162,952Derivative assets 17,624 16,658 - 966 - - 6,680,524 3,372,309 250,581 1,274,305 549,052 1,234,277
Notes(continued)
Bestway (Holdings) LtdAnnual Report & Accounts 2014
Notes
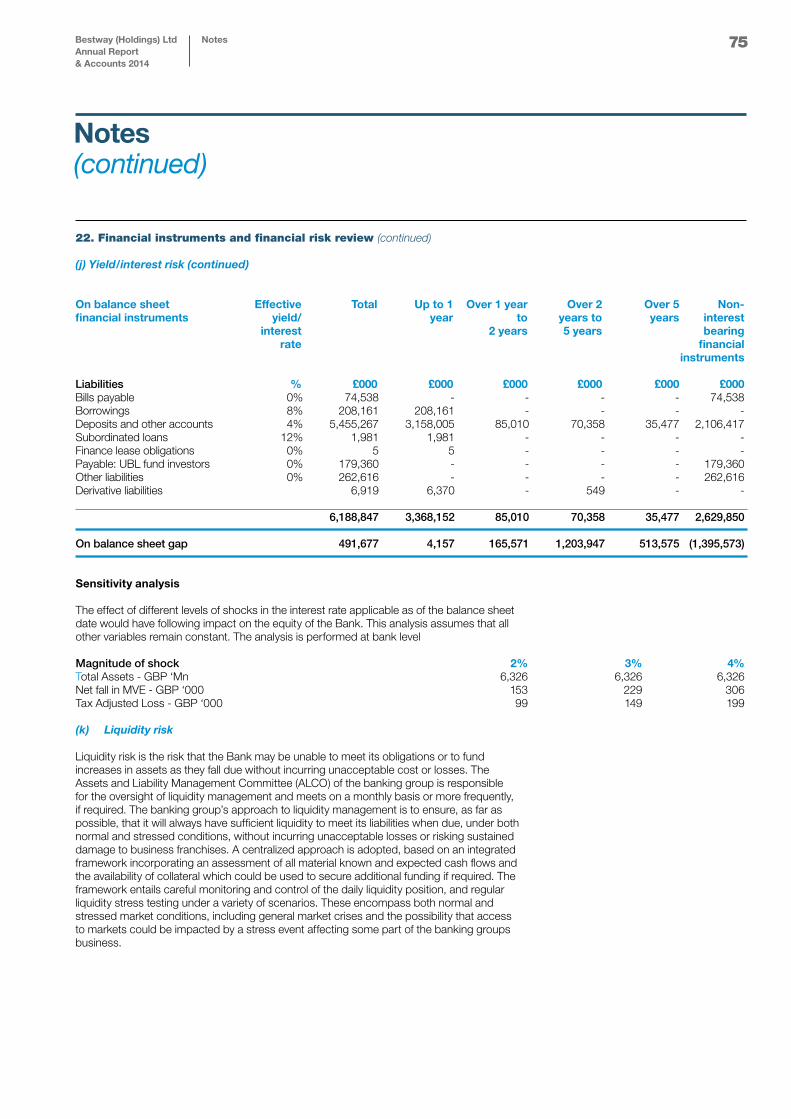
75
22. Financial instruments and financial risk review (continued)
(j) Yield/interest risk (continued)
On balance sheet Effective Total Up to 1 Over 1 year Over 2 Over 5 Non- financial instruments yield/ year to years to years interest interest 2 years 5 years bearing rate financial instruments Liabilities % £000 £000 £000 £000 £000 £000Bills payable 0% 74,538 - - - - 74,538 Borrowings 8% 208,161 208,161 - - - - Deposits and other accounts 4% 5,455,267 3,158,005 85,010 70,358 35,477 2,106,417 Subordinated loans 12% 1,981 1,981 - - - - Finance lease obligations 0% 5 5 - - - - Payable: UBL fund investors 0% 179,360 - - - - 179,360 Other liabilities 0% 262,616 - - - - 262,616Derivative liabilities 6,919 6,370 - 549 - - 6,188,847 3,368,152 85,010 70,358 35,477 2,629,850 On balance sheet gap 491,677 4,157 165,571 1,203,947 513,575 (1,395,573) Sensitivity analysis The effect of different levels of shocks in the interest rate applicable as of the balance sheet date would have following impact on the equity of the Bank. This analysis assumes that all other variables remain constant. The analysis is performed at bank level
Magnitude of shock 2% 3% 4% Total Assets - GBP ‘Mn 6,326 6,326 6,326 Net fall in MVE - GBP ‘000 153 229 306 Tax Adjusted Loss - GBP ‘000 99 149 199 (k) Liquidity risk
Liquidity risk is the risk that the Bank may be unable to meet its obligations or to fund increases in assets as they fall due without incurring unacceptable cost or losses. The Assets and Liability Management Committee (ALCO) of the banking group is responsible for the oversight of liquidity management and meets on a monthly basis or more frequently, if required. The banking group’s approach to liquidity management is to ensure, as far as possible, that it will always have sufficient liquidity to meet its liabilities when due, under both normal and stressed conditions, without incurring unacceptable losses or risking sustained damage to business franchises. A centralized approach is adopted, based on an integrated framework incorporating an assessment of all material known and expected cash flows and the availability of collateral which could be used to secure additional funding if required. The framework entails careful monitoring and control of the daily liquidity position, and regular liquidity stress testing under a variety of scenarios. These encompass both normal and stressed market conditions, including general market crises and the possibility that access to markets could be impacted by a stress event affecting some part of the banking groups business.
Notes(continued)
Bestway (Holdings) LtdAnnual Report & Accounts 2014
Notes
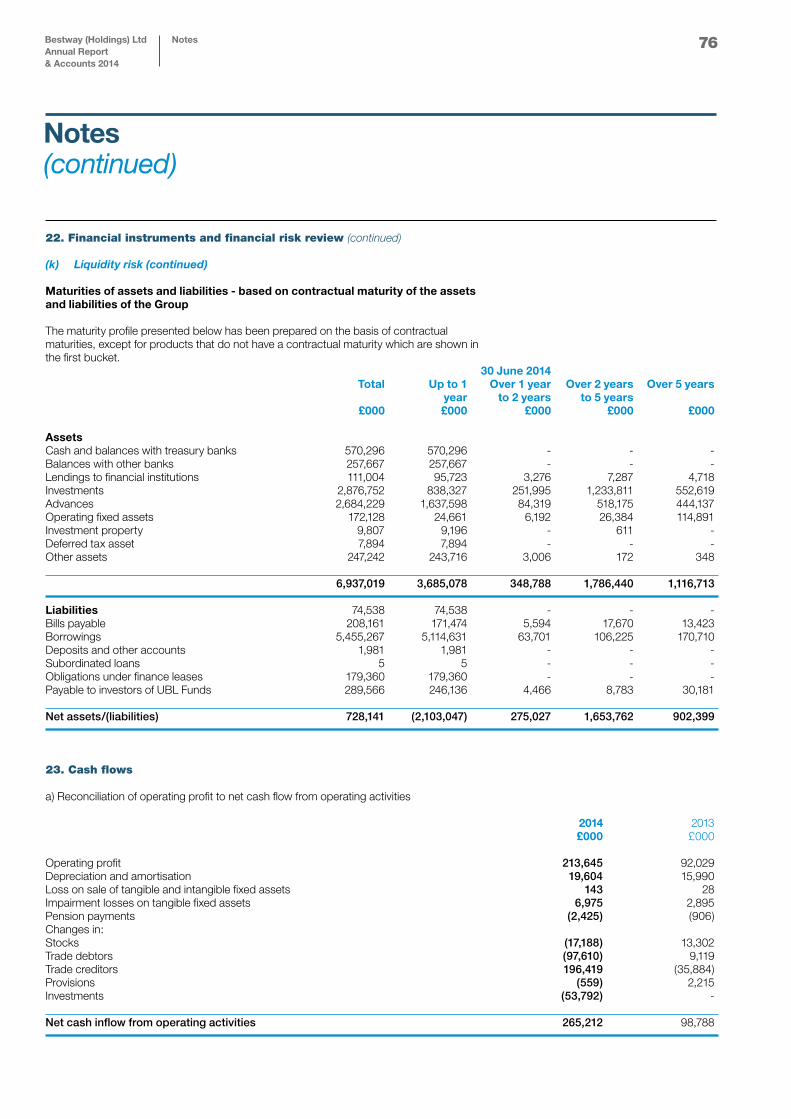
76
22. Financial instruments and financial risk review (continued)
(k) Liquidity risk (continued) Maturities of assets and liabilities - based on contractual maturity of the assets and liabilities of the Group The maturity profile presented below has been prepared on the basis of contractual maturities, except for products that do not have a contractual maturity which are shown in the first bucket. 30 June 2014 Total Up to 1 Over 1 year Over 2 years Over 5 years year to 2 years to 5 years £000 £000 £000 £000 £000
Assets Cash and balances with treasury banks 570,296 570,296 - - - Balances with other banks 257,667 257,667 - - - Lendings to financial institutions 111,004 95,723 3,276 7,287 4,718 Investments 2,876,752 838,327 251,995 1,233,811 552,619 Advances 2,684,229 1,637,598 84,319 518,175 444,137 Operating fixed assets 172,128 24,661 6,192 26,384 114,891 Investment property 9,807 9,196 - 611 - Deferred tax asset 7,894 7,894 - - - Other assets 247,242 243,716 3,006 172 348 6,937,019 3,685,078 348,788 1,786,440 1,116,713 Liabilities 74,538 74,538 - - - Bills payable 208,161 171,474 5,594 17,670 13,423 Borrowings 5,455,267 5,114,631 63,701 106,225 170,710 Deposits and other accounts 1,981 1,981 - - - Subordinated loans 5 5 - - - Obligations under finance leases 179,360 179,360 - - - Payable to investors of UBL Funds 289,566 246,136 4,466 8,783 30,181 Net assets/(liabilities) 728,141 (2,103,047) 275,027 1,653,762 902,399
23. Cash flows a) Reconciliation of operating profit to net cash flow from operating activities
2014 2013 £000 £000 Operating profit 213,645 92,029Depreciation and amortisation 19,604 15,990Loss on sale of tangible and intangible fixed assets 143 28Impairment losses on tangible fixed assets 6,975 2,895Pension payments (2,425) (906)Changes in: Stocks (17,188) 13,302Trade debtors (97,610) 9,119Trade creditors 196,419 (35,884)Provisions (559) 2,215Investments (53,792) - Net cash inflow from operating activities 265,212 98,788
Notes(continued)
Bestway (Holdings) LtdAnnual Report & Accounts 2014
Notes
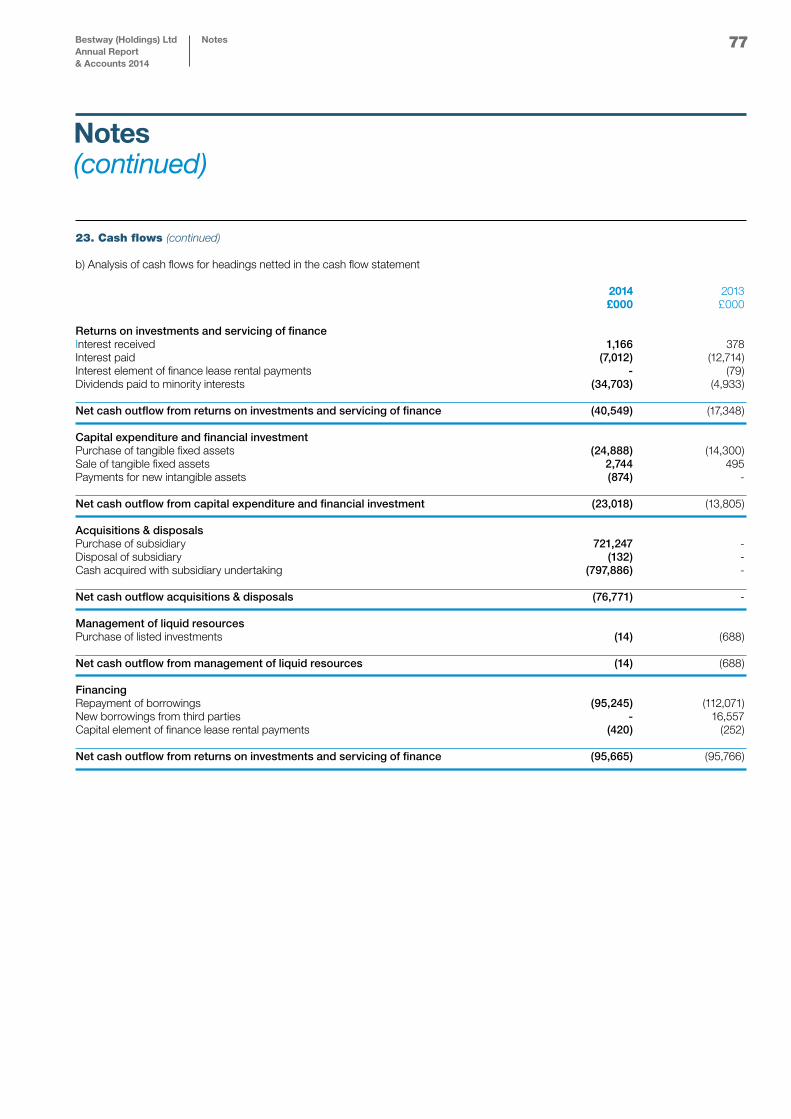
77
23. Cash flows (continued)
b) Analysis of cash flows for headings netted in the cash flow statement 2014 2013 £000 £000 Returns on investments and servicing of finance Interest received 1,166 378Interest paid (7,012) (12,714)Interest element of finance lease rental payments - (79)Dividends paid to minority interests (34,703) (4,933) Net cash outflow from returns on investments and servicing of finance (40,549) (17,348) Capital expenditure and financial investment Purchase of tangible fixed assets (24,888) (14,300)Sale of tangible fixed assets 2,744 495Payments for new intangible assets (874) - Net cash outflow from capital expenditure and financial investment (23,018) (13,805) Acquisitions & disposals Purchase of subsidiary 721,247 -Disposal of subsidiary (132) -Cash acquired with subsidiary undertaking (797,886) - Net cash outflow acquisitions & disposals (76,771) - Management of liquid resources Purchase of listed investments (14) (688) Net cash outflow from management of liquid resources (14) (688) Financing Repayment of borrowings (95,245) (112,071)New borrowings from third parties - 16,557Capital element of finance lease rental payments (420) (252) Net cash outflow from returns on investments and servicing of finance (95,665) (95,766)
Notes(continued)
Bestway (Holdings) LtdAnnual Report & Accounts 2014
Notes
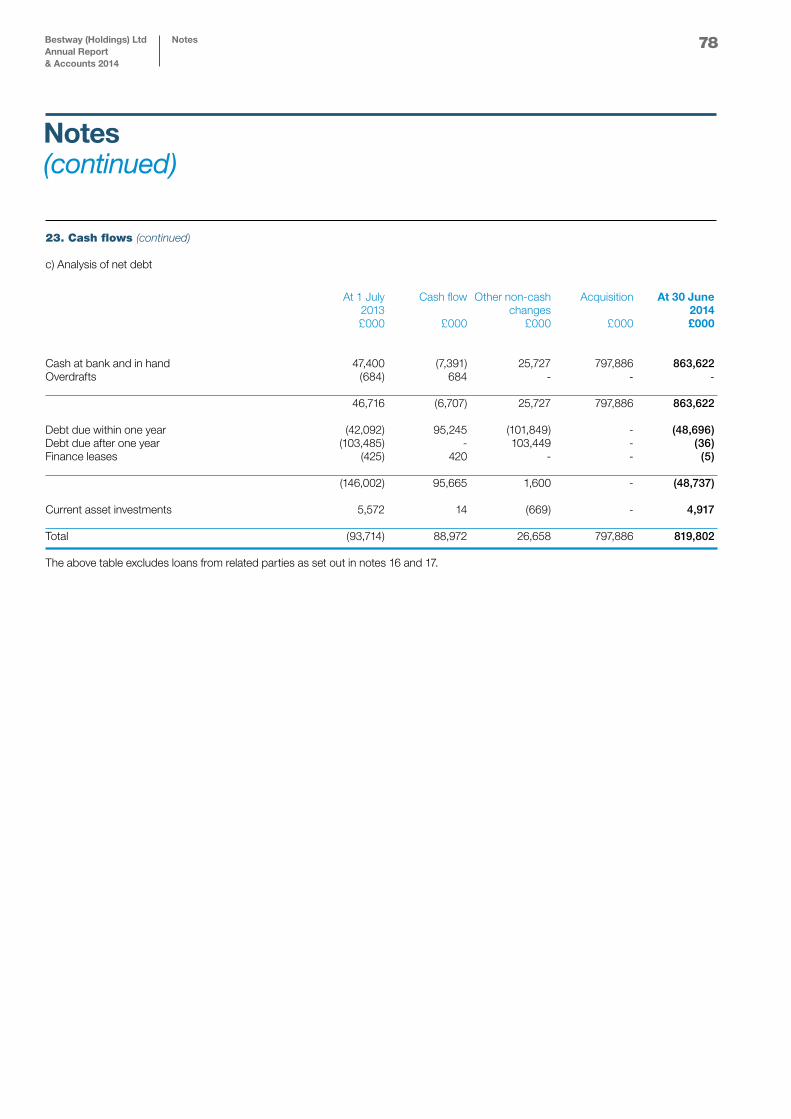
78
23. Cash flows (continued)
c) Analysis of net debt
At 1 July Cash flow Other non-cash Acquisition At 30 June 2013 changes 2014 £000 £000 £000 £000 £000
Cash at bank and in hand 47,400 (7,391) 25,727 797,886 863,622Overdrafts (684) 684 - - - 46,716 (6,707) 25,727 797,886 863,622 Debt due within one year (42,092) 95,245 (101,849) - (48,696)Debt due after one year (103,485) - 103,449 - (36)Finance leases (425) 420 - - (5) (146,002) 95,665 1,600 - (48,737) Current asset investments 5,572 14 (669) - 4,917 Total (93,714) 88,972 26,658 797,886 819,802 The above table excludes loans from related parties as set out in notes 16 and 17.
Notes(continued)
Bestway (Holdings) LtdAnnual Report & Accounts 2014
Notes
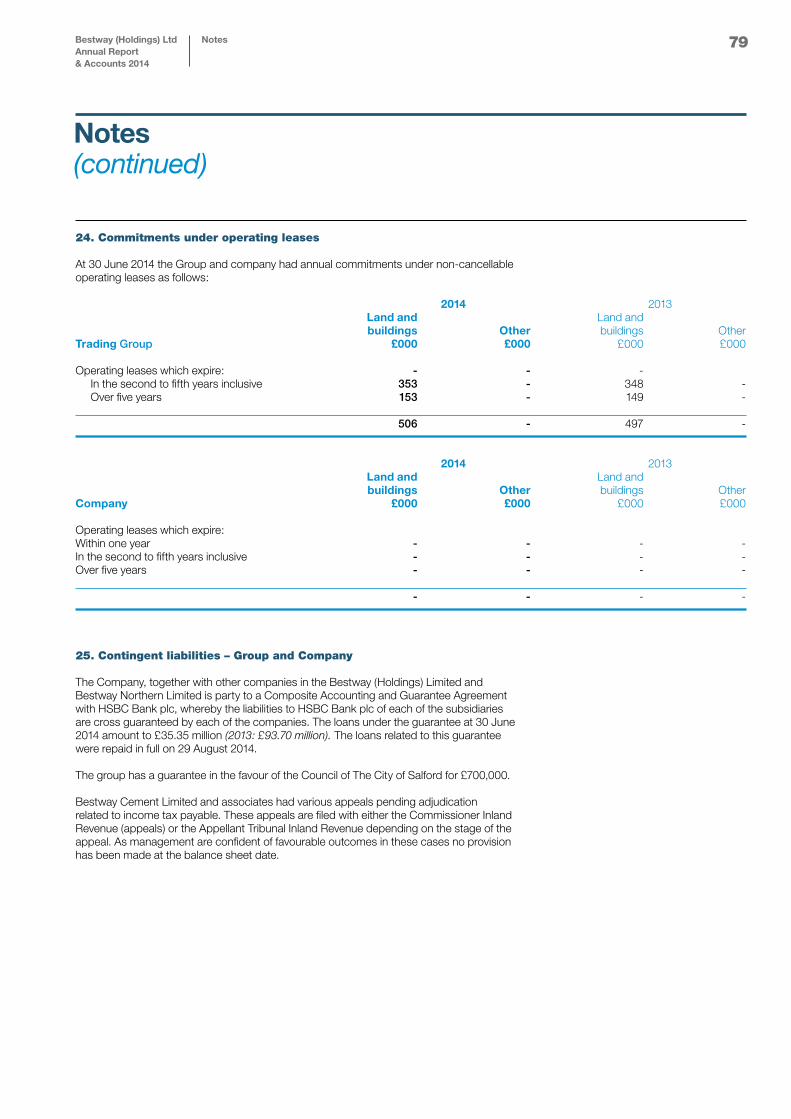
79
24. Commitments under operating leases At 30 June 2014 the Group and company had annual commitments under non-cancellable operating leases as follows: 2014 2013 Land and Land and buildings Other buildings Other Trading Group £000 £000 £000 £000 Operating leases which expire: - - - In the second to fifth years inclusive 353 - 348 - Over five years 153 - 149 - 506 - 497 -
2014 2013 Land and Land and buildings Other buildings Other Company £000 £000 £000 £000 Operating leases which expire: Within one year - - - -In the second to fifth years inclusive - - - -Over five years - - - - - - - -
25. Contingent liabilities – Group and Company The Company, together with other companies in the Bestway (Holdings) Limited and Bestway Northern Limited is party to a Composite Accounting and Guarantee Agreement with HSBC Bank plc, whereby the liabilities to HSBC Bank plc of each of the subsidiaries are cross guaranteed by each of the companies. The loans under the guarantee at 30 June 2014 amount to £35.35 million (2013: £93.70 million). The loans related to this guarantee were repaid in full on 29 August 2014.
The group has a guarantee in the favour of the Council of The City of Salford for £700,000.
Bestway Cement Limited and associates had various appeals pending adjudication related to income tax payable. These appeals are filed with either the Commissioner Inland Revenue (appeals) or the Appellant Tribunal Inland Revenue depending on the stage of the appeal. As management are confident of favourable outcomes in these cases no provision has been made at the balance sheet date.
Notes(continued)
Bestway (Holdings) LtdAnnual Report & Accounts 2014
Notes
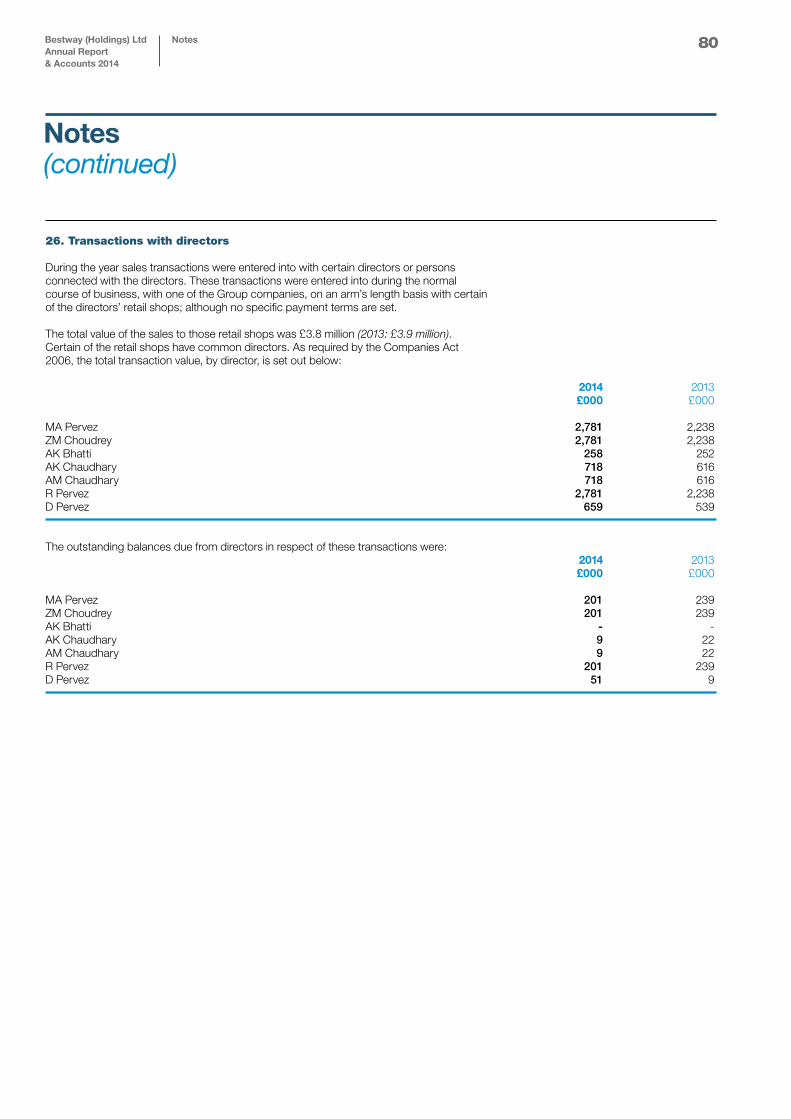
80
26. Transactions with directors During the year sales transactions were entered into with certain directors or persons connected with the directors. These transactions were entered into during the normal course of business, with one of the Group companies, on an arm’s length basis with certain of the directors’ retail shops; although no specific payment terms are set.
The total value of the sales to those retail shops was £3.8 million (2013: £3.9 million). Certain of the retail shops have common directors. As required by the Companies Act 2006, the total transaction value, by director, is set out below:
2014 2013 £000 £000
MA Pervez 2,781 2,238 ZM Choudrey 2,781 2,238 AK Bhatti 258 252 AK Chaudhary 718 616 AM Chaudhary 718 616 R Pervez 2,781 2,238 D Pervez 659 539 The outstanding balances due from directors in respect of these transactions were: 2014 2013 £000 £000
MA Pervez 201 239ZM Choudrey 201 239AK Bhatti - -AK Chaudhary 9 22AM Chaudhary 9 22R Pervez 201 239D Pervez 51 9
Notes(continued)
Bestway (Holdings) LtdAnnual Report & Accounts 2014
Notes
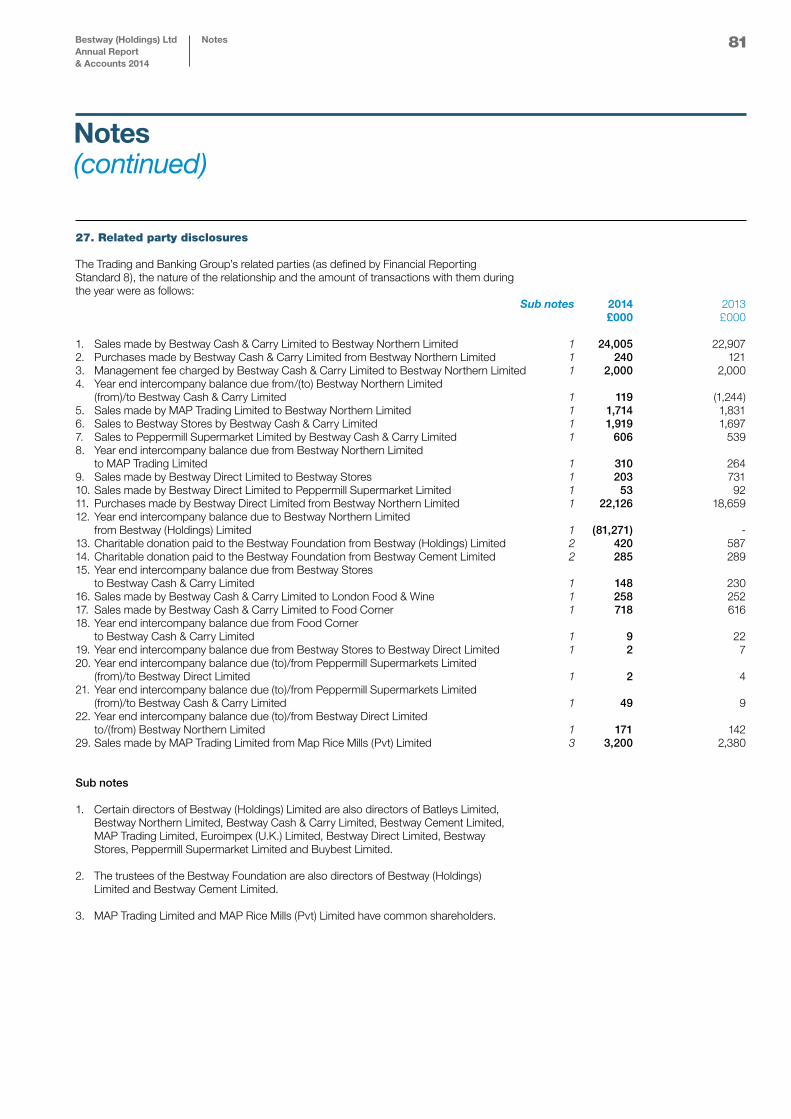
81
27. Related party disclosures
The Trading and Banking Group’s related parties (as defined by Financial Reporting Standard 8), the nature of the relationship and the amount of transactions with them during the year were as follows: Sub notes 2014 2013 £000 £000
1. Sales made by Bestway Cash & Carry Limited to Bestway Northern Limited 1 24,005 22,9072. Purchases made by Bestway Cash & Carry Limited from Bestway Northern Limited 1 240 1213. Management fee charged by Bestway Cash & Carry Limited to Bestway Northern Limited 1 2,000 2,0004. Year end intercompany balance due from/(to) Bestway Northern Limited (from)/to Bestway Cash & Carry Limited 1 119 (1,244)5. Sales made by MAP Trading Limited to Bestway Northern Limited 1 1,714 1,8316. Sales to Bestway Stores by Bestway Cash & Carry Limited 1 1,919 1,6977. Sales to Peppermill Supermarket Limited by Bestway Cash & Carry Limited 1 606 5398. Year end intercompany balance due from Bestway Northern Limited to MAP Trading Limited 1 310 2649. Sales made by Bestway Direct Limited to Bestway Stores 1 203 73110. Sales made by Bestway Direct Limited to Peppermill Supermarket Limited 1 53 9211. Purchases made by Bestway Direct Limited from Bestway Northern Limited 1 22,126 18,65912. Year end intercompany balance due to Bestway Northern Limited from Bestway (Holdings) Limited 1 (81,271) -13. Charitable donation paid to the Bestway Foundation from Bestway (Holdings) Limited 2 420 58714. Charitable donation paid to the Bestway Foundation from Bestway Cement Limited 2 285 28915. Year end intercompany balance due from Bestway Stores to Bestway Cash & Carry Limited 1 148 23016. Sales made by Bestway Cash & Carry Limited to London Food & Wine 1 258 25217. Sales made by Bestway Cash & Carry Limited to Food Corner 1 718 61618. Year end intercompany balance due from Food Corner to Bestway Cash & Carry Limited 1 9 2219. Year end intercompany balance due from Bestway Stores to Bestway Direct Limited 1 2 7 20. Year end intercompany balance due (to)/from Peppermill Supermarkets Limited (from)/to Bestway Direct Limited 1 2 421. Year end intercompany balance due (to)/from Peppermill Supermarkets Limited (from)/to Bestway Cash & Carry Limited 1 49 922. Year end intercompany balance due (to)/from Bestway Direct Limited to/(from) Bestway Northern Limited 1 171 14229. Sales made by MAP Trading Limited from Map Rice Mills (Pvt) Limited 3 3,200 2,380
Sub notes
1. Certain directors of Bestway (Holdings) Limited are also directors of Batleys Limited, Bestway Northern Limited, Bestway Cash & Carry Limited, Bestway Cement Limited, MAP Trading Limited, Euroimpex (U.K.) Limited, Bestway Direct Limited, Bestway Stores, Peppermill Supermarket Limited and Buybest Limited.
2. The trustees of the Bestway Foundation are also directors of Bestway (Holdings) Limited and Bestway Cement Limited.
3. MAP Trading Limited and MAP Rice Mills (Pvt) Limited have common shareholders.
Notes(continued)
Bestway (Holdings) LtdAnnual Report & Accounts 2014
Notes
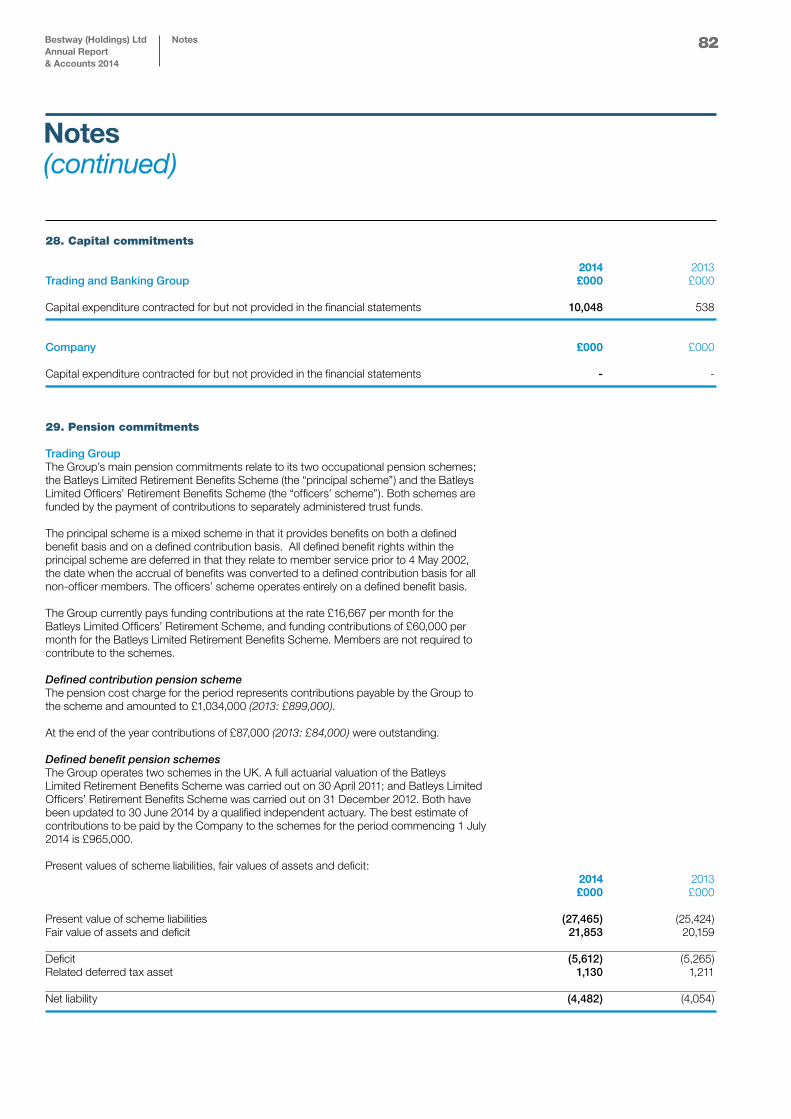
82
28. Capital commitments 2014 2013Trading and Banking Group £000 £000 Capital expenditure contracted for but not provided in the financial statements 10,048 538
Company £000 £000 Capital expenditure contracted for but not provided in the financial statements - -
29. Pension commitments
Trading Group The Group’s main pension commitments relate to its two occupational pension schemes; the Batleys Limited Retirement Benefits Scheme (the “principal scheme”) and the Batleys Limited Officers’ Retirement Benefits Scheme (the “officers’ scheme”). Both schemes are funded by the payment of contributions to separately administered trust funds. The principal scheme is a mixed scheme in that it provides benefits on both a defined benefit basis and on a defined contribution basis. All defined benefit rights within the principal scheme are deferred in that they relate to member service prior to 4 May 2002, the date when the accrual of benefits was converted to a defined contribution basis for all non-officer members. The officers’ scheme operates entirely on a defined benefit basis. The Group currently pays funding contributions at the rate £16,667 per month for the Batleys Limited Officers’ Retirement Scheme, and funding contributions of £60,000 per month for the Batleys Limited Retirement Benefits Scheme. Members are not required to contribute to the schemes. Defined contribution pension scheme The pension cost charge for the period represents contributions payable by the Group to the scheme and amounted to £1,034,000 (2013: £899,000). At the end of the year contributions of £87,000 (2013: £84,000) were outstanding.
Defined benefit pension schemesThe Group operates two schemes in the UK. A full actuarial valuation of the Batleys Limited Retirement Benefits Scheme was carried out on 30 April 2011; and Batleys Limited Officers’ Retirement Benefits Scheme was carried out on 31 December 2012. Both have been updated to 30 June 2014 by a qualified independent actuary. The best estimate of contributions to be paid by the Company to the schemes for the period commencing 1 July 2014 is £965,000.
Present values of scheme liabilities, fair values of assets and deficit: 2014 2013 £000 £000 Present value of scheme liabilities (27,465) (25,424)Fair value of assets and deficit 21,853 20,159 Deficit (5,612) (5,265)Related deferred tax asset 1,130 1,211 Net liability (4,482) (4,054)
Notes(continued)
Bestway (Holdings) LtdAnnual Report & Accounts 2014
Notes
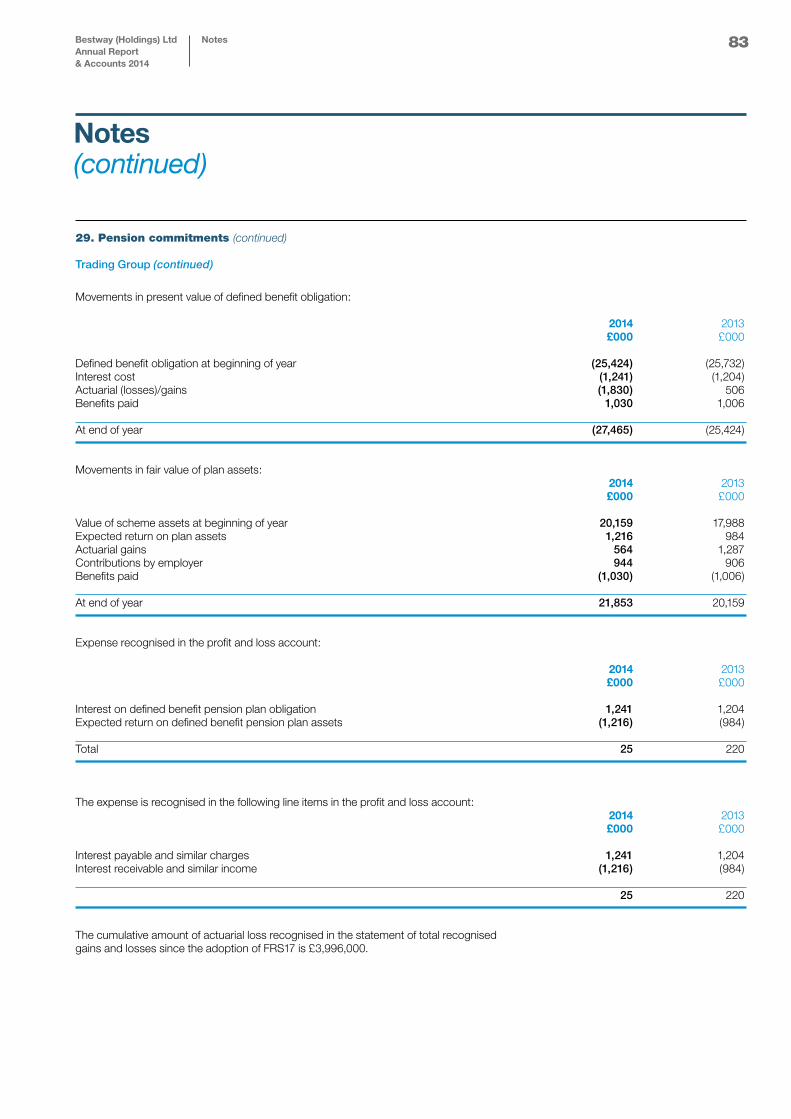
83
29. Pension commitments (continued)
Trading Group (continued)
Movements in present value of defined benefit obligation:
2014 2013 £000 £000
Defined benefit obligation at beginning of year (25,424) (25,732)Interest cost (1,241) (1,204)Actuarial (losses)/gains (1,830) 506Benefits paid 1,030 1,006 At end of year (27,465) (25,424) Movements in fair value of plan assets: 2014 2013 £000 £000
Value of scheme assets at beginning of year 20,159 17,988Expected return on plan assets 1,216 984Actuarial gains 564 1,287Contributions by employer 944 906Benefits paid (1,030) (1,006) At end of year 21,853 20,159 Expense recognised in the profit and loss account: 2014 2013 £000 £000 Interest on defined benefit pension plan obligation 1,241 1,204Expected return on defined benefit pension plan assets (1,216) (984) Total 25 220
The expense is recognised in the following line items in the profit and loss account: 2014 2013 £000 £000 Interest payable and similar charges 1,241 1,204Interest receivable and similar income (1,216) (984) 25 220 The cumulative amount of actuarial loss recognised in the statement of total recognised gains and losses since the adoption of FRS17 is £3,996,000.
Notes(continued)
Bestway (Holdings) LtdAnnual Report & Accounts 2014
Notes
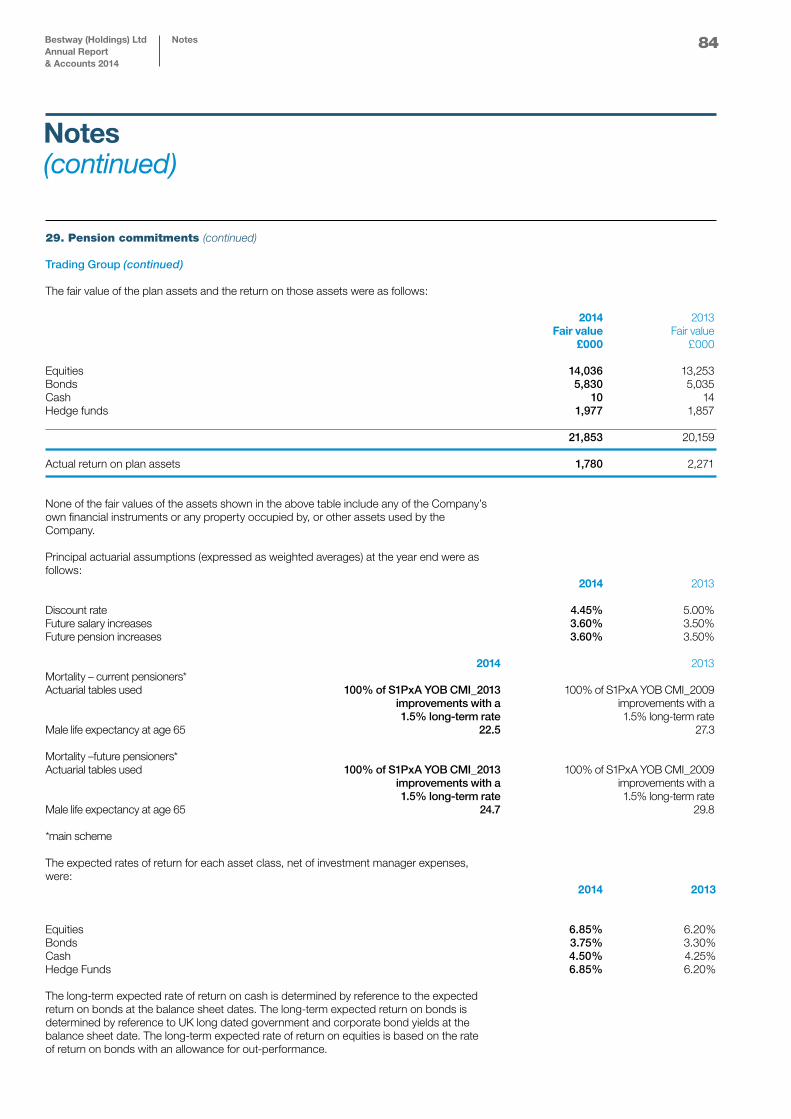
84
29. Pension commitments (continued)
Trading Group (continued)
The fair value of the plan assets and the return on those assets were as follows: 2014 2013 Fair value Fair value £000 £000 Equities 14,036 13,253Bonds 5,830 5,035Cash 10 14Hedge funds 1,977 1,857 21,853 20,159 Actual return on plan assets 1,780 2,271 None of the fair values of the assets shown in the above table include any of the Company’s own financial instruments or any property occupied by, or other assets used by the Company.
Principal actuarial assumptions (expressed as weighted averages) at the year end were as follows: 2014 2013 Discount rate 4.45% 5.00%Future salary increases 3.60% 3.50%Future pension increases 3.60% 3.50%
2014 2013 Mortality – current pensioners* Actuarial tables used 100% of S1PxA YOB CMI_2013 100% of S1PxA YOB CMI_2009 improvements with a improvements with a 1.5% long-term rate 1.5% long-term rate Male life expectancy at age 65 22.5 27.3
Mortality –future pensioners* Actuarial tables used 100% of S1PxA YOB CMI_2013 100% of S1PxA YOB CMI_2009 improvements with a improvements with a 1.5% long-term rate 1.5% long-term rate Male life expectancy at age 65 24.7 29.8 *main scheme The expected rates of return for each asset class, net of investment manager expenses, were: 2014 2013 Equities 6.85% 6.20% Bonds 3.75% 3.30% Cash 4.50% 4.25% Hedge Funds 6.85% 6.20%
The long-term expected rate of return on cash is determined by reference to the expected return on bonds at the balance sheet dates. The long-term expected return on bonds is determined by reference to UK long dated government and corporate bond yields at the balance sheet date. The long-term expected rate of return on equities is based on the rate of return on bonds with an allowance for out-performance.
Notes(continued)
Bestway (Holdings) LtdAnnual Report & Accounts 2014
Notes
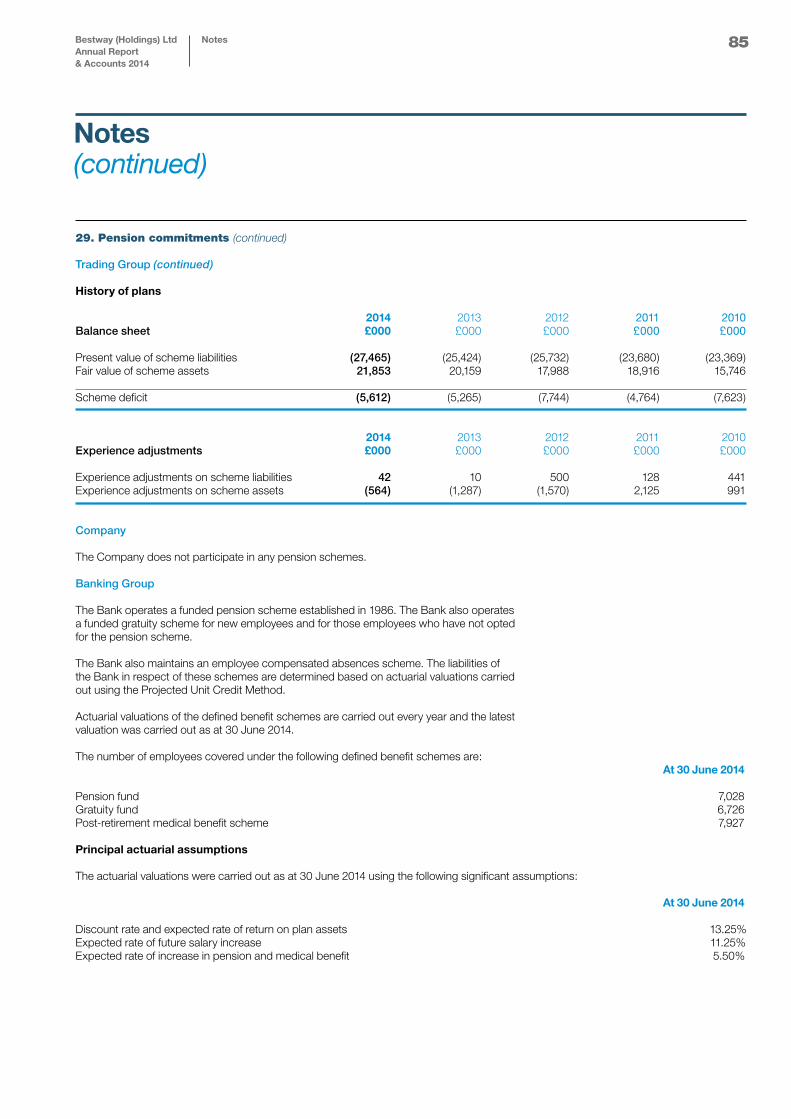
85
29. Pension commitments (continued)
Trading Group (continued) History of plans
2014 2013 2012 2011 2010 Balance sheet £000 £000 £000 £000 £000
Present value of scheme liabilities (27,465) (25,424) (25,732) (23,680) (23,369)Fair value of scheme assets 21,853 20,159 17,988 18,916 15,746 Scheme deficit (5,612) (5,265) (7,744) (4,764) (7,623)
2014 2013 2012 2011 2010Experience adjustments £000 £000 £000 £000 £000 Experience adjustments on scheme liabilities 42 10 500 128 441Experience adjustments on scheme assets (564) (1,287) (1,570) 2,125 991
Company
The Company does not participate in any pension schemes. Banking Group
The Bank operates a funded pension scheme established in 1986. The Bank also operates a funded gratuity scheme for new employees and for those employees who have not opted for the pension scheme. The Bank also maintains an employee compensated absences scheme. The liabilities of the Bank in respect of these schemes are determined based on actuarial valuations carried out using the Projected Unit Credit Method. Actuarial valuations of the defined benefit schemes are carried out every year and the latest valuation was carried out as at 30 June 2014. The number of employees covered under the following defined benefit schemes are: At 30 June 2014
Pension fund 7,028Gratuity fund 6,726Post-retirement medical benefit scheme 7,927 Principal actuarial assumptions
The actuarial valuations were carried out as at 30 June 2014 using the following significant assumptions:
At 30 June 2014
Discount rate and expected rate of return on plan assets 13.25%Expected rate of future salary increase 11.25%Expected rate of increase in pension and medical benefit 5.50%
Notes(continued)
Bestway (Holdings) LtdAnnual Report & Accounts 2014
Notes
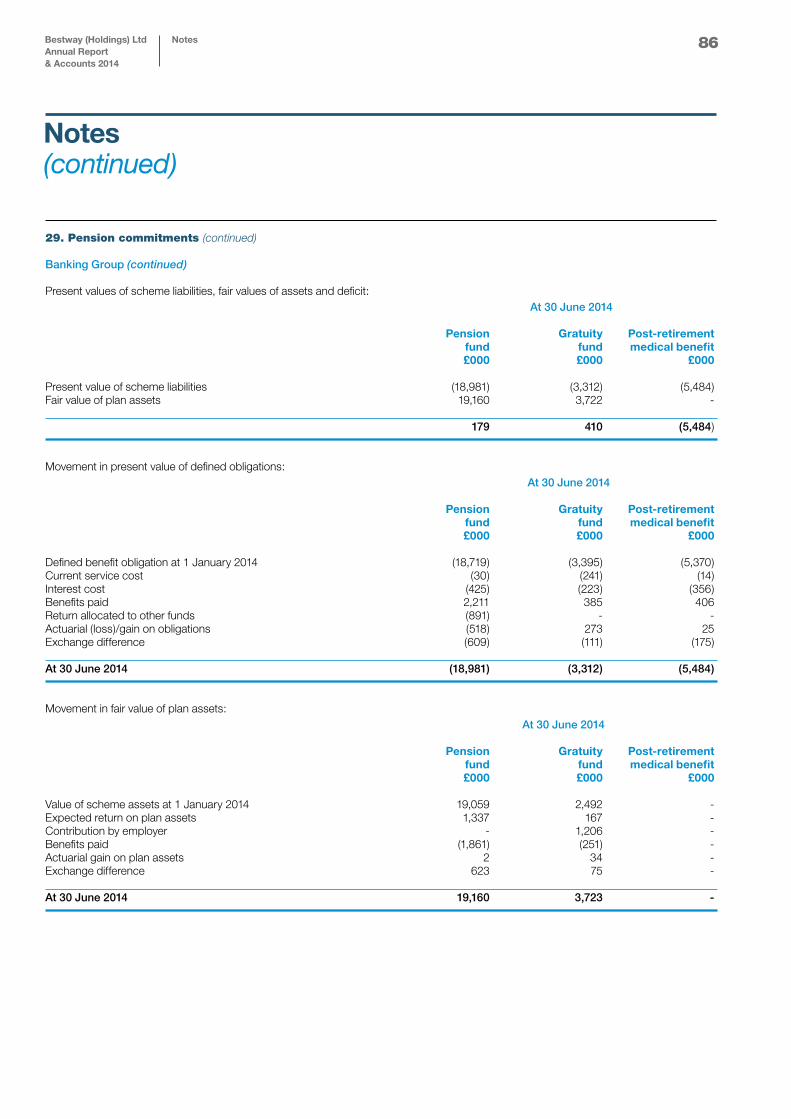
29. Pension commitments (continued)
Banking Group (continued)
Present values of scheme liabilities, fair values of assets and deficit: At 30 June 2014 Pension Gratuity Post-retirement fund fund medical benefit £000 £000 £000 Present value of scheme liabilities (18,981) (3,312) (5,484)Fair value of plan assets 19,160 3,722 - 179 410 (5,484) Movement in present value of defined obligations: At 30 June 2014 Pension Gratuity Post-retirement fund fund medical benefit £000 £000 £000 Defined benefit obligation at 1 January 2014 (18,719) (3,395) (5,370)Current service cost (30) (241) (14)Interest cost (425) (223) (356)Benefits paid 2,211 385 406Return allocated to other funds (891) - -Actuarial (loss)/gain on obligations (518) 273 25Exchange difference (609) (111) (175) At 30 June 2014 (18,981) (3,312) (5,484) Movement in fair value of plan assets: At 30 June 2014 Pension Gratuity Post-retirement fund fund medical benefit £000 £000 £000 Value of scheme assets at 1 January 2014 19,059 2,492 -Expected return on plan assets 1,337 167 -Contribution by employer - 1,206 -Benefits paid (1,861) (251) -Actuarial gain on plan assets 2 34 -Exchange difference 623 75 - At 30 June 2014 19,160 3,723 -
86
Notes(continued)
Bestway (Holdings) LtdAnnual Report & Accounts 2014
Notes
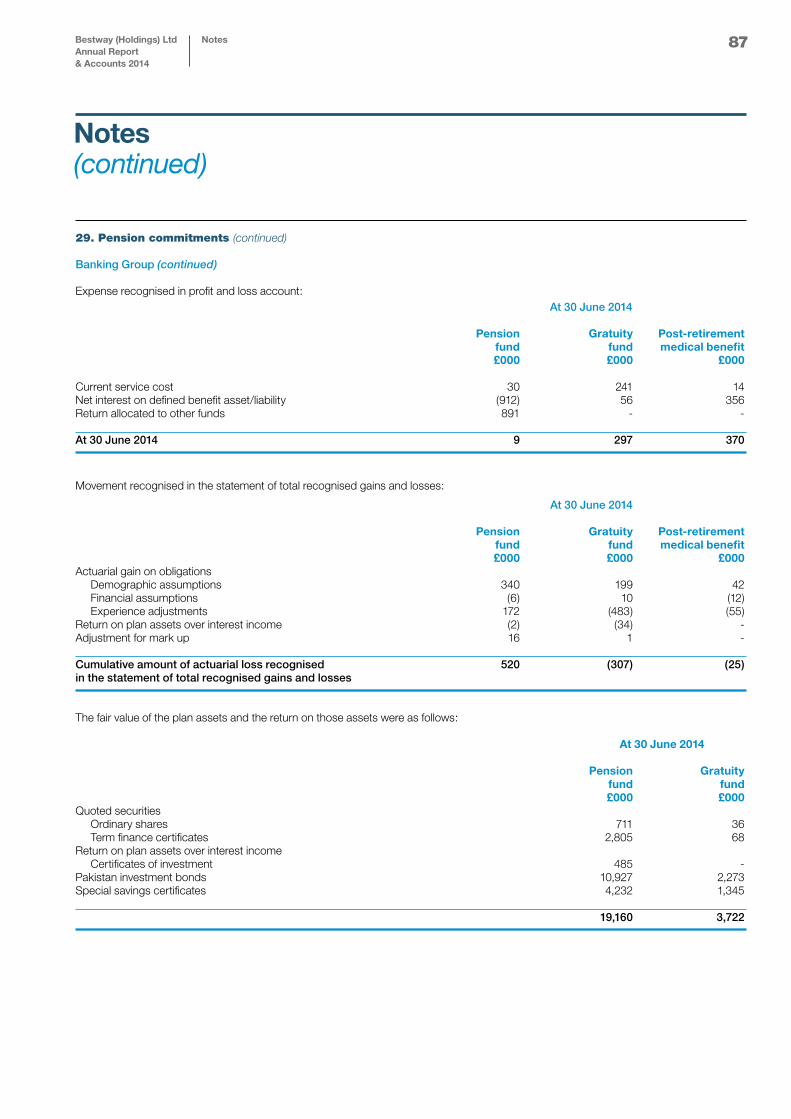
87
29. Pension commitments (continued)
Banking Group (continued)
Expense recognised in profit and loss account: At 30 June 2014 Pension Gratuity Post-retirement fund fund medical benefit £000 £000 £000 Current service cost 30 241 14Net interest on defined benefit asset/liability (912) 56 356Return allocated to other funds 891 - - At 30 June 2014 9 297 370
Movement recognised in the statement of total recognised gains and losses: At 30 June 2014 Pension Gratuity Post-retirement fund fund medical benefit £000 £000 £000 Actuarial gain on obligations Demographic assumptions 340 199 42 Financial assumptions (6) 10 (12) Experience adjustments 172 (483) (55)Return on plan assets over interest income (2) (34) -Adjustment for mark up 16 1 - Cumulative amount of actuarial loss recognised 520 (307) (25)in the statement of total recognised gains and losses The fair value of the plan assets and the return on those assets were as follows: At 30 June 2014 Pension Gratuity fund fund £000 £000 Quoted securities Ordinary shares 711 36 Term finance certificates 2,805 68Return on plan assets over interest income Certificates of investment 485 -Pakistan investment bonds 10,927 2,273Special savings certificates 4,232 1,345 19,160 3,722
Notes(continued)
Bestway (Holdings) LtdAnnual Report & Accounts 2014
Notes
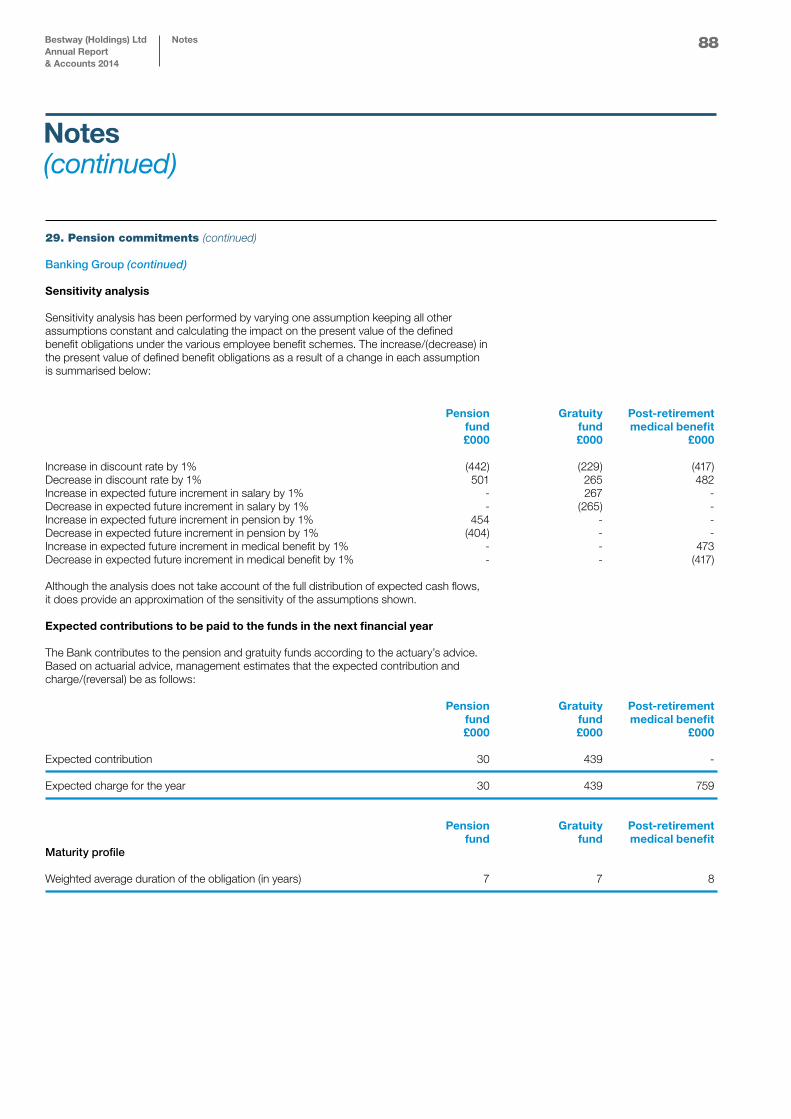
29. Pension commitments (continued)
Banking Group (continued) Sensitivity analysis Sensitivity analysis has been performed by varying one assumption keeping all other assumptions constant and calculating the impact on the present value of the defined benefit obligations under the various employee benefit schemes. The increase/(decrease) in the present value of defined benefit obligations as a result of a change in each assumption is summarised below:
Pension Gratuity Post-retirement fund fund medical benefit £000 £000 £000 Increase in discount rate by 1% (442) (229) (417)Decrease in discount rate by 1% 501 265 482Increase in expected future increment in salary by 1% - 267 -Decrease in expected future increment in salary by 1% - (265) -Increase in expected future increment in pension by 1% 454 - -Decrease in expected future increment in pension by 1% (404) - -Increase in expected future increment in medical benefit by 1% - - 473Decrease in expected future increment in medical benefit by 1% - - (417) Although the analysis does not take account of the full distribution of expected cash flows, it does provide an approximation of the sensitivity of the assumptions shown. Expected contributions to be paid to the funds in the next financial year The Bank contributes to the pension and gratuity funds according to the actuary’s advice. Based on actuarial advice, management estimates that the expected contribution and charge/(reversal) be as follows: Pension Gratuity Post-retirement fund fund medical benefit £000 £000 £000 Expected contribution 30 439 - Expected charge for the year 30 439 759 Pension Gratuity Post-retirement fund fund medical benefitMaturity profile Weighted average duration of the obligation (in years) 7 7 8
88
Notes(continued)
Bestway (Holdings) LtdAnnual Report & Accounts 2014
Notes
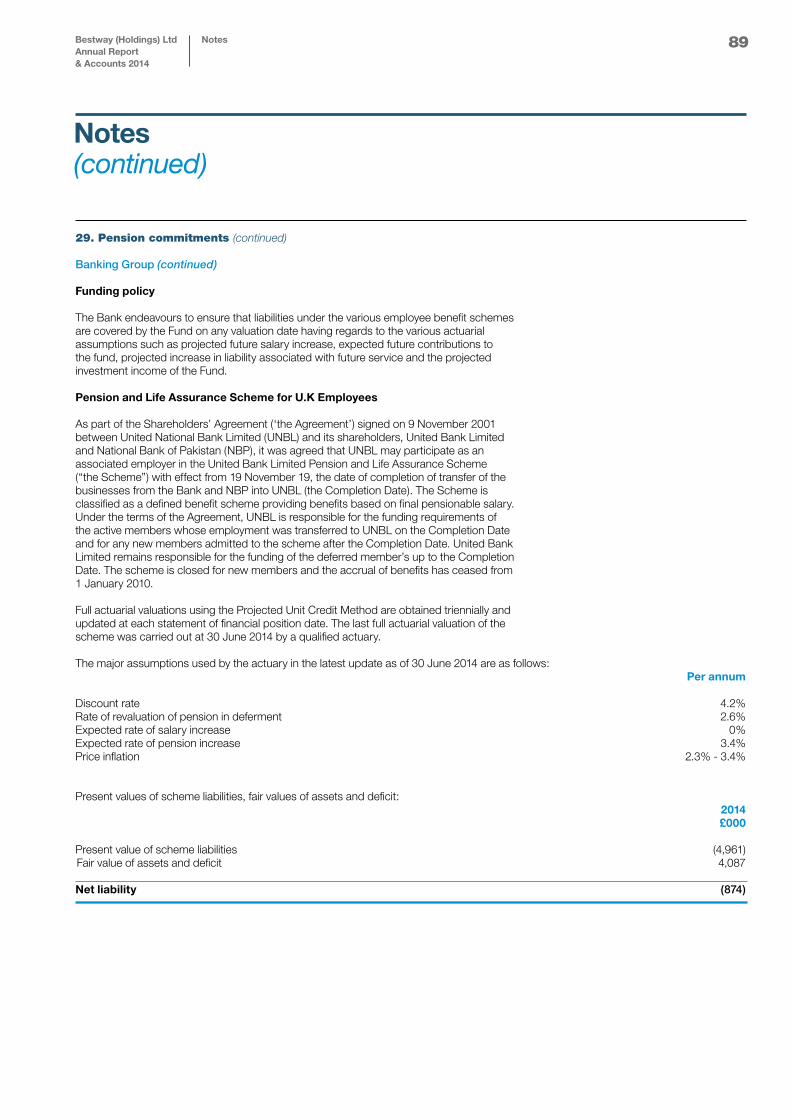
89
29. Pension commitments (continued)
Banking Group (continued) Funding policy The Bank endeavours to ensure that liabilities under the various employee benefit schemes are covered by the Fund on any valuation date having regards to the various actuarial assumptions such as projected future salary increase, expected future contributions to the fund, projected increase in liability associated with future service and the projected investment income of the Fund. Pension and Life Assurance Scheme for U.K Employees As part of the Shareholders’ Agreement (‘the Agreement’) signed on 9 November 2001 between United National Bank Limited (UNBL) and its shareholders, United Bank Limited and National Bank of Pakistan (NBP), it was agreed that UNBL may participate as an associated employer in the United Bank Limited Pension and Life Assurance Scheme (“the Scheme”) with effect from 19 November 19, the date of completion of transfer of the businesses from the Bank and NBP into UNBL (the Completion Date). The Scheme is classified as a defined benefit scheme providing benefits based on final pensionable salary. Under the terms of the Agreement, UNBL is responsible for the funding requirements of the active members whose employment was transferred to UNBL on the Completion Date and for any new members admitted to the scheme after the Completion Date. United Bank Limited remains responsible for the funding of the deferred member’s up to the Completion Date. The scheme is closed for new members and the accrual of benefits has ceased from 1 January 2010. Full actuarial valuations using the Projected Unit Credit Method are obtained triennially and updated at each statement of financial position date. The last full actuarial valuation of the scheme was carried out at 30 June 2014 by a qualified actuary.
The major assumptions used by the actuary in the latest update as of 30 June 2014 are as follows: Per annum
Discount rate 4.2%Rate of revaluation of pension in deferment 2.6%Expected rate of salary increase 0%Expected rate of pension increase 3.4%Price inflation 2.3% - 3.4% Present values of scheme liabilities, fair values of assets and deficit:
2014 £000
Present value of scheme liabilities (4,961)Fair value of assets and deficit 4,087
Net liability (874)
Notes(continued)
Bestway (Holdings) LtdAnnual Report & Accounts 2014
Notes
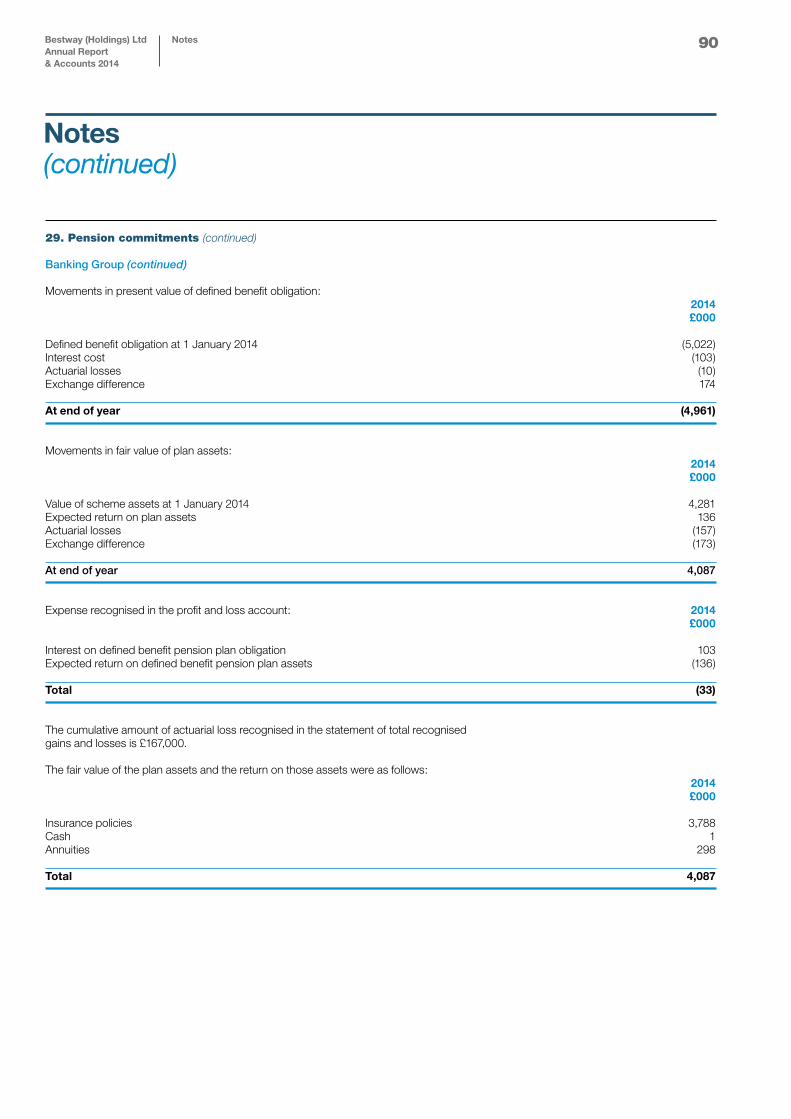
90
29. Pension commitments (continued)
Banking Group (continued) Movements in present value of defined benefit obligation: 2014 £000 Defined benefit obligation at 1 January 2014 (5,022)Interest cost (103)Actuarial losses (10)Exchange difference 174 At end of year (4,961)
Movements in fair value of plan assets: 2014 £000 Value of scheme assets at 1 January 2014 4,281Expected return on plan assets 136Actuarial losses (157)Exchange difference (173)
At end of year 4,087 Expense recognised in the profit and loss account: 2014 £000 Interest on defined benefit pension plan obligation 103 Expected return on defined benefit pension plan assets (136)
Total (33) The cumulative amount of actuarial loss recognised in the statement of total recognised gains and losses is £167,000.
The fair value of the plan assets and the return on those assets were as follows: 2014 £000 Insurance policies 3,788Cash 1Annuities 298 Total 4,087
Notes(continued)
Bestway (Holdings) LtdAnnual Report & Accounts 2014
Notes
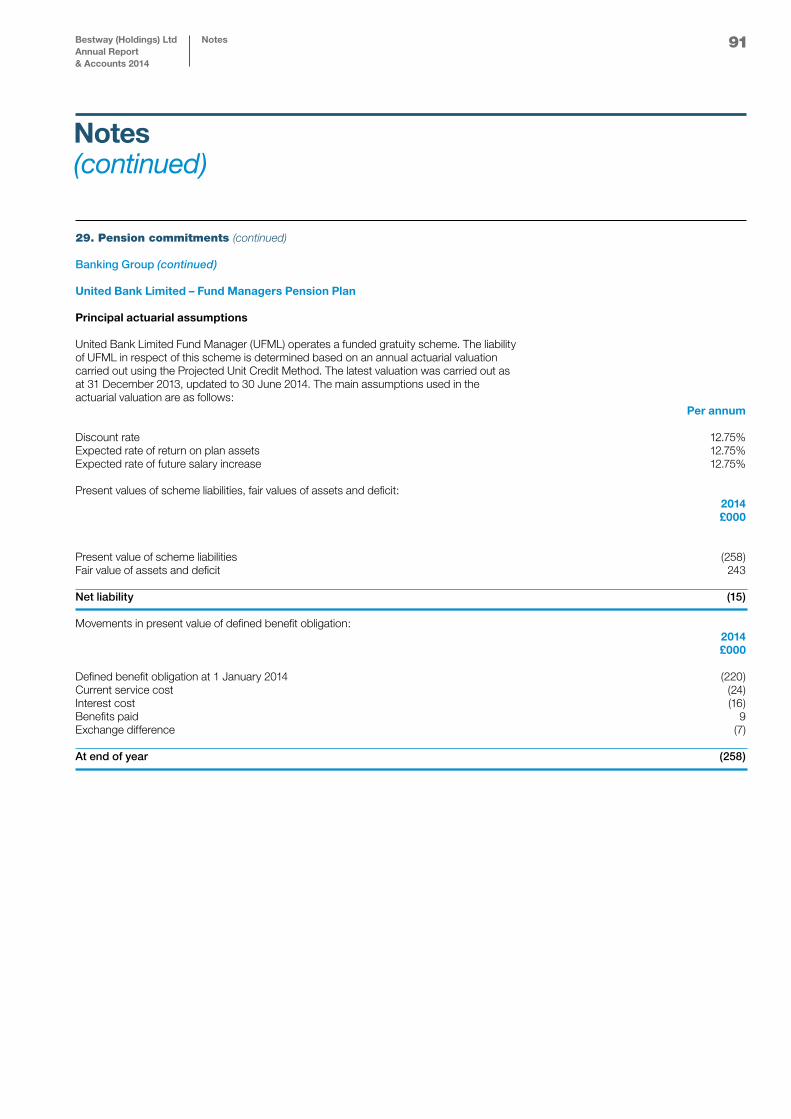
91
29. Pension commitments (continued)
Banking Group (continued) United Bank Limited – Fund Managers Pension Plan Principal actuarial assumptions United Bank Limited Fund Manager (UFML) operates a funded gratuity scheme. The liability of UFML in respect of this scheme is determined based on an annual actuarial valuation carried out using the Projected Unit Credit Method. The latest valuation was carried out as at 31 December 2013, updated to 30 June 2014. The main assumptions used in the actuarial valuation are as follows: Per annum Discount rate 12.75%Expected rate of return on plan assets 12.75%Expected rate of future salary increase 12.75%
Present values of scheme liabilities, fair values of assets and deficit: 2014 £000
Present value of scheme liabilities (258)Fair value of assets and deficit 243 Net liability (15) Movements in present value of defined benefit obligation: 2014 £000 Defined benefit obligation at 1 January 2014 (220)Current service cost (24)Interest cost (16)Benefits paid 9Exchange difference (7) At end of year (258)
Notes(continued)
Bestway (Holdings) LtdAnnual Report & Accounts 2014
Notes
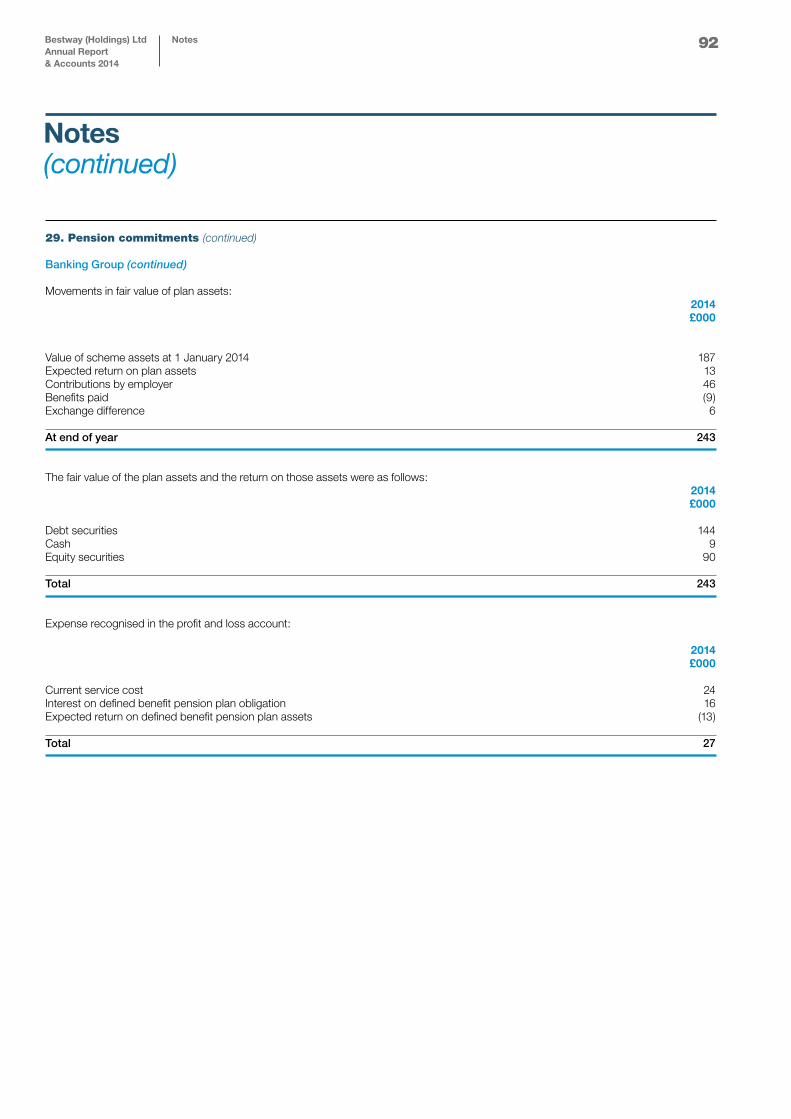
29. Pension commitments (continued)
Banking Group (continued) Movements in fair value of plan assets: 2014 £000 Value of scheme assets at 1 January 2014 187Expected return on plan assets 13Contributions by employer 46Benefits paid (9)Exchange difference 6
At end of year 243 The fair value of the plan assets and the return on those assets were as follows: 2014 £000 Debt securities 144Cash 9Equity securities 90
Total 243 Expense recognised in the profit and loss account: 2014 £000 Current service cost 24Interest on defined benefit pension plan obligation 16Expected return on defined benefit pension plan assets (13) Total 27
92
Notes(continued)
Bestway (Holdings) LtdAnnual Report & Accounts 2014
Notes
93
29. Pension commitments (continued)
Banking Group (continued) Other employee benefit schemes
Defined contribution plans
The Bank operates a contributory provident fund scheme for its employees who are not in the pension scheme. The employer and employee each contribute 8.33% of the basic salary to the funded scheme every month. UFML operates a contributory provident fund scheme. The employer and employee each contribute 10% of the basic salary to the funded scheme every month. UBL Bank (Tanzania) Limited operates a contributory provident fund scheme. The employer and employee each contribute 10% of the basic salary to the funded scheme every month. Employee Stock Option Scheme UBL Fund Managers has an incentive scheme for its top performing employees in the form of share options under the policy of Employee Stock Option Scheme (ESOS). The options give a right to eligible employees to acquire shares of UFML granted at a specified exercise price. The options vest over 3 years with 50% vesting at the end of second year and 50% vesting at the end of third year. During the year, 182,300 shares were issued pursuant to exercise of the share options.
Notes(continued)
Bestway (Holdings) LtdAnnual Report & Accounts 2014
Notes
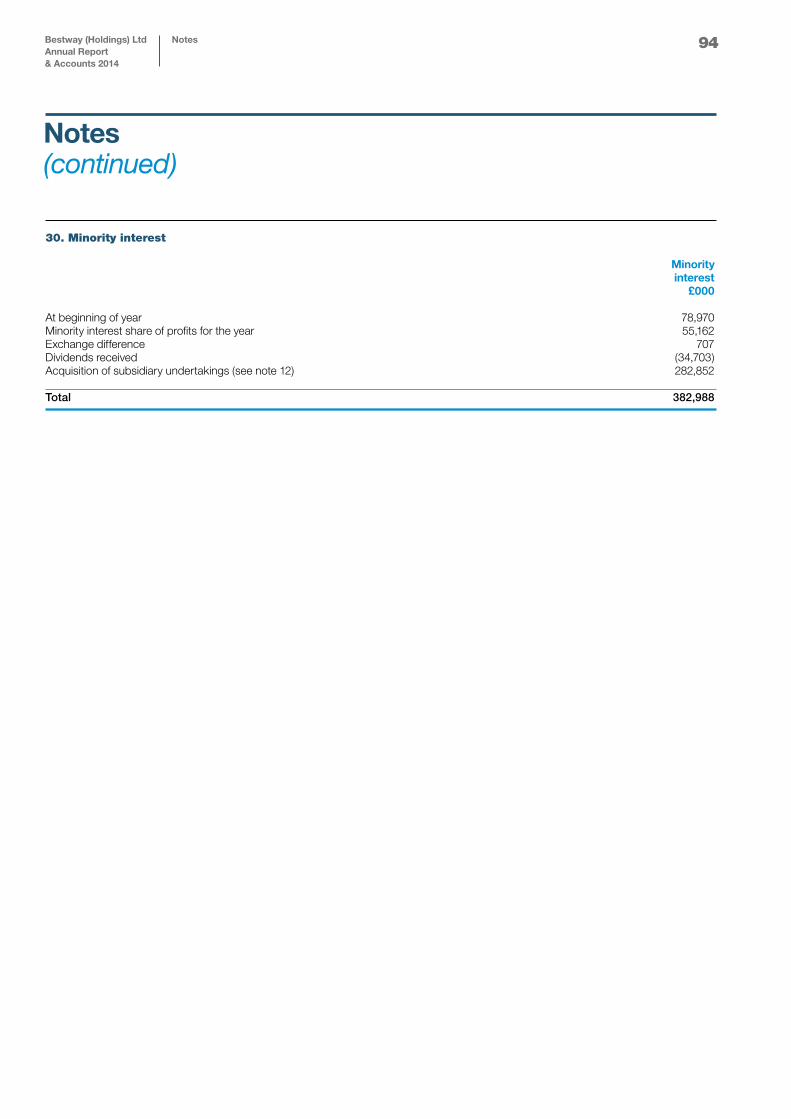
94
30. Minority interest Minority interest £000
At beginning of year 78,970Minority interest share of profits for the year 55,162Exchange difference 707Dividends received (34,703)Acquisition of subsidiary undertakings (see note 12) 282,852 Total 382,988
Notes(continued)
Bestway (Holdings) LtdAnnual Report & Accounts 2014
Notes
95
31. Post balance sheet events
On 29 September 2014 Bestway (Holdings) Limited transferred its Shareholding of the following subsidiaries to Bestway UK Holdco Limited (a member of the Bestway Holdings group):
Batleys LimitedPalmbest LimitedMAP Trading LimitedBestway Cash & Carry LimitedBestway Direct LimitedEuroimpex (U.K.) Limited
On 4 October 2014 Bestway UK Holdco Limited purchased the entire share capital of Co-operative Healthcare Holdings Limited (renamed to Panacea Holdings Limited), from the Co-operative Group Limited. This purchase added 770 Pharmacies and the management team to the group. The purchase of Panacea Holdings Limited was funded by 2 term loans and a Revolving Credit Facility totalling £725 million.
On 6 October 2014 Companies within the Bestway (Holdings) Limited and Bestway North-ern Limited (a related party) became party to a Senior Facilities Agreement with JP Morgan Limited, whereby the liabilities to JP Morgan Limited of each of the subsidiaries are cross guaranteed by each of the companies. JP Morgan Limited represents a group of lenders who are party to the facilities.
In July 2014 Bestway (Holdings) Limited repaid the bank loan that on the balance sheet dates was valued at £32,997,552.
In August 2014 Palmbest Limited repaid the bank loan that on the balance sheet date was valued at £2,350,000. In November 2014 Bestway (Holdings) Limited transferred its properties to Bestway Cash & Carry Limited and Palmbest Limited; these transfers were funded by intercompany loan notes repayable in 10 years.
In July 2014 Bestway Cement Limited entered into a binding agreement to purchase 75.86% in Lafarge Pakistan Cement Limited. Bestway cement also entered a binding agreement to purchase 50% share of Ecocem Pakistan (Pvt.).
Notes(continued)
Bestway (Holdings) LtdAnnual Report & Accounts 2014
Notes
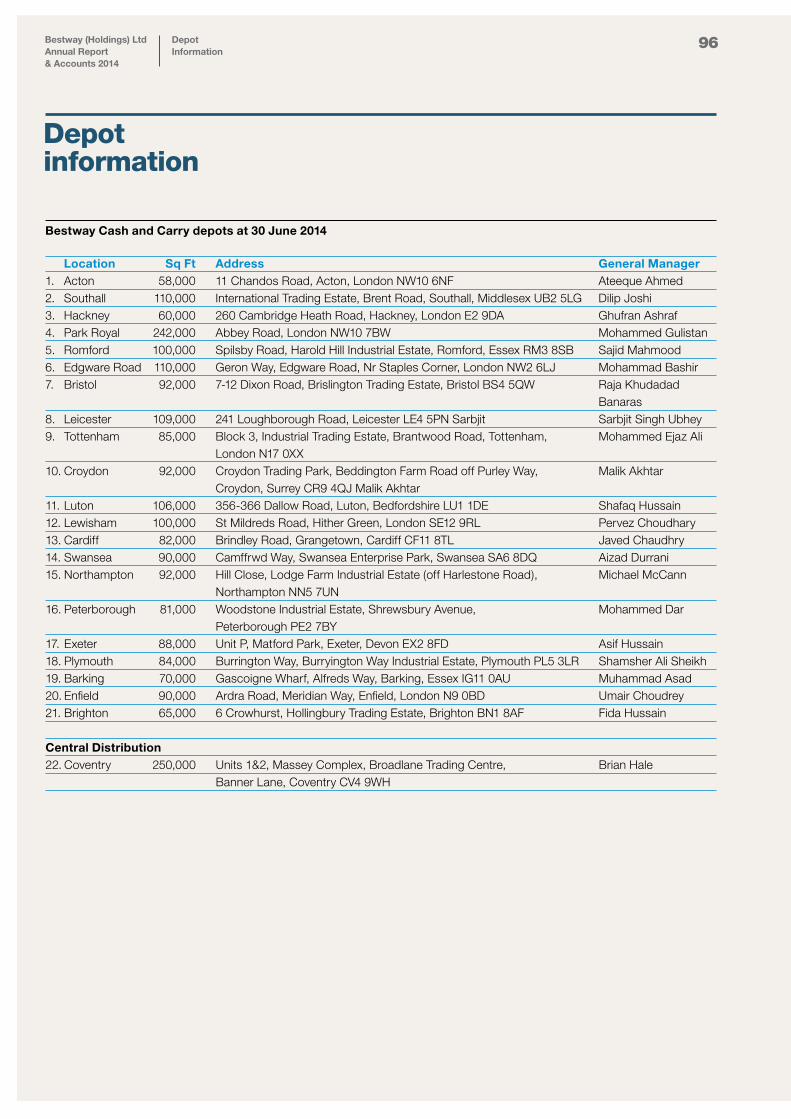
96Bestway (Holdings) LtdAnnual Report & Accounts 2014
Depot Information
Bestway Cash and Carry depots at 30 June 2014
Location Sq Ft Address General Manager1. Acton 58,000 11 Chandos Road, Acton, London NW10 6NF Ateeque Ahmed2. Southall 110,000 International Trading Estate, Brent Road, Southall, Middlesex UB2 5LG Dilip Joshi3. Hackney 60,000 260 Cambridge Heath Road, Hackney, London E2 9DA Ghufran Ashraf4. Park Royal 242,000 Abbey Road, London NW10 7BW Mohammed Gulistan5. Romford 100,000 Spilsby Road, Harold Hill Industrial Estate, Romford, Essex RM3 8SB Sajid Mahmood6. Edgware Road 110,000 Geron Way, Edgware Road, Nr Staples Corner, London NW2 6LJ Mohammad Bashir7. Bristol 92,000 7-12 Dixon Road, Brislington Trading Estate, Bristol BS4 5QW Raja Khudadad Banaras8. Leicester 109,000 241 Loughborough Road, Leicester LE4 5PN Sarbjit Sarbjit Singh Ubhey9. Tottenham 85,000 Block 3, Industrial Trading Estate, Brantwood Road, Tottenham, Mohammed Ejaz Ali London N17 0XX10. Croydon 92,000 Croydon Trading Park, Beddington Farm Road off Purley Way, Malik Akhtar Croydon, Surrey CR9 4QJ Malik Akhtar11. Luton 106,000 356-366 Dallow Road, Luton, Bedfordshire LU1 1DE Shafaq Hussain12. Lewisham 100,000 St Mildreds Road, Hither Green, London SE12 9RL Pervez Choudhary 13. Cardiff 82,000 Brindley Road, Grangetown, Cardiff CF11 8TL Javed Chaudhry14. Swansea 90,000 Camffrwd Way, Swansea Enterprise Park, Swansea SA6 8DQ Aizad Durrani15. Northampton 92,000 Hill Close, Lodge Farm Industrial Estate (off Harlestone Road), Michael McCann Northampton NN5 7UN16. Peterborough 81,000 Woodstone Industrial Estate, Shrewsbury Avenue, Mohammed Dar Peterborough PE2 7BY17. Exeter 88,000 Unit P, Matford Park, Exeter, Devon EX2 8FD Asif Hussain18. Plymouth 84,000 Burrington Way, Burryington Way Industrial Estate, Plymouth PL5 3LR Shamsher Ali Sheikh19. Barking 70,000 Gascoigne Wharf, Alfreds Way, Barking, Essex IG11 0AU Muhammad Asad20. Enfield 90,000 Ardra Road, Meridian Way, Enfield, London N9 0BD Umair Choudrey21. Brighton 65,000 6 Crowhurst, Hollingbury Trading Estate, Brighton BN1 8AF Fida Hussain Central Distribution22. Coventry 250,000 Units 1&2, Massey Complex, Broadlane Trading Centre, Brian Hale Banner Lane, Coventry CV4 9WH
Depot information
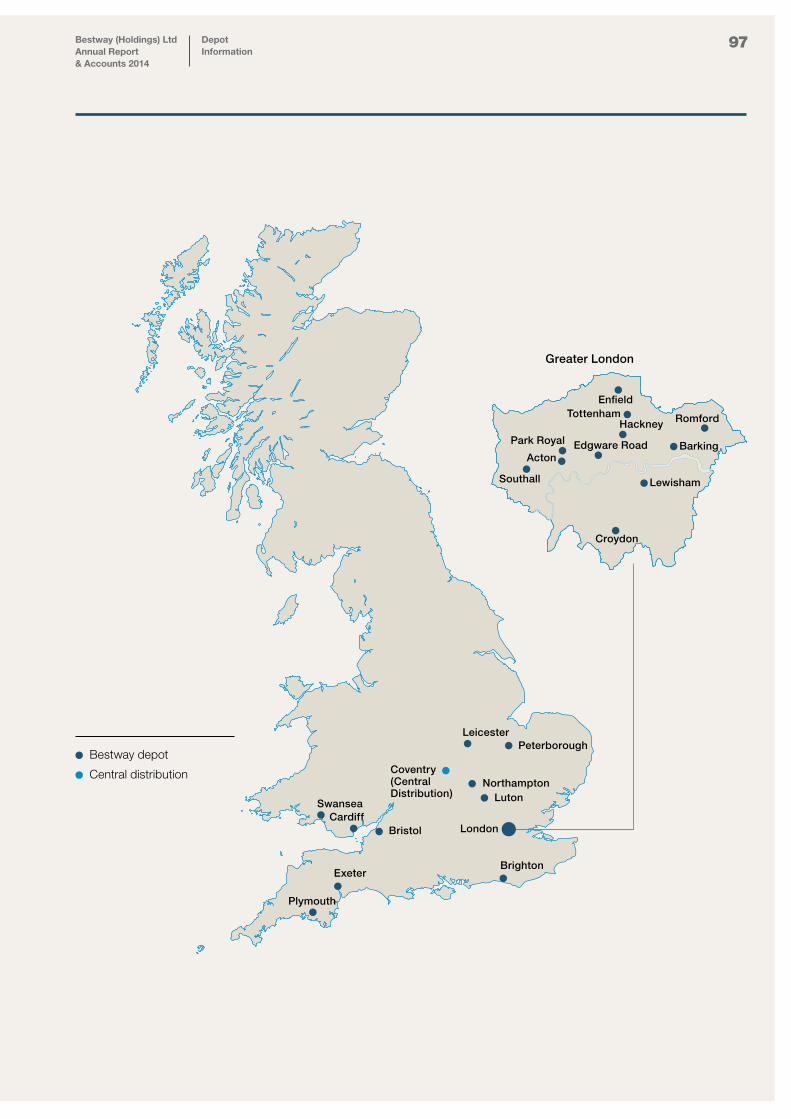
97Depot Information
Bestway (Holdings) LtdAnnual Report & Accounts 2014
Acton
Park Royal
Southall
Croydon
Edgware Road
Enfield
Barking
Lewisham
HackneyTottenham Romford
Bestway depot
Greater London
Leicester
NorthamptonLuton
LondonBristol
SwanseaCardiff
Coventry(Central Distribution)
BrightonExeter
Plymouth
Peterborough
Central distribution
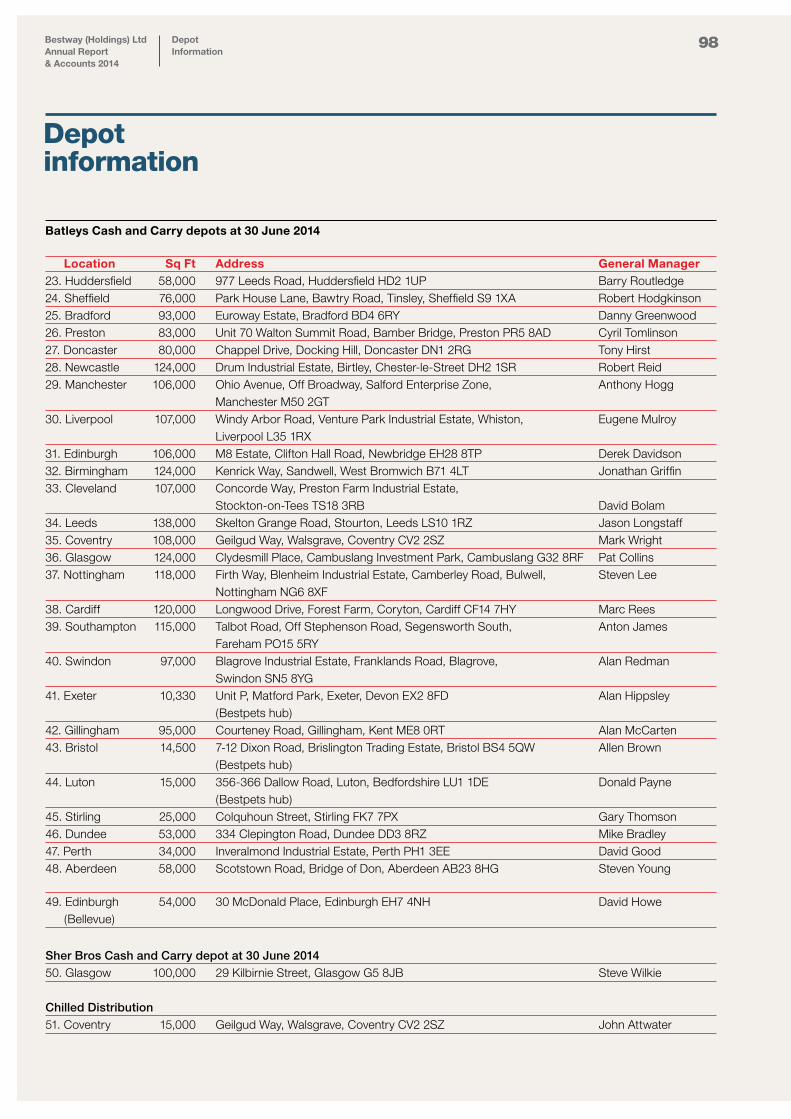
98Bestway (Holdings) LtdAnnual Report & Accounts 2014
Depot Information
Batleys Cash and Carry depots at 30 June 2014
Location Sq Ft Address General Manager23. Huddersfield 58,000 977 Leeds Road, Huddersfield HD2 1UP Barry Routledge24. Sheffield 76,000 Park House Lane, Bawtry Road, Tinsley, Sheffield S9 1XA Robert Hodgkinson25. Bradford 93,000 Euroway Estate, Bradford BD4 6RY Danny Greenwood26. Preston 83,000 Unit 70 Walton Summit Road, Bamber Bridge, Preston PR5 8AD Cyril Tomlinson 27. Doncaster 80,000 Chappel Drive, Docking Hill, Doncaster DN1 2RG Tony Hirst28. Newcastle 124,000 Drum Industrial Estate, Birtley, Chester-le-Street DH2 1SR Robert Reid29. Manchester 106,000 Ohio Avenue, Off Broadway, Salford Enterprise Zone, Anthony Hogg Manchester M50 2GT30. Liverpool 107,000 Windy Arbor Road, Venture Park Industrial Estate, Whiston, Eugene Mulroy Liverpool L35 1RX31. Edinburgh 106,000 M8 Estate, Clifton Hall Road, Newbridge EH28 8TP Derek Davidson32. Birmingham 124,000 Kenrick Way, Sandwell, West Bromwich B71 4LT Jonathan Griffin33. Cleveland 107,000 Concorde Way, Preston Farm Industrial Estate, Stockton-on-Tees TS18 3RB David Bolam34. Leeds 138,000 Skelton Grange Road, Stourton, Leeds LS10 1RZ Jason Longstaff35. Coventry 108,000 Geilgud Way, Walsgrave, Coventry CV2 2SZ Mark Wright36. Glasgow 124,000 Clydesmill Place, Cambuslang Investment Park, Cambuslang G32 8RF Pat Collins37. Nottingham 118,000 Firth Way, Blenheim Industrial Estate, Camberley Road, Bulwell, Steven Lee Nottingham NG6 8XF38. Cardiff 120,000 Longwood Drive, Forest Farm, Coryton, Cardiff CF14 7HY Marc Rees39. Southampton 115,000 Talbot Road, Off Stephenson Road, Segensworth South, Anton James Fareham PO15 5RY40. Swindon 97,000 Blagrove Industrial Estate, Franklands Road, Blagrove, Alan Redman Swindon SN5 8YG41. Exeter 10,330 Unit P, Matford Park, Exeter, Devon EX2 8FD Alan Hippsley (Bestpets hub)42. Gillingham 95,000 Courteney Road, Gillingham, Kent ME8 0RT Alan McCarten43. Bristol 14,500 7-12 Dixon Road, Brislington Trading Estate, Bristol BS4 5QW Allen Brown (Bestpets hub)44. Luton 15,000 356-366 Dallow Road, Luton, Bedfordshire LU1 1DE Donald Payne (Bestpets hub)45. Stirling 25,000 Colquhoun Street, Stirling FK7 7PX Gary Thomson46. Dundee 53,000 334 Clepington Road, Dundee DD3 8RZ Mike Bradley47. Perth 34,000 Inveralmond Industrial Estate, Perth PH1 3EE David Good48. Aberdeen 58,000 Scotstown Road, Bridge of Don, Aberdeen AB23 8HG Steven Young
49. Edinburgh 54,000 30 McDonald Place, Edinburgh EH7 4NH David Howe (Bellevue)
Sher Bros Cash and Carry depot at 30 June 201450. Glasgow 100,000 29 Kilbirnie Street, Glasgow G5 8JB Steve Wilkie Chilled Distribution51. Coventry 15,000 Geilgud Way, Walsgrave, Coventry CV2 2SZ John Attwater
Depot information
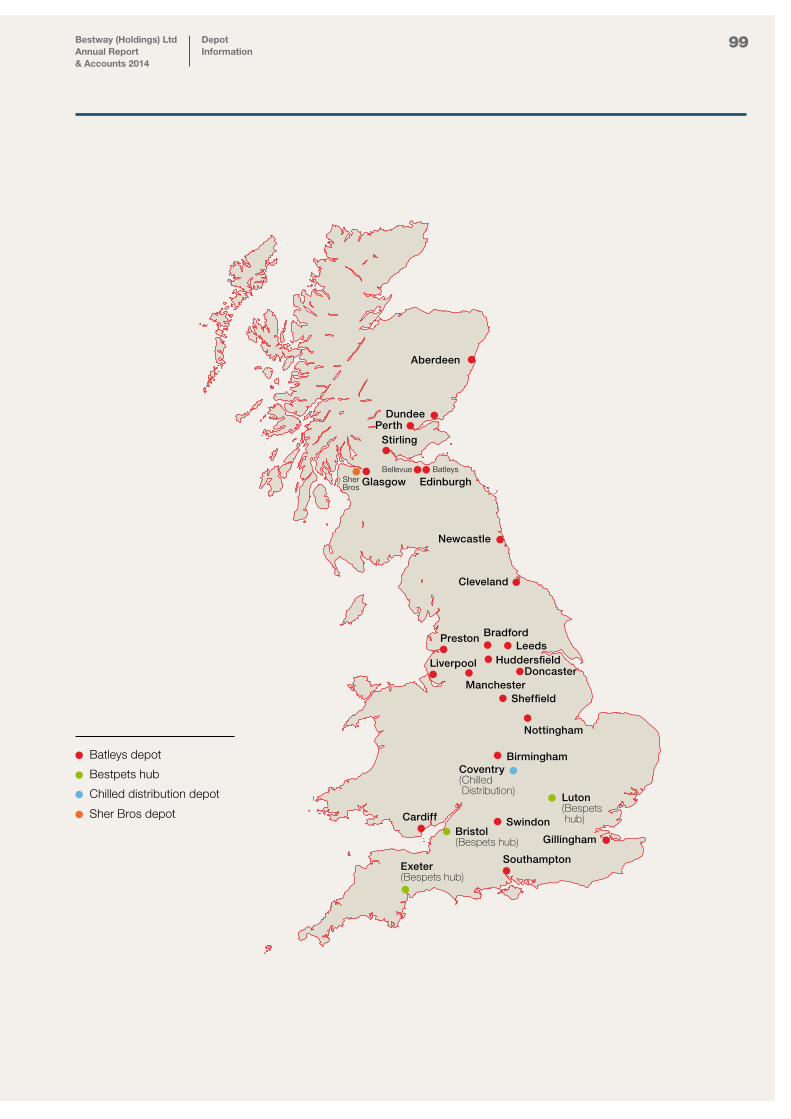
99Bestway (Holdings) LtdAnnual Report & Accounts 2014
Depot Information
Batleys depot
Bestpets hub
Chilled distribution depot
Sher Bros depot
Aberdeen
DundeePerth
Stirling
GlasgowBellevue
Sher Bros
Batleys
Edinburgh
Newcastle
Cleveland
BradfordLeeds
HuddersfieldDoncaster
ManchesterSheffield
Nottingham
Gillingham
Southampton
Swindon
Coventry (Chilled Distribution)
Birmingham
Cardiff
Luton(Bespets hub)
Bristol (Bespets hub)
Exeter (Bespets hub)
Preston
Liverpool
Bestway (Holdings) LtdAnnual Report & Accounts 2014
CompanyInformation
Company registration number 01392861 Registered Office 2 Abbey Road Park Royal London NW10 7BW Directors Sir MA Pervez, OBE HPk (Chairman) ZM Choudrey, BA (Hons), FCA (Group Chief Executive) MY Sheikh (Managing Director of Wholesale Businesses) AK Bhatti AK Chaudhary AM Chaudhary, MBA R Pervez, ACA D Pervez, BA (Hons), FRSA MA Oxon, Solicitor Secretary D Pervez, BA (Hons), FRSA MA Oxon, Solicitor Solicitors Hogan Lovells International LLP Atlantic House Holborn Viaduct London EC1A 2FG Auditors KPMG LLP 8 Salisbury Square London EC4Y 8BB
Company information
100

“ We will continue to enhance our market share in UK wholesale and pharmacy sectors and in the Pakistan cement and banking sectors whenever suitable opportunities arise.
”


![[ Core Values ] - ubldirect.com · [ Core Values ] [ Mission ] • Set ... Bestway Cement in Pakistan & Bestway Northern Limited in UK. ... He joined Bestway Group as a financial](https://img.pdfslide.us/doc/110x75/5b3ed4417f8b9a4b3f8b602b/-core-values-core-values-mission-set-bestway-cement-in.jpg)