Embed Size (px)
Citation preview
2017 REVISED EDITION
BEST PRACTICES: Risk Management and Simulation for Geologic Storage Projects
O�ce ofFossil Energy
DOE/NETL-2017/1846
Albany, OR • Anchorage, AK • Houston, TX • Morgantown, WV • Pittsburgh, PA
NATIONAL ENERGY TECHNOLOGY LABORATORY
BEST PRACTICES: Risk Management and Simulation for Geologic Storage Projects2
DISCLAIMERThis report was prepared as an account of work sponsored by an agency of the United States Government. Neither the United States Government nor any agency thereof, nor any of their employees, makes any warranty, express or implied, or assumes any legal liability or responsibility for the accuracy, completeness, or usefulness of any information, apparatus, product, or process disclosed, or represents that its use would not infringe privately owned rights. Reference therein to any specific commercial product, process, or service by trade name, trademark, manufacturer, or otherwise does not necessarily constitute or imply its endorsement, recommendation, or favoring by the United States Government or any agency thereof. The views and opinions of authors expressed therein do not necessarily state or reflect those of the United States Government or any agency thereof.
BEST PRACTICES
BEST PRACTICES: Risk Management and Simulation for Geologic Storage Projects 3
BEST PRACTICES:Risk Management and Simulation for Geologic Storage Projects
DOE/NETL-2017/1846
June 2017
National Energy Technology Laboratory
www.netl.doe.gov
BEST PRACTICES: Risk Management and Simulation for Geologic Storage Projects4
TABLE OF CONTENTSList of Tables . . . . . . . . . . . . . . . . . . . . . . . . . . . . . . . . . . . . . . . . . . . . . . . . . . . . . . . . . . . . . . . . . . . . . . . . . . . . . . . . . 6
List of Figures . . . . . . . . . . . . . . . . . . . . . . . . . . . . . . . . . . . . . . . . . . . . . . . . . . . . . . . . . . . . . . . . . . . . . . . . . . . . . . . . 7
Terminology . . . . . . . . . . . . . . . . . . . . . . . . . . . . . . . . . . . . . . . . . . . . . . . . . . . . . . . . . . . . . . . . . . . . . . . . . . . . . . . . . . 9
Acronyms and Abbreviations . . . . . . . . . . . . . . . . . . . . . . . . . . . . . . . . . . . . . . . . . . . . . . . . . . . . . . . . . . . . . . . . . . 10
Executive Summary . . . . . . . . . . . . . . . . . . . . . . . . . . . . . . . . . . . . . . . . . . . . . . . . . . . . . . . . . . . . . . . . . . . . . . . . . . 12
1.0 Introduction . . . . . . . . . . . . . . . . . . . . . . . . . . . . . . . . . . . . . . . . . . . . . . . . . . . . . . . . . . . . . . . . . . . . . . . . . . . . . . 14
1.1 Overview of the Manual . . . . . . . . . . . . . . . . . . . . . . . . . . . . . . . . . . . . . . . . . . . . . . . . . . . . . . . . . . . . . . . . . . . . . . . . 18
1.2 Key Concepts: Integration and Iteration . . . . . . . . . . . . . . . . . . . . . . . . . . . . . . . . . . . . . . . . . . . . . . . . . . . . . . . . . . . . 19
2.0 Best Practices for Risk Management . . . . . . . . . . . . . . . . . . . . . . . . . . . . . . . . . . . . . . . . . . . . . . . . . . . . . . . . 21
2.1 Establish the Context for Risk Management . . . . . . . . . . . . . . . . . . . . . . . . . . . . . . . . . . . . . . . . . . . . . . . . . . . . . . . . 23
2.2 Identify Potential Project Risks . . . . . . . . . . . . . . . . . . . . . . . . . . . . . . . . . . . . . . . . . . . . . . . . . . . . . . . . . . . . . . . . . . . 23
2.2.1 Using FEPs to Identify Sources of Project Risk . . . . . . . . . . . . . . . . . . . . . . . . . . . . . . . . . . . . . . . . . . . . . . . . . . 24
2.2.2 Other Approaches to Risk Identification . . . . . . . . . . . . . . . . . . . . . . . . . . . . . . . . . . . . . . . . . . . . . . . . . . . . . . . 26
2.3 Characterize Project Risks . . . . . . . . . . . . . . . . . . . . . . . . . . . . . . . . . . . . . . . . . . . . . . . . . . . . . . . . . . . . . . . . . . . . . . 27
2.3.1 Determining Probability of Risk Occurrence and the Magnitude or Risk Impacts . . . . . . . . . . . . . . . . . . . . . . . . 29
2.3.2 Assessment Tools . . . . . . . . . . . . . . . . . . . . . . . . . . . . . . . . . . . . . . . . . . . . . . . . . . . . . . . . . . . . . . . . . . . . . . . 29
2.3.3 Risk Analysis . . . . . . . . . . . . . . . . . . . . . . . . . . . . . . . . . . . . . . . . . . . . . . . . . . . . . . . . . . . . . . . . . . . . . . . . . . . 34
2.4 Develop a Risk Management Plan . . . . . . . . . . . . . . . . . . . . . . . . . . . . . . . . . . . . . . . . . . . . . . . . . . . . . . . . . . . . . . . . 36
2.4.1 Risk Management Planning . . . . . . . . . . . . . . . . . . . . . . . . . . . . . . . . . . . . . . . . . . . . . . . . . . . . . . . . . . . . . . . . 36
2.4.2 Elements of a Risk Management Plan . . . . . . . . . . . . . . . . . . . . . . . . . . . . . . . . . . . . . . . . . . . . . . . . . . . . . . . . 37
2.5 Implement the Risk Management Plan . . . . . . . . . . . . . . . . . . . . . . . . . . . . . . . . . . . . . . . . . . . . . . . . . . . . . . . . . . . . 38
2.5.1 The Importance of Project Communication to Implementation of RMP . . . . . . . . . . . . . . . . . . . . . . . . . . . . . . . 39
2.6 Conduct Periodic Updates to Risk Assessments . . . . . . . . . . . . . . . . . . . . . . . . . . . . . . . . . . . . . . . . . . . . . . . . . . . . . 40
2.6.1 Periodic Activities . . . . . . . . . . . . . . . . . . . . . . . . . . . . . . . . . . . . . . . . . . . . . . . . . . . . . . . . . . . . . . . . . . . . . . . . 40
2.7 RCSP Case Studies . . . . . . . . . . . . . . . . . . . . . . . . . . . . . . . . . . . . . . . . . . . . . . . . . . . . . . . . . . . . . . . . . . . . . . . . . . 42
BEST PRACTICES: Risk Management and Simulation for Geologic Storage Projects 5
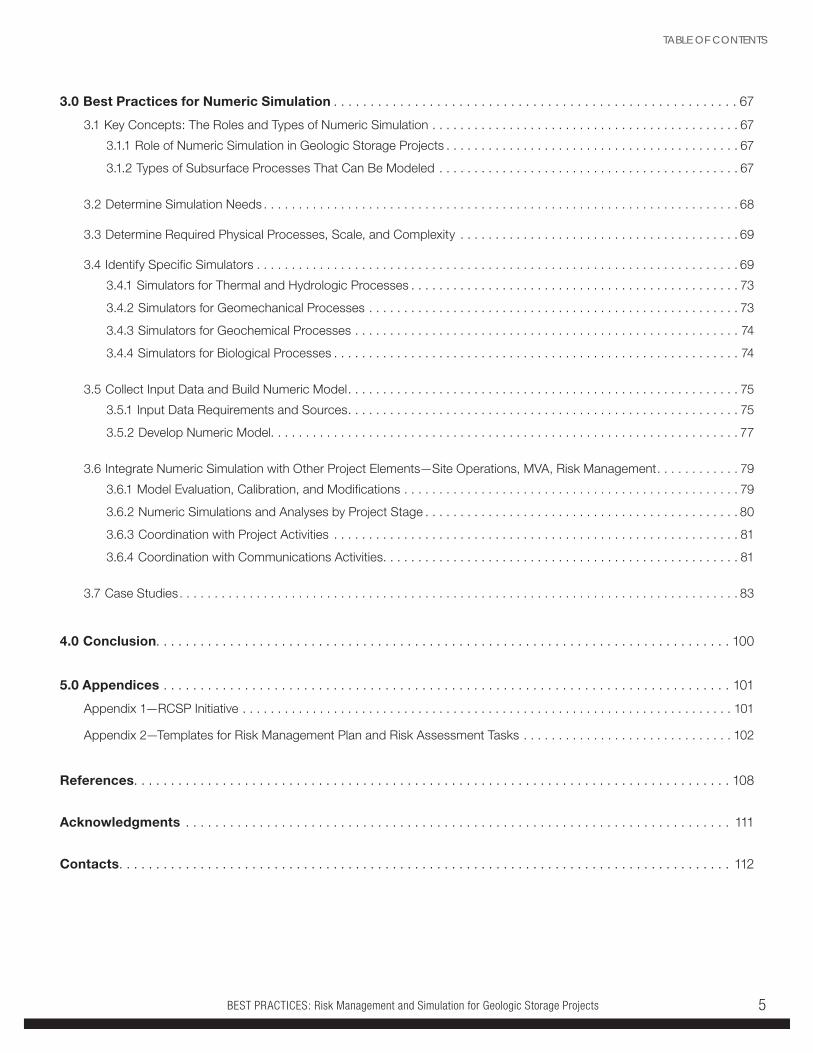
3.0 Best Practices for Numeric Simulation . . . . . . . . . . . . . . . . . . . . . . . . . . . . . . . . . . . . . . . . . . . . . . . . . . . . . . . 67
3.1 Key Concepts: The Roles and Types of Numeric Simulation . . . . . . . . . . . . . . . . . . . . . . . . . . . . . . . . . . . . . . . . . . . . 67
3.1.1 Role of Numeric Simulation in Geologic Storage Projects . . . . . . . . . . . . . . . . . . . . . . . . . . . . . . . . . . . . . . . . . . 67
3.1.2 Types of Subsurface Processes That Can Be Modeled . . . . . . . . . . . . . . . . . . . . . . . . . . . . . . . . . . . . . . . . . . . 67
3.2 Determine Simulation Needs . . . . . . . . . . . . . . . . . . . . . . . . . . . . . . . . . . . . . . . . . . . . . . . . . . . . . . . . . . . . . . . . . . . . 68
3.3 Determine Required Physical Processes, Scale, and Complexity . . . . . . . . . . . . . . . . . . . . . . . . . . . . . . . . . . . . . . . . 69
3.4 Identify Specific Simulators . . . . . . . . . . . . . . . . . . . . . . . . . . . . . . . . . . . . . . . . . . . . . . . . . . . . . . . . . . . . . . . . . . . . . 69
3.4.1 Simulators for Thermal and Hydrologic Processes . . . . . . . . . . . . . . . . . . . . . . . . . . . . . . . . . . . . . . . . . . . . . . . 73
3.4.2 Simulators for Geomechanical Processes . . . . . . . . . . . . . . . . . . . . . . . . . . . . . . . . . . . . . . . . . . . . . . . . . . . . . 73
3.4.3 Simulators for Geochemical Processes . . . . . . . . . . . . . . . . . . . . . . . . . . . . . . . . . . . . . . . . . . . . . . . . . . . . . . . 74
3.4.4 Simulators for Biological Processes . . . . . . . . . . . . . . . . . . . . . . . . . . . . . . . . . . . . . . . . . . . . . . . . . . . . . . . . . . 74
3.5 Collect Input Data and Build Numeric Model . . . . . . . . . . . . . . . . . . . . . . . . . . . . . . . . . . . . . . . . . . . . . . . . . . . . . . . . 75
3.5.1 Input Data Requirements and Sources . . . . . . . . . . . . . . . . . . . . . . . . . . . . . . . . . . . . . . . . . . . . . . . . . . . . . . . . 75
3.5.2 Develop Numeric Model. . . . . . . . . . . . . . . . . . . . . . . . . . . . . . . . . . . . . . . . . . . . . . . . . . . . . . . . . . . . . . . . . . . 77
3.6 Integrate Numeric Simulation with Other Project Elements—Site Operations, MVA, Risk Management . . . . . . . . . . . . 79
3.6.1 Model Evaluation, Calibration, and Modifications . . . . . . . . . . . . . . . . . . . . . . . . . . . . . . . . . . . . . . . . . . . . . . . . 79
3.6.2 Numeric Simulations and Analyses by Project Stage . . . . . . . . . . . . . . . . . . . . . . . . . . . . . . . . . . . . . . . . . . . . . 80
3.6.3 Coordination with Project Activities . . . . . . . . . . . . . . . . . . . . . . . . . . . . . . . . . . . . . . . . . . . . . . . . . . . . . . . . . . 81
3.6.4 Coordination with Communications Activities . . . . . . . . . . . . . . . . . . . . . . . . . . . . . . . . . . . . . . . . . . . . . . . . . . . 81
3.7 Case Studies . . . . . . . . . . . . . . . . . . . . . . . . . . . . . . . . . . . . . . . . . . . . . . . . . . . . . . . . . . . . . . . . . . . . . . . . . . . . . . . . 83
4.0 Conclusion. . . . . . . . . . . . . . . . . . . . . . . . . . . . . . . . . . . . . . . . . . . . . . . . . . . . . . . . . . . . . . . . . . . . . . . . . . . . . . 100
5.0 Appendices . . . . . . . . . . . . . . . . . . . . . . . . . . . . . . . . . . . . . . . . . . . . . . . . . . . . . . . . . . . . . . . . . . . . . . . . . . . . . 101
Appendix 1—RCSP Initiative . . . . . . . . . . . . . . . . . . . . . . . . . . . . . . . . . . . . . . . . . . . . . . . . . . . . . . . . . . . . . . . . . . . . . . 101
Appendix 2—Templates for Risk Management Plan and Risk Assessment Tasks . . . . . . . . . . . . . . . . . . . . . . . . . . . . . . 102
References . . . . . . . . . . . . . . . . . . . . . . . . . . . . . . . . . . . . . . . . . . . . . . . . . . . . . . . . . . . . . . . . . . . . . . . . . . . . . . . . . 108
Acknowledgments . . . . . . . . . . . . . . . . . . . . . . . . . . . . . . . . . . . . . . . . . . . . . . . . . . . . . . . . . . . . . . . . . . . . . . . . . . 111
Contacts . . . . . . . . . . . . . . . . . . . . . . . . . . . . . . . . . . . . . . . . . . . . . . . . . . . . . . . . . . . . . . . . . . . . . . . . . . . . . . . . . . . 112
TABLE OF CONTENTS
BEST PRACTICES: Risk Management and Simulation for Geologic Storage Projects6
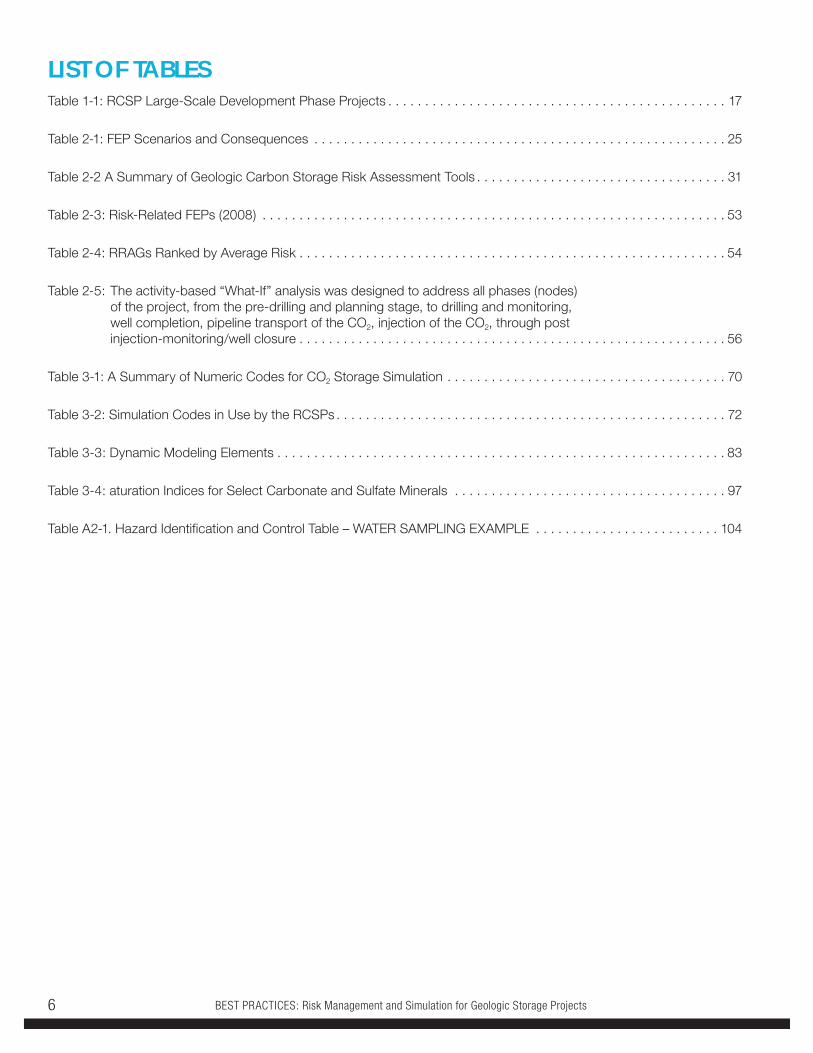
LIST OF TABLESTable 1-1: RCSP Large-Scale Development Phase Projects . . . . . . . . . . . . . . . . . . . . . . . . . . . . . . . . . . . . . . . . . . . . . . 17
Table 2-1: FEP Scenarios and Consequences . . . . . . . . . . . . . . . . . . . . . . . . . . . . . . . . . . . . . . . . . . . . . . . . . . . . . . . . 25
Table 2-2 A Summary of Geologic Carbon Storage Risk Assessment Tools . . . . . . . . . . . . . . . . . . . . . . . . . . . . . . . . . . 31
Table 2-3: Risk-Related FEPs (2008) . . . . . . . . . . . . . . . . . . . . . . . . . . . . . . . . . . . . . . . . . . . . . . . . . . . . . . . . . . . . . . . 53
Table 2-4: RRAGs Ranked by Average Risk . . . . . . . . . . . . . . . . . . . . . . . . . . . . . . . . . . . . . . . . . . . . . . . . . . . . . . . . . . 54
Table 2-5: The activity-based “What-If” analysis was designed to address all phases (nodes) of the project, from the pre-drilling and planning stage, to drilling and monitoring, well completion, pipeline transport of the CO2, injection of the CO2, through post injection-monitoring/well closure . . . . . . . . . . . . . . . . . . . . . . . . . . . . . . . . . . . . . . . . . . . . . . . . . . . . . . . . . . 56
Table 3-1: A Summary of Numeric Codes for CO2 Storage Simulation . . . . . . . . . . . . . . . . . . . . . . . . . . . . . . . . . . . . . . 70
Table 3-2: Simulation Codes in Use by the RCSPs . . . . . . . . . . . . . . . . . . . . . . . . . . . . . . . . . . . . . . . . . . . . . . . . . . . . . 72
Table 3-3: Dynamic Modeling Elements . . . . . . . . . . . . . . . . . . . . . . . . . . . . . . . . . . . . . . . . . . . . . . . . . . . . . . . . . . . . . 83
Table 3-4: aturation Indices for Select Carbonate and Sulfate Minerals . . . . . . . . . . . . . . . . . . . . . . . . . . . . . . . . . . . . . 97
Table A2-1. Hazard Identification and Control Table – WATER SAMPLING EXAMPLE . . . . . . . . . . . . . . . . . . . . . . . . . 104
BEST PRACTICES: Risk Management and Simulation for Geologic Storage Projects 7
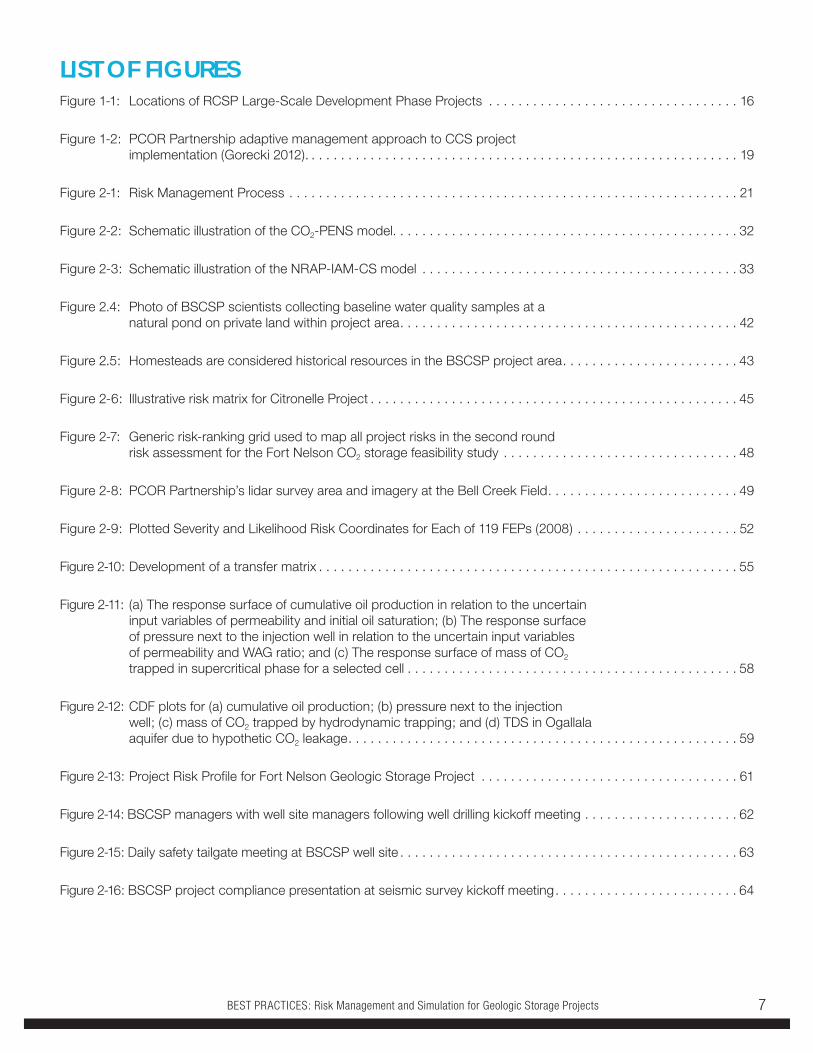
LIST OF FIGURESFigure 1-1: Locations of RCSP Large-Scale Development Phase Projects . . . . . . . . . . . . . . . . . . . . . . . . . . . . . . . . . . 16
Figure 1-2: PCOR Partnership adaptive management approach to CCS project implementation (Gorecki 2012). . . . . . . . . . . . . . . . . . . . . . . . . . . . . . . . . . . . . . . . . . . . . . . . . . . . . . . . . . . 19
Figure 2-1: Risk Management Process . . . . . . . . . . . . . . . . . . . . . . . . . . . . . . . . . . . . . . . . . . . . . . . . . . . . . . . . . . . . . 21
Figure 2-2: Schematic illustration of the CO2-PENS model. . . . . . . . . . . . . . . . . . . . . . . . . . . . . . . . . . . . . . . . . . . . . . . 32
Figure 2-3: Schematic illustration of the NRAP-IAM-CS model . . . . . . . . . . . . . . . . . . . . . . . . . . . . . . . . . . . . . . . . . . . 33
Figure 2.4: Photo of BSCSP scientists collecting baseline water quality samples at a natural pond on private land within project area . . . . . . . . . . . . . . . . . . . . . . . . . . . . . . . . . . . . . . . . . . . . . . 42
Figure 2.5: Homesteads are considered historical resources in the BSCSP project area . . . . . . . . . . . . . . . . . . . . . . . . 43
Figure 2-6: Illustrative risk matrix for Citronelle Project . . . . . . . . . . . . . . . . . . . . . . . . . . . . . . . . . . . . . . . . . . . . . . . . . . 45
Figure 2-7: Generic risk-ranking grid used to map all project risks in the second round risk assessment for the Fort Nelson CO2 storage feasibility study . . . . . . . . . . . . . . . . . . . . . . . . . . . . . . . . 48
Figure 2-8: PCOR Partnership’s lidar survey area and imagery at the Bell Creek Field . . . . . . . . . . . . . . . . . . . . . . . . . . 49
Figure 2-9: Plotted Severity and Likelihood Risk Coordinates for Each of 119 FEPs (2008) . . . . . . . . . . . . . . . . . . . . . . 52
Figure 2-10: Development of a transfer matrix . . . . . . . . . . . . . . . . . . . . . . . . . . . . . . . . . . . . . . . . . . . . . . . . . . . . . . . . . 55
Figure 2-11: (a) The response surface of cumulative oil production in relation to the uncertain input variables of permeability and initial oil saturation; (b) The response surface of pressure next to the injection well in relation to the uncertain input variables of permeability and WAG ratio; and (c) The response surface of mass of CO2 trapped in supercritical phase for a selected cell . . . . . . . . . . . . . . . . . . . . . . . . . . . . . . . . . . . . . . . . . . . . . 58
Figure 2-12: CDF plots for (a) cumulative oil production; (b) pressure next to the injection well; (c) mass of CO2 trapped by hydrodynamic trapping; and (d) TDS in Ogallala aquifer due to hypothetic CO2 leakage . . . . . . . . . . . . . . . . . . . . . . . . . . . . . . . . . . . . . . . . . . . . . . . . . . . . . 59
Figure 2-13: Project Risk Profile for Fort Nelson Geologic Storage Project . . . . . . . . . . . . . . . . . . . . . . . . . . . . . . . . . . . 61
Figure 2-14: BSCSP managers with well site managers following well drilling kickoff meeting . . . . . . . . . . . . . . . . . . . . . 62
Figure 2-15: Daily safety tailgate meeting at BSCSP well site . . . . . . . . . . . . . . . . . . . . . . . . . . . . . . . . . . . . . . . . . . . . . . 63
Figure 2-16: BSCSP project compliance presentation at seismic survey kickoff meeting . . . . . . . . . . . . . . . . . . . . . . . . . 64
BEST PRACTICES: Risk Management and Simulation for Geologic Storage Projects8
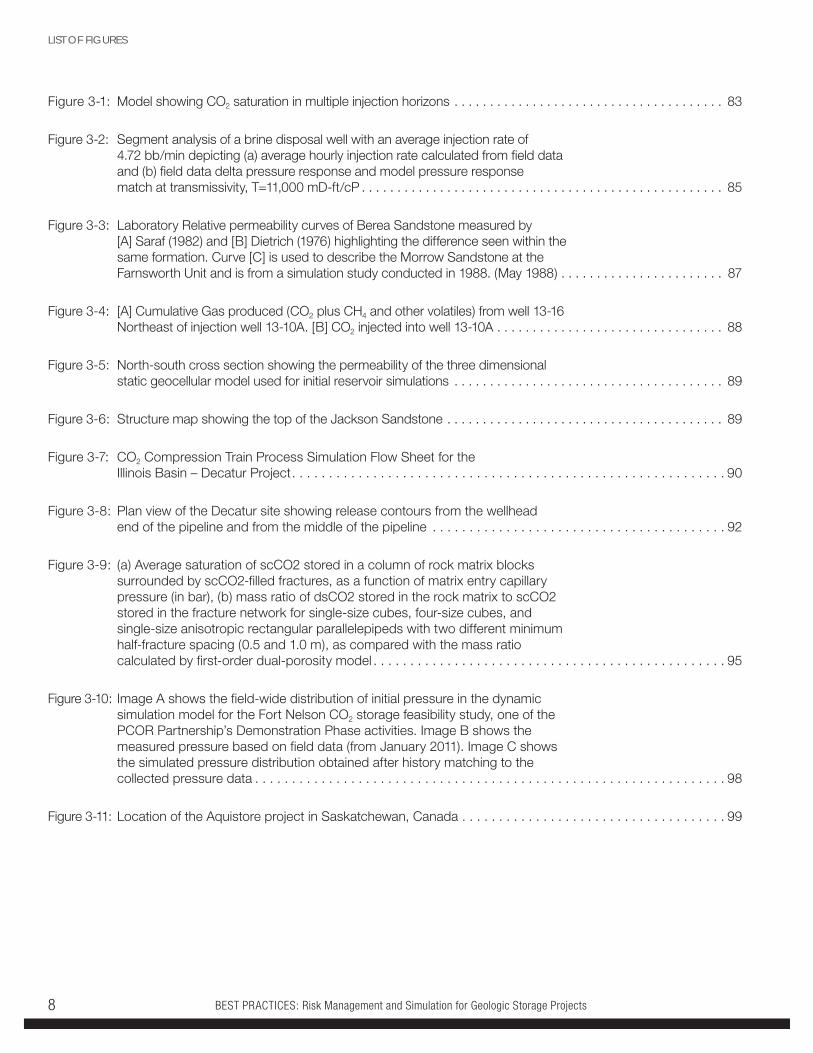
Figure 3-1: Model showing CO2 saturation in multiple injection horizons . . . . . . . . . . . . . . . . . . . . . . . . . . . . . . . . . . . . . . 83
Figure 3-2: Segment analysis of a brine disposal well with an average injection rate of 4.72 bb/min depicting (a) average hourly injection rate calculated from field data and (b) field data delta pressure response and model pressure response match at transmissivity, T=11,000 mD-ft/cP . . . . . . . . . . . . . . . . . . . . . . . . . . . . . . . . . . . . . . . . . . . . . . . . . . . 85
Figure 3-3: Laboratory Relative permeability curves of Berea Sandstone measured by [A] Saraf (1982) and [B] Dietrich (1976) highlighting the difference seen within the same formation. Curve [C] is used to describe the Morrow Sandstone at the Farnsworth Unit and is from a simulation study conducted in 1988. (May 1988) . . . . . . . . . . . . . . . . . . . . . . . 87
Figure 3-4: [A] Cumulative Gas produced (CO2 plus CH4 and other volatiles) from well 13-16 Northeast of injection well 13-10A. [B] CO2 injected into well 13-10A . . . . . . . . . . . . . . . . . . . . . . . . . . . . . . . . 88
Figure 3-5: North-south cross section showing the permeability of the three dimensional static geocellular model used for initial reservoir simulations . . . . . . . . . . . . . . . . . . . . . . . . . . . . . . . . . . . . . . 89
Figure 3-6: Structure map showing the top of the Jackson Sandstone . . . . . . . . . . . . . . . . . . . . . . . . . . . . . . . . . . . . . . . 89
Figure 3-7: CO2 Compression Train Process Simulation Flow Sheet for the Illinois Basin – Decatur Project . . . . . . . . . . . . . . . . . . . . . . . . . . . . . . . . . . . . . . . . . . . . . . . . . . . . . . . . . . . 90
Figure 3-8: Plan view of the Decatur site showing release contours from the wellhead end of the pipeline and from the middle of the pipeline . . . . . . . . . . . . . . . . . . . . . . . . . . . . . . . . . . . . . . . . 92
Figure 3-9: (a) Average saturation of scCO2 stored in a column of rock matrix blocks surrounded by scCO2-filled fractures, as a function of matrix entry capillary pressure (in bar), (b) mass ratio of dsCO2 stored in the rock matrix to scCO2 stored in the fracture network for single-size cubes, four-size cubes, and single-size anisotropic rectangular parallelepipeds with two different minimum half-fracture spacing (0.5 and 1.0 m), as compared with the mass ratio calculated by first-order dual-porosity model . . . . . . . . . . . . . . . . . . . . . . . . . . . . . . . . . . . . . . . . . . . . . . . . 95
Figure 3-10: Image A shows the field-wide distribution of initial pressure in the dynamic simulation model for the Fort Nelson CO2 storage feasibility study, one of the PCOR Partnership’s Demonstration Phase activities. Image B shows the measured pressure based on field data (from January 2011). Image C shows the simulated pressure distribution obtained after history matching to the collected pressure data . . . . . . . . . . . . . . . . . . . . . . . . . . . . . . . . . . . . . . . . . . . . . . . . . . . . . . . . . . . . . . . . 98
Figure 3-11: Location of the Aquistore project in Saskatchewan, Canada . . . . . . . . . . . . . . . . . . . . . . . . . . . . . . . . . . . . 99
LIST OF FIGURES
BEST PRACTICES: Risk Management and Simulation for Geologic Storage Projects 9
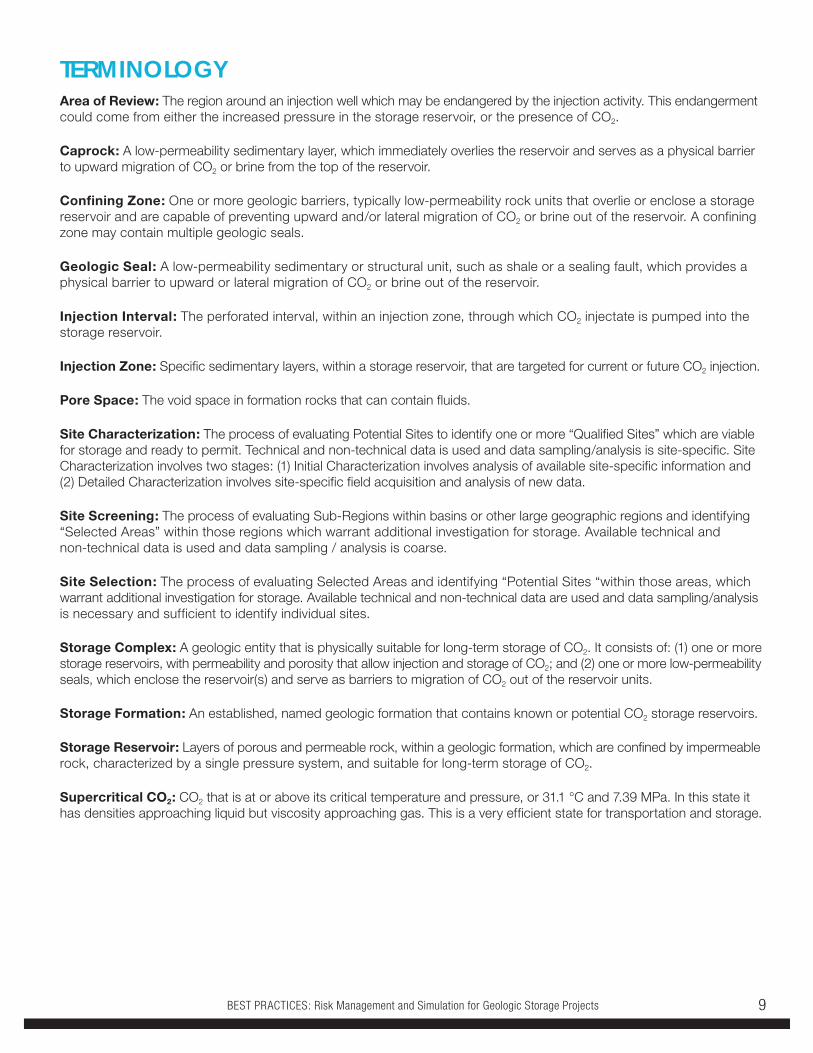
TERMINOLOGYArea of Review: The region around an injection well which may be endangered by the injection activity. This endangerment could come from either the increased pressure in the storage reservoir, or the presence of CO2.
Caprock: A low-permeability sedimentary layer, which immediately overlies the reservoir and serves as a physical barrier to upward migration of CO2 or brine from the top of the reservoir.
Confining Zone: One or more geologic barriers, typically low-permeability rock units that overlie or enclose a storage reservoir and are capable of preventing upward and/or lateral migration of CO2 or brine out of the reservoir. A confining zone may contain multiple geologic seals.
Geologic Seal: A low-permeability sedimentary or structural unit, such as shale or a sealing fault, which provides a physical barrier to upward or lateral migration of CO2 or brine out of the reservoir.
Injection Interval: The perforated interval, within an injection zone, through which CO2 injectate is pumped into the storage reservoir.
Injection Zone: Specific sedimentary layers, within a storage reservoir, that are targeted for current or future CO2 injection.
Pore Space: The void space in formation rocks that can contain fluids.
Site Characterization: The process of evaluating Potential Sites to identify one or more “Qualified Sites” which are viable for storage and ready to permit. Technical and non-technical data is used and data sampling/analysis is site-specific. Site Characterization involves two stages: (1) Initial Characterization involves analysis of available site-specific information and (2) Detailed Characterization involves site-specific field acquisition and analysis of new data.
Site Screening: The process of evaluating Sub-Regions within basins or other large geographic regions and identifying “Selected Areas” within those regions which warrant additional investigation for storage. Available technical and non-technical data is used and data sampling / analysis is coarse.
Site Selection: The process of evaluating Selected Areas and identifying “Potential Sites “within those areas, which warrant additional investigation for storage. Available technical and non-technical data are used and data sampling/analysis is necessary and sufficient to identify individual sites.
Storage Complex: A geologic entity that is physically suitable for long-term storage of CO2. It consists of: (1) one or more storage reservoirs, with permeability and porosity that allow injection and storage of CO2; and (2) one or more low-permeability seals, which enclose the reservoir(s) and serve as barriers to migration of CO2 out of the reservoir units.
Storage Formation: An established, named geologic formation that contains known or potential CO2 storage reservoirs.
Storage Reservoir: Layers of porous and permeable rock, within a geologic formation, which are confined by impermeable rock, characterized by a single pressure system, and suitable for long-term storage of CO2.
Supercritical CO2: CO2 that is at or above its critical temperature and pressure, or 31.1 °C and 7.39 MPa. In this state it has densities approaching liquid but viscosity approaching gas. This is a very efficient state for transportation and storage.
BEST PRACTICES: Risk Management and Simulation for Geologic Storage Projects10
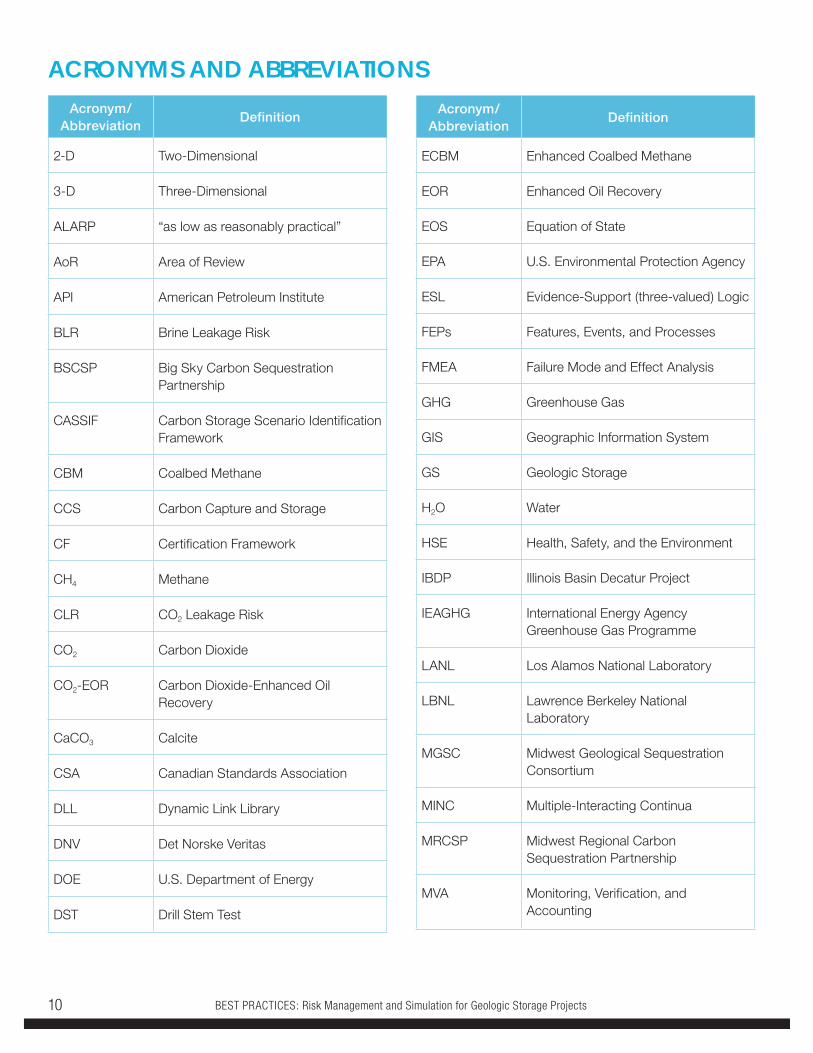
ACRONYMS AND ABBREVIATIONSAcronym/
AbbreviationDefinition
2-D Two-Dimensional
3-D Three-Dimensional
ALARP “as low as reasonably practical”
AoR Area of Review
API American Petroleum Institute
BLR Brine Leakage Risk
BSCSP Big Sky Carbon Sequestration Partnership
CASSIF Carbon Storage Scenario Identification Framework
CBM Coalbed Methane
CCS Carbon Capture and Storage
CF Certification Framework
CH4 Methane
CLR CO2 Leakage Risk
CO2 Carbon Dioxide
CO2-EOR Carbon Dioxide-Enhanced Oil Recovery
CaCO3 Calcite
CSA Canadian Standards Association
DLL Dynamic Link Library
DNV Det Norske Veritas
DOE U.S. Department of Energy
DST Drill Stem Test
Acronym/Abbreviation
Definition
ECBM Enhanced Coalbed Methane
EOR Enhanced Oil Recovery
EOS Equation of State
EPA U.S. Environmental Protection Agency
ESL Evidence-Support (three-valued) Logic
FEPs Features, Events, and Processes
FMEA Failure Mode and Effect Analysis
GHG Greenhouse Gas
GIS Geographic Information System
GS Geologic Storage
H2O Water
HSE Health, Safety, and the Environment
IBDP Illinois Basin Decatur Project
IEAGHG International Energy Agency Greenhouse Gas Programme
LANL Los Alamos National Laboratory
LBNL Lawrence Berkeley National Laboratory
MGSC Midwest Geological Sequestration Consortium
MINC Multiple-Interacting Continua
MRCSP Midwest Regional Carbon Sequestration Partnership
MVA Monitoring, Verification, and Accounting
BEST PRACTICES: Risk Management and Simulation for Geologic Storage Projects 11
ACRONYMS AND ABBREVIATIONS
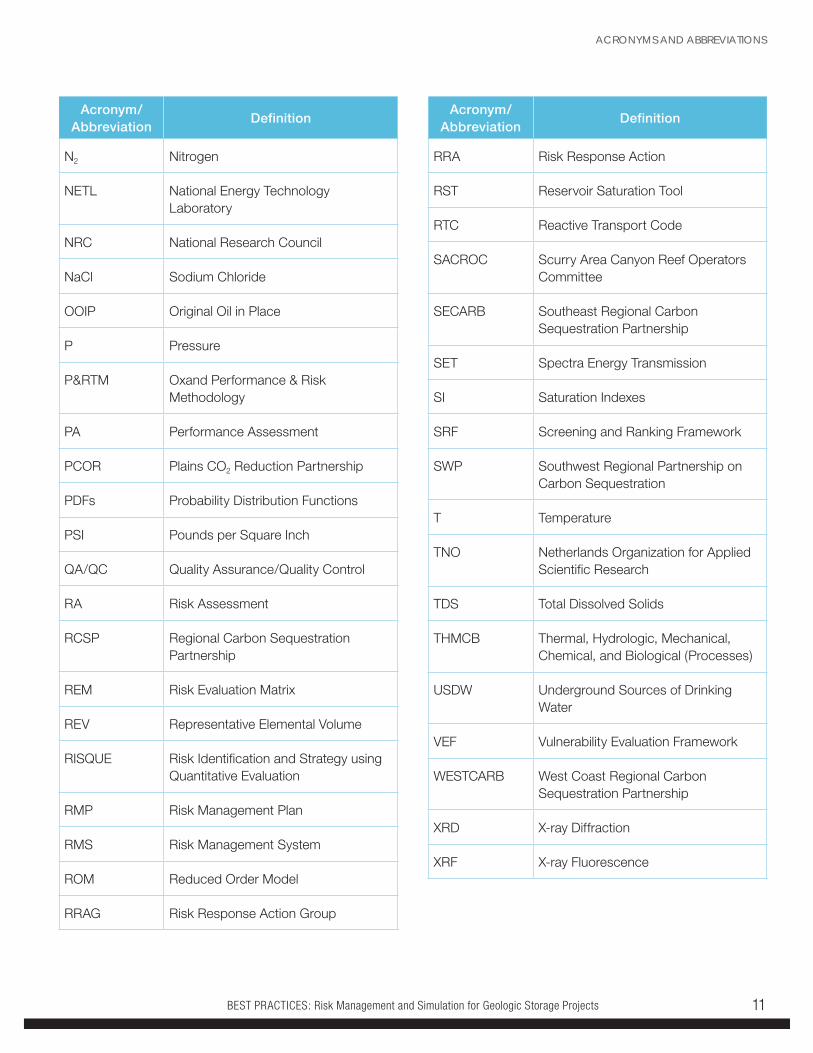
Acronym/Abbreviation
Definition
N2 Nitrogen
NETL National Energy Technology Laboratory
NRC National Research Council
NaCl Sodium Chloride
OOIP Original Oil in Place
P Pressure
P&RTM Oxand Performance & Risk Methodology
PA Performance Assessment
PCOR Plains CO2 Reduction Partnership
PDFs Probability Distribution Functions
PSI Pounds per Square Inch
QA/QC Quality Assurance/Quality Control
RA Risk Assessment
RCSP Regional Carbon Sequestration Partnership
REM Risk Evaluation Matrix
REV Representative Elemental Volume
RISQUE Risk Identification and Strategy using Quantitative Evaluation
RMP Risk Management Plan
RMS Risk Management System
ROM Reduced Order Model
RRAG Risk Response Action Group
Acronym/Abbreviation
Definition
RRA Risk Response Action
RST Reservoir Saturation Tool
RTC Reactive Transport Code
SACROC Scurry Area Canyon Reef Operators Committee
SECARB Southeast Regional Carbon Sequestration Partnership
SET Spectra Energy Transmission
SI Saturation Indexes
SRF Screening and Ranking Framework
SWP Southwest Regional Partnership on Carbon Sequestration
T Temperature
TNO Netherlands Organization for Applied Scientific Research
TDS Total Dissolved Solids
THMCB Thermal, Hydrologic, Mechanical, Chemical, and Biological (Processes)
USDW Underground Sources of Drinking Water
VEF Vulnerability Evaluation Framework
WESTCARB West Coast Regional Carbon Sequestration Partnership
XRD X-ray Diffraction
XRF X-ray Fluorescence
BEST PRACTICES: Risk Management and Simulation for Geologic Storage Projects12
EXECUTIVE SUMMARYGeologic Storage of anthropogenic carbon dioxide (CO2) has gained recognition in recent years as a necessary technology approach for ensure environmental sustainability by reducing greenhouse gas emissions. The U.S. Department of Energy (DOE) Office of Fossil Energy’s (FE) National Energy Technology Laboratory (NETL) are developing technologies that will enable widespread commercial deployment of geologic storage of CO2 by 2025-2035.
DOE has engaged with technical experts in the Regional Carbon Sequestration Partnership (RCSP) Initiative to update its Best Practice Manuals (BPMs) for geologic storage projects. The BPMs are intended to disseminate knowledge gained through the RCSP Initiative and to establish uniform approaches for carrying out successful projects.
The first editions of the BPMs were completed between 2009 and 2013 and incorporated findings from RCSP Characterization Phase and small-scale Validation Phase field projects. The 2017 Revised Editions of the BPMs include lessons learned in more recent years, as the RCSPs have progressed to large-scale Development Phase field projects.
The five 2017 Revised Edition BPMs are:
• BEST PRACTICES: Site Screening, Site Selection, and Site Characterization for Geologic Storage Projects
• BEST PRACTICES: Public Outreach and Education for Geologic Storage Projects
• BEST PRACTICES: Risk Management and Simulation for Geologic Storage Projects
• BEST PRACTICES: Operations for Geologic Storage Projects
• BEST PRACTICES: Monitoring, Verification, and Accounting (MVA) for Geologic Storage Projects
The BPMs are interconnected, and together they are intended to provide a holistic approach to carrying out a geologic storage project, from inception to completion.
Risk management and numeric simulation are critical tools, which are used throughout all stages of a geologic storage project. For purposes of this manual, risk is assessed by estimating the probability of an event that results in adverse impacts and quantifying the magnitude of those adverse impacts or consequences. Risk management is an iterative process used in many disciplines to develop and implement strategies to mitigate those impacts that represent an unacceptable risk. This manual presents a framework for risk management that incorporates the knowledge gained through the experiences of the RCSPs. It consists of six best practices that are intended to help project developers and other stakeholders to assess and manage geologic storage project risks. The commercial deployment of CO2 storage is in its early stages; therefore, an adaptive management strategy is being employed for the development of these best practices. As such, the best practices presented in this document provide a foundation, or initial snap shot, upon which industry best practices will continue to evolve over time as more lessons are learned from the ongoing research and during the commercialization of the industry.
Numeric simulations or models are used to predict the behavior of many parts of the storage project to the injection of CO2 into the subsurface. They serve as primary tools to support the identification, estimation, and mitigation of risks arising from the transport and injection of CO2. They are also used to optimize the design of monitoring systems and facilitate more effective site characterization. This manual presents a framework of best practices for developing and using numeric simulation to model the specific subsurface processes at a geologic storage site (thermal and hydrologic, chemical, mechanical, and biologic) that are necessary for predicting the behavior of injected CO2 for risk management and other purposes.
The content of this manual is based upon the direct experience gained by the RCSPs during the implementation of their portions of the DOE Carbon Storage Program and through discourse with other experts from the DOE national laboratories and others.
BEST PRACTICES: Risk Management and Simulation for Geologic Storage Projects 13
This manual is organized into five major sections:
1. Introduction
2. Best Practices for Risk Management
3. Best Practices for Numeric Simulation
4. Conclusion
5. Appendices
Successful implementation of geologic storage projects will require developers to assess candidate sites based on a number of site selection criteria, such as storage capacity; health and environmental safety; economics; regulatory constraints; ability to deploy monitoring technologies; and potential ancillary benefits such as enhanced hydrocarbon production. Risk analysis and numeric simulations will help guide geologic storage implementation by providing stakeholders (e.g., operators, project developers, general public, and regulators) with information to predict the long-term fate and associated risks of CO2 injection into the subsurface, including, but not limited to: long-term CO2 storage capacity; potential risks associated with CO2 leakage; and potential other adverse impacts. Over time, by comparing measured data to the predicted model results, the operator will be able to calibrate the model and “history match” the predicted location of the CO2 and its measured location as well as update the risk analysis to identify any unacceptable risks. This history match is an important part of the process in that it provides confidence that the available models of a geologic storage project: (1) can predict the safe storage of CO2 at the project site; (2) can verify when the site has reached a point of negligible risk; and (3) can accurately predict site conditions and risk over extended periods of time following site closure.
EXECUTIVE SUMMARY
BEST PRACTICES: Risk Management and Simulation for Geologic Storage Projects14
1.0 INTRODUCTIONGeologic Storage of anthropogenic carbon dioxide (CO2) has gained recognition in recent years as a necessary technology approach for ensure environmental sustainability by reducing greenhouse gas emissions. The U.S. Department of Energy (DOE) Office of Fossil Energy’s (FE) National Energy Technology Laboratory (NETL) are developing technologies that will enable widespread commercial deployment of geologic storage of CO2 by 2025-2035.
As an important step in meeting this objective, DOE/FE/NETL established the Regional Carbon Sequestration Partnership (RCSP) Initiative (see Appendix 1). This national Initiative, launched in 2003, includes seven regional partnerships tasked with developing and testing technologies and approaches for safe and permanent storage of CO2 in different geologic and geographic settings across the United States. An important outcome of the RCSP Initiative is the publication of a series of topical BPMs for geologic storage projects. The BPMs are intended to disseminate knowledge gained through the RCSP field efforts and to establish effective methods, reliable approaches, and consistent standards for carrying out successful geologic storage projects.
The first editions of the BPMs were completed between 2009 and 2013 and presented salient findings of the RCSPs’ Characterization and Validation Phase field projects. Since that time, the RCSPs have progressed to large-scale Development Phase field projects. For the 2017 Revised Editions of the BPMs, DOE/FE/NETL has worked closely with technical experts from the RCSPs to incorporate new findings and lessons learned from these Development Phase projects.
The five 2017 Revised Edition BPMs are:
• BEST PRACTICES: Site Screening, Site Selection, and Site Characterization for Geologic Storage Projects
• BEST PRACTICES: Public Outreach and Education for Geologic Storage Projects
• BEST PRACTICES: Risk Management and Simulation for Geologic Storage Projects
• BEST PRACTICES: Operations for Geologic Storage Projects
• BEST PRACTICES: Monitoring, Verification, and Accounting (MVA) for Geologic Storage Projects
Taken separately, each BPM can serve as a stand-alone guide for conducting specific activities related to Characterization, Public Outreach, Risk Management, Operations, or MVA. Taken together, the five BPMs are interconnected—each linked to the others by the interdisciplinary nature of a geologic storage project. They are intended to provide a holistic approach to carrying out a multifaceted geologic storage project, from inception to completion.
The 2017 Revised Edition BPM on “Risk Management and Simulation for Geologic Storage Projects” is a revision of an earlier version, published in 2013.
Geologic storage is an approach that draws on more than a century of experience in the oil and gas industry and, more recently, several decades of other analogous commercial industries that utilize subsurface injection of gases and/or liquids. However, like any technology application, there are potential risks associated with geologic storage that need to be analyzed and properly managed. This BPM builds on the experience of the RCSP Initiative and efforts within the research community, notably the International Energy Agency Greenhouse Gas (IEAGHG) R&D Program review of risk assessment guidelines, (IEA 2009) to develop an approach for utilizing risk management and numeric simulation throughout the process of implementing a geologic storage project, (i.e., site selection, design, operation and, ultimately, closure).1 Together, risk management and numeric
1 Efforts associated with closure are not comprehensively addressed in this manual since it represents a time period that will occur following 20 or 30 years of site operation. Since there are currently no sites undergoing closure, this manual focuses on modeling and simulation activities that are capable of predicting site conditions during the closure period. However, no actual field data is available at this time with which to validate these model results.
BEST PRACTICES: Risk Management and Simulation for Geologic Storage Projects 15
simulation are an integral part of the decision-making process for all geologic storage project stakeholders, including developers, operators, regulators, and the general public. These analyses need to be undertaken routinely throughout the entire lifecycle of a project and updated as experience and operational data are obtained.
This BPM reflects the lessons learned from the work of the RCSPs to develop and/or use formal and qualitative methods to select and implement geologic storage projects safely and effectively.2 The manual presents two frameworks—one for approaching risk management and the second for approaching numeric simulation. These approaches have been structured to include the overarching best practices that have been developed from the specific lessons learned of the RCSPs. The format is intended to help the reader consider both the overarching structure of the approach as well as some of the details required for implementation.
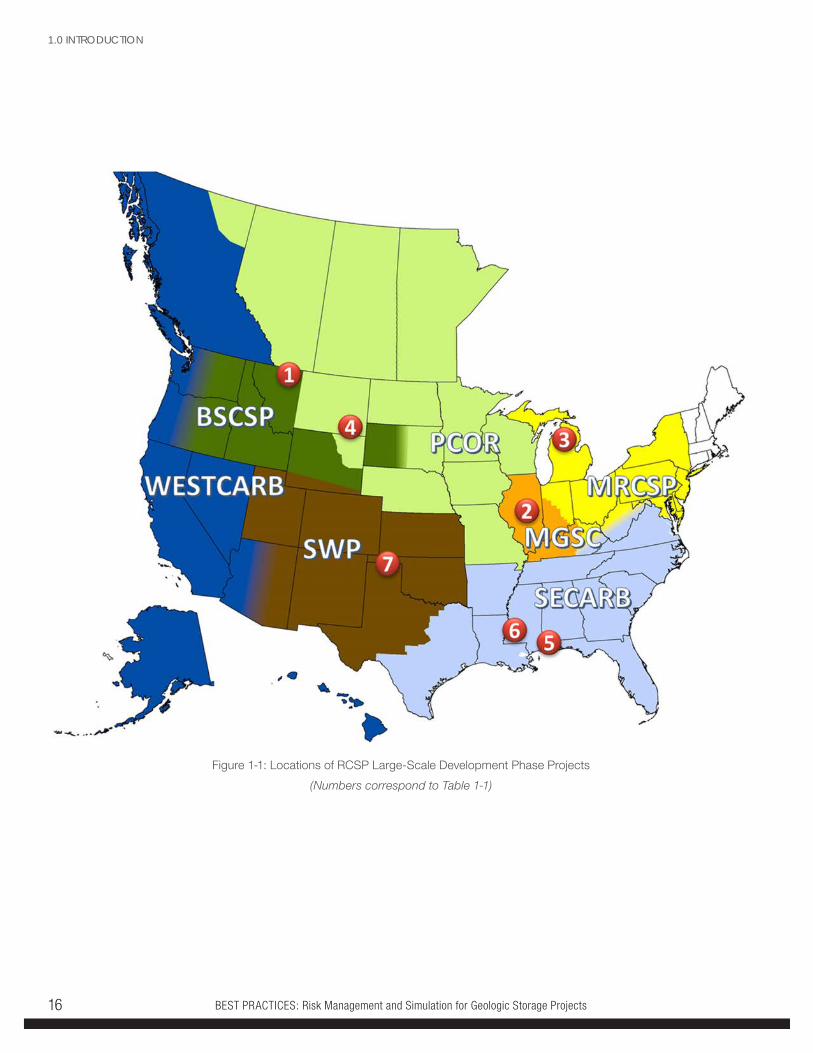
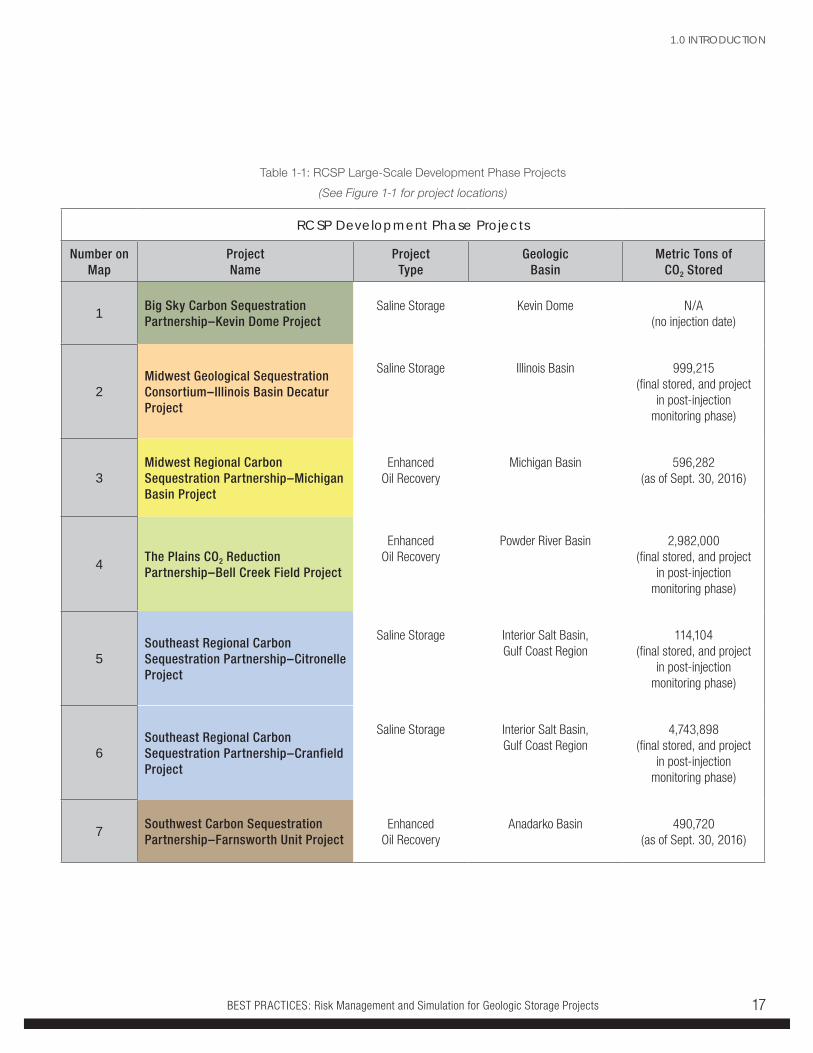
Throughout the manual, examples and lessons learned are provided as “case studies” from the RCSP Large-Scale Development Phase field projects. Figure 1-1 and Table 1-1 provide the fundamental information on these RCSP projects, including project name, project type, geologic basin, amount of stored CO2, and geographic location. Some additional context for the RCSP Development Phase field projects is provided in Appendix I.
2 At this point the lessons learned by each of the RCSPs document their experience gained as their field projects were conducted. These lessons learned come from working with the real-world problems that will be associated with implementing a commercial geologic storage project. Lessons learned documents identify problems and how to solve them. Collecting and disseminating lessons learned helps to eliminate the occurrence of the same problems in future projects and results in the development of a best practice. That said, a best practice is a process, practice, or system that performs exceptionally well and is widely recognized as improving the performance and efficiency of specific processes. Successfully identifying and applying best practices can reduce business expenses and improve organizational efficiency. Best practices are positive activities or systems that are recommended for use by others in similar situations. With this understanding, the best practices will continue to evolve over time for the geologic storage of CO2 as more and more lessons are learned during the commercialization of this GHG emissions reduction strategy.
1.0 INTRODUCTION
BEST PRACTICES: Risk Management and Simulation for Geologic Storage Projects16
Figure 1-1: Locations of RCSP Large-Scale Development Phase Projects
(Numbers correspond to Table 1-1)
1.0 INTRODUCTION
BEST PRACTICES: Risk Management and Simulation for Geologic Storage Projects 17
RCSP Development Phase Projects
Number on Map
Project Name
Project Type
Geologic Basin
Metric Tons of CO2 Stored
1 Big Sky Carbon Sequestration Partnership–Kevin Dome Project
Saline Storage Kevin Dome N/A (no injection date)
2Midwest Geological Sequestration Consortium–Illinois Basin Decatur Project
Saline Storage Illinois Basin 999,215 (final stored, and project
in post-injection monitoring phase)
3Midwest Regional Carbon Sequestration Partnership–Michigan Basin Project
Enhanced Oil Recovery
Michigan Basin 596,282 (as of Sept. 30, 2016)
4 The Plains CO2 Reduction Partnership–Bell Creek Field Project
Enhanced Oil Recovery
Powder River Basin 2,982,000 (final stored, and project
in post-injection monitoring phase)
5Southeast Regional Carbon Sequestration Partnership–Citronelle Project
Saline Storage Interior Salt Basin, Gulf Coast Region
114,104 (final stored, and project
in post-injection monitoring phase)
6Southeast Regional Carbon Sequestration Partnership–Cranfield Project
Saline Storage Interior Salt Basin, Gulf Coast Region
4,743,898 (final stored, and project
in post-injection monitoring phase)
7 Southwest Carbon Sequestration Partnership–Farnsworth Unit Project
Enhanced Oil Recovery
Anadarko Basin 490,720 (as of Sept. 30, 2016)
Table 1-1: RCSP Large-Scale Development Phase Projects
(See Figure 1-1 for project locations)
1.0 INTRODUCTION
BEST PRACTICES: Risk Management and Simulation for Geologic Storage Projects18
1.1 OVERVIEW OF THE MANUALThis manual is broken into five sections. Section 1.0, this introduction, presents background information and an overview of the manual.
Section 2.0 describes the best practices for risk management that have been developed from the experience of the RCSPs; these correspond to the basic steps of a risk management framework. This experience draws on the larger discipline of evaluating and managing the risks associated with other industries and technologies. Risk management is a critical process that, when done well, provides a rigorous analytical framework for identifying and characterizing pertinent risks; proactively developing methodologies to mitigate the impacts from any unacceptable risks; and, integrating risk management with project management, design, and implementation.
As applied to geologic storage projects, the risks of primary concern to many stakeholder groups are those associated with unintended CO2 migration out of the storage reservoir, and that is a major focus of this manual. In addition, the RCSPs have identified other project-related operational and financial events, such as events that take place on the surface or in the policy arena that could also have adverse impacts on a geologic storage project. The risk management section of the manual presents the concepts and steps involved in developing a qualitative and quantitative evaluation of the impact these risks could pose to human health, safety, the environment, and operational aspects of a storage project. It summarizes the tools that have recently become available for performing risk analysis and discusses the potential major pathways for migration of CO2 out of the storage reservoir and approaches to mitigate, remediate, and control such migration. The intended audience of this section of the manual includes engineers, regulators, project developers, non-governmental organizations (NGOs), and professionals who are interested in the applications of risk analysis principles to geologic CO2 storage.
Section 3.0 focuses on numeric simulation, which is the use of computer codes to model the hydrologic, mechanical, and chemical processes associated with CO2 injection and movement in the subsurface. Numeric simulators are used to predict how far the CO2 will move, how fast the CO2 will move, what pressures will be created, what kind of chemical reactions will occur, and what happens to the products of those reactions. They are also used to model the behavior of pipelines, facilities, wells, shallow aquifers and the atmosphere, as well as the geomechanical response of the storage formation to the increase in pore pressure. Numeric simulation is a highly developed discipline, built upon decades of development driven by applications such as oil and gas production, geothermal energy development, and groundwater use. However, technical issues remain with application of numeric simulation to geologic CO2 storage. The numeric simulations section of the manual reviews the RCSPs’ approaches to simulation and it also includes sidebars and appendices that provide more detailed modeling information geared toward reservoir engineering specialists.
Section 4.0 contains a brief set of concluding remarks on the risk management and numeric simulation best practices described in this BPM.
And finally, Section 5.0 contains the appendices, which provide detailed information on specific aspects of risk analysis and numeric simulation.
This manual is not intended to be prescriptive; rather, it is meant to share the experiences and lessons learned from the risk analysis and numeric simulation activities of the RCSPs. Collectively this experience will serve as a foundation for developing a best practice approach to risk analysis and numeric simulation.
1.0 INTRODUCTION
BEST PRACTICES: Risk Management and Simulation for Geologic Storage Projects 19
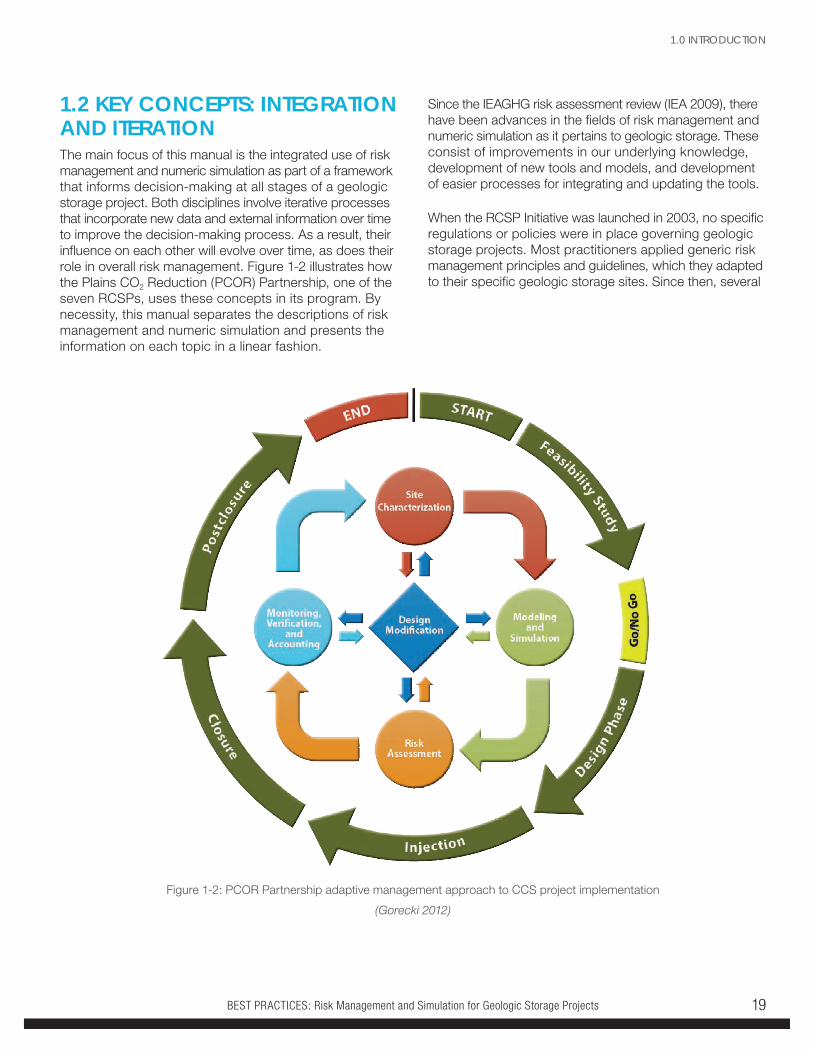
1.2 KEY CONCEPTS: INTEGRATION AND ITERATIONThe main focus of this manual is the integrated use of risk management and numeric simulation as part of a framework that informs decision-making at all stages of a geologic storage project. Both disciplines involve iterative processes that incorporate new data and external information over time to improve the decision-making process. As a result, their influence on each other will evolve over time, as does their role in overall risk management. Figure 1-2 illustrates how the Plains CO2 Reduction (PCOR) Partnership, one of the seven RCSPs, uses these concepts in its program. By necessity, this manual separates the descriptions of risk management and numeric simulation and presents the information on each topic in a linear fashion.
Since the IEAGHG risk assessment review (IEA 2009), there have been advances in the fields of risk management and numeric simulation as it pertains to geologic storage. These consist of improvements in our underlying knowledge, development of new tools and models, and development of easier processes for integrating and updating the tools.
When the RCSP Initiative was launched in 2003, no specific regulations or policies were in place governing geologic storage projects. Most practitioners applied generic risk management principles and guidelines, which they adapted to their specific geologic storage sites. Since then, several
1.0 INTRODUCTION
Figure 1-2: PCOR Partnership adaptive management approach to CCS project implementation
(Gorecki 2012)
BEST PRACTICES: Risk Management and Simulation for Geologic Storage Projects20
1.0 INTRODUCTION
notable developments have occurred in risk management, both general and specific to geologic storage. Examples of these developments are:
• ISO 31000 published Risk Management—Principles and Guidelines, an international resource for risk management (ISO 31000, 2009). Although not specifically targeted to geologic storage, ISO 31000 provides risk management principles and generic guidelines, which can be used in conjunction with CO2 storage risk management tools.
• Quintessa developed the open-access Generic CO2 Features, Events and Processes (FEP) Database, a tool that has been continually updated since around 2006 to support the assessment of long-term safety and performance of geologic storage projects. The Generic CO2 FEP Database provides a comprehensive knowledge base, consisting of descriptions of FEPs, explanations of their relevance, bibliographies and links to external websites (Quintessa 2016). These FEPs provide a starting point from which site operators may begin developing their own site-specific risk registers.
• The Canadian Standards Associate (CSA) published Z741-12, Geological Storage of Carbon Dioxide, which is intended to establish requirements and recommendations for CO2 storage (CSA 2012). The purpose of these requirements is to promote environmentally safe and permanent containment of CO2 in a way that minimizes potential adverse effects and risks to the environment and human health (CSA 2012). Section 5 of CSA provides a detailed list of risk management principles specific to geologic storage projects (CSA 2012).
• Numerous peer-reviewed journal articles specific to risk management for geologic storage projects have been published (e.g., (Damien 2006), (Condor 2011), (Pawar 2015). These publications provide lessons learned and allow potential CO2 storage operators to find common elements from other sites that they can incorporate into their own site-specific risk management practices.
• The National Risk Assessment Partnership (NRAP)—an initiative founded in 2003 within DOE’s Office of Fossil Energy and led by the National Energy Technology Laboratory (NETL)—has developed a suite of risk assessment tools and guidance documents designed to help site operators assess and manage potential risks (DOE-NETL NRAP 2016).
National Risk Assessment Partnership
The National Risk Assessment Partnership (NRAP) is a Department of Energy (DOE) initiative harnessing core capabilities developed across the national laboratory complex in the science-based prediction of engineered-natural systems and applying them to better quantify risk-related performance of geologic CO2 storage. The partnership is developing defensible, science-based tools and methodologies for quantifying the evolution of environmental risk through time amidst system uncertainty, for the most likely types of CO2 storage sites (e.g., saline aquifers, depleted oil and gas formations). These products are intended to be used by stakeholders to inform decision-making related to risk-based site selection, quantifying storage risk, strategic monitoring, and risk management—efforts which will help ensure safe and effective CO2 storage.
BEST PRACTICES: Risk Management and Simulation for Geologic Storage Projects 21
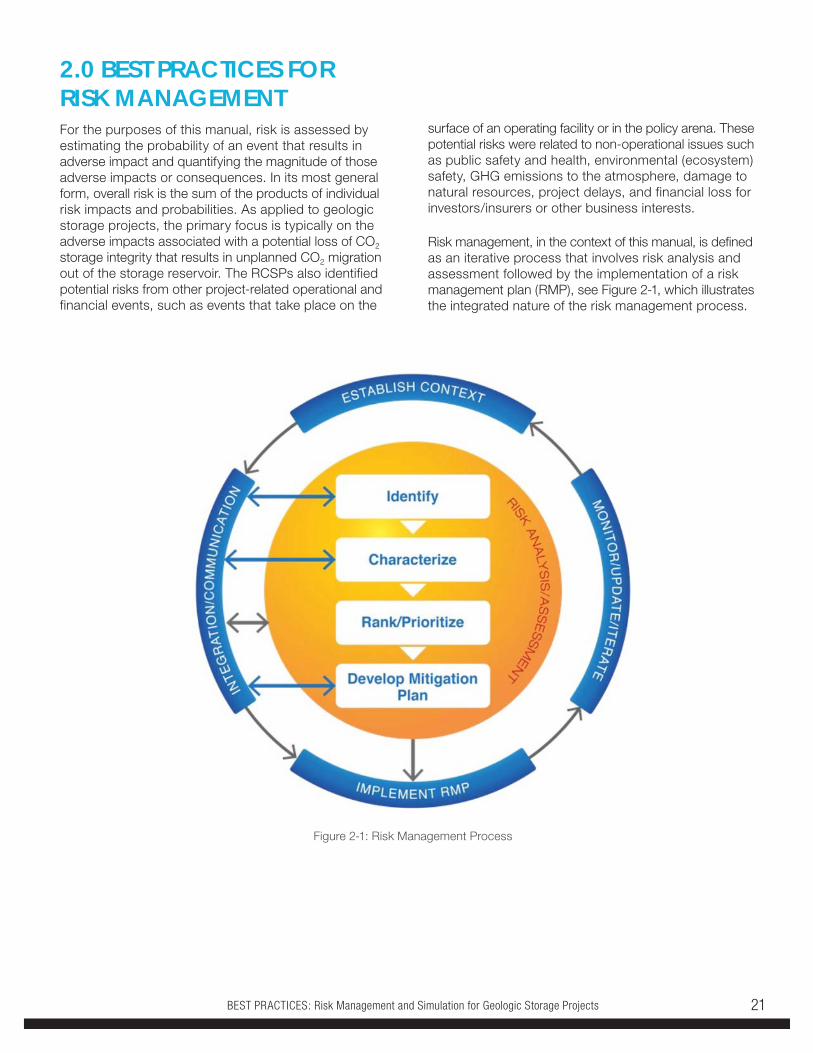
2.0 BEST PRACTICES FOR RISK MANAGEMENTFor the purposes of this manual, risk is assessed by estimating the probability of an event that results in adverse impact and quantifying the magnitude of those adverse impacts or consequences. In its most general form, overall risk is the sum of the products of individual risk impacts and probabilities. As applied to geologic storage projects, the primary focus is typically on the adverse impacts associated with a potential loss of CO2 storage integrity that results in unplanned CO2 migration out of the storage reservoir. The RCSPs also identified potential risks from other project-related operational and financial events, such as events that take place on the
surface of an operating facility or in the policy arena. These potential risks were related to non-operational issues such as public safety and health, environmental (ecosystem) safety, GHG emissions to the atmosphere, damage to natural resources, project delays, and financial loss for investors/insurers or other business interests.
Risk management, in the context of this manual, is defined as an iterative process that involves risk analysis and assessment followed by the implementation of a risk management plan (RMP), see Figure 2-1, which illustrates the integrated nature of the risk management process.
Figure 2-1: Risk Management Process
BEST PRACTICES: Risk Management and Simulation for Geologic Storage Projects22
Through regular and routine risk communication and integration, feedback loops exist permitting the exchange of information between the individual steps of the process. A major feedback loop also follows the implementation of the RMP, as monitoring data are gathered and dictate a reevaluation of the risk analysis and risk assessment. When applied to geologic storage, a comprehensive risk management program enables projects to proactively plan and implement strategies to minimize the risks from project inception through long-term, post-operational monitoring and final site closure. Due to the long-term nature of geologic CO2 projects, risk management is most effective when applied iteratively over time to permit the evaluation of potential risks that may evolve from changing site conditions, changing site plans or designs, and evolving operational activities. This manual focuses on several integrated elements in risk management as depicted in Figure 2-1, including:
• Establishing the context for risk management. Risk management can be applied to the project as a whole to develop a “big picture” of overall risk and an overall risk management strategy. And, it can be applied to smaller, more discrete project activities, such as those that take place at each major step, phase, or milestone throughout the life of the project. This discrete use can inform near-term or contained RMPs that contribute to overall risk management. This is discussed in Section 2.1.
• Risk identification, sometimes referred to as risk source assessment, involves reviewing the site-specific details of a project to enumerate a comprehensive list of potential sources of risk. As discussed in Section 2.2 several tools and approaches are available to assist in developing a comprehensive set of site-specific risks for individual geologic storage projects.
• Risk characterization, sometimes referred to as risk assessment or risk analysis, consists of several components. These include: (1) determining the probability that a risk event will occur (i.e., exposure assessment); (2) determining the magnitude of loss from an individual risk event (i.e., effects assessment); and (3) integrating the exposure-effect data to produce qualitative, semi-quantitative, or quantitative measures of the risk (i.e., risk characterization). At the conclusion of this step, a variety of social, political, and techno-economic factors can be used to prioritize or rank the project risks. As discussed in Section 2.3, several tools and approaches are available to assist in characterizing the site-specific risks for individual geologic storage projects.
• The RMP uses input from the risk identification, characterization, and ranking to develop plans to monitor, control and/or mitigate risks. As discussed in Section 2.4 tools and approaches are available to assist in developing site-specific risk mitigation plans.
• Implementation of RMPs as discussed in Section 2.5 implementation of risk management entails communication and coordination.
• The periodic updating, communication, and integration of risk management with the overall project. Section 2.6 discusses approaches to these steps.
The six overarching best practices for a comprehensive risk management program are drawn from this process and include:
1. Integrate risk management into project design and implementation
2. Identify site-specific project risks
3. Characterize and rank the impact and probability of project risks
4. Develop RMPs
5. Implement the RMP
6. Complete periodic updates to the risk analysis
An array of tools and options are available to tailor an RMP to the decisions at hand. It can be used to evaluate activity-specific decisions or expanded to consider whole projects. No single method for risk analysis is appropriate for all purposes. A main purpose of this manual is to share the experience of the RCSPs and provide insights to help those involved in geologic storage projects determine their risk analysis / risk assessment needs and to identify the approaches and tools available to address them. As will be discussed in the upcoming sections, project developers will need to consider time, cost, and the certainty and reliability of the available data in making these determinations and may find that they will need to use multiple methods and tools to supplement decisions at different stages of the process.
2.0 BEST PRACTICES FOR RISK MANAGEMENT
BEST PRACTICES: Risk Management and Simulation for Geologic Storage Projects 23
2.0 BEST PRACTICES FOR RISK MANAGEMENT
2.1 ESTABLISH THE CONTEXT FOR RISK MANAGEMENT The first best practice calls for establishing the context for risk management. This includes identifying the internal and external factors that could impact project risk. Internal factors include the project team, contractors, internal stakeholders, such as corporate management, as well as factors like organizational culture and capabilities. External factors include external stakeholders, such as regulators and the public, as well as trends and circumstances in the policy, regulatory, environmental, and economic setting. External factors include the perceptions, events, and other factors that could impact the project.
Risk management can be applied to the project as a whole to develop a high-level overview of the overall project risk. Alternatively, it can be applied to smaller, more discrete project tasks or activities, such as those that take place at each major step, phase, or milestone throughout the life of the project. Applying risk management at the sub-level of the project can inform near-term or focused RMPs that ultimately contribute to an overall RMP for the site. As a first step, it is important to understand the context for risk management within the project and to consider how it will be integrated into project design and implementation.
2.2 IDENTIFY POTENTIAL PROJECT RISKSThe effectiveness of a risk analysis will rely, in part, on the comprehensiveness of the risk identification step. Therefore, the second best practice calls for a structured review of potential project risks and their features, sometimes referred to as risk source assessment.
In general, risk identification uses a methodical approach to review a geologic storage project in its entirety, often starting with independent assessments of its individual component parts, to identify potential sources of risk. In practice, several methods may be used to identify risk. For CO2 storage, the most common approach identifies the project specific features, events and processes (FEPs), alone or in combination, to develop a wide range of scenarios for the project (Yamaguchia 2013). A second method utilizes screening criteria to identify key risks. A third method uses historic operating data from similar geologic settings to identify risks. Other methods might draw on expertise gained from risk identification in similar but different projects, for example environmental remediation. Two key differences among the approaches are the resource intensity required to
Case Study 2.3 shows how the Plains CO2 Reduction (PCOR) Partnership uses an adaptive management approach to integrate technical activities to manage risk.
► See page 47
Case Study 2.2 from the Southeast Regional Carbon Sequestration Partnership (SECARB) references the two guidelines they used for risk identification: (1) Citronelle Integrated Test – DNV-RP-J201: Qualification Procedures for CO2 Capture Technology 2010; and (2) CO2QUALSTORE – Guideline for Selection and Qualification of Sites and Projects for Geological Storage of CO2 (Aarnes et al., 2010).
► See page 44
Case Study 2.1 from the Big Sky Regional Carbon Sequestration Partnership (BSCSP) project illustrates the importance of fully evaluating the social context in which a CCS project will be implemented, including developing an understanding of potential “hidden” risks that may be associated with stakeholder concerns and perceptions.
► See page 42
BEST PRACTICES: Risk Management and Simulation for Geologic Storage Projects24
complete the review and the level of pre-existing background understanding of the project site. FEP analysis is the broadest and therefore most resource-intensive approach; the other approaches use knowledge of the site to focus on key areas of risk. This section presents information and strategies to assist in structuring a risk identification effort for an individual geologic storage project. While there is an emphasis on the FEP approach, a discussion at the end of the segment also provides insights for designing a risk identification process appropriate for the needs of a specific CO2 storage project.
2.2.1 USING FEPS TO IDENTIFY SOURCES OF PROJECT RISKIn the case of geologic storage projects, the three elements of a FEP are understood in the following terms:
• Features—physical characteristics and elements of a site, such as wellbores, subsurface faults, surface equipment, and contractors.
• Events—relatively short-term or discrete events that will or may happen, such as well drilling, injection pressure increases, pipeline ruptures, earthquakes.
• Processes—relatively long-term or ongoing events or actions, such as gravity-driven CO2 movement, regulatory compliance, or residual saturation trapping of CO2.
A common approach for identifying the sources of project risk entails identifying: (1) important project FEPs and (2) the scenarios through which individual or combinations of FEPs could result in adverse impacts to the project. As previously noted, one adverse impact to CO2 storage is the unplanned CO2 migration from the storage reservoir. Other adverse impacts of potential concern are scenarios that result in harm to humans or the environment, the accumulation of additional project costs, or project delays. In simple terms, the sources of project risk are events
that could go wrong, which could negatively impact the successful implementation of the project.
Ideally, risk analysis points to the key risks and facilitates their mitigation should they reach unacceptable levels. However, storage projects are complex, have multiple phases, and take place over long periods of time. As a result, some risks will change over time, others will be contingent on earlier decisions/outcomes, and some will be discrete but may not be a factor until later in the project life. FEP analysis provides a structured approach for the systematic review of a CO2 storage project, but it is still a complex process and typically expert input is utilized.
2.2.1.1 DETERMINING RELEVANT FEPSA first step is to identify the relevant FEPs for the geologic storage project. A project team may wish to use applicable FEPs listed in existing databases in addition to project-specific FEPs that address unique project conditions. An extensive database of nearly 200 potential FEPs for CO2 storage was assembled and published by Quintessa. This database is publicly accessible at the following website: https://www.quintessa.org/co2fepdb/v2.0.0/PHP/frames.php.
The Quintessa FEP database currently includes eight broad categories of FEPs and includes the following factors for consideration (Quintessa 2014):
• Assessment basis
• External factors
• CO2 storage properties, interactions, and transport
• Geosphere
• Boreholes
• Near-surface environment
• Impacts
The Quintessa system’s generic database of CO2 storage FEPs represents a good starting place but must be carefully considered. Because the database is generic, it can be applied to all types of geologic settings and thus will often lead to more considerations than will be relevant for any single project. While the Quintessa database includes some FEPs associated with the injection phase, it largely focuses
2.0 BEST PRACTICES FOR RISK MANAGEMENT
Case Study 2.4 from the PCOR Partnership shows how they solicited expert opinion to identify potential risks.
► See page 48
BEST PRACTICES: Risk Management and Simulation for Geologic Storage Projects 25
2.0 BEST PRACTICES FOR RISK MANAGEMENT
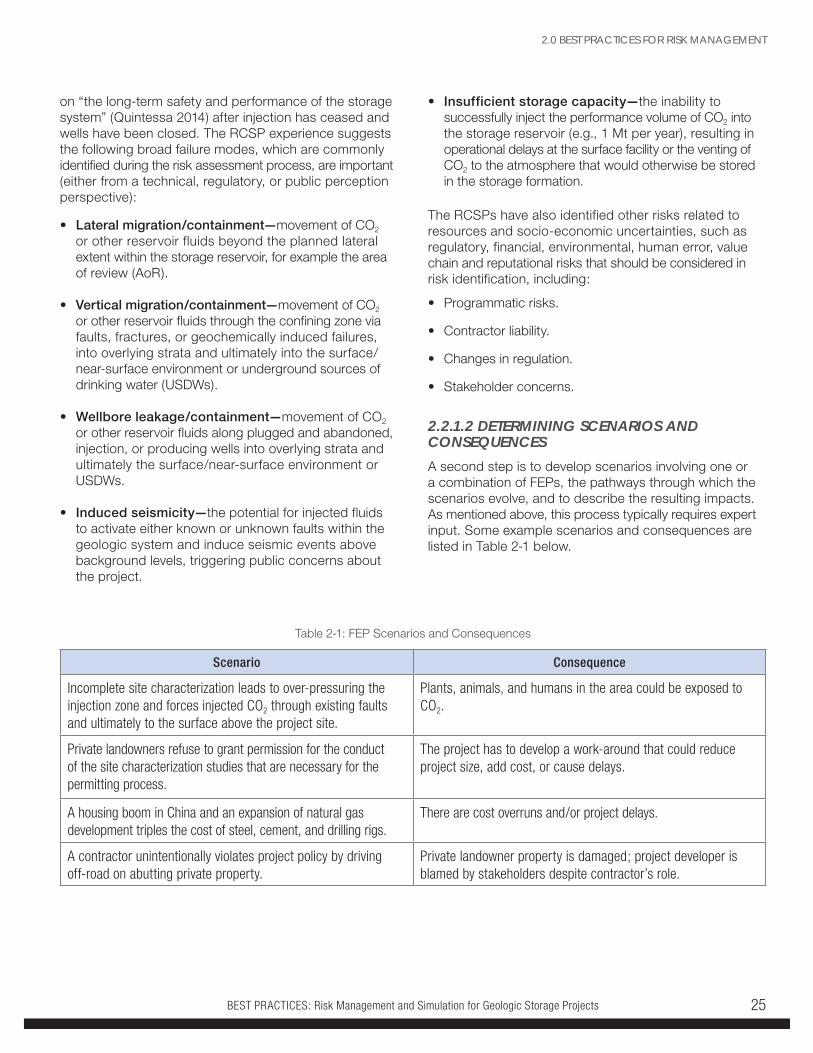
on “the long-term safety and performance of the storage system” (Quintessa 2014) after injection has ceased and wells have been closed. The RCSP experience suggests the following broad failure modes, which are commonly identified during the risk assessment process, are important (either from a technical, regulatory, or public perception perspective):
• Lateral migration/containment—movement of CO2 or other reservoir fluids beyond the planned lateral extent within the storage reservoir, for example the area of review (AoR).
• Vertical migration/containment—movement of CO2 or other reservoir fluids through the confining zone via faults, fractures, or geochemically induced failures, into overlying strata and ultimately into the surface/near-surface environment or underground sources of drinking water (USDWs).
• Wellbore leakage/containment—movement of CO2 or other reservoir fluids along plugged and abandoned, injection, or producing wells into overlying strata and ultimately the surface/near-surface environment or USDWs.
• Induced seismicity—the potential for injected fluids to activate either known or unknown faults within the geologic system and induce seismic events above background levels, triggering public concerns about the project.
Table 2-1: FEP Scenarios and Consequences
Scenario Consequence
Incomplete site characterization leads to over-pressuring the injection zone and forces injected CO2 through existing faults and ultimately to the surface above the project site.
Plants, animals, and humans in the area could be exposed to CO2.
Private landowners refuse to grant permission for the conduct of the site characterization studies that are necessary for the permitting process.
The project has to develop a work-around that could reduce project size, add cost, or cause delays.
A housing boom in China and an expansion of natural gas development triples the cost of steel, cement, and drilling rigs.
There are cost overruns and/or project delays.
A contractor unintentionally violates project policy by driving off-road on abutting private property.
Private landowner property is damaged; project developer is blamed by stakeholders despite contractor’s role.
• Insufficient storage capacity—the inability to successfully inject the performance volume of CO2 into the storage reservoir (e.g., 1 Mt per year), resulting in operational delays at the surface facility or the venting of CO2 to the atmosphere that would otherwise be stored in the storage formation.
The RCSPs have also identified other risks related to resources and socio-economic uncertainties, such as regulatory, financial, environmental, human error, value chain and reputational risks that should be considered in risk identification, including:
• Programmatic risks.
• Contractor liability.
• Changes in regulation.
• Stakeholder concerns.
2.2.1.2 DETERMINING SCENARIOS AND CONSEQUENCESA second step is to develop scenarios involving one or a combination of FEPs, the pathways through which the scenarios evolve, and to describe the resulting impacts. As mentioned above, this process typically requires expert input. Some example scenarios and consequences are listed in Table 2-1 below.
BEST PRACTICES: Risk Management and Simulation for Geologic Storage Projects26
For geologic storage, some consequences of critical concern include brine contamination of USDWs, unintended migration of CO2 into adjacent hydrocarbon resources or other infringement on adjacent mineral rights, and long-term CO2 seepage into the atmosphere. Other consequences of critical concern include severe cost overruns or delays, induced seismicity, and harm to humans or the environment.
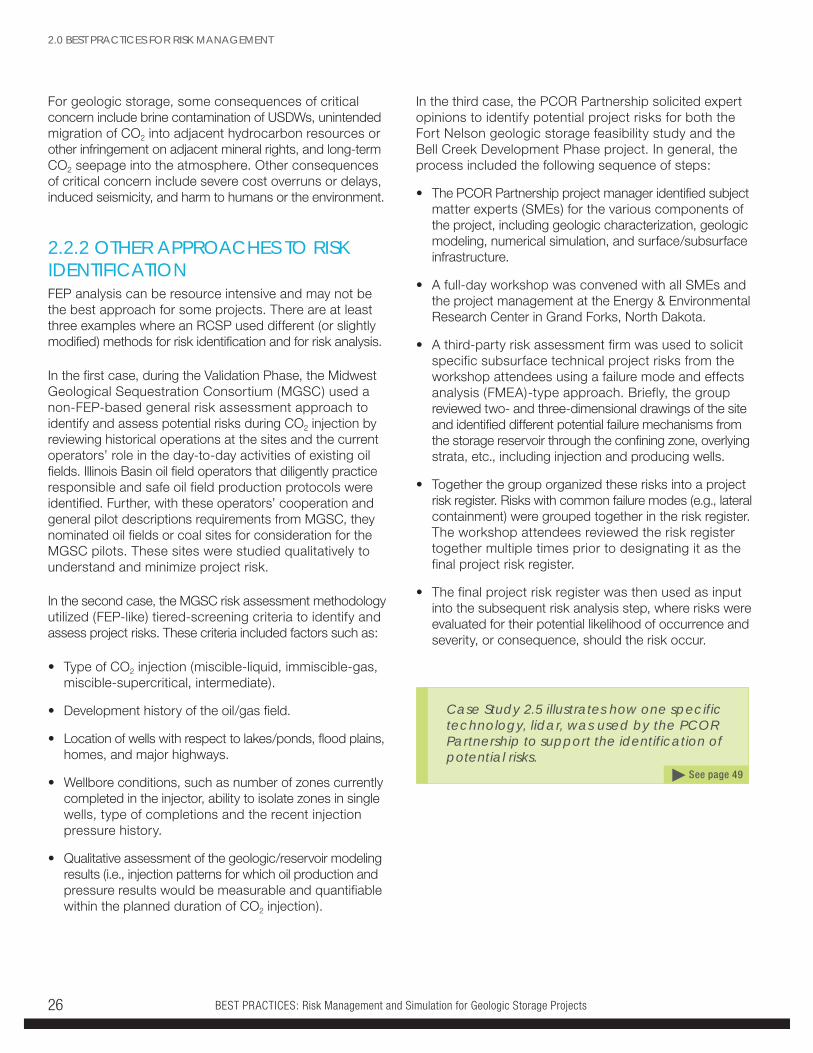
2.2.2 OTHER APPROACHES TO RISK IDENTIFICATIONFEP analysis can be resource intensive and may not be the best approach for some projects. There are at least three examples where an RCSP used different (or slightly modified) methods for risk identification and for risk analysis.
In the first case, during the Validation Phase, the Midwest Geological Sequestration Consortium (MGSC) used a non-FEP-based general risk assessment approach to identify and assess potential risks during CO2 injection by reviewing historical operations at the sites and the current operators’ role in the day-to-day activities of existing oil fields. Illinois Basin oil field operators that diligently practice responsible and safe oil field production protocols were identified. Further, with these operators’ cooperation and general pilot descriptions requirements from MGSC, they nominated oil fields or coal sites for consideration for the MGSC pilots. These sites were studied qualitatively to understand and minimize project risk.
In the second case, the MGSC risk assessment methodology utilized (FEP-like) tiered-screening criteria to identify and assess project risks. These criteria included factors such as:
• Type of CO2 injection (miscible-liquid, immiscible-gas, miscible-supercritical, intermediate).
• Development history of the oil/gas field.
• Location of wells with respect to lakes/ponds, flood plains, homes, and major highways.
• Wellbore conditions, such as number of zones currently completed in the injector, ability to isolate zones in single wells, type of completions and the recent injection pressure history.
• Qualitative assessment of the geologic/reservoir modeling results (i.e., injection patterns for which oil production and pressure results would be measurable and quantifiable within the planned duration of CO2 injection).
In the third case, the PCOR Partnership solicited expert opinions to identify potential project risks for both the Fort Nelson geologic storage feasibility study and the Bell Creek Development Phase project. In general, the process included the following sequence of steps:
• The PCOR Partnership project manager identified subject matter experts (SMEs) for the various components of the project, including geologic characterization, geologic modeling, numerical simulation, and surface/subsurface infrastructure.
• A full-day workshop was convened with all SMEs and the project management at the Energy & Environmental Research Center in Grand Forks, North Dakota.
• A third-party risk assessment firm was used to solicit specific subsurface technical project risks from the workshop attendees using a failure mode and effects analysis (FMEA)-type approach. Briefly, the group reviewed two- and three-dimensional drawings of the site and identified different potential failure mechanisms from the storage reservoir through the confining zone, overlying strata, etc., including injection and producing wells.
• Together the group organized these risks into a project risk register. Risks with common failure modes (e.g., lateral containment) were grouped together in the risk register. The workshop attendees reviewed the risk register together multiple times prior to designating it as the final project risk register.
• The final project risk register was then used as input into the subsequent risk analysis step, where risks were evaluated for their potential likelihood of occurrence and severity, or consequence, should the risk occur.
2.0 BEST PRACTICES FOR RISK MANAGEMENT
Case Study 2.5 illustrates how one specific technology, lidar, was used by the PCOR Partnership to support the identification of potential risks.
► See page 49
BEST PRACTICES: Risk Management and Simulation for Geologic Storage Projects 27
2.0 BEST PRACTICES FOR RISK MANAGEMENT
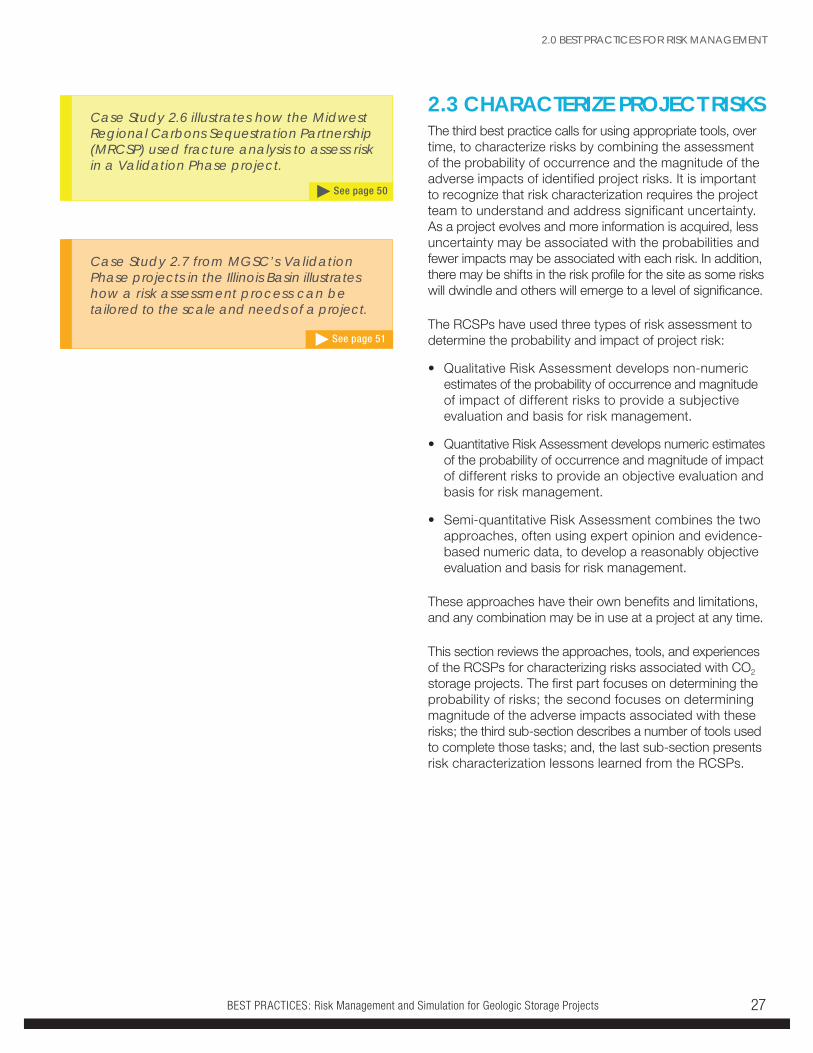
Case Study 2.6 illustrates how the Midwest Regional Carbons Sequestration Partnership (MRCSP) used fracture analysis to assess risk in a Validation Phase project.
► See page 50
2.3 CHARACTERIZE PROJECT RISKSThe third best practice calls for using appropriate tools, over time, to characterize risks by combining the assessment of the probability of occurrence and the magnitude of the adverse impacts of identified project risks. It is important to recognize that risk characterization requires the project team to understand and address significant uncertainty. As a project evolves and more information is acquired, less uncertainty may be associated with the probabilities and fewer impacts may be associated with each risk. In addition, there may be shifts in the risk profile for the site as some risks will dwindle and others will emerge to a level of significance.
The RCSPs have used three types of risk assessment to determine the probability and impact of project risk:
• Qualitative Risk Assessment develops non-numeric estimates of the probability of occurrence and magnitude of impact of different risks to provide a subjective evaluation and basis for risk management.
• Quantitative Risk Assessment develops numeric estimates of the probability of occurrence and magnitude of impact of different risks to provide an objective evaluation and basis for risk management.
• Semi-quantitative Risk Assessment combines the two approaches, often using expert opinion and evidence-based numeric data, to develop a reasonably objective evaluation and basis for risk management.
These approaches have their own benefits and limitations, and any combination may be in use at a project at any time.
This section reviews the approaches, tools, and experiences of the RCSPs for characterizing risks associated with CO2 storage projects. The first part focuses on determining the probability of risks; the second focuses on determining magnitude of the adverse impacts associated with these risks; the third sub-section describes a number of tools used to complete those tasks; and, the last sub-section presents risk characterization lessons learned from the RCSPs.
Case Study 2.7 from MGSC’s Validation Phase projects in the Illinois Basin illustrates how a risk assessment process can be tailored to the scale and needs of a project.
► See page 51
BEST PRACTICES: Risk Management and Simulation for Geologic Storage Projects28
2.0 PROJECT AND SITE DEVELOPMENT PLANNING
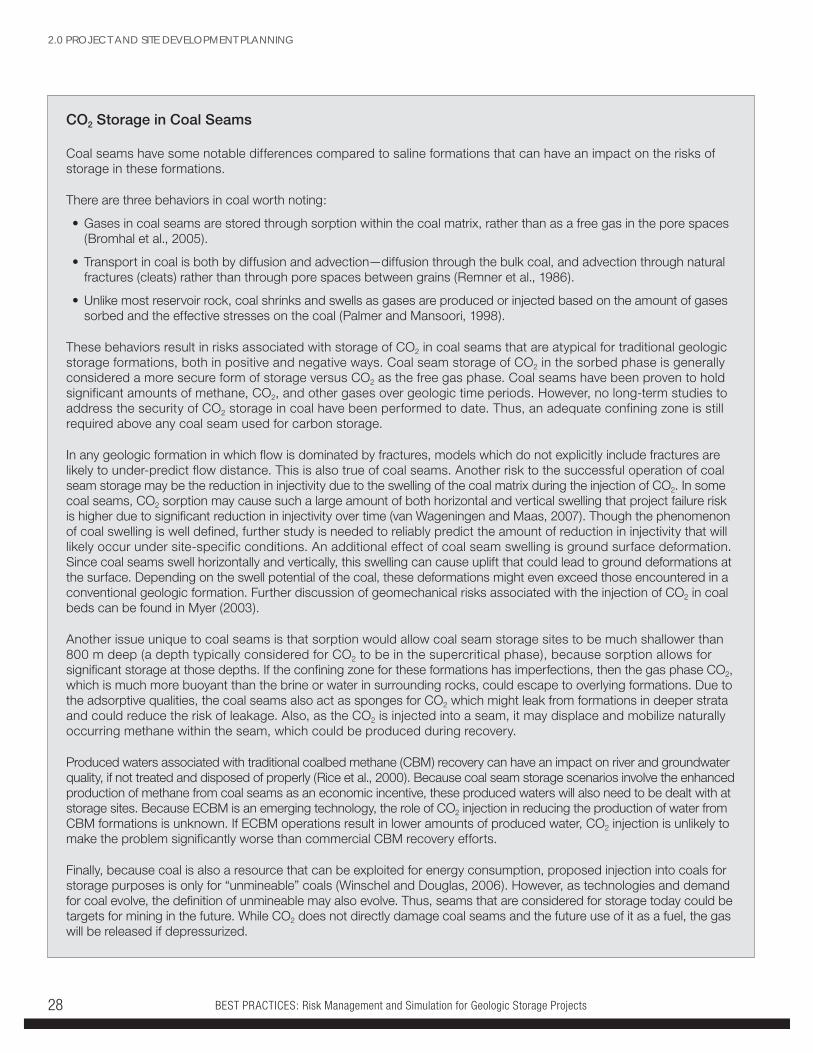
CO2 Storage in Coal Seams
Coal seams have some notable differences compared to saline formations that can have an impact on the risks of storage in these formations.
There are three behaviors in coal worth noting:
• Gases in coal seams are stored through sorption within the coal matrix, rather than as a free gas in the pore spaces (Bromhal et al., 2005).
• Transport in coal is both by diffusion and advection—diffusion through the bulk coal, and advection through natural fractures (cleats) rather than through pore spaces between grains (Remner et al., 1986).
• Unlike most reservoir rock, coal shrinks and swells as gases are produced or injected based on the amount of gases sorbed and the effective stresses on the coal (Palmer and Mansoori, 1998).
These behaviors result in risks associated with storage of CO2 in coal seams that are atypical for traditional geologic storage formations, both in positive and negative ways. Coal seam storage of CO2 in the sorbed phase is generally considered a more secure form of storage versus CO2 as the free gas phase. Coal seams have been proven to hold significant amounts of methane, CO2, and other gases over geologic time periods. However, no long-term studies to address the security of CO2 storage in coal have been performed to date. Thus, an adequate confining zone is still required above any coal seam used for carbon storage.
In any geologic formation in which flow is dominated by fractures, models which do not explicitly include fractures are likely to under-predict flow distance. This is also true of coal seams. Another risk to the successful operation of coal seam storage may be the reduction in injectivity due to the swelling of the coal matrix during the injection of CO2. In some coal seams, CO2 sorption may cause such a large amount of both horizontal and vertical swelling that project failure risk is higher due to significant reduction in injectivity over time (van Wageningen and Maas, 2007). Though the phenomenon of coal swelling is well defined, further study is needed to reliably predict the amount of reduction in injectivity that will likely occur under site-specific conditions. An additional effect of coal seam swelling is ground surface deformation. Since coal seams swell horizontally and vertically, this swelling can cause uplift that could lead to ground deformations at the surface. Depending on the swell potential of the coal, these deformations might even exceed those encountered in a conventional geologic formation. Further discussion of geomechanical risks associated with the injection of CO2 in coal beds can be found in Myer (2003).
Another issue unique to coal seams is that sorption would allow coal seam storage sites to be much shallower than 800 m deep (a depth typically considered for CO2 to be in the supercritical phase), because sorption allows for significant storage at those depths. If the confining zone for these formations has imperfections, then the gas phase CO2, which is much more buoyant than the brine or water in surrounding rocks, could escape to overlying formations. Due to the adsorptive qualities, the coal seams also act as sponges for CO2 which might leak from formations in deeper strata and could reduce the risk of leakage. Also, as the CO2 is injected into a seam, it may displace and mobilize naturally occurring methane within the seam, which could be produced during recovery.
Produced waters associated with traditional coalbed methane (CBM) recovery can have an impact on river and groundwater quality, if not treated and disposed of properly (Rice et al., 2000). Because coal seam storage scenarios involve the enhanced production of methane from coal seams as an economic incentive, these produced waters will also need to be dealt with at storage sites. Because ECBM is an emerging technology, the role of CO2 injection in reducing the production of water from CBM formations is unknown. If ECBM operations result in lower amounts of produced water, CO2 injection is unlikely to make the problem significantly worse than commercial CBM recovery efforts.
Finally, because coal is also a resource that can be exploited for energy consumption, proposed injection into coals for storage purposes is only for “unmineable” coals (Winschel and Douglas, 2006). However, as technologies and demand for coal evolve, the definition of unmineable may also evolve. Thus, seams that are considered for storage today could be targets for mining in the future. While CO2 does not directly damage coal seams and the future use of it as a fuel, the gas will be released if depressurized.
BEST PRACTICES: Risk Management and Simulation for Geologic Storage Projects 29
2.3.1 DETERMINING PROBABILITY OF RISK OCCURRENCE AND THE MAGNITUDE OR RISK IMPACTSDuring this process, the probability is estimated for an event occurring that will give rise to a risk. The first stage is often a high-level qualitative or semi-quantitative prioritization of the risks, where risks are categorized and ranked in terms of likelihood and magnitude of consequence. From this preliminary analysis, risks that require immediate responses can be identified and addressed. The ranking helps to identify high-priority risks and inform plans for mitigating or controlling them; it also facilitates the placement of lower-priority risks on a watch list. Other risks, with mid- or unknown-priorities, may undergo further analysis or investigation. As more information is obtained from site characterization, modeling, monitoring, and project operations, risk priorities should be updated. Later stages may also include model simulations of varying detail to assess the probabilities and impacts of selected scenarios. These simulations may rely on different model types including the following, which are listed in order of increasing detail and complexity:
• Conceptual models of the storage system’s individual aspects
• Process-level models to simulate the behavior of various system compartments
• System-level models to review impacts across the entire system in which the storage site is located.
The probability of occurrence of a particular risk can be either qualitatively or quantitatively determined. And in many cases, these efforts are combined into a semi-quantitative assessment.
In addition to probability of occurrence, the other component to risk characterization is an estimation of the impact magnitude. Section 2.3.2 briefly describes how qualitative, quantitative, and semi-quantitative tools are used to assess magnitude and provides some illustrative examples of magnitude assessments.
2.3.2 ASSESSMENT TOOLSThe following types of tools can be used to determine the probability and magnitude of a given risk during the risk analysis process.
2.3.2.1 QUALITATIVE TOOLSQualitative risk assessment tools are often used to assess fast-paced project activities such as infrastructure construction or when working with subcontractors or partners who would otherwise need extensive training to effectively participate in a quantitative risk analysis program. Qualitative risk analyses identify potential risks and treatments to reduce risk but do not calculate a numeric score on the probability or severity of a given risk or scenario. Rather, qualitative risk analysis relies on past experience and expertise to provide an informed opinion on what risk factors pose the greatest risk to a project considering compliance with health, safety, and environment (HSE) requirements. Qualitative tools may include verbal or written evaluations of immediate or emerging HSE risks during daily tailgate safety meetings for onsite crews and regularly scheduled management team calls. The evaluation is based on the technical expertise and experience of the project leads, partners, and subcontractors as well as previously identified risks and treatments that may be catalogued in qualitative risk analysis database tools or documents.
2.3.2.2 QUANTITATIVE TOOLSQuantitative risk assessment tools are often used to assess big-picture, long-term project risks. As defined in Section 1.0, risk is a product of the probability of its occurrence and the severity of the resulting impacts. The purpose of a quantitative risk assessment is to numerically quantify the probability of event occurrences leading to risks and their impacts. These scores can be used to rank FEPs. They can also be used to track the probability of occurrence and impact over time to assess whether risk mitigation measures are required, and if so, whether or not they are effective after they are applied.
Until relatively recently, the application of quantitative risk assessment tools was focused on generalized or generic site performance. However, recent advances in quantitative risk assessment tools and workflows have opened up the possibility of using them to consider more site-specific operational scenarios. For example, DOE’s National Risk
2.0 BEST PRACTICES FOR RISK MANAGEMENT
BEST PRACTICES: Risk Management and Simulation for Geologic Storage Projects30
Assessment Partnership has developed, and released for beta testing, a set of simulation tools for use in evaluating critical behavior of several parts of the carbon storage complex containment system (e.g., reservoirs, seals, wells, and aquifers), as they relate to two major types of environmental risks: potential leakage and induced seismicity.
At present, that toolset consists of the following tools:
• NRAP Integrated Assessment Model—Carbon Storage (NRAP-IAM-CS) simulates long-term behavior of the full carbon storage system (from reservoir to receptor), generates risk profiles, quantitatively estimates storage permanence, and identifies key drivers of risk.
• Reservoir Evaluation and Visualization (REV) Tool generates CO2 plume size and pressure differential (an important indicator for potential unwanted fluid migration from the storage reservoir) over time and visualizes probable reservoir behavior.
• Wellbore Leakage Analysis Tool (WLAT) evaluates existing wells for leakage potential and explores leakage response options based on the characteristics of the well.
• Natural Seal ROM (NSealR) evaluates potential breaches in well seals and their impact on migration of fluids (CO2 or brine) outside of the primary storage formation.
• Aquifer Impact Model (AIM) rapidly estimates volumes of an aquifer impacted if a CO2 or brine leak occurs.
• Design for Risk Evaluation and Monitoring (DREAM) evaluates and selects optimal monitoring designs for long-term CO2 storage (prototype model).
• Short Term Seismic Forecasting (STSF) forecasts the likelihood that seismic events will occur and how often, over the short term, in response to active CO2 injection.
Going forward, NRAP will demonstrate applicability of these tools for demonstration sites, and using site-specific information to validate predictive performance of those tools. Once demonstrated and validated, such quantitative risk assessment tools could represent a significant resource to develop information useful in full-system risk analysis.
2.3.2.3 SEMI-QUANTITATIVE TOOLS
Semi-quantitative risk assessment tools typically utilize qualitative methods to assign estimates of probability and/or consequence (i.e., high, medium, low probability and/ or consequence), and then use quantitative tools to rank and evaluate them in more detail. The RCSPs found the following three examples:
• One RCSP used expert-panel inputs to determine the probability of occurrence of certain risks. These probabilities were then used as the inputs for model simulations to develop consequence and risk assessment calculations, using a risk-matrix approach.
• One RCSP used a risk-transfer matrix approach to calculate consequences, such as the severity of CO2 leaks to the surface and various shallow receptors (USDW and other hydrocarbon mineral resources). The probability of these consequences were subsequently assigned by various internal stakeholders and validated by an expert panel.
• Schlumberger’s CarbonWorkFlow process establishes a basis for allocating resources for risk reduction and provides a structure to document and track risk reductions using a modified FEP analysis.
2.0 PROJECT AND SITE DEVELOPMENT PLANNING
Case Study 2.2 from SECARB’s Citronelle Project provides a detailed example of the use of semi-qualitative approaches in developing a risk management plan that incorporates expert opinion and evidence-based numeric data, to arrive at a reasonably objective evaluation and basis for risk management.
► See page 44
Case Study 2.8 from MGSC’s IBDP shows how they used CarbonWorkflow™ approach to assess project risk over the course of implementation.
► See page 52
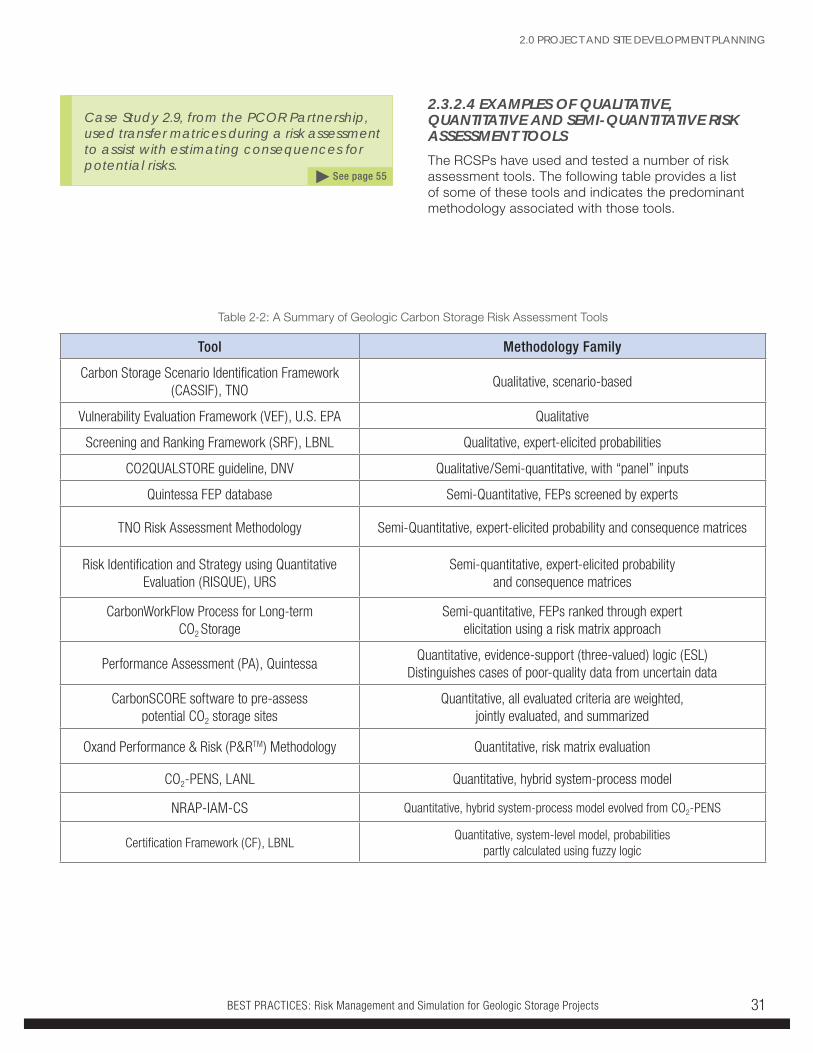
BEST PRACTICES: Risk Management and Simulation for Geologic Storage Projects 31
2.3.2.4 EXAMPLES OF QUALITATIVE, QUANTITATIVE AND SEMI-QUANTITATIVE RISK ASSESSMENT TOOLSThe RCSPs have used and tested a number of risk assessment tools. The following table provides a list of some of these tools and indicates the predominant methodology associated with those tools.
2.0 PROJECT AND SITE DEVELOPMENT PLANNING
Case Study 2.9, from the PCOR Partnership, used transfer matrices during a risk assessment to assist with estimating consequences for potential risks.
► See page 55
Table 2-2: A Summary of Geologic Carbon Storage Risk Assessment Tools
Tool Methodology Family
Carbon Storage Scenario Identification Framework (CASSIF), TNO
Qualitative, scenario-based
Vulnerability Evaluation Framework (VEF), U.S. EPA Qualitative
Screening and Ranking Framework (SRF), LBNL Qualitative, expert-elicited probabilities
CO2QUALSTORE guideline, DNV Qualitative/Semi-quantitative, with “panel” inputs
Quintessa FEP database Semi-Quantitative, FEPs screened by experts
TNO Risk Assessment Methodology Semi-Quantitative, expert-elicited probability and consequence matrices
Risk Identification and Strategy using Quantitative Evaluation (RISQUE), URS
Semi-quantitative, expert-elicited probability and consequence matrices
CarbonWorkFlow Process for Long-term CO2 Storage
Semi-quantitative, FEPs ranked through expert elicitation using a risk matrix approach
Performance Assessment (PA), QuintessaQuantitative, evidence-support (three-valued) logic (ESL)
Distinguishes cases of poor-quality data from uncertain data
CarbonSCORE software to pre-assess potential CO2 storage sites
Quantitative, all evaluated criteria are weighted, jointly evaluated, and summarized
Oxand Performance & Risk (P&RTM) Methodology Quantitative, risk matrix evaluation
CO2-PENS, LANL Quantitative, hybrid system-process model
NRAP-IAM-CS Quantitative, hybrid system-process model evolved from CO2-PENS
Certification Framework (CF), LBNLQuantitative, system-level model, probabilities
partly calculated using fuzzy logic
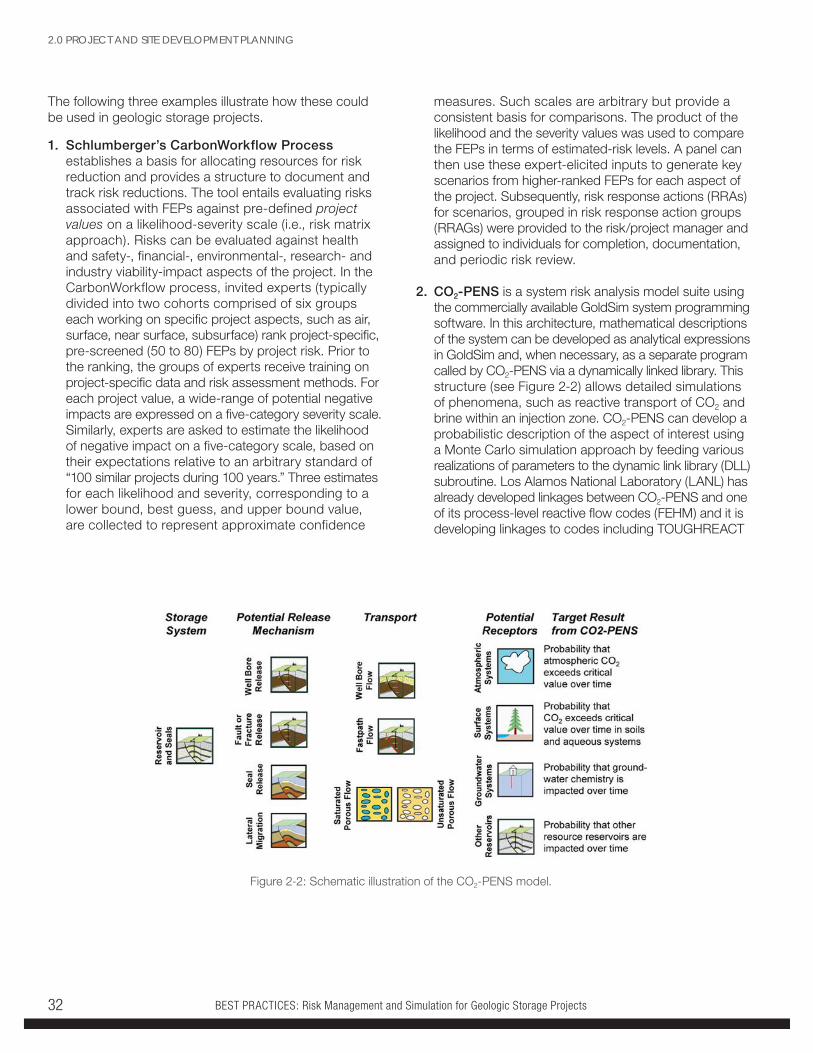
BEST PRACTICES: Risk Management and Simulation for Geologic Storage Projects32
The following three examples illustrate how these could be used in geologic storage projects.
1. Schlumberger’s CarbonWorkflow Process establishes a basis for allocating resources for risk reduction and provides a structure to document and track risk reductions. The tool entails evaluating risks associated with FEPs against pre-defined project values on a likelihood-severity scale (i.e., risk matrix approach). Risks can be evaluated against health and safety-, financial-, environmental-, research- and industry viability-impact aspects of the project. In the CarbonWorkflow process, invited experts (typically divided into two cohorts comprised of six groups each working on specific project aspects, such as air, surface, near surface, subsurface) rank project-specific, pre-screened (50 to 80) FEPs by project risk. Prior to the ranking, the groups of experts receive training on project-specific data and risk assessment methods. For each project value, a wide-range of potential negative impacts are expressed on a five-category severity scale. Similarly, experts are asked to estimate the likelihood of negative impact on a five-category scale, based on their expectations relative to an arbitrary standard of “100 similar projects during 100 years.” Three estimates for each likelihood and severity, corresponding to a lower bound, best guess, and upper bound value, are collected to represent approximate confidence
measures. Such scales are arbitrary but provide a consistent basis for comparisons. The product of the likelihood and the severity values was used to compare the FEPs in terms of estimated-risk levels. A panel can then use these expert-elicited inputs to generate key scenarios from higher-ranked FEPs for each aspect of the project. Subsequently, risk response actions (RRAs) for scenarios, grouped in risk response action groups (RRAGs) were provided to the risk/project manager and assigned to individuals for completion, documentation, and periodic risk review.
2. CO2-PENS is a system risk analysis model suite using the commercially available GoldSim system programming software. In this architecture, mathematical descriptions of the system can be developed as analytical expressions in GoldSim and, when necessary, as a separate program called by CO2-PENS via a dynamically linked library. This structure (see Figure 2-2) allows detailed simulations of phenomena, such as reactive transport of CO2 and brine within an injection zone. CO2-PENS can develop a probabilistic description of the aspect of interest using a Monte Carlo simulation approach by feeding various realizations of parameters to the dynamic link library (DLL) subroutine. Los Alamos National Laboratory (LANL) has already developed linkages between CO2-PENS and one of its process-level reactive flow codes (FEHM) and it is developing linkages to codes including TOUGHREACT
2.0 PROJECT AND SITE DEVELOPMENT PLANNING
Figure 2-2: Schematic illustration of the CO2-PENS model.
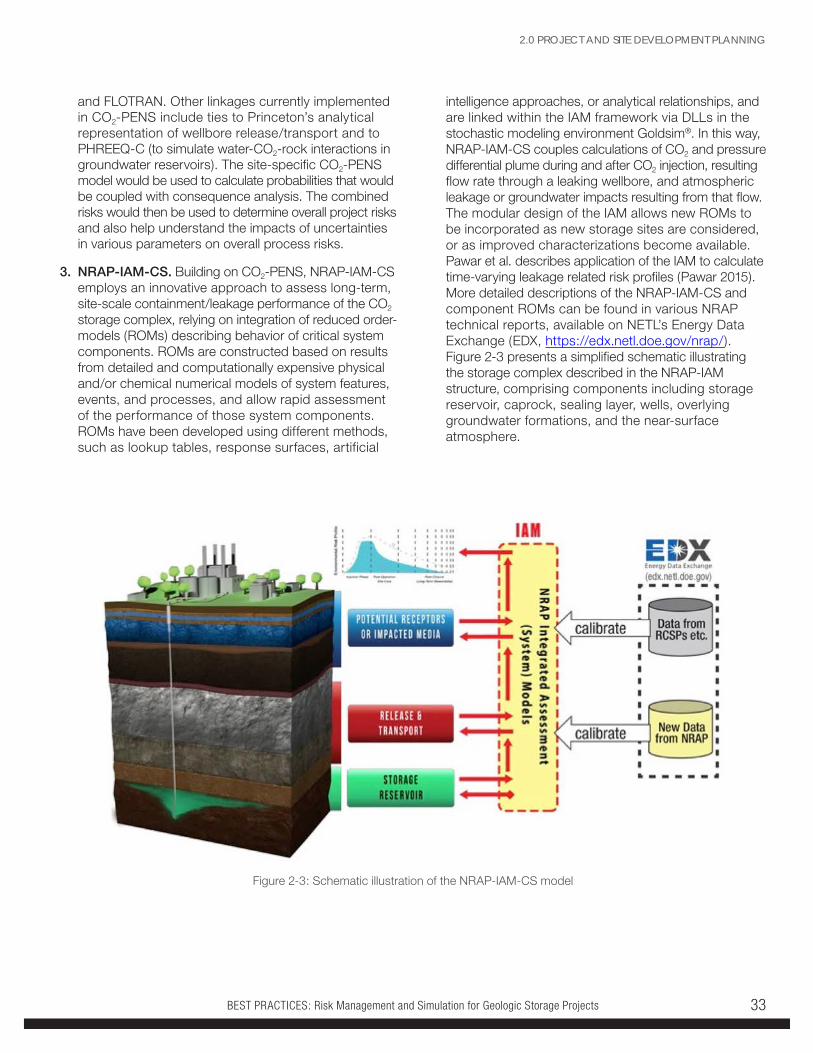
BEST PRACTICES: Risk Management and Simulation for Geologic Storage Projects 33
and FLOTRAN. Other linkages currently implemented in CO2-PENS include ties to Princeton’s analytical representation of wellbore release/transport and to PHREEQ-C (to simulate water-CO2-rock interactions in groundwater reservoirs). The site-specific CO2-PENS model would be used to calculate probabilities that would be coupled with consequence analysis. The combined risks would then be used to determine overall project risks and also help understand the impacts of uncertainties in various parameters on overall process risks.
3. NRAP-IAM-CS. Building on CO2-PENS, NRAP-IAM-CS employs an innovative approach to assess long-term, site-scale containment/leakage performance of the CO2 storage complex, relying on integration of reduced order-models (ROMs) describing behavior of critical system components. ROMs are constructed based on results from detailed and computationally expensive physical and/or chemical numerical models of system features, events, and processes, and allow rapid assessment of the performance of those system components. ROMs have been developed using different methods, such as lookup tables, response surfaces, artificial
intelligence approaches, or analytical relationships, and are linked within the IAM framework via DLLs in the stochastic modeling environment Goldsim®. In this way, NRAP-IAM-CS couples calculations of CO2 and pressure differential plume during and after CO2 injection, resulting flow rate through a leaking wellbore, and atmospheric leakage or groundwater impacts resulting from that flow. The modular design of the IAM allows new ROMs to be incorporated as new storage sites are considered, or as improved characterizations become available. Pawar et al. describes application of the IAM to calculate time-varying leakage related risk profiles (Pawar 2015). More detailed descriptions of the NRAP-IAM-CS and component ROMs can be found in various NRAP technical reports, available on NETL’s Energy Data Exchange (EDX, https://edx.netl.doe.gov/nrap/). Figure 2-3 presents a simplified schematic illustrating the storage complex described in the NRAP-IAM structure, comprising components including storage reservoir, caprock, sealing layer, wells, overlying groundwater formations, and the near-surface atmosphere.
2.0 PROJECT AND SITE DEVELOPMENT PLANNING
Figure 2-3: Schematic illustration of the NRAP-IAM-CS model
BEST PRACTICES: Risk Management and Simulation for Geologic Storage Projects34
2.3.3 RISK ANALYSISRisk analysis or risk evaluation entails ranking and prioritizing risks based on the assessment of probability (frequency) and magnitude (severity). Once the project team has quantified risk frequency and magnitude, even with a preliminary scoring system, these factors may be mapped onto a risk criticality grid (frequency × severity). At this early stage, the team would be able to identify high-frequency/high-severity events, which would automatically trigger additional evaluation. Conversely, low-frequency/low-severity events are less critical at this point in the process.
Once priority concerns and objectives are established, acceptability criteria should be defined for the priority categories. The more specific the criteria, the easier they are to use. The threshold for “unacceptable risk” is project- and
operator-specific, dependent upon a host of factors about impacts to health, safety, environment, cost, schedule, etc. The risk maps can then be compared against these initial thresholds. If one or more risks plot above these thresholds, then unacceptable risks have been identified. Over time, the thresholds for “unacceptable risks” can be revisited and, if necessary, a reassessment of the unacceptable risks can be completed. For example, the Southeast Regional Carbon Sequestration Partnership (SECARB), in conjunction with their risk consultant Det Norske Veritas (DNV), created a matrix of five consequences and five probabilities. The consequences ranged from “slight” to “severe” and used specific examples to illustrate each case for each element of concern. For example, the range of “cost” included “less than $10K” for slight and “more than $10M” for severe. The probabilities were labeled as “likelihood” and ranged from “remote” to “certain,” with qualitative definitions of the likelihoods.
2.0 PROJECT AND SITE DEVELOPMENT PLANNING
Storage in Oil and Gas Reservoirs
Oil and gas reservoirs have some notable differences compared to saline formations that can have an impact on the risks of storage in these formations.
A major risk reduction factor for CO2 storage in oil and gas reservoirs is the existence of a proven hydrocarbon confining zone and trap. While it cannot be said that every hydrocarbon trap will necessarily function as an effective trap for CO2, the existence of the reservoir itself means that a confining zone of low permeability and high structural integrity was sufficient to keep buoyant hydrocarbons in place for geologic time. In saline formations, the existence and effectiveness of the confining zone must be demonstrated through careful characterization before injection and monitoring after injection begins. A variety of techniques are available to assess and monitor confining zone effectiveness in saline formations, but lack of access to the subsurface, and its inherent variability and heterogeneity, may result in considerable uncertainty when quantifying the probability and impacts.
A potential factor in increasing the risk of unplanned CO2 migration through the confining zone of an oil and gas formation is the presence of pre-existing wells that penetrate the primary geologic seal. While the data from these wells can considerably reduce uncertainties about the subsurface they are also a potential migration pathway for injected CO2. This is particularly the case for oil and gas fields developed many decades ago. In addition, reservoir pressure reduction due to extraction and reservoir stimulation procedures in oil and gas fields can affect the integrity of the confining zone.
BEST PRACTICES: Risk Management and Simulation for Geologic Storage Projects 35
Risk acceptability criteria should reflect the main concerns or objectives for a geologic storage project. Typical categories include elements such as:
• Environment
• Health & safety
• Technical
• Cost
• Reputation
• Schedule
DNV also developed a framework for simulating and analyzing infrastructure risk for storage operations. DNV utilized a modular approach to the risk analysis in which they broke the surface infrastructure into the following five components:
1. CO2 recovery at the source
2. Converging pipelines (gathering system)
3. Booster station
4. Pipeline
5. Injection system
Each of these systems was analyzed as generic plant or component models. The failure data was derived from a large database of hydrocarbon infrastructure release and reportable events.
DNV also set up a process to simulate and analyze the yearly releases of CO2 to the atmosphere during operations
2.0 PROJECT AND SITE DEVELOPMENT PLANNING
Case Study 2.12 from the Southwest Carbon Sequestration Partnership (SWP) shows how the partnership used reduced order models (ROMs) to identify and assess risk.
► See page 58
Case Study 2.9, from the PCOR Partnership, shows how they used transfer matrices during a risk assessment to assist with estimating consequences for potential risks.
► See page 55
Case Study 2.11 from BSCSP’s Kevin Dome Project illustrates the use of a hybrid approach to identify, characterize and assess project risks. Using a combination of quantitative and qualitative risk assessment tools can improve the risk assessment process by including broader input and increasing the efficiency of the process.
► See page 57
Case Study 2.10 illustrates how the MRCSP identified project risks for the Michigan Basin project.
► See page 56
of the different components of the surface infrastructure for CO2 storage (DNV 2003). The analysis was based on a simple-event tree. This event tree included the size of the leak path, whether the leak would be auto-detected or manually detected, the fraction of the leak that can be isolated if detected, and frequency of CO2 releases. From this event tree analysis, DNV calculated the fraction of a module’s flow that was lost. With the fraction calculated and the known flow rate for the module, DNV calculated the yearly production losses.
The further development of larger-scale CO2 infrastructure systems will provide improved information regarding performance of surface infrastructure.
BEST PRACTICES: Risk Management and Simulation for Geologic Storage Projects36
2.0 PROJECT AND SITE DEVELOPMENT PLANNING
2.4 DEVELOP A RISK MANAGEMENT PLAN Best practice four calls for the development of a risk management plan (RMP) that documents the results of the risk analysis. It summarizes the activities that were evaluated for risk, what those risks are, how they are ranked, and the steps the project will take to manage, monitor, avoid, or minimize those risks.
2.4.1 RISK MANAGEMENT PLANNINGA necessary step in a complete risk analysis is the development of a mitigation and control approach to address potential consequences. Such plans will heavily rely on numerous resources including standard industry practices, technical expertise and past experience, existing data from onsite and nearby locations, and monitoring data. The RMP should be prepared to address known risks with mitigating solutions (i.e., mandatory respiratory protection during sour gas operations) and will generally function in an “if-then” manner for unknown or potential risks—that is, if the monitoring system detects a problem, then certain actions will be performed to address that problem. Some findings will require immediate action and others will signal the need for an additional, focused monitoring. A good RMP will include well thought-out monitoring and mitigation activities that will decrease the risk and uncertainty associated with many potential consequences.
RMPs generally address two primary categories of risk: (1) programmatic risks, including resource and management risks, which may affect project progress or costs, and (2) storage (technical) risks, which may affect the achievement of the scientific and engineering objectives of a storage project. A great deal of experience in managing programmatic risk has been built over time by the oil and gas industry and more recently (during the last three decades) by other companies involved in subsurface operations. Many of these lessons are embodied in industry best practice standards such as those published by the American Petroleum Institute (API) and Society of Petroleum Engineers (SPE). For geologic CO2 storage, programmatic risks rely in part on the technical risks and vice-versa, and therefore the two are inextricably linked.
Examples of the common approaches to risk mitigation are provided below:
• Elimination (e.g., implement a regularly scheduled data backup system and server for all project files to eliminate risk of data loss or corruption if primary data server fails)
• Substitution (e.g., use water-based drilling muds instead of oil-based drilling muds to avoid petroleum product exposure to workers and wildlife)
• Engineered controls (e.g., use enclosed tanks to temporarily store produced water instead of open pits)
• Administrative or managerial controls (e.g., mandatory project orientation and HSE awareness training for all project personnel and onsite subcontractors)
• Personal protective equipment (e.g., steel-toed boots, hardhats, safety glasses, H2S monitoring devices, respirators, work gloves, etc.)
For example, in the Certification Framework approach, if the CO2- and/or brine-leakage risks (CLR, BLR) are above the threshold, changes to the injection plan or refinements in site characterization may be made, resulting in decreased CLR/BLR. Additionally, in the CO2-PENS approach, comprehensive risk assessment would provide insights into the specific FEPs/actions, which led to the risks. This information would be used to identify technologies and approaches that can be deployed to address the critical FEPs/actions with the goal of minimizing the risks. Mitigation approaches might include:
• Water injection into the reservoir above the primary confining interval to pressurize the formation.
• Water injection into the primary reservoir outside the CO2 plume to contain the CO2 and prevent migration.
• Reducing reservoir pressure by venting CO2 to the atmosphere, or by producing brine/water.
BEST PRACTICES: Risk Management and Simulation for Geologic Storage Projects 37
2.0 PROJECT AND SITE DEVELOPMENT PLANNING
Certain data types, such as drilling reports, well log data, air quality data, and water quality data from the project site or nearby facilities, are also important sources of information for mitigating risks, particularly to onsite workers and natural resources. For example, drilling reports and well log data may indicate the presence of mixed fluids in the down-hole environment that may require specific engineering controls and operational activities for well control and site safety. Air monitoring data may indicate that the project should be prepared to mitigate the potential for exposure to high levels of hydrogen sulfide gas, or other “sour gases” that can be extremely hazardous to the health and safety of onsite workers. Similarly, water quality data may indicate that an alternative means of disposal may be necessary to comply with regulations and protect natural resources, or the data may suggest that additional personal protection measures may be necessary to protect workers from exposure to potential hydrocarbons, volatiles, or sour gases that may be in the water.
Surface, near-surface, and deep-subsurface operational monitoring data should be compared against a set of baseline (pre-injection) measurements. If a measurement collected during the operational monitoring phase exceeds threshold values established from baseline (above or below, depending on the specific measurement), then this triggers a significant change from baseline conditions. Additional measurements will be evaluated to assess whether the exceedance represents a serious problem or whether it is a false-positive (i.e., the measurement suggests that a leak is present when other lines of evidence support the conclusion that there is no leak). If a problem is observed, then the operator would determine the cause and proceed to implement mitigation measures to address the problem.
2.4.2 ELEMENTS OF A RISK MANAGEMENT PLANAs noted above, the RMP summarizes the activities that were evaluated for risk, what those risks are, how they are ranked, and the step the project will take to manage, monitor, avoid, or minimize those risks. Some projects may wish to develop a comprehensive RMP that addresses all aspects and activities associated with the project. Others may find it more manageable to develop separate RMPs or “Health & Safety Field Plans” for specific project activities such a Well Drilling & Completion RMP, Monitoring Verification & Accounting RMP, or CO2 Injection Operations RMP. Regardless, all RMPs should be prepared in a manner that makes the document a useful reference tool for the project team, as opposed to an unwieldy, large, or complicated document that few people will read. While RMPs have no formal format or template, many plans include the following information to address these important questions:
• What is the purpose of the RMP? State the projects objectives and policy.
• What activities are covered in the RMP? State the scope of work that was evaluated for risk.
• Who is in charge of managing risk? Describe the management structure of the project and the roles and responsibilities of the key personnel leading the scope of work.
• What policies or regulations does the project team need to be aware of in terms of risk management? Summarize any project-specific or regulatory policies that trigger the need for risk mitigation (i.e., federal, state, and local regulations; project-specific policies; landowner agreements; worker health and safety mandates; etc.)
• What risks were identified for the scope of work and how will they be avoided, minimized, or mitigated? Summarize the risks that were identified and ranked during the risk assessment process for the defined scope of work. Summarize how the risks will be avoided, minimized, and/or mitigated.
BEST PRACTICES: Risk Management and Simulation for Geologic Storage Projects38
2.0 PROJECT AND SITE DEVELOPMENT PLANNING
• How will risk mitigation be implemented and how will new information about risk be handled as the scope of work progresses? Describe how risk avoidance, minimization, and mitigation measures will be implemented in the field or office setting (i.e., who will do what and when). Describe how new information and decisions will be tracked and how the “management of change” process will be carried out.
In addition, the RCSPs have found it useful to include certain specific elements into their RMPs such as:
• Identification of risk owner—person assigned with responsibility and authority to ensure that identified risk scenarios are appropriately managed.
• Potential actions to reduce or manage the risk assigned to a person with responsibility and authority.
• Worker safety and safe practice protocols.
• Project expectations for safety.
• Emergency response protocols.
A sample outline for a general RMP is included in Appendix 2.
In addition, the RCSPs have found it useful to include certain tools and documents into their RMPs such as:
• Identification of risk owner—person assigned with responsibility and authority to ensure that identified risk scenarios are appropriately managed.
• Potential actions to reduce or manage the risk assigned to a person with responsibility and authority.
• Worker safety and safe practice protocols.
• Project expectations for safety.
• Emergency response protocols.
A sample outline for a general RMP is included in Appendix 2.
2.5 IMPLEMENT THE RISK MANAGEMENT PLAN The fifth best practice calls for implementing the RMP by integrating and communicating risk management throughout the project. This section outlines approaches for achieving this objective.
Overall project risk is significantly reduced when the concepts, protocols, and actions described in the RMP are successfully integrated into project management, design, and operational activities. Risk management could be undertaken for the site characterization activities to develop a big picture view of the risks associated with properly conducting site characterization work, and/or it could be used to develop a more limited view of the risks associated with individuals working in the field to collect site characterization data. Similarly, risk management can be used to assess project infrastructure planning and implementation activities to develop a big-picture sense of whether the infrastructure is designed to minimize risk to the project, and/or it can be used to develop a more focused view on minimizing the risks to workers and the environment during construction. In this sense, risk management has different functions depending upon when in the process it is implemented and its intended use. From a risk management perspective, the team should focus on integrating and communicating the risks, risk analysis results, and risk management directives to all project personnel so everyone does their work to support the RMP. It is important to emphasize that in an effective risk management program every person on the project team has a role in risk management—from the top down and the bottom up. Coordination between project management leads, technical leads and field leads is critical to successfully implementing a RMP. In addition, these leads must communicate clearly with their teams to ensure all personnel involved in the project are conducting their work in a manner that supports the mitigation measures outlined in the project’s RMP. A successful project has effective top-down and bottom-up communication among all project personnel. This ensures that risk is managed correctly across all five primary elements of the geologic storage projects: site characterization, numeric simulation, risk analysis monitoring, and public outreach. All activities are interdependent and lessons learned from the RCSP Initiative indicate that all of these activities need to be carried out in an integrated manner.
BEST PRACTICES: Risk Management and Simulation for Geologic Storage Projects 39
2.0 PROJECT AND SITE DEVELOPMENT PLANNING
2.5.1 THE IMPORTANCE OF PROJECT COMMUNICATION TO IMPLEMENTATION OF RMPEffective risk communication is also a key component of educating the general public and serves as the basis for obtaining useful feedback from communities. Public outreach and communication is both informed by these activities and also generates input for the analysis, in the form of public views, concerns, and suggestions.
As discussed in the Public Outreach and Education for Geologic Storage Projects BPM, one of the critical objectives of a good outreach program is to effectively share information about risk with stakeholders in an effort to build a shared understanding of how risks are perceived and mitigated.
Several relevant suggestions on how to effectively integrate and communicate risk management within the project team and with the general public have arisen from the RCSP experience. These include:
• Create an RMP that includes/references/coordinates with the Communications Plan
• Plan for and implement routine project communications—these should include daily, weekly, and monthly project updates between management team and key project personnel, partners, and subcontractors
• Work with the communications team to develop content for public communication programs including materials such as newsletters, updated project websites, community events, and other outreach activities
• Ensure that the key planning documents such as HSE field plans, Emergency Response Plan, Environmental Incident Plan, Journey Management Plans, and chemical product MSDSs, include descriptions of the risk assessment and mitigation program. It is critical to communicate to all project personnel how to conduct their work safety and what to do in the event of an incident or emergency.
Case Study 2.15 from BSCSP’s Kevin Dome Project illustrates how the results of risk assessment were integrated into the daily implementation of the project. An RMP entails a dynamic feedback process and communication plays a vital role.
► See page 62
Case Study 2.13 shows how the PCOR Partnership used an adaptive management approach to integrate risk management with other technical activities.
► See page 60
Case Study 2.14 shows how the PCOR Partnership used multiple rounds of risk assessment during project planning to support a commercial CO2 storage feasibility study at a site in British Columbia.
► See page 61
Case Study 2.16 from BSCSP illustrates the importance of fully communicating project health, safety, environmental and performance standards with all members of the project team, including contractors. Most CCS projects engage a number of outside contractors to complete specific tasks. It is important that those contractors are aware of and implement project health, safety and environment field plans to maintain compliance with the project’s safety standards and permitting requirements.
► See page 63
BEST PRACTICES: Risk Management and Simulation for Geologic Storage Projects40
2.6 CONDUCT PERIODIC UPDATES TO RISK ASSESSMENTSOver time, geologic storage project risks will evolve. Some issues will become more certain, others will cease to be of concern, and new risks may emerge. Therefore, the sixth best practice calls for the periodic updating of all or portions of the risk analysis. The risk analysis should be a dynamic process that entails both “big picture” and “smaller picture” analysis of the project as a whole and its components. This section of the manual outlines some of the updating activities undertaken by the RCSPs.
2.6.1 PERIODIC ACTIVITIESThe timing and type of periodic risk assessments depends on current and upcoming activities. At a minimum, risk analysis should be conducted at the project inception and on an annual (or periodic) basis. In addition, the RCSPs have found it useful to update all or portions of risk analysis as follows:
• During critical and/or potentially high-consequence field activities (i.e., well drilling, completion, and testing), project operators should consider completing daily risk assessments. In many cases, verbal qualitative assessments (e.g., daily tailgate meetings, daily phone calls with technical leads) are more practical for fast-paced field activities as opposed to numeric ranking, which requires time to input various rankings and probabilities before decisions can be made.
• During more routine field activities (i.e., MVA sampling, topographic surveys), verbal or written qualitative assessments are appropriate (i.e., weekly phone calls with technical leads or weekly progress reports).
• On a periodic basis, the management team should assess risks and treatments for current activities and upcoming activities. Additional project personnel should be included in the assessments as needed. A qualitative risk analysis is appropriate and any new or updated risk assessments should be tracked in the projects risk management database. A quantitative analysis would also be appropriate if key project personnel are adequately trained and familiar with using the quantitative database; however, it may be difficult to conduct this assessment on a monthly basis unless the process is very streamlined. Quantitative databases could also be updated with the results from the daily and weekly assessments each month.
• After major activities are completed, risk assessments should be performed (e.g., annually, biannually) to capture lessons learned, update new or modified mitigation measures, and record new or emerging risks that could potentially affect future work. Quantitative or qualitative risk assessment approaches are both appropriate.
• Risk assessments also should be performed each year, preferably at an annual project meeting when all of the key partners, technical leads and project personnel are together. This is an ideal opportunity to update the quantitative risk database and also an excellent time to quickly capture new and emerging risks, concerns and lessons-learned from break-out session with focused groups.
2.0 PROJECT AND SITE DEVELOPMENT PLANNING
BEST PRACTICES: Risk Management and Simulation for Geologic Storage Projects 41
Case Study 2.18 shows how the PCOR Partnership has periodically updated its programmatic and site-specific risk assessments to include new data.
► See page 66
Case Study 2.17 from SECARB’s Citronelle Project shows the importance of updating risk management plans. Updates have been conducted during the planning stage of project development, immediately prior to the start of CO2 injection, annually during CO2 injection and at the start of the post-injection monitoring period.
► See page 65
Case Study 2.10 MRCSP illustrates how MRCSP updated its risk assessment for the Michigan Basin Project as new reefs were added to the study. The update focused on performance and safety.
► See page 56
2.0 PROJECT AND SITE DEVELOPMENT PLANNING
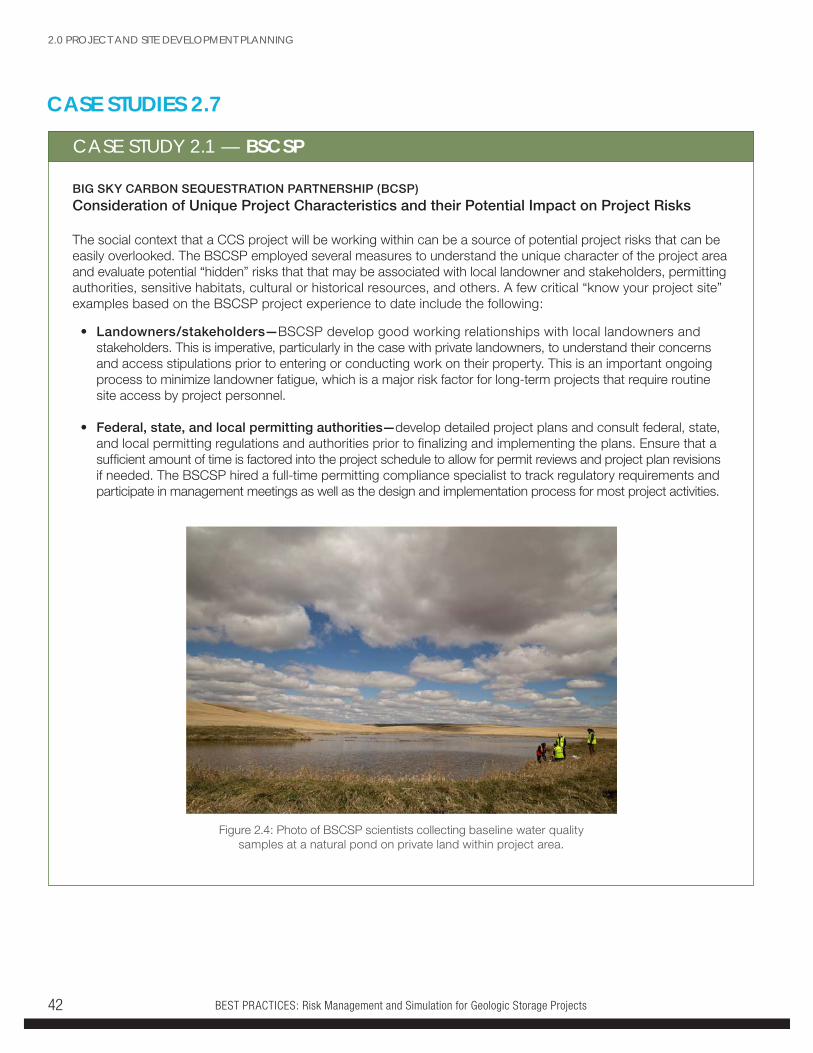
BEST PRACTICES: Risk Management and Simulation for Geologic Storage Projects42
CASE STUDY 2.1 — BSCSP
CASE STUDIES 2.7
BIG SKY CARBON SEQUESTRATION PARTNERSHIP (BCSP)
Consideration of Unique Project Characteristics and their Potential Impact on Project Risks
The social context that a CCS project will be working within can be a source of potential project risks that can be easily overlooked. The BSCSP employed several measures to understand the unique character of the project area and evaluate potential “hidden” risks that that may be associated with local landowner and stakeholders, permitting authorities, sensitive habitats, cultural or historical resources, and others. A few critical “know your project site” examples based on the BSCSP project experience to date include the following:
• Landowners/stakeholders—BSCSP develop good working relationships with local landowners and stakeholders. This is imperative, particularly in the case with private landowners, to understand their concerns and access stipulations prior to entering or conducting work on their property. This is an important ongoing process to minimize landowner fatigue, which is a major risk factor for long-term projects that require routine site access by project personnel.
• Federal, state, and local permitting authorities—develop detailed project plans and consult federal, state, and local permitting regulations and authorities prior to finalizing and implementing the plans. Ensure that a sufficient amount of time is factored into the project schedule to allow for permit reviews and project plan revisions if needed. The BSCSP hired a full-time permitting compliance specialist to track regulatory requirements and participate in management meetings as well as the design and implementation process for most project activities.
Figure 2.4: Photo of BSCSP scientists collecting baseline water quality samples at a natural pond on private land within project area.
2.0 PROJECT AND SITE DEVELOPMENT PLANNING
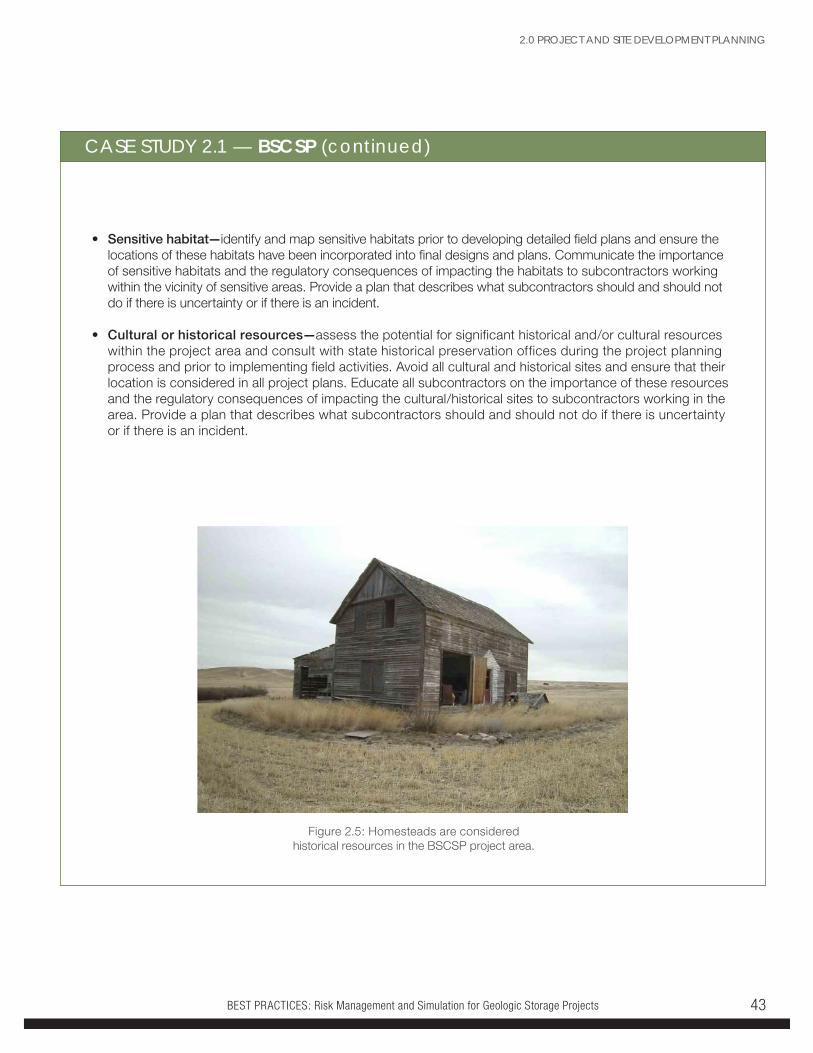
BEST PRACTICES: Risk Management and Simulation for Geologic Storage Projects 43
CASE STUDY 2.1 — BSCSP (continued)
• Sensitive habitat—identify and map sensitive habitats prior to developing detailed field plans and ensure the locations of these habitats have been incorporated into final designs and plans. Communicate the importance of sensitive habitats and the regulatory consequences of impacting the habitats to subcontractors working within the vicinity of sensitive areas. Provide a plan that describes what subcontractors should and should not do if there is uncertainty or if there is an incident.
• Cultural or historical resources—assess the potential for significant historical and/or cultural resources within the project area and consult with state historical preservation offices during the project planning process and prior to implementing field activities. Avoid all cultural and historical sites and ensure that their location is considered in all project plans. Educate all subcontractors on the importance of these resources and the regulatory consequences of impacting the cultural/historical sites to subcontractors working in the area. Provide a plan that describes what subcontractors should and should not do if there is uncertainty or if there is an incident.
Figure 2.5: Homesteads are considered historical resources in the BSCSP project area.
2.0 PROJECT AND SITE DEVELOPMENT PLANNING
BEST PRACTICES: Risk Management and Simulation for Geologic Storage Projects44
SOUTHEAST REGIONAL CARBON SEQUESTRATION PARTNERSHIP (SECARB)
Using FEP Analysis to Identify and Assess Project Risk
SECARB used a semi-quantitative approach, including DNV-RP-J201: Qualification Procedures for CO2 Capture Technology 2010; CO2QUALSTORE—Guideline for Selection and Qualification of Sites and Projects for Geological Storage of CO2 (Aarnes et al., 2010) to assess risk at the Development Phase Citronelle project. Figure 2-6 illustrates the type of risk matrix SECARB developed to rank identified project risk. The “likelihood” scale shows how probabilities were estimated and the “severity” scale shows the magnitude.
Documents that have provided context for the SECARB-Citronelle risk management approach taken by the project team include the following:
• ISO 31000 (ISO 31000: Risk Management—Principles and Guidelines 2009).
• DNV-RP-J201 (DNV-RP-J201: Qualification Procedures for CO2 Capture Technology 2010).
• DNV-RP-J202 (DNV-RP-J202: Design and Operation of CO2 Pipelines 2010).
• World Resources Institute (WRI) CCS Guidelines—Guidelines for Carbon Dioxide Capture, Transport, and Storage (Forbes et al. 2008).
• CO2QUALSTORE—Guideline for Selection and Qualification of Sites and Projects for Geological Storage of CO2 (Aarnes et al. 2010).
• Implementation of Directive 2009/31/EC on the Geological Storage of Carbon Dioxide, Guidance Document 1—CO2 Storage Life Cycle Risk Management Framework (EC 2011).
• Best Practices for: Risk Analysis and Simulation for Geological Storage of CO2 (NETL 2011).
• CSA Z741 (CSA Z741-12: Geological storage of carbon dioxide 2011).
Item 6.5 in CSA Z741-12 states that the risk management plan should include, among other things, a description of “risk evaluation criteria for each element of concern tailored to the scope and objectives of the project.” Elements of concern are defined as “valued elements or objectives for which risk is evaluated or managed.” The elements of concern defined for the Citronellle project are environment, health and safety, cost, reputation, and schedule.
To facilitate allocation and management of risk, the risk register for the project includes a description of the following for each identified risk:
• A description of the risk scenario, i.e., the possible causes or threats, the event or circumstance with potential negative impact to one or more of the elements of concern, and the potential consequences that may materialize should the event or circumstance occur
• A description of the planned or implemented risk treatment to mitigate the risk scenario
• A description of the assessed effectiveness of the risk treatment
• The designated risk owner and the persons responsible for actions associated with execution of the risk controls in the risk treatment, and a schedule for timely execution of the controls.
CASE STUDY 2.2 — SECARB
2.0 PROJECT AND SITE DEVELOPMENT PLANNING
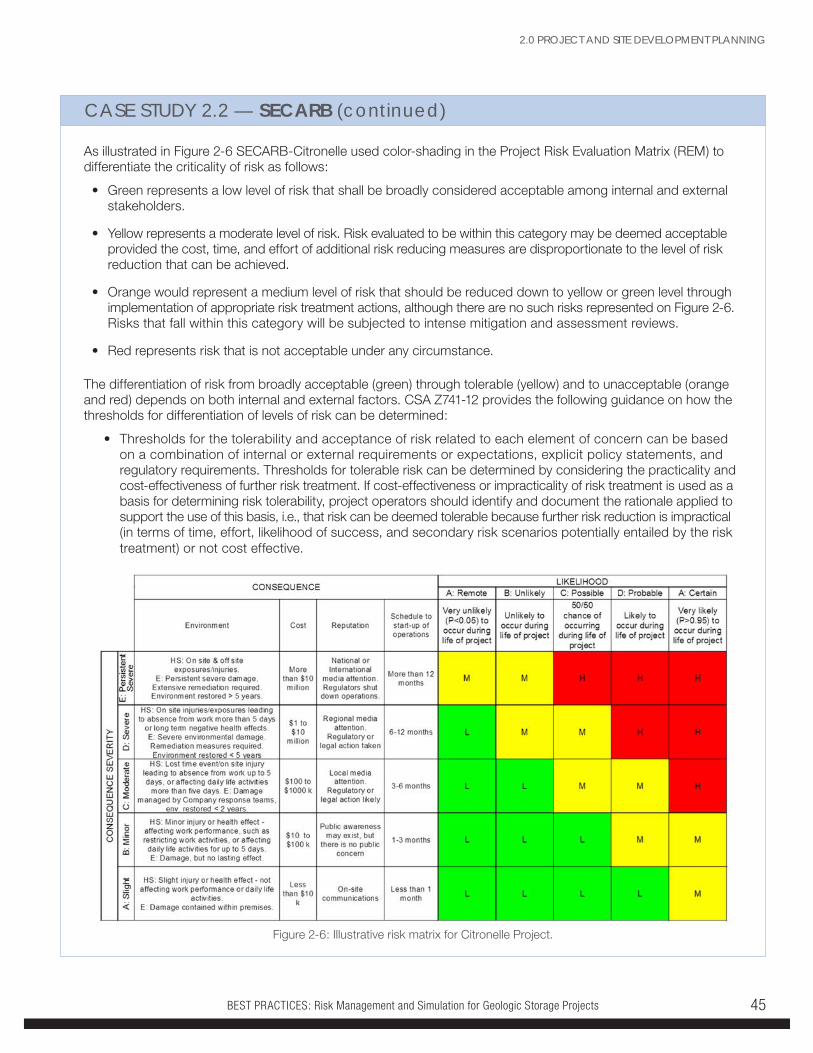
BEST PRACTICES: Risk Management and Simulation for Geologic Storage Projects 45
CASE STUDY 2.2 — SECARB (continued)
Figure 2-6: Illustrative risk matrix for Citronelle Project.
2.0 PROJECT AND SITE DEVELOPMENT PLANNING
As illustrated in Figure 2-6 SECARB-Citronelle used color-shading in the Project Risk Evaluation Matrix (REM) to differentiate the criticality of risk as follows:
• Green represents a low level of risk that shall be broadly considered acceptable among internal and external stakeholders.
• Yellow represents a moderate level of risk. Risk evaluated to be within this category may be deemed acceptable provided the cost, time, and effort of additional risk reducing measures are disproportionate to the level of risk reduction that can be achieved.
• Orange would represent a medium level of risk that should be reduced down to yellow or green level through implementation of appropriate risk treatment actions, although there are no such risks represented on Figure 2-6. Risks that fall within this category will be subjected to intense mitigation and assessment reviews.
• Red represents risk that is not acceptable under any circumstance.
The differentiation of risk from broadly acceptable (green) through tolerable (yellow) and to unacceptable (orange and red) depends on both internal and external factors. CSA Z741-12 provides the following guidance on how the thresholds for differentiation of levels of risk can be determined:
• Thresholds for the tolerability and acceptance of risk related to each element of concern can be based on a combination of internal or external requirements or expectations, explicit policy statements, and regulatory requirements. Thresholds for tolerable risk can be determined by considering the practicality and cost-effectiveness of further risk treatment. If cost-effectiveness or impracticality of risk treatment is used as a basis for determining risk tolerability, project operators should identify and document the rationale applied to support the use of this basis, i.e., that risk can be deemed tolerable because further risk reduction is impractical (in terms of time, effort, likelihood of success, and secondary risk scenarios potentially entailed by the risk treatment) or not cost effective.
BEST PRACTICES: Risk Management and Simulation for Geologic Storage Projects46
CASE STUDY 2.2 — SECARB (continued)
2.0 PROJECT AND SITE DEVELOPMENT PLANNING
SECARB integrated their risk management program into the Development Phase Citronelle project using an RMP that was based on expert and stakeholder input. The team used this information to identify and develop a project risk register, record the risks in the risk management tool(s), and identify a risk owner to be responsible for shepherding the respective risks through the project life cycle. Specifically, the RMP was used to:
• Develop the rationale for the respective assessments of likelihood and severity of potential consequences (this description should include enough detail to enable an audit of the assessed likelihoods and consequence severities)
• Assign a risk owner for each risk, i.e., an individual with responsibility and authority to ensure that risk is properly managed
• Assure that corrective/mitigating actions are implemented to manage risk
• Assign an owner to each corrective/mitigating action to ensure that the action is effectively implemented in a timely manner.
SECARB developed two guidelines for risk identification based on early tests: (1) Citronelle Integrated Test – DNV-RP-J201: Qualification Procedures for CO2 Capture Technology 2010; (2) CO2QUALSTORE – Guideline for Selection and Qualification of Sites and Projects for Geological Storage of CO2 (Aarnes et al., 2010).
SECARB also developed a generalized mitigation plan for the Validation Phase Gulf Coast Stacked Storage project. It consisted of identifying potential problems with safety of truck-delivered CO2 to the location, operations of CO2 injection equipment, transportation of CO2 through an injection flow line, operation of injection and production wellbores, and separation of produced fluids through a tank battery. As a result of the rigorous site screening process, the likelihood of operational problems was minimized. Further, the collaboration with reputable oil field operators further reduced risk and contributed to the mitigation plan to follow commonly used and accepted oil field practices of that specific operator.
BEST PRACTICES: Risk Management and Simulation for Geologic Storage Projects 47
CASE STUDY 2.3 — PCORPLAINS CO2 REDUCTION (PCOR) PARTNERSHIP
Adaptive Management Approach to Integrate Risk Management with Project Management
The PCOR Partnership uses an adaptive management approach as part of its Development Phase activities in order to integrate site characterization, modeling and simulation, and monitoring, verification, and accounting (MVA) measurements into risk assessment efforts. This process ensures that the most current site data are being used to inform the assessment.
For example, if a technical risk is lateral migration of CO2 beyond the Area of Review (AoR), then each activity of the adaptive management approach is used to evaluate this risk. The outcome of this integrated approach provides information to the subject matter experts (SMEs) as they score and rank the risk as part of the overall risk assessment. Continuing with the previous example of lateral migration of CO2:
• Site characterization data provide geologic and petrophysical (e.g., permeability and porosity) information about the reservoir and the overlying geologic seal, as well as the presence, orientation, and continuity of significant features such as fractures, faults or discontinuities. These characterization data are then used as input to the geologic model (geomodel), which is used to develop a three-dimensional (3-D), static representation of the storage complex.
• After the geomodel is developed, dynamic simulation is used to model the movement of fluids (CO2, oil, and/or formation water brine) throughout the reservoir and overlying strata in response to CO2 injection. Multiple realizations of these dynamic models are used to assess the model sensitivity to specific input parameters or assumptions. Collectively, these simulation results are used to map the maximum lateral extent of CO2 migration in the storage reservoir as a function of time since CO2 injection.
• The numerical simulation maps provide input to the SMEs during the risk assessment so that they may assess the likelihood of CO2 exceeding the boundaries of the AoR.
• As the geologic storage project progresses through the operational phase, MVA data become available for use in successive risk assessments. For example, if four-dimensional seismic (3-D seismic collected over time) shows CO2 movement within the storage reservoir that is consistent with the numerical simulation results, this validates the model and allows the SMEs to more confidently assign risk likelihoods during the next risk assessment(s). On the other hand, if movement exceeds the predictions of the numerical simulations, modifications to the models would be appropriate, providing a new basis upon which the SMEs would rely for the reassignment of the risk likelihoods.
2.0 PROJECT AND SITE DEVELOPMENT PLANNING
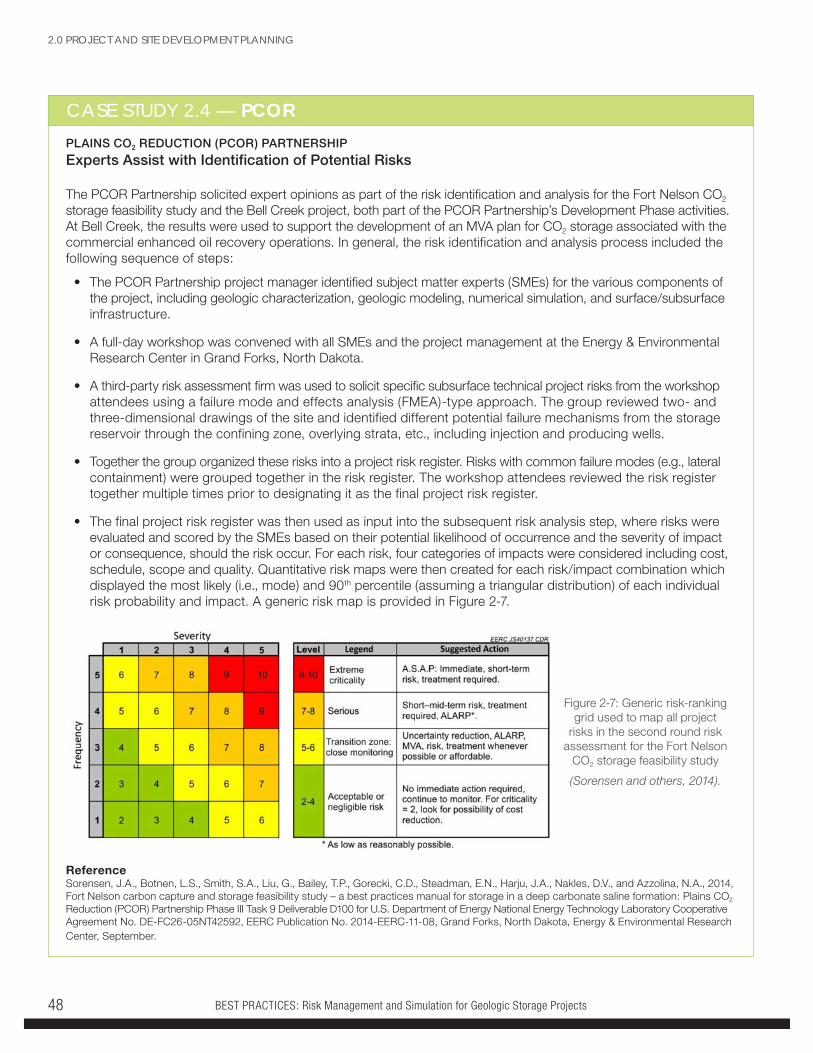
BEST PRACTICES: Risk Management and Simulation for Geologic Storage Projects48
CASE STUDY 2.4 — PCOR
Figure 2-7: Generic risk-ranking grid used to map all project
risks in the second round risk assessment for the Fort Nelson
CO2 storage feasibility study
(Sorensen and others, 2014).
ReferenceSorensen, J.A., Botnen, L.S., Smith, S.A., Liu, G., Bailey, T.P., Gorecki, C.D., Steadman, E.N., Harju, J.A., Nakles, D.V., and Azzolina, N.A., 2014, Fort Nelson carbon capture and storage feasibility study – a best practices manual for storage in a deep carbonate saline formation: Plains CO2 Reduction (PCOR) Partnership Phase III Task 9 Deliverable D100 for U.S. Department of Energy National Energy Technology Laboratory Cooperative Agreement No. DE-FC26-05NT42592, EERC Publication No. 2014-EERC-11-08, Grand Forks, North Dakota, Energy & Environmental Research Center, September.
PLAINS CO2 REDUCTION (PCOR) PARTNERSHIP
Experts Assist with Identification of Potential Risks
The PCOR Partnership solicited expert opinions as part of the risk identification and analysis for the Fort Nelson CO2 storage feasibility study and the Bell Creek project, both part of the PCOR Partnership’s Development Phase activities. At Bell Creek, the results were used to support the development of an MVA plan for CO2 storage associated with the commercial enhanced oil recovery operations. In general, the risk identification and analysis process included the following sequence of steps:
• The PCOR Partnership project manager identified subject matter experts (SMEs) for the various components of the project, including geologic characterization, geologic modeling, numerical simulation, and surface/subsurface infrastructure.
• A full-day workshop was convened with all SMEs and the project management at the Energy & Environmental Research Center in Grand Forks, North Dakota.
• A third-party risk assessment firm was used to solicit specific subsurface technical project risks from the workshop attendees using a failure mode and effects analysis (FMEA)-type approach. The group reviewed two- and three-dimensional drawings of the site and identified different potential failure mechanisms from the storage reservoir through the confining zone, overlying strata, etc., including injection and producing wells.
• Together the group organized these risks into a project risk register. Risks with common failure modes (e.g., lateral containment) were grouped together in the risk register. The workshop attendees reviewed the risk register together multiple times prior to designating it as the final project risk register.
• The final project risk register was then used as input into the subsequent risk analysis step, where risks were evaluated and scored by the SMEs based on their potential likelihood of occurrence and the severity of impact or consequence, should the risk occur. For each risk, four categories of impacts were considered including cost, schedule, scope and quality. Quantitative risk maps were then created for each risk/impact combination which displayed the most likely (i.e., mode) and 90th percentile (assuming a triangular distribution) of each individual risk probability and impact. A generic risk map is provided in Figure 2-7.
2.0 PROJECT AND SITE DEVELOPMENT PLANNING
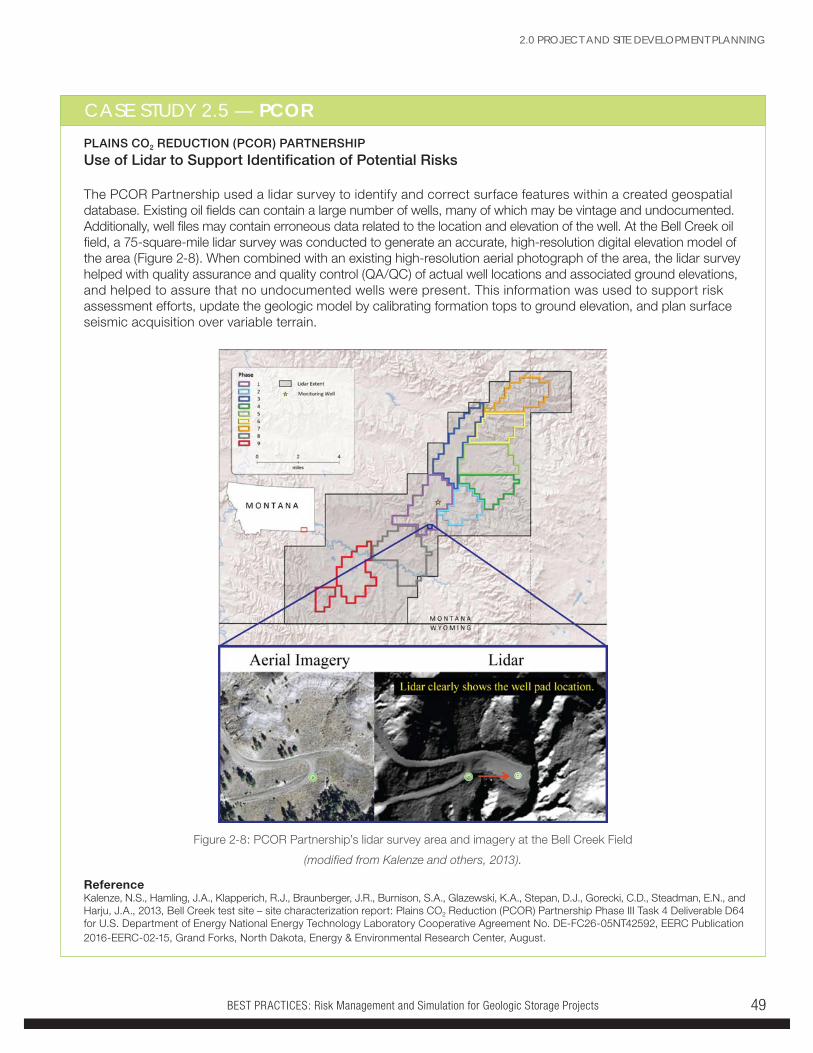
BEST PRACTICES: Risk Management and Simulation for Geologic Storage Projects 49
CASE STUDY 2.5 — PCORPLAINS CO2 REDUCTION (PCOR) PARTNERSHIP
Use of Lidar to Support Identification of Potential Risks
The PCOR Partnership used a lidar survey to identify and correct surface features within a created geospatial database. Existing oil fields can contain a large number of wells, many of which may be vintage and undocumented. Additionally, well files may contain erroneous data related to the location and elevation of the well. At the Bell Creek oil field, a 75-square-mile lidar survey was conducted to generate an accurate, high-resolution digital elevation model of the area (Figure 2-8). When combined with an existing high-resolution aerial photograph of the area, the lidar survey helped with quality assurance and quality control (QA/QC) of actual well locations and associated ground elevations, and helped to assure that no undocumented wells were present. This information was used to support risk assessment efforts, update the geologic model by calibrating formation tops to ground elevation, and plan surface seismic acquisition over variable terrain.
Figure 2-8: PCOR Partnership’s lidar survey area and imagery at the Bell Creek Field
(modified from Kalenze and others, 2013).
ReferenceKalenze, N.S., Hamling, J.A., Klapperich, R.J., Braunberger, J.R., Burnison, S.A., Glazewski, K.A., Stepan, D.J., Gorecki, C.D., Steadman, E.N., and Harju, J.A., 2013, Bell Creek test site – site characterization report: Plains CO2 Reduction (PCOR) Partnership Phase III Task 4 Deliverable D64 for U.S. Department of Energy National Energy Technology Laboratory Cooperative Agreement No. DE-FC26-05NT42592, EERC Publication 2016-EERC-02-15, Grand Forks, North Dakota, Energy & Environmental Research Center, August.
2.0 PROJECT AND SITE DEVELOPMENT PLANNING
BEST PRACTICES: Risk Management and Simulation for Geologic Storage Projects50
CASE STUDY 2.6 — MRCSP
MIDWEST REGIONAL CARBON SEQUESTRATION PARTNERSHIP (MRCSP)
Using Fracture Pressure Analysis to Assess Project Risk
MRCSP performed fracture pressure analysis using limited well data available from the closed reef, as well as regional geomechanical data, to determine the maximum acceptable pressure buildup due to CO2 injection in the reef. To avoid tensile fracturing of the reservoir and caprock, the estimation of minimum horizontal stress and its change by CO2 injection is necessary. The friction-limit method and the log-derived method were used to derive estimates of minimum horizontal stress in the reef. These calculation methods require knowledge of rock density, Poisson Ratio of formations, Young’s Modulus of formations, reservoir (pore) pressure, and vertical stress. The mechanical parameters were estimated from sonic-log data (compressional-wave slowness and shear-wave slowness) and density logs from the nearby reefs as surrogates. Changes in minimum horizontal stress caused by changes in pressure and temperature during CO2 injection were approximated to determine whether the stress state compromises the ability of storage reservoirs for safe and effective CO2 storage. The results of geomechanical modeling showed that the calculated minimum horizontal stress value (by considering poro- and thermo- elastic effects of CO2 injection) remained higher than pore pressure when pore pressure is maintained below the permit pressure limit—i.e., fracturing is not likely to occur below the permit pressure limit in the reef, even if the pressure in the reef was raised above discovery pressure. Geomechanical analysis of the CO2 injection in the reef can thus reduce risks to integrity and capacity in storage formations of interest by putting bounds on the operational parameters.
2.0 PROJECT AND SITE DEVELOPMENT PLANNING

BEST PRACTICES: Risk Management and Simulation for Geologic Storage Projects 51
MIDWEST GEOLOGICAL SEQUESTRATION CONSORTIUM (MGSC)
Tailoring Risk Assessment to Meet Project Needs
During the Validation Phase, the MGSC used a general risk assessment approach to identify and assess potential risks during CO2 injection by reviewing historical operations at the sites and the current operators’ role in the day-to-day activities of existing oil fields. Illinois Basin oil field operators that diligently practice responsible and safe oil field production protocols were identified. Further, with operator cooperation and general pilot descriptions requirements from MGSC, the project team nominated oil fields or coal sites for consideration for the MGSC pilots. These sites were studied qualitatively to understand and minimize project risk.
CASE STUDY 2.7 — MGSC
2.0 PROJECT AND SITE DEVELOPMENT PLANNING
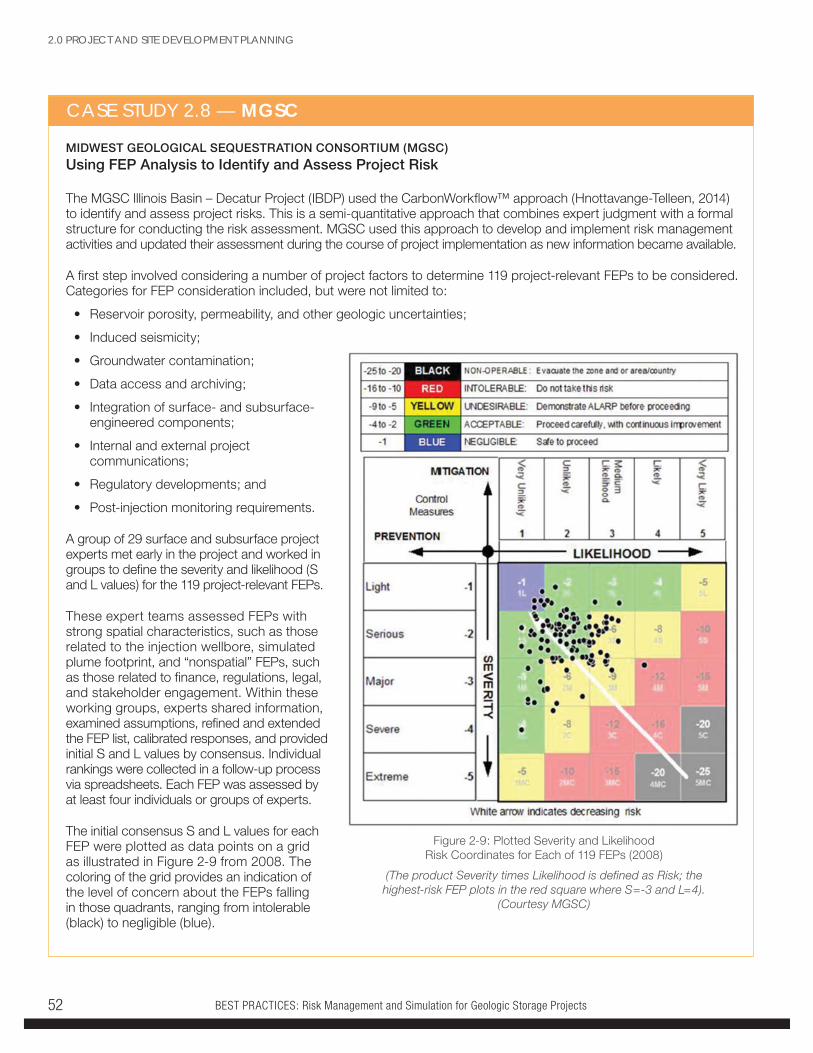
BEST PRACTICES: Risk Management and Simulation for Geologic Storage Projects52
MIDWEST GEOLOGICAL SEQUESTRATION CONSORTIUM (MGSC)
Using FEP Analysis to Identify and Assess Project Risk
The MGSC Illinois Basin – Decatur Project (IBDP) used the CarbonWorkflow™ approach (Hnottavange-Telleen, 2014) to identify and assess project risks. This is a semi-quantitative approach that combines expert judgment with a formal structure for conducting the risk assessment. MGSC used this approach to develop and implement risk management activities and updated their assessment during the course of project implementation as new information became available.
A first step involved considering a number of project factors to determine 119 project-relevant FEPs to be considered. Categories for FEP consideration included, but were not limited to:
• Reservoir porosity, permeability, and other geologic uncertainties;
• Induced seismicity;
• Groundwater contamination;
• Data access and archiving;
• Integration of surface- and subsurface-engineered components;
• Internal and external project communications;
• Regulatory developments; and
• Post-injection monitoring requirements.
A group of 29 surface and subsurface project experts met early in the project and worked in groups to define the severity and likelihood (S and L values) for the 119 project-relevant FEPs.
These expert teams assessed FEPs with strong spatial characteristics, such as those related to the injection wellbore, simulated plume footprint, and “nonspatial” FEPs, such as those related to finance, regulations, legal, and stakeholder engagement. Within these working groups, experts shared information, examined assumptions, refined and extended the FEP list, calibrated responses, and provided initial S and L values by consensus. Individual rankings were collected in a follow-up process via spreadsheets. Each FEP was assessed by at least four individuals or groups of experts.
The initial consensus S and L values for each FEP were plotted as data points on a grid as illustrated in Figure 2-9 from 2008. The coloring of the grid provides an indication of the level of concern about the FEPs falling in those quadrants, ranging from intolerable (black) to negligible (blue).
CASE STUDY 2.8 — MGSC
Figure 2-9: Plotted Severity and Likelihood Risk Coordinates for Each of 119 FEPs (2008)
(The product Severity times Likelihood is defined as Risk; the highest-risk FEP plots in the red square where S=-3 and L=4).
(Courtesy MGSC)
2.0 PROJECT AND SITE DEVELOPMENT PLANNING
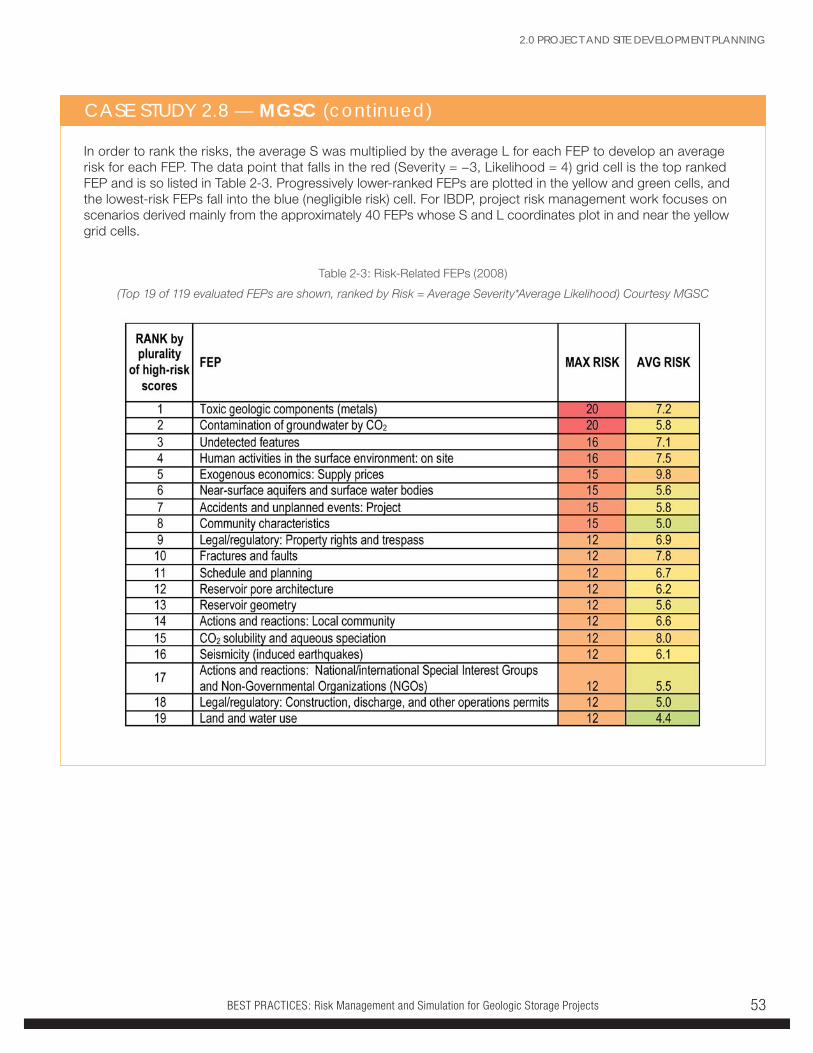
BEST PRACTICES: Risk Management and Simulation for Geologic Storage Projects 53
CASE STUDY 2.8 — MGSC (continued)
In order to rank the risks, the average S was multiplied by the average L for each FEP to develop an average risk for each FEP. The data point that falls in the red (Severity = −3, Likelihood = 4) grid cell is the top ranked FEP and is so listed in Table 2-3. Progressively lower-ranked FEPs are plotted in the yellow and green cells, and the lowest-risk FEPs fall into the blue (negligible risk) cell. For IBDP, project risk management work focuses on scenarios derived mainly from the approximately 40 FEPs whose S and L coordinates plot in and near the yellow grid cells.
Table 2-3: Risk-Related FEPs (2008)
(Top 19 of 119 evaluated FEPs are shown, ranked by Risk = Average Severity*Average Likelihood) Courtesy MGSC
2.0 PROJECT AND SITE DEVELOPMENT PLANNING
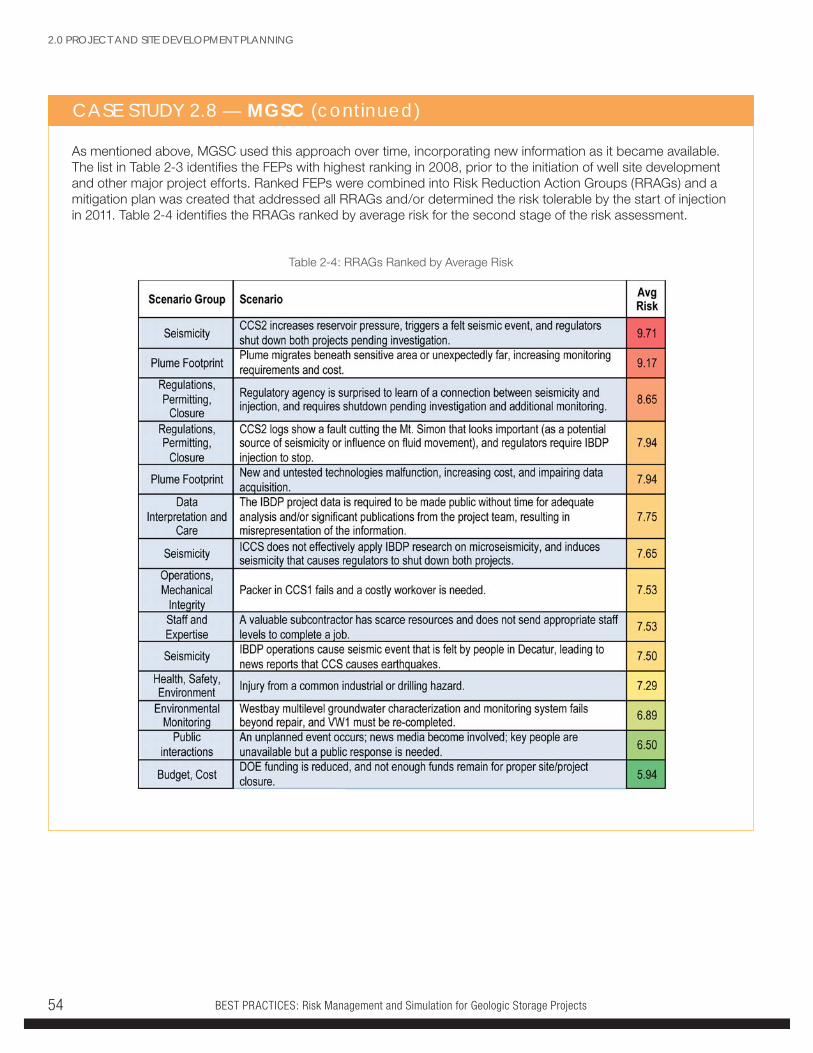
BEST PRACTICES: Risk Management and Simulation for Geologic Storage Projects54
CASE STUDY 2.8 — MGSC (continued)
As mentioned above, MGSC used this approach over time, incorporating new information as it became available. The list in Table 2-3 identifies the FEPs with highest ranking in 2008, prior to the initiation of well site development and other major project efforts. Ranked FEPs were combined into Risk Reduction Action Groups (RRAGs) and a mitigation plan was created that addressed all RRAGs and/or determined the risk tolerable by the start of injection in 2011. Table 2-4 identifies the RRAGs ranked by average risk for the second stage of the risk assessment.
Table 2-4: RRAGs Ranked by Average Risk
2.0 PROJECT AND SITE DEVELOPMENT PLANNING
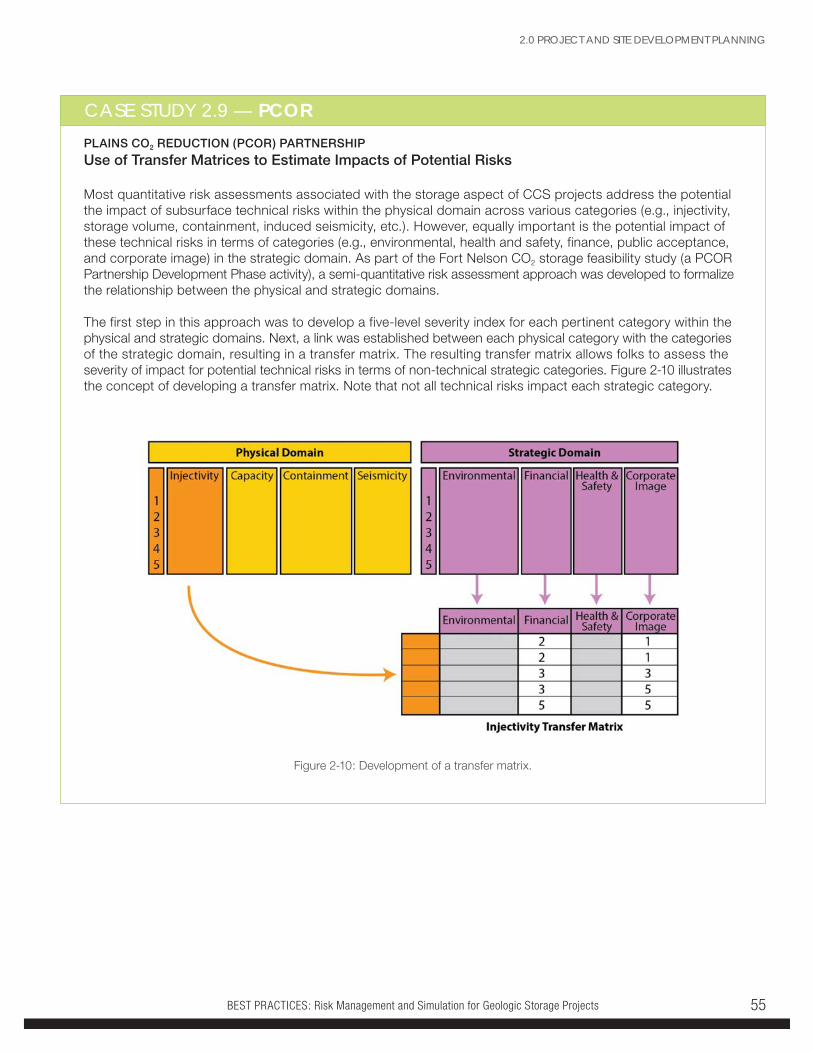
BEST PRACTICES: Risk Management and Simulation for Geologic Storage Projects 55
CASE STUDY 2.9 — PCORPLAINS CO2 REDUCTION (PCOR) PARTNERSHIP
Use of Transfer Matrices to Estimate Impacts of Potential Risks
Most quantitative risk assessments associated with the storage aspect of CCS projects address the potential the impact of subsurface technical risks within the physical domain across various categories (e.g., injectivity, storage volume, containment, induced seismicity, etc.). However, equally important is the potential impact of these technical risks in terms of categories (e.g., environmental, health and safety, finance, public acceptance, and corporate image) in the strategic domain. As part of the Fort Nelson CO2 storage feasibility study (a PCOR Partnership Development Phase activity), a semi-quantitative risk assessment approach was developed to formalize the relationship between the physical and strategic domains.
The first step in this approach was to develop a five-level severity index for each pertinent category within the physical and strategic domains. Next, a link was established between each physical category with the categories of the strategic domain, resulting in a transfer matrix. The resulting transfer matrix allows folks to assess the severity of impact for potential technical risks in terms of non-technical strategic categories. Figure 2-10 illustrates the concept of developing a transfer matrix. Note that not all technical risks impact each strategic category.
Figure 2-10: Development of a transfer matrix.
2.0 PROJECT AND SITE DEVELOPMENT PLANNING
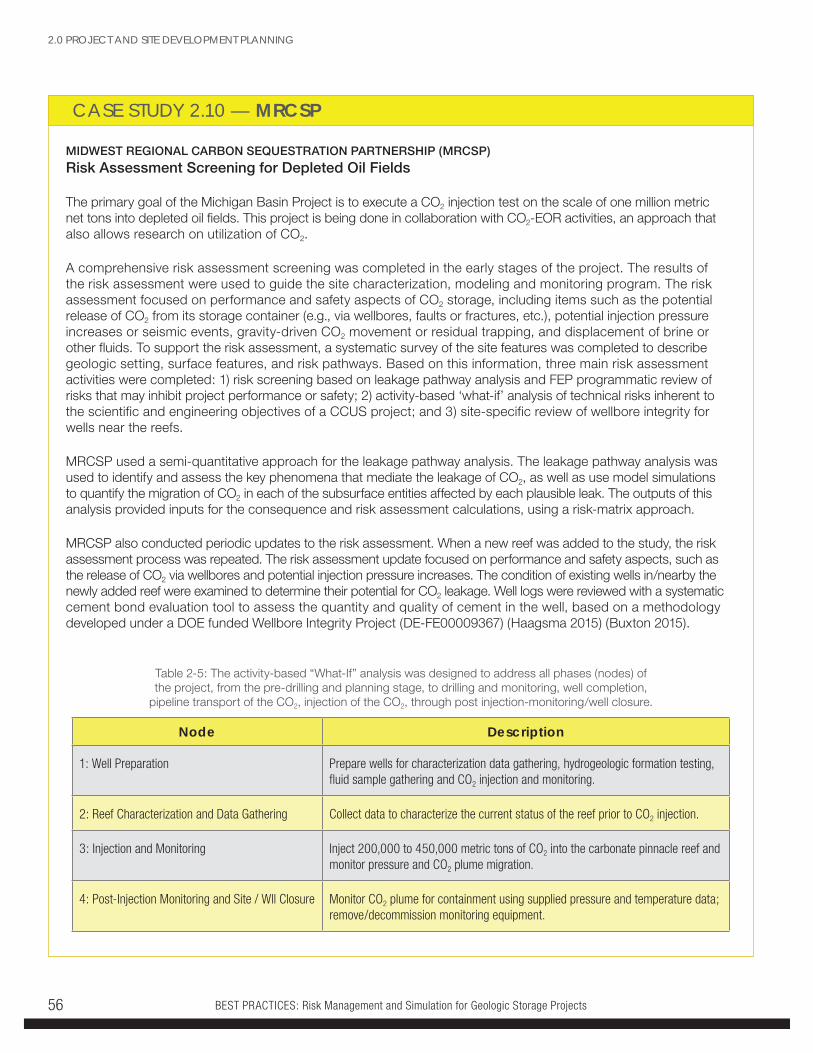
BEST PRACTICES: Risk Management and Simulation for Geologic Storage Projects56
CASE STUDY 2.10 — MRCSP
MIDWEST REGIONAL CARBON SEQUESTRATION PARTNERSHIP (MRCSP)
Risk Assessment Screening for Depleted Oil Fields
The primary goal of the Michigan Basin Project is to execute a CO2 injection test on the scale of one million metric net tons into depleted oil fields. This project is being done in collaboration with CO2-EOR activities, an approach that also allows research on utilization of CO2.
A comprehensive risk assessment screening was completed in the early stages of the project. The results of the risk assessment were used to guide the site characterization, modeling and monitoring program. The risk assessment focused on performance and safety aspects of CO2 storage, including items such as the potential release of CO2 from its storage container (e.g., via wellbores, faults or fractures, etc.), potential injection pressure increases or seismic events, gravity-driven CO2 movement or residual trapping, and displacement of brine or other fluids. To support the risk assessment, a systematic survey of the site features was completed to describe geologic setting, surface features, and risk pathways. Based on this information, three main risk assessment activities were completed: 1) risk screening based on leakage pathway analysis and FEP programmatic review of risks that may inhibit project performance or safety; 2) activity-based ‘what-if’ analysis of technical risks inherent to the scientific and engineering objectives of a CCUS project; and 3) site-specific review of wellbore integrity for wells near the reefs.
MRCSP used a semi-quantitative approach for the leakage pathway analysis. The leakage pathway analysis was used to identify and assess the key phenomena that mediate the leakage of CO2, as well as use model simulations to quantify the migration of CO2 in each of the subsurface entities affected by each plausible leak. The outputs of this analysis provided inputs for the consequence and risk assessment calculations, using a risk-matrix approach.
MRCSP also conducted periodic updates to the risk assessment. When a new reef was added to the study, the risk assessment process was repeated. The risk assessment update focused on performance and safety aspects, such as the release of CO2 via wellbores and potential injection pressure increases. The condition of existing wells in/nearby the newly added reef were examined to determine their potential for CO2 leakage. Well logs were reviewed with a systematic cement bond evaluation tool to assess the quantity and quality of cement in the well, based on a methodology developed under a DOE funded Wellbore Integrity Project (DE-FE00009367) (Haagsma 2015) (Buxton 2015).
Node Description
1: Well Preparation Prepare wells for characterization data gathering, hydrogeologic formation testing, fluid sample gathering and CO2 injection and monitoring.
2: Reef Characterization and Data Gathering Collect data to characterize the current status of the reef prior to CO2 injection.
3: Injection and Monitoring Inject 200,000 to 450,000 metric tons of CO2 into the carbonate pinnacle reef and monitor pressure and CO2 plume migration.
4: Post-Injection Monitoring and Site / Wll Closure Monitor CO2 plume for containment using supplied pressure and temperature data; remove/decommission monitoring equipment.
Table 2-5: The activity-based “What-If” analysis was designed to address all phases (nodes) of the project, from the pre-drilling and planning stage, to drilling and monitoring, well completion,
pipeline transport of the CO2, injection of the CO2, through post injection-monitoring/well closure.
2.0 PROJECT AND SITE DEVELOPMENT PLANNING
BEST PRACTICES: Risk Management and Simulation for Geologic Storage Projects 57
CASE STUDY 2.11 — BSCSP
BIG SKY CARBON SEQUESTRATION PARTNERSHIP (BCSP)
Use of a Hybrid Approach To Identify and Assess Project Risks
The use of more than one risk analysis tool can improve the overall risk assessment process. BSCSP used a two-pronged (FEP/non-FEP) risk approach to risk management for the development phase of the Kevin Dome project. A quantitative FEPs approach was initially performed at an in-person project kick-off meeting using the Quintessa database. The likelihood and severity of the impacts of each FEP was evaluated by team members in a facilitated workshop. Scenarios and treatments were later developed and entered into a risk management database to categorize, monitor, and track the information. This approach was extremely useful in identifying, cataloging, and quantitatively ranking potential project risks, particularly long-term risks. However, as the BSCSP project moved into its infrastructure development stage and began bringing on new partners and contractors, it was evident that the existing FEPs approach was too complex and time intensive to keep up with the project’s fast-paced field program. As a result, BSCSP developed a qualitative RMS that falls in line with the widely used “Plan-Do-Check-Adjust” management strategy. This method evaluates near-term tasks and management concerns as opposed to long-term scenarios that were captured in the original FEPs database. Key project personnel are asked to provide input, based on their experience, about the potential risks, treatment and “lessons-learned” for the project activity in which they are involved. The qualitative analysis greatly reduces the amount of time and effort needed to update and maintain the database, and the simplicity also encourages broader participation from project personnel.
The qualitative RMS is a virtual information-gathering tool, to identify risks for current and upcoming activities and recommend ways, or “treatments”, to reduce those risks. Treatments include hazard elimination, substitution, engineered controls, administrative or managerial controls, and personal protective equipment. The RMS tool is managed through a web-based Risk SharePoint site that is accessible by all BSCSP key project personnel. The Risk site allows team members to enter risk-related information from any location into a database that is easily recorded, managed, queried, and redistributed. The RMS can be adapted over-time by incorporating feedback from team members at regular intervals. This feedback is entered into a simple “Risk List” and includes (1) input on potential risks and treatments for upcoming tasks, (2) comments on ways to improve risk management for current tasks, and (3) lessons learned on tasks that have been recently completed. BSCSP management can then review and query entries associated with a particular activity (e.g., well drilling and completion) to ensure the risks and treatments are addressed during the activity’s planning process through field, operational, and/or management procedures and HSE field plans. This approach allows the BSCSP management team to continuously manage, monitor, and reduce the impacts of risks throughout the life of the project.
Unlike the quantitative FEPs approach to risk assessment, the qualitative RMS tool does not rank the severity or estimate the probability of a given risk from occurring. Rather the qualitative approach provides a straightforward way for project personnel to participate in the risk assessment process and provide risks and treatment examples that may have otherwise been missed or undervalued in a traditional FEP analysis. By using this hybrid approach, the BSCSP can maximize partner participation in the risk analysis process and leverage the benefits of both assessment systems to benefit the overall project.
2.0 PROJECT AND SITE DEVELOPMENT PLANNING
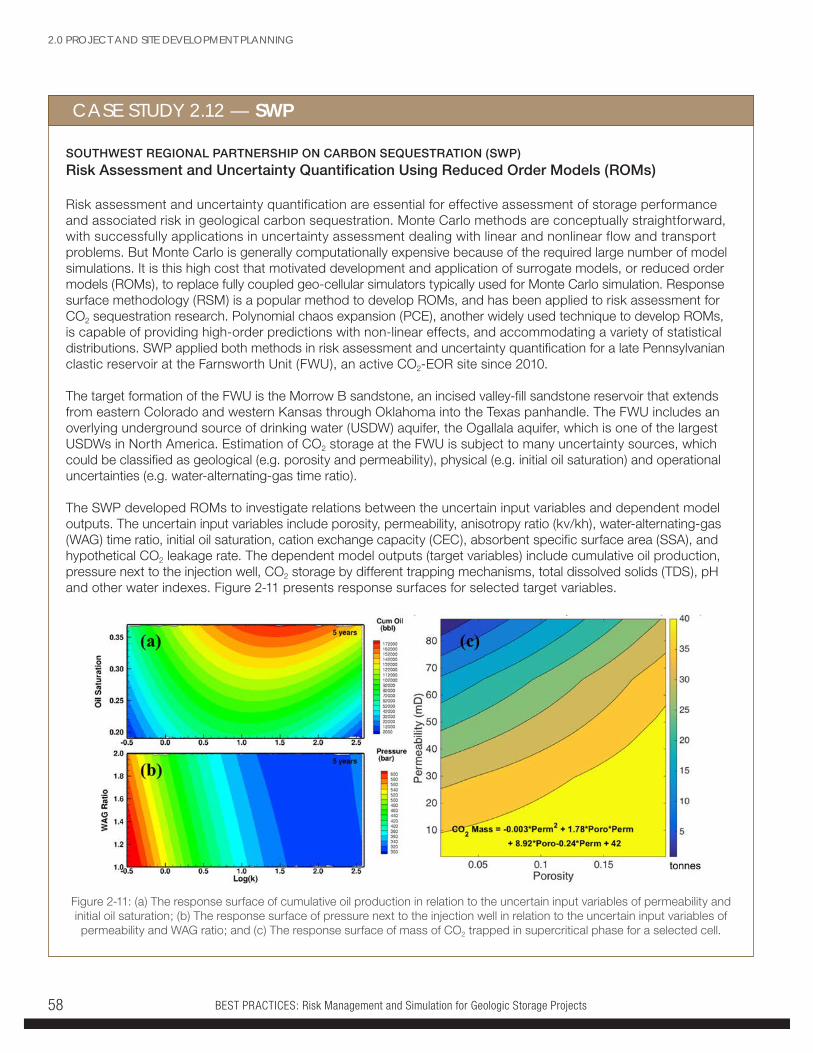
BEST PRACTICES: Risk Management and Simulation for Geologic Storage Projects58
CASE STUDY 2.12 — SWP
SOUTHWEST REGIONAL PARTNERSHIP ON CARBON SEQUESTRATION (SWP)
Risk Assessment and Uncertainty Quantification Using Reduced Order Models (ROMs)
Risk assessment and uncertainty quantification are essential for effective assessment of storage performance and associated risk in geological carbon sequestration. Monte Carlo methods are conceptually straightforward, with successfully applications in uncertainty assessment dealing with linear and nonlinear flow and transport problems. But Monte Carlo is generally computationally expensive because of the required large number of model simulations. It is this high cost that motivated development and application of surrogate models, or reduced order models (ROMs), to replace fully coupled geo-cellular simulators typically used for Monte Carlo simulation. Response surface methodology (RSM) is a popular method to develop ROMs, and has been applied to risk assessment for CO2 sequestration research. Polynomial chaos expansion (PCE), another widely used technique to develop ROMs, is capable of providing high-order predictions with non-linear effects, and accommodating a variety of statistical distributions. SWP applied both methods in risk assessment and uncertainty quantification for a late Pennsylvanian clastic reservoir at the Farnsworth Unit (FWU), an active CO2-EOR site since 2010.
The target formation of the FWU is the Morrow B sandstone, an incised valley-fill sandstone reservoir that extends from eastern Colorado and western Kansas through Oklahoma into the Texas panhandle. The FWU includes an overlying underground source of drinking water (USDW) aquifer, the Ogallala aquifer, which is one of the largest USDWs in North America. Estimation of CO2 storage at the FWU is subject to many uncertainty sources, which could be classified as geological (e.g. porosity and permeability), physical (e.g. initial oil saturation) and operational uncertainties (e.g. water-alternating-gas time ratio).
The SWP developed ROMs to investigate relations between the uncertain input variables and dependent model outputs. The uncertain input variables include porosity, permeability, anisotropy ratio (kv/kh), water-alternating-gas (WAG) time ratio, initial oil saturation, cation exchange capacity (CEC), absorbent specific surface area (SSA), and hypothetical CO2 leakage rate. The dependent model outputs (target variables) include cumulative oil production, pressure next to the injection well, CO2 storage by different trapping mechanisms, total dissolved solids (TDS), pH and other water indexes. Figure 2-11 presents response surfaces for selected target variables.
Figure 2-11: (a) The response surface of cumulative oil production in relation to the uncertain input variables of permeability and initial oil saturation; (b) The response surface of pressure next to the injection well in relation to the uncertain input variables of permeability and WAG ratio; and (c) The response surface of mass of CO2 trapped in supercritical phase for a selected cell.
2.0 PROJECT AND SITE DEVELOPMENT PLANNING
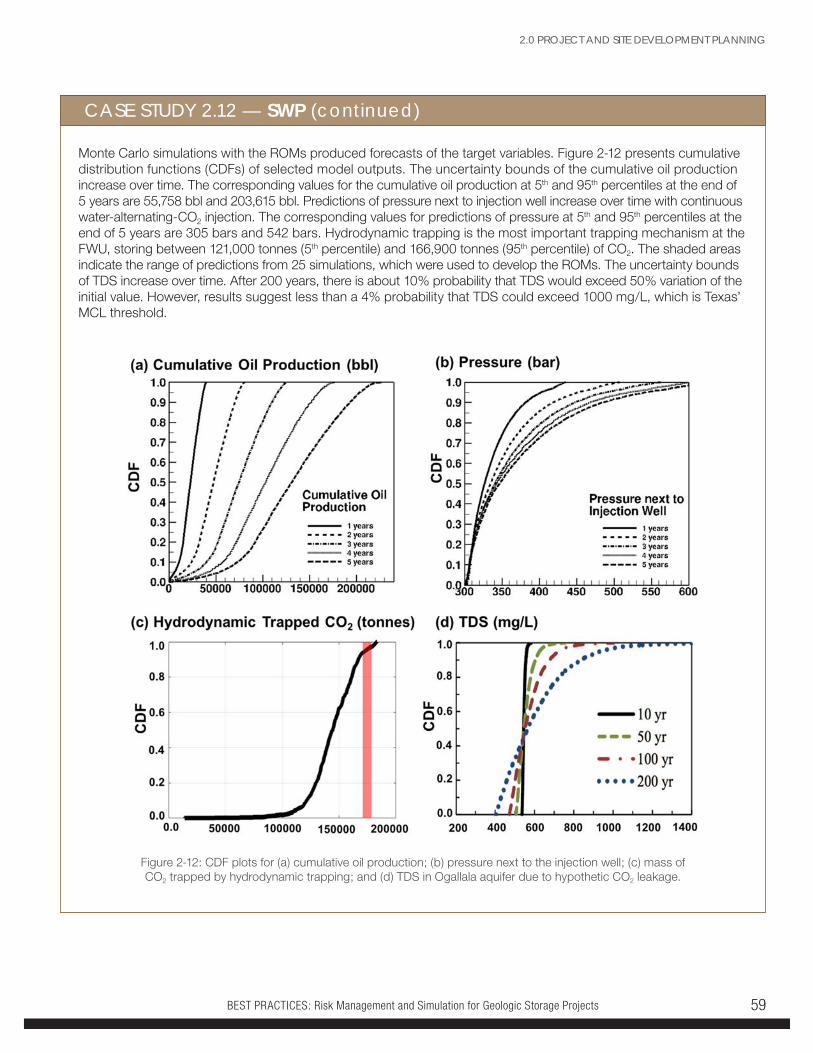
BEST PRACTICES: Risk Management and Simulation for Geologic Storage Projects 59
CASE STUDY 2.12 — SWP (continued)
Monte Carlo simulations with the ROMs produced forecasts of the target variables. Figure 2-12 presents cumulative distribution functions (CDFs) of selected model outputs. The uncertainty bounds of the cumulative oil production increase over time. The corresponding values for the cumulative oil production at 5th and 95th percentiles at the end of 5 years are 55,758 bbl and 203,615 bbl. Predictions of pressure next to injection well increase over time with continuous water-alternating-CO2 injection. The corresponding values for predictions of pressure at 5th and 95th percentiles at the end of 5 years are 305 bars and 542 bars. Hydrodynamic trapping is the most important trapping mechanism at the FWU, storing between 121,000 tonnes (5th percentile) and 166,900 tonnes (95th percentile) of CO2. The shaded areas indicate the range of predictions from 25 simulations, which were used to develop the ROMs. The uncertainty bounds of TDS increase over time. After 200 years, there is about 10% probability that TDS would exceed 50% variation of the initial value. However, results suggest less than a 4% probability that TDS could exceed 1000 mg/L, which is Texas’ MCL threshold.
Figure 2-12: CDF plots for (a) cumulative oil production; (b) pressure next to the injection well; (c) mass of CO2 trapped by hydrodynamic trapping; and (d) TDS in Ogallala aquifer due to hypothetic CO2 leakage.
2.0 PROJECT AND SITE DEVELOPMENT PLANNING
BEST PRACTICES: Risk Management and Simulation for Geologic Storage Projects60
CASE STUDY 2.13 — PCORPLAINS CO2 REDUCTION (PCOR) PARTNERSHIP
Adaptive Management Approach to Integrate Risk Management with Project Management
The PCOR Partnership uses an adaptive management approach as part of its Development Phase activities in order to integrate site characterization, modeling and simulation, and monitoring, verification, and accounting (MVA) measurements into risk assessment efforts. This process ensures that the most current site data are being used to inform the assessment.
For example, if a technical risk is lateral migration of CO2 beyond the Area of Review (AoR), then each activity of the adaptive management approach is used to evaluate this risk. The outcome of this integrated approach provides information to the subject matter experts (SMEs) as they score and rank the risk as part of the overall risk assessment. Continuing with the previous example of lateral migration of CO2:
• Site characterization data provide geologic and petrophysical (e.g., permeability and porosity) information about the reservoir and the overlying geologic seal, as well as the presence, orientation, and continuity of significant features such as fractures, faults or discontinuities. These characterization data are then used as input to the geologic model (geomodel), which is used to develop a three-dimensional (3-D), static representation of the storage complex.
• After the geomodel is developed, dynamic simulation is used to model the movement of fluids (CO2, oil, and/or formation water brine) throughout the reservoir and overlying strata in response to CO2 injection. Multiple realizations of these dynamic models are used to assess the model sensitivity to specific input parameters or assumptions. Collectively, these simulation results are used to map the maximum lateral extent of CO2 migration in the storage reservoir as a function of time since CO2 injection.
• The numerical simulation maps provide input to the SMEs during the risk assessment so that they may assess the likelihood of CO2 exceeding the boundaries of the AoR.
• As the geologic storage project progresses through the operational phase, MVA data become available for use in successive risk assessments. For example, if four-dimensional seismic (3-D seismic collected over time) shows CO2 movement within the storage reservoir that is consistent with the numerical simulation results, this validates the model and allows the SMEs to more confidently assign risk likelihoods during the next risk assessment(s). On the other hand, if movement exceeds the predictions of the numerical simulations, modifications to the models would be appropriate, providing a new basis upon which the SMEs would rely for the reassignment of the risk likelihoods.
2.0 PROJECT AND SITE DEVELOPMENT PLANNING
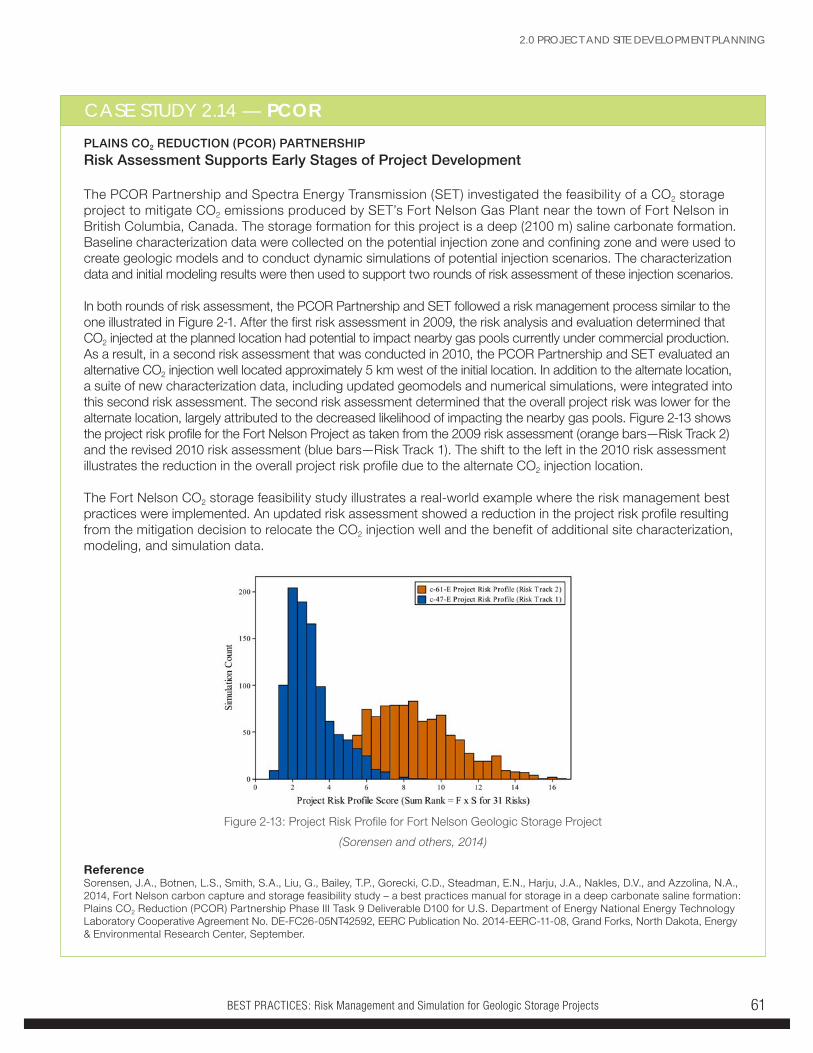
BEST PRACTICES: Risk Management and Simulation for Geologic Storage Projects 61
CASE STUDY 2.14 — PCORPLAINS CO2 REDUCTION (PCOR) PARTNERSHIP
Risk Assessment Supports Early Stages of Project Development
The PCOR Partnership and Spectra Energy Transmission (SET) investigated the feasibility of a CO2 storage project to mitigate CO2 emissions produced by SET’s Fort Nelson Gas Plant near the town of Fort Nelson in British Columbia, Canada. The storage formation for this project is a deep (2100 m) saline carbonate formation. Baseline characterization data were collected on the potential injection zone and confining zone and were used to create geologic models and to conduct dynamic simulations of potential injection scenarios. The characterization data and initial modeling results were then used to support two rounds of risk assessment of these injection scenarios.
In both rounds of risk assessment, the PCOR Partnership and SET followed a risk management process similar to the one illustrated in Figure 2-1. After the first risk assessment in 2009, the risk analysis and evaluation determined that CO2 injected at the planned location had potential to impact nearby gas pools currently under commercial production. As a result, in a second risk assessment that was conducted in 2010, the PCOR Partnership and SET evaluated an alternative CO2 injection well located approximately 5 km west of the initial location. In addition to the alternate location, a suite of new characterization data, including updated geomodels and numerical simulations, were integrated into this second risk assessment. The second risk assessment determined that the overall project risk was lower for the alternate location, largely attributed to the decreased likelihood of impacting the nearby gas pools. Figure 2-13 shows the project risk profile for the Fort Nelson Project as taken from the 2009 risk assessment (orange bars—Risk Track 2) and the revised 2010 risk assessment (blue bars—Risk Track 1). The shift to the left in the 2010 risk assessment illustrates the reduction in the overall project risk profile due to the alternate CO2 injection location.
The Fort Nelson CO2 storage feasibility study illustrates a real-world example where the risk management best practices were implemented. An updated risk assessment showed a reduction in the project risk profile resulting from the mitigation decision to relocate the CO2 injection well and the benefit of additional site characterization, modeling, and simulation data.
ReferenceSorensen, J.A., Botnen, L.S., Smith, S.A., Liu, G., Bailey, T.P., Gorecki, C.D., Steadman, E.N., Harju, J.A., Nakles, D.V., and Azzolina, N.A., 2014, Fort Nelson carbon capture and storage feasibility study – a best practices manual for storage in a deep carbonate saline formation: Plains CO2 Reduction (PCOR) Partnership Phase III Task 9 Deliverable D100 for U.S. Department of Energy National Energy Technology Laboratory Cooperative Agreement No. DE-FC26-05NT42592, EERC Publication No. 2014-EERC-11-08, Grand Forks, North Dakota, Energy & Environmental Research Center, September.
Figure 2-13: Project Risk Profile for Fort Nelson Geologic Storage Project
(Sorensen and others, 2014)
2.0 PROJECT AND SITE DEVELOPMENT PLANNING
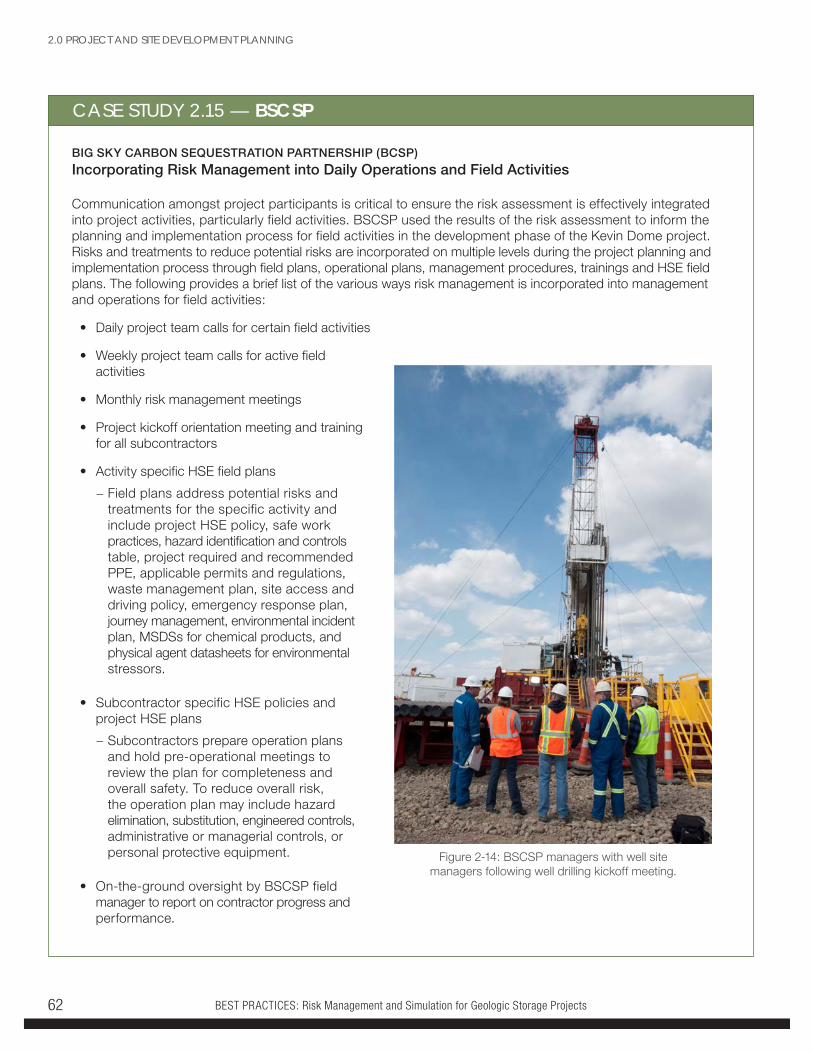
BEST PRACTICES: Risk Management and Simulation for Geologic Storage Projects62
CASE STUDY 2.15 — BSCSP
BIG SKY CARBON SEQUESTRATION PARTNERSHIP (BCSP)
Incorporating Risk Management into Daily Operations and Field Activities
Communication amongst project participants is critical to ensure the risk assessment is effectively integrated into project activities, particularly field activities. BSCSP used the results of the risk assessment to inform the planning and implementation process for field activities in the development phase of the Kevin Dome project. Risks and treatments to reduce potential risks are incorporated on multiple levels during the project planning and implementation process through field plans, operational plans, management procedures, trainings and HSE field plans. The following provides a brief list of the various ways risk management is incorporated into management and operations for field activities:
• Daily project team calls for certain field activities
• Weekly project team calls for active field activities
• Monthly risk management meetings
• Project kickoff orientation meeting and training for all subcontractors
• Activity specific HSE field plans
− Field plans address potential risks and treatments for the specific activity and include project HSE policy, safe work practices, hazard identification and controls table, project required and recommended PPE, applicable permits and regulations, waste management plan, site access and driving policy, emergency response plan, journey management, environmental incident plan, MSDSs for chemical products, and physical agent datasheets for environmental stressors.
• Subcontractor specific HSE policies and project HSE plans
− Subcontractors prepare operation plans and hold pre-operational meetings to review the plan for completeness and overall safety. To reduce overall risk, the operation plan may include hazard elimination, substitution, engineered controls, administrative or managerial controls, or personal protective equipment.
• On-the-ground oversight by BSCSP field manager to report on contractor progress and performance.
Figure 2-14: BSCSP managers with well site managers following well drilling kickoff meeting.
2.0 PROJECT AND SITE DEVELOPMENT PLANNING
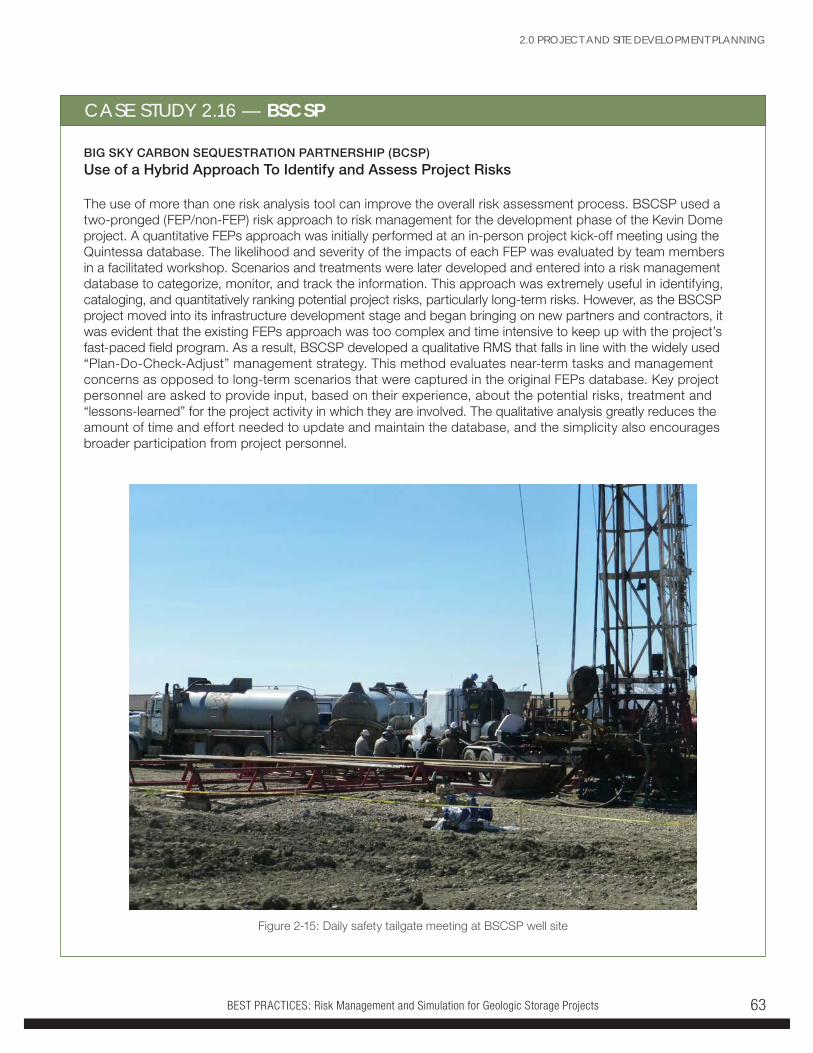
BEST PRACTICES: Risk Management and Simulation for Geologic Storage Projects 63
BIG SKY CARBON SEQUESTRATION PARTNERSHIP (BCSP)
Use of a Hybrid Approach To Identify and Assess Project Risks
The use of more than one risk analysis tool can improve the overall risk assessment process. BSCSP used a two-pronged (FEP/non-FEP) risk approach to risk management for the development phase of the Kevin Dome project. A quantitative FEPs approach was initially performed at an in-person project kick-off meeting using the Quintessa database. The likelihood and severity of the impacts of each FEP was evaluated by team members in a facilitated workshop. Scenarios and treatments were later developed and entered into a risk management database to categorize, monitor, and track the information. This approach was extremely useful in identifying, cataloging, and quantitatively ranking potential project risks, particularly long-term risks. However, as the BSCSP project moved into its infrastructure development stage and began bringing on new partners and contractors, it was evident that the existing FEPs approach was too complex and time intensive to keep up with the project’s fast-paced field program. As a result, BSCSP developed a qualitative RMS that falls in line with the widely used “Plan-Do-Check-Adjust” management strategy. This method evaluates near-term tasks and management concerns as opposed to long-term scenarios that were captured in the original FEPs database. Key project personnel are asked to provide input, based on their experience, about the potential risks, treatment and “lessons-learned” for the project activity in which they are involved. The qualitative analysis greatly reduces the amount of time and effort needed to update and maintain the database, and the simplicity also encourages broader participation from project personnel.
CASE STUDY 2.16 — BSCSP
Figure 2-15: Daily safety tailgate meeting at BSCSP well site
2.0 PROJECT AND SITE DEVELOPMENT PLANNING
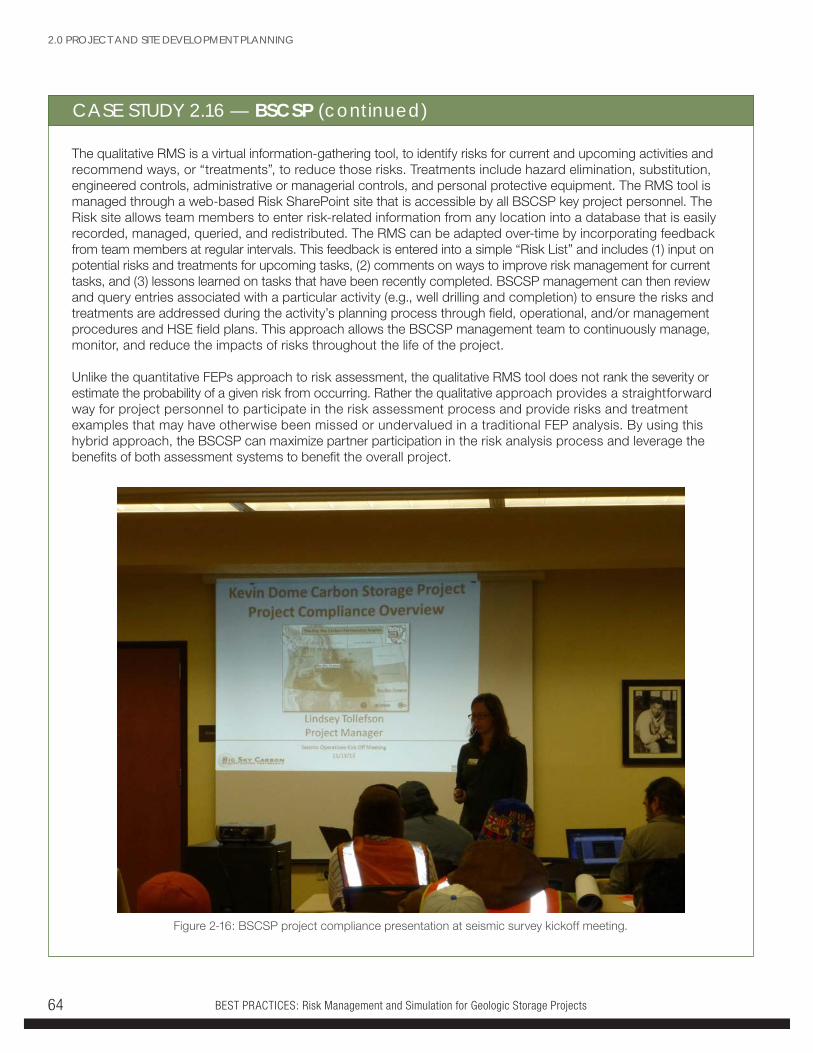
BEST PRACTICES: Risk Management and Simulation for Geologic Storage Projects64
The qualitative RMS is a virtual information-gathering tool, to identify risks for current and upcoming activities and recommend ways, or “treatments”, to reduce those risks. Treatments include hazard elimination, substitution, engineered controls, administrative or managerial controls, and personal protective equipment. The RMS tool is managed through a web-based Risk SharePoint site that is accessible by all BSCSP key project personnel. The Risk site allows team members to enter risk-related information from any location into a database that is easily recorded, managed, queried, and redistributed. The RMS can be adapted over-time by incorporating feedback from team members at regular intervals. This feedback is entered into a simple “Risk List” and includes (1) input on potential risks and treatments for upcoming tasks, (2) comments on ways to improve risk management for current tasks, and (3) lessons learned on tasks that have been recently completed. BSCSP management can then review and query entries associated with a particular activity (e.g., well drilling and completion) to ensure the risks and treatments are addressed during the activity’s planning process through field, operational, and/or management procedures and HSE field plans. This approach allows the BSCSP management team to continuously manage, monitor, and reduce the impacts of risks throughout the life of the project.
Unlike the quantitative FEPs approach to risk assessment, the qualitative RMS tool does not rank the severity or estimate the probability of a given risk from occurring. Rather the qualitative approach provides a straightforward way for project personnel to participate in the risk assessment process and provide risks and treatment examples that may have otherwise been missed or undervalued in a traditional FEP analysis. By using this hybrid approach, the BSCSP can maximize partner participation in the risk analysis process and leverage the benefits of both assessment systems to benefit the overall project.
CASE STUDY 2.16 — BSCSP (continued)
Figure 2-16: BSCSP project compliance presentation at seismic survey kickoff meeting.
2.0 PROJECT AND SITE DEVELOPMENT PLANNING
BEST PRACTICES: Risk Management and Simulation for Geologic Storage Projects 65
CASE STUDY 2.17 — SECARB
SOUTHEAST CARBON SEQUESTRATION PARTNERSHIP (SECARB) – CITRONELLE PROJECT
The Importance of Updating RMPs
SECARB’s iterative updating of the risk registry is an example of the periodic performance and update of the risk management plan. The intent of the updating of the risk registry is to re-familiarize the project partners (i.e., stakeholders) with the risk register, allow the group to express opinions about the risk register, identify any additional risk scenarios that were not captured in the initial risk register, and create a better understanding among the partners of project opportunities and risks and what actions are required to manage them. This process emphasizes risk reduction; that is, the process of reducing the total level of risk for each of four defined consequence categories: HSE protection, cost, reputation, and schedule. This process helps to manage the balancing act between the likelihood of risks occurring (e.g., certain/frequent, probable, possible, unlikely, and remote) with the consequences of the occurrence (e.g., slight, minor, moderate, severe, and persistent/severe). (See Case Study 2.6 for an illustration of the risk matrix.)
2.0 PROJECT AND SITE DEVELOPMENT PLANNING
BEST PRACTICES: Risk Management and Simulation for Geologic Storage Projects66
CASE STUDY 2.18 — PCOR
PLAINS CO2 REDUCTION (PCOR) PARTNERSHIP
Periodic Updates to Risk Assessments
The PCOR Partnership has conducted programmatic, as well as site-specific, risk assessments associated with its Development Phase efforts for the Fort Nelson and Bell Creek studies. These risk assessments have been updated periodically to include new data and the most recent project understanding. In general, this update process includes the following key series of steps:
• Convening a workgroup to solicit input from the SMEs on the current project risk register. These SMEs may be some of the same personnel who participated in prior risk assessments, or they may be new personnel who have recently joined the project team.
• Soliciting expert opinions from the workgroup regarding the existing project risk register to determine whether previous risks should still be considered, consolidated into other risks, or parsed into more than one risk, and whether any new risks should be added.
• Documenting modifications to the previous risk register to produce a revised final technical risk register.
• Re-scoring the risk frequency (probability) and severity (impact) using input from all workgroup attendees for all risks in the revised final technical risk register.
• Conducting a detailed data analysis of the responses, focusing on uncertainty (i.e., the variability of the scores across respondents for a particular risk) and changes in risk scores since the prior risk assessment. The generation of risk scores that differ from those of the prior risk assessment should be noted and explanations for these deviations should be explored.
• Reviewing the risk scores with the workgroup attendees and resolving any discrepancies or outliers.
• Mapping all risks using the new risk scores and identifying low-, medium-, or high-ranking risks.
Additional comments that were received during the risk scoring process from workgroup attendees should be documented so that feedback is captured for use in the next iteration of the risk assessment.
2.0 PROJECT AND SITE DEVELOPMENT PLANNING
BEST PRACTICES: Risk Management and Simulation for Geologic Storage Projects 67
3.0 BEST PRACTICES FOR NUMERIC SIMULATIONNumeric simulation uses computer codes to model the hydrologic, mechanical, and chemical processes associated with CO2 injection and movement in the deep subsurface. They are also used to model the behavior of pipelines, facilities, wells, shallow aquifers and the atmosphere, as well as the geomechanical response of the storage formation to the increase in pore pressure. The models developed through numeric simulation are used to replicate and predict the movement or behavior of CO2 once it is injected into the subsurface as well as the interaction of CO2 with the subsurface materials. Numeric simulations are also used to inform geologic storage project design, operations, and closure. These simulations serve as critical tools in risk analysis and are used to optimize monitoring design and facilitate more effective site characterization. This BPM summarizes the state-of-the-art of numeric simulation as applied to CO2 storage. The extensive work of the DOE RCSPs on the field pilot projects provides lessons learned on the application of multiple simulation techniques and tools at the various stages of CCS projects.
This section provides background information on the roles and types of numeric simulation and then outlines the following five overarching best practices for using numeric simulation to help manage geologic storage projects:
1. Determine simulations needs
2. Determine required physical processes, scale, complexity
3. Identify specific simulators and appropriate software
4. Gather input data and develop numeric model
5. Integrate numeric simulation with other project elements
3.1 KEY CONCEPTS: THE ROLES AND TYPES OF NUMERIC SIMULATION This section presents a brief overview of numeric simulation. It describes how and why models are used in all stages of a CCS project, and it describes the subsurface processes that can be modeled.
3.1.1 ROLE OF NUMERIC SIMULATION IN GEOLOGIC STORAGE PROJECTSNumeric simulation is used for several purposes. It assists with exploration and appraisal, project design, permitting, implementation issues, interpretation of monitoring data, and project closure. Models vary by project and by project phase. The model scale, model details, and extracted result metrics all depend on the project developers’ objectives and available data. Simulation also plays an important role in risk assessment because it is used to identify and characterize risks. Typically, modeling involves the input of team members with different areas of expertise and entails an integrated effort within the team.
3.1.2 TYPES OF SUBSURFACE PROCESSES THAT CAN BE MODELEDThe fundamental aspects of models of CO2 storage can be explained by using four basic physical subsurface processes:
i. Thermal and hydrologic
ii. Geomechanical
iii. Chemical
iv. Biological
BEST PRACTICES: Risk Management and Simulation for Geologic Storage Projects68
Thermal and hydrologic processes refer to the flow of heat and fluids (including water, oil, CO2 and other fluids and gases), and the pressure of the fluids. Geomechanical processes refer to the deformation and possible failure of rock in response to an applied load (the “load” of most common interest in geologic storage is the pressure in the fluids in the pores of the rock). Chemical processes relevant to subsurface CO2 storage include aqueous speciation, dissolution/precipitation, ion-exchange between solutions and minerals, and surface chemical reactions occurring at phase interfaces (i.e., surface complexation, sorption), as well as the effects of these processes on porosity and permeability. Biological processes include cellular and extracellular biomass production.
Numeric simulators that integrate two or more of these processes into one simulator are referred to, collectively, as THMCB simulators. How biological processes affect geologic storage and transport is currently unclear, but it is included in this discussion for the sake of completeness. THMCB numeric models are based on first principle relationships for conservation of mass, momentum, and energy. Added to these are phenomenological or empirical equations of state, kinematic conditions, transport laws, rate expressions, and other constitutive relationships that express the interdependencies between variables in the equations.
A numeric simulator that solves the equations for only one of the four processes (e.g., just geomechanical or thermal/hydrologic) is referred to as “uncoupled”. A simulator that solves the combined equations for more than one of the processes is referred to as a “coupled” simulator. “Coupled” is a non-specific term that encompasses many different interdependencies between physical processes, which may be represented in the combined equations, as well as different approaches for solving the equations. An example of interdependency between physical processes is the effect of stress on permeability; that is, the permeability of a reservoir may change as the state of stress changes. In an uncoupled thermal/hydrologic simulator, permeability is a constant value independent of the state of stress. In order for the effects of stress dependent permeability to be taken into account in the model, the geomechanical stress/strain equations must be solved along with the equations for fluid flow in the coupled simulator.
A variety of modifiers, including “partial,” “fully,” “weak,” “strong,” “one-way,” or “two-way,” are used to more specifically define the term “coupled.” However, for any specific simulator, a user should consult the accompanying documentation to determine exactly what “coupled” means for that simulator.
3.2 DETERMINE SIMULATION NEEDS The first Best Practice calls for determining the site-specific modeling needs for a geologic storage project. This section aims to help the project developer with that task by reviewing factors for consideration and sharing RCSP experiences.
Simulation can be used to support decision making at all stages of a geologic storage project. It may be used to guide choices related to project design such as economics, injection operations, monitoring operations, storage capacity, and storage integrity. In particular, they inform site characterization, risk management, and MVA in a geologic storage project. Simulation can clarify project design features and answer key questions such as:
• What is the injectivity at the site, and how many injection wells will be needed for project success?
• What will be the areal extent of the CO2 plume? How will it affect calculations of wellbore, fault, and caprock leakage risks?
• What is the areal extent of CO2 saturated formation water?
• What is the magnitude, rate of change, and extent (AoR) of injected CO2 pressure front movement?
• What is the expected rate, type, and extent of mineralization of the injected CO2?
• What injection rate schedule will maximize injectivity while avoiding cap-rock fracturing?
Each of these types of modeling efforts relies on a specific scale and set of physical processes requiring a corresponding type and level of detail of inputs.
Case Study 3.1, from the PCOR Partnership, used dynamic simulation to estimate the CO2 storage efficiency and other properties of the target storage reservoirs for several projects.
► See page 83
3.0 BEST PRACTICES FOR NUMERIC SIMULATION
BEST PRACTICES: Risk Management and Simulation for Geologic Storage Projects 69
3.3 DETERMINE REQUIRED PHYSICAL PROCESSES, SCALE, AND COMPLEXITYThis section reviews the considerations for determining what physical processes need to be simulated, and at what scale and complexity they need to be simulated to meet the project needs. Key factors include:
• Physical processes—As outlined in the preceding section, many interacting thermal, hydrologic (multi-phase flow), mechanical, chemical, and biologic (THMCB) processes can come into play when describing the impacts and fate of injected CO2, and examples described in the individual RCSP case studies illustrate the benefits which can come from the use of coupled, three-dimensional THMCB models. However, all processes (THMCB) may not require simulation for all stages of all projects, and practicality dictates that the degree of coupling in numeric simulation should be “fit for purpose,” in that every simulation of CO2 injection and storage need not include all phenomena. For example, there may be post-injection or closure scenarios when
Case Study 3.4 from SWP illustrates how they simulated a multi-phase flow and transport of injected CO2 for the Farnsworth Unit.
► See page 86
Case Study 3.3 from MRCSP illustrates the application of routine well operational data obtained from various operators to improve reservoir characterization in the region.
► See page 85
Case Study 3.2 from SECARB’s Citronelle Project shows how modeling can be used to inform project design. Data collected from an initial site characterization well and surface seismic acquisition provided the basis for determining the area of review and monitoring well placement in the CO2 injection zone.
► See page 84
geomechanical considerations are not important. The key to successful modeling endeavors is knowing how and when to include a subset of relevant phenomena, which may be on the basis of relevant time and length scale. Project developers should be selective based on needs, as discussed above, budget, and project schedule.
• Scale—both spatial and temporal - scale should consider far-, mid-, and near-field regions with varying grid-spacing (coarse to fine), determined by purpose and characterized reservoir extent. The time step and simulation time periods are strongly affected by the goals of the simulation, the degree of coupling modeled, the amount of CO2 injected, and the volume of the model domain.
• Purpose of simulation (as discussed above)—key for all considerations in the modeling process.
• Level of complexity—analytical calculations may be satisfactory for some purposes, but a range of complexity is possible from conceptual to very detailed, strongly coupled, 3D numeric models.
3.4 IDENTIFY SPECIFIC SIMULATORSMany simulators are designed for interoperability with other simulators or software packages. Considerable savings in time and software expense can be achieved by selecting a suite of software products designed for the specific purpose. For example, a single software vendor may offer a geological static modeling program, hydrologic modeling program, and geomechanical modeling program that read and write commonly understood files with a minimum of translation effort. This may be an effective option if the cost and available program features are acceptable. Some simulator files from different vendors can be read or translated to each other with a moderate amount of effort and good reliability, while other software combinations may prove to be problematic. Therefore, processes to be simulated, the level of detail, the interoperability of the software, and the combined cost are important factors to consider thoroughly in the selection process.
Case Study 3.5 from MGSC illustrates how small scale features can have a large impact on CO2 plume movement.
► See page 89
3.0 BEST PRACTICES FOR NUMERIC SIMULATION
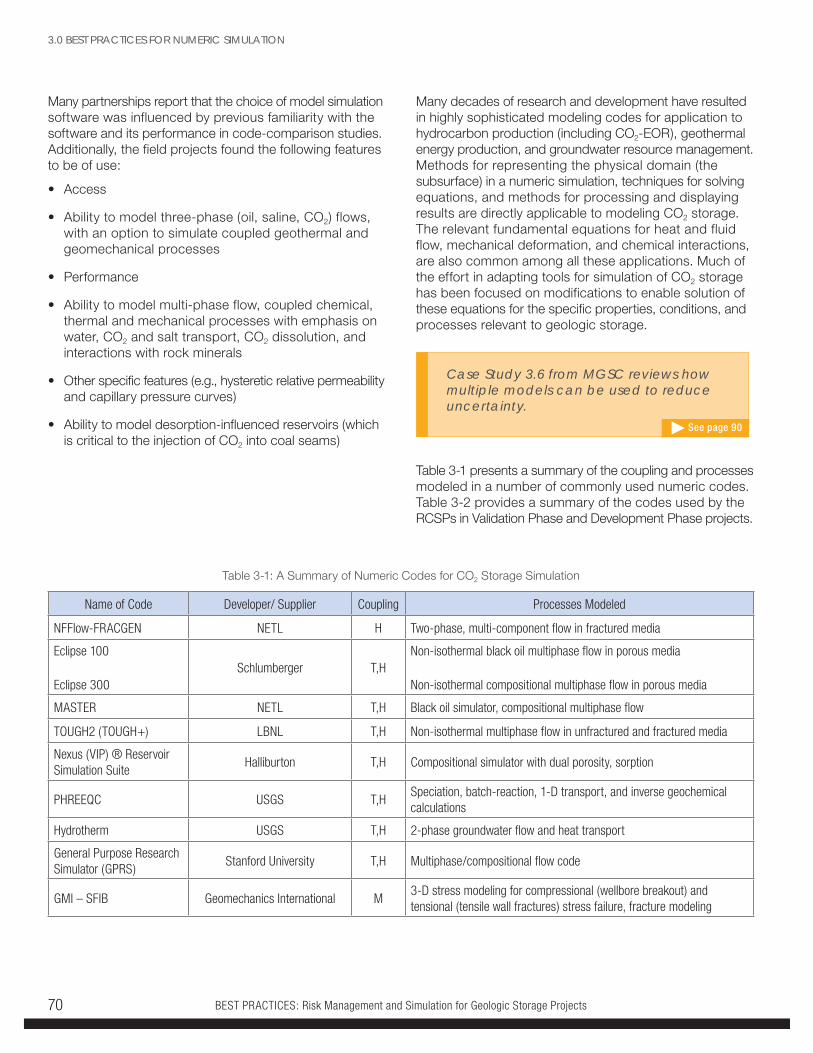
BEST PRACTICES: Risk Management and Simulation for Geologic Storage Projects70
Many partnerships report that the choice of model simulation software was influenced by previous familiarity with the software and its performance in code-comparison studies. Additionally, the field projects found the following features to be of use:
• Access
• Ability to model three-phase (oil, saline, CO2) flows, with an option to simulate coupled geothermal and geomechanical processes
• Performance
• Ability to model multi-phase flow, coupled chemical, thermal and mechanical processes with emphasis on water, CO2 and salt transport, CO2 dissolution, and interactions with rock minerals
• Other specific features (e.g., hysteretic relative permeability and capillary pressure curves)
• Ability to model desorption-influenced reservoirs (which is critical to the injection of CO2 into coal seams)
Table 3-1: A Summary of Numeric Codes for CO2 Storage Simulation
Name of Code Developer/ Supplier Coupling Processes Modeled
NFFlow-FRACGEN NETL H Two-phase, multi-component flow in fractured media
Eclipse 100
Eclipse 300Schlumberger T,H
Non-isothermal black oil multiphase flow in porous media
Non-isothermal compositional multiphase flow in porous media
MASTER NETL T,H Black oil simulator, compositional multiphase flow
TOUGH2 (TOUGH+) LBNL T,H Non-isothermal multiphase flow in unfractured and fractured media
Nexus (VIP) ® Reservoir Simulation Suite
Halliburton T,H Compositional simulator with dual porosity, sorption
PHREEQC USGS T,HSpeciation, batch-reaction, 1-D transport, and inverse geochemical calculations
Hydrotherm USGS T,H 2-phase groundwater flow and heat transport
General Purpose Research Simulator (GPRS)
Stanford University T,H Multiphase/compositional flow code
GMI – SFIB Geomechanics International M3-D stress modeling for compressional (wellbore breakout) and tensional (tensile wall fractures) stress failure, fracture modeling
Many decades of research and development have resulted in highly sophisticated modeling codes for application to hydrocarbon production (including CO2-EOR), geothermal energy production, and groundwater resource management. Methods for representing the physical domain (the subsurface) in a numeric simulation, techniques for solving equations, and methods for processing and displaying results are directly applicable to modeling CO2 storage. The relevant fundamental equations for heat and fluid flow, mechanical deformation, and chemical interactions, are also common among all these applications. Much of the effort in adapting tools for simulation of CO2 storage has been focused on modifications to enable solution of these equations for the specific properties, conditions, and processes relevant to geologic storage.
Table 3-1 presents a summary of the coupling and processes modeled in a number of commonly used numeric codes. Table 3-2 provides a summary of the codes used by the RCSPs in Validation Phase and Development Phase projects.
Case Study 3.6 from MGSC reviews how multiple models can be used to reduce uncertainty.
► See page 90
3.0 BEST PRACTICES FOR NUMERIC SIMULATION
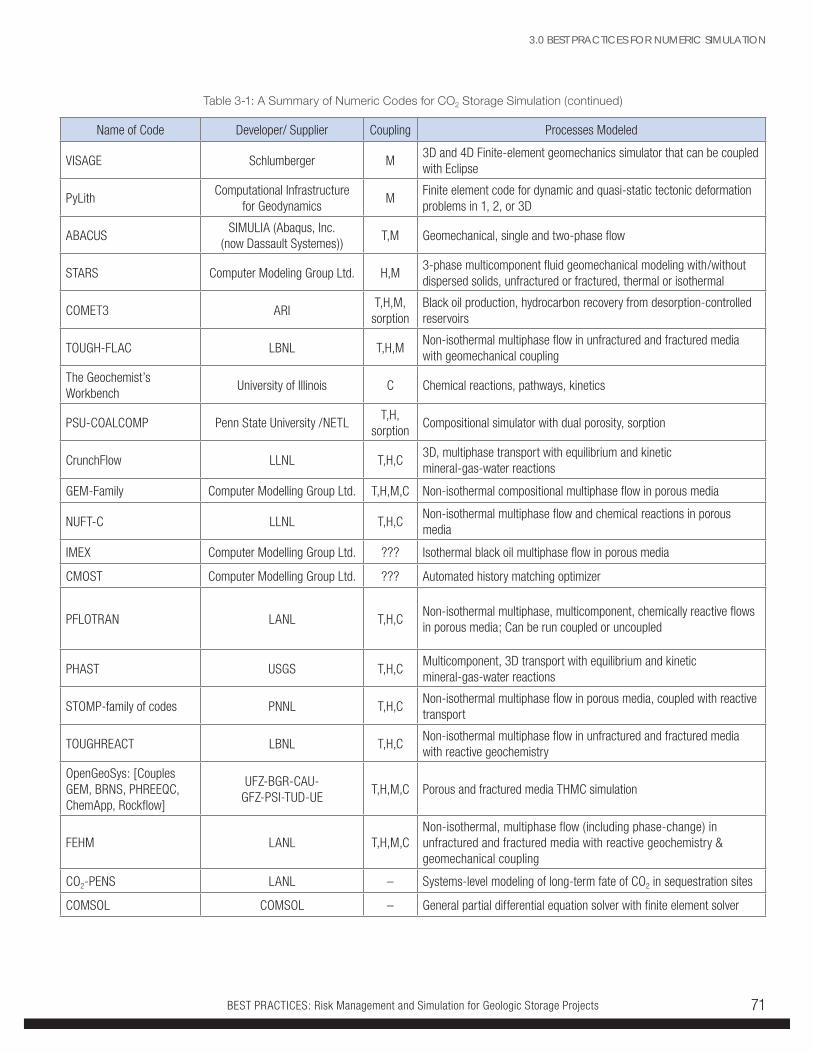
BEST PRACTICES: Risk Management and Simulation for Geologic Storage Projects 71
Name of Code Developer/ Supplier Coupling Processes Modeled
VISAGE Schlumberger M3D and 4D Finite-element geomechanics simulator that can be coupled with Eclipse
PyLithComputational Infrastructure
for GeodynamicsM
Finite element code for dynamic and quasi-static tectonic deformation problems in 1, 2, or 3D
ABACUSSIMULIA (Abaqus, Inc.
(now Dassault Systemes))T,M Geomechanical, single and two-phase flow
STARS Computer Modeling Group Ltd. H,M3-phase multicomponent fluid geomechanical modeling with/without dispersed solids, unfractured or fractured, thermal or isothermal
COMET3 ARIT,H,M,
sorptionBlack oil production, hydrocarbon recovery from desorption-controlled reservoirs
TOUGH-FLAC LBNL T,H,MNon-isothermal multiphase flow in unfractured and fractured media with geomechanical coupling
The Geochemist’s Workbench
University of Illinois C Chemical reactions, pathways, kinetics
PSU-COALCOMP Penn State University /NETLT,H,
sorptionCompositional simulator with dual porosity, sorption
CrunchFlow LLNL T,H,C3D, multiphase transport with equilibrium and kinetic mineral-gas-water reactions
GEM-Family Computer Modelling Group Ltd. T,H,M,C Non-isothermal compositional multiphase flow in porous media
NUFT-C LLNL T,H,CNon-isothermal multiphase flow and chemical reactions in porous media
IMEX Computer Modelling Group Ltd. ??? Isothermal black oil multiphase flow in porous media
CMOST Computer Modelling Group Ltd. ??? Automated history matching optimizer
PFLOTRAN LANL T,H,CNon-isothermal multiphase, multicomponent, chemically reactive flows in porous media; Can be run coupled or uncoupled
PHAST USGS T,H,CMulticomponent, 3D transport with equilibrium and kinetic mineral-gas-water reactions
STOMP-family of codes PNNL T,H,CNon-isothermal multiphase flow in porous media, coupled with reactive transport
TOUGHREACT LBNL T,H,CNon-isothermal multiphase flow in unfractured and fractured media with reactive geochemistry
OpenGeoSys: [Couples GEM, BRNS, PHREEQC, ChemApp, Rockflow]
UFZ-BGR-CAU- GFZ-PSI-TUD-UE
T,H,M,C Porous and fractured media THMC simulation
FEHM LANL T,H,M,CNon-isothermal, multiphase flow (including phase-change) in unfractured and fractured media with reactive geochemistry & geomechanical coupling
CO2-PENS LANL – Systems-level modeling of long-term fate of CO2 in sequestration sites
COMSOL COMSOL – General partial differential equation solver with finite element solver
Table 3-1: A Summary of Numeric Codes for CO2 Storage Simulation (continued)
3.0 BEST PRACTICES FOR NUMERIC SIMULATION
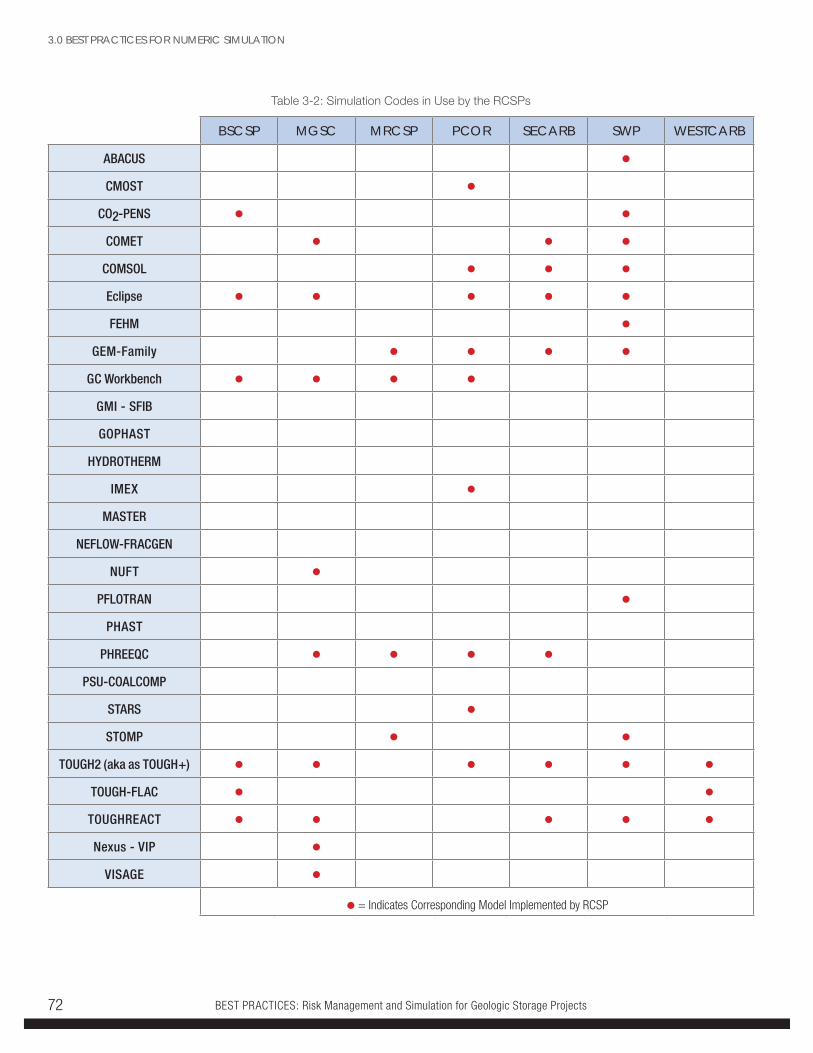
BEST PRACTICES: Risk Management and Simulation for Geologic Storage Projects72
Table 3-2: Simulation Codes in Use by the RCSPs
BSCSP MGSC MRCSP PCOR SECARB SWP WESTCARB
ABACUS •CMOST •
CO2-PENS • •COMET • • •
COMSOL • • •Eclipse • • • • •FEHM •
GEM-Family • • • •GC Workbench • • • •
GMI - SFIB
GOPHAST
HYDROTHERM
IMEX •MASTER
NEFLOW-FRACGEN
NUFT •PFLOTRAN •
PHAST
PHREEQC • • • •PSU-COALCOMP
STARS •STOMP • •
TOUGH2 (aka as TOUGH+) • • • • • •TOUGH-FLAC • •TOUGHREACT • • • • •Nexus - VIP •
VISAGE •
• = Indicates Corresponding Model Implemented by RCSP
3.0 BEST PRACTICES FOR NUMERIC SIMULATION
BEST PRACTICES: Risk Management and Simulation for Geologic Storage Projects 73
3.4.1 SIMULATORS FOR THERMAL AND HYDROLOGIC PROCESSESModeling heat transfer and multi-phase flow aspects of CO2 behavior in the subsurface is a primary component of numeric simulation, and is used to address issues such as AoR delineation and monitoring well location. This modeling also provides predictions of the extent of the CO2 plume in the subsurface at a given point in time. One input to the solution of the coupled TH equations is capillary pressure, which represents the force required to pass a non-wetting phase (CO2 or oil) through the pore space. Capillary pressure and relative permeability data represent two of the inputs critical to modeling multi-phase hydrologic processes. Because plume migration also depends upon calculation of the amount of CO2 trapped in the residual phase, the codes also incorporate complex hysteretic capillary pressure behavior.
Some geologic storage processes may be represented by analytic, semi-analytic, or simplified numeric solutions for fluid flow. Such approaches (see for example, Celia and Nordbotten, 2010, and references cited therein) are useful to study basin-wide flows and wellbore leakage, and to obtain quick estimates of the rates of CO2 transport. These approaches may also be used as components for probabilistic risk assessment.
Many of the TH codes have been tested, compared, and benchmarked against other codes for geologic storage simulation in code comparison studies (Oldenburg 2004), (Pruess 2004).
3.4.2 SIMULATORS FOR GEOMECHANICAL PROCESSESCO2 injection will increase pore pressure in the storage reservoir, which potentially could cause the rock to fracture or pre-existing fractures or faults to move, affecting storage integrity. Therefore, numeric models of coupled hydrologic-geomechanical processes are vital for evaluating the potential for FEPs, such as overpressures, migration through in situ fracture networks, fracture generation, and induced seismicity. In broadest terms, geomechanical processes include effects of fluid pressure, elastic and non-recoverable deformation, fracture opening and closing, and larger-scale faulting. Coupling of geomechanics with other processes in numeric simulations of geologic storage is accomplished mainly through an analysis of fluid pressure and the effects of deformation on absolute and relative permeability.
Deformations may be elastic (linear response to subsurface pressure), or inelastic (irreversible). Small, reversible deformation in porous media is represented using the linear theory of poroelasticity. This relates mean stress to excess pore pressure, which is controlled by hydrogeologic and thermal processes. Applications of poroelastic formulations for rock deformation are discussed by several researchers (Ge 1992), (McPherson 1999), and (Person 1996). In contrast, inelastic deformation (which includes plasticity and creep) results in irreversible changes in the subsurface. Pore collapse due to fluid drainage, and opening of local fractures due to tectonic stress, are some examples of inelastic deformation. Inelastic deformation is modeled using “cap plasticity models,”3 implemented in commercial software such as ABAQUS™ and FLAC3D™. In clay-bearing confining zones, the coupling between flow, mechanical, and chemical processes is exemplified by physical phenomena with potential implications for geomechanical integrity, such as dry-out, clay swelling or shrinkage via interactions with the injected fluids and displaced brines. In such cases, the shale confining zone deformation can be strongly coupled to multiphase flow, thermal effects, and chemical reactive transport (Borja, 2004).
Fault rupture is another example of an inelastic change in the subsurface that may result from coupled hydrologic-geomechanical processes. CO2 injection may increase the pore pressure in a reservoir, which may affect the stability of preexisting faults and fractures. In cases where pore pressure exceeds in situ stresses on faults or fractures, slippage may occur. When such slippage or rupture is caused by human activities like fluid injection, it is referred to as induced seismicity.
Several recent studies have focused on the potential for induced seismicity associated with injection, and preliminary results of these studies are encouraging. TOUGH-FLAC, a coupled T-H-M simulator, was used to calculate maximum injection pressures beyond which shear-slip is likely to occur (Rutqvist 2009). In addition, a multiphase flow simulator, known as STOMP, was combined with deformation and stress analysis using ABAQUS® to assess the potential for fault slip in injection settings. Earthquake simulators, such as OpenSHA or RSQSim, may also be coupled to a given hydrologic model. Several site-specific modeling studies predicting the potential for fault reactivation during CO2 injection are noted by Rutqvist (Rutqvist 2012).
3 Note that “cap plasticity model” need not be confined, or related to “caprock.”
3.0 BEST PRACTICES FOR NUMERIC SIMULATION
BEST PRACTICES: Risk Management and Simulation for Geologic Storage Projects74
These examples are consistent with recommendations made by the National Research Council (NRC) in 2012, which proposed developing coupled geomechanical and earthquake simulation models to understand factors controlling induced seismicity. The NRC also recommended the development of models to estimate potential earthquake magnitudes that could be induced by large-scale CO2 injection. Further, NRC proposed the development of detailed physicochemical and fluid mechanical models for predicting induced seismicity resulting from the injection of supercritical CO2 into saline formations.
3.4.3 SIMULATORS FOR GEOCHEMICAL PROCESSESA study of rock-CO2-formation fluid chemical interactions is relevant to assess storage integrity, to evaluate injected CO2 behavior, and to guide monitoring efforts during and after injection. Some of the storage integrity issues that can be addressed by reactive transport modeling of CO2 and other fluid flow in the subsurface include: confinement in the injection zone; CO2 partitioning into the rock and fluid phases via mineralization and dissolution; potential impacts to groundwater from CO2 leakage; and, storage integrity.
Various codes are available to model chemical processes in the subsurface, including equilibrium models, path-of-reaction models, kinetic models, and coupled reactive transport models. Equilibrium models rely on thermodynamic and physical property data to calculate the chemical species in the solid phase (minerals), gaseous phase, and in solution (supercritical CO2, water). Path-of-reaction models determine the equilibrium speciation, but they additionally indicate the intermediate species formed in the series of chemical reactions leading up to equilibrium.
Kinetic models incorporate the rates of heterogeneous chemical reactions (e.g., solid-gas, solid-liquid, and gas-liquid), which occur more slowly than reactions involving chemical species in solution/same phase (homogeneous reactions). Equilibrium, path-of-reaction, and kinetic modeling codes, such as Geochemist’s Workbench, PATHARC, and SOLMINEQ, do not account for the migration of CO2 in the storage formation and are essentially closed-system or “batch” models. In contrast, reactive transport models incorporate the coupling between CO2 transport and chemical reaction. They are more computationally intensive, because the addition
of even a single reaction to the set of equations adds multiple variables and associated degrees of freedom. To some extent, the number of variables may be reduced by expressing a subset of chemical species (secondary species) in terms of the primary chemical components. However, the relatively coarser grids used in reservoir hydrogeologic and geothermal simulators may not capture the fine-scale reaction fronts and chemical gradients that arise in subsurface engineering scenarios. Given the disparate size and time scales among the THMCB processes, methods for using different grids, or using nesting or adaptive grids, have been explored and may be necessary for coupled reactive transport codes such as PFLOTRAN, NUFT, CRUNCH, PHAST, and TOUGHREACT.
Chemical processes relevant to subsurface CO2 storage include aqueous speciation, dissolution/precipitation, microbial-mediated redox reactions, ion-exchange between solutions and minerals, and surface chemical reactions occurring at phase interfaces (i.e., surface complexation, sorption), as well as the effects of these processes on porosity and permeability, coupling with mechanical effects (e.g., water-assisted creep and crack growth; fracture healing, clay mineral swelling). Further, transport processes involved in multiphase reactive flow include advection, dispersion, and multicomponent diffusion. Because of these inherent complexities, the following factors should be considered when choosing a model: time and length scales under consideration, reactive buffering capacity (e.g., of gases and minerals), limitations on thermodynamic and kinetic data for the system in question, options for model validation, geochemical and biological processes, and what can be excluded from consideration.
3.4.4 SIMULATORS FOR BIOLOGICAL PROCESSESResearch is needed regarding the specific conditions under which microbial processes affect geologic storage to better understand the THMCB couplings governing the ultimate behavior of injected CO2. The activities of microorganisms can have a considerable chemical and physical impact on subsurface environments. In the context of CO2 storage, cellular and extracellular biomass production can clog pores in the subsurface, leading to decreased permeability (Taylor 1990). Microorganisms can also affect permeability by driving mineral dissolution and precipitation. This is an area for further investigation.
3.0 BEST PRACTICES FOR NUMERIC SIMULATION
BEST PRACTICES: Risk Management and Simulation for Geologic Storage Projects 75
3.5 COLLECT INPUT DATA AND BUILD NUMERIC MODEL
3.5.1 INPUT DATA REQUIREMENTS AND SOURCESA geologic model (often referred to as the “static” model) forms the basis for risk analysis and numeric simulation (often referred to as the “dynamic” model). The geologic model depicts the storage formation, the confining zone, and the lithologies of the rocks overlying the confining zones up to the surface of the Earth. The model shows the thickness of the various lithologies, and their structure (dip, folding, etc.), and contains information on the relevant THMCB properties of the rocks and contained fluids. The geologic model is not static, but evolves throughout the life of the storage project as more data helps improve the understanding of the subsurface system. Development of the geologic model begins during site screening and selection and is the focus of detailed studies carried out during site characterization. During the operational phase of a project, the model is updated based on monitoring measurements. The DOE BPMs for Site Screening, Site Selection, and Site Characterization for Geologic Storage Projects and Monitoring, Verification, and Accounting (MVA) for Geologic Storage Projects describe the use of various characterization techniques to select a site for CO2 injection and develop the geologic model for that site. The BPM Monitoring, Verification, and Accounting (MVA) for Geologic Storage Projects, also describes techniques and approaches for measuring data used to update the geologic mode.
Any numeric simulations of CO2 flow in porous media should accurately account for the hydraulic, thermal, mechanical, and chemical properties of the fluids (brine, CO2, hydrocarbons), within the injection and confining zones.
Data requirements fall into four primary categories as described in the following subsections:
• Reservoir and rock properties
• Fluid properties
• Existing well infrastructure
• Field history (historical production/ injection)
3.5.1.1 RESERVOIR AND ROCK PROPERTIES Reservoir and rock properties are estimated by reviewing data that provides information on porosity, permeability, relative permeability, capillary pressures, fluid saturation, mechanical properties, and mineralogy. To develop the input parameters for their numeric simulations, modelers must average data over spatial areas or rely on factors developed in the literature. These parameters can be calibrated as more data are collected to improve the confidence in the predictions resulting from the models.
Porosity is a measure of the void space within the rock that fluids or gases may occupy. A variety of techniques including well/wireline logs (e.g., neutron, density, and sonic), core analyses, and thin-section analysis may be employed to measure porosity. Information on porosity is also obtained from in situ hydrologic measurements and seismic survey results. It is important to calibrate results obtained through wireline logs and core measurements as more data becomes available. Some methods of examination may estimate the distribution of pore sizes at high resolution, or identify porosity-mineralogy relationships. The resulting data produces estimates that vary from pore to near-borehole to reservoir-scale resolution.
Permeability refers to the flow rate of a single fluid under a specific pressure regime known as hydraulic head. Permeability may be measured using core plugs, hydrologic tests (long-term pumping tests, drill stem tests), or estimated from wireline logs. By calibrating the results obtained from wireline logs and core analyses, modelers can increase their confidence in estimating permeability for the formation; this is known as history matching. Additional permeability measurements may examine heterogeneity in the vertical and horizontal directions, through fractures, or with different viscosity fluids.
Case Study 3.7 from SECARB’s Citronelle Project illustrates the importance of developing data collection redundancy as part of the MVA efforts. Having duplicative data collection options ensures that data will not be lost during routine equipment maintenance or failure and can be used to check conflicting data.
► See page 93
3.0 BEST PRACTICES FOR NUMERIC SIMULATION
BEST PRACTICES: Risk Management and Simulation for Geologic Storage Projects76
Relative permeability is a concept in which two immiscible fluids (e.g., oil and brine, CO2 and brine) must share the same pore space available for flow. The flow rate of each phase is therefore reduced relative to what it would be in the absence of the other phase. This phenomenon is strongly related to the saturation of each fluid, but it also involves pore size, capillary pressure, and interfacial tension of the reservoir rock. Relative permeability curves are estimated using lab measurements on cores, core analysis data, or from the literature.
Capillary pressures and the related measurements of interfacial tension are properties that describe the surface tension of a fluid spanning a pore throat and the pressure required to penetrate a second phase through that pore throat. Measurements are made on cores and values inferred from wireline log analyses, but capillary pressure curves are commonly estimated from literature. Wettability (core-scale) can also be determined from literature, however, the evolution of wettability upon prolonged CO2 exposure is still not well understood.
Fluid saturation refers to the percentage of the pore space occupied by each fluid within the reservoir. Subsurface rocks naturally contain some amount of fluid (water, brine, oil and/or gas) that must be compressed or displaced to accept injected CO2. The CO2 will not displace 100 percent of the native fluid(s), and the amount that remains is referred to as the irreducible saturation of that phase. The maximum CO2 saturation that can be attained (the difference between porosity and irreducible saturation of other phase) strongly reflects the physical trap volume in a reservoir and is often inferred from water flood literature, field observations, historic reservoir data, or lab measurements. Oil, gas, and water/brine irreducible saturation can be estimated from operator core analysis, measured in the lab, or estimated from literature. Hysteresis (a measurement of residual trapping) is a less common calculation, but may be determined from field observations and/or literature.
Mineralogy is the chemical composition of rock formations and is critical to the long-term storage of CO2. Mineralogy is typically determined by wireline logs, thin-section/petrographic analysis, x-ray diffraction (XRD), x-ray fluorescence (XRF) studies on drill cuttings, and core samples. Other tests, such as ion chromatography, may be performed on fluid samples. Mineralogy is very important to consider when both modeling and simulating a reservoir because chemical reactions between the fluids and the minerals can affect each of the reservoir properties listed above.
Fracture gradient and mechanical properties, such as stress-strain relationships, are commonly calculated from laboratory measurements, inferred from wireline logs, or estimated from literature, and vary in resolution from the pore to near-wellbore and reservoir scale.
3.5.1.2 FLUID PROPERTIES Fluid properties need to be determined for both formation fluids and the CO2 injection stream. CO2 stream composition is determined from analytical labs.
Thermophysical fluid properties such as density, viscosity, and CO2/oil CO2/brine solubilities are typically calculated by equations of state from literature/correlations. These values can be checked by measurements on samples obtained from wells using techniques such as U-tube measurements. The RCSPs collected these properties at various scales in different models, ranging from lab scale to the core/near-wellbore/reservoir scales. In addition to thermophysical properties, geochemical analyses of water/brine, oil and gas samples were also conducted to better characterize the chemical constituents in the reservoir.
Fluid chemical properties, such as the concentration of major cations, major anions, trace metals, total dissolved solids, ammonia-nitrogen, total dissolved inorganic carbon, and pH, dissolved oxygen, redox potential, specific conductance and alkalinity may be measured on brine and groundwater samples that are collected with downhole U-tube sampling or drill stem tests (DSTs) on monitoring, observation, and/or production wells. The RCSPs estimated additional geochemical properties from literature. In deep saline and basalt injections, dissolved gas compositions were obtained from well fluid samples at the end of long-term pumping tests, as well as surface and bottom water samples.
Case Study 3.8 from BSCSP discusses how they used simulation tools to assess the opportunity to use fractured reservoirs for CCS.
► See page 94
3.0 BEST PRACTICES FOR NUMERIC SIMULATION
BEST PRACTICES: Risk Management and Simulation for Geologic Storage Projects 77
Fluid (oil/brine/groundwater) samples from the subsurface or shallow groundwater, and headspaces and annuli of wells were used to measure isotope (4He, 13C, 18O, 34S, 3H, 36Cl) concentrations and isotopic ratios. Detailed information on the application of isotope analyses to aid in situ subsurface characterization, model calibration, and leak detection is provided in the Monitoring, Verification, and Accounting (MVA) for Geologic Storage Projects best practices manual.
3.5.1.3 EXISTING WELL INFRASTRUCTURE All known wells, including operational, planned, and abandoned wells within the modeled area, must be accounted for to accurately assess project performance and account for project integrity over the short and long term. Well information (e.g., radius, roughness, perforation depths, and thermal conductivity) may be collected by compiling inventories of existing wells around the injection site, or via available well databases. Well integrity testing can be performed, or operator logs analyzed to characterize wells relative to their potential impact on model results. The individual RCSP case studies indicate that numeric simulations can provide guidance for selection of locations for CO2 injection wells or monitoring wells.
Data from all existing wells within the storage site need to be accounted for and incorporated into the models to provide the most comprehensive “picture” of the geology, rock, and fluid properties of the site. In addition, data from wells outside of the storage site may also need to be included. Data obtained at a regional scale can be used to establish trends in formation thickness, continuity, and geologic structure, or build a geostatistical model.
3.5.1.4 FIELD HISTORYHistorical production and injection information from hydrocarbon producing fields can be used to better understand the current conditions of the reservoir (location of the oil water contact, distribution of pressure, oil, or brine) to help evaluate the theoretical CO2 storage capacity and injectivity. This information can also be compared to modeled results to calibrate rock properties. Field history is not likely to be available for deep saline formations. Field history considerations are more important for depleted hydrocarbon fields than in saline aquifers.
3.5.2 DEVELOP NUMERIC MODEL3.5.2.1 GEOLOGIC MODEL SPECIFICS Gridding
Gridding is the process of dividing up the modeled domain into elements. The choices involved with grid building are very project specific; high-resolution models can provide great detail, but they become increasingly difficult to manage and compute. It is generally accepted that vertical cell resolution should not be finer than the data that will be used to populate it, and horizontal cells should be kept to a reasonable size, balancing detail and time. Complex grids may be developed that contain higher resolution, finer gridding near the wellbore, and larger cells as the distance from the well increases.
The first step in grid building involves the delineation of the domain. Construction of a model grid involves the selection of appropriate model domain sizes and grid resolution, accounting for specific features, such as faults and fractures, and any necessary upscaling. An optimally sized model domain should accomplish the following parameters:
• Encompass all of the major flow units and confining zones of interest (injection zone, overlying and underlying formations)
• Include the proposed injection, monitoring, and production wells in addition to the known existing wells in the study area
• Adequately encompass the extent of the pressure response area
• Be computationally tractable
The size of the model domain will vary according to the size (rate and duration) of CO2 injection, the type of project (EOR, coal, saline) and the time frame allowed for monitoring.
Approaches to grid coarsening vary according to specific site characteristics. For example, in some cases the x- and y-grid dimensions may be increased by an order of magnitude, while the vertical (z-) dimensions were unchanged. In other cases, the grid size in the vertical direction also may be coarsened. Grid coarsening can create numeric dispersion in the model, which causes a smearing-out effect for the CO2 plume. Grid coarsening should be evaluated carefully with sensitivity studies using multiple grid resolutions to determine a resolution that allows for a reasonable computational time while maintaining the level of detail necessary to accurately calculate pressure and saturation changes.
3.0 BEST PRACTICES FOR NUMERIC SIMULATION
BEST PRACTICES: Risk Management and Simulation for Geologic Storage Projects78
Flow at the rock matrix–fracture interface can be modeled by the dual-continuum approach, which includes the dual porosity model, dual-permeability approach, or the more general multiple-interacting continua [MINC] method (Pruess 1982), (Pruess 1985). In reservoirs with extensive, well-connected fractures, the MINC-method can be used to model transport processes. Discrete fracture network modeling simulations can also be used to evaluate potential impacts of the discrete fractures that may account for a major part of the flow in some fractured reservoirs.
Faults, when present, can be incorporated either by specifying no-flow boundaries (normal to the fault direction), dual porosity, and manually delineated high-permeability or by including lateral permeability-anisotropy in the direction parallel to the fault orientation.
Property Assignment
The next phase in developing a numeric simulation is the assignment of rock and fluid properties to the defined grid blocks. This phase involves upscaling the properties (derived from the “static” geological model) obtained at a high resolution, to the more coarsely resolved grid blocks in the “dynamic” model. Initial and boundary conditions are also assigned. Property assignment should consider the reservoir at stake; for example, cleat permeability within a coal seam may incorporate data from pressure transient and interference tests.
Properties must be assigned to reflect their spatial variability as well as any anisotropic or directional-dependent trends. Geostatistics, prior knowledge of the particular field, extensive core data, and extensive well log data are used to estimate heterogeneity and anisotropy.
Geologic characterization typically provides variations of porosity and permeability on a much finer resolution than can be handled using the state-of-the-art computing. Upscaling is the process of converting the fine-scale properties and features in the static geologic model to a coarser grid while preserving the geologic features and properties. This involves two steps. First, the fine layers in the geologic model are combined into fewer layers in the coarse simulation model. Second, the coarse grid is subsequently populated with properties, such as permeability and porosity, using mathematical methods with the fine grid properties as inputs. Therefore, both property-upscaling and grid-upscaling are typically performed. Various methodologies have been developed for upscaling porosity and permeability, including the use of geostatistical distributions, the harmonic mean, the arithmetic mean, and the volume-weighted arithmetic method.
In addition to grid refinement, model properties such as porosity and permability may be modified either to obtain better matches with historic production data or, in some cases, monitoring data acquired during the CO2 injection.
In addition to property assignment within grid blocks, dynamic reservoir simulations of CO2 injection also require a description of the initial state of the system and boundary conditions for solving the partial differential equations.
Boundary conditions account for the specific geological features at a site that affect pressure and flow conditions on the boundary of the numeric model. A structural trap, for example is represented by no-flow boundary conditions. Any fluid flow into the region of interest is represented by open-boundary conditions (e.g., an infinite-acting formation, or water-drive in hydrocarbon fields).
Simplified models may be iteratively refined in the subsequent steps of the modeling process. For example, a simple, uniform, geologic model may be used in the initial history matching process, and then subsequently refined to include heterogeneities to obtain a better history match. In other cases the initial history-matching process might incorporate only two of the gas phase components (e.g., CO2 and methane) whereas the updated history-match might also incorporate nitrogen.
3.5.2.2 ACCOUNTING FOR SURFACE INFRASTRUCTUREThe surface infrastructure for geologic storage projects has been modeled to achieve various objectives. This section is focused on the use of process-level (techno-economic) or dynamic models to aid in cost analysis, process engineering design, and risk analysis of surface infrastructure.
In a techno-economic model, the surface infrastructure system is broken down into engineering modules, such as pipelines, compressors, separation plant, and injection facilities. Operating and capital costs are incorporated within each module. Subsequently, the individual modules are integrated to develop a levelized cost (e.g., incorporating both operating costs and overnight capital costs for a given transport rate) (Kobos 2007) and (McCollum 2006). CO2 pipeline simulation may also be performed on a system-wide, dynamic basis to conceptualize the required CO2 pipeline system. Examples of these efforts include the “String-of-Pearls Model” (Kobos 2007) and MIT’s geographic information system (GIS)-based project, which lays out future pipelines on actual maps that include current infrastructure and rights-of-way.
3.0 BEST PRACTICES FOR NUMERIC SIMULATION
BEST PRACTICES: Risk Management and Simulation for Geologic Storage Projects 79
Modeling to support process engineering design estimates equipment (e.g., compression) size and supporting utility requirements including electricity, cooling water, and fuel gas. Modeling is also used to evaluate equipment supplier designs during the equipment selection process and then validate the supplier predicted performance for the selected equipment.
Simulation of the surface CO2 infrastructure is also an important component of risk analysis for a geologic storage project.
3.6 INTEGRATE NUMERIC SIMULATION WITH OTHER PROJECT ELEMENTS—SITE OPERATIONS, MVA, RISK MANAGEMENTNumeric simulation serves the following purposes:
1. Informs long-term sample locations
2. Informs phase timing for sampling efforts and sampling frequency
3. Informs radius of AoR to determine geographical extent of shallow subsurface and surface water sampling for public assurance
4. Informs rate of injection and other operational parameters
5. Informs long-term operational monitoring and maintenance requirements
6. Informs model calibration or history matching to provide a realistic representation of the system
7. Informs assessment of uncertainty in project risks and performance
3.6.1 MODEL EVALUATION, CALIBRATION, AND MODIFICATIONSNumeric simulations of CO2, brine, methane, and oil flows need to be calibrated with any pre-existing field data and evaluated with actual injection data so that stakeholders can gain confidence in their predictive capabilities.
Fairly extensive historical production data is often available for the cases of CO2 injection into depleted oil/gas reservoirs. In such cases, the RCSPs calibrated and evaluated models based partly on production- and pressure-history matching, breakthrough times, phase saturation at monitoring wells, and plume geometry from monitoring measurements. History matching was also used to evaluate ECBM models.
Previous field history (production) data are not generally available for storage in deep saline reservoirs. Therefore, to calibrate and evaluate models, the RCSPs used various types of data, including injection rates, pressures, downhole temperatures, CO2 plume migration, and information on CO2 dissolution, and the distribution of CO2 among various phases from fluid sampling. Seismic monitoring and fluid sampling also provided information on CO2 plume migration, the times required for plume stabilization, which was also useful in evaluating models.
Practical economic and scheduling constraints make it unlikely that sufficient data will be collected to make completely certain predictions of the behavior of injected CO2, or of impacts of injection. Numeric simulations can be used to develop a better understanding of uncertainties in geologic storage projects. The text box discusses use of statistical methods in conjunction with numeric simulation to quantify these uncertainties.
Case Study 3.11, shows how the PCOR Partnership iteratively updates dynamic simulation to incorporate new data.
► See page 98
Case Study 3.10 from the MRCSP project discusses how more robust geochemical models were employed to realize CO2 injection in high salinity and oil bearing systems. ► See page 97
CaseStudy 3.9 from MGSC reviews how more complexity can be included in a model as more input data becomes available to address different questions at various stages of the project.
► See page 96
3.0 BEST PRACTICES FOR NUMERIC SIMULATION
BEST PRACTICES: Risk Management and Simulation for Geologic Storage Projects80
3.6.2 NUMERIC SIMULATIONS AND ANALYSES BY PROJECT STAGEThe simulations should be updated as the project progresses, and the results should be communicated among the management team and key project personnel to inform the design, implementation, and management of the project. For example, SECARB generated an annual AoR report that integrated the most recent MVA data, simulation, modeling, and containment for compared to the regulatory requirements (e.g., USDW, UIC Class V) and the actual performance of the project.
3.6.2.1 PRE-INJECTION ANALYSES The RCSPs’ goals for pre-injection analyses were site specific and included both site selection and field project design. Site selection involves the selection of an optimal site among various candidates, considering, among other factors, the storage capacities and the injection rate. Field project design includes the selection of an optimal injection and/or production and/or monitoring scheme, delineating the AoR, understanding CO2 trapping, and estimating incremental oil recovery for CO2- EOR projects. Numeric simulation to support these project goals included:
• Estimation of the volume of CO2 stored.
• Incorporation of wellbore pressure monitoring to check for injectivity issues.
• Determination of the AoR by the CO2 plume locations at various times.
• Increased understanding of trapping mechanisms (structural, physical, mineral) by examining the modeled results for CO2 distribution in the mobile, immobile and dissolved forms, and also quantification of the incremental oil production in the EOR cases.
• Identification of optimal sites for the monitoring wells from the CO2 plume extent, and breakthrough times in the case of hydrocarbon reservoirs.
Optimal injection schemes were obtained by parameter sensitivity (permeability, well location, injection pressure, reservoir injection intervals) analyses and economic (net-present value) analyses. Sensitivity studies also helped to identify the parameters and processes limiting CO2 injection rates.
3.6.2.2 DURING-INJECTION ANALYSES At this stage of project development, numeric simulation results were used to assess the performance of the model against field observations (known as model calibration or fine tuning). RCSPs used results of this assessment to revise estimates of formation properties and other modeling parameters, and for the design of the monitoring system. Specific performance assessments for model calibration and modifications included:
• Comparison of real-time versus simulated pressures at the injection and/or monitoring wells
• Comparing injection/production data from model simulations with actual CO2 injection, and/or hydrocarbon production data
• Tracking CO2 migration through estimates of plume geometry and CO2 phase saturations
Some of the resulting changes in the input model parameters, the conceptual model, and estimates of formation properties included:
• The addition of hydraulic fractures to the geologic model
• The modification of relative permeability estimates
• The modification of wellbore skin values
3.0 BEST PRACTICES FOR NUMERIC SIMULATION
Case Study 3.12 shows how the PCOR Partnership uses operational data to update dynamic simulation for the Aquistore project.
► See page 99
BEST PRACTICES: Risk Management and Simulation for Geologic Storage Projects 81
3.6.2.3 POST-INJECTION ANALYSES The most common goals of post-injection analyses are long-term monitoring of the fate of injected CO2 (tracking CO2 plume and anticipating plume stabilization), Post Injection Site Care (to model non-endangerment of underground sources of drinking water), and the prediction of additional oil recovery (in the EOR models). The following simulated outcomes were used to test whether the models could achieve the goals:
• Spatio-temporal movement of the CO2 plume
• Estimates of additional oil produced (for the EOR injections)
• Estimates of long-term CO2 trapping, dissolution, and precipitation (for the deep saline injections)
• Pressure history, phase saturations, and CO2 plume geometries (for risk analysis and long-term monitoring—AoR)
• Predictions of CO2 breakthrough times at production and/or monitoring wells
• Permeability changes with pressure to improve CO2 injectivity, ECBM production and CO2 storage (CBM models).
3.6.3 COORDINATION WITH PROJECT ACTIVITIESCoordination with project activities achieves the following goals:
• Informs selection of long-term sample locations
• Informs timing for sampling efforts and sampling frequency
• Informs determination of the radius of AoR and geographical extent of shallow subsurface and surface water sampling for public assurance
• Informs rate of injection and other operational parameters
• Informs long-term operational monitoring and maintenance requirements
• Informs modeling integration during various project stages
3.6.4 COORDINATION WITH COMMUNICATIONS ACTIVITIESCoordination with communication activities achieves the following goals:
• Informs HSE field plans as well as Emergency Response Plan, Environmental Incident Plan, Journey Management Plan, and chemical product MSDSs to communicate to project personnel how to conduct their work safety and what to do in the event of an incident or emergency.
• Regular simulation updates between management team and key project personnel to inform the design, implementation and management of the project.
3.0 BEST PRACTICES FOR NUMERIC SIMULATION
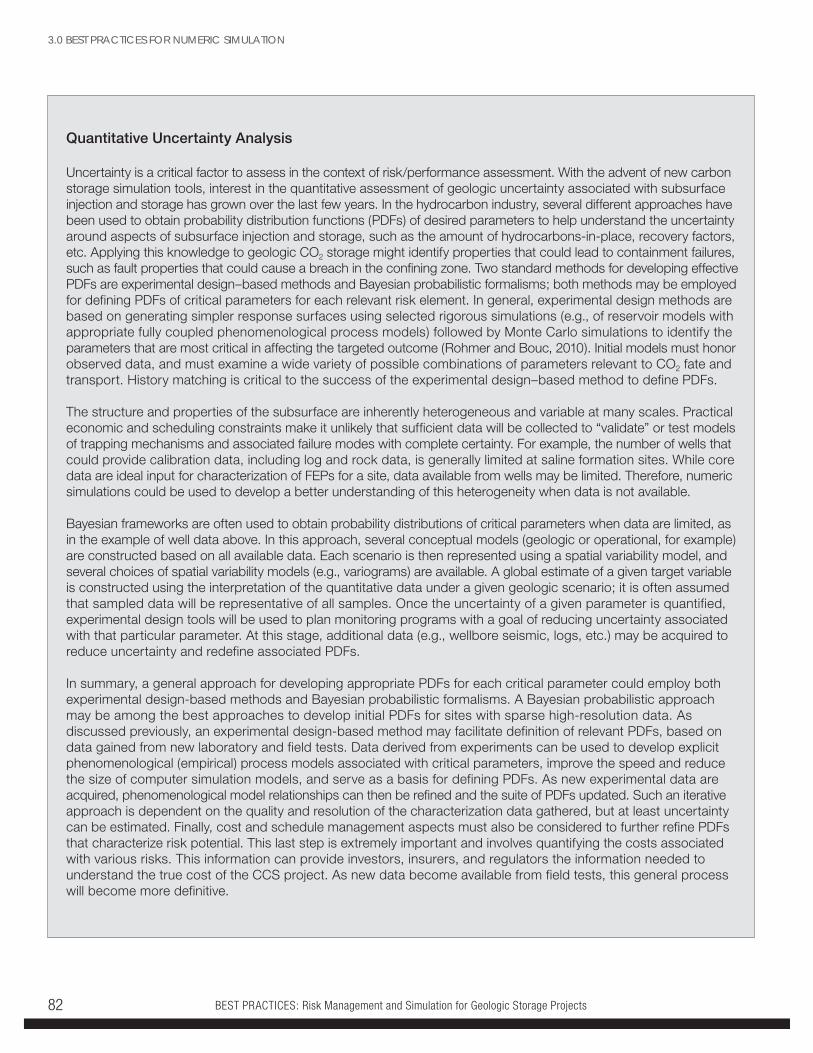
BEST PRACTICES: Risk Management and Simulation for Geologic Storage Projects82
Quantitative Uncertainty Analysis
Uncertainty is a critical factor to assess in the context of risk/performance assessment. With the advent of new carbon storage simulation tools, interest in the quantitative assessment of geologic uncertainty associated with subsurface injection and storage has grown over the last few years. In the hydrocarbon industry, several different approaches have been used to obtain probability distribution functions (PDFs) of desired parameters to help understand the uncertainty around aspects of subsurface injection and storage, such as the amount of hydrocarbons-in-place, recovery factors, etc. Applying this knowledge to geologic CO2 storage might identify properties that could lead to containment failures, such as fault properties that could cause a breach in the confining zone. Two standard methods for developing effective PDFs are experimental design–based methods and Bayesian probabilistic formalisms; both methods may be employed for defining PDFs of critical parameters for each relevant risk element. In general, experimental design methods are based on generating simpler response surfaces using selected rigorous simulations (e.g., of reservoir models with appropriate fully coupled phenomenological process models) followed by Monte Carlo simulations to identify the parameters that are most critical in affecting the targeted outcome (Rohmer and Bouc, 2010). Initial models must honor observed data, and must examine a wide variety of possible combinations of parameters relevant to CO2 fate and transport. History matching is critical to the success of the experimental design–based method to define PDFs.
The structure and properties of the subsurface are inherently heterogeneous and variable at many scales. Practical economic and scheduling constraints make it unlikely that sufficient data will be collected to “validate” or test models of trapping mechanisms and associated failure modes with complete certainty. For example, the number of wells that could provide calibration data, including log and rock data, is generally limited at saline formation sites. While core data are ideal input for characterization of FEPs for a site, data available from wells may be limited. Therefore, numeric simulations could be used to develop a better understanding of this heterogeneity when data is not available.
Bayesian frameworks are often used to obtain probability distributions of critical parameters when data are limited, as in the example of well data above. In this approach, several conceptual models (geologic or operational, for example) are constructed based on all available data. Each scenario is then represented using a spatial variability model, and several choices of spatial variability models (e.g., variograms) are available. A global estimate of a given target variable is constructed using the interpretation of the quantitative data under a given geologic scenario; it is often assumed that sampled data will be representative of all samples. Once the uncertainty of a given parameter is quantified, experimental design tools will be used to plan monitoring programs with a goal of reducing uncertainty associated with that particular parameter. At this stage, additional data (e.g., wellbore seismic, logs, etc.) may be acquired to reduce uncertainty and redefine associated PDFs.
In summary, a general approach for developing appropriate PDFs for each critical parameter could employ both experimental design-based methods and Bayesian probabilistic formalisms. A Bayesian probabilistic approach may be among the best approaches to develop initial PDFs for sites with sparse high-resolution data. As discussed previously, an experimental design-based method may facilitate definition of relevant PDFs, based on data gained from new laboratory and field tests. Data derived from experiments can be used to develop explicit phenomenological (empirical) process models associated with critical parameters, improve the speed and reduce the size of computer simulation models, and serve as a basis for defining PDFs. As new experimental data are acquired, phenomenological model relationships can then be refined and the suite of PDFs updated. Such an iterative approach is dependent on the quality and resolution of the characterization data gathered, but at least uncertainty can be estimated. Finally, cost and schedule management aspects must also be considered to further refine PDFs that characterize risk potential. This last step is extremely important and involves quantifying the costs associated with various risks. This information can provide investors, insurers, and regulators the information needed to understand the true cost of the CCS project. As new data become available from field tests, this general process will become more definitive.
3.0 BEST PRACTICES FOR NUMERIC SIMULATION
BEST PRACTICES: Risk Management and Simulation for Geologic Storage Projects 83
CASE STUDY 3.1 — PCOR
PLAINS CO2 REDUCTION (PCOR) PARTNERSHIP
Dynamic Simulation Used to Estimate CO2 Storage Efficiency and Other Properties
From planning through post-closure, each phase of a CO2 storage project requires an understanding of dynamic behavior of the target reservoir and the injected CO2. A preponderance of this understanding comes from dynamic simulation of the planned or actual CO2 injection. Successful dynamic simulations hinge on the development of an accurate static geologic model. A well informed geologic model will include components that accurately integrate information about geologic structure, stratigraphy, petrophysical properties (e.g., porosity, permeability, etc.), faults, and other physical features.
The PCOR Partnership, as part of its Development Phase projects (e.g., Fort Nelson, Aquistore), constructed static models and used simulation to understand specific dynamic elements. Several of these elements are presented Table 3-3. A thorough understanding of these elements is critical to determining the long-term viability of any geologic storage project.
As part of the PCOR Partnership’s involvement in the Aquistore Project, dynamic simulations were performed to predict the areal extent of the injected CO2. The image (Figure 3-1) below depicts the extent and CO2 saturation in multiple injection horizons with respect to the injection and monitoring well (Jiang and others, 2016).
CASE STUDIES 3.7
ReferenceJiang, T., Pekot, L.J., Jin, L., Peck, W.D., and Gorecki, C.D., 2016, Geologic modeling and simulation report for the Aquistore project: Plains CO2 Reduction (PCOR) Partnership Phase III Task 1 Deliverable D93 (update 2) for U.S. Department of Energy National Energy Technology Laboratory Cooperative Agreement No. DE-FC26-05NT42592, EERC Publication 2016-EERC-04-06, Grand Forks, North Dakota, Energy & Environmental Research Center, February.
Table 3-3: Dynamic Modeling Elements
CO2 storage efficiency
Injectivity
Number of injection/production wells
Well operation
Areal extent of CO2 and pressure plumes
Potential impacts to neighboring resources
Post-injection migration potential
Geochemical reactions
Figure 3-1: Model showing CO2 saturation in multiple injection horizons.
(Jiang and others, 2016)
3.0 BEST PRACTICES FOR NUMERIC SIMULATION
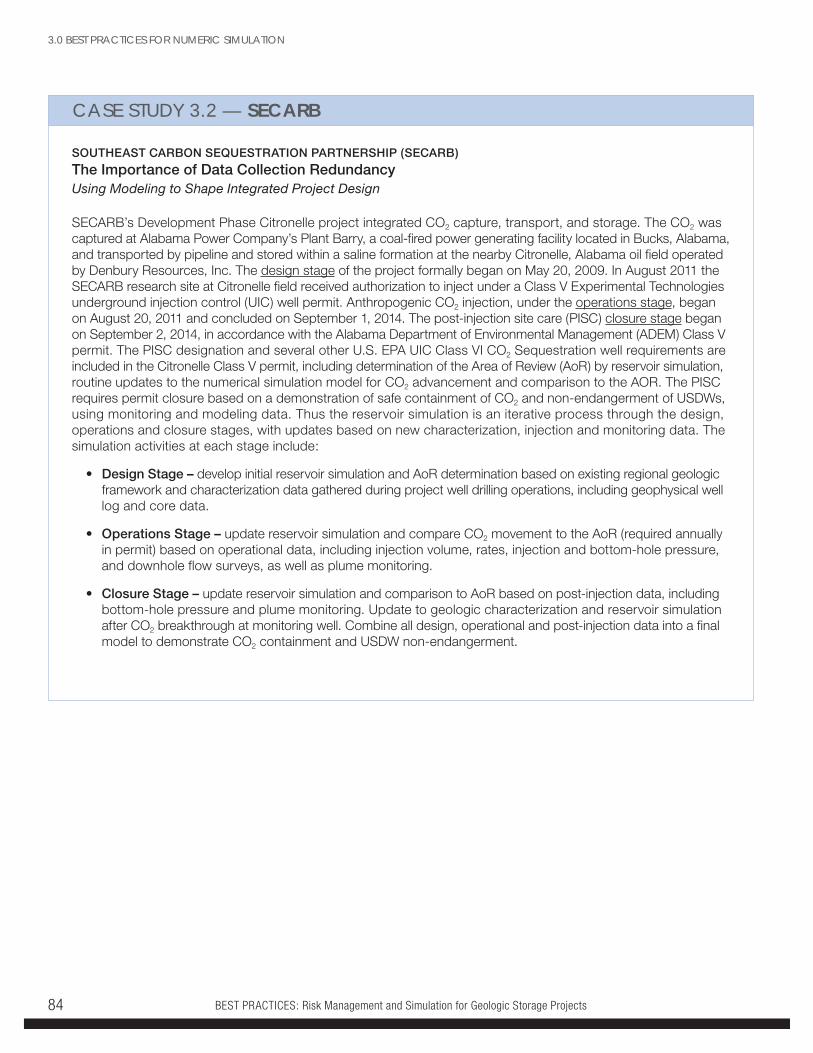
BEST PRACTICES: Risk Management and Simulation for Geologic Storage Projects84
CASE STUDY 3.2 — SECARB
SOUTHEAST CARBON SEQUESTRATION PARTNERSHIP (SECARB)
The Importance of Data Collection RedundancyUsing Modeling to Shape Integrated Project Design
SECARB’s Development Phase Citronelle project integrated CO2 capture, transport, and storage. The CO2 was captured at Alabama Power Company’s Plant Barry, a coal-fired power generating facility located in Bucks, Alabama, and transported by pipeline and stored within a saline formation at the nearby Citronelle, Alabama oil field operated by Denbury Resources, Inc. The design stage of the project formally began on May 20, 2009. In August 2011 the SECARB research site at Citronelle field received authorization to inject under a Class V Experimental Technologies underground injection control (UIC) well permit. Anthropogenic CO2 injection, under the operations stage, began on August 20, 2011 and concluded on September 1, 2014. The post-injection site care (PISC) closure stage began on September 2, 2014, in accordance with the Alabama Department of Environmental Management (ADEM) Class V permit. The PISC designation and several other U.S. EPA UIC Class VI CO2 Sequestration well requirements are included in the Citronelle Class V permit, including determination of the Area of Review (AoR) by reservoir simulation, routine updates to the numerical simulation model for CO2 advancement and comparison to the AOR. The PISC requires permit closure based on a demonstration of safe containment of CO2 and non-endangerment of USDWs, using monitoring and modeling data. Thus the reservoir simulation is an iterative process through the design, operations and closure stages, with updates based on new characterization, injection and monitoring data. The simulation activities at each stage include:
• Design Stage – develop initial reservoir simulation and AoR determination based on existing regional geologic framework and characterization data gathered during project well drilling operations, including geophysical well log and core data.
• Operations Stage – update reservoir simulation and compare CO2 movement to the AoR (required annually in permit) based on operational data, including injection volume, rates, injection and bottom-hole pressure, and downhole flow surveys, as well as plume monitoring.
• Closure Stage – update reservoir simulation and comparison to AoR based on post-injection data, including bottom-hole pressure and plume monitoring. Update to geologic characterization and reservoir simulation after CO2 breakthrough at monitoring well. Combine all design, operational and post-injection data into a final model to demonstrate CO2 containment and USDW non-endangerment.
3.0 BEST PRACTICES FOR NUMERIC SIMULATION
BEST PRACTICES: Risk Management and Simulation for Geologic Storage Projects 85
CASE STUDY 3.3 — MRCSP
MIDWEST REGIONAL CARBON SEQUESTRATION PARTNERSHIP (MRCSP)
Using Well Data To Improve Simulation
Brine disposal well operators typically report injection volumes and surface pressures recorded at hourly or daily intervals. The goal of this work was to develop methodology and workflow that enables the use of this widely available basic injection rate and pressure data to infer formation characteristics (e.g., permeability, distance to boundary). This reservoir characterization exercise can be extended to also enable injectivity mapping for analogous CO2 injection.
Through the regional characterization activities taking place in both the Validation Phase and Development Phase, MRCSP used basic operational data—namely, injection rate and wellhead pressure reported for brine injection (disposal) wells—to help develop an analytical-based methodology to infer formation characteristics such as transmissivity and storativity. Preliminary reservoir characterization of a given region where brine injection well networks are present can thus be estimated by applying this methodology. The storativity and transmissivity distributions calculated from a number of wells can be used to improve regional capacity estimates and for injectivity mapping for analogous CO2 injection as well.
Figure 3-2: Segment analysis of a brine disposal well with an average injection rate of 4.72 bb/min depicting (a) average hourly injection rate calculated from field data and (b) field data delta pressure response and model pressure response match at transmissivity, T=11,000 mD-ft/cP
3.0 BEST PRACTICES FOR NUMERIC SIMULATION
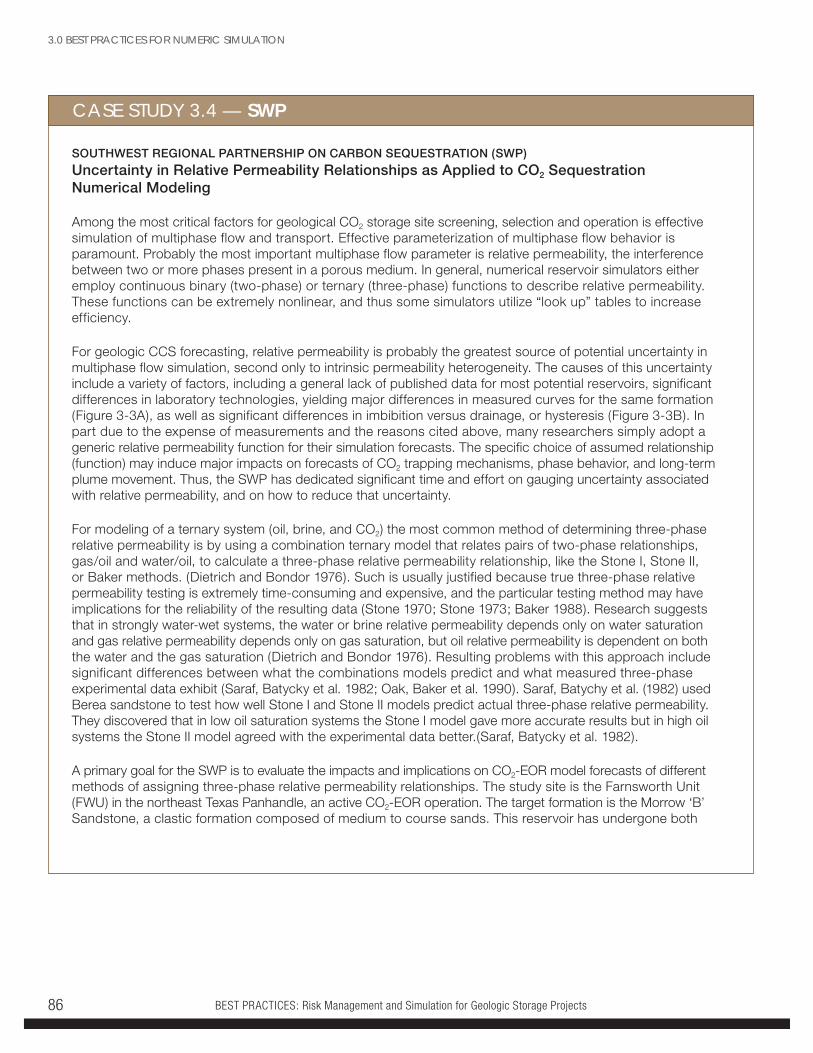
BEST PRACTICES: Risk Management and Simulation for Geologic Storage Projects86
CASE STUDY 3.4 — SWP
SOUTHWEST REGIONAL PARTNERSHIP ON CARBON SEQUESTRATION (SWP)
Uncertainty in Relative Permeability Relationships as Applied to CO2 Sequestration Numerical Modeling
Among the most critical factors for geological CO2 storage site screening, selection and operation is effective simulation of multiphase flow and transport. Effective parameterization of multiphase flow behavior is paramount. Probably the most important multiphase flow parameter is relative permeability, the interference between two or more phases present in a porous medium. In general, numerical reservoir simulators either employ continuous binary (two-phase) or ternary (three-phase) functions to describe relative permeability. These functions can be extremely nonlinear, and thus some simulators utilize “look up” tables to increase efficiency.
For geologic CCS forecasting, relative permeability is probably the greatest source of potential uncertainty in multiphase flow simulation, second only to intrinsic permeability heterogeneity. The causes of this uncertainty include a variety of factors, including a general lack of published data for most potential reservoirs, significant differences in laboratory technologies, yielding major differences in measured curves for the same formation (Figure 3-3A), as well as significant differences in imbibition versus drainage, or hysteresis (Figure 3-3B). In part due to the expense of measurements and the reasons cited above, many researchers simply adopt a generic relative permeability function for their simulation forecasts. The specific choice of assumed relationship (function) may induce major impacts on forecasts of CO2 trapping mechanisms, phase behavior, and long-term plume movement. Thus, the SWP has dedicated significant time and effort on gauging uncertainty associated with relative permeability, and on how to reduce that uncertainty.
For modeling of a ternary system (oil, brine, and CO2) the most common method of determining three-phase relative permeability is by using a combination ternary model that relates pairs of two-phase relationships, gas/oil and water/oil, to calculate a three-phase relative permeability relationship, like the Stone I, Stone II, or Baker methods. (Dietrich and Bondor 1976). Such is usually justified because true three-phase relative permeability testing is extremely time-consuming and expensive, and the particular testing method may have implications for the reliability of the resulting data (Stone 1970; Stone 1973; Baker 1988). Research suggests that in strongly water-wet systems, the water or brine relative permeability depends only on water saturation and gas relative permeability depends only on gas saturation, but oil relative permeability is dependent on both the water and the gas saturation (Dietrich and Bondor 1976). Resulting problems with this approach include significant differences between what the combinations models predict and what measured three-phase experimental data exhibit (Saraf, Batycky et al. 1982; Oak, Baker et al. 1990). Saraf, Batychy et al. (1982) used Berea sandstone to test how well Stone I and Stone II models predict actual three-phase relative permeability. They discovered that in low oil saturation systems the Stone I model gave more accurate results but in high oil systems the Stone II model agreed with the experimental data better.(Saraf, Batycky et al. 1982).
A primary goal for the SWP is to evaluate the impacts and implications on CO2-EOR model forecasts of different methods of assigning three-phase relative permeability relationships. The study site is the Farnsworth Unit (FWU) in the northeast Texas Panhandle, an active CO2-EOR operation. The target formation is the Morrow ‘B’ Sandstone, a clastic formation composed of medium to course sands. This reservoir has undergone both
3.0 BEST PRACTICES FOR NUMERIC SIMULATION
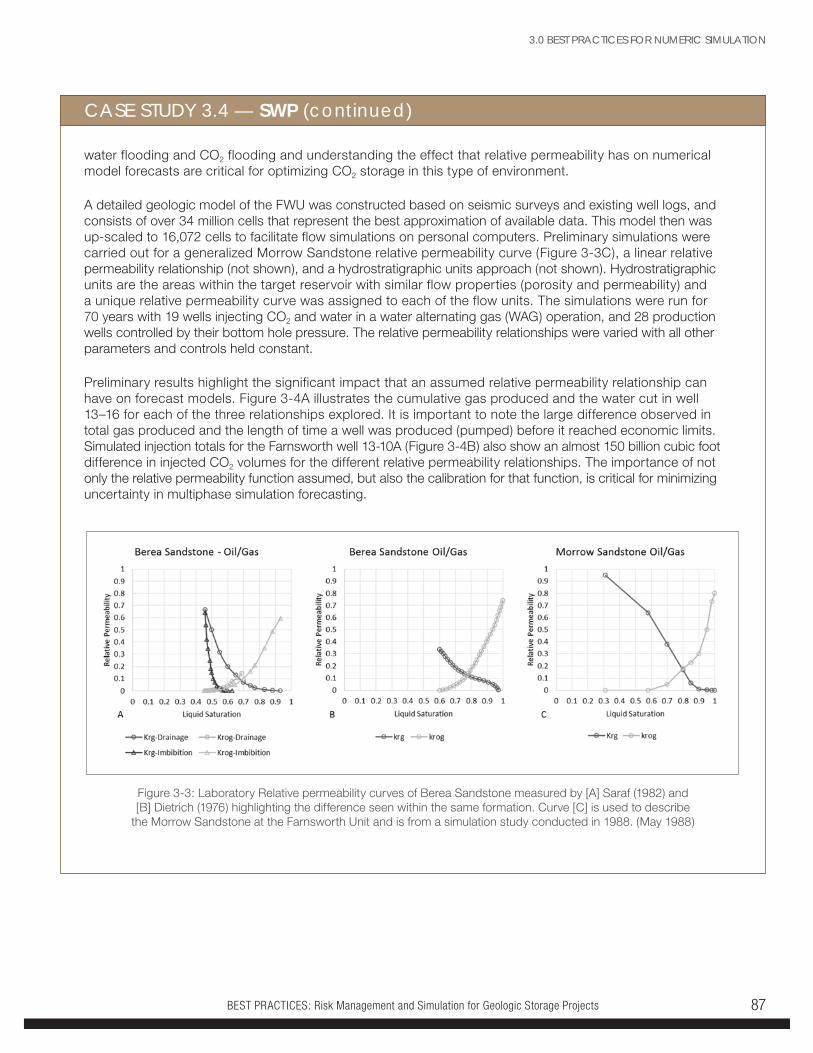
BEST PRACTICES: Risk Management and Simulation for Geologic Storage Projects 87
CASE STUDY 3.4 — SWP (continued)
water flooding and CO2 flooding and understanding the effect that relative permeability has on numerical model forecasts are critical for optimizing CO2 storage in this type of environment.
A detailed geologic model of the FWU was constructed based on seismic surveys and existing well logs, and consists of over 34 million cells that represent the best approximation of available data. This model then was up-scaled to 16,072 cells to facilitate flow simulations on personal computers. Preliminary simulations were carried out for a generalized Morrow Sandstone relative permeability curve (Figure 3-3C), a linear relative permeability relationship (not shown), and a hydrostratigraphic units approach (not shown). Hydrostratigraphic units are the areas within the target reservoir with similar flow properties (porosity and permeability) and a unique relative permeability curve was assigned to each of the flow units. The simulations were run for 70 years with 19 wells injecting CO2 and water in a water alternating gas (WAG) operation, and 28 production wells controlled by their bottom hole pressure. The relative permeability relationships were varied with all other parameters and controls held constant.
Preliminary results highlight the significant impact that an assumed relative permeability relationship can have on forecast models. Figure 3-4A illustrates the cumulative gas produced and the water cut in well 13–16 for each of the three relationships explored. It is important to note the large difference observed in total gas produced and the length of time a well was produced (pumped) before it reached economic limits. Simulated injection totals for the Farnsworth well 13-10A (Figure 3-4B) also show an almost 150 billion cubic foot difference in injected CO2 volumes for the different relative permeability relationships. The importance of not only the relative permeability function assumed, but also the calibration for that function, is critical for minimizing uncertainty in multiphase simulation forecasting.
3.0 BEST PRACTICES FOR NUMERIC SIMULATION
Figure 3-3: Laboratory Relative permeability curves of Berea Sandstone measured by [A] Saraf (1982) and [B] Dietrich (1976) highlighting the difference seen within the same formation. Curve [C] is used to describe
the Morrow Sandstone at the Farnsworth Unit and is from a simulation study conducted in 1988. (May 1988)
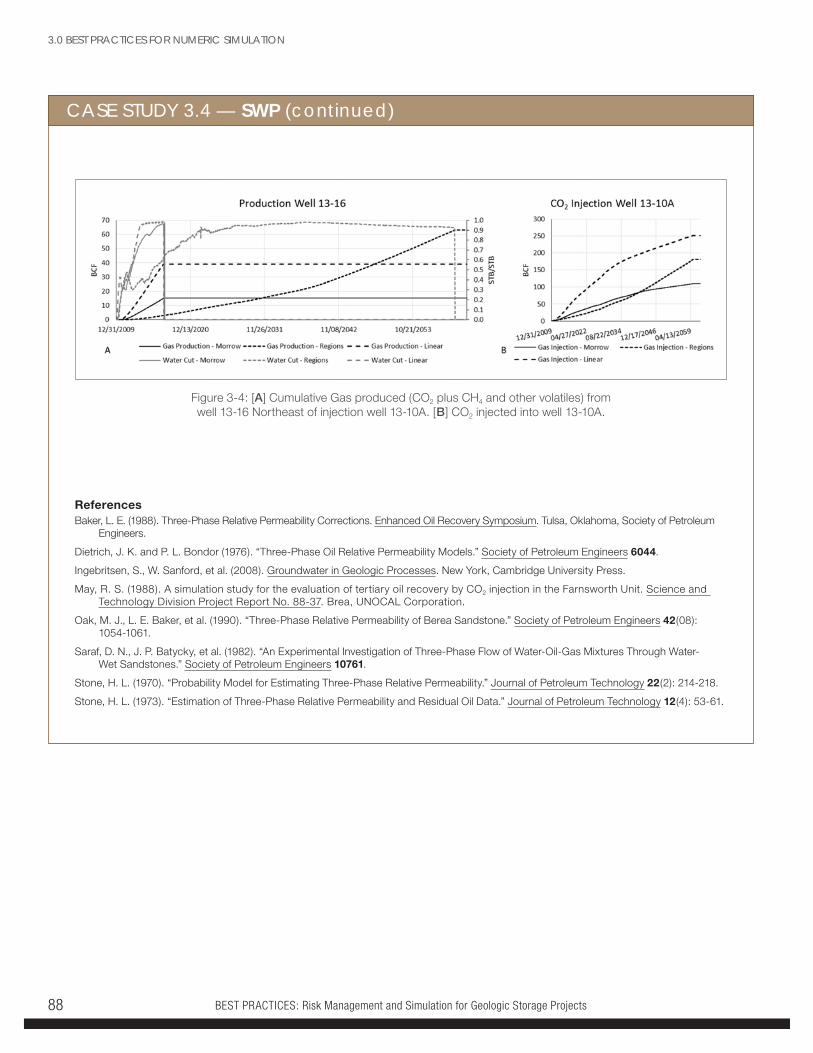
BEST PRACTICES: Risk Management and Simulation for Geologic Storage Projects88
CASE STUDY 3.4 — SWP (continued)
ReferencesBaker, L. E. (1988). Three-Phase Relative Permeability Corrections. Enhanced Oil Recovery Symposium. Tulsa, Oklahoma, Society of Petroleum
Engineers.
Dietrich, J. K. and P. L. Bondor (1976). “Three-Phase Oil Relative Permeability Models.” Society of Petroleum Engineers 6044.
Ingebritsen, S., W. Sanford, et al. (2008). Groundwater in Geologic Processes. New York, Cambridge University Press.
May, R. S. (1988). A simulation study for the evaluation of tertiary oil recovery by CO2 injection in the Farnsworth Unit. Science and Technology Division Project Report No. 88-37. Brea, UNOCAL Corporation.
Oak, M. J., L. E. Baker, et al. (1990). “Three-Phase Relative Permeability of Berea Sandstone.” Society of Petroleum Engineers 42(08): 1054-1061.
Saraf, D. N., J. P. Batycky, et al. (1982). “An Experimental Investigation of Three-Phase Flow of Water-Oil-Gas Mixtures Through Water-Wet Sandstones.” Society of Petroleum Engineers 10761.
Stone, H. L. (1970). “Probability Model for Estimating Three-Phase Relative Permeability.” Journal of Petroleum Technology 22(2): 214-218.
Stone, H. L. (1973). “Estimation of Three-Phase Relative Permeability and Residual Oil Data.” Journal of Petroleum Technology 12(4): 53-61.
Figure 3-4: [A] Cumulative Gas produced (CO2 plus CH4 and other volatiles) from well 13-16 Northeast of injection well 13-10A. [B] CO2 injected into well 13-10A.
3.0 BEST PRACTICES FOR NUMERIC SIMULATION
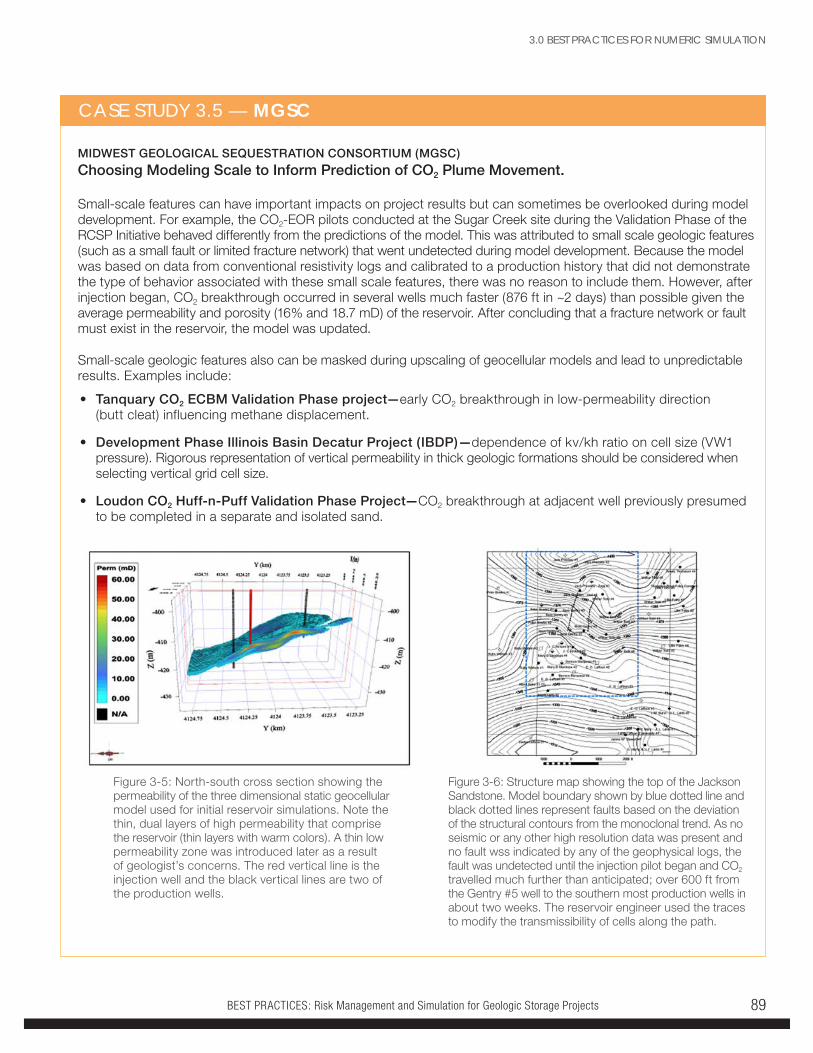
BEST PRACTICES: Risk Management and Simulation for Geologic Storage Projects 89
MIDWEST GEOLOGICAL SEQUESTRATION CONSORTIUM (MGSC)
Choosing Modeling Scale to Inform Prediction of CO2 Plume Movement.
Small-scale features can have important impacts on project results but can sometimes be overlooked during model development. For example, the CO2-EOR pilots conducted at the Sugar Creek site during the Validation Phase of the RCSP Initiative behaved differently from the predictions of the model. This was attributed to small scale geologic features (such as a small fault or limited fracture network) that went undetected during model development. Because the model was based on data from conventional resistivity logs and calibrated to a production history that did not demonstrate the type of behavior associated with these small scale features, there was no reason to include them. However, after injection began, CO2 breakthrough occurred in several wells much faster (876 ft in ~2 days) than possible given the average permeability and porosity (16% and 18.7 mD) of the reservoir. After concluding that a fracture network or fault must exist in the reservoir, the model was updated.
Small-scale geologic features also can be masked during upscaling of geocellular models and lead to unpredictable results. Examples include:
• Tanquary CO2 ECBM Validation Phase project—early CO2 breakthrough in low-permeability direction (butt cleat) influencing methane displacement.
• Development Phase Illinois Basin Decatur Project (IBDP)—dependence of kv/kh ratio on cell size (VW1 pressure). Rigorous representation of vertical permeability in thick geologic formations should be considered when selecting vertical grid cell size.
• Loudon CO2 Huff-n-Puff Validation Phase Project—CO2 breakthrough at adjacent well previously presumed to be completed in a separate and isolated sand.
CASE STUDY 3.5 — MGSC
Figure 3-5: North-south cross section showing the permeability of the three dimensional static geocellular model used for initial reservoir simulations. Note the thin, dual layers of high permeability that comprise the reservoir (thin layers with warm colors). A thin low permeability zone was introduced later as a result of geologist’s concerns. The red vertical line is the injection well and the black vertical lines are two of the production wells.
Figure 3-6: Structure map showing the top of the Jackson Sandstone. Model boundary shown by blue dotted line and black dotted lines represent faults based on the deviation of the structural contours from the monoclonal trend. As no seismic or any other high resolution data was present and no fault wss indicated by any of the geophysical logs, the fault was undetected until the injection pilot began and CO2 travelled much further than anticipated; over 600 ft from the Gentry #5 well to the southern most production wells in about two weeks. The reservoir engineer used the traces to modify the transmissibility of cells along the path.
3.0 BEST PRACTICES FOR NUMERIC SIMULATION
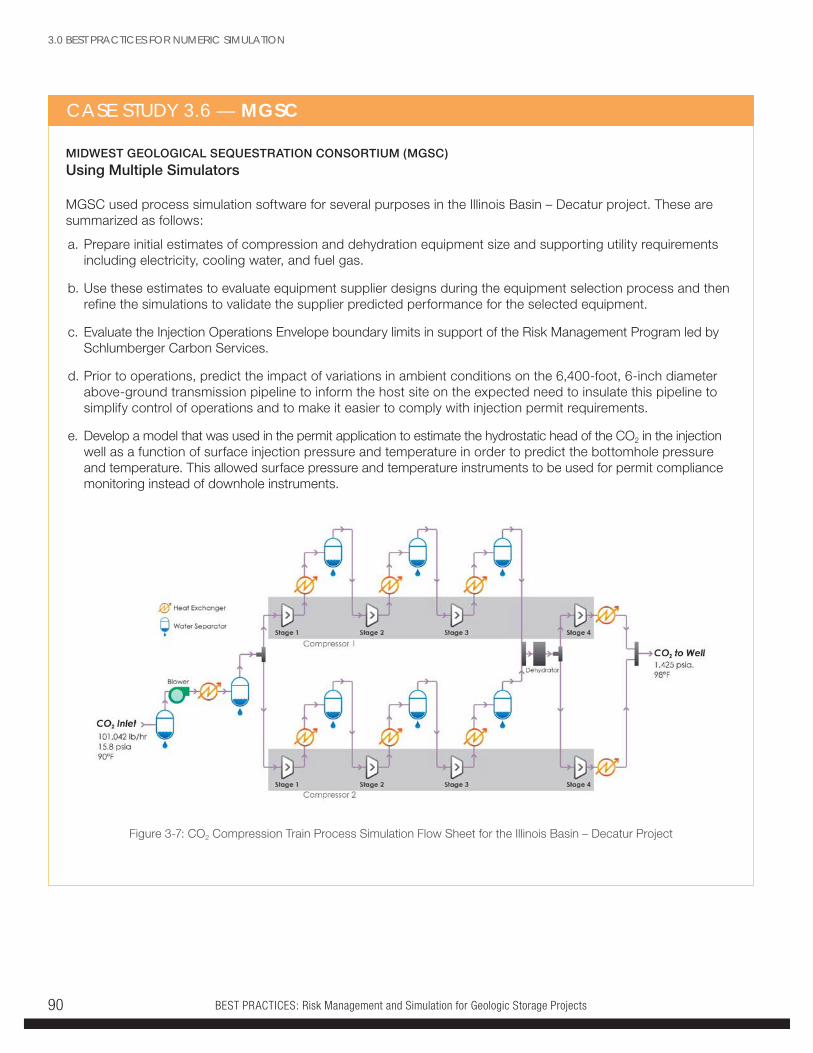
BEST PRACTICES: Risk Management and Simulation for Geologic Storage Projects90
MIDWEST GEOLOGICAL SEQUESTRATION CONSORTIUM (MGSC)
Using Multiple Simulators
MGSC used process simulation software for several purposes in the Illinois Basin – Decatur project. These are summarized as follows:
a. Prepare initial estimates of compression and dehydration equipment size and supporting utility requirements including electricity, cooling water, and fuel gas.
b. Use these estimates to evaluate equipment supplier designs during the equipment selection process and then refine the simulations to validate the supplier predicted performance for the selected equipment.
c. Evaluate the Injection Operations Envelope boundary limits in support of the Risk Management Program led by Schlumberger Carbon Services.
d. Prior to operations, predict the impact of variations in ambient conditions on the 6,400-foot, 6-inch diameter above-ground transmission pipeline to inform the host site on the expected need to insulate this pipeline to simplify control of operations and to make it easier to comply with injection permit requirements.
e. Develop a model that was used in the permit application to estimate the hydrostatic head of the CO2 in the injection well as a function of surface injection pressure and temperature in order to predict the bottomhole pressure and temperature. This allowed surface pressure and temperature instruments to be used for permit compliance monitoring instead of downhole instruments.
CASE STUDY 3.6 — MGSC
Figure 3-7: CO2 Compression Train Process Simulation Flow Sheet for the Illinois Basin – Decatur Project
3.0 BEST PRACTICES FOR NUMERIC SIMULATION
BEST PRACTICES: Risk Management and Simulation for Geologic Storage Projects 91
CASE STUDY 3.5 — MGSC (continued)
Working for MGSC, Trimeric developed process simulations of the compression facility from the source of CO2 at the existing facility to the discharge of the multistage centrifugal pump using two separate software packages, WinSim Design II and HYSYS, to ensure that there were no critical issues with the process simulations or process simulation software that would lead to unacceptable results. Multiple equation-of-state (EOS) models including Peng-Robinson and Lee-Kesler-Plocker were tested in both simulation software packages in order to guard against any limitations of the EOS models for CO2, which can be very sensitive to small changes in temperature and pressure near the critical point for CO2.
Results from these two industry standard process simulation packages were compared and good agreement was noted in all cases. The simulation packages were also used to confirm the supplier provided performance data for the following equipment:
• HSI Blowers for the multistage centrifugal blower
• Toromont and Ariel for the reciprocating compressors
• Dickson Process Systems for the dehydration system
• Wood Group for the multistage centrifugal pumps
During this process, the following performance parameters were checked in the comparisons of WinSim, HYSYS, and equipment supplier provided performance data:
• Flow rate
• Temperature
• Pressure
• Power requirement
• Water removal
• Heat exchanger duty
Agreement was consistently within 5% and typically better than that for all parameters. A few water removal rates from compressor suction scrubbers varied by < 10%.
A recognized risk for anyone living or working near a storage complex will be an accidental release of CO2 from the surface injection system. Modelling of CO2 releases can provide reassurance that in the unlikely event of a CO2 release there would not be any impact beyond the site boundary.
3.0 BEST PRACTICES FOR NUMERIC SIMULATION
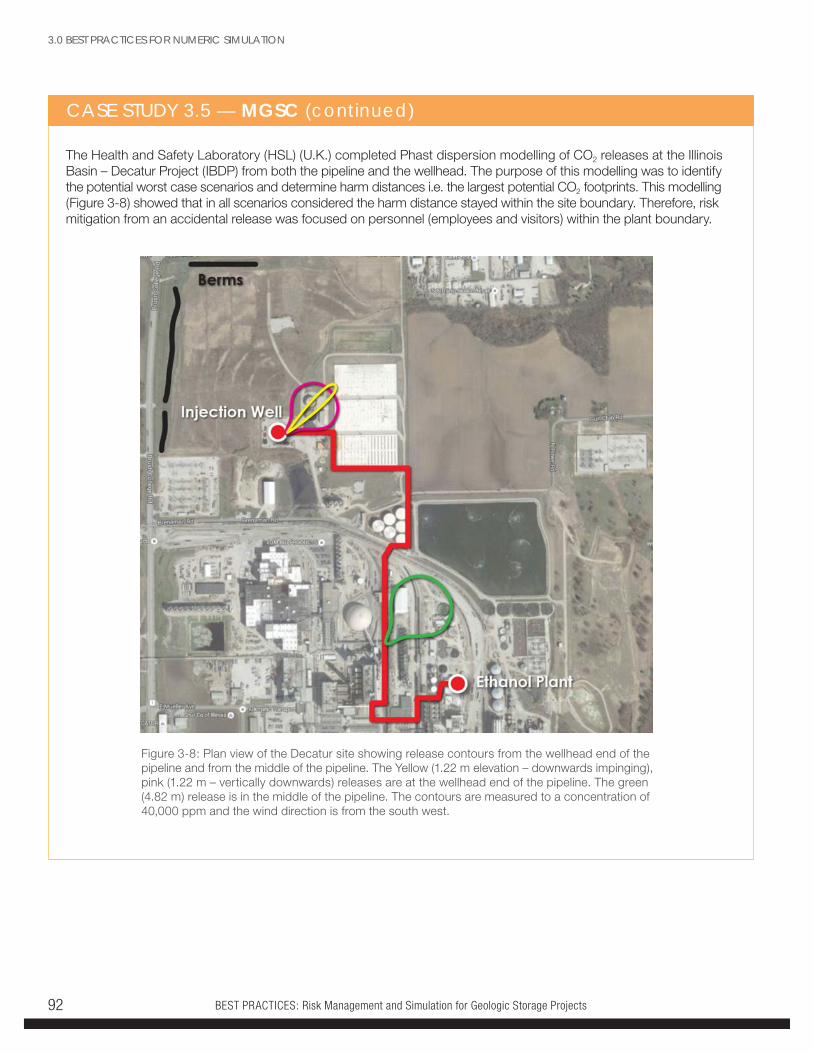
BEST PRACTICES: Risk Management and Simulation for Geologic Storage Projects92
CASE STUDY 3.5 — MGSC (continued)
Figure 3-8: Plan view of the Decatur site showing release contours from the wellhead end of the pipeline and from the middle of the pipeline. The Yellow (1.22 m elevation – downwards impinging), pink (1.22 m – vertically downwards) releases are at the wellhead end of the pipeline. The green (4.82 m) release is in the middle of the pipeline. The contours are measured to a concentration of 40,000 ppm and the wind direction is from the south west.
3.0 BEST PRACTICES FOR NUMERIC SIMULATION
The Health and Safety Laboratory (HSL) (U.K.) completed Phast dispersion modelling of CO2 releases at the Illinois Basin – Decatur Project (IBDP) from both the pipeline and the wellhead. The purpose of this modelling was to identify the potential worst case scenarios and determine harm distances i.e. the largest potential CO2 footprints. This modelling (Figure 3-8) showed that in all scenarios considered the harm distance stayed within the site boundary. Therefore, risk mitigation from an accidental release was focused on personnel (employees and visitors) within the plant boundary.
BEST PRACTICES: Risk Management and Simulation for Geologic Storage Projects 93
CASE STUDY 3.7 — SECARB
SOUTHEAST CARBON SEQUESTRATION PARTNERSHIP (SECARB)
The Importance of Data Collection Redundancy
MVA programs provide critical information for public credibility and regulatory compliance. They are also frequently used to support national and international research efforts. Multiple and duplicative data collection options are necessary to address both normal equipment failure and conflict between research technologies. SECARB created MVA data collection redundancy throughout Citronelle project. Duplicate gauges were used where practical and affordable. Duplicate gauges provide available options when competing research technologies sometimes cause interference, as was the case when the LBNL DTS system interfered with and damaged the original downhole pressure and temperature gauges. These duplicate or redundant data collection methods also provide a failsafe to ensure that the project is not generating “bad” data, which ultimately is included in simulation runs.
3.0 BEST PRACTICES FOR NUMERIC SIMULATION
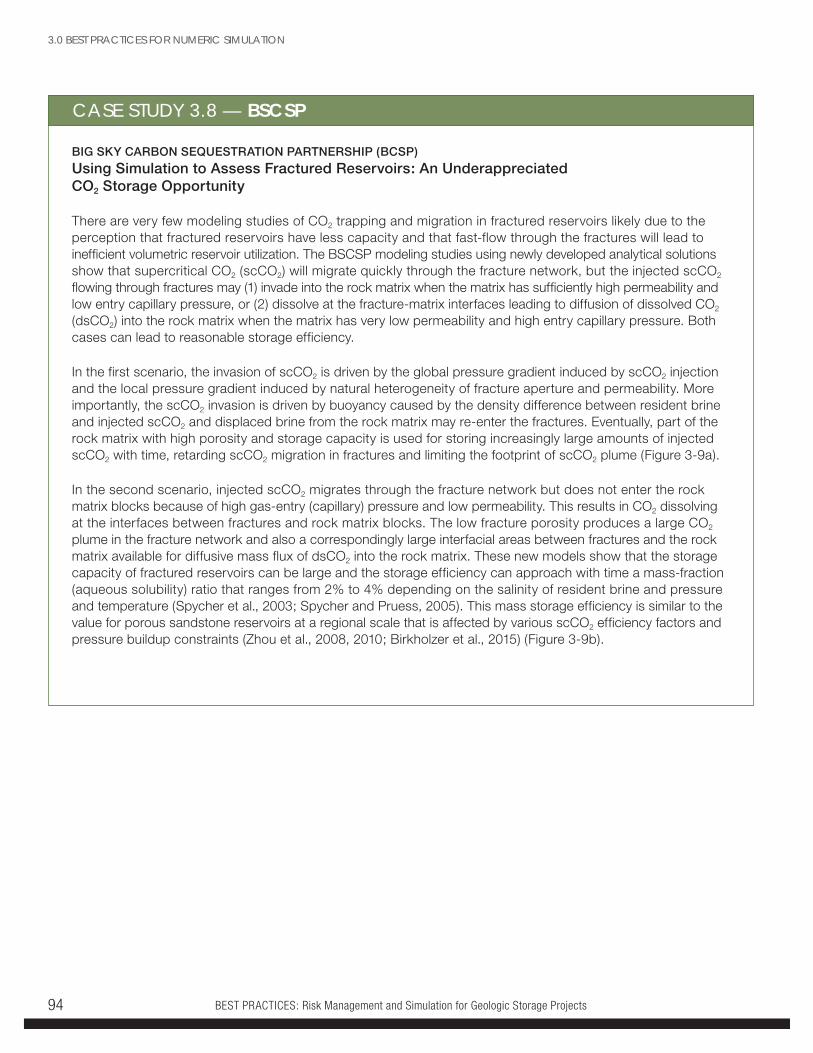
BEST PRACTICES: Risk Management and Simulation for Geologic Storage Projects94
CASE STUDY 3.8 — BSCSP
BIG SKY CARBON SEQUESTRATION PARTNERSHIP (BCSP)
Using Simulation to Assess Fractured Reservoirs: An Underappreciated CO2 Storage Opportunity
There are very few modeling studies of CO2 trapping and migration in fractured reservoirs likely due to the perception that fractured reservoirs have less capacity and that fast-flow through the fractures will lead to inefficient volumetric reservoir utilization. The BSCSP modeling studies using newly developed analytical solutions show that supercritical CO2 (scCO2) will migrate quickly through the fracture network, but the injected scCO2 flowing through fractures may (1) invade into the rock matrix when the matrix has sufficiently high permeability and low entry capillary pressure, or (2) dissolve at the fracture-matrix interfaces leading to diffusion of dissolved CO2 (dsCO2) into the rock matrix when the matrix has very low permeability and high entry capillary pressure. Both cases can lead to reasonable storage efficiency.
In the first scenario, the invasion of scCO2 is driven by the global pressure gradient induced by scCO2 injection and the local pressure gradient induced by natural heterogeneity of fracture aperture and permeability. More importantly, the scCO2 invasion is driven by buoyancy caused by the density difference between resident brine and injected scCO2 and displaced brine from the rock matrix may re-enter the fractures. Eventually, part of the rock matrix with high porosity and storage capacity is used for storing increasingly large amounts of injected scCO2 with time, retarding scCO2 migration in fractures and limiting the footprint of scCO2 plume (Figure 3-9a).
In the second scenario, injected scCO2 migrates through the fracture network but does not enter the rock matrix blocks because of high gas-entry (capillary) pressure and low permeability. This results in CO2 dissolving at the interfaces between fractures and rock matrix blocks. The low fracture porosity produces a large CO2 plume in the fracture network and also a correspondingly large interfacial areas between fractures and the rock matrix available for diffusive mass flux of dsCO2 into the rock matrix. These new models show that the storage capacity of fractured reservoirs can be large and the storage efficiency can approach with time a mass-fraction (aqueous solubility) ratio that ranges from 2% to 4% depending on the salinity of resident brine and pressure and temperature (Spycher et al., 2003; Spycher and Pruess, 2005). This mass storage efficiency is similar to the value for porous sandstone reservoirs at a regional scale that is affected by various scCO2 efficiency factors and pressure buildup constraints (Zhou et al., 2008, 2010; Birkholzer et al., 2015) (Figure 3-9b).
3.0 BEST PRACTICES FOR NUMERIC SIMULATION
BEST PRACTICES: Risk Management and Simulation for Geologic Storage Projects 95
Figure 3-9: (a) Average saturation of scCO2 stored in a column of rock matrix blocks surrounded by scCO2-filled fractures, as a function of matrix entry capillary pressure (in bar), (b) mass ratio of dsCO2 stored in the rock matrix to scCO2 stored in the fracture network for single-size cubes, four-size cubes, and single-size anisotropic rectangular parallelepipeds with two different minimum half-fracture spacing (0.5 and 1.0 m), as compared with the mass ratio calculated by first-order dual-porosity model.
(Zhou et al., 2016)
(a) (b)
CASE STUDY 3.8 — BSCSP (continued)
References
Birkholzer, J. T., C. M. Oldenburg, and Q. Zhou (2015), CO2 migration and pressure evolution in deep saline aquifers, Int. J. Greenh. Gas Cont., 40, 203–220, http://dx.doi.org/10.1016/j.ijggc.2015.03.022.
Spycher, N., K. Pruess, and J. Ennis-King (2003), CO2–H2O mixtures in the geological sequestration of CO2. I. Assessment and calculation of mutual solubilities from 12 to 100 °C and up to 600 bar, Geochim. Cosmochim. Acta 67 (16), 3015–3031.
Spycher, N., and K. Pruess (2005), CO2–H2O mixtures in the geological sequestration of CO2. II. Partitioning in chloride brines at 12–100 °C and up to 600 bar, Geochim. Cosmochim. Acta 69 (13), 3309–3320.
Zhou Q, J. T. Birkholzer, C. -F. Tsang and J. Rutqvist (2008), A method for quick assessment of CO2 storage capacity in closed and semi-closed saline formations, Int. J. Greenh. Gas Cont., 2(4), 626–639.
Zhou Q, J. T. Birkholzer, E. Mehnert, Y. F. Lin and K. Zhang (2010), Modeling basin- and plume-scale processes of CO2 storage for full-scale deployment, Ground Water 48(4), 494–514.
Zhou, Q., C. M. Oldenburg, L. H. Spangler, and J. T. Birkholzer (2016), Approximate solutions for diffusive fracture-matrix transfer: Application to storage of dissolved CO2 in fractured rocks, Water Resources Research (submitted).
3.0 BEST PRACTICES FOR NUMERIC SIMULATION
BEST PRACTICES: Risk Management and Simulation for Geologic Storage Projects96
MIDWEST GEOLOGICAL SEQUESTRATION CONSORTIUM (MGSC)
Including Complexity in Modeling to Inform Project Design
MGSC built several models during the course of the IBDP project to answer questions specific to each stage. For example, at the planning stage of the project, when very little data was available, generic, simple block models were used to answer questions related to the permitting process such as the maximum extent the AoR would need to cover. As the project progressed and site-specific data was collected, more detailed models that better represented the site-specific geologic architecture were built to answer design questions such as the injection pressure that would be required to inject the total amount of CO2 in the given time frame. After injection activities had been completed and data on the migration of CO2 had been acquired, the models were improved further to determine the maximum extent CO2 would travel and the final fate of the CO2. In each case, the models were improved and the amount of uncertainty was reduced as more data was acquired. In addition, the models were designed to answer the specific questions posed in order to be as efficient as possible with project resources and time.
CASE STUDY 3.9 — MGSC
3.0 BEST PRACTICES FOR NUMERIC SIMULATION
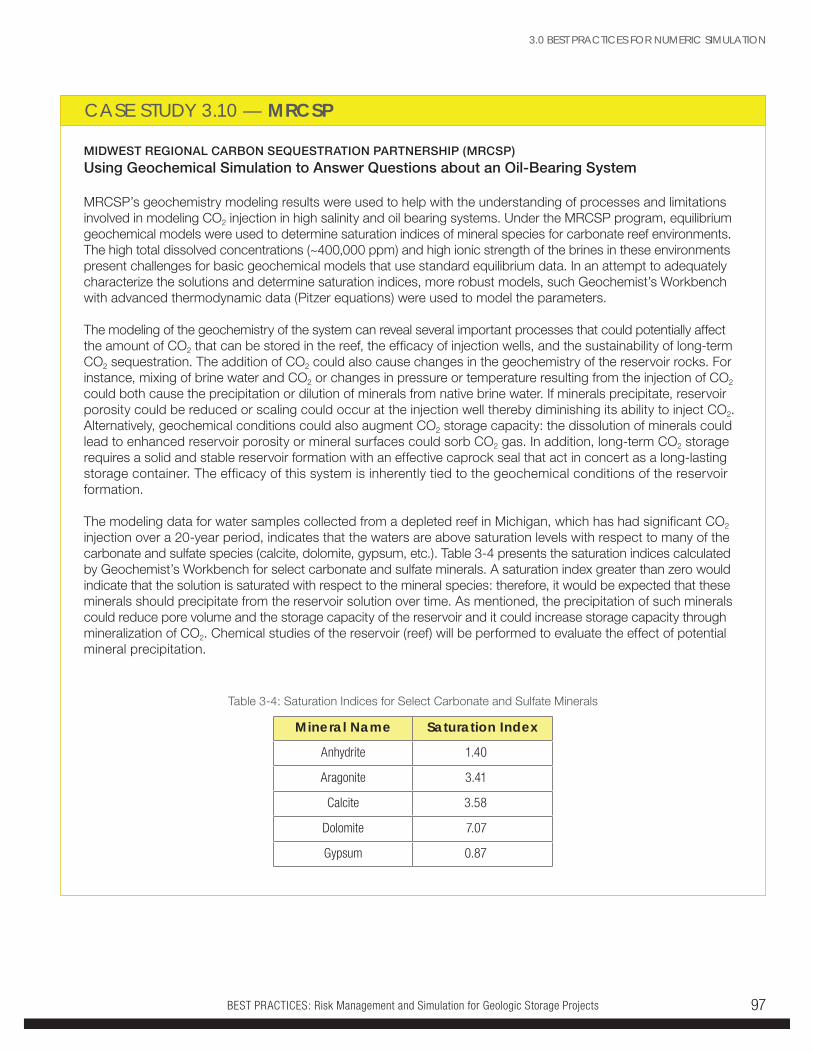
BEST PRACTICES: Risk Management and Simulation for Geologic Storage Projects 97
CASE STUDY 3.10 — MRCSP
MIDWEST REGIONAL CARBON SEQUESTRATION PARTNERSHIP (MRCSP)
Using Geochemical Simulation to Answer Questions about an Oil-Bearing System
MRCSP’s geochemistry modeling results were used to help with the understanding of processes and limitations involved in modeling CO2 injection in high salinity and oil bearing systems. Under the MRCSP program, equilibrium geochemical models were used to determine saturation indices of mineral species for carbonate reef environments. The high total dissolved concentrations (~400,000 ppm) and high ionic strength of the brines in these environments present challenges for basic geochemical models that use standard equilibrium data. In an attempt to adequately characterize the solutions and determine saturation indices, more robust models, such Geochemist’s Workbench with advanced thermodynamic data (Pitzer equations) were used to model the parameters.
The modeling of the geochemistry of the system can reveal several important processes that could potentially affect the amount of CO2 that can be stored in the reef, the efficacy of injection wells, and the sustainability of long-term CO2 sequestration. The addition of CO2 could also cause changes in the geochemistry of the reservoir rocks. For instance, mixing of brine water and CO2 or changes in pressure or temperature resulting from the injection of CO2 could both cause the precipitation or dilution of minerals from native brine water. If minerals precipitate, reservoir porosity could be reduced or scaling could occur at the injection well thereby diminishing its ability to inject CO2. Alternatively, geochemical conditions could also augment CO2 storage capacity: the dissolution of minerals could lead to enhanced reservoir porosity or mineral surfaces could sorb CO2 gas. In addition, long-term CO2 storage requires a solid and stable reservoir formation with an effective caprock seal that act in concert as a long-lasting storage container. The efficacy of this system is inherently tied to the geochemical conditions of the reservoir formation.
The modeling data for water samples collected from a depleted reef in Michigan, which has had significant CO2 injection over a 20-year period, indicates that the waters are above saturation levels with respect to many of the carbonate and sulfate species (calcite, dolomite, gypsum, etc.). Table 3-4 presents the saturation indices calculated by Geochemist’s Workbench for select carbonate and sulfate minerals. A saturation index greater than zero would indicate that the solution is saturated with respect to the mineral species: therefore, it would be expected that these minerals should precipitate from the reservoir solution over time. As mentioned, the precipitation of such minerals could reduce pore volume and the storage capacity of the reservoir and it could increase storage capacity through mineralization of CO2. Chemical studies of the reservoir (reef) will be performed to evaluate the effect of potential mineral precipitation.
Table 3-4: Saturation Indices for Select Carbonate and Sulfate Minerals
Mineral Name Saturation Index
Anhydrite 1.40
Aragonite 3.41
Calcite 3.58
Dolomite 7.07
Gypsum 0.87
3.0 BEST PRACTICES FOR NUMERIC SIMULATION
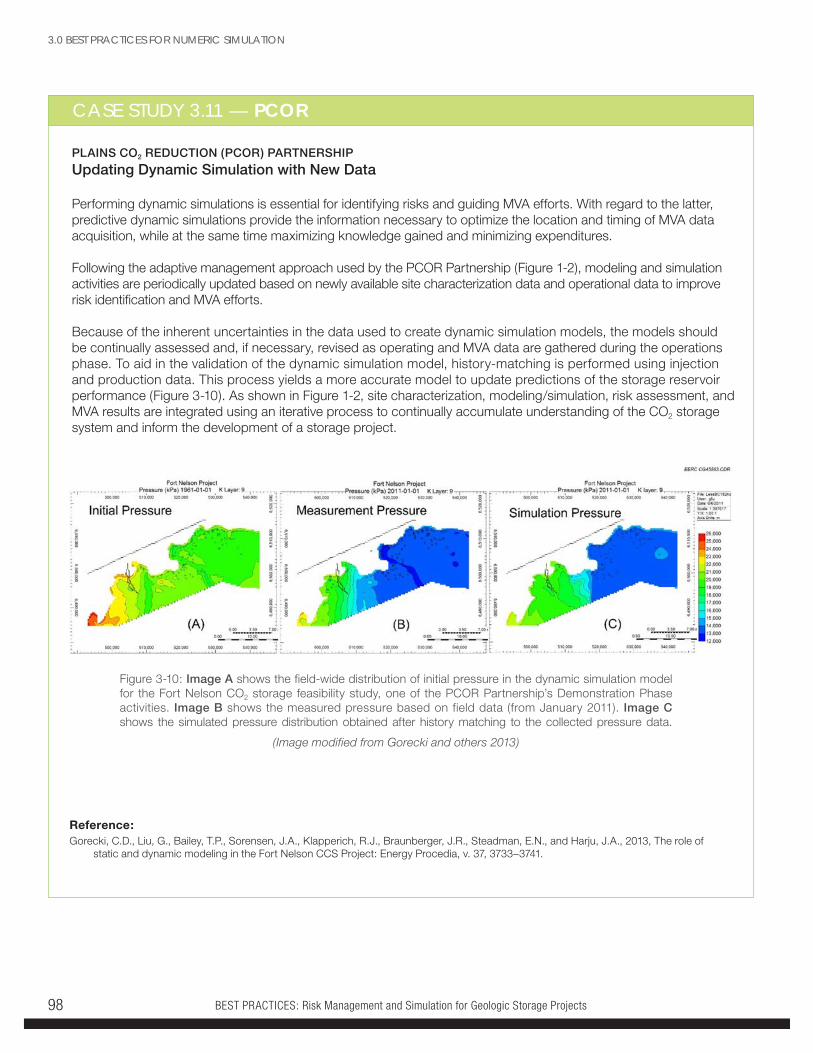
BEST PRACTICES: Risk Management and Simulation for Geologic Storage Projects98
- CASE STUDY 3.11 — PCOR
PLAINS CO2 REDUCTION (PCOR) PARTNERSHIP
Updating Dynamic Simulation with New Data
Performing dynamic simulations is essential for identifying risks and guiding MVA efforts. With regard to the latter, predictive dynamic simulations provide the information necessary to optimize the location and timing of MVA data acquisition, while at the same time maximizing knowledge gained and minimizing expenditures.
Following the adaptive management approach used by the PCOR Partnership (Figure 1-2), modeling and simulation activities are periodically updated based on newly available site characterization data and operational data to improve risk identification and MVA efforts.
Because of the inherent uncertainties in the data used to create dynamic simulation models, the models should be continually assessed and, if necessary, revised as operating and MVA data are gathered during the operations phase. To aid in the validation of the dynamic simulation model, history-matching is performed using injection and production data. This process yields a more accurate model to update predictions of the storage reservoir performance (Figure 3-10). As shown in Figure 1-2, site characterization, modeling/simulation, risk assessment, and MVA results are integrated using an iterative process to continually accumulate understanding of the CO2 storage system and inform the development of a storage project.
Reference:Gorecki, C.D., Liu, G., Bailey, T.P., Sorensen, J.A., Klapperich, R.J., Braunberger, J.R., Steadman, E.N., and Harju, J.A., 2013, The role of
static and dynamic modeling in the Fort Nelson CCS Project: Energy Procedia, v. 37, 3733–3741.
Figure 3-10: Image A shows the field-wide distribution of initial pressure in the dynamic simulation model for the Fort Nelson CO2 storage feasibility study, one of the PCOR Partnership’s Demonstration Phase activities. Image B shows the measured pressure based on field data (from January 2011). Image C shows the simulated pressure distribution obtained after history matching to the collected pressure data.
(Image modified from Gorecki and others 2013)
3.0 BEST PRACTICES FOR NUMERIC SIMULATION
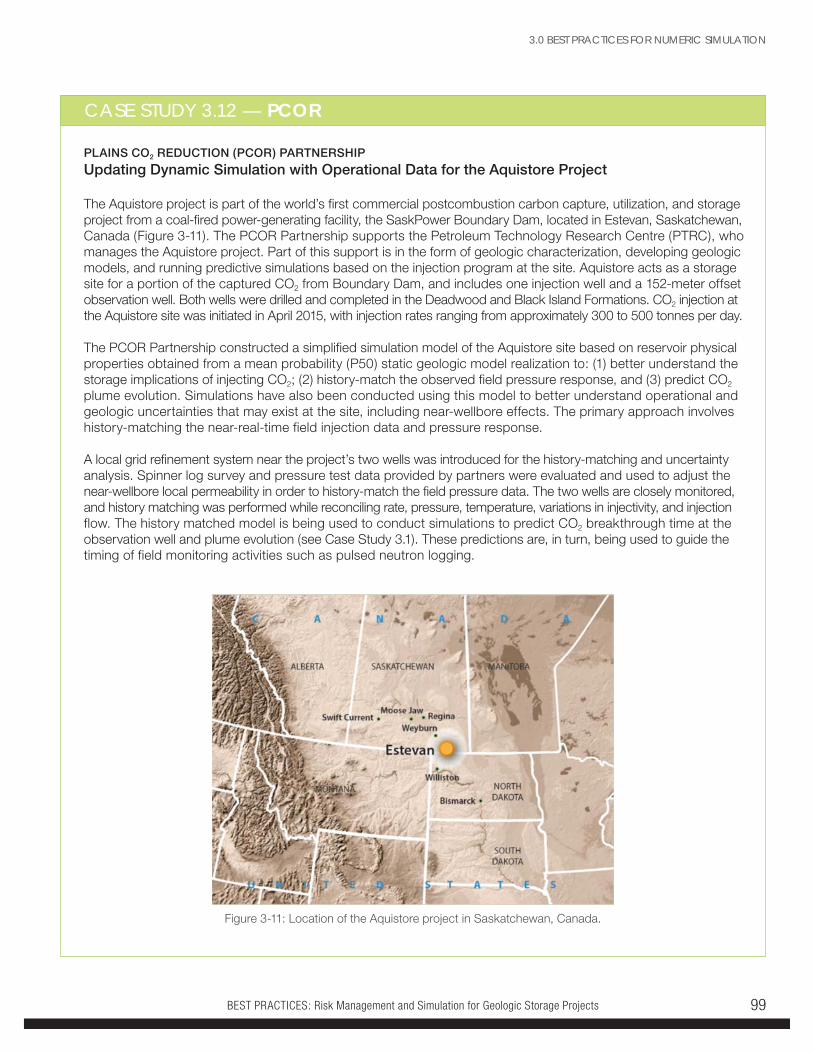
BEST PRACTICES: Risk Management and Simulation for Geologic Storage Projects 99
- CASE STUDY 3.12 — PCOR
PLAINS CO2 REDUCTION (PCOR) PARTNERSHIP
Updating Dynamic Simulation with Operational Data for the Aquistore Project
The Aquistore project is part of the world’s first commercial postcombustion carbon capture, utilization, and storage project from a coal-fired power-generating facility, the SaskPower Boundary Dam, located in Estevan, Saskatchewan, Canada (Figure 3-11). The PCOR Partnership supports the Petroleum Technology Research Centre (PTRC), who manages the Aquistore project. Part of this support is in the form of geologic characterization, developing geologic models, and running predictive simulations based on the injection program at the site. Aquistore acts as a storage site for a portion of the captured CO2 from Boundary Dam, and includes one injection well and a 152-meter offset observation well. Both wells were drilled and completed in the Deadwood and Black Island Formations. CO2 injection at the Aquistore site was initiated in April 2015, with injection rates ranging from approximately 300 to 500 tonnes per day.
The PCOR Partnership constructed a simplified simulation model of the Aquistore site based on reservoir physical properties obtained from a mean probability (P50) static geologic model realization to: (1) better understand the storage implications of injecting CO2; (2) history-match the observed field pressure response, and (3) predict CO2 plume evolution. Simulations have also been conducted using this model to better understand operational and geologic uncertainties that may exist at the site, including near-wellbore effects. The primary approach involves history-matching the near-real-time field injection data and pressure response.
A local grid refinement system near the project’s two wells was introduced for the history-matching and uncertainty analysis. Spinner log survey and pressure test data provided by partners were evaluated and used to adjust the near-wellbore local permeability in order to history-match the field pressure data. The two wells are closely monitored, and history matching was performed while reconciling rate, pressure, temperature, variations in injectivity, and injection flow. The history matched model is being used to conduct simulations to predict CO2 breakthrough time at the observation well and plume evolution (see Case Study 3.1). These predictions are, in turn, being used to guide the timing of field monitoring activities such as pulsed neutron logging.
Figure 3-11: Location of the Aquistore project in Saskatchewan, Canada.
3.0 BEST PRACTICES FOR NUMERIC SIMULATION
BEST PRACTICES: Risk Management and Simulation for Geologic Storage Projects100
4.0 CONCLUSIONThe ultimate goal of CO2 storage is to help reduce the amount of GHG emissions in the atmosphere by ensuring safe, secure, and verified permanent storage in geologic formations. Risk analysis and numeric simulation are critical tools used iteratively in conjunction with site characterization, monitoring, and public outreach throughout all stages of a geologic storage project to help meet these goals. This BPM builds on the experience of the RCSP Initiative and efforts within the research community, notably the IEAGHG R&D Program review of risk assessment guidelines (IEA 2009), to develop an approach for utilizing risk analysis and numeric simulation throughout the process of CO2 storage project site selection, design, operation, and closure. Together, risk analysis and numeric simulation are integral to decision-making for CCS project developers, operators, regulators, and public stakeholders. The results from risk analysis and simulation are relevant to decisions made at all stages in a CCS project, from site screening and selection to closure. These analyses need to be routinely undertaken throughout the life of a project and updated as experience and operational data are obtained.
Risk analysis and numeric simulation serve as critical tools in a framework to identify, estimate, and mitigate risks arising from CO2 injection into the subsurface. They are used not only to evaluate and quantify risks, but also to optimize monitoring design and facilitate more effective site characterization. Monitoring and site characterization are critical for developing improved models and associated risk analysis, and they also play a role in accounting and verification. Effective risk communication is key to educating the general public and serves as the basis for obtaining useful feedback from communities. Public outreach and communication are both informed by these activities and also generate input for the analysis, in the form of public views, concerns, and suggestions. All five activities—risk analysis, numeric simulation, site characterization, monitoring, and public outreach—are interdependent. Lessons learned from the RCSP Initiative indicate that all of these activities need to be carried out in an integrated manner.
This manual illustrates the concepts of risk analysis and numeric simulation by describing the experience gained by the RCSPs as they implemented multiple field projects. Successful implementation of geologic storage projects will require developers to compare critical criteria among candidate sites including storage capacity, health and environmental safety, economics, local regulatory constraints, monitoring efficacy, and potential ancillary benefits, such as enhanced hydrocarbon production. Risk analysis and numeric simulations will guide this implementation by providing stakeholders (operators, project developers, general public, and regulators) with information to predict the long-term fate of CO2. This manual is not intended to be prescriptive, but rather to share the experiences and lessons drawn from the risk analysis and numeric simulation activities of the RCSPs. Collectively this experience may serve as a foundation for developing a best practice approach to risk analysis and numeric simulation.
This manual is a companion to several other carbon storage best practices documents either recently published or under development within DOE. Subjects for these companion documents include site screening, selection, and characterization; monitoring, verification, and accounting; well construction and closure; public outreach and education; and terrestrial sequestration.
For more information on the Sequestration Program please visit our website at:
http://www.netl.doe.gov/research/coal/carbon-storage
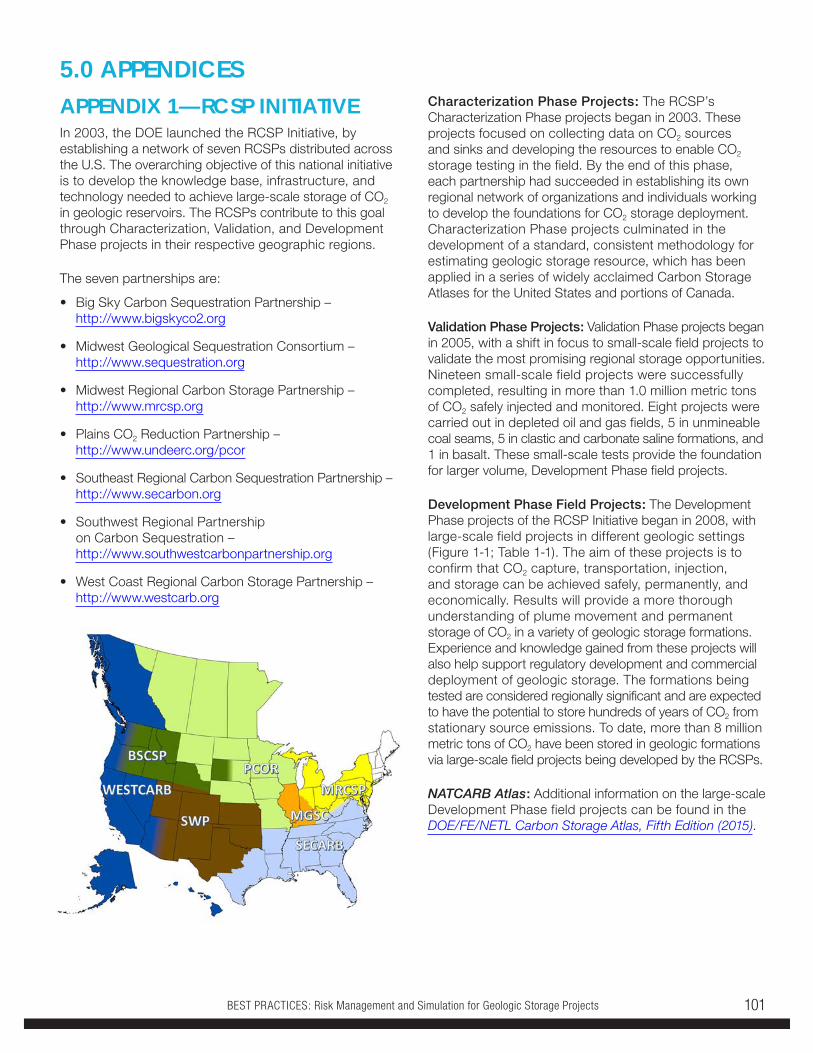
BEST PRACTICES: Risk Management and Simulation for Geologic Storage Projects 101
5.0 APPENDICESAPPENDIX 1—RCSP INITIATIVEIn 2003, the DOE launched the RCSP Initiative, by establishing a network of seven RCSPs distributed across the U.S. The overarching objective of this national initiative is to develop the knowledge base, infrastructure, and technology needed to achieve large-scale storage of CO2 in geologic reservoirs. The RCSPs contribute to this goal through Characterization, Validation, and Development Phase projects in their respective geographic regions.
The seven partnerships are:
• Big Sky Carbon Sequestration Partnership – http://www.bigskyco2.org
• Midwest Geological Sequestration Consortium – http://www.sequestration.org
• Midwest Regional Carbon Storage Partnership – http://www.mrcsp.org
• Plains CO2 Reduction Partnership – http://www.undeerc.org/pcor
• Southeast Regional Carbon Sequestration Partnership – http://www.secarbon.org
• Southwest Regional Partnership on Carbon Sequestration – http://www.southwestcarbonpartnership.org
• West Coast Regional Carbon Storage Partnership – http://www.westcarb.org
Characterization Phase Projects: The RCSP’s Characterization Phase projects began in 2003. These projects focused on collecting data on CO2 sources and sinks and developing the resources to enable CO2 storage testing in the field. By the end of this phase, each partnership had succeeded in establishing its own regional network of organizations and individuals working to develop the foundations for CO2 storage deployment. Characterization Phase projects culminated in the development of a standard, consistent methodology for estimating geologic storage resource, which has been applied in a series of widely acclaimed Carbon Storage Atlases for the United States and portions of Canada.
Validation Phase Projects: Validation Phase projects began in 2005, with a shift in focus to small-scale field projects to validate the most promising regional storage opportunities. Nineteen small-scale field projects were successfully completed, resulting in more than 1.0 million metric tons of CO2 safely injected and monitored. Eight projects were carried out in depleted oil and gas fields, 5 in unmineable coal seams, 5 in clastic and carbonate saline formations, and 1 in basalt. These small-scale tests provide the foundation for larger volume, Development Phase field projects.
Development Phase Field Projects: The Development Phase projects of the RCSP Initiative began in 2008, with large-scale field projects in different geologic settings (Figure 1-1; Table 1-1). The aim of these projects is to confirm that CO2 capture, transportation, injection, and storage can be achieved safely, permanently, and economically. Results will provide a more thorough understanding of plume movement and permanent storage of CO2 in a variety of geologic storage formations. Experience and knowledge gained from these projects will also help support regulatory development and commercial deployment of geologic storage. The formations being tested are considered regionally significant and are expected to have the potential to store hundreds of years of CO2 from stationary source emissions. To date, more than 8 million metric tons of CO2 have been stored in geologic formations via large-scale field projects being developed by the RCSPs.
NATCARB Atlas: Additional information on the large-scale Development Phase field projects can be found in the DOE/FE/NETL Carbon Storage Atlas, Fifth Edition (2015).
BEST PRACTICES: Risk Management and Simulation for Geologic Storage Projects102
APPENDIX 2—TEMPLATES FOR RISK MANAGEMENT PLAN AND RISK ASSESSMENT TASKS
RISK MANAGEMENT PLAN TEMPLATEThe following is an outline template for a Risk Management Plan that can be used to evaluate risk for the overall project scope. This can also be used for individual project tasks including field tasks that a more focused analysis.
1.0 INTRODUCTION
2.0 HSE OBJECTIVES & HSE POLICY
2.1 Project HSE Policy
3.0 PROJECT SCOPE
3.1 Objectives
3.2 Tasks
3.2.1 Task 1 3.2.2 Task 2 3.2.3 Task 3 3.2.4 Task 4
3.3 Timeline/Schedule
4.0 MANAGEMENT STRUCTURE, RESPONSIBILITIES & ACCOUNTABILITIES
4.1 Management Structure
4.2 Roles and Individual Responsibilities and Accountabilities
3.2.1 Project Management Team
5.0 COMMUNICATION
5.1 Communication Chain of Command
5.2 Routine Communications
5.3 Feedback
5.4 Management of Change
5.5 Regulatory Body Communication & Procedures
5.6 Emergency Communications & Procedures
5.6.1 Medical Emergencies5.6.2 Environmental Impacts5.6.3 Regulatory Reporting
6.0 PROJECT POLICIES & EXPECTATIONS
6.1 Federal, State & Local Regulations & Policies
6.2 Landowner Agreements & Policies
6.3 Waste Management
6.4 Site Access & Security
6.5 Weapons, Alcohol & Drugs
6.6 Safe Driving Policies
6.7 Fire Prevention & Protection
6.8 Other Project or Site Specific Policies
7.0 RISK IDENTIFICATION, ANALYSIS & RISK MANAGEMENT
(Review the scope in detail and determine what risks are associated with each task. For each category, you would identify the potential risks, you’d analyze each risk in terms of potential consequences, then you’d come up with ideas to avoid, mitigate or manage those risks. It is always helpful to summarize this in a table format too [See example]).
7.1 Task 1
7.1.1 Risk Identification7.1.2 Risk Analysis7.1.3 Risk Management
7.2 Task 2
7.2.1 Risk Identification7.2.2 Risk Analysis7.2.3 Risk Management
7.3 Task 3
7.3.1 Risk Identification7.3.2 Risk Analysis7.3.3 Risk Management
7.4 Task 4
7.4.1 Risk Identification7.4.2 Risk Analysis7.4.3 Risk Management
APPENDICES
BEST PRACTICES: Risk Management and Simulation for Geologic Storage Projects 103
8.0 IMPLEMENTATION & MANAGEMENT OF RISK ANALYSIS
8.1 Risk Analysis Implementation Process (Describe how the project will implement the results of the risk analysis – the implementation process should align with the roles/responsibilities and communication chain of command.)
8.2 Risk Analysis Information Management
9.0 UPDATES TO RISK ANALYSIS & RISK MANAGEMENT PLAN
9.1 Risk Analysis Review Process (Describe how the project will implement the risk analysis review process – the implementation process should align with the roles/responsibilities and communication chain of command.)
9.1.2 Lessons-Learned
9.2 Risk Management Plan Update Process (Describe how the project will manage the data/info as the project evolves. How will updates, lessons-learned or new/emerging risks be documented and communicated? Possibly through revisions to the original Risk Management Plan? Or possibly through revisions to a risk management database?
The following is an example of a ‘hazard identification and control table’ that was developed for a water sampling field effort. This table was included in a RMP that was prepared for water sampling field activities. The table provides a summary of the tasks, risks, controls and sources of additional information associated with the project’s water sampling risk analysis management plan and provides a quick reference guide for field staff and project management.
APPENDICES
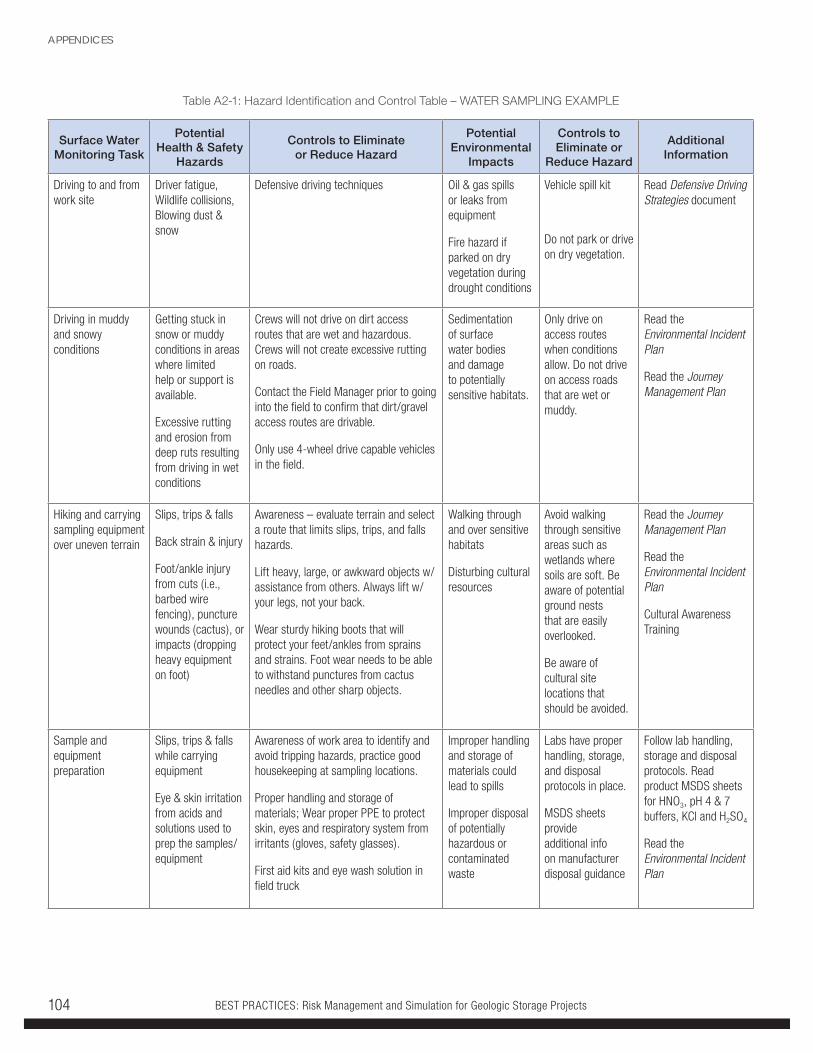
BEST PRACTICES: Risk Management and Simulation for Geologic Storage Projects104
Surface Water Monitoring Task
Potential Health & Safety
Hazards
Controls to Eliminate or Reduce Hazard
Potential Environmental
Impacts
Controls to Eliminate or
Reduce Hazard
Additional Information
Driving to and from work site
Driver fatigue, Wildlife collisions, Blowing dust & snow
Defensive driving techniques Oil & gas spills or leaks from equipment
Fire hazard if parked on dry vegetation during drought conditions
Vehicle spill kit
Do not park or drive on dry vegetation.
Read Defensive Driving Strategies document
Driving in muddy and snowy conditions
Getting stuck in snow or muddy conditions in areas where limited help or support is available.
Excessive rutting and erosion from deep ruts resulting from driving in wet conditions
Crews will not drive on dirt access routes that are wet and hazardous. Crews will not create excessive rutting on roads.
Contact the Field Manager prior to going into the field to confirm that dirt/gravel access routes are drivable.
Only use 4-wheel drive capable vehicles in the field.
Sedimentation of surface water bodies and damage to potentially sensitive habitats.
Only drive on access routes when conditions allow. Do not drive on access roads that are wet or muddy.
Read the Environmental Incident Plan
Read the Journey Management Plan
Hiking and carrying sampling equipment over uneven terrain
Slips, trips & falls
Back strain & injury
Foot/ankle injury from cuts (i.e., barbed wire fencing), puncture wounds (cactus), or impacts (dropping heavy equipment on foot)
Awareness – evaluate terrain and select a route that limits slips, trips, and falls hazards.
Lift heavy, large, or awkward objects w/ assistance from others. Always lift w/ your legs, not your back.
Wear sturdy hiking boots that will protect your feet/ankles from sprains and strains. Foot wear needs to be able to withstand punctures from cactus needles and other sharp objects.
Walking through and over sensitive habitats
Disturbing cultural resources
Avoid walking through sensitive areas such as wetlands where soils are soft. Be aware of potential ground nests that are easily overlooked.
Be aware of cultural site locations that should be avoided.
Read the Journey Management Plan
Read the Environmental Incident Plan
Cultural Awareness Training
Sample and equipment preparation
Slips, trips & falls while carrying equipment
Eye & skin irritation from acids and solutions used to prep the samples/equipment
Awareness of work area to identify and avoid tripping hazards, practice good housekeeping at sampling locations.
Proper handling and storage of materials; Wear proper PPE to protect skin, eyes and respiratory system from irritants (gloves, safety glasses).
First aid kits and eye wash solution in field truck
Improper handling and storage of materials could lead to spills
Improper disposal of potentially hazardous or contaminated waste
Labs have proper handling, storage, and disposal protocols in place.
MSDS sheets provide additional info on manufacturer disposal guidance
Follow lab handling, storage and disposal protocols. Read product MSDS sheets for HNO3, pH 4 & 7 buffers, KCl and H2SO4
Read the Environmental Incident Plan
Table A2-1: Hazard Identification and Control Table – WATER SAMPLING EXAMPLE
APPENDICES
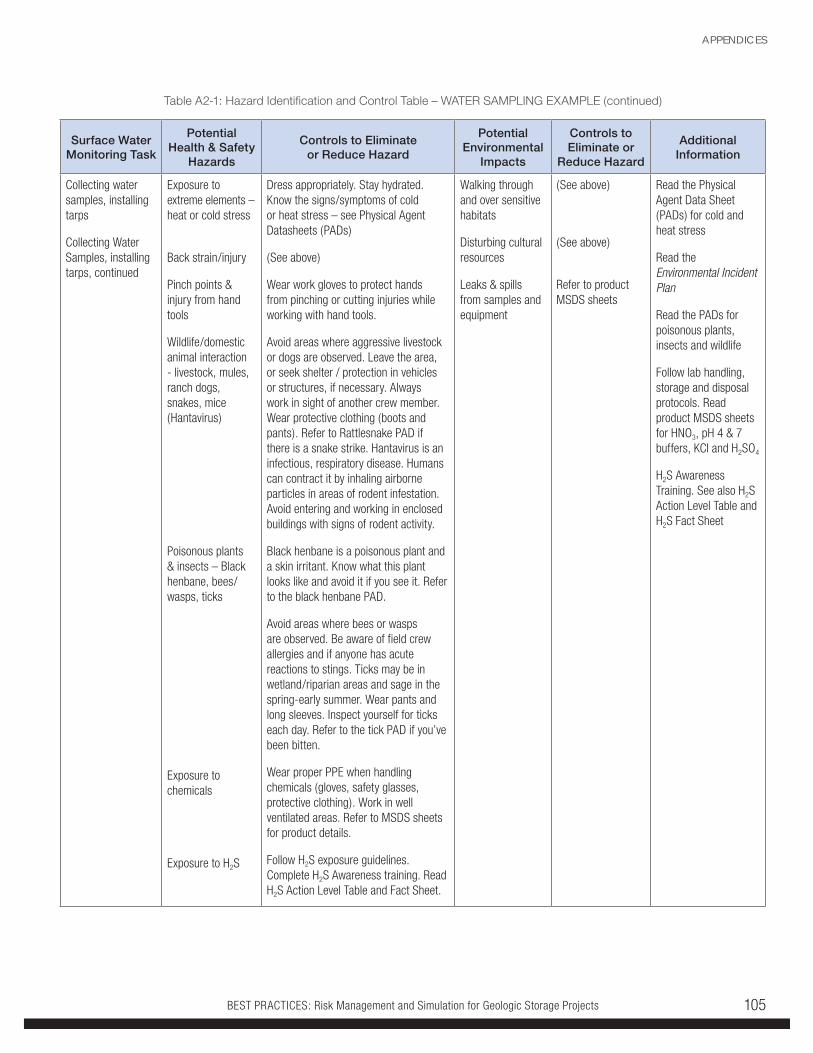
BEST PRACTICES: Risk Management and Simulation for Geologic Storage Projects 105
Surface Water Monitoring Task
Potential Health & Safety
Hazards
Controls to Eliminate or Reduce Hazard
Potential Environmental
Impacts
Controls to Eliminate or
Reduce Hazard
Additional Information
Collecting water samples, installing tarps
Collecting Water Samples, installing tarps, continued
Exposure to extreme elements – heat or cold stress
Back strain/injury
Pinch points & injury from hand tools
Wildlife/domestic animal interaction - livestock, mules, ranch dogs, snakes, mice (Hantavirus)
Poisonous plants & insects – Black henbane, bees/wasps, ticks
Exposure to chemicals
Exposure to H2S
Dress appropriately. Stay hydrated. Know the signs/symptoms of cold or heat stress – see Physical Agent Datasheets (PADs)
(See above)
Wear work gloves to protect hands from pinching or cutting injuries while working with hand tools.
Avoid areas where aggressive livestock or dogs are observed. Leave the area, or seek shelter / protection in vehicles or structures, if necessary. Always work in sight of another crew member. Wear protective clothing (boots and pants). Refer to Rattlesnake PAD if there is a snake strike. Hantavirus is an infectious, respiratory disease. Humans can contract it by inhaling airborne particles in areas of rodent infestation. Avoid entering and working in enclosed buildings with signs of rodent activity.
Black henbane is a poisonous plant and a skin irritant. Know what this plant looks like and avoid it if you see it. Refer to the black henbane PAD.
Avoid areas where bees or wasps are observed. Be aware of field crew allergies and if anyone has acute reactions to stings. Ticks may be in wetland/riparian areas and sage in the spring-early summer. Wear pants and long sleeves. Inspect yourself for ticks each day. Refer to the tick PAD if you’ve been bitten.
Wear proper PPE when handling chemicals (gloves, safety glasses, protective clothing). Work in well ventilated areas. Refer to MSDS sheets for product details.
Follow H2S exposure guidelines. Complete H2S Awareness training. Read H2S Action Level Table and Fact Sheet.
Walking through and over sensitive habitats
Disturbing cultural resources
Leaks & spills from samples and equipment
(See above)
(See above)
Refer to product MSDS sheets
Read the Physical Agent Data Sheet (PADs) for cold and heat stress
Read the Environmental Incident Plan
Read the PADs for poisonous plants, insects and wildlife
Follow lab handling, storage and disposal protocols. Read product MSDS sheets for HNO3, pH 4 & 7 buffers, KCl and H2SO4
H2S Awareness Training. See also H2S Action Level Table and H2S Fact Sheet
Table A2-1: Hazard Identification and Control Table – WATER SAMPLING EXAMPLE (continued)
APPENDICES
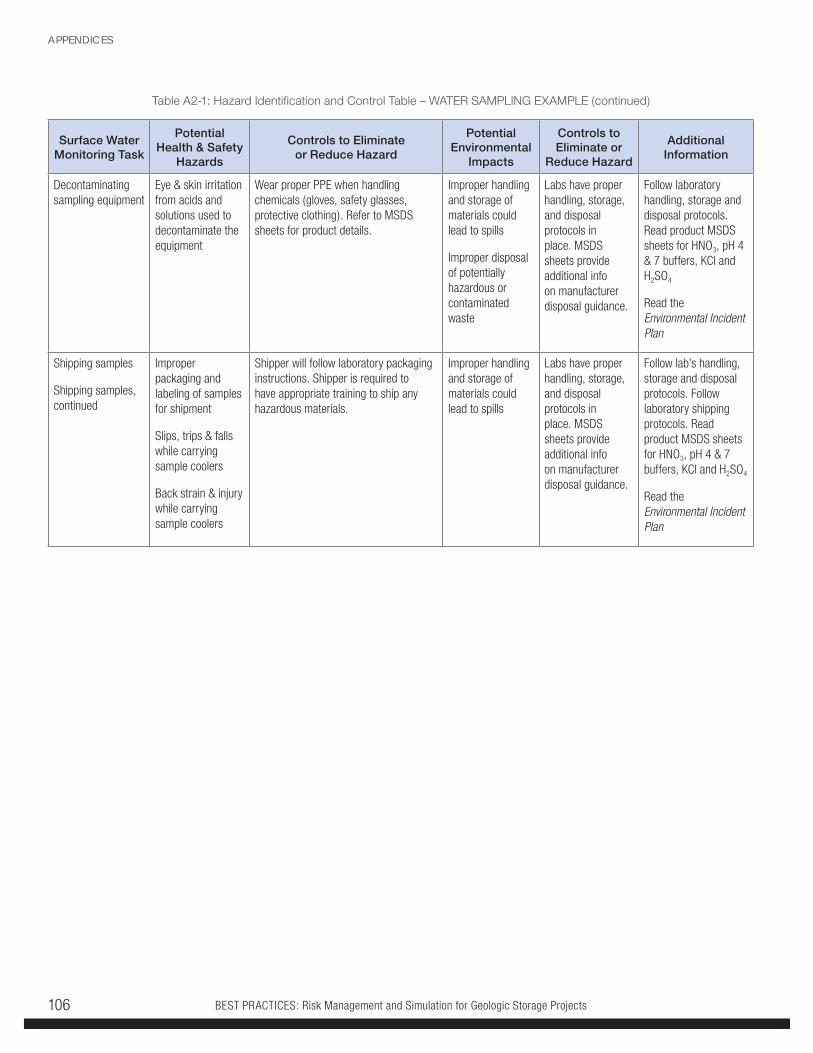
BEST PRACTICES: Risk Management and Simulation for Geologic Storage Projects106
Surface Water Monitoring Task
Potential Health & Safety
Hazards
Controls to Eliminate or Reduce Hazard
Potential Environmental
Impacts
Controls to Eliminate or
Reduce Hazard
Additional Information
Decontaminating sampling equipment
Eye & skin irritation from acids and solutions used to decontaminate the equipment
Wear proper PPE when handling chemicals (gloves, safety glasses, protective clothing). Refer to MSDS sheets for product details.
Improper handling and storage of materials could lead to spills
Improper disposal of potentially hazardous or contaminated waste
Labs have proper handling, storage, and disposal protocols in place. MSDS sheets provide additional info on manufacturer disposal guidance.
Follow laboratory handling, storage and disposal protocols. Read product MSDS sheets for HNO3, pH 4 & 7 buffers, KCl and H2SO4
Read the Environmental Incident Plan
Shipping samples
Shipping samples, continued
Improper packaging and labeling of samples for shipment
Slips, trips & falls while carrying sample coolers
Back strain & injury while carrying sample coolers
Shipper will follow laboratory packaging instructions. Shipper is required to have appropriate training to ship any hazardous materials.
Improper handling and storage of materials could lead to spills
Labs have proper handling, storage, and disposal protocols in place. MSDS sheets provide additional info on manufacturer disposal guidance.
Follow lab’s handling, storage and disposal protocols. Follow laboratory shipping protocols. Read product MSDS sheets for HNO3, pH 4 & 7 buffers, KCl and H2SO4
Read the Environmental Incident Plan
Table A2-1: Hazard Identification and Control Table – WATER SAMPLING EXAMPLE (continued)
APPENDICES
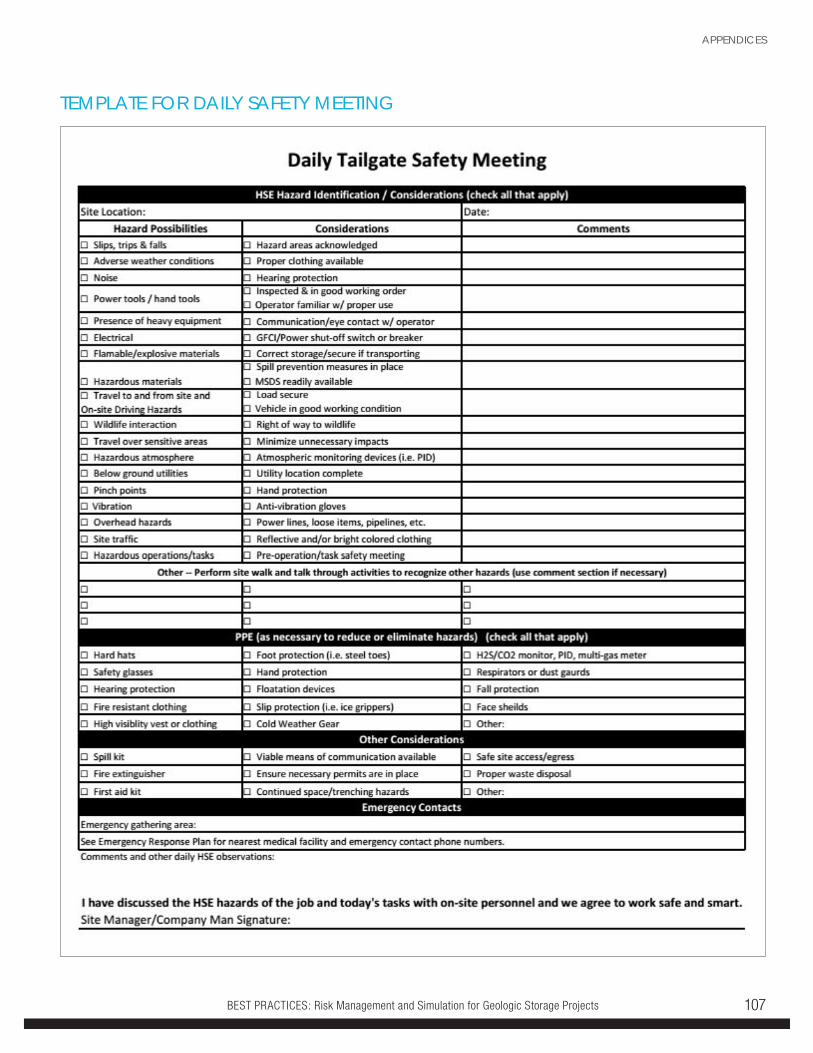
BEST PRACTICES: Risk Management and Simulation for Geologic Storage Projects 107
TEMPLATE FOR DAILY SAFETY MEETING
APPENDICES
BEST PRACTICES: Risk Management and Simulation for Geologic Storage Projects108
REFERENCESAarnes, J.; M. Carpenter; and K. Kvien. 2010. CO2QUALSTORE—Guideline for Selection and Qualification of Sites and
Projects for Geological Storage of CO2. International Journal of GHG Control 5(4):942–951.
Borja, R., 2004, Cam-Clay plasticity. Part V: A mathematical framework for three-phase deformation and strain localization analyses of partially saturated porous media. Computer Methods in Applied Mechanics and Engineering, v. 193, p. 5301–5338.
Buxton, Bruce; Gupta, N.; Moody, M.; Sminchak, J.; and, Weber, S. 2015. Approach for Assessing Wellbore Integrity to Prioritize Study Areas for Potential Siting of a Carbon Dioxide Repository, SPE-177315-MS presented at the SPE Eastern Regional Meeting, Morgantown, West Virginia, 13–15 October 2015.
Celia, M., and Nordbotten, J.M., 2010. How simple can we make models for CO2 injection, migration, and leakage? International Conference of GHG Technologies (GHGT 2010), Elsevier/Energy Procedia.
Condor, J., Unatrakarn, D., Wilson, M., & Asghan, K. (2011). A comparative analysis of risk assessment methodologies for the geologic storage of carbon dioxide. Energy Procedia, 4, 4036–4043.
CSA (2012) Z741-12 - Geological Storage of Carbon Dioxide, Canadian Standards Association.
Damien, K., Faaij, A., and Turkenburg, W. (2006). Health, safety, and environmental risks of underground CO2 storage—Overview of mechanisms and current knowledge. Climate Change, 74 (1–3): 289–318.
DNV. 2003. Risk Analysis of Geological Sequestration of Carbon Dioxide, Report Number R249, 109p.
DNV. 2010. DNV-RP-J201 (DNV-RP-J201: Qualification Procedures for CO2 Capture Technology 2010). http://rules.dnvgl.com/docs/pdf/DNV/codes/docs/2010-04/RP-J201.pdf
DNV. 2010. DNV-RP-J202 (DNV-RP-J202: Design and Operation of CO2 Pipelines 2010). http://rules.dnvgl.com/docs/pdf/DNV/codes/docs/2010-04/RP-J202.pdf
DOE-NETL (2016) National Risk Assessment Partnership (NRAP), Accessed March 22, 2016 from http://www.netl.doe.gov/research/coal/crosscutting/national-risk-assessment-partnership
DOE-NETL. 2011 edition. Best Practices for: Risk Analysis and Simulation for Geological Storage of CO2.
Forbes, S., et al. 2008. World Resources Institute (WRI) CCS Guidelines—Guidelines for Carbon Dioxide Capture, Transport, and Storage.
Ge, S.; G. Garven. 1992. Hydromechanical modeling of tectonically driven groundwater flow with application to the Arkoma Foreland Basin. Journal of Geophysical Research, 97(B6), 9119–9144.
Gorecki, C.D., Hamling, J.A., Klapperich, R.J., Steadman, E.N., and Harju, J.A., 2012, Integrating CO2 EOR and CO2 storage in the Bell Creek oil field: Carbon Management Technology Conference (CMTC) Paper 151476, February 2012.
BEST PRACTICES: Risk Management and Simulation for Geologic Storage Projects 109
Haagsma, Autumn; Burchwell, A.; Moody, M.; Gerst, J.; and Sminchak, J. 2015. Utilizing Cement Bond Logs to Evaluate Wellbore Integrity on Local and Regional Scales, SPE-177316-MS presented at the SPE Eastern Regional Meeting, Morgantown, West Virginia, 13–15 October 2015.
Hamling, J.A., Gorecki, C.D., Klapperich, R.J., Saini, D., and Steadman, E.N., 2013, Overview of the Bell Creek combined CO2 storage and CO2 enhanced oil recovery project: Energy Procedia, v. 37, p. 6402–6411.
IEA GHG Risk Assessment Network, “A Review of the International State of the Art in Risk Assessment Guidelines and Proposed Terminology for Use of CO2 Geological Storage,” Technical Review 2009/TR7, December 2009, found online at http://www.ieaghg.org/docs/General_Docs/Reports/2009-TR7.pdf IEA GHG R&D Programme. Anna Korre and Sevket Durucan, Imperial College. 5 November 2009.
Implementation of Directive 2009/31/EC on the Geological Storage of Carbon Dioxide, Guidance Document 1—CO2 Storage Life Cycle Risk Management Framework (EC 2011).
ISO 31000 (2009) Risk Management—Principles and Guidelines, First Edition. International Organization for Standardization, ISO 31000:2009E.
Kobos and others, 2007, The ‘String of Pearls’: The Integrated Assessment Cost and Source-Sink Model, The 6th Annual Carbon Capture & Sequestration Conference, Pittsburgh, PA, May 7–10, 2007.
McCollum, David L. and Joan M. Odgen, 2006, Techno-Economic Models for Carbon Dioxide Compression, Transport, and Storage, UCD-ITS-RR-06-14, University of California, Davis, Davis, California.
McPherson, B. J. O. L., and G. Garven, 1999. Hydrodynamics and overpressure mechanisms in the Sacramento Basin, California, American Journal of Science, 299, p. 429–466.
Oldenburg, C.M., G.J. Moridis, N. Spycher, and K. Pruess, 2004, EOS7C version 1.0: TOUGH2 module for carbon dioxide or nitrogen in natural gas (methane) reservoirs, Lawrence Berkeley National Laboratory Report LBNL-56589. http://repositories.cdlib.org/lbnl/LBNL-273E.
Pawar, R.J.; Bromhal, G.S.; Carey, J.W.; Foxall, W.; Korre, A.; Ringrose, P.S.; Tucker, O.; Watson, M.N.; White, J.A. (2015) Recent advances in risk assessment and risk management of geologic CO2 storage. International Journal of Greenhouse Gas Control, Volume 40, September 2015, Pages 292–311.
Person, M., J. P. Raffensperger, S. Ge, and G. Garven (1996), Basin-scale hydrogeologic modeling, Reviews of Geophysics, 34(1), 61–87, doi:10.1029/95RG03286.
Pruess, K. and Narasimhan T. N., 1982, On Fluid Reserves and the Production of Superheated Steam from Fractured, Vapor-Dominated Geothermal Reservoirs: Journal Geophysical Research, v. 87, (B 11) p. 9329–9339.
Pruess, K. and Narasimhan T.N., 1985, A Practical Method for Modeling Fluid and Heat Flow in Fractured Porous Media: Society of Petroleum Engineers Journal, v. 25, no. 1, p. 14–26.
REFERENCES
BEST PRACTICES: Risk Management and Simulation for Geologic Storage Projects110
Pruess, K., J. Garcıa, T. Kovscek, C. Oldenburg, J. Rutqvist, C. Steefel, T. Xu, 2004, Code intercomparison builds confidence in numerical simulation models for geologic disposal of CO2, Energy 29, 1431–1444.
Quintessa (2014). Generic CO2 FEP Database, Version 2.0. Quintessa Limited, Henley-on-Thames, United Kingdom. Open access on-line database https://www.quintessa.org/co2fepdb/.
Quintessa (2016) CO2 FEP Database, Version 2.0 released, December 2013, Quintessa Limited, Henley-on-Thames, United Kingdom. Open access on-line database http://www.quintessa.org/co2fepdb/.
Rutqvist, J., Vasco, D.W. & Myer, L., 2009. Coupled reservoir-geomechanical analysis of CO2 Algeria. Energy Procedia, 1(1), pp. 1847–1854.
Rutqvist, J. 2012. The Geomechanics of CO2 Storage in Deep Sedimentary Formations Geotech Geol Eng (2012) 30: 525.
Steadman, E.N., Anagnost, K.K., Botnen, B.W., Botnen, L.S., Daly, D.J., Gorecki, C.D., Harju, J.A., Jensen, M.D., Peck, W.D., Romuld, L., Smith, S.A., Sorensen, J.A., and Votava, T.J., 2011, The Plains CO2 Reduction (PCOR) Partnership—developing carbon management options for the central interior of North America: Energy Procedia, v. 4, p. 6061–6068.
Taylor, S.W., Milly, P.C.D., and Jaffe, P.R., 1990, Biofilm growth and the related changes in the physical properties of a porous medium. 2. Permeability: Water Resources Research, v. 26, p. 2161–2169.
Yamaguchia, Kohei, et al, Features Events and Processes (FEPs) and Scenario Analysis in the Field of CO2 Storage, Energy Procedia 37 (2013) 4833–4842, published by El Sevier, (2013). (http://www.sciencedirect.com/science/article/pii/S187661021300636X).
REFERENCES
BEST PRACTICES: Risk Management and Simulation for Geologic Storage Projects 111
ACKNOWLEDGMENTSThis report presents information prepared by the Simulation and Risk Assessment Working Group as part of the RCSP Initiative. Lead authors and contributing authors include the following:
Big Sky Carbon Sequestration PartnershipJeanette Blank and Lindsey Tollefson
Midwest Geologic Sequestration ConsortiumNathan Grigsby, Scott Frailey, James Damico, and Roland Okwen
Midwest Regional Carbon Sequestration PartnershipLydia Cumming, Priya Ravi-Ganesh, and Sarah Wade
Plains CO2 Reduction PartnershipScott Ayash and Charles Gorecki
Southeast Regional Carbon Sequestration PartnershipGerald Hill
Southwest Regional Partnership on Carbon SequestrationBrian McPherson and Martin Appold
NETL Support to Simulation and Risk Assessment Working GroupRobert Dilmore
The authors wish to acknowledge the excellent guidance, contributions, and cooperation of NETL staff, particularly:
NETL Federal Project ManagersAndrea Dunn and Kylee Rice
NETL ResearcherAngela Goodman
NETL Portfolio ManagerTraci Rodosta
BEST PRACTICES: Risk Management and Simulation for Geologic Storage Projects112
NATIONAL ENERGY TECHNOLOGY LABORATORY
U.S. DEPARTMENT OF ENERGY OFFICE OF FOSSIL ENERGY
CARBON STORAGE PROGRAM PORTFOLIO MANAGERTraci [email protected]
Darin [email protected]
CARBON STORAGE TEAM SUPERVISORKanwal [email protected]
BEST PRACTICE MANUAL LEADKylee [email protected]
CONTACTSPlease contact the following individuals for more information about DOE’s Carbon Storage Program:

BEST PRACTICES: Risk Management and Simulation for Geologic Storage Projects

www.NETL.DOE.govScan this with your smartphone to link to NETL’s website.
BEST PRACTICESJUNE 2017
1450 Queen Avenue SW Albany, OR 97321-2198 541-967-5892
3610 Collins Ferry Road P.O. Box 880 Morgantown, WV 26507-0880 304-285-4764
626 Cochrans Mill Road P.O. Box 10940 Pittsburgh, PA 15236-0940 412-386-4687
Program staff are also located in Houston, Texas and Anchorage, Alaska
CUSTOMER SERVICE 1-800-553-7681