Embed Size (px)
Citation preview

In the following report, Hanover Research reviews best practices in university parking and
transportation administration and profiles the transportation services offered by five large
universities.
Best Practices in University Transportation Services
May 2014

Hanover Research | May 2014
© 2014 Hanover Research | Academy Administration Practice 2
TABLE OF CONTENTS
Executive Summary and Key Findings ................................................................................ 3
Introduction ........................................................................................................................... 3
Key Findings ........................................................................................................................... 3
Organizational Structure .................................................................................................... 3
Transit ................................................................................................................................ 3
Parking ............................................................................................................................... 4
Fleet ................................................................................................................................... 4
TDM Initiatives and Programs ........................................................................................... 4
Section I: Best Practices ..................................................................................................... 5
Transit .................................................................................................................................... 5
Parking ................................................................................................................................... 6
Fleet ....................................................................................................................................... 6
Transportation Demand Management and Integrated Services ........................................... 7
Section II: Profiles in Practice ............................................................................................. 8
Iowa State University ............................................................................................................. 9
Pennsylvania State University – Main Campus ................................................................... 14
Texas A&M University – College Station ............................................................................. 19
University of Colorado Boulder ........................................................................................... 22
University of Virginia ........................................................................................................... 25

Hanover Research | May 2014
© 2014 Hanover Research | Academy Administration Practice 3
EXECUTIVE SUMMARY AND KEY FINDINGS
INTRODUCTION
This report examines the administration of parking and transportation services at large universities. The main focus areas include administrative and financial structures and considerations, physical capacity and fleet sizes, and operational details, such as the frequency of shuttle service to perimeter lots. In order to gather this information, Hanover Research conducted both primary and secondary research on best practices and practices at large universities. The report is structured as follows:
Section I highlights best practices in parking and transportation administration and operation, and it also discusses transportation demand management; and
Section II presents five profiles of parking and transportation administration and operation, with information drawn from secondary sources as well as interviews with institutional contacts.
The key findings of our research are provided below.
KEY FINDINGS
ORGANIZATIONAL STRUCTURE
The majority of the institutions profiled for this report integrate parking and transportation services and responsibilities. However, it is important to note that information pertinent to this report is substantially more forthcoming from institutions with integrated services. While the sample is biased toward institutions with integrated services, contacts from these institutions stressed how critically important it is to take an integrated approach. However, the various components of parking and transportation services, such as parking, transit, and fleet operations, are separate entities for accounting purposes, even at institutions with an integrated approach. Furthermore, all units are auxiliary units, and they are not subsidized by the university. Of the institutions profiled for this report, Penn State, Texas A&M, the University of Colorado Boulder, and the University of Virginia consolidate all university‐run transportation operations in one department or division. At Iowa State, there are multiple entities covering these services.
TRANSIT
Of the institutions examined for this report, three rely on university‐owned and university‐operated bus routes to transport students on campus. Texas A&M operates all transit service on and around its campus. Meanwhile, the University of Colorado Boulder

Hanover Research | May 2014
© 2014 Hanover Research | Academy Administration Practice 4
operates a shuttle that connects its multiple campuses and provides very limited service within the main campus, and the University of Virginia provides transit service within its campus. Both of these institutions also partner with local transit authorities to provide free service for students, faculty, and staff. Finally, Penn State has established transit authorities in coordination with local governments, with the university serving as the primary local source of revenue.
PARKING
Most institutions examined for this report are facing pressure as parking moves to the perimeter of the campus or as the number of parking spaces is being reduced due to building growth. The primary response to this pressure is to shift away from parking and single‐occupancy vehicle use. All institutions researched for the report provide transportation to parking lots or rely on local authorities to do so. This includes storage lots at the perimeter of campus, which are a staple across campuses. Bus service to these lots is typically very frequent on weekdays and approximately every 20 minutes on weekends, with hours of operation varying but starting and ending later on weekends. Contacts responsible for parking operations universally noted that pricing structures for parking permits include lower prices for perimeter parking to shift congestion out of the main campus areas. A central challenge and concern is generating sufficient revenue to cover the costs of parking facilities maintenance. Challenges in this area include capped revenues for faculty and staff, as well as university policies for free and reduced‐price permits.
FLEET
Fleet and charter services are typically a small component of parking and transportation services at the profiled institutions. The fleet sizes for the two institutions publicly releasing that information were between 600 and 700 vehicles. For those institutions with a full‐service maintenance center, compliance is a major component of their work.
TDM INITIATIVES AND PROGRAMS
With space limited and at a premium, TDM initiatives are becoming a very prominent component of the work done by parking and transportation entities. These include car sharing, ride sharing, bike sharing, and other commuter programs. Generally speaking, universities partner with outside entities around car sharing, ride sharing, and bike sharing. Other commuter benefits, such as carpool incentives, are typically more internal and relate to parking operations. However, Penn State partners with the local joint transit authority for commuter benefits. Many bicycle programs, such as registration and designated bicycle trails and lanes, are also more internal for the university.

Hanover Research | May 2014
© 2014 Hanover Research | Academy Administration Practice 5
SECTION I: BEST PRACTICES The transportation challenges facing colleges and universities are complex. Universities face rising enrollments that bring rising demand for parking and transportation, as well as increasing congestion in surrounding areas. In addition, the university campus integrates a wide variety of transportation types, including pedestrians, bicyclists, cars, and buses. Traffic from these various modes of transportation often creates bottlenecks, and the intersection of jurisdictional authority further complicates matters.1 In considering the organizational structure for transportation at and around a university campus, there are three main areas of consideration, in addition to the cross‐cutting considerations of transportation demand management (TDM). These three areas include transit, parking, and fleet services. While identified separately here, the vast majority of research in this area promotes an integrated approach that considers each component in the context of transportation at the university as a whole. As there are very few sources describing best practices in parking and transportation services among universities in the United States, this section draws on a limited range of reports identifying common and effective practices.
TRANSIT
One of the core responsibilities for transportation authorities at universities is transit service, particularly bus transportation. Universities typically provide free transportation services for the campus community; offer unlimited local transit passes to students, faculty, and staff; or support the local transportation authority in providing no‐fare transit services for the campus community.2 A recent report from the Frontier Group and the national consumer group and research entity, U.S. PIRG, identifies 101 colleges and universities in the United States with either no‐fare transit or unlimited transit pass (U‐Pass) systems for their students. The report also lists 36 colleges and universities that offer fare discount programs.3 A 2010 report from the Texas Transportation Institute (TTI), an institution of the Texas A&M University System, asserts that it is common practice for universities to collaborate with the
1 Ibid., pp. 3‐4. 2 [1] Van Heeke, Sullivan, and Baxandall, Op. cit., p. 5. [2] Primary research cited in Section II. 3 Van Heeke, T., E. Sullivan, and P. Baxandall. “A New Course: How Innovative University Programs Are Reducing
Driving on Campus and Creating New Models for Transportation.” US PIRG Education Fund and Frontier Group, 2014, pp. 34‐35. http://www.uspirg.org/sites/pirg/files/reports/US_A_New_Course_scrn_0.pdf

Hanover Research | May 2014
© 2014 Hanover Research | Academy Administration Practice 6
surrounding community and government agencies to negotiate transportation options for students:4
It is common that universities collaboratively plan and manage transit services on their campuses with host cities in terms of fares, routes, schedule, and terminal locations to maximize serviceability, flexibility, and connectivity.5
The report highlights methods for linking on‐campus transportation to public transit and remote parking lots. According to the TTI, most universities have shuttles servicing inner campuses and connecting them to perimeter parking lots. In addition, the report notes the benefits of having a public transit terminal on or adjacent to the campus.6
PARKING
In addition to transit, parking is a large component of university transportation departments. Whether as a parking department solely or integrated with other transportation offerings, parking officials are responsible for parking facilities maintenance, planning, and management. The TTI report notes that, due to its importance, many institutions address parking separately from other transportation issues. However, “[e]ffective parking planning and management should consider the needs and challenges of all components of the university transportation system and the surrounding transportation system.”7 In addition to working with other transportation actors within the university, parking officials should also collaborate with and involve surrounding neighborhoods and local authorities. Normally, parking is more expensive at premium lots located closer to the inner campus and in garages, while remote storage lots are less expensive. Pricing can be used as a mechanism to regulate demand in and around campus. To promote parking in more remote lots and to ensure safety and connectedness, it is important to have reliable shuttle service and safety measures, including adequate lighting. Clear signage and, if possible, dynamic parking and traffic information, can improve the parking experience and regulate the flow of vehicular traffic and density of parking.8
FLEET
University fleet management typically functions as an auxiliary business unit that is similar to a car rental entity. One of the few best practices shared on this topic is the process of selecting appropriate fleet vehicles to purchase. The University of Nebraska – Lincoln has a self‐supporting Transportation Services department within Business and Finance, and the department focuses on fleet vehicles. In response to rising fuel costs, the department
4 Aldrete‐Sanchez, R., J. Shelton, and R. Cheu. “Integrating the Transportation System with a University Transportation
Master Plan: Best Practices and Lessons Learned.” Texas Transportation Institute, Texas A&M University System, 2010, p. 6. http://d2dtl5nnlpfr0r.cloudfront.net/tti.tamu.edu/documents/0‐6608‐3.pdf
5 Ibid., p. 9. 6 Ibid., pp. 8‐9. 7 Ibid., p. 9. 8 Ibid., pp. 9‐10.

Hanover Research | May 2014
© 2014 Hanover Research | Academy Administration Practice 7
revisited its fleet vehicle selection process. Incorporating the needs and desires of departments and other fleet renters, as well as fuel efficiency, the department chose to shift its fleet composition. By analyzing the needs and desires of stakeholders, the department was able to both save money and improve the service it provided.9
TRANSPORTATION DEMAND MANAGEMENT AND INTEGRATED SERVICES
Universities are increasingly integrating their transportation services and promoting alternative methods of transportation. A report from the University of North Carolina – Chapel Hill compared its transportation demand management program with those offered at Duke University, the University of Washington, University of British Columbia, and Cornell University. The report found that “[a]ll of the universities have at least one full‐time staff member dedicated to promoting alternative transportation and TDM efforts,” who is typically based within the main parking and transportation department.10 The report also notes that car sharing, ride sharing, bike sharing, carpooling, and other commuter benefits are nearly universal at these institutions. As Section II notes, these observations also hold true for the majority of institutions examined for this report. One major bicycle program implemented by the University of California – Berkeley is providing “bicycle‐parking spaces in covered, locked cages or under security‐camera surveillance.”11
9 Barrett, P. “University of Nebraska Transportation Services Best Fit Vehicle Selection Process.” CACUBO 2007 Best
Practices Award Program, Proposal. http://cacubo.org/files/docs/resources/University_of_Nebraska_Lincoln_Best_Fit_Vehicle.pdf
10 Watterson, B. “Transportation Demand Management on UNC’s Campus: Evaluation, Best Practices and Recommendations for Reducing Single‐Occupancy Vehicle Use.” University of North Carolina at Chapel Hill, Master’s Project, 2011. p. 4. Available from: https://www.google.com/url?sa=t&rct=j&q=&esrc=s&source=web&cd=11&cad=rja&uact=8&ved=0CCcQFjAAOAo&url=https%3A%2F%2Fcdr.lib.unc.edu%2Findexablecontent%2Fuuid%3A4089985f‐62f9‐405a‐b0ab‐37d6459abbfe%3Fdl%3Dtrue&ei=nWUfU‐zeEILp2QWu6ICYBQ&usg=AFQjCNHblqP1aiCVKbMhco3zODO7lpamMQ&sig2=xr5uWIrbtoLG7iqsf3oo9Q&bvm=bv.62788935,d.dmQ
11 “Best Practices Make, If Not Perfect, Pretty Darn Close.” UC Berkeley News, 2004. http://www.berkeley.edu/news/berkeleyan/2004/04/14_bestpr.shtml

Hanover Research | May 2014
© 2014 Hanover Research | Academy Administration Practice 8
SECTION II: PROFILES IN PRACTICE This section presents five profiles of university practice in parking and transportation services. For each profile, this report provides contextualizing facts related to the student and surrounding population and to parking and transportation services. The student and surrounding population figures draw on statistics from the National Center for Education Statistics (NCES) and the U.S. Census Bureau’s American FactFinder, respectively.12 In most cases, the population estimates for the surrounding city include at least some of the students attending the university. The footnote for each figure provides additional relevant citations.
12 All of the institutions draw from the same citations for the NCES and Census data: [1] Custom search. College Navigator, National Center for Education Statistics.
http://nces.ed.gov/collegenavigator/default.aspx?s=all&l=93+94&ic=1&en=20000&lc=3+2+1&hs=1&xp=1 [2] Custom searches. Community Facts, American FactFinder, United States Census Bureau.
http://factfinder2.census.gov/faces/nav/jsf/pages/community_facts.xhtml

Hanover Research | May 2014
© 2014 Hanover Research | Academy Administration Practice 9
IOWA STATE UNIVERSITY
Located in Ames, Iowa, north of Des Moines, Iowa State University (Iowa State) is home to more than 30,000 students in a city of fewer than 60,000 residents. As one university contact noted, the Iowa State student body represents the majority of the city’s population.13 Iowa State University “is primarily a pedestrian campus” and encourages “pedestrian, bicycle, and bus traffic.”14
Figure 2.1: Reference Figures, Iowa State University
Total Student Population: 30,748
Undergraduate Student Population: 25,553
Total Number of Students Residing on Campus: 11,222*
Population of the Surrounding City: 58,965
Integration of Parking and Transportation Services: No
Total Number of Buses: **
Total Number of Fleet Vehicles: Unknown
Total Number of Parking Spaces: 19,487
* This is the total number of students in university‐operated housing: 10,102 students in residence halls and 1,120 students in other university‐operated housing ** 89 buses operated by CyRide, a partnership between the university and the local government but technically a city entity Source: Census Bureau, NCES, and Iowa State University
15
ORGANIZATIONAL STRUCTURE
Parking and transportation responsibilities are spread across a variety of departments at Iowa State, although all of them are within the Division of Business and Finance. Parking is a division within Public Safety, while Facilities Planning and Management handles flight services and sustainability initiatives, which include TDM initiatives. Transportation Services, located within Business Services, is responsible for fleet management.16 The organizational chart on the following page highlights departments responsible for parking and transportation services. In addition to the administrative units, there is a Transportation Advisory Council, which incorporates students, faculty, and staff. The purpose of the Council is to articulate input from various user groups for transportation policy. Representing some of the entities most involved in transportation are staff from Facilities Planning and
13 Rankin, M. Sustainability Director, Iowa State University. Phone interview, March 31, 2014. 14 “The Iowa State University Parking Division Manual.” Iowa State University.
http://www.parking.iastate.edu/about/docs/ParkingManual.pdf 15 [1] “Enrollment by Housing Type.” Office of Institutional Research, Iowa State University.
http://www.ir.iastate.edu/FB14/PDF%20files%20as%20of%20Nov%2020/047%20Enrollment%20by%20Housing%20Type.pdf
[2] Miller, M. Assistant Director, Parking Division, Department of Public Safety, Iowa State University. Email correspondence, March 31, 2014.
[3] “CyRide Performance Stats 1977 to 2013.” CyRide. Available from: http://www.cyride.com/index.aspx?page=1240
16 Rankin, Op. cit.

Hanover Research | May 2014
© 2014 Hanover Research | Academy Administration Practice 10
Management and from the Department of Public Safety, primarily from the Parking Division.17
Figure 2.2: Organizational Chart, Iowa State University
*Blue boxes highlight departments within the Division and Finance responsible for parking and transportation services. Source: Iowa State University
18
17 “Transportation Advisory Council.” Iowa State University. http://www.committees.iastate.edu/comm‐
info.php?id=15 18 Organizational chart. Office of the President, Iowa State University.
http://www.president.iastate.edu/org/univorg.pdf
Hanover Research | May 2014
© 2014 Hanover Research | Academy Administration Practice 11
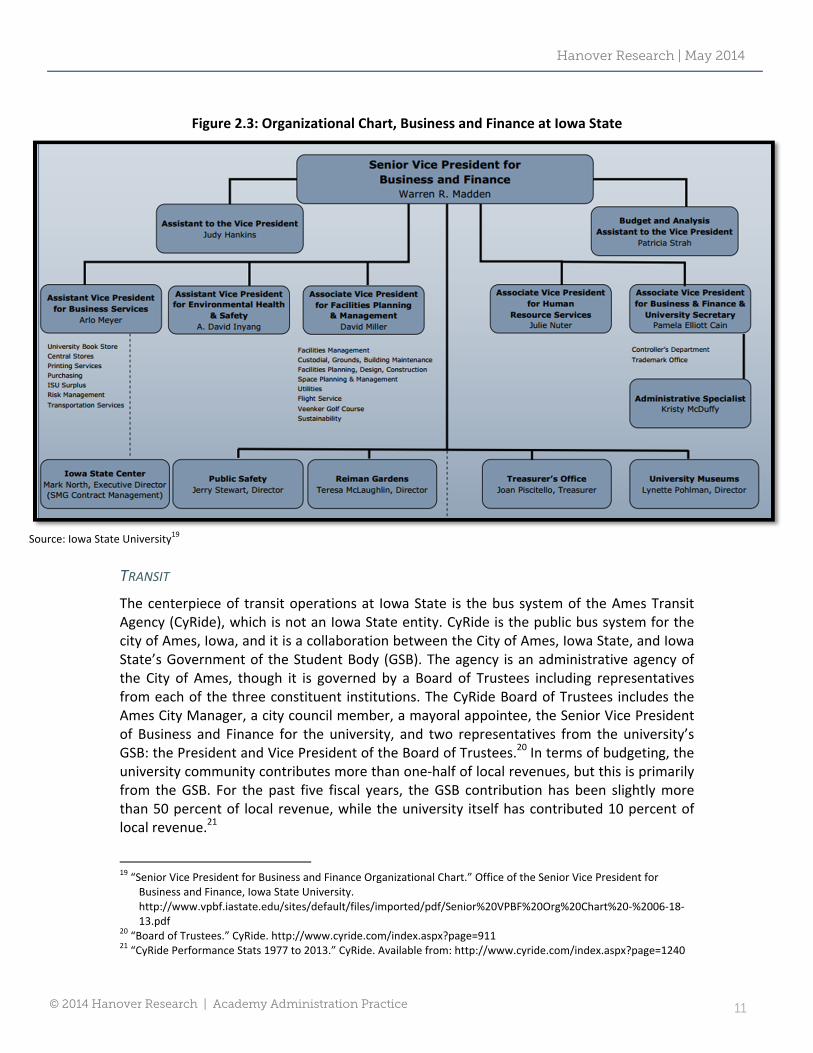
Figure 2.3: Organizational Chart, Business and Finance at Iowa State
Source: Iowa State University19
TRANSIT
The centerpiece of transit operations at Iowa State is the bus system of the Ames Transit Agency (CyRide), which is not an Iowa State entity. CyRide is the public bus system for the city of Ames, Iowa, and it is a collaboration between the City of Ames, Iowa State, and Iowa State’s Government of the Student Body (GSB). The agency is an administrative agency of the City of Ames, though it is governed by a Board of Trustees including representatives from each of the three constituent institutions. The CyRide Board of Trustees includes the Ames City Manager, a city council member, a mayoral appointee, the Senior Vice President of Business and Finance for the university, and two representatives from the university’s GSB: the President and Vice President of the Board of Trustees.20 In terms of budgeting, the university community contributes more than one‐half of local revenues, but this is primarily from the GSB. For the past five fiscal years, the GSB contribution has been slightly more than 50 percent of local revenue, while the university itself has contributed 10 percent of local revenue.21
19 “Senior Vice President for Business and Finance Organizational Chart.” Office of the Senior Vice President for
Business and Finance, Iowa State University. http://www.vpbf.iastate.edu/sites/default/files/imported/pdf/Senior%20VPBF%20Org%20Chart%20‐%2006‐18‐13.pdf
20 “Board of Trustees.” CyRide. http://www.cyride.com/index.aspx?page=911 21 “CyRide Performance Stats 1977 to 2013.” CyRide. Available from: http://www.cyride.com/index.aspx?page=1240

Hanover Research | May 2014
© 2014 Hanover Research | Academy Administration Practice 12
Figure 2.4: CyRide Revenues, 2009 to 2014
REVENUE SOURCE 2009 ‐ 2010 2010 ‐ 2011 2011 ‐ 2012 2012 ‐ 2013 2013 ‐ 2014*
Farebox Revenue $317,590 $315,716 $322,600 $330,847 $360,000
Other Transportation Revenue $276,608 $278,493 $356,683 $294,360 $300,000
Other State/Federal Grants ‐ $197,675 $204,432 $162,345 $247,000
Tax Levy $1,309,644 $1,306,309 $1,355,883 $1,452,687 $1,501,714
Government of the Student Body $2,898,278 $3,008,118 $3,204,263 $3,499,053 $3,726,491
Iowa State University $557,302 $576,808 $599,880 $641,872 $658,561
Miscellaneous Revenue $204,274 $227,830 $178,332 $220,112 $194,600
Total Local Revenue $5,563,696 $5,910,949 $6,222,073 $6,601,276 $6,988,366
IDOT Operating Assistance $448,180 $497,650 $613,424 $606,634 $600,000
FTA Operating Assistance $1,574,500 $1,490,918 $1,528,279 $1,540,702 $1,845,414
Total Revenue $13,150,072 $13,810,466 $14,585,849 $15,349,888 $16,422,146
* The 2013‐2014 year uses estimated data. Source: CyRide22
In exchange for supporting the majority of the budget, the students of the university do not pay any fare. Moreover, the Parking Division at Iowa State subsidizes passes for staff and faculty members.23 Additionally, nearly every CyRide route services the Iowa State campus, and multiple routes link perimeter parking and buildings to the main campus.24
PARKING
The Parking Division is part of the Department of Public Safety at Iowa State. While the institution pays a fee for a route to bring those parking in auxiliary lots to campus, there is not a substantial level of coordination with CyRide. Perimeter parking is used for both storage parking and daily parking, with free bus service to campus. Buses frequently service storage lots every day of the week, except Sunday, when service is closer to every 40 minutes. Service runs from around 7 A.M. to as late as 2:30 A.M. on Saturdays. All of the nearly 20,000 spaces require permits, with designated staff and student lots. Those lots around residence halls are typically reserved for students.25 As the campus expands, providing close parking at a reasonable price is the division’s main challenge.26 A representative from Iowa State noted that the university has one of the lowest rates for parking in the region. While officials would like to increase fees to support better parking facilities maintenance and other priorities, these changes receive substantial pushback and must be approved by the administration.27
22 Ibid. 23 “Fares.” CyRide. http://www.cyride.com/index.aspx?page=19 24 Route map. CyRide. http://www.cyride.com/modules/showdocument.aspx?documentid=8345 25 Miller, Op. cit. 26 Ibid. 27 Rankin, Op. cit.

Hanover Research | May 2014
© 2014 Hanover Research | Academy Administration Practice 13
FLEET
Fleet management is provided by the Transportation Services office.28 Available vehicles include compact and mid‐size cars, minivans, various types of pickup trucks, cargo vans, SUVs, 15‐passenger vans, enclosed trailers, car‐hauling trailers, and flatbed trailers.29 Vehicles are available for short‐term rental, long‐term rental, or a rental period of one to 12 months. Hanover was unable to ascertain the number of vehicles.
TDM INITIATIVES AND PROGRAMS
Iowa State has several TDM initiatives, including a car share program, a ride share program, and a vanpool program.30
28 Rankin, Op. cit. 29 “Vehicles and Rates.” Transportation Services, Iowa State University.
http://www.transportation.iastate.edu/vehicles 30 Rankin, Op. cit.

Hanover Research | May 2014
© 2014 Hanover Research | Academy Administration Practice 14
PENNSYLVANIA STATE UNIVERSITY – MAIN CAMPUS
The main campus of Pennsylvania State University (Penn State) is located in State College, Pennsylvania. The population of the surrounding town is approximately equal to the student body at the university, with a total of nearly 154,000 residents in the county. According to the local government, the greater State College area is home to approximately 96,000 residents, and 75 percent of the residents of the Borough of State College are Penn State students. The town and the university are highly interconnected and have grown together since the institution’s founding.31
Figure 2.5: Reference Figures, Pennsylvania State University
Total Student Population: 45,783
Undergraduate Student Population: 39,192
Total Number of Students Residing on Campus: 14,635*
Population of the Surrounding City: 42,034
Integration of Parking and Transportation Services: Single Dept.
Total Number of Buses: **
Total Number of Fleet Vehicles: ***
Total Number of Parking Spaces: ****
* This figure represents on‐campus capacity. The institution notes that occupancy ranges from 100 to 105 percent during the year. ** CATABUS serves the campus, as well as a greater service area. Among all fixed routes, CATABUS operates 66 buses. *** The university does not publicly offer this number. The fleet vehicle options are noted below. **** The university does not note the number of spaces available for faculty and staff. There are approximately 18,000 spaces available for students. Source: Census Bureau, NCES, and Pennsylvania State University
32
ORGANIZATIONAL STRUCTURE
The Transportation Services Department (Transportation Services) is located within the Auxiliary and Business Services department of the Finance and Business division.33 The department contains offices for transportation services, parking, and fleet services.34 Figure 2.6 notes the relationship between auxiliary units, such as Transportation Services, and the rest of the administration, with the auxiliary units highlighted with a green outline. The Director of Transportation Services reports directly to the Associate Vice President for
31 “Mayor’s Welcome.” Borough of State College Government. http://www.statecollegepa.us/index.aspx?nid=1158 32 [1] “Policies, Safety & U: 2013 Annual Security and Fire Safety Report.” Pennsylvania State University.
http://www.police.psu.edu/clery/security‐reports/upload/122425ePoliciesSafetyU_UP.pdf [2] “CATA Annual Report Fall 2012/13.” CATA.
http://www.catabus.com/AboutCATA/Budget/AnnualReport/AnnualReport1213.pdf 33 [1] “Directory entry for TRANSPORTATION SERVICES.” Pennsylvania State University. Result of a search for
“Transportation Services” in the Department Directory: http://www.work.psu.edu/ldap/dept/ [2] “The Pennsylvania State University Administrative Organization.” Pennsylvania State University.
http://www.psu.edu/provost/assets/Administrative.pdf 34 “Contact Us.” Transportation Services, Pennsylvania State University.
http://www.transportation.psu.edu/transportation/contact‐us.cfm

Hanover Research | May 2014
© 2014 Hanover Research | Academy Administration Practice 15
Auxiliary and Business Services. Due to the transit relationship discussed in this profile, the primary division within the department is between parking and fleet operations, with one staff member each in facilities and finance, as shown in Figure 2.7.35
Figure 2.6: Organizational Chart Excerpt, Pennsylvania State University
Source: Pennsylvania State University36
35 Organizational charts. Auxiliary and Business Services, Pennsylvania State University.
http://www.abservices.psu.edu/abservices/upload/ABS_UnitOrgCharts.pdf 36 Organizational chart. Office of the Provost, Pennsylvania State University.
http://www.psu.edu/provost/assets/Administrative.pdf

Hanover Research | May 2014
© 2014 Hanover Research | Academy Administration Practice 16
Figure 2.7: Organizational Chart, Transportation Services, Pennsylvania State University
Source: Pennsylvania State University37
37 Organizational charts. Auxiliary and Business Services, Pennsylvania State University, Op. cit.

Hanover Research | May 2014
© 2014 Hanover Research | Academy Administration Practice 17
TRANSIT
Campus Transit offers a variety of bus and shuttle services on and around the campus, as well as routes to other areas in the county. The University partners with the Centre Area Transportation Authority (CATA) to provide almost all bus service.38 CATA is a Joint Municipal Authority formed by and serving the majority of Centre County, and it was first incorporated in 1974.39 CATA categorizes its bus routes as Community Service and Campus Service. While the Community Service routes require one‐way fares, Campus Service is a no‐fare service made possible by a partnership between CATA and Penn State Transportation Services.40 For the 2012‐13 fiscal year, CATA estimated the University’s contribution at $118,535, in addition to $2,133,500 from Penn State to pay for the no‐fare campus routes and $50,800 in passenger fare revenue from the Football Shuttle. This represents 18 percent of the total estimated revenue for the year, which amounted to $12,765,431. While state and federal contributions support the bulk of the organization’s budget, Penn State contributes far more to the CATA operating budget than any of the local governments. The university pays for nearly 25 percent of the budget not covered by subsidies and revenues, as determined by a formula that incorporates ridership, mileage, and costs.41 While CATA provides on‐campus bus service, including the Loop and Link routes, the University also offers two additional bus lines on campus. First, the Campus Shuttle provides no‐fare transportation around campus at 15‐minute intervals between 7 A.M. and 6 P.M on weekdays, servicing 23 stops.42 Second, as part of disability services, the Paratransit Shuttle has 16 stops and operates in the reverse direction every 20 minutes from 7:15 A.M. to 6 P.M. on weekdays.43
PARKING
The University provides a wide variety of parking permits for faculty, staff, and students.44 There are approximately 18,000 parking spaces for students, including commuter, storage, and residential spaces.45 Residential student lots are zoned by the section of campus where
38 “Loop/Link Bus.” Transportation Services, Pennsylvania State University.
http://www.transportation.psu.edu/transportation/campus‐transit/loop‐link.cfm 39 “About CATA.” CATA. http://www.catabus.com/AboutCATA/index.html 40 “CATABUS.” CATA. http://www.catabus.com/ServiceSchedules/CATABUS/index.html 41 “Centre Area Transportation Authority Budget FY 2013/14 Final.” CATA. pp. 2‐3, 11.
http://www.catabus.com/AboutCATA/Budget/Budgets/FY20132014FinalBudget.pdf 42 [1] “Campus Shuttle.” Transportation Services, Pennsylvania State University.
http://www.transportation.psu.edu/transportation/campus‐transit/shuttle.cfm [2] “Shuttle Map.” Transportation Services, Pennsylvania State University.
http://www.transportation.psu.edu/transportation/campus‐transit/upload/ShuttleMap.pdf 43 “Paratransit Shuttle.” Transportation Services, Pennsylvania State University.
http://www.transportation.psu.edu/transportation/disability‐services/upload/paratransit‐shuttle‐change‐3.pdf 44 [1] “Student Parking Permits.” Transportation Services, Pennsylvania State University.
http://www.transportation.psu.edu/transportation/parking/students/student‐permits.cfm [2] “Faculty/Staff: Parking Permits.” Transportation Services, Pennsylvania State University.
http://www.transportation.psu.edu/transportation/parking/faculty‐staff/fac‐staff‐permits.cfm 45 [1] “Student Parking.” Transportation Services, Pennsylvania State University.
http://www.transportation.psu.edu/transportation/parking/students/index.cfm

Hanover Research | May 2014
© 2014 Hanover Research | Academy Administration Practice 18
the resident lives. Commuter lots are primarily located around the football stadium and basketball arena, with all four CATABUS campus service routes stopping in the vicinity. The only identified storage lot is located next to student residences on the outside edge of one corner of campus, but the Blue Loop services the complex, and there is also a White Loop stop fairly close to the lot. The longest wait time any day of the week is 22 minutes, with service as frequent as every five minutes during peak hours.46
FLEET
The university does not offer a substantial amount of information on its fleet vehicle services. There is a wide variety of available options for renting, with prices slightly more expensive than the local Enterprise Rent‐A‐Car location.47
TDM INITIATIVES AND PROGRAMS
To encourage alternatives to single‐occupancy driving, Penn State offers ride sharing programs for students and for faculty and staff, as well as discounts for faculty and staff on CATA bus routes for commuters. For full‐time employees with no daytime parking permit, Penn State offers a discounted unlimited monthly CATA bus pass for just five dollars, which can be paid pre‐tax.48 Furthermore, the institution partners with CATA and CATACOMMUTE for faculty and staff ride sharing and with AlterNetRides.com for student ride sharing.49 For these various systems, CATA and Penn State offer a guaranteed ride home to assuage fears of being stranded.
[2] “Student Parking Map.” Transportation Services, Pennsylvania State University.
http://www.parking.psu.edu/transportation/maps/parking‐maps/upload/2014‐student‐parking‐map.pdf 46 “Map, Hours & Frequencies.” CATABUS.
http://www.catabus.com/ServiceSchedules/CATABUS/CampusService/Schedule/Web/whiteloop.html 47 [1] “Rates.” Transportation Services, Pennsylvania State University.
http://www.transportation.psu.edu/transportation/fleet/vehicle/rates.cfm [2] Search conducted for Enterprise Rent‐A‐Car in State College, Pennsylvania. Enterprise Rent‐A‐Car.
http://www.enterprise.com/car_rental/deeplinkmap.do?gpbr=4025&bid=004&cnty=US 48 “Ride for Five.” Transportation Services, Pennsylvania State University.
http://www.transportation.psu.edu/transportation/parking/faculty‐staff/ride‐for‐five.cfm 49 [1] “Faculty/Staff Rideshare.” Transportation Services, Pennsylvania State University.
http://www.transportation.psu.edu/transportation/parking/faculty‐staff/fac‐staff‐rideshare.cfm [2] “Student Rideshare.” Transportation Services, Pennsylvania State University.
http://www.transportation.psu.edu/transportation/parking/students/student‐rideshare.cfm
Hanover Research | May 2014
© 2014 Hanover Research | Academy Administration Practice 19
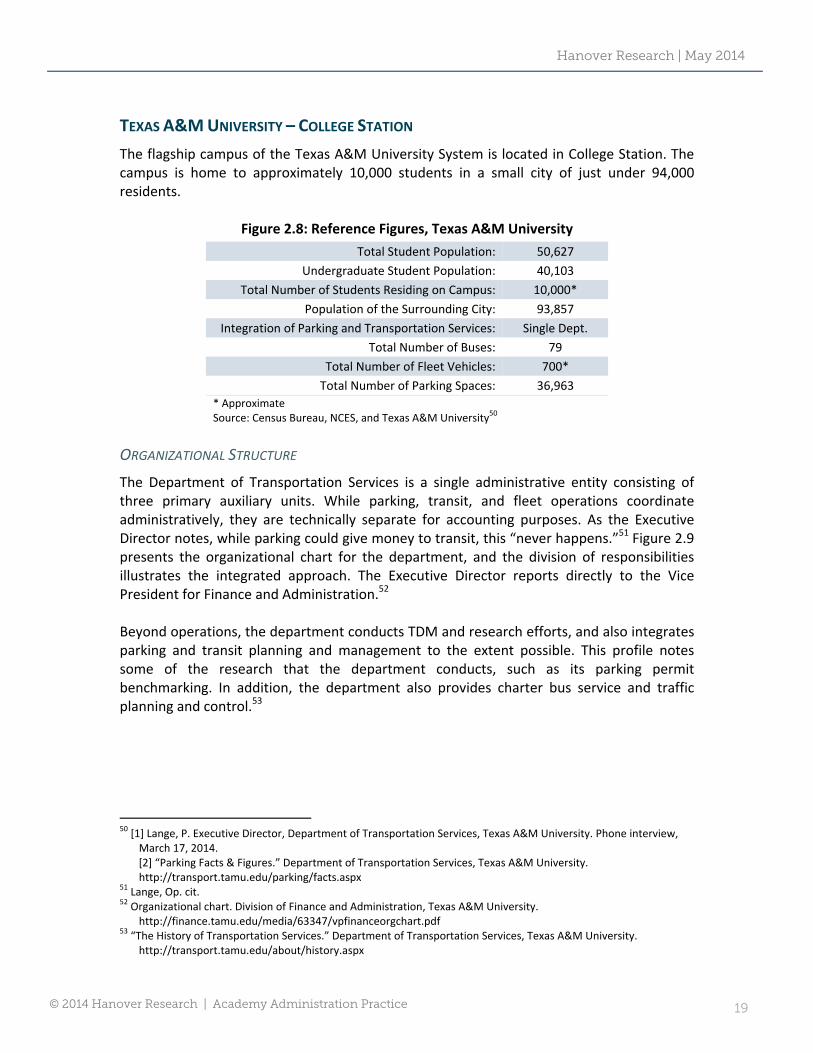
TEXAS A&M UNIVERSITY – COLLEGE STATION
The flagship campus of the Texas A&M University System is located in College Station. The campus is home to approximately 10,000 students in a small city of just under 94,000 residents.
Figure 2.8: Reference Figures, Texas A&M University
Total Student Population: 50,627
Undergraduate Student Population: 40,103
Total Number of Students Residing on Campus: 10,000*
Population of the Surrounding City: 93,857
Integration of Parking and Transportation Services: Single Dept.
Total Number of Buses: 79
Total Number of Fleet Vehicles: 700*
Total Number of Parking Spaces: 36,963
* Approximate Source: Census Bureau, NCES, and Texas A&M University50
ORGANIZATIONAL STRUCTURE
The Department of Transportation Services is a single administrative entity consisting of three primary auxiliary units. While parking, transit, and fleet operations coordinate administratively, they are technically separate for accounting purposes. As the Executive Director notes, while parking could give money to transit, this “never happens.”51 Figure 2.9 presents the organizational chart for the department, and the division of responsibilities illustrates the integrated approach. The Executive Director reports directly to the Vice President for Finance and Administration.52 Beyond operations, the department conducts TDM and research efforts, and also integrates parking and transit planning and management to the extent possible. This profile notes some of the research that the department conducts, such as its parking permit benchmarking. In addition, the department also provides charter bus service and traffic planning and control.53
50 [1] Lange, P. Executive Director, Department of Transportation Services, Texas A&M University. Phone interview,
March 17, 2014. [2] “Parking Facts & Figures.” Department of Transportation Services, Texas A&M University.
http://transport.tamu.edu/parking/facts.aspx 51 Lange, Op. cit. 52 Organizational chart. Division of Finance and Administration, Texas A&M University.
http://finance.tamu.edu/media/63347/vpfinanceorgchart.pdf 53 “The History of Transportation Services.” Department of Transportation Services, Texas A&M University.
http://transport.tamu.edu/about/history.aspx

Hanover Research | May 2014
© 2014 Hanover Research | Academy Administration Practice 20
Figure 2.9: Organizational Chart, Transportation Services, Texas A&M University
Source: Texas A&M University54
TRANSIT
Texas A&M provides all of its own transportation services. The University owns 79 buses, having recently sold one. The buses are primarily 40‐foot vehicles, and they operate on six on‐campus routes and 10 off‐campus routes.55 In order to determine routes and maintain an efficient transit system, the department continually monitors ridership. The department overlays student addresses for a heat map of student density and considers the effect on the people in the university community. However, the Executive Director indicated that removing a route or even reducing the number of buses operating on a given route is politically difficult, and the department has faced strong opposition to scaling back service even on routes with extensively diminished ridership.56 The department is self‐sufficient, but the transit area depends on the Student Success Fee and bus charter income.57
PARKING
Parking is a self‐sustaining auxiliary unit funded through user fees.58 With an estimated 6,500 resident students bringing a car to campus, many of the 20,741 parking spaces
54 Organizational chart. Department of Transportation Services, Texas A&M University.
http://transport.tamu.edu/about/files/OrgChartMgr.pdf 55 “Transit Facts and Figures.” Department of Transportation Services, Texas A&M University.
http://transport.tamu.edu/transit/facts.aspx 56 Lange, Op. cit. 57 The History of Transportation Services,” Op. cit. 58 Lange, Op. cit.

Hanover Research | May 2014
© 2014 Hanover Research | Academy Administration Practice 21
available for students are taken by commuters. However, the university combined resident and commuter permits beginning with the fall semester of 2004. The Executive Director estimates that approximately 10,000 faculty and staff park at the university as well. The department regularly benchmarks its parking permit price, and it maintains and publishes detailed information on parking.59 Since the University can oversell certain lots, such as commuter lots, the department issues more than 40,000 permits each year, including students, faculty, and staff.60 Recent building growth has resulted in the loss of parking spaces. While the University plans to add garages, parking garages are more expensive to construct than lots, and the department considers a main challenge to be dealing with reduced space without substantially increasing the cost of permits.
The department implements different price points for different types of spaces, with incentives to park in outer areas. The department uses a priority system to assign permits to faculty, staff, and students on the basis of various characteristics, such as time at the institution. While most students park close to where they live, some students must park in perimeter lots farther away and are placed on a waitlist for a better permit.61 Multiple bus routes service the perimeter spaces, resulting in fairly frequent service during class time and service at least every 30 minutes on nights and weekends.62
FLEET
The fleet area of the department leases more than 700 vehicles owned by the University and maintains more than 1,200 vehicles and 3,000 pieces of equipment.63 University departments may purchase long‐term rentals akin to leasing the vehicles. According to the Executive Director, the department regularly benchmarks its rental rates.64 At one point the fleet maintained a motor pool and 15‐passenger vans, but both were shut down because the motor pool was losing money and the vans were largely unused.
TDM INITIATIVES AND PROGRAMS
As noted above, the department engages in an integrated approach to parking, transit, and the general transportation landscape. The University offers ride share, car share, bike share, and other bicycle services. The ride sharing program relies on Zimride, while the car sharing program is a partnership with Hertz 24/7. Notably, University departments may also establish department accounts for the car sharing program. The bike sharing program relies on MaroonBikes, a bike‐sharing company.65
59 “Parking Facts & Figures,” Op. cit. 60 “The History of Transportation Services,” Op. cit. 61 Lange, Op. cit. 62 “Bus Routes.” Department of Transportation Services, Texas A&M University.
http://transport.tamu.edu/busroutes/ 63 “The History of Transportation Services,” Op. cit. 64 Lange, Op. cit. 65 [1] “Car Share.” Department of Transportation Services, Texas A&M University.
http://transport.tamu.edu/Alternative/carshare.aspx [2] “Ride Share.” Department of Transportation Services, Texas A&M University.
http://transport.tamu.edu/Alternative/rideshare.aspx

Hanover Research | May 2014
© 2014 Hanover Research | Academy Administration Practice 22
UNIVERSITY OF COLORADO BOULDER
Located in Boulder, Colorado, the flagship campus of the University of Colorado is home to over 30,000 students, representing approximately one‐third of the city’s population.
Figure 2.10: Reference Figures, University of Colorado Boulder
Total Student Population: 31,945
Undergraduate Student Population: 25,941
Total Number of Students Residing on Campus: 6,000*
Population of the Surrounding City: 97,385
Integration of Parking and Transportation Services: Single Dept.
Total Number of Buses: 20
Total Number of Fleet Vehicles: 624**
Total Number of Parking Spaces: 11,354***
* Approximate ** Most fleet vehicles are department‐owned *** Of these, Parking Services operates 8,242 spaces. Source: Census Bureau, NCES, and the University of Colorado Boulder
66
ORGANIZATIONAL STRUCTURE
Parking and Transportation Services (PTS) is a division within the Department of Public Safety at the University of Colorado Boulder. However, the parking and transportation components are not very integrated, according to the Director of Parking and Transportation Services.67 There is an associate director for each, and each unit is an auxiliary unit. Transportation services are provided in a separate, third area. The division is currently working on generating greater integration within the division and into the University, and there has been a recent change of leadership. In 2013, PTS welcomed a new Director who had previously been an Associate Director at Cornell University, where he helped launch and manage alternative transportation programs. In his current post, the Director notes that the division is working toward better clarity of goals for PTS from the senior level. The Director is also encouraging the University to consider commuter benefits to be employee benefits, which would help ensure the financial viability of PTS. The organizational structure of the department is shown below.
[3] “Bicycle Services.” Department of Transportation Services, Texas A&M University.
http://transport.tamu.edu/alternative/bicycles/services.aspx [4] “Our Story.” MaroonBikes. http://maroonbikeshare.com/our‐story/ 66 [1] “Students.” University of Colorado Boulder.” http://www.colorado.edu/news/facts/students [2] “2013 Annual Report.” Parking and Transportation Services, University of Colorado Boulder.
http://www.colorado.edu/pts/sites/default/files/attached‐files/2013%20Annual%20Report.pdf [3] Lieb, D. Director of Parking and Transportation Services, University of Colorado Boulder. Phone interviews,
March 14 and 17, 2014. 67 Lieb, Op. cit.

Hanover Research | May 2014
© 2014 Hanover Research | Academy Administration Practice 23
Administration Business Operations Field Operations Transportation Services
Accounting
Communications
IT
Projects and Planning
Transportation Options
Appeals, Billing, Correspondence
Customer Services
Permits
Revenue Control
Enforcement
Events
Maintenance
Fleet Management
Vehicle Maintenance
Driver Training
Lease Operations
Transit Operations68
TRANSIT
The only transit operation on campus is the Buff Bus, which connects Williams Village to the Main Campus, with an additional stop at the corner of the East Campus. PTS pays for the shuttle service, except for a portion of nighttime service paid for by the major student environmental group on campus. On weekdays, the Buff Bus runs approximately every five minutes from 6:45 A.M. until midnight. On weekends, the bus runs every 20 to 25 minutes from 10 A.M. until shortly before midnight.69 According to the Director, there are currently 20 buses, with a maximum of seven buses on the route at any given time. The vehicles are also used as charters for students and departments. At this time, PTS is evaluating the need to increase campus bus service, given expansion in the student population and the physical size of the institution. However, there are currently no plans to expand.70 Off campus, there are two bus pass programs. All faculty and staff receive an EcoPass, valid for unlimited use of all regular bus and light rail service within the Regional Transit District (RTD), the public transit system of central Colorado. 71 Meanwhile, the student‐led Environmental Center manages student passes, which are paid through fees determined by student government. The fee for Student Bus and Bike Programs, which includes the RTD CollegePass, bike programs, and other services, is $85 per semester.72 The CollegePass also grants no‐fare rides on most RTD service.73
PARKING
The current parking focus at PTS is to minimize parking. PTS sells approximately 3,000 permits to students and an additional 3,000 to faculty and staff. Due to the constraints of space and the addition of buildings, campus growth has been pushing parking toward the perimeter. In order to preserve space for other uses, PTS has been looking toward TDM to lower the demand for parking.74
68 “About PTS Slideshow.” Parking and Transportation Services, University of Colorado Boulder. Available from:
http://www.colorado.edu/pts/about‐us 69 “Buff Bus.” Parking and Transportation Services, University of Colorado Boulder.
http://www.colorado.edu/pts/sites/default/files/attached‐files/Buff%20Bus%20Brochure%2013‐14.pdf 70 Lieb, Op. cit. 71 “EcoPass.” RTD. http://www.rtd‐denver.com/EcoPass.shtml 72 “Student Fees.” Bursar’s Office, University of Colorado Boulder. https://bursar.colorado.edu/tuition‐fees/fees‐
description/student‐fees/ 73 “CollegePass.” RTD. http://www.rtd‐denver.com/CollegePass.shtml 74 Lieb, Op. cit.

Hanover Research | May 2014
© 2014 Hanover Research | Academy Administration Practice 24
One issue in this area, however, is the structuring of institutional policies. The Director noted that the university had been giving retirees free parking permits, paid and administered through PTS, as opposed to human resources and employee benefits. As the Director notes, free permits mean that other permit holders are subsidizing these groups. Accordingly, the Director is working toward the re‐categorization of these and other commuter benefits as employee benefits.75
FLEET
The majority of the University of Colorado’s fleet of 624 vehicles is housed at the Boulder campus. In the 2013 fiscal year, PTS completed 1,108 lease reservations for the use of 49 lease vehicles within the broader fleet.76 The vast majority of the fleet is department‐owned.77
TDM INITIATIVES AND PROGRAMS
TDM initiatives and programs are a major part of the agenda for PTS. The division manages carpooling and vanpooling programs, an eGo CarShare, and the guaranteed ride home program for the institution.78 In conjunction with the Environmental Center, PTS also manages bicycle programs, though the Director of PTS notes that money for Environmental Center programs does not flow through PTS.79 Notably, there are over 13,000 bicycle parking spaces on the Boulder campuses. One of the major challenges for TDM and the division generally is the financial structure of PTS. TDM initiatives are dependent on parking revenue, so it is difficult to obtain funding for TDM programs.80 The Director also noted that a related challenge is shifting funding from parking to TDM. Since parking lots and garages are expensive and take away potential sites for university buildings, the cost of not implementing TDM is high. However, it can be challenging to act on this, as the division depends on student fees and parking revenue.81
75 Ibid. 76 “2013 Annual Report,” Op. cit. 77 Lieb, Op. cit. 78 “2013 Annual Report,” Op. cit. 79 Lieb, Op. cit. 80 Ibid. 81 Ibid.

Hanover Research | May 2014
© 2014 Hanover Research | Academy Administration Practice 25
UNIVERSITY OF VIRGINIA
The University of Virginia has a student population of nearly 24,000. It is located in Charlottesville, Virginia, a city of approximately 45,000 residents.
Figure 2.11: Reference Figures, University of Virginia
Total Student Population: 23,907
Undergraduate Student Population: 15,822
Total Number of Students Residing on Campus: 6,000*
Population of the Surrounding City: 43,475**
Integration of Parking and Transportation Services: Single Dept.
Total Number of Buses: 34***
Total Number of Fleet Vehicles: N/A
Total Number of Parking Spaces: 7,000****
* Approximate ** Unlike many other figures, this population does not include the university’s campus and residence halls *** The Department of Parking and Transportation provides on‐campus transit with 34 buses, in addition to its four charter buses. This does not include the city buses that provide service connecting to the campus **** Approximate, based on estimated three to four thousand each for students and for faculty and staff. Source: Census Bureau, NCES, and the University of Virginia
82
ORGANIZATIONAL STRUCTURE
The Department of Parking and Transportation at the University of Virginia is a single department with an integrated approach to the administration of parking and transportation operations. While the department does maintain a charter bus service, it does not provide fleet vehicles. The department operates financially as one autonomous entity, though the business office technically lists parking and transportation as separate accounting entities. When the income from parking fees, citation revenue, charter revenue, and other services exceeds expenditures, the department reduces fees.83
TRANSIT
Members of the University of Virginia community benefit from both University Transit Service (UTS) and unlimited free rides on buses run by the City of Charlottesville. Covering the main arteries of the campus with 34 transit buses, of which 27 are in service at any given time, UTS is a free shuttle bus service for students, faculty, and staff.84 In addition, the university pays a lump sum to the city for its students, faculty, and staff to ride city buses for
82 [1] “University of Virginia‐Main Campus.” NCES College Navigator.
http://nces.ed.gov/collegenavigator/?q=university+of+virginia&s=all&id=234076 [2] Mansfield, A. Associate Director, Department of Parking and Transportation, University of Virginia. Phone
interview, March 19, 2014. 83 Mansfield, Op. cit. 84 Ibid.

Hanover Research | May 2014
© 2014 Hanover Research | Academy Administration Practice 26
free. The Charlottesville Area Transit (CAT) routes include service along and within campus boundaries.85
PARKING
Since first‐year students are not permitted to bring cars to campus, most residential student parking is located near dormitories for students in their second year or later. In addition, there are storage lots, which are more attractively priced to encourage parking outside the center of campus. The Associate Director estimated that approximately 3,000 to 4,000 students, as well as a similar number of faculty and staff, buy parking permits. As the Department has increased permit prices and worked to convince students, faculty, and staff to use alternative means of transportation, permit sales have declined. The Associate Director notes that this is one of the primary reasons he feels parking and transportation need to work together closely. The Department also offers a parking permit for occasional use, including the option to park only between Thanksgiving and Christmas.86 The UTS lines servicing garages and perimeter parking operate frequently on weekdays from 6 A.M. until 8 P.M. An additional bus line operates every 15 minutes from 8 P.M. to 12:30 A.M. daily. On weekends, service runs every 20 minutes from noon until 8 P.M. 87
FLEET
Instead of fleet operations, the Department focuses on car sharing and other TDM programs. However, the Department does manage charter operations. In addition to using the standard transit buses, the Department owns four charter buses, including three full‐size and one smaller bus.88 The services are for university departments, organizations, students, faculty, and staff.89
TDM INITIATIVES AND PROGRAMS
The Department is extensively focused on TDM programs to reduce parking and improve transportation for the university community. These programs include Zipcar car share, Zimride ride sharing, a university‐specific carpool and vanpool known as Cavpool, and the occasional parking permit mentioned above. Zipcar membership has grown tremendously in the past four years and currently stands at approximately 12,400 members. Other TDM services have experienced similar growth.90 Carpooling commuters receive a discount on parking permits, with larger discounts provided for additional passengers per vehicle, and also have access to a guaranteed ride home program to cover the cost of taxi fare or a
85 “Transit Service Routes.” Department of Parking and Transportation, University of Virginia.
http://www.virginia.edu/parking/documents/maps/Bus_Map_Layers_Web.pdf 86 Mansfield, Op. cit. 87 “Routes and Schedules.” Department of Parking and Transportation, University of Virginia.
http://www.virginia.edu/parking/uts/routes/index.html 88 Ibid. 89 “Charter Services.” Department of Parking and Transportation, University of Virginia.
http://www.virginia.edu/parking/charter/index.html 90 Mansfield, Op. cit.

Hanover Research | May 2014
© 2014 Hanover Research | Academy Administration Practice 27
rental car if stranded.91 In addition, there are several programs to promote bicycling. Overall, the Associate Director stressed the importance of having a transportation demand manager on staff for the success of the department.
91 “CAVPOOL: U.Va's Carpool Incentives Program.” Department of Parking and Transportation, University of Virginia.
http://www.virginia.edu/parking/TDM/CAVPOOL/index.html

Hanover Research | May 2014
© 2014 Hanover Research | Academy Administration Practice 28
PROJECT EVALUATION FORM Hanover Research is committed to providing a work product that meets or exceeds partner expectations. In keeping with that goal, we would like to hear your opinions regarding our reports. Feedback is critically important and serves as the strongest mechanism by which we tailor our research to your organization. When you have had a chance to evaluate this report, please take a moment to fill out the following questionnaire. http://www.hanoverresearch.com/evaluation/index.php
CAVEAT The publisher and authors have used their best efforts in preparing this brief. The publisher and authors make no representations or warranties with respect to the accuracy or completeness of the contents of this brief and specifically disclaim any implied warranties of fitness for a particular purpose. There are no warranties which extend beyond the descriptions contained in this paragraph. No warranty may be created or extended by representatives of Hanover Research or its marketing materials. The accuracy and completeness of the information provided herein and the opinions stated herein are not guaranteed or warranted to produce any particular results, and the advice and strategies contained herein may not be suitable for every partner. Neither the publisher nor the authors shall be liable for any loss of profit or any other commercial damages, including but not limited to special, incidental, consequential, or other damages. Moreover, Hanover Research is not engaged in rendering legal, accounting, or other professional services. Partners requiring such services are advised to consult an appropriate professional.

Hanover Research | May 2014
© 2014 Hanover Research | Academy Administration Practice 29
1700 K Street, NW, 8th Floor
Washington, DC 20006
P 202.559.0500 F 866.808.6585
www.hanoverresearch.com