Embed Size (px)
Citation preview

RTI International
RTI International is a trade name of Research Triangle Institute. www.rti.org
Best Practices in the Evaluation of Consumer Food Safety Interventions
Presented by Jonathan Blitstein, Sheryl Cates, and Angela Fraser
Consumer Food Safety Education Conference
December 4, 2014
1

RTI International
2
http://norocore.ncsu.edu/cms/

RTI International
Introduction
Worldwide, food safety is an important and pressing public health issue.
The 2010 Global Burden of Disease report ranks diarrheal disease as the 4th most prevalent malady in the world, after heart disease, pneumonia, and stroke. (Murray et al. 2013).
Most cases of diarrheal disease are from contaminated food or water.
3

RTI International
Food Safety Control Systems (FAO)1. Food Laws and Regulations – relevant, science-based,
enforceable food laws and regulations. 2. Food Control Management – coordination of policies
and operations at the national level.3. Inspection – food laws and regulations that use
qualified, trained, and honest food inspection service. 4. Food Monitoring/Epidemiological Data – laboratory
facilities run by qualified analysts.5. Information, Education, and Communication –
delivery of balanced, factual information, education, and communication to groups across the farm-to-table continuum.
4

RTI International
Critics of Food Safety Education
Critics suggest many education efforts to raise awareness of food safety are not approached in a systematic, scientific, and theoretically and pedagogically sound fashion.
In the IFT Expert Report on Emerging Microbiological Food Safety Issues: Implications for Control in the 21st
Century (IFT 2002), the authors acknowledge food safety education as a control strategy, but are unconvinced of its effectiveness.
5

RTI International
Aim of Food Safety Education
Globally, pursued as a means to decrease the burden of illness from foodborne disease.
Governments, industry, colleges, and universities have developed countless food safety education interventions.
But . . . How effective are they, particularly at changing safe food handling practices?
6

RTI International
Typical Outcome Measures
Improved knowledge, presumably because one assumes practices will improve as knowledge increases.
Knowledge, as well as positive attitudes, about an intended behavior are important prerequisites to taking action, but they do not guarantee action.
Implementation of safe food handling practices is the action that reduces the burden of illness.
7

RTI International
Two Systematic Literature Reviews
Egan et al. (2007) Food Control– Summarizes results of studies that reported effectiveness of
training in commercial food industry. – Conclude scant empirical evidence that documents the
effectiveness of education at improving practices.– Most evidence is fair to poor by scientific standards.
Viator et al. (2015) Journal of Food Protection– Current state of evaluation is not sufficiently rigorous to support
development of an evidence-based literature.
8

RTI International
Suggested Reasons Educators trained to deliver information not to evaluate
it. Educators might not understand research methods.
– Medeiros et al. (2001) evaluated 12 food safety curricula targeting consumers.
– Only 50% of the evaluation instruments reviewed had been tested for reliability and/or validity and then to varying extents.
More rigor is needed in the development and pretesting of evaluation instruments if educators are to have confidence in the outcomes they report.
9

RTI International
Moving Forward
Scientific community is just beginning to gather empirical evidence to prove the effectiveness of food safety interventions.
When substantially high quality, empirical evidence is collected and analyzed, a decisive judgment of the effectiveness of food safety education at reducing the burden of illness from foodborne disease can then be made.
Much more work needs to be done to prove food safety education is effective.
10

RTI International
Review of Best Practices
Guidance on research design– Counterfactual condition– Measures to avoid threats to validity– Alternatives to randomized designs
Specification of outcome measures– SMART measures– Quantifiable terms– Primary and secondary outcomes
Development and testing of impact instruments– Seven guidelines– Cognitive testing– Translation
11
RTI International
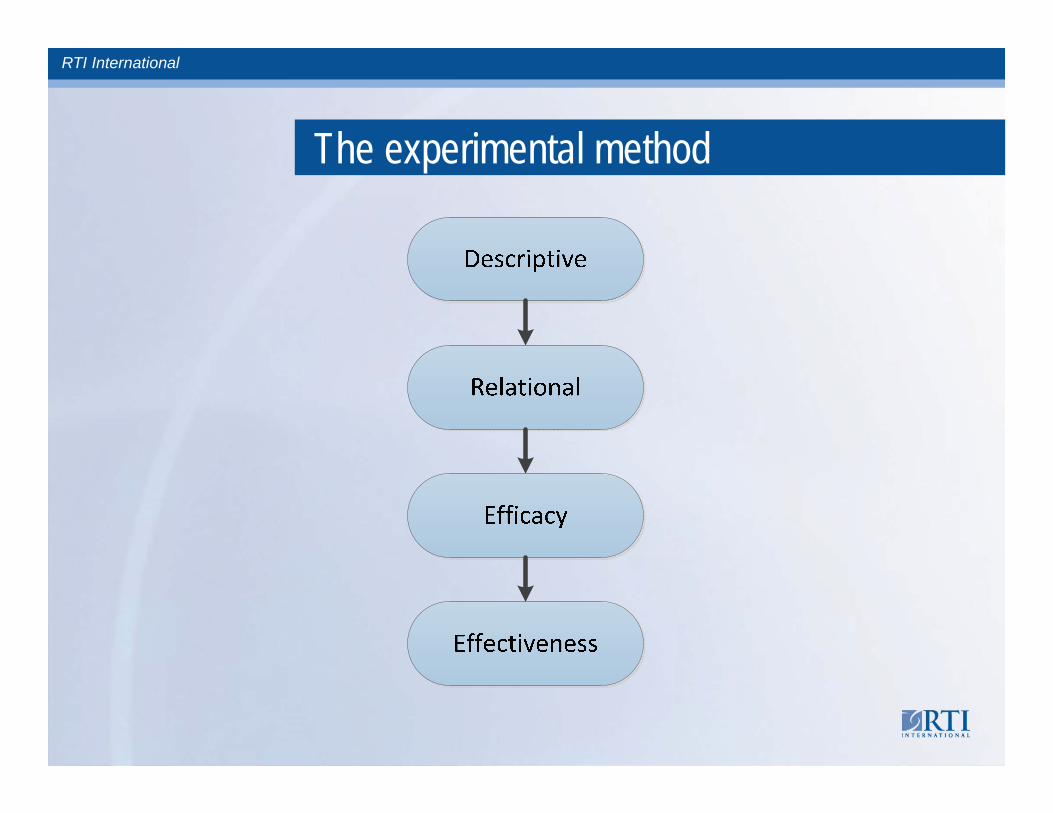
The experimental method
RTI International
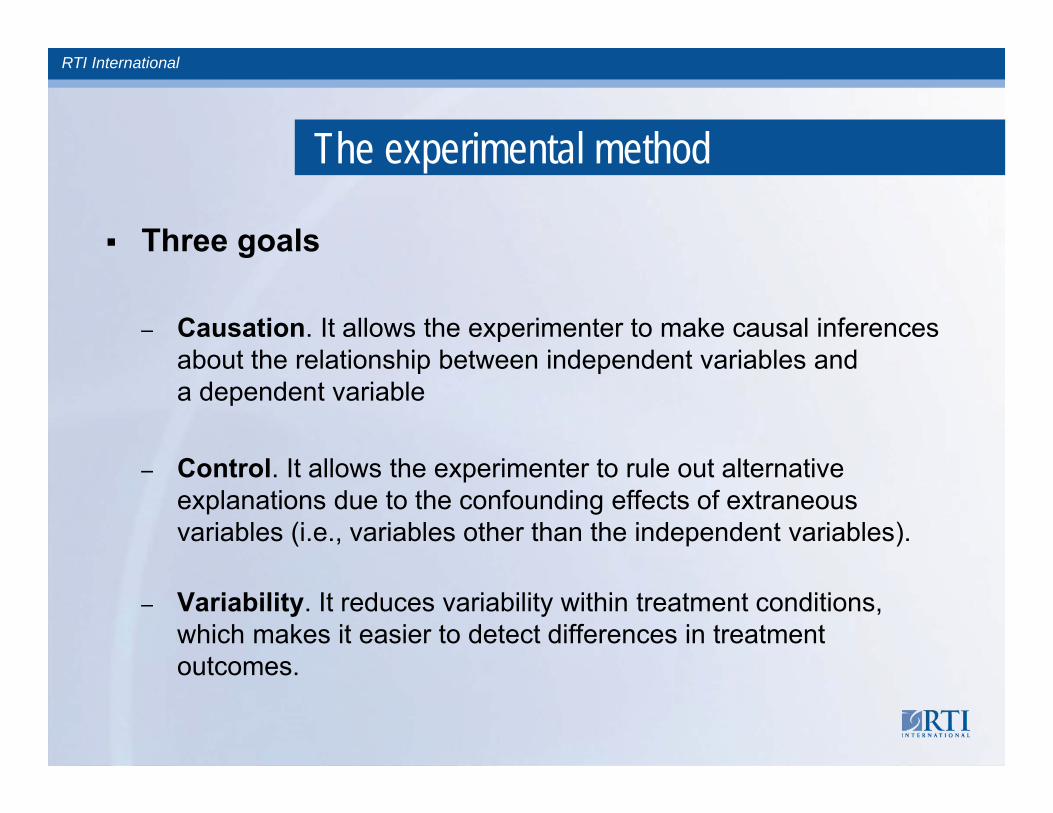
The experimental method
Three goals
– Causation. It allows the experimenter to make causal inferences about the relationship between independent variables and a dependent variable
– Control. It allows the experimenter to rule out alternative explanations due to the confounding effects of extraneous variables (i.e., variables other than the independent variables).
– Variability. It reduces variability within treatment conditions, which makes it easier to detect differences in treatment outcomes.

RTI International
RTI International is a trade name of Research Triangle Institute. www.rti.org14
What Do We Mean By Cause And Effect?

RTI International
What Do We Mean By Cause And Effect?

RTI International
16
Rules for demonstrating a causal relationship
Temporal Precedence– The observed effect must occur after the assumed
cause Co-variation
– The observed effect must be associated with assumed cause beyond chance association
Plausibility– We must be able to rule out alternative
explanations for the observed effect
RTI International
RTI International is a trade name of Research Triangle Institute. www.rti.org17
The Null Hypothesis Statistical Test

RTI International
Logic of statistical hypothesis testing
Hypothesis -- A testable statement about the relationship between two factors– Theory-driven– Include researchers belief about direction and
magnitude– Operationalizable– Falsifiable

RTI International
19
Logic of statistical hypothesis testing
Hypothesis Test – Inferential procedure using samples drawn from a population to evaluate a hypothesis about that population.
Does the observed difference reflect a realpopulation difference?– 2 possibilities: Real statistical difference (samples not from the
same population) Chance variation (random difference, but same
population)

RTI International
RTI International is a trade name of Research Triangle Institute. www.rti.org20
What Do We Mean By Validity?

RTI International
What is validity?
Validity refers to the approximate truth of an statement– Does the evidence support the statement?– What is the source of the evidence?– What other information is available?
Validity of the property of an inference, not a design

RTI International
What is validity?
Experimental studies are designed to identify a set of practices and strategies that improve food safety
Resources are limited—want to use the opportunity wisely
If we draw incorrect inferences about what works or what doesn’t work, may make bad decisions about allocation of time and resources.
Bad decisions can ultimately fail to benefit—and may even do harm to—those we are seeking to serve.

RTI International
Types of validities
Internal Validity
Statistical Conclusion Validity
External Validity
Construct Validity
Today, we will discuss internal validity and statistical conclusion validity

RTI International
24
Internal validity
Do our conclusions about observed covariationbetween a treatment, intervention, or program and a behavior the program is designed to affect reflect a causal relationship?
Have we controlled for or measured factors that could also covary with our program or the outcome?

RTI International
Threats to internal validity
Selection History Maturation Regression artifacts Attrition Instrumentation

RTI International
26
Statistical Conclusion Validity
Did the measured outcome covary with the application of the program?
What was the magnitude of covariation?
Was the observed covaration greater than expected by chance alone?
How confident can we be regarding the conclusions we draw about our hypotheses?
Statistical conclusion validity

RTI International
Threats to statistical conclusion validity
Violated assumptions of the test statistic Low statistical power Inaccurate effect size estimation Unreliability of measures Extraneous variation in the experimental setting Unreliability of treatment implementation Error rate problem

RTI International
RTI International is a trade name of Research Triangle Institute. www.rti.org
Experimental Designs Randomization and alternative designs

RTI International
Randomization isn’t all that random
Randomization is the single best and most efficient method of eliminating measureable sources of bias.
It is one of the only methods of eliminating unmeasurable sources of bias.
AND…it’s not random in the common sense of the word
Randomization uses a known mechanism for assignment treatments to persons.

RTI International
Benefits of randomization
Estimates of effect from randomized experiments are unbiased: the expectation equals the population parameter.– So the average of many randomized experiments is a good
estimate of the parameter (e.g., Meta-analysis)
Estimates from randomized experiments are consistent: as the sample size increases in an experiment, the sample estimate approaches the population parameter. – So large sample sizes are good
RTI International
What randomization is NOT
Random assignment is not random sampling– Random sampling is rarely feasible in experiments
Random assignment does not require that every unit have an equal probability of being assigned to conditions– You can assign unequal proportions to conditions
Random assignment does not compensate for poorly designed experiments
RTI International
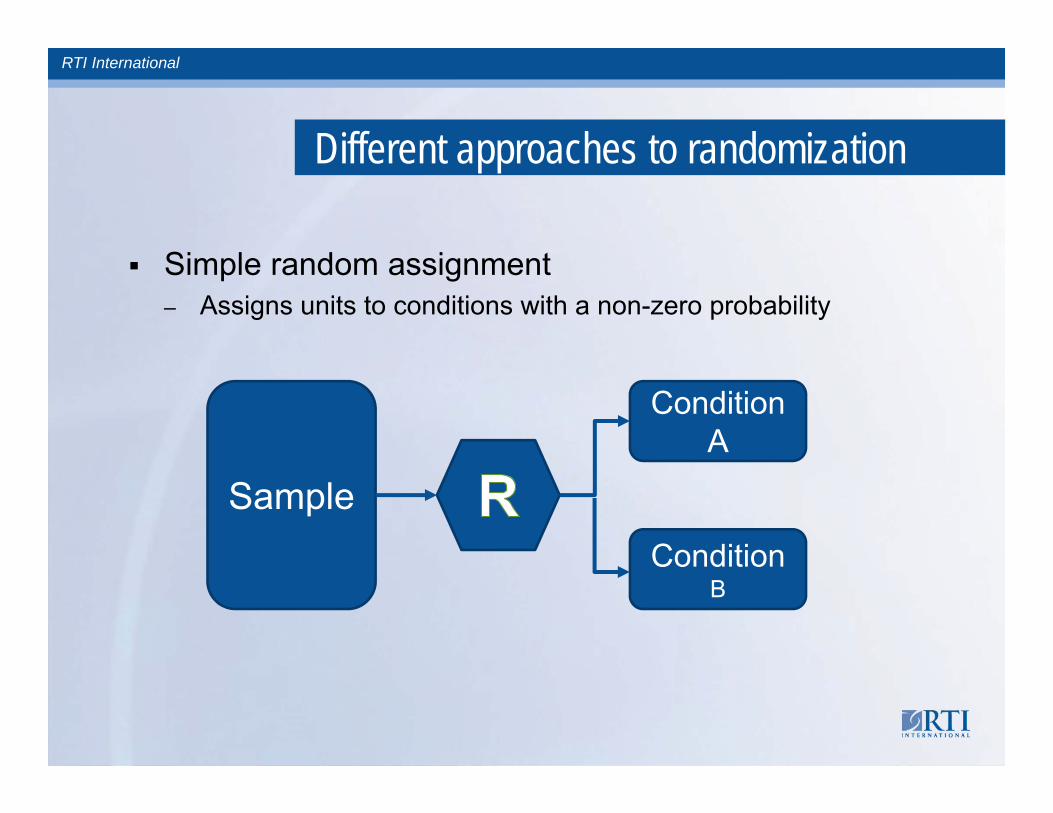
Different approaches to randomization
Simple random assignment– Assigns units to conditions with a non-zero probability
Sample
Condition A
ConditionB

RTI International
RTI International is a trade name of Research Triangle Institute. www.rti.org
Alternatives to randomization

RTI International
Alternatives to randomized design
Not always possible to randomly assign treatment to participants
Practical issues– Logistics– Timing– Recruitment/enrollment procedures
Legal and ethical issues– Distribution of scarce resources– Participants may have a right to receive treatment– Ethics of withholding beneficial treatment

RTI International
Logic of quasi-experimental designs
Logic of quasi-experimental designs– Identification of plausible threats to internal validity
What other factors could account for the observed association? How do the participants in one group differ from the participants in the other
group? Differences in place? Differences in time?
– Primacy of control by design Matching Stratification Multiple baseline measures
– Coherent pattern matching Complex predictions allow for fewer alternative explanations Interactions Mediating factors
RTI International
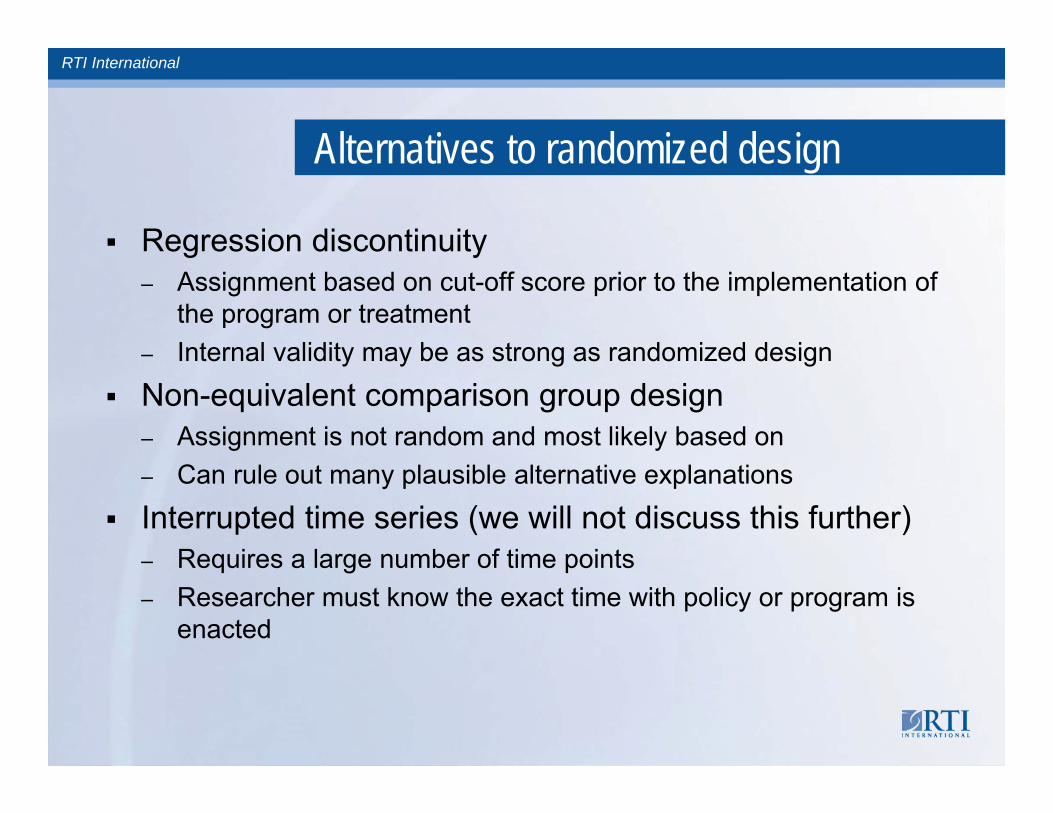
Alternatives to randomized design
Regression discontinuity– Assignment based on cut-off score prior to the implementation of
the program or treatment– Internal validity may be as strong as randomized design
Non-equivalent comparison group design– Assignment is not random and most likely based on – Can rule out many plausible alternative explanations
Interrupted time series (we will not discuss this further)– Requires a large number of time points– Researcher must know the exact time with policy or program is
enacted

RTI International
Basics of the regression discontinuity
Assigns participants to treatment or control based on whether the fall above or below a determined cut-off score on an assignment variable
Assignment variable can be any continuous measure taken prior to treatment
Assignment variable does not have to be correlated with the outcome variable
The power of the design is maximized when the cut-off value is the mean of the assignment variable

RTI International
Regression discontinuity compared with randomized design
Selection Variable (S)
Posttest (Y2)
T
C
Δ
Cutting Point

RTI International
Non-equivalent comparison (NCG) group designs
One of the most commonly used QE designs in public health and public policy research
There are NCG designs that rely strictly on post-test data Our focus is on NCG designs with pre-test and post-test
data– Repeated measures on same participants in most cases– General design plus augmented designs

RTI International
Logic of the NCG design
Retains control of a treatment of intervention applied to one set of participants, withheld from another
With baseline measures, researchers can examine similarity across conditions on outcomes measures and other factors that could be correlated with treatment outcomes
Careful design and consideration allows researchers to eliminate many potential validity threats

RTI International
Untreated control group with pre-test and post-test
One of the most commonly used QE designs in public health and public policy research
Closely mirrors RCT (minus randomization) Eliminates many validity threats
NCG design with Pre-test and Post-test measuresNR O1 X O2
NR O1 O2 1
1.5
2
2.5
3
O(2) O (3)Trx Group Comp Group

RTI International
NCG with additional pre-test measure
Provides a more dynamic view of change Excellent design to use when outcome is modeling a
developmental process
NEC design with Multiple Pre-tests and one Post-test measureNR O
1
O2
X O3
NR O1
O2
O3
1
1.5
2
2.5
3
O(1) O(2) O (3)Trx Group Comp Group

RTI International
NCG with additional comparison group
Can reduce eliminate some selection factors Excellent design to help rule out maturation, history
Many other NCG designs are possible Creative and logical thinking can compensate for
most challenges and threats to internal validity
NEC design with Multiple Pre-tests and one Post-test measureNR O1 X O2
NR O1 O2
NR O1 O2

RTI International
Resource
Shadish, Cook, and Campbell, (2002). Experimental and Quasi-Experimental Designs for Generalized Causal Inference. Boston: Houghton Mifflin Co.

RTI International
An outcome measure is the desired benefit, improvement, or achievement of a specific program goal or objective.
More specifically, it is the amount of change expected in an individual, a group of people, or population that is associated with a program or intervention activity within a given time frame (Posavac & Carey, 1997).
Developing Outcome Measures
45
RTI International
Engage key stakeholders.
Develop logic model to outline at minimum the program’s– Inputs, activities, or processes; – Outputs;– Outcomes or impacts; and– External factors that may influence program’s inputs, activities, or
outcomes.
Identify Key Outcomes First
46

RTI International
OUTCOME ≠ OUTPUTS Outputs describe the number of individuals served by
a program. Outcomes record the results of the program’s
interactions with the individual.
Outcomes Versus Outputs
47

RTI International
Outcome measures quantify the desired achievements and should be clearly defined and be “SMART” (Meyer, 2003):– Specific– Measurable– Achievable– Relevant– Time bound
SMART Outcome Measures
48

RTI International
Specific: Clearly state your desired outcome, achievement, or accomplishment by addressing the 5 Ws: Who, What, When, Where, and Why.
Outcome Measures Should Be Specific
Good example: Specific outcome: At least 85% of the teen participants will wash
all fruit before eating by the end of the 6-week intervention.Bad example:
x Nonspecific outcome: To get teens to wash fruit.
49

RTI International
Measurable: Identify the level or amount of change expected as a result of program activity.
Include numeric or descriptive measures that define quantity, quality, cost, etc.
Measurable outcomes guide evaluation design, track progress, and document success.
Outcome Measures Should Be Measurable
Good example: Measurable outcome: To increase food thermometer usage among
program participants by 25% by June 2015.Bad example:
x Nonmeasurable objective: To ensure that participants in the program use a food thermometer.
50

RTI International
Achievable: Intended behaviors should be realistic, feasible, and attainable.
Outcome Measures Should Be Achievable
Good example: Achievable objective: By end of semester, increase the percentage
of college males who always wash countertops with soap and hot water after preparing a meal at home from 40% to 50%.
Bad example:x Nonachievable objective: Increase the percentage of college males
who always wash countertops with soap and hot water after preparing a meal at home to 90% in 1 month.
51

RTI International
Relevant: Align outcomes with organization’s mission and goals.
Time bound: Clearly state a definitive date when the desired behavior will be achieved (e.g., within 6 months).
Outcome Measures Should Be Relevant and Time Bound
52

RTI International
Examine measures from prior program implementations (i.e., what is realistic and achievable).
Review published literature. If no prior estimates available, consider whether it is
appropriate to move forward with full impact evaluation or if a smaller pilot study is more appropriate.
Express Evaluation Measures in Quantifiable Terms
53
If outcome measures are not expressed in quantifiable terms, it is hard to know if the program failed to observe desired changes because of implementation failures or statistical/measurement issues.
RTI International
Include secondary outcome measures. Secondary outcomes link intervention to your outcomes
to create a clear snapshot of program’s impact on behaviors.
Secondary outcomes capture complex nature of behavior change process, include mediating factors and short-term outcomes.
Changes in short-term outcomes may influence primary outcome.
Primary and Secondary Outcome Measures
54
RTI International
Predisposing factors include the knowledge and attitudes of an individual as they relate to the motivation to act.
Enabling factors include the skills and resources needed to engage in intended behavior.
Reinforcing factors include factors that help reinforce intended behavior.
Mediating Factors
55

RTI International
Davidson, E. J. (2013). Actionable evaluation basics: Getting succinct answers to the most important questions. Auckland, New Zealand: Real Evaluation Ltd.
Wholey, J. S., Hatry, H. P., & Newcomer, K. E. (2010). Handbook of practical program evaluation (3rd ed.). San Francisco, CA: Jossey-Bass.
Yin, R. K. (2009). Case study research: Design and methods (4th ed.). Thousand Oaks, CA: SAGE Publications, Inc.
For More Information on Selecting and Defining Outcome Measures
56

RTI International
Questions
57
RTI International
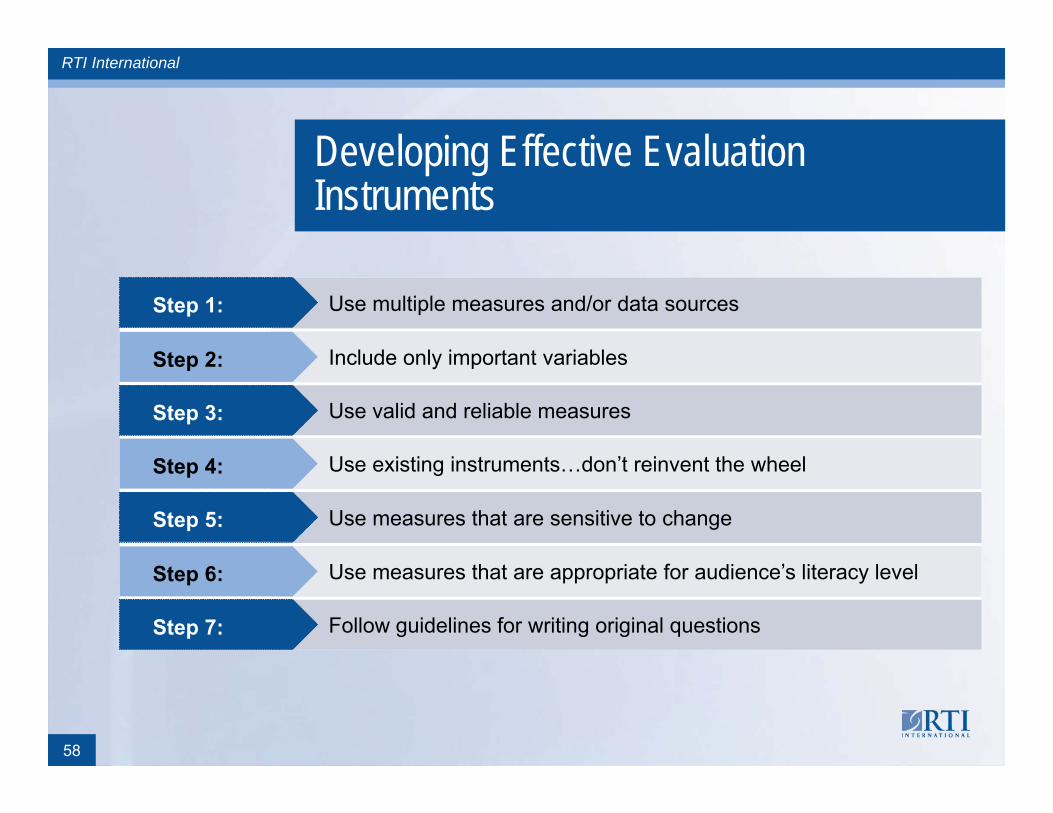
Developing Effective Evaluation Instruments
58
Use multiple measures and/or data sourcesStep 1:
Include only important variablesStep 2:
Use valid and reliable measuresStep 3:
Use existing instruments…don’t reinvent the wheelStep 4:
Use measures that are sensitive to changeStep 5:
Use measures that are appropriate for audience’s literacy level Step 6:
Follow guidelines for writing original questionsStep 7:

RTI International
By using multiple measures of the same underlying construct that are assessed in different ways and drawn from different sources, you can arrive at conclusions that can greatly strengthen your overall evaluation effort (Posavac, 2010).
Two or more data sources will provide a clearer picture of intended behavior than just one source on its own. If resources permit, this is a good approach to use.
STEP 1: Use Multiple Measures and/or Data Sources
59

RTI International
Resist the “kitchen sink” approach. Ask yourself what questions truly need to be answered. Which variables are essential to the evaluation?
If respondents perceive questions to be unimportant or off-track, they may become inattentive and less willing to complete the survey accurately.
Asking nonessential questions can weaken your results if respondents do not answer particular questions or decline to complete the survey.
STEP 2: Include Only Important Variables
60
A good rule of thumb: Limit interviewer-administered surveys to 15 to 20 minutes and self-administered surveys to 5 to 10 minutes

RTI International
Reliability Reliability of a survey item or instrument is shown by the
extent to which it produces the same result when applied to the same person under the same conditions.
Often assessed using test-retest method. Validity Survey items or instruments are considered to be valid
when they accurately measure the activity, behavior, or opinion they’re intended to assess.
Validity applies not to the survey items themselves but rather to the purpose for which they are being used.
STEP 3: Use Reliable and Valid Measures
61

RTI International
Reliability refers to the consistency of measures. Validity refers to the accuracy of measures. Example…
– Let’s say your scale is off by 5 pounds. Everyday, it reads your weight as being 5 pounds higher than it actually is.
Although the reliability (consistency) of this scale is very good because it consistently reports the same weight every day, it is not valid (accurate) because you actually weigh 5 pounds less.
Use Reliable and Valid Measures (continued)
62

RTI International
Types of Reliability
Source: Litwin, M. S. (1995). How to measure survey reliability and validity. Thousand Oaks, CA: SAGE Publications. Adapted with permission.63
Reliability = consistency of measureType of
Reliability Description Statistical Test
Test-retest Indicator of the stability of responses over time that is measured by having the same set of respondents complete the survey (a single item or group of items or scale within an instrument) at two different time points.
Correlation coefficient or r value is calculated to compare the two sets of responses.
Internal Consistency
Indicator of how well a group of items in a scale measures the same characteristic or concept.
Measured by calculating Cronbach’s coefficient , a statistic that reflects the homogeneity of the scale.
Interobserver or inter-rater
Indicator of how well two or more interviewers agree in their assessment of a variable; should be used whenever there is a subjective component in the measurement of an external variable.
Measured as a correlation coefficient between different data collectors.

RTI International
Types of Validity
Source: Litwin, M. S. (1995). How to measure survey reliability and validity. Thousand Oaks, CA: SAGE Publications. Adapted with permission.
64
Type of Validity Description
Face Casual review of how good an item or group of items appears as assessed by individuals with no formal training in the subject matter of interest.
Content Formal expert review of how good an item or series of items appears, usually assessed by individuals who are experts in the subject matter of interest.
Concurrent criterion
Measures how well the item or scale correlates with the “gold standard” measure of the same variable. For example, for measuring dietary intake, the “gold standard” would be 24-hour dietary recalls.
Predictive criterion
Measures how well the item or scale predicts expected future observations.
Construct Theoretical measure of how meaningful a survey instrument is and is usually determined after years of experience by numerous investigators (more like hypothesis testing than calculation of correlation coefficients).
Validity = accuracy of measure
RTI International
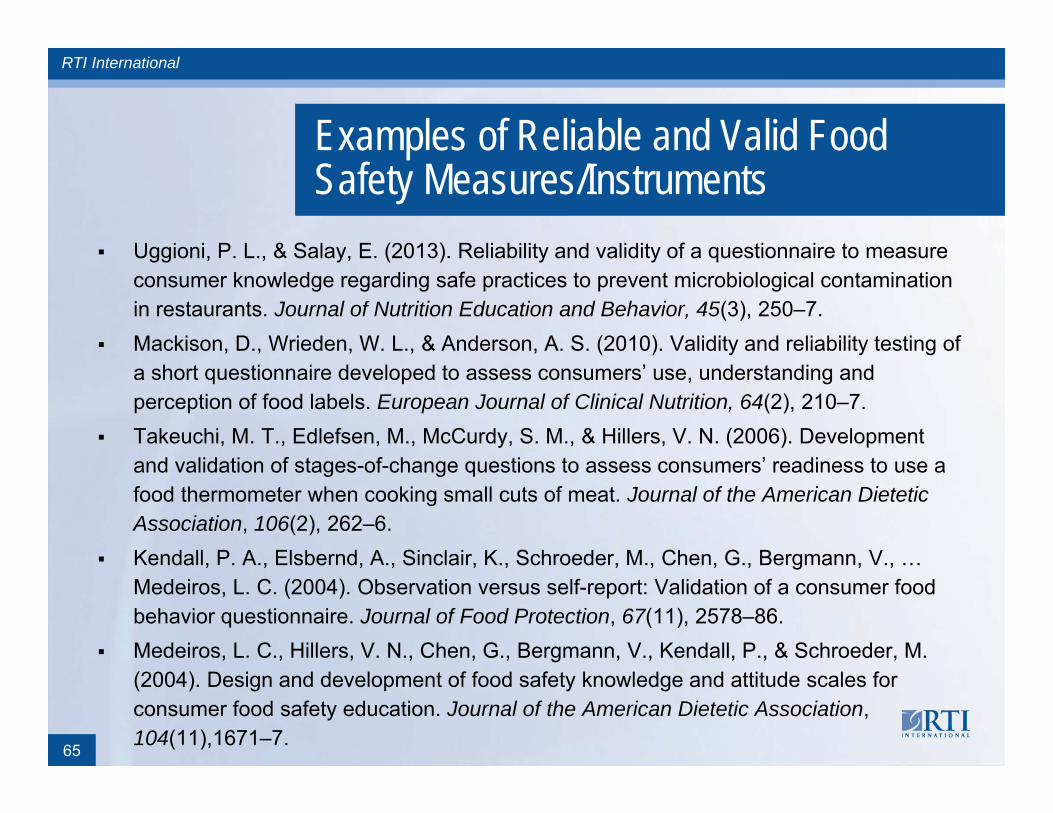
Uggioni, P. L., & Salay, E. (2013). Reliability and validity of a questionnaire to measure consumer knowledge regarding safe practices to prevent microbiological contamination in restaurants. Journal of Nutrition Education and Behavior, 45(3), 250–7.
Mackison, D., Wrieden, W. L., & Anderson, A. S. (2010). Validity and reliability testing of a short questionnaire developed to assess consumers’ use, understanding and perception of food labels. European Journal of Clinical Nutrition, 64(2), 210–7.
Takeuchi, M. T., Edlefsen, M., McCurdy, S. M., & Hillers, V. N. (2006). Development and validation of stages-of-change questions to assess consumers’ readiness to use a food thermometer when cooking small cuts of meat. Journal of the American Dietetic Association, 106(2), 262–6.
Kendall, P. A., Elsbernd, A., Sinclair, K., Schroeder, M., Chen, G., Bergmann, V., … Medeiros, L. C. (2004). Observation versus self-report: Validation of a consumer food behavior questionnaire. Journal of Food Protection, 67(11), 2578–86.
Medeiros, L. C., Hillers, V. N., Chen, G., Bergmann, V., Kendall, P., & Schroeder, M.(2004). Design and development of food safety knowledge and attitude scales for consumer food safety education. Journal of the American Dietetic Association, 104(11),1671–7.
Examples of Reliable and Valid Food Safety Measures/Instruments
65

RTI International
For More Information on Measuring Survey Reliability and Validity
66
Carmines, E. G., & Zeller, R. A. (1979). Reliability and validity assessment (2nd ed.). Thousand Oaks, CA: SAGE Publications.
Litwin, M. S. (1995). How to measure survey reliability and validity. Thousand Oaks, CA: SAGE Publications.
Traub, R. E. (1994). Reliability for the social sciences: Theory and applications. Thousand Oaks, CA: SAGE Publications.

RTI International
Do not reinvent the wheel. Whenever possible, use existing instruments that have
been previously demonstrated to be valid and reliable for measuring the outcomes of interest.– See examples on previous slide– FDA Food Safety Survey at http://www.fda.gov/Food/
FoodScienceResearch/ConsumerBehaviorResearch/ucm259074.htm
– Others
STEP 4: Use Existing Instruments
67

RTI International
The term “sensitivity” refers to the ability of a measure to detect variation associated with the measured outcome before and after the intervention.
Continuous measures of an outcome (e.g., a 5-point Likert scale) are more sensitive to detecting change than dichotomous (yes/no) measures.
STEP 5: Use Measures that are Sensitive to Change
68
Dichotomous Measure Continuous MeasureDo you use a food thermometer to check the doneness of hamburgers? Yes No
How often do you use a food thermometer to check the doneness of hamburgers? Almost never Often Once in a while Almost always Sometimes
RTI International
Make sure your audience understands the questions asked in your survey.
Questions should be easily understood by low-literacy and limited-resource audiences.
For best results, use existing instruments that have been tested for literacy, especially ones that have been used with limited-resource audiences.
If developing new questions, conduct tests to assess ease of reading and literacy grade level.
STEP 6: Use Measures that are Appropriate for Audience’s Literacy Level
69
RTI International
A variety of tests are available to assess reading ease and grade level. – Flesch Reading Ease test (Flesch, 1948) – Flesch–Kincaid Grade Level Formula (Kincaid et al., 1975)– Gunning Fog index (Gunning, 1968) – Coleman–Liau index (Coleman & Liau, 1975)– Fry Test (Fry, 1968) – Automated Readability Index (ARI) (Senter & Smith, 1967)
This website can perform several different tests:http://www.readability-score.com.
Microsoft Word can conduct Flesch tests.
Tests to Assess Reading Ease and Grade Level
70
RTI International
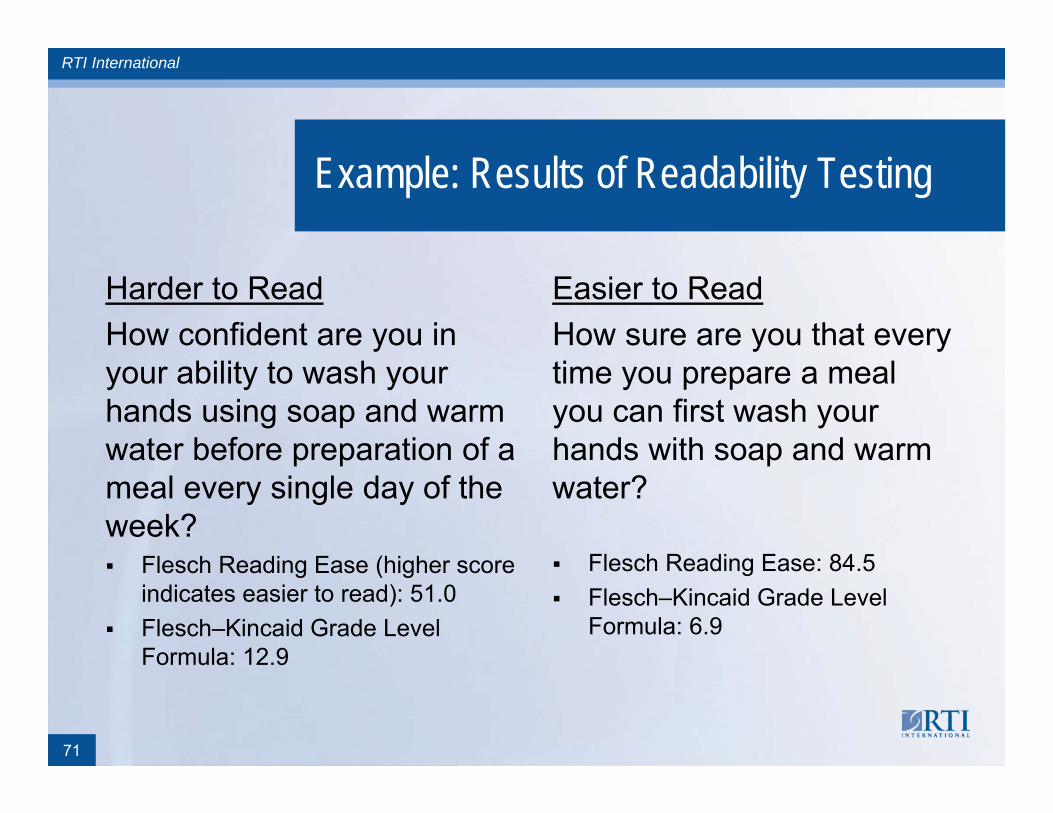
Harder to ReadHow confident are you in your ability to wash your hands using soap and warm water before preparation of a meal every single day of the week? Flesch Reading Ease (higher score
indicates easier to read): 51.0 Flesch–Kincaid Grade Level
Formula: 12.9
Example: Results of Readability Testing
Easier to ReadHow sure are you that every time you prepare a meal you can first wash your hands with soap and warm water?
Flesch Reading Ease: 84.5 Flesch–Kincaid Grade Level
Formula: 6.9
71

RTI International
Begin by asking questions that clearly relate to the program’s topics and goals to build face validity and engage respondents.– Ask about specific domains (e.g., printed materials, hands-on
activities) before asking general summary questions.– Ask sensitive items near end of questionnaire.– Conclude with demographic questions.– Thank participants.
Consider whether respondents are willing or able to answer all the questions you would like to ask them.– For example, respondents may not be able to accurately report
behaviors of household members.
STEP 7: Follow Guidelines for Writing Original Questions
72

RTI International
Avoid open-ended questions whenever possible.– Low-literacy populations can find writing challenging and their
handwriting may be difficult to read or interpret.– Written text takes longer to code and quantify.
Avoid numerous, wordy, or complicated questions that involve many skips and changes in topic.
Write questions that address one subject at a time; avoid double-barreled questions.– Use response items that are mutually exclusive.
Guidelines for Writing Original Questions (continued)
73

RTI International
Avoid complicated syntax, technical jargon, or advanced vocabulary.
Word questions neutrally to avoid response bias. – For example, mix positively and negative worded questions in
attitude scales. Be specific about reference periods.
– For example, use “in the past 7 days” instead of “in the past week.”
Guidelines for Writing Original Questions (continued)
74

RTI International
Explain survey data will be handled confidentially. – Use unique case IDs.– Report data in summary form.
Ask colleagues to review draft questions to get a fresh perspective.– Read questions aloud.– Obtain estimate of how long survey will take to complete.
Guidelines for Writing Original Questions (continued)
75

RTI International
Cognitive interviews can provide useful information on the– manner and degree to which respondents understand questions, – how respondents recall information and appropriate cues to help
aid recall, – cognitive complexity of questions and the strategies used by
respondents to answer the questions, – extent to which respondents are answering questions as
intended,– ability of respondents to make any calculations and judgments,
and– whether any important responses are missing from the list of
responses.
How to Test Evaluation Instruments
76

RTI International
Two approaches to conducting cognitive interviews: 1. The respondent reads aloud from the draft survey (especially if
the instrument will be self-administered) or 2. You (the interviewer) read the questions aloud to the
respondent Use a “think aloud” method in which you ask a
respondent to describe his/her thought process while answering the survey questions.
Use follow-up “probes” to learn how respondents understand the meaning of questions. – Concurrent versus retrospective probing
How to Test Evaluation Instruments (continued)
77
RTI International
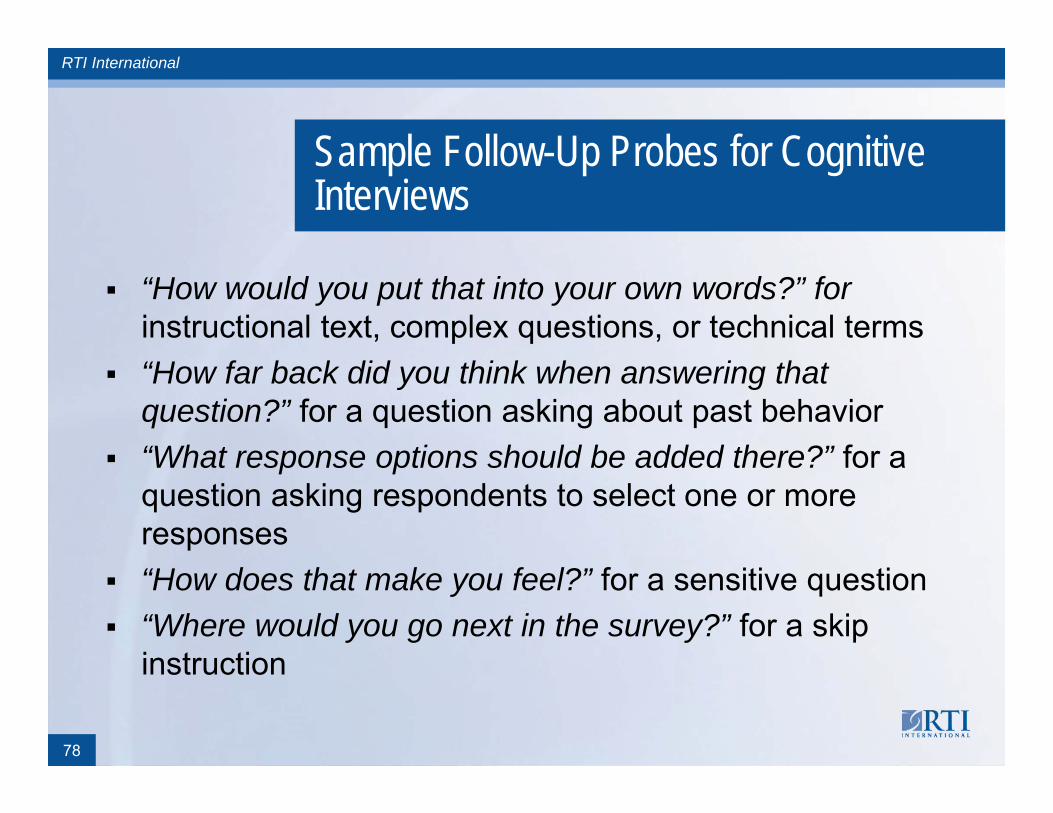
“How would you put that into your own words?” forinstructional text, complex questions, or technical terms
“How far back did you think when answering that question?” for a question asking about past behavior
“What response options should be added there?” for a question asking respondents to select one or more responses
“How does that make you feel?” for a sensitive question “Where would you go next in the survey?” for a skip
instruction
Sample Follow-Up Probes for Cognitive Interviews
78

RTI International
For More Information on Developing Effective Evaluation Instruments
79
Converse, J., & Presser, S. (1986). Survey questions: Handcrafting the standardized questionnaire. Newbury Park: SAGE Publications.
Devellis, R. F. (2012). Scale development: Theory and applications (3rd Ed.). Thousand Oaks, CA: SAGE Publications.
Fink, A. (2004). Evaluation fundamentals (2nd Ed.). Thousand Oaks, CA: SAGE Publications, Inc.
Fowler, Jr., F. J. (1995). Improving survey questions: Design and evaluation. Thousand Oaks, CA: SAGE Publications.
National Collaborative on Childhood Obesity Research (NCCOR). (2012). Measures registry. Retrieved from http://nccor.org/projects/measures/index.php
Schaeffer, N. C., & Presser, S. (2003). The science of asking questions. Annual Review of Sociology, 29, 65–88.
Sudman, S. & Bradburn, N. (1982). Asking questions: A practical guide to questionnaire design. San Francisco: Jossey-Bass.

RTI International
Steps in forward translation– Conduct forward translation using native-speaking translation
professionals. Provide translator with instructions on translation approach,
emphasizing conceptual rather than literal translations and the need to use natural and acceptable language for the broadest audience.
– Edit revised documents (second person). – Conduct cognitive interviews to test translation.– Finalize translated documents.
Translating Survey Instruments
80
The focus of translation should be cross-cultural and conceptual rather than linguistic (literal equivalence).

RTI International
Translating Survey Instruments (continued)
81
The World Health Organization (WHO) Guidelines for Forward Translation1. Translators should always aim at the conceptual equivalent of a word or phrase, not a word-for-
word translation (i.e., not a literal translation). They should consider the definition of the original term and attempt to translate it in the most relevant way.
2. Translators should strive to be simple, clear, and concise in formulating a question. Fewer words are better. Long sentences with many clauses should be avoided.
3. The target language should aim for the most common audience. Translators should consider the typical respondent for the instrument being translated and what the respondent will understand when s/he hears the question.
4. Translators should avoid the use of any jargon. For example, they should not usea. technical terms that cannot be understood clearly and b. colloquialism, idioms, or vernacular terms that cannot be understood by common people in
everyday life.
5. Translators should consider issues of gender and age applicability and avoid any terms that might be considered offensive to the target population.
Source: World Health Organization (WHO). (n.d.). The process of translation and adaptation of instruments. Retrieved from http://www.who.int/substance_abuse/research_tools/translation/en/

RTI International
For More Information on Translating Survey Instruments
82
Behling, O., & Law, K. S. (2000). Translating questionnaires and other research instruments: Problems and solutions. Thousand Oaks, CA: SAGE Publications, Inc.
Esposito, N. (2001). From meaning to meaning: The influence of translation techniques on non-English focus group research. Qualitative Health Research, 11(4), 568–79.
Harkness, J. A., van de Vijver, F. J. R., & Mohler, P. P. (2002). Cross-cultural survey methods. New York, NY: Wiley Publishers.
Pan, Y., & de la Puente, M. (2005). Census Bureau guideline for the translation of data collection instruments and data collection instruments and supporting materials: Documentation on how the guideline was developed. Research Report Series (Survey Methodology #2005-06). Washington, DC: Census Bureau.
World Health Organization (WHO). (n.d.). The process of translation and adaptation of instruments. Retrieved from http://www.who.int/substance_abuse/research_tools/translation/en/

RTI International
Questions
83