Embed Size (px)
Citation preview
An Oracle White Paper March 2014
Best Practices for Workload Management of a Data Warehouse on the Oracle Exadata Database Machine
Best Practices for Workload Management of a Data Warehouse on the Oracle Exadata Database Machine
Introduction ......................................................................................... 1 Parallel Execution ............................................................................... 2
Basic principles of parallel processing ............................................ 2 Controlling parallel execution on a RAC environment ..................... 3
Workload Monitoring ........................................................................... 4 Monitoring the benefits of Exadata storage ......................................... 8
Storage Indexes ............................................................................ 11 Database Resource Manager ........................................................... 12 Optimizer Statistics Management ..................................................... 13
Frequency of statistics gathering .................................................. 14 Conclusion ........................................................................................ 15
Oracle White Paper—Best Practices for a Data Warehouse on Oracle Exadata Database Machine
1
Introduction
Regardless of the purpose of your data warehouse the challenge is always the same, access and process large amounts of data in an extremely short amount of time. The key to getting good performance from your data warehouse is to leverage all of the hardware resource available: multiple CPUs, all IO channels, storage arrays and disks, as well as large volumes of memory.
This paper explains how to leverage Oracle key database technologies such as Parallel Execution, Resource Manager and more to fully utilize your system regardless of which data model you have implement. It will build on what you have already learned in part one of our best practices for Data Warehousing series “How to Implement a Data Warehouse on Oracle Exadata Database Machine”.
The paper is divided into four sections:
The first describes Oracle’s parallel execution capabilities and how you should use it to fully utilize your system.
The second explains how Oracle Resource manager enables you to manage a mixed workload environment. It also outlines the Optimizer statistics management.
The remaining three sections explain how to implement these models in the most optimal manner in an Oracle database and provide detailed information on how to achieve optimal data loading performance.
Oracle White Paper—Best Practices for a Data Warehouse on Oracle Exadata Database Machine
2
Parallel Execution
Parallel execution is one of the key features, which will enable you to fully utilize your system and is beneficial regardless of which data model you will implement. Parallel execution should be leveraged for all resource intensive operations including:
• Complex queries that access large amounts of data
• Building indexes on large tables
• Gathering Optimizer statistics
• Loading or manipulating large volumes of data
Basic principles of parallel processing
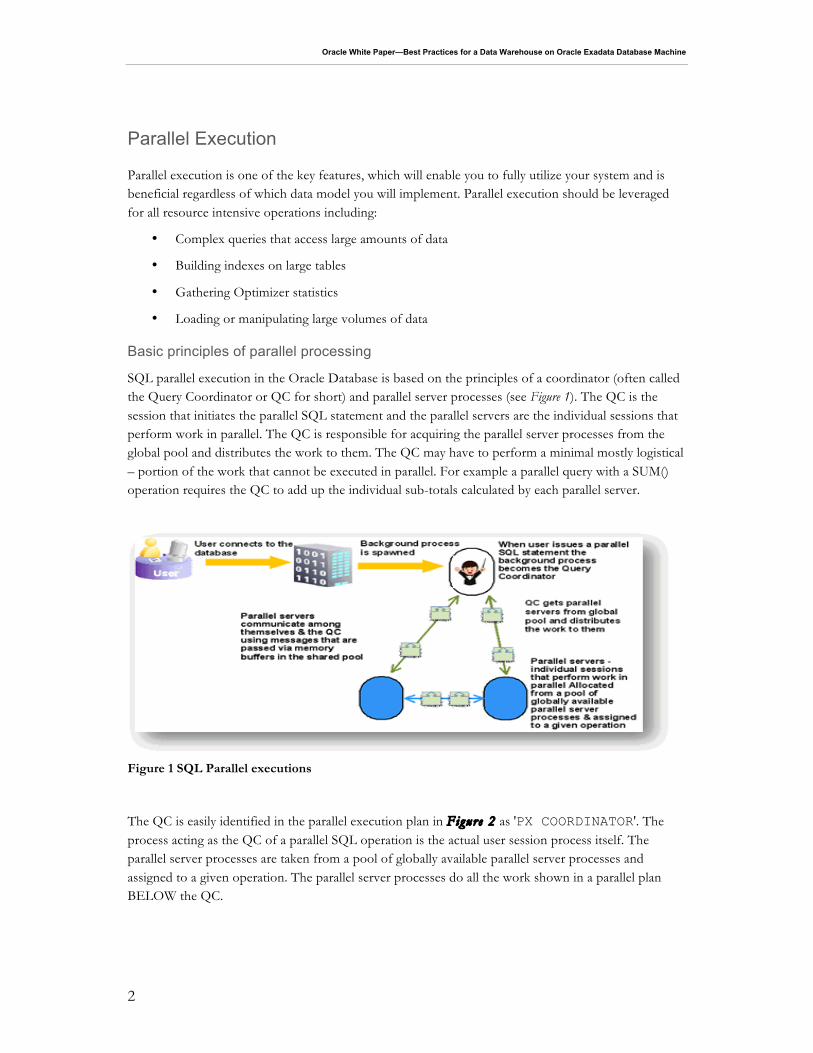
SQL parallel execution in the Oracle Database is based on the principles of a coordinator (often called the Query Coordinator or QC for short) and parallel server processes (see Figure 1). The QC is the session that initiates the parallel SQL statement and the parallel servers are the individual sessions that perform work in parallel. The QC is responsible for acquiring the parallel server processes from the global pool and distributes the work to them. The QC may have to perform a minimal mostly logistical – portion of the work that cannot be executed in parallel. For example a parallel query with a SUM() operation requires the QC to add up the individual sub-totals calculated by each parallel server.
Figure 1 SQL Parallel executions
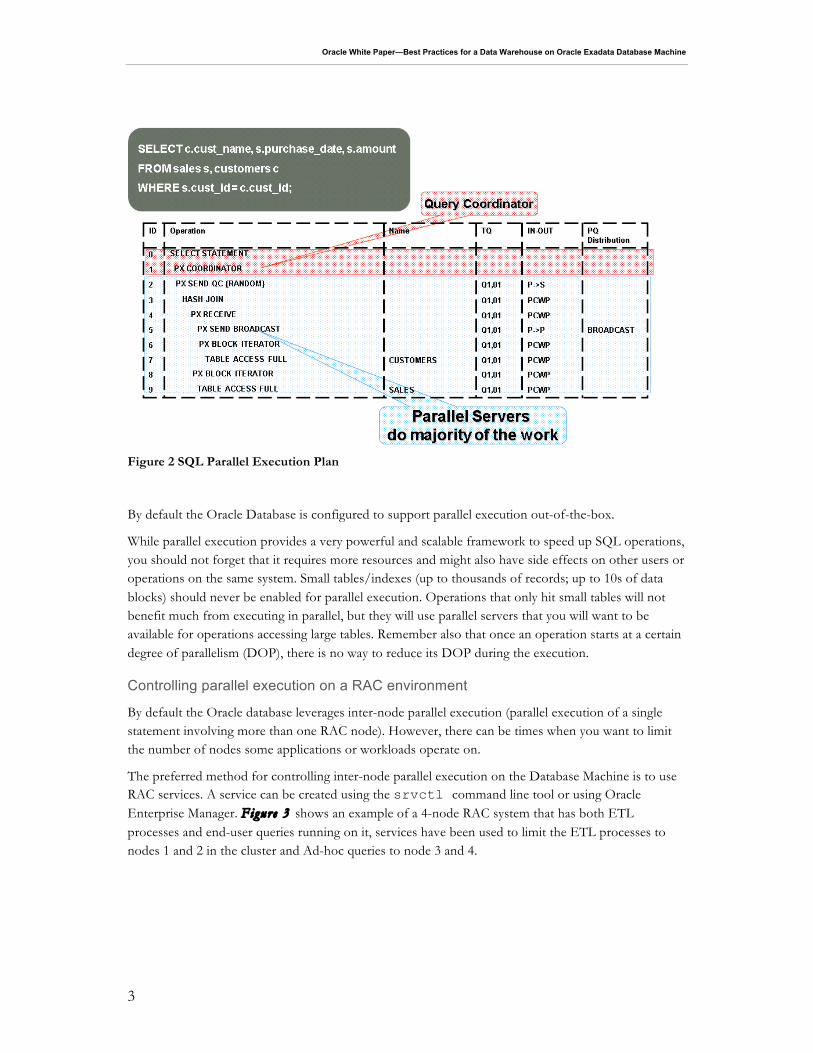
The QC is easily identified in the parallel execution plan in Figure 2 as 'PX COORDINATOR'. The process acting as the QC of a parallel SQL operation is the actual user session process itself. The parallel server processes are taken from a pool of globally available parallel server processes and assigned to a given operation. The parallel server processes do all the work shown in a parallel plan BELOW the QC.
Oracle White Paper—Best Practices for a Data Warehouse on Oracle Exadata Database Machine
3
Figure 2 SQL Parallel Execution Plan
By default the Oracle Database is configured to support parallel execution out-of-the-box.
While parallel execution provides a very powerful and scalable framework to speed up SQL operations, you should not forget that it requires more resources and might also have side effects on other users or operations on the same system. Small tables/indexes (up to thousands of records; up to 10s of data blocks) should never be enabled for parallel execution. Operations that only hit small tables will not benefit much from executing in parallel, but they will use parallel servers that you will want to be available for operations accessing large tables. Remember also that once an operation starts at a certain degree of parallelism (DOP), there is no way to reduce its DOP during the execution.
Controlling parallel execution on a RAC environment
By default the Oracle database leverages inter-node parallel execution (parallel execution of a single statement involving more than one RAC node). However, there can be times when you want to limit the number of nodes some applications or workloads operate on.
The preferred method for controlling inter-node parallel execution on the Database Machine is to use RAC services. A service can be created using the srvctl command line tool or using Oracle Enterprise Manager. Figure 3 shows an example of a 4-node RAC system that has both ETL processes and end-user queries running on it, services have been used to limit the ETL processes to nodes 1 and 2 in the cluster and Ad-hoc queries to node 3 and 4.
Oracle White Paper—Best Practices for a Data Warehouse on Oracle Exadata Database Machine
4
Srvctl add service –d database_name -s ETL -r sid1, sid2 Srvctl add service –d database_name -s ADHOC -r sid3, sid4
Figure 3: Controlling Parallel execution with services
It is also possible to limit the parallel server to just the node the statement is issued on by setting PARALLEL_FORCE_LOCAL to TRUE.
Workload Monitoring
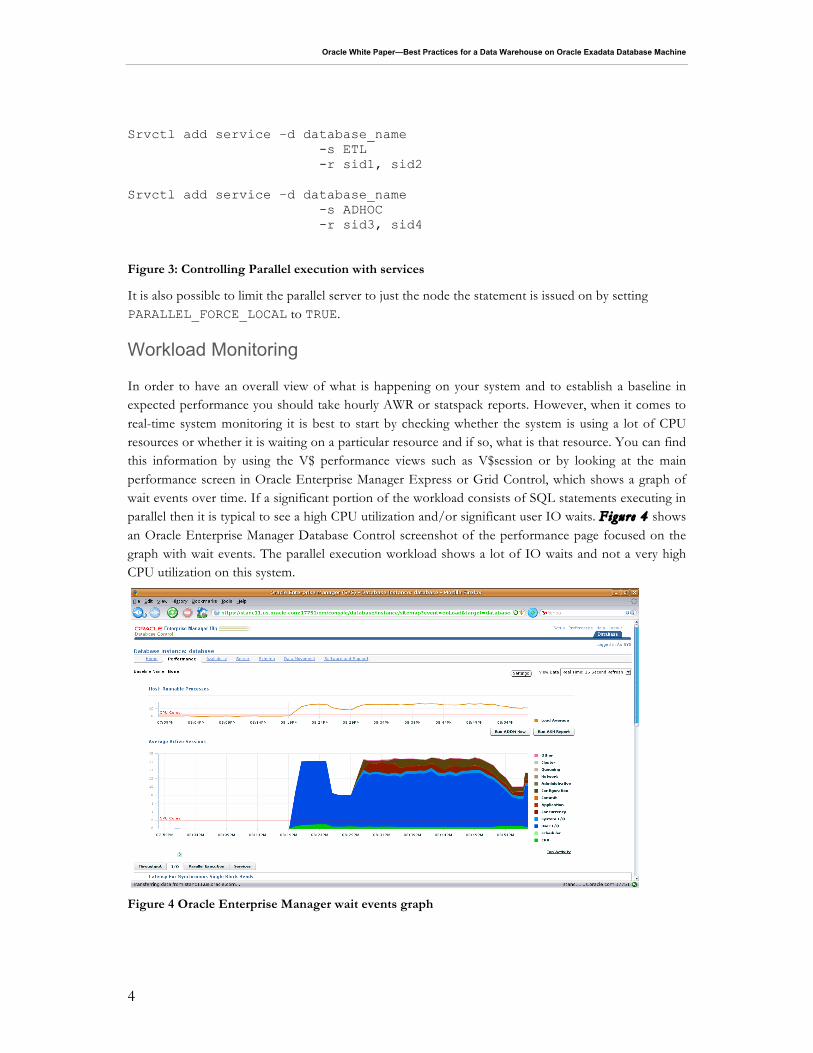
In order to have an overall view of what is happening on your system and to establish a baseline in expected performance you should take hourly AWR or statspack reports. However, when it comes to real-time system monitoring it is best to start by checking whether the system is using a lot of CPU resources or whether it is waiting on a particular resource and if so, what is that resource. You can find this information by using the V$ performance views such as V$session or by looking at the main performance screen in Oracle Enterprise Manager Express or Grid Control, which shows a graph of wait events over time. If a significant portion of the workload consists of SQL statements executing in parallel then it is typical to see a high CPU utilization and/or significant user IO waits. Figure 4 shows an Oracle Enterprise Manager Database Control screenshot of the performance page focused on the graph with wait events. The parallel execution workload shows a lot of IO waits and not a very high CPU utilization on this system.
Figure 4 Oracle Enterprise Manager wait events graph
Oracle White Paper—Best Practices for a Data Warehouse on Oracle Exadata Database Machine
5
If you were to look at an AWR or statspack report for the same time period as shown in Figure 4 it is likely you would see PX wait events on the top or near the top of the wait event list. The most common PX events deal with the message (data) exchange between the parallel servers themselves and with the query coordinator. You will most likely see wait events such as PX Deq Credit: send blkd, which is due to one set of parallel servers (the producers or data readers) waiting for consumers (another set of parallel servers) to accept data. Or PX Deq Credit: need buffer, which is caused by consumers waiting for producers to produce data. The PX wait events are unavoidable to a large extent and don't really hurt performance as these wait events fall in the “idle” wait class. Generally it is not parallel execution specific wait events that may cause slow system performance but rather waits introduced by the workload running in parallel, such as IO waits, or high CPU utilization. An increase in the number of the idle PX events can often be considered a symptom of a performance problem rather than the cause. For example, an increase in PX Deq Credit: need buffer waits (consumers waiting for producers to produce data) is likely to indicate an IO bottleneck or performance problem, as producer operations tend to involve disk IO (e.g. a parallel full table scan).
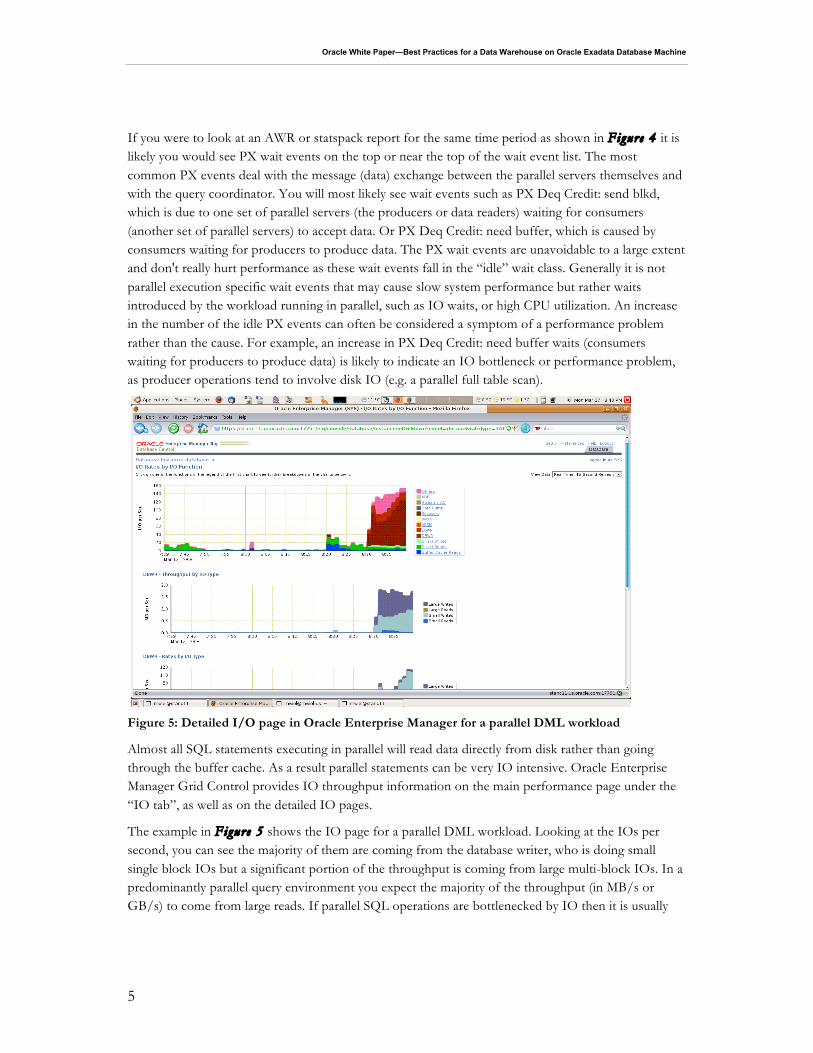
Figure 5: Detailed I/O page in Oracle Enterprise Manager for a parallel DML workload
Almost all SQL statements executing in parallel will read data directly from disk rather than going through the buffer cache. As a result parallel statements can be very IO intensive. Oracle Enterprise Manager Grid Control provides IO throughput information on the main performance page under the “IO tab”, as well as on the detailed IO pages.
The example in Figure 5 shows the IO page for a parallel DML workload. Looking at the IOs per second, you can see the majority of them are coming from the database writer, who is doing small single block IOs but a significant portion of the throughput is coming from large multi-block IOs. In a predominantly parallel query environment you expect the majority of the throughput (in MB/s or GB/s) to come from large reads. If parallel SQL operations are bottlenecked by IO then it is usually
Oracle White Paper—Best Practices for a Data Warehouse on Oracle Exadata Database Machine
6
because the maximum throughput (MB/s) has been reached rather than the maximum I/O operations per second (IOPS).
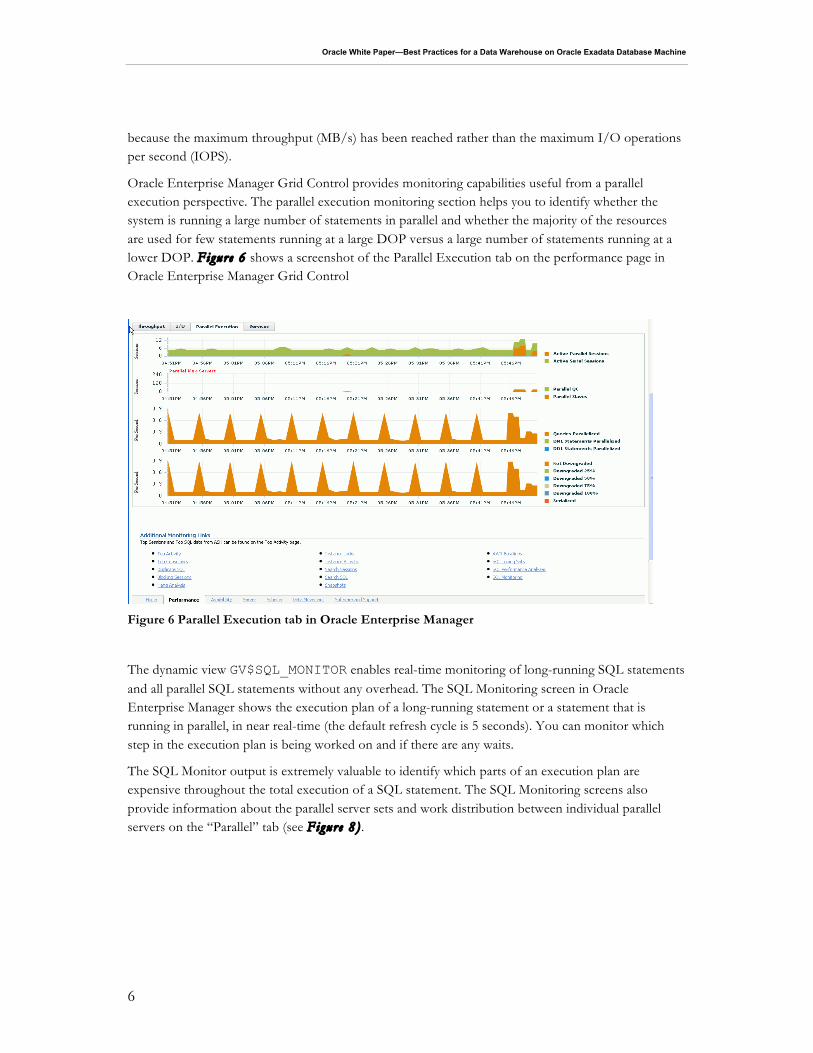
Oracle Enterprise Manager Grid Control provides monitoring capabilities useful from a parallel execution perspective. The parallel execution monitoring section helps you to identify whether the system is running a large number of statements in parallel and whether the majority of the resources are used for few statements running at a large DOP versus a large number of statements running at a lower DOP. Figure 6 shows a screenshot of the Parallel Execution tab on the performance page in Oracle Enterprise Manager Grid Control
Figure 6 Parallel Execution tab in Oracle Enterprise Manager
The dynamic view GV$SQL_MONITOR enables real-time monitoring of long-running SQL statements and all parallel SQL statements without any overhead. The SQL Monitoring screen in Oracle Enterprise Manager shows the execution plan of a long-running statement or a statement that is running in parallel, in near real-time (the default refresh cycle is 5 seconds). You can monitor which step in the execution plan is being worked on and if there are any waits.
The SQL Monitor output is extremely valuable to identify which parts of an execution plan are expensive throughout the total execution of a SQL statement. The SQL Monitoring screens also provide information about the parallel server sets and work distribution between individual parallel servers on the “Parallel” tab (see Figure 8) .
Oracle White Paper—Best Practices for a Data Warehouse on Oracle Exadata Database Machine
7
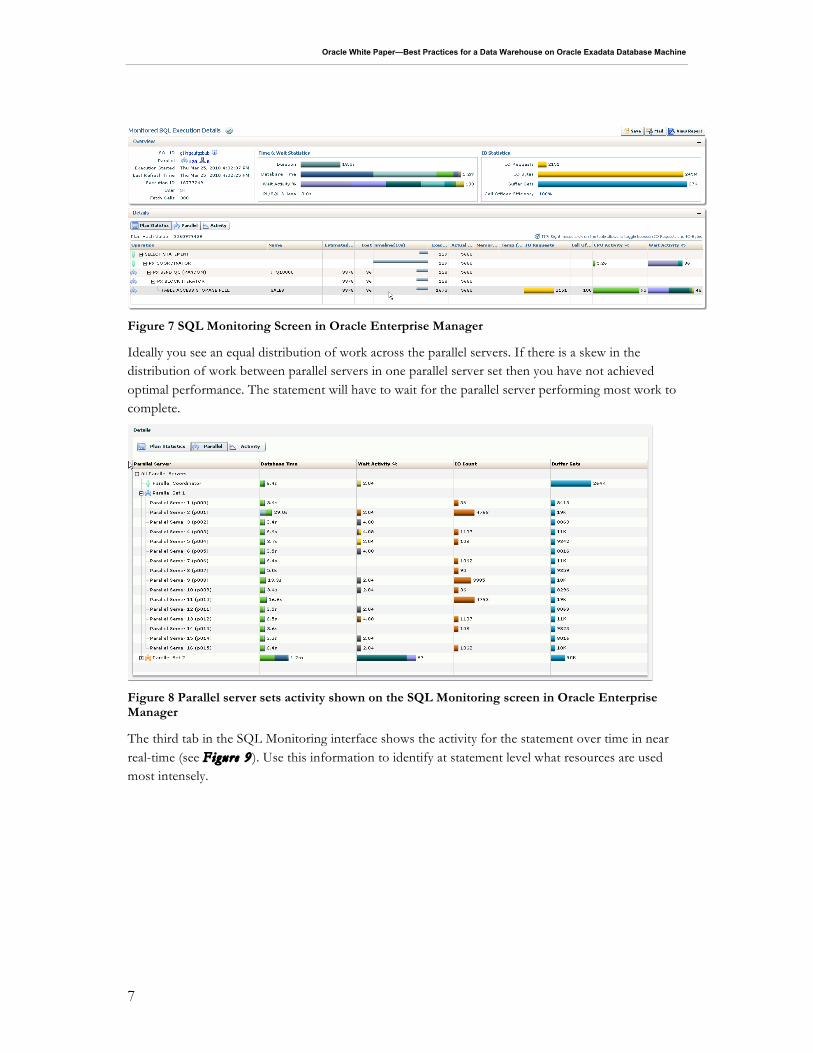
Figure 7 SQL Monitoring Screen in Oracle Enterprise Manager
Ideally you see an equal distribution of work across the parallel servers. If there is a skew in the distribution of work between parallel servers in one parallel server set then you have not achieved optimal performance. The statement will have to wait for the parallel server performing most work to complete.
Figure 8 Parallel server sets activity shown on the SQL Monitoring screen in Oracle Enterprise Manager
The third tab in the SQL Monitoring interface shows the activity for the statement over time in near real-time (see Figure 9 ). Use this information to identify at statement level what resources are used most intensely.
Oracle White Paper—Best Practices for a Data Warehouse on Oracle Exadata Database Machine
8
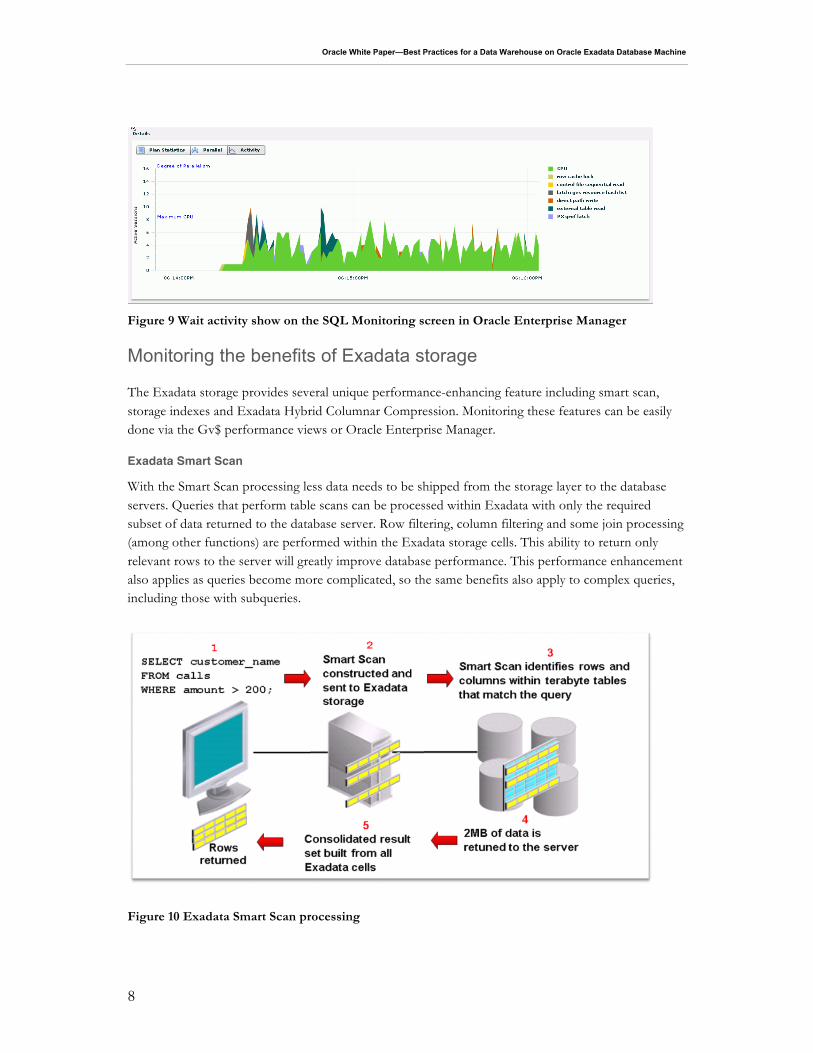
Figure 9 Wait activity show on the SQL Monitoring screen in Oracle Enterprise Manager
Monitoring the benefits of Exadata storage
The Exadata storage provides several unique performance-enhancing feature including smart scan, storage indexes and Exadata Hybrid Columnar Compression. Monitoring these features can be easily done via the Gv$ performance views or Oracle Enterprise Manager.
Exadata Smart Scan
With the Smart Scan processing less data needs to be shipped from the storage layer to the database servers. Queries that perform table scans can be processed within Exadata with only the required subset of data returned to the database server. Row filtering, column filtering and some join processing (among other functions) are performed within the Exadata storage cells. This ability to return only relevant rows to the server will greatly improve database performance. This performance enhancement also applies as queries become more complicated, so the same benefits also apply to complex queries, including those with subqueries.
Figure 10 Exadata Smart Scan processing
Oracle White Paper—Best Practices for a Data Warehouse on Oracle Exadata Database Machine
9
Figure 10 shows the different steps that happen during a smart scan:
1. The client issues a SELECT statement with a predicate to filter and return only rows of interest.
2. The database kernel determines that Exadata storage is available and constructs an iDB command representing the SQL command issued and sends it the Exadata storage.
3. The CELLSRV component of the Exadata software scans the data blocks to identify those rows and columns that satisfy the SQL issued. Only the rows satisfying the predicate and the requested columns are read into memory. The database kernel consolidates the result sets from across the Exadata cells.
4. Lastly, the rows are returned to the client.
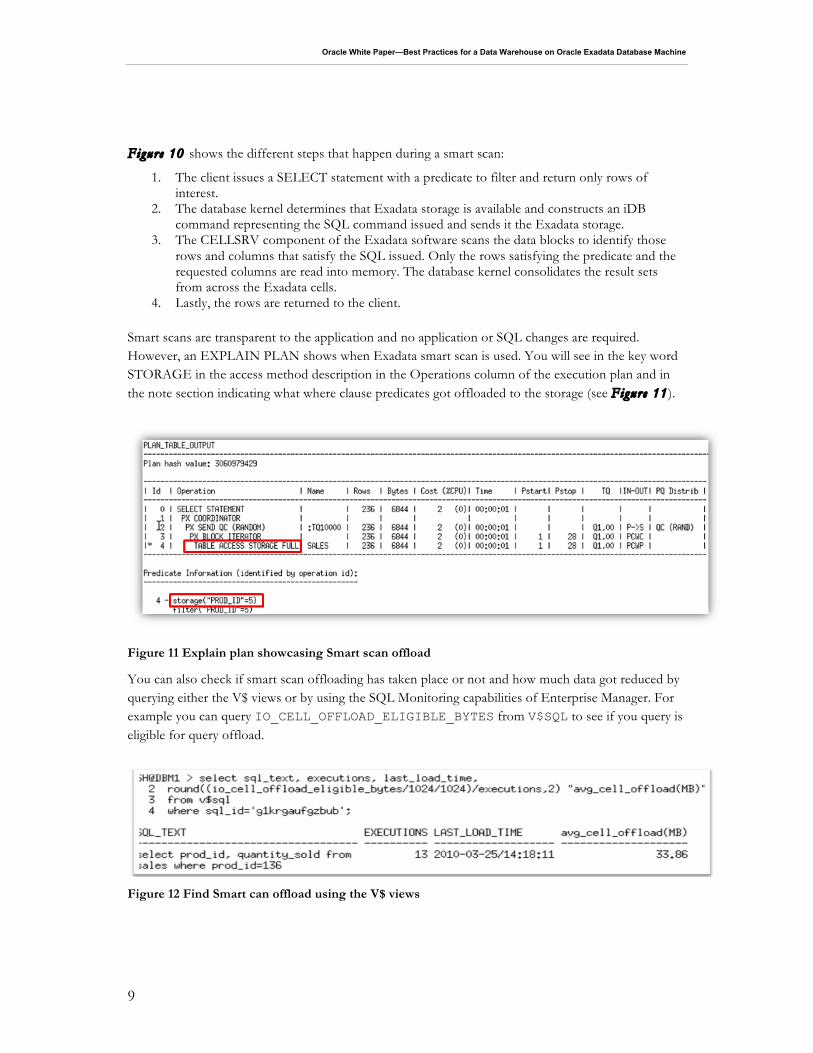
Smart scans are transparent to the application and no application or SQL changes are required. However, an EXPLAIN PLAN shows when Exadata smart scan is used. You will see in the key word STORAGE in the access method description in the Operations column of the execution plan and in the note section indicating what where clause predicates got offloaded to the storage (see Figure 11 ).
Figure 11 Explain plan showcasing Smart scan offload
You can also check if smart scan offloading has taken place or not and how much data got reduced by querying either the V$ views or by using the SQL Monitoring capabilities of Enterprise Manager. For example you can query IO_CELL_OFFLOAD_ELIGIBLE_BYTES from V$SQL to see if you query is eligible for query offload.
Figure 12 Find Smart can offload using the V$ views
Oracle White Paper—Best Practices for a Data Warehouse on Oracle Exadata Database Machine
10
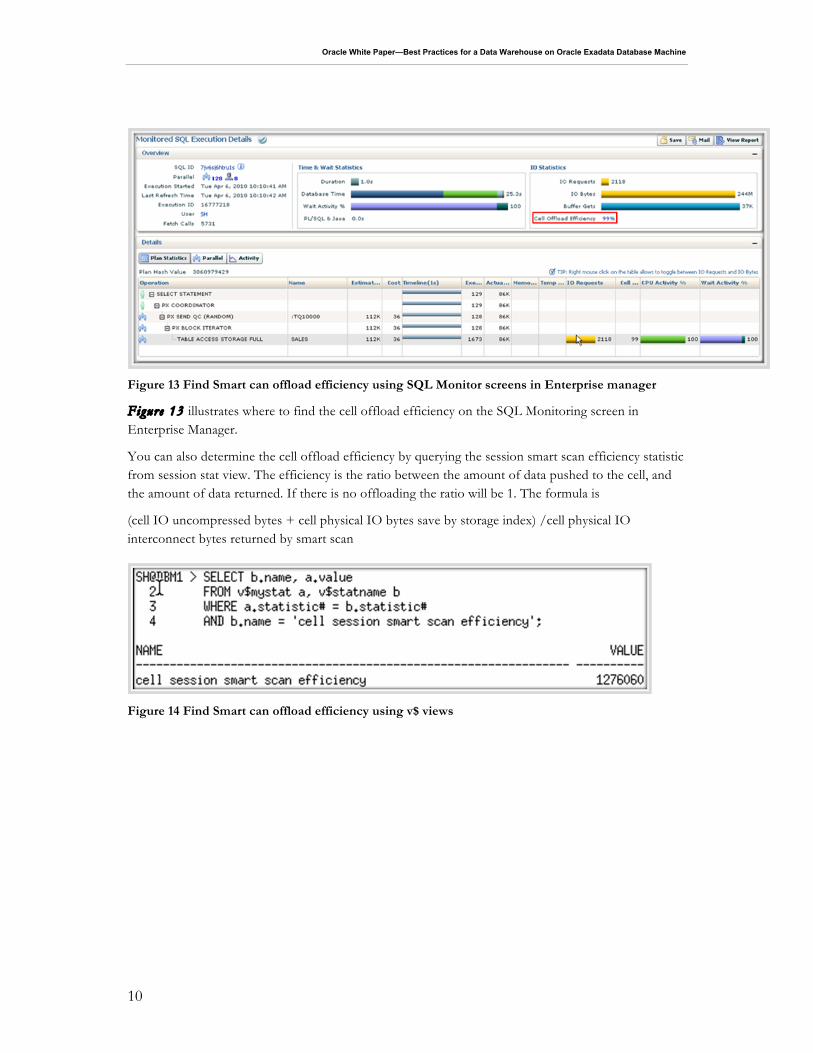
Figure 13 Find Smart can offload efficiency using SQL Monitor screens in Enterprise manager
Figure 13 illustrates where to find the cell offload efficiency on the SQL Monitoring screen in Enterprise Manager.
You can also determine the cell offload efficiency by querying the session smart scan efficiency statistic from session stat view. The efficiency is the ratio between the amount of data pushed to the cell, and the amount of data returned. If there is no offloading the ratio will be 1. The formula is
(cell IO uncompressed bytes + cell physical IO bytes save by storage index) /cell physical IO interconnect bytes returned by smart scan
Figure 14 Find Smart can offload efficiency using v$ views
Oracle White Paper—Best Practices for a Data Warehouse on Oracle Exadata Database Machine
11
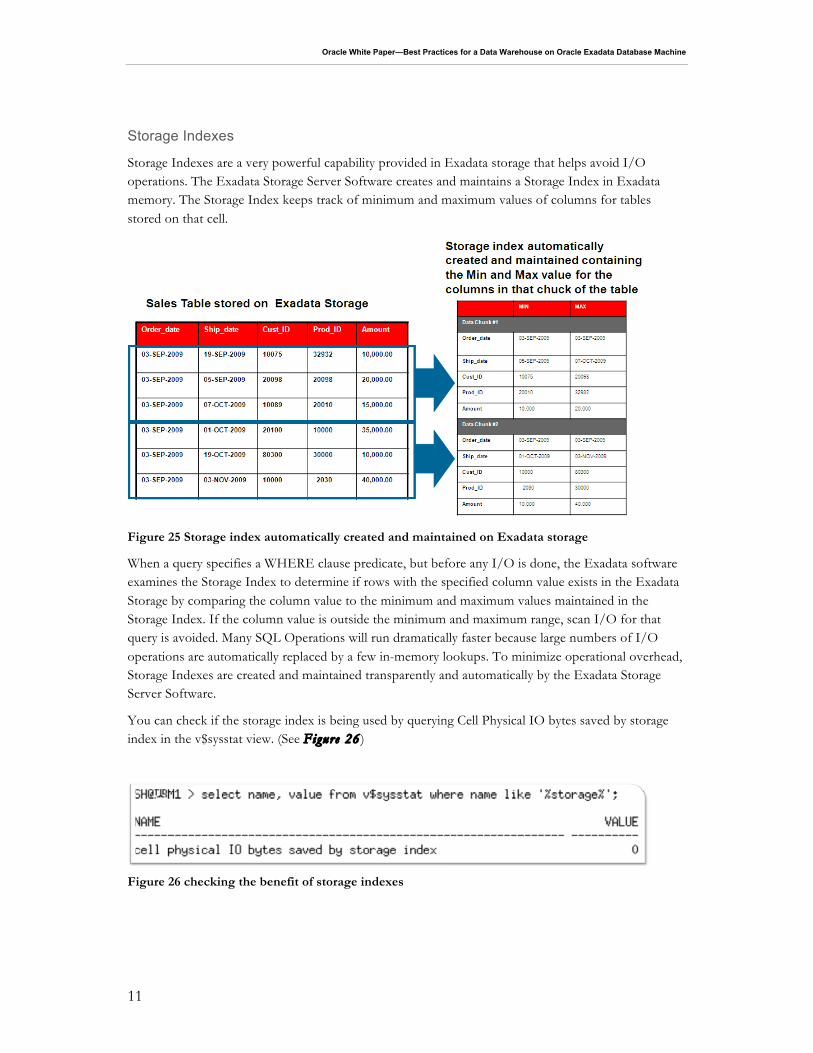
Storage Indexes
Storage Indexes are a very powerful capability provided in Exadata storage that helps avoid I/O operations. The Exadata Storage Server Software creates and maintains a Storage Index in Exadata memory. The Storage Index keeps track of minimum and maximum values of columns for tables stored on that cell.
Figure 25 Storage index automatically created and maintained on Exadata storage
When a query specifies a WHERE clause predicate, but before any I/O is done, the Exadata software examines the Storage Index to determine if rows with the specified column value exists in the Exadata Storage by comparing the column value to the minimum and maximum values maintained in the Storage Index. If the column value is outside the minimum and maximum range, scan I/O for that query is avoided. Many SQL Operations will run dramatically faster because large numbers of I/O operations are automatically replaced by a few in-memory lookups. To minimize operational overhead, Storage Indexes are created and maintained transparently and automatically by the Exadata Storage Server Software.
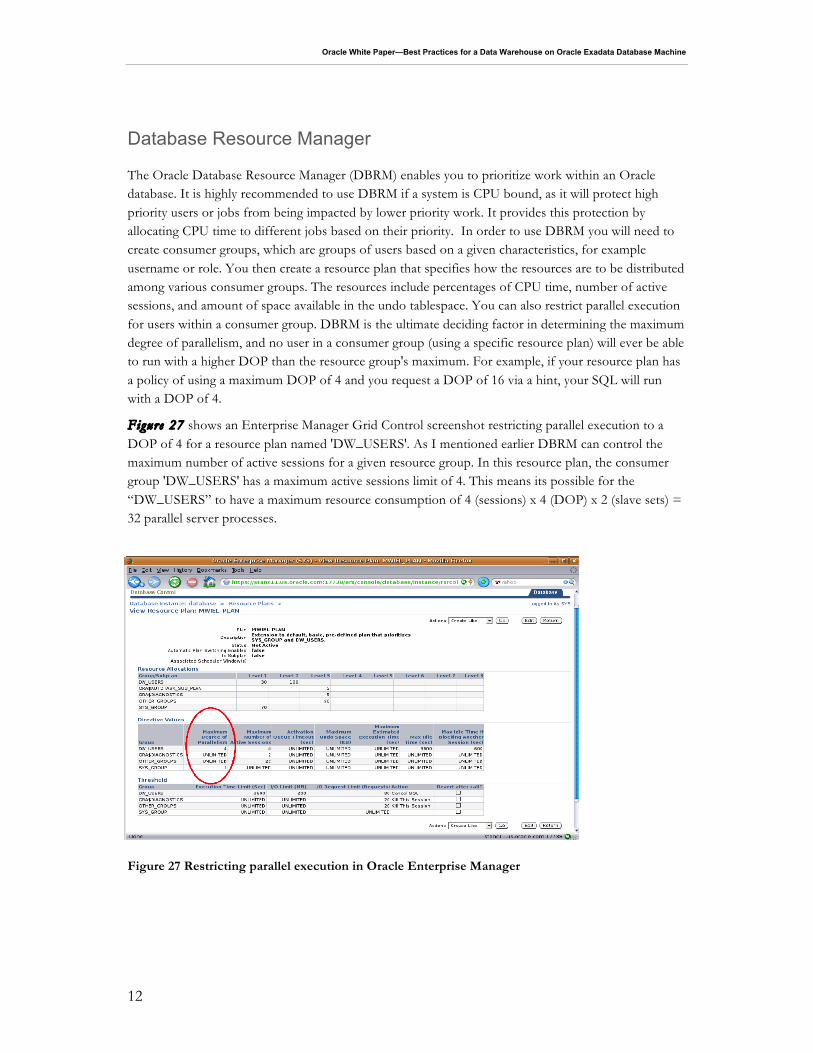
You can check if the storage index is being used by querying Cell Physical IO bytes saved by storage index in the v$sysstat view. (See Figure 26 )
Figure 26 checking the benefit of storage indexes
Oracle White Paper—Best Practices for a Data Warehouse on Oracle Exadata Database Machine
12
Database Resource Manager
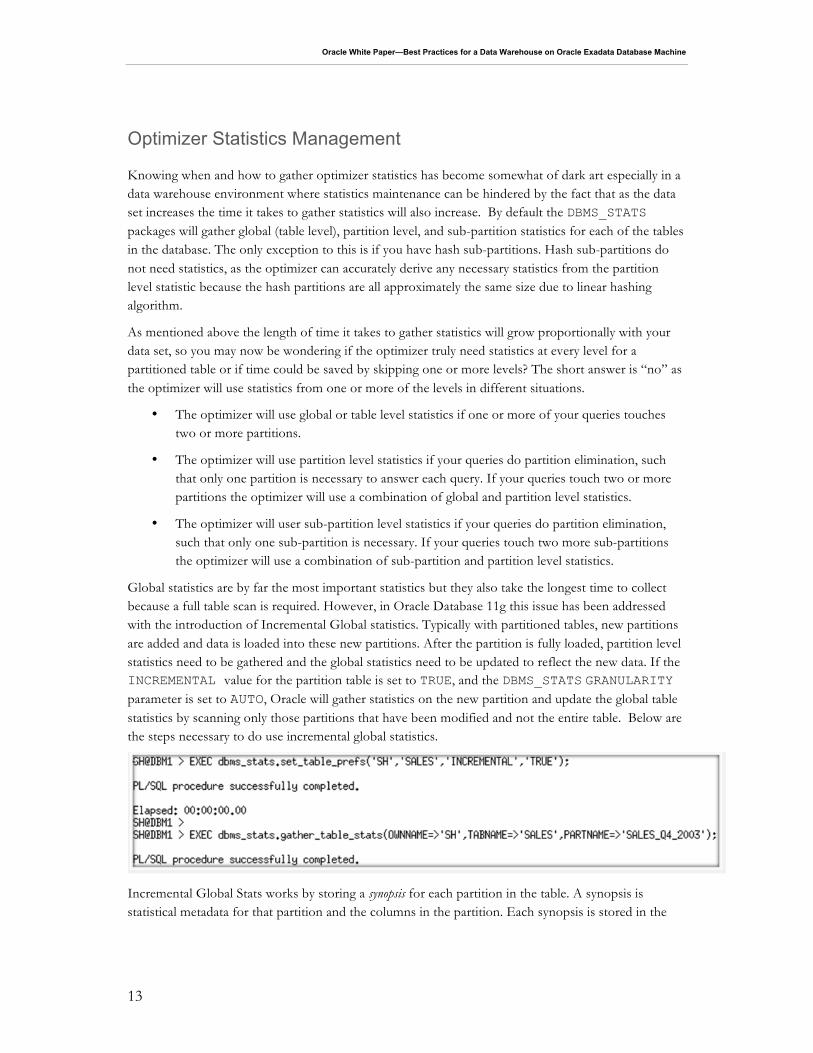
The Oracle Database Resource Manager (DBRM) enables you to prioritize work within an Oracle database. It is highly recommended to use DBRM if a system is CPU bound, as it will protect high priority users or jobs from being impacted by lower priority work. It provides this protection by allocating CPU time to different jobs based on their priority. In order to use DBRM you will need to create consumer groups, which are groups of users based on a given characteristics, for example username or role. You then create a resource plan that specifies how the resources are to be distributed among various consumer groups. The resources include percentages of CPU time, number of active sessions, and amount of space available in the undo tablespace. You can also restrict parallel execution for users within a consumer group. DBRM is the ultimate deciding factor in determining the maximum degree of parallelism, and no user in a consumer group (using a specific resource plan) will ever be able to run with a higher DOP than the resource group's maximum. For example, if your resource plan has a policy of using a maximum DOP of 4 and you request a DOP of 16 via a hint, your SQL will run with a DOP of 4.
Figure 27 shows an Enterprise Manager Grid Control screenshot restricting parallel execution to a DOP of 4 for a resource plan named 'DW_USERS'. As I mentioned earlier DBRM can control the maximum number of active sessions for a given resource group. In this resource plan, the consumer group 'DW_USERS' has a maximum active sessions limit of 4. This means its possible for the “DW_USERS” to have a maximum resource consumption of 4 (sessions) x 4 (DOP) x 2 (slave sets) = 32 parallel server processes.
Figure 27 Restricting parallel execution in Oracle Enterprise Manager
Oracle White Paper—Best Practices for a Data Warehouse on Oracle Exadata Database Machine
13
Optimizer Statistics Management
Knowing when and how to gather optimizer statistics has become somewhat of dark art especially in a data warehouse environment where statistics maintenance can be hindered by the fact that as the data set increases the time it takes to gather statistics will also increase. By default the DBMS_STATS packages will gather global (table level), partition level, and sub-partition statistics for each of the tables in the database. The only exception to this is if you have hash sub-partitions. Hash sub-partitions do not need statistics, as the optimizer can accurately derive any necessary statistics from the partition level statistic because the hash partitions are all approximately the same size due to linear hashing algorithm.
As mentioned above the length of time it takes to gather statistics will grow proportionally with your data set, so you may now be wondering if the optimizer truly need statistics at every level for a partitioned table or if time could be saved by skipping one or more levels? The short answer is “no” as the optimizer will use statistics from one or more of the levels in different situations.
• The optimizer will use global or table level statistics if one or more of your queries touches two or more partitions.
• The optimizer will use partition level statistics if your queries do partition elimination, such that only one partition is necessary to answer each query. If your queries touch two or more partitions the optimizer will use a combination of global and partition level statistics.
• The optimizer will user sub-partition level statistics if your queries do partition elimination, such that only one sub-partition is necessary. If your queries touch two more sub-partitions the optimizer will use a combination of sub-partition and partition level statistics.
Global statistics are by far the most important statistics but they also take the longest time to collect because a full table scan is required. However, in Oracle Database 11g this issue has been addressed with the introduction of Incremental Global statistics. Typically with partitioned tables, new partitions are added and data is loaded into these new partitions. After the partition is fully loaded, partition level statistics need to be gathered and the global statistics need to be updated to reflect the new data. If the INCREMENTAL value for the partition table is set to TRUE, and the DBMS_STATS GRANULARITY parameter is set to AUTO, Oracle will gather statistics on the new partition and update the global table statistics by scanning only those partitions that have been modified and not the entire table. Below are the steps necessary to do use incremental global statistics.
Incremental Global Stats works by storing a synopsis for each partition in the table. A synopsis is statistical metadata for that partition and the columns in the partition. Each synopsis is stored in the
Oracle White Paper—Best Practices for a Data Warehouse on Oracle Exadata Database Machine
14
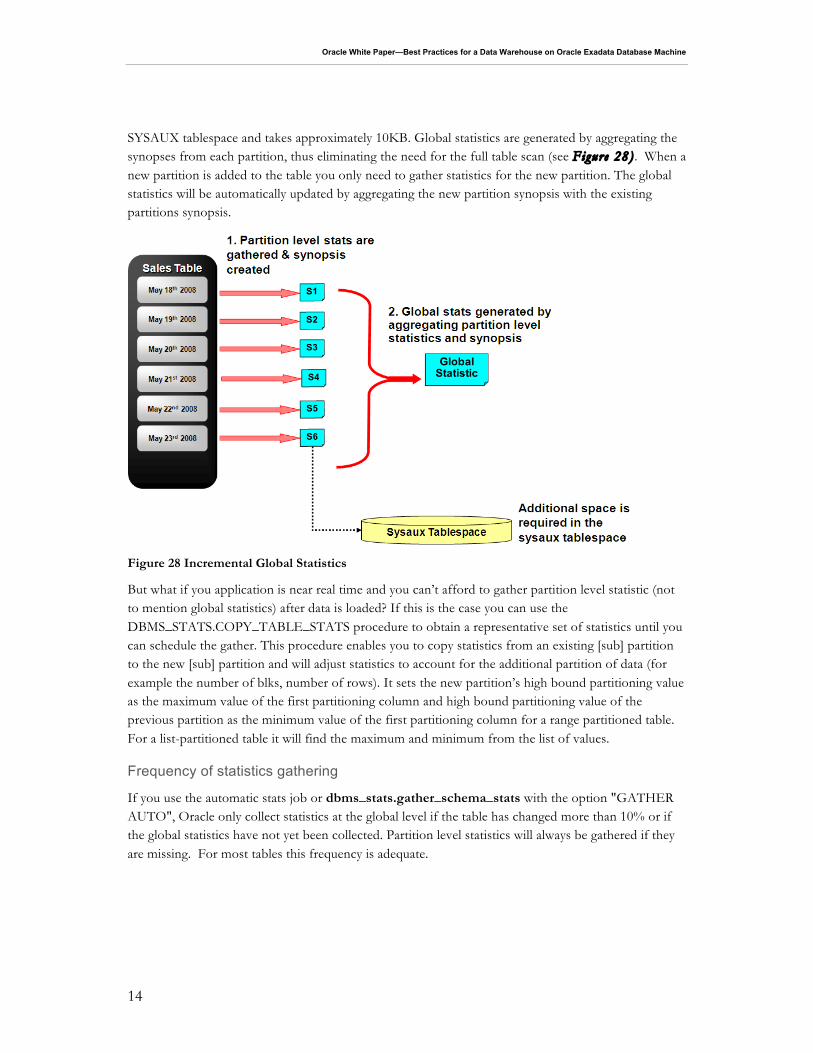
SYSAUX tablespace and takes approximately 10KB. Global statistics are generated by aggregating the synopses from each partition, thus eliminating the need for the full table scan (see Figure 28) . When a new partition is added to the table you only need to gather statistics for the new partition. The global statistics will be automatically updated by aggregating the new partition synopsis with the existing partitions synopsis.
Figure 28 Incremental Global Statistics
But what if you application is near real time and you can’t afford to gather partition level statistic (not to mention global statistics) after data is loaded? If this is the case you can use the DBMS_STATS.COPY_TABLE_STATS procedure to obtain a representative set of statistics until you can schedule the gather. This procedure enables you to copy statistics from an existing [sub] partition to the new [sub] partition and will adjust statistics to account for the additional partition of data (for example the number of blks, number of rows). It sets the new partition’s high bound partitioning value as the maximum value of the first partitioning column and high bound partitioning value of the previous partition as the minimum value of the first partitioning column for a range partitioned table. For a list-partitioned table it will find the maximum and minimum from the list of values.
Frequency of statistics gathering
If you use the automatic stats job or dbms_stats.gather_schema_stats with the option "GATHER AUTO", Oracle only collect statistics at the global level if the table has changed more than 10% or if the global statistics have not yet been collected. Partition level statistics will always be gathered if they are missing. For most tables this frequency is adequate.
Oracle White Paper—Best Practices for a Data Warehouse on Oracle Exadata Database Machine
15
Conclusion
In order to guarantee you will get the optimal performance from your data warehouse and to ensure it will scale as the data set increases you need to get three fundamental things correct:
• The hardware configuration. It must be balanced and must achieve the necessary IO throughput required to meet the systems peak load
• The data model. If it is a 3NF it should always achieve partition-wise joins or if it’s a Star Schema it should use star transformation
• The data loading process. It should be as fast as possible and have zero impact on the business user
By selecting the Oracle Exadata Database Machine you can ensure the hardware configuration will perform. Following the best practices for deploying a data warehouse as outlined in this paper will allow you to seamlessly scale out your EDW without having to constantly tune or tweak your system.
White Paper Title March 2014
Oracle Corporation World Headquarters 500 Oracle Parkway Redwood Shores, CA 94065 U.S.A.
Worldwide Inquiries: Phone: +1.650.506.7000 Fax: +1.650.506.7200
oracle.com
Copyright © 2014, Oracle and/or its affiliates. All rights reserved.
This document is provided for information purposes only, and the contents hereof are subject to change without notice. This document is not warranted to be error-free, nor subject to any other warranties or conditions, whether expressed orally or implied in law, including implied warranties and conditions of merchantability or fitness for a particular purpose. We specifically disclaim any liability with respect to this document, and no contractual obligations are formed either directly or indirectly by this document. This document may not be reproduced or transmitted in any form or by any means, electronic or mechanical, for any purpose, without our prior written permission.
Oracle and Java are registered trademarks of Oracle and/or its affiliates. Other names may be trademarks of their respective owners.
Intel and Intel Xeon are trademarks or registered trademarks of Intel Corporation. All SPARC trademarks are used under license and are trademarks or registered trademarks of SPARC International, Inc. AMD, Opteron, the AMD logo, and the AMD Opteron logo are trademarks or registered trademarks of Advanced Micro Devices. UNIX is a registered trademark of The Open Group. 0114