Embed Size (px)
Citation preview

SANDIA REPORT SAND2011-4108 Unlimited Release Printed June 2011
Best Practices for System Dynamics Model Design and
Construction with Powersim Studio Leonard A. Malczynski Prepared by Sandia National Laboratories Albuquerque, New Mexico 87185 and Livermore, California 94550 Sandia National Laboratories is a multi-program laboratory managed and operated by Sandia Corporation, a wholly owned subsidiary of Lockheed Martin Corporation, for the U.S. Department of Energy’s National Nuclear Security Administration under contract DE-AC04-94AL85000. Approved for public release; further dissemination unlimited.

Issued by Sandia National Laboratories, operated for the United States Department of Energy by Sandia Corporation.
NOTICE: This report was prepared as an account of work sponsored by an agency of the United States Government. Neither the United States Government, nor any agency thereof, nor any of their employees, nor any of their contractors, subcontractors, or their employees, make any warranty, express or implied, or assume any legal liability or responsibility for the accuracy, completeness, or usefulness of any information, apparatus, product, or process disclosed, or represent that its use would not infringe privately owned rights. Reference herein to any specific commercial product, process, or service by trade name, trademark, manufacturer, or otherwise, does not necessarily constitute or imply its endorsement, recommendation, or favoring by the United States Government, any agency thereof, or any of their contractors or subcontractors. The views and opinions expressed herein do not necessarily state or reflect those of the United States Government, any agency thereof, or any of their contractors.
Printed in the United States of America. This report has been reproduced directly from the best available copy.
Available to DOE and DOE contractors from
U.S. Department of Energy Office of Scientific and Technical Information P.O. Box 62 Oak Ridge, TN 37831
Telephone: (865) 576-8401 Facsimile: (865) 576-5728 E-Mail: [email protected] Online ordering: http://www.osti.gov/bridge
Available to the public from
U.S. Department of Commerce National Technical Information Service 5285 Port Royal Rd. Springfield, VA 22161 Telephone: (800) 553-6847 Facsimile: (703) 605-6900 E-Mail: [email protected] Online order: http://www.ntis.gov/help/ordermethods.aspx

SAND2011-4108 Unlimited Release Printed June 2011
Best Practices for System Dynamics Model Design and
Construction with Powersim Studio
Leonard A. Malczynski
Sandia National Laboratories P.O. Box 5800
Albuquerque, New Mexico 87185
Abstract
This guide addresses software quality in the construction of Powersim® Studio 81 system dynamics simulation models. It is the result of almost ten years of experience with the Powersim suite of system dynamics modeling tools (Constructor and earlier Studio versions). It is a guide that proposes a common look and feel for the construction of Powersim Studio system dynamics models.
1 Powersim is a registered trademark of Powersim Software AS.

Acknowledgements This booklet is the result of the alignment of several factors. They include my software engineering background, attempts by the staff at Sandia National Laboratories to perform a self examination of our model code, grassroots efforts by the modeling staff to improve model quality, and the chance to critically examine someone else‟s work. First, I would like to thank all my current and former colleagues at Sandia National Laboratories for their contributions to building better models in Powersim Studio. They have done some amazing work with a „system dynamics‟ software tool, extending it into the „extra-methodological‟ arena. As I was able to introduce new staff to Studio I learned more and more about it just to address their questions. Thanks to Dave Harris, Dick Thomas, Vince Tidwell, Jesse Roach, Jim Brainard, Howard Passell, Peter Kobos, Tom Drennen, Beth Richards, Tom Lowry, Marissa Reno, Will Peplinski, Garrett Barter, Katherine Dunphy Guzman, Dave Reichmuth, Robert Taylor, Jim Ellison, and Will Kamery. There were many students too, especially Carlos Aragon, Jesse Roach, La Tonya Walker, Cesar Castillo, and Zach Lott. Second, the colleagues of the powersimtools user group on Yahoo Groups. Amazing questions and amazing answers are the norm. I told one of the original members that the group was really a selfish act on my part to learn faster. Let‟s hope it works for all of us. Special thanks to Keith Linard, Alan McLucas, Bill Braun, Jake Jacobson, and Steinar Moen. Last but not least, Powersim Corporation AS for listening to praises, complaints, and suggestions. It has been a wonderful experience since 1992 working with you especially Knut Vavik, Arne Kråkenes, Steinar Moen, Bjørn Arild Baugstø, Hilde Martinussen, and Tone Haveland. We have had great expectations as modelers and have not been disappointed. Special thanks to those who contributed to the editing of this document, Bill Braun, Frederic Dromigny, George Papacristos, Hilde Martinussen and Howard Passell. Although many have contributed to the techniques in this guide all errors and omissions2 are mine.
2 I am always finding useful things that the Studio Interactive Development Environment (IDE) or „Workspace‟ can do. It also seems that I can never keep up with the new features, especially functions, which are added to new Studio Feature Packs and Service Releases. Experiment and enjoy!
If you would like to contribute ideas to this pamphlet please contact me at [email protected].
iv
Table of Contents
Table of Figures ....................................................................... 3
Philosophy ............................................................................... 1
Why ................................................................................................. 1
Precedent ........................................................................................ 1
Advantages ..................................................................................... 1
Color and Naming and Capitalization - Oh, My! ........................ 2
Naming Conventions ....................................................................... 2
Colors .............................................................................................. 2
Testing and temporary variables ..................................................... 3
Units ......................................................................................... 3
System Units ................................................................................... 4
Custom and Atomic Units ................................................................ 4
Arrays, Ranges and Range Names .......................................... 4
Advantages ..................................................................................... 7
Style ................................................................................................ 7
Pitfalls ............................................................................................. 7
Modularity or Partitioning: Art and Science ............................... 7
Coupling .......................................................................................... 7
Cohesion ......................................................................................... 8
Practical Issues ............................................................................... 9
Naming Constructor Diagrams ........................................................ 9
Data ......................................................................................... 9
Potential data problems ................................................................ 10
Coding Style ........................................................................... 10
Indent at Operators ....................................................................... 10
Indent at () ..................................................................................... 11
General code layout and indentation............................................. 11
Align Arrays ................................................................................... 11
Layout ........................................................................................... 12
Shortcut variables ......................................................................... 13
Documentation .............................................................................. 13
iv
Coding Pitfalls ........................................................................ 13
DIVZ0 ............................................................................................ 13
Equation complexity ...................................................................... 13
Techniques ............................................................................ 14
Getting started on a model ............................................................ 14
Data Considerations...................................................................... 14
Input ........................................................................................................ 14
Output ..................................................................................................... 14
Model naming ............................................................................... 14
Interface Design ..................................................................... 15
Source Code Analysis – What Can Be Done? ........................ 16
Are there undefined or problematic variables? .............................. 17
Does every variable have a well defined unit assigned to it? ........ 17
Does the model follow ‘standard’ naming conventions?................ 17
Does the model contain embedded constants? ............................ 18
Are stocks initialized internally with other than non-zero values? . 18
Are Links marked with # (indicating they are not used in the
variable they connect to) ............................................................... 18
Is every variable used by another variable? If not, why not? ......... 18
Do variables exist in the Equations View and not on any of the
model sheets? ............................................................................... 18
Units Checking .............................................................................. 18
Using the Find and Go to Variable Tools ...................................... 18
Automatic Errors and Warnings – Executable Code at Every
Stopping Point ............................................................................... 19
Checklists ...................................................................................... 20
Summary and Conclusion ...................................................... 22
Appendix A: Assigning Constructor Diagram Names (sheet names) to Variables ............................................................... 23
Appendix B: Creating ranges names from external data files . 24
Appendix C: Model Construction Checklist ............................. 26
Appendix D: Model Analysis Checklist ................................... 28
References ............................................................................. 30

iv
Table of Figures
Figure 1 Sample model color scheme ............................................................................................................................................................................. 3 Figure 2 Population model using an array ...................................................................................................................................................................... 5 Figure 3 Population model without an array .................................................................................................................................................................. 6 Figure 4 Model variable grouping .................................................................................................................................................................................... 8 Figure 5 Sample Studio icons ......................................................................................................................................................................................... 12 Figure 6 Duplication of DYNAMO-like output in Studio. Model based upon MIT D-Memo D-2843, Suggested Solution to
Modeling Assignment #4 (D-2824), Dynamics of Illegal Mexican Migration, Homayoon E. Dabiri, December 23, 1977 ............................................................................................................................................................................................................... 15
Figure 7 Liquid fuel supply chain demonstration. Provided by Robert Taylor of Sandia National Laboratories ................................................ 16 Figure 8 Carbon sequestration demonstration. Provided by Peter Kobos of Sandia National Laboratories ....................................................... 16 Figure 9 Studio Go To Variable window ...................................................................................................................................................................... 19 Figure 10 Studio Select Special window ........................................................................................................................................................................ 19 Figure 11 Modeler's Dilemma causal loop .................................................................................................................................................................... 22
B E S T P R A C T I C E S V O L U M E 1
1
Philosophy
wise person learns from the mistakes of others.”
“Any fool can write code that a computer can understand. Good programmers write code that humans can understand.” - Martin Fowler
Why
Many years of experience with Powersim tools such as Constructor and Studio have taught us that a bit of prevention is a great cure to model complexity. Some would say that a best practices guide just stifles creativity. We say that it liberates creativity in that it simplifies mundane modeling tasks, makes models3 done by other modelers more accessible, and prolongs the useful life of models. This best practices guide is a mixture of the pedagogic and the practical. We attempt to explain the why and the how, specifically in the context of Powersim Studio4. This work could turn into guidelines for simulation software engineering in general (please see References), it will not. These are techniques specific to Powersim Studio that may have their foundations in software engineering and the system dynamics methodology. This is not a substitute for the tremendous body of knowledge in those two fields.
The difficulty here is balancing prescriptive measures with the system dynamics methodology5 and mastery of Studio itself. Powersim Studio provides good tutorials on the latter. In addition the Powersim Tools User Group on Yahoo Groups6 has much sample code and training materials for beginners.
Precedent
Can you think of a well defined methodology that doesn‟t have a best practices guide? All of us are constantly made aware of „the right thing to do‟. These suggestions come from others who have tried again and again, made mistakes, and now want to pass their wisdom on to us. Of course it is a good thing to make mistakes (within some bounds) and learn from them. Here we can learn from the mistakes of others.
Advantages
Time savings, as simple as that.
3 Model, the word, can have many meanings. Here we mean the actual Studio *.sip file and all the variables in it. Adding an interface
to a model results in an application; model + interface = application. Here we are concerned only with models. A guide on application development is forthcoming.
4 A similar guide could be produced for Vensim or Stella or any other tool. 5 Studio has a good „Introduction to System Dynamics‟ as part of its Help system. 6 http://tech.groups.yahoo.com/group/powersimtools/
“A
2
Color and Naming and Capitalization - Oh, My!
“I found I could say things with color and shapes that I couldn't say any other way - things I had no words
for.” [Georgia O‟Keeffe, American painter]
Naming Conventions
Studio has the capability of permitting long variable names. In fact, several hundred characters are not a problem. These are the styles and recommendations for naming:
1. The names of variables should be clear and unambiguous7.
2. Resist using uncommon abbreviations, e.g. „fltp‟ when you mean „fuel type‟.
3. Use acronyms sparsely and only if they are generally accepted in your field, e.g. kWh instead
of kilowatt hours.
4. Resist using digits, e.g. 1, when you mean one. Occasionally digits can be used if your client
uses them to name objects, e.g. „Power plant 1‟.
5. Resist using special characters, e.g. !, #, $, &, ~, -.8
6. Constants should be in uppercase, e.g. INITIAL POPULATION.
7. Auxiliaries, including flow rates, should be lowercase, e.g. population growth rate.
8. Stocks should have the first letter of major words in uppercase, e.g. Corn Stock.
The benefits are in immediate recognition (even though Studio assigns a distinct icon to each variable type). This is even more beneficial when variables are exported from the Equations View to Microsoft Excel (2007). We will see below how the Studio icon face also adds clarification to a model. Many modelers adopt additional naming conventions, e.g. prefixes for interface variables or for special control variables. Studio 8 can now list the variable type of every equation in Equations View.
Your project can develop a standard for prefixes and suffixes on variable names. An example might be preceding all input variables with „INPUT‟ or all constants used as switches with „SWITCH‟. This document has no specified preference. Decide, document, and consistently implement a standard of your own.
Colors
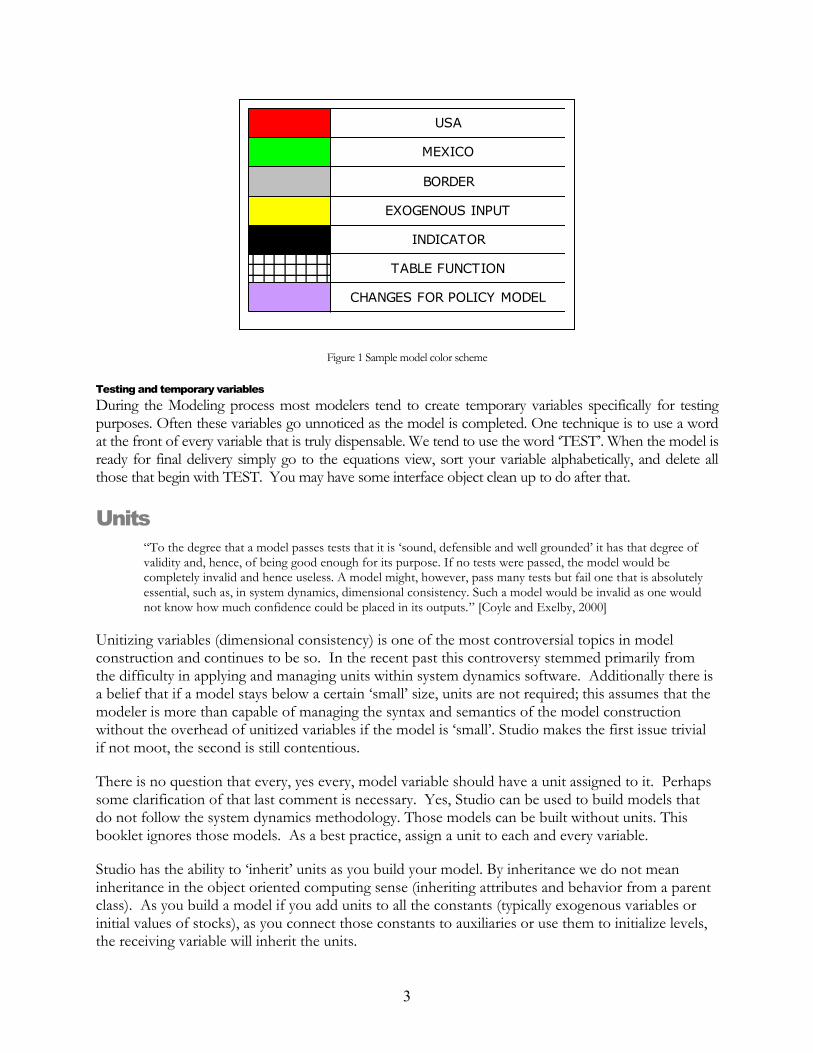
Colors are a personal or team preference. The use of color draws the eye to certain variables. It is best to set up a color scheme for you or your team, publish it and stick with it. You can include a table built using the Studio Table tool to show the colors and what they represent. Copy this table and place it in the same spot, e.g. upper left corner, of every Constructor Diagram aka sheet. Avoid hiding detail that will occur when coloring objects the same color as the Constructor diagram background. Also avoid adding color to model elements to make them „look pretty‟. Have a purpose for color.
7 Gone are the days of DYNAMO when names were constrained to be 4-6 characters long. 8 These characters can be used in names but may cause confusion in equations especially if exporting equations to Microsoft Excel
(2007).
3
Figure 1 Sample model color scheme
Testing and temporary variables
During the Modeling process most modelers tend to create temporary variables specifically for testing purposes. Often these variables go unnoticed as the model is completed. One technique is to use a word at the front of every variable that is truly dispensable. We tend to use the word „TEST‟. When the model is ready for final delivery simply go to the equations view, sort your variable alphabetically, and delete all those that begin with TEST. You may have some interface object clean up to do after that.
Units
“To the degree that a model passes tests that it is „sound, defensible and well grounded‟ it has that degree of validity and, hence, of being good enough for its purpose. If no tests were passed, the model would be completely invalid and hence useless. A model might, however, pass many tests but fail one that is absolutely essential, such as, in system dynamics, dimensional consistency. Such a model would be invalid as one would not know how much confidence could be placed in its outputs.” [Coyle and Exelby, 2000]
Unitizing variables (dimensional consistency) is one of the most controversial topics in model construction and continues to be so. In the recent past this controversy stemmed primarily from the difficulty in applying and managing units within system dynamics software. Additionally there is a belief that if a model stays below a certain „small‟ size, units are not required; this assumes that the modeler is more than capable of managing the syntax and semantics of the model construction without the overhead of unitized variables if the model is „small‟. Studio makes the first issue trivial if not moot, the second is still contentious.
There is no question that every, yes every, model variable should have a unit assigned to it. Perhaps some clarification of that last comment is necessary. Yes, Studio can be used to build models that do not follow the system dynamics methodology. Those models can be built without units. This booklet ignores those models. As a best practice, assign a unit to each and every variable.
Studio has the ability to „inherit‟ units as you build your model. By inheritance we do not mean inheritance in the object oriented computing sense (inheriting attributes and behavior from a parent class). As you build a model if you add units to all the constants (typically exogenous variables or initial values of stocks), as you connect those constants to auxiliaries or use them to initialize levels, the receiving variable will inherit the units.
USA
MEXICO
BORDER
EXOGENOUS INPUT
INDICATOR
TABLE FUNCTION
CHANGES FOR POLICY MODEL
4
Finally, one of the easiest objective tests for model quality is to open the Equations View and check that all variables have an assigned unit. If we build with the thought that we build for posterity then why not include units? From our experience, one of the first things a reviewer will look for, if given access to the model code, is unitization of variables. As Coyle and Exelby state, failing that test only weakens confidence in the model.
System Units
One of the first steps in starting a model in Studio (in addition to choosing the time unit, run length and integration method) is to define the units to be used. Studio will recognize new units as you attempt to add them to your variables. Nevertheless, we recommend that you add all the system units to your model. In this way you will be less likely to make mistakes when adding custom units.
Another way to accomplish this is to develop an empty model template that only contains the units your modeling team, or perhaps you alone, typically use. Save this „model‟ as your template and start each new project by opening the template and immediately saving it with the name of your new model. 9
Custom and Atomic Units
The built-in standard units will probably not suffice for most of your models. You will need to create custom and atomic units.
Atomic units are used to represent things or events and not measures. For example, many models have a unit <<person, persons>> or perhaps <<plant, plants>>10.
Custom units are aggregations of built-in standard units or modifications of built-in standard units. If using an English measurement system the unit <<foot>> can be defined as a function of the built-in standard unit <<meter>>. Always make sure that you have examined the built-in standard units before creating a custom unit. Many custom units can be simple aggregations of built-in standard units such as <<km>> being defined as 1000 * m where <<m>> is the built-in standard unit for meter. When group model constructing having different definitions for the same unit can cause serious problems and rework.
One unit that raises some controversy is <<dimensionless>>. When a ratio is calculated in a model the units cancel and you seem to have a unit-less variable. Historically DYNAMO used the <<dmnl>> unit to indicate the unit on these variables. Some modelers also use <<fraction>>. Then there are constants that serve as switches for an interface, since all variables must be assigned units we create a custom unit <<dimensionless>> and define it as the integer 1.11
Arrays, Ranges and Range Names
“The beginning of wisdom is to call things by the right names.” [Chinese proverb] “If I could remember the names of all these particles, I‟d be a botanist.” [Enrico Fermi]
9 You might want to include Best Practices checklists as sheets in the template.
10 We typically use lowercase words for units. The exceptions are commonly used acronyms or scientific notation, e.g. kWh and proper nouns. 11 Note that this is not a substitute for the percent unit, %.
5
As models become more and more complex they typically require the use of arrays. The alternative to an array is to duplicate or copy variables then rename them as required. This method can get unwieldy as the number of copies increases. First of all this adds more variables to the model increasing detail at the cost of confusing dynamics. Second, this method uses more screen space making models more difficult to understand. Third, any changes to logic will have to carefully be made to all copies of the duplicated code. Understanding and using arrays is unfortunately not trivial. Nevertheless, once understood, arrays will improve the quality and flexibility of your models.
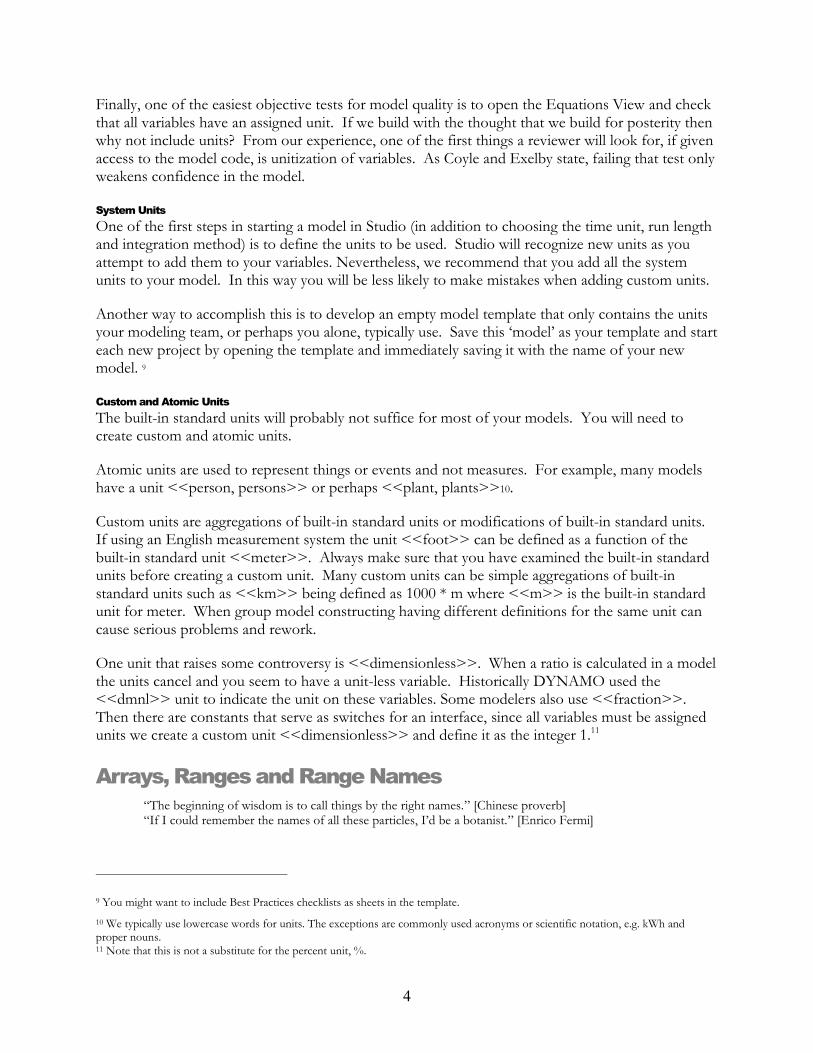
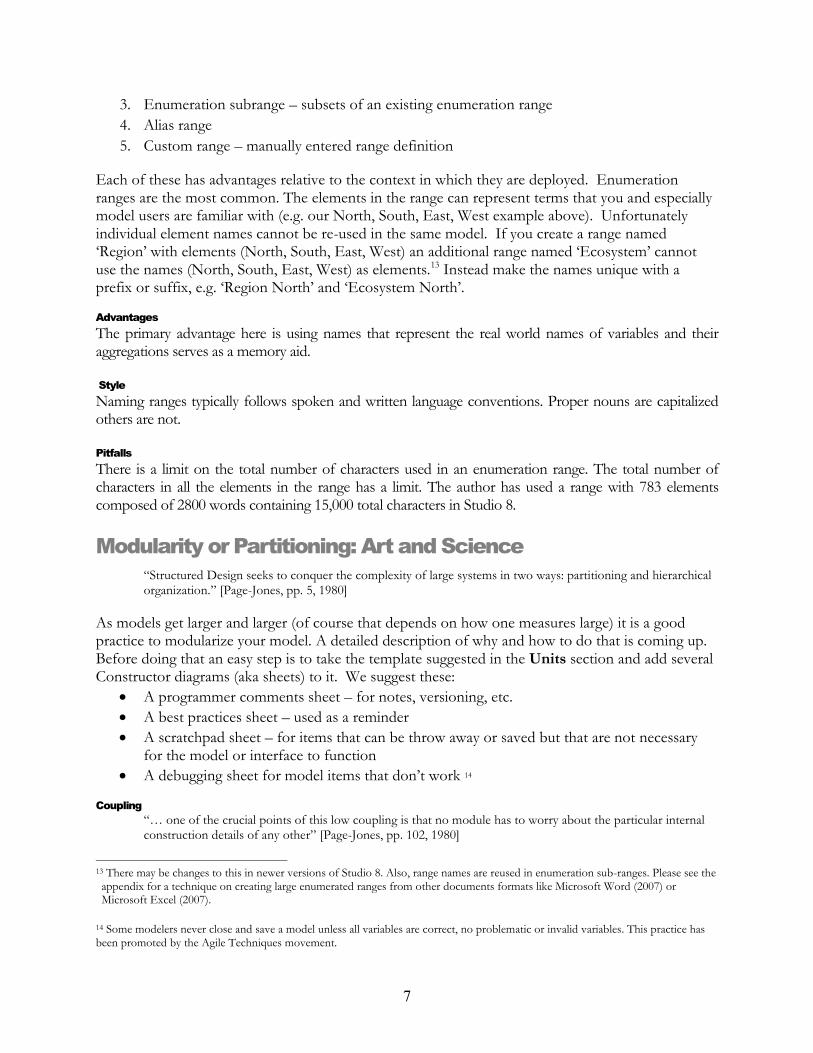
Arrays permit the modeler to mask detail not dynamics. The detail typically involves repeating logic for a set of similar stocks, flow rates, constants, or auxiliaries. Using arrays permits the modeler to collapse the detail. An example might be a population model. Assume that you have four independent regions12, North, East, South, and West. Figure 1 shows this model with arrays.
Figure 2 Population model using an array
The equations from the Equations View are shown in Table 1.
Name Dimensions Unit Definition
POPULATION GROWTH RATE Region %/yr {1, 2, 1.5, 1.8}<<%/yr>>
INITIAL POPULATION Region person {1000, 2000, 1500, 2500}<<person>>
Population Region person 'INITIAL POPULATION'
population growth Region person/yr ‘POPULATION GROWTH RATE’ * population
Table 1. Equations from arrayed population model
12 This example shows independent regions. Regions can be made to interact. The interaction can be accomplished with the use of arrays. I will leave that for another best practices booklet.
Population
INITIALPOPULATION
POPULATIONGROWTH RATE
population growth
6
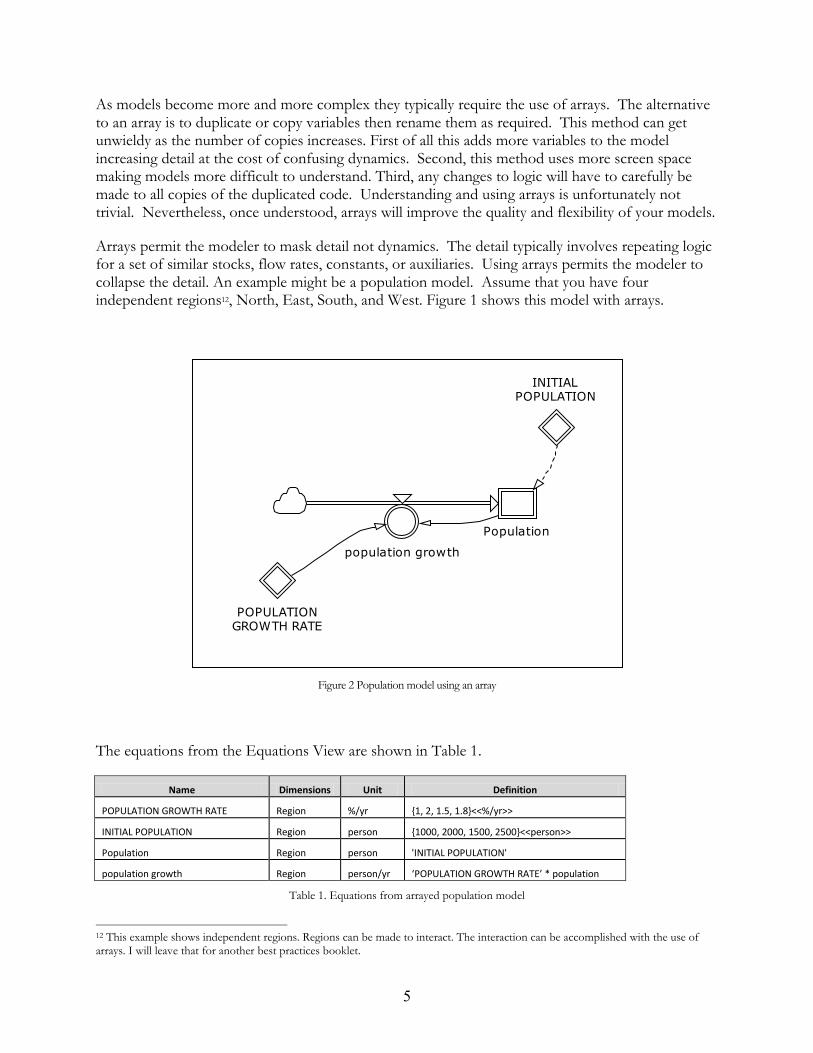
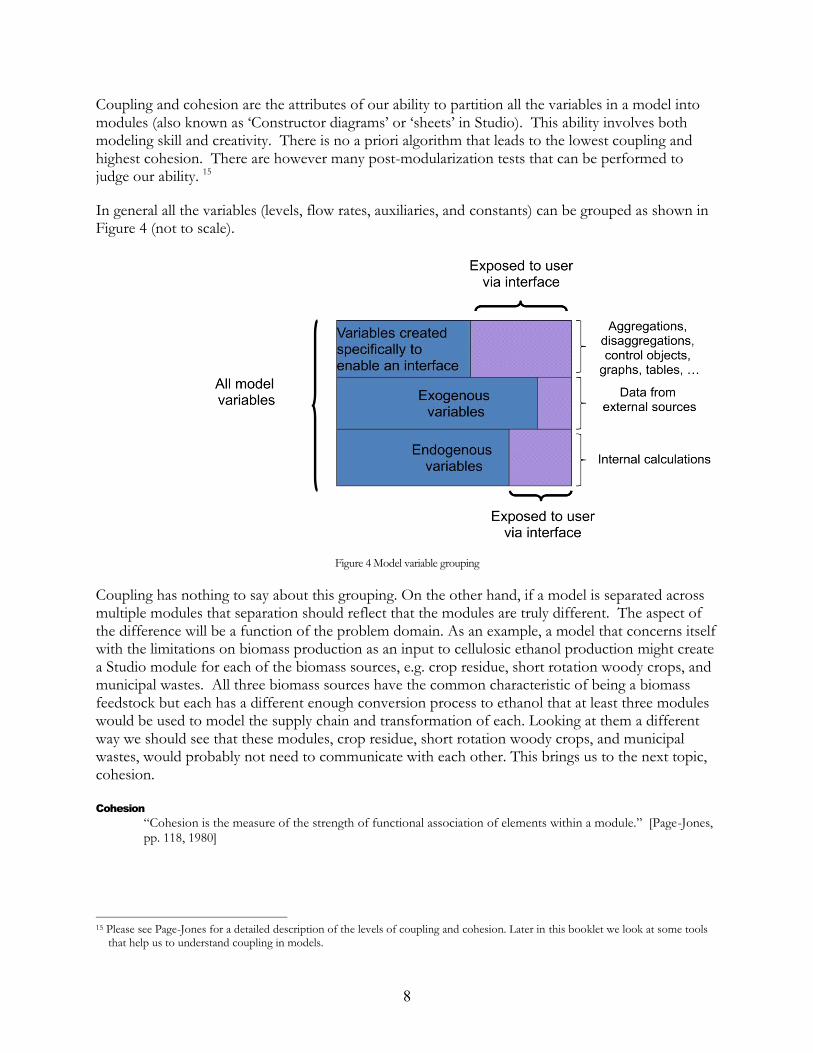
Figure 3 shows the same model without arrays. A general „rule-of-thumb‟ is to use Ranges and arrayed variables when there are three or more copies of the same construct in a model.
Figure 3 Population model without an array
Ranges are the predefined and named elements to be used in an array. Studio permits several types of ranges:
1. Numerical subrange – an continuous set of integer entries
2. Enumeration range – named set of entries
INITIALPOPULATION NORTH
INITIALPOPULATION SOUTH
INITIALPOPULATION EAST
INITIALPOPULATION WEST
Population North
Population South
Population East
Population West
POPULATIONGROWTH RATE
NORTH
POPULATIONGROWTH RATE
SOUTH
POPULATIONGROWTH RATE EAST
POPULATIONGROWTH RATE
WEST
population growthnorth
population growthsouth
population growtheast
population growthwest
7
3. Enumeration subrange – subsets of an existing enumeration range
4. Alias range
5. Custom range – manually entered range definition
Each of these has advantages relative to the context in which they are deployed. Enumeration ranges are the most common. The elements in the range can represent terms that you and especially model users are familiar with (e.g. our North, South, East, West example above). Unfortunately individual element names cannot be re-used in the same model. If you create a range named „Region‟ with elements (North, South, East, West) an additional range named „Ecosystem‟ cannot use the names (North, South, East, West) as elements.13 Instead make the names unique with a prefix or suffix, e.g. „Region North‟ and „Ecosystem North‟.
Advantages
The primary advantage here is using names that represent the real world names of variables and their aggregations serves as a memory aid.
Style
Naming ranges typically follows spoken and written language conventions. Proper nouns are capitalized others are not.
Pitfalls
There is a limit on the total number of characters used in an enumeration range. The total number of characters in all the elements in the range has a limit. The author has used a range with 783 elements composed of 2800 words containing 15,000 total characters in Studio 8.
Modularity or Partitioning: Art and Science
“Structured Design seeks to conquer the complexity of large systems in two ways: partitioning and hierarchical organization.” [Page-Jones, pp. 5, 1980]
As models get larger and larger (of course that depends on how one measures large) it is a good practice to modularize your model. A detailed description of why and how to do that is coming up. Before doing that an easy step is to take the template suggested in the Units section and add several Constructor diagrams (aka sheets) to it. We suggest these:
A programmer comments sheet – for notes, versioning, etc.
A best practices sheet – used as a reminder
A scratchpad sheet – for items that can be throw away or saved but that are not necessary for the model or interface to function
A debugging sheet for model items that don‟t work 14
Coupling
“… one of the crucial points of this low coupling is that no module has to worry about the particular internal construction details of any other” [Page-Jones, pp. 102, 1980]
13 There may be changes to this in newer versions of Studio 8. Also, range names are reused in enumeration sub-ranges. Please see the appendix for a technique on creating large enumerated ranges from other documents formats like Microsoft Word (2007) or Microsoft Excel (2007).
14 Some modelers never close and save a model unless all variables are correct, no problematic or invalid variables. This practice has been promoted by the Agile Techniques movement.
8
Coupling and cohesion are the attributes of our ability to partition all the variables in a model into modules (also known as „Constructor diagrams‟ or „sheets‟ in Studio). This ability involves both modeling skill and creativity. There is no a priori algorithm that leads to the lowest coupling and highest cohesion. There are however many post-modularization tests that can be performed to judge our ability. 15
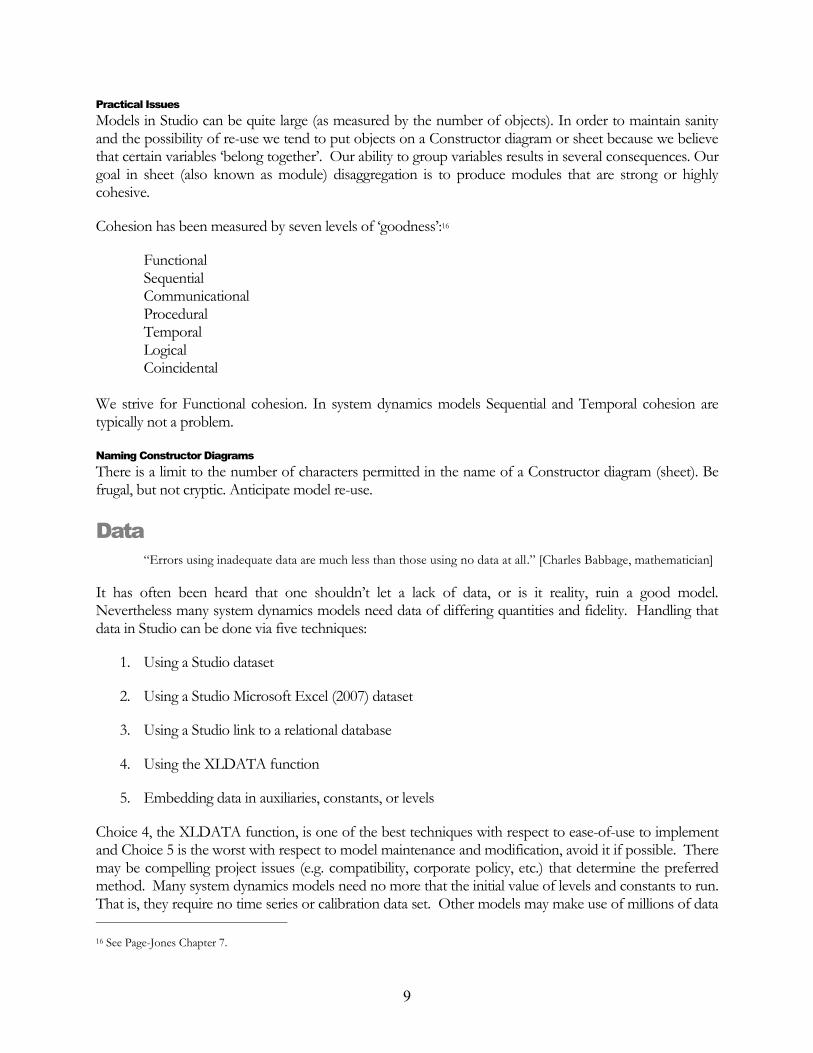
In general all the variables (levels, flow rates, auxiliaries, and constants) can be grouped as shown in Figure 4 (not to scale).
Figure 4 Model variable grouping
Coupling has nothing to say about this grouping. On the other hand, if a model is separated across multiple modules that separation should reflect that the modules are truly different. The aspect of the difference will be a function of the problem domain. As an example, a model that concerns itself with the limitations on biomass production as an input to cellulosic ethanol production might create a Studio module for each of the biomass sources, e.g. crop residue, short rotation woody crops, and municipal wastes. All three biomass sources have the common characteristic of being a biomass feedstock but each has a different enough conversion process to ethanol that at least three modules would be used to model the supply chain and transformation of each. Looking at them a different way we should see that these modules, crop residue, short rotation woody crops, and municipal wastes, would probably not need to communicate with each other. This brings us to the next topic, cohesion.
Cohesion
“Cohesion is the measure of the strength of functional association of elements within a module.” [Page-Jones, pp. 118, 1980]
15 Please see Page-Jones for a detailed description of the levels of coupling and cohesion. Later in this booklet we look at some tools
that help us to understand coupling in models.
9
Practical Issues
Models in Studio can be quite large (as measured by the number of objects). In order to maintain sanity and the possibility of re-use we tend to put objects on a Constructor diagram or sheet because we believe that certain variables „belong together‟. Our ability to group variables results in several consequences. Our goal in sheet (also known as module) disaggregation is to produce modules that are strong or highly cohesive.
Cohesion has been measured by seven levels of „goodness‟:16
Functional Sequential Communicational Procedural Temporal Logical Coincidental We strive for Functional cohesion. In system dynamics models Sequential and Temporal cohesion are typically not a problem.
Naming Constructor Diagrams
There is a limit to the number of characters permitted in the name of a Constructor diagram (sheet). Be frugal, but not cryptic. Anticipate model re-use.
Data
“Errors using inadequate data are much less than those using no data at all.” [Charles Babbage, mathematician]
It has often been heard that one shouldn‟t let a lack of data, or is it reality, ruin a good model. Nevertheless many system dynamics models need data of differing quantities and fidelity. Handling that data in Studio can be done via five techniques:
1. Using a Studio dataset
2. Using a Studio Microsoft Excel (2007) dataset
3. Using a Studio link to a relational database
4. Using the XLDATA function
5. Embedding data in auxiliaries, constants, or levels
Choice 4, the XLDATA function, is one of the best techniques with respect to ease-of-use to implement and Choice 5 is the worst with respect to model maintenance and modification, avoid it if possible. There may be compelling project issues (e.g. compatibility, corporate policy, etc.) that determine the preferred method. Many system dynamics models need no more that the initial value of levels and constants to run. That is, they require no time series or calibration data set. Other models may make use of millions of data
16 See Page-Jones Chapter 7.
10
values in order to represent their problem in a model. This is true when enabling multiple scenarios, when loading complex sets of constraints, and when matching historic trends in a data series.
Potential data problems
1. Source data format – We have found it best to maintain data in the source data format if at all possible. Yes, institutions may change their published formats but the less the data is manipulated by the modeler prior to including it in a model the better. This is especially important when performing unit conversions. Let Studio perform those in the model. Keeping data in the original formats may permit addition to the bottom of time series when newer data is available.
2. Ease of management – Data management is non-trivial as data sets become larger and larger. When using Microsoft Excel (2007) as a data store putting data on separate tabs is the logical way to manage it. We have also stored data in a relational database in order to manage data relationships and redundancy. Queries are then written to produce the file required which is then exported to Microsoft Excel (2007). Don‟t forget to keep potential problem (1) in mind.
3. Ease of discovering hidden values – Model transparency is one goal, especially when involving stakeholders. Embedding a value, even if it is a constant, in an object definition may make it hard to find. It is extremely difficult to find constants embedded in object definitions if the definition contains more than just a numeric value, i.e. it contains a formula.
Coding Style
“A coding style specifies things like how you indent, tabs vs. spaces, use of "reverse-Hungarian" notation for naming of variables, etc. A coding standard often includes a coding style, but goes beyond just how to name a variable: it tells you how that variable should be treated and when it should (and should not be) used.” [http://www.perlmonks.org/?node_id=744932]
Indent at Operators
The programming literature and the majority of programming style guides and programming languages have suggested rules for indentation. The point is to use indentation to make code clear. Let‟s look at this example.
Example 1 FOR(i='Sun hour band'|IF('Open Pond Plants Under Construction'[i]=0<<plant>>, 'Open Pond Nameplate Capacity in Construction'[i]/1<<plant>>, 'Open Pond Nameplate Capacity in Construction'[i]/'Open Pond Plants Under Construction'[i]))
Example 2 FOR(i='Sun hour band'| IF('Open Pond Plants Under Construction'[i]=0<<plant>>, 'Open Pond Nameplate Capacity in Construction'[i], 'Open Pond Nameplate Capacity in Construction'[i]/'Open Pond Plants Under Construction'[i] ) )
11
Example 2 is easier to read and is the standard. Studio has the wonderful capacity to highlight opening and closing parentheses as your cursor moves through the code. This makes indentation even more valuable. Nested „IF statements‟ can be particularly difficult to understand. Indenting at parentheses makes re-use and modification much easier. There are processing speed issues with nested IF statements that will be addressed in another Best Practices Guide. Example 3 – complex nested IF statements IF('CF 20'=1, 'Graph Coal Prod', IF('CF 40'=2, 'Graph Coal Prod', IF('CF 60'=3, 'Graph Coal Prod', IF('CF 80'=4, 'Graph Coal Prod', IF('CF 90'=5, 'Graph Coal Prod', IF(CF=6, 'Graph Coal Prod', IF('Default CF'=7, 'Coal production cost', 'Coal production cost'))))))) Example 4 Clear nested IF statements IF('CF 20'=1, 'Graph Coal Prod', IF('CF 40'=2, 'Graph Coal Prod', IF('CF 60'=3, 'Graph Coal Prod', IF('CF 80'=4, 'Graph Coal Prod', IF('CF 90'=5, 'Graph Coal Prod', IF(CF=6, 'Graph Coal Prod', IF('Default CF'=7, 'Coal production cost', 'Coal production cost'))))))) Indent at ()
As seen in Example 2, indent at parentheses. Closing parentheses below opening parentheses is the standard. Studio will „bold‟ the matching opening and closing parentheses making code easier to understand as it is written.
General code layout and indentation
The two suggestions on indentation above do not mention indentation for simple code. Here are some suggestions:
1. Leave no blank lines at the top of the definition box. Blank lines will play havoc during Find and
Replace and when exporting equations to Microsoft Excel (2007).
2. Do not make the first line of a definition a comment, i.e. do not start a definition with //. If you
want to embed comments, place them below the first line of the definition.
3. Do not leave commented, unused (i.e. old) code at the top of the definition. Put in at the
bottom of the definition.
Align Arrays
Here is another example.
12
Example 5 {4,5,2,3,1,9,8,7,0} Example 6 { 4, 5, 2, 3, 1, 9, 8, 7, 0 } Example 6 may seem to use excessive carriage returns but using the style in Example 6 you could add a comment to the end of each line, e.g. „9, // highest value‟. This is a trivial example for an array. Some arrays have elements that are themselves composed of functions and equations. Aligning them vertically helps tremendously in model maintenance. There is no well defined standard here. Multidimensional arrays benefit from the style in example 6. The standard is clarity. Layout
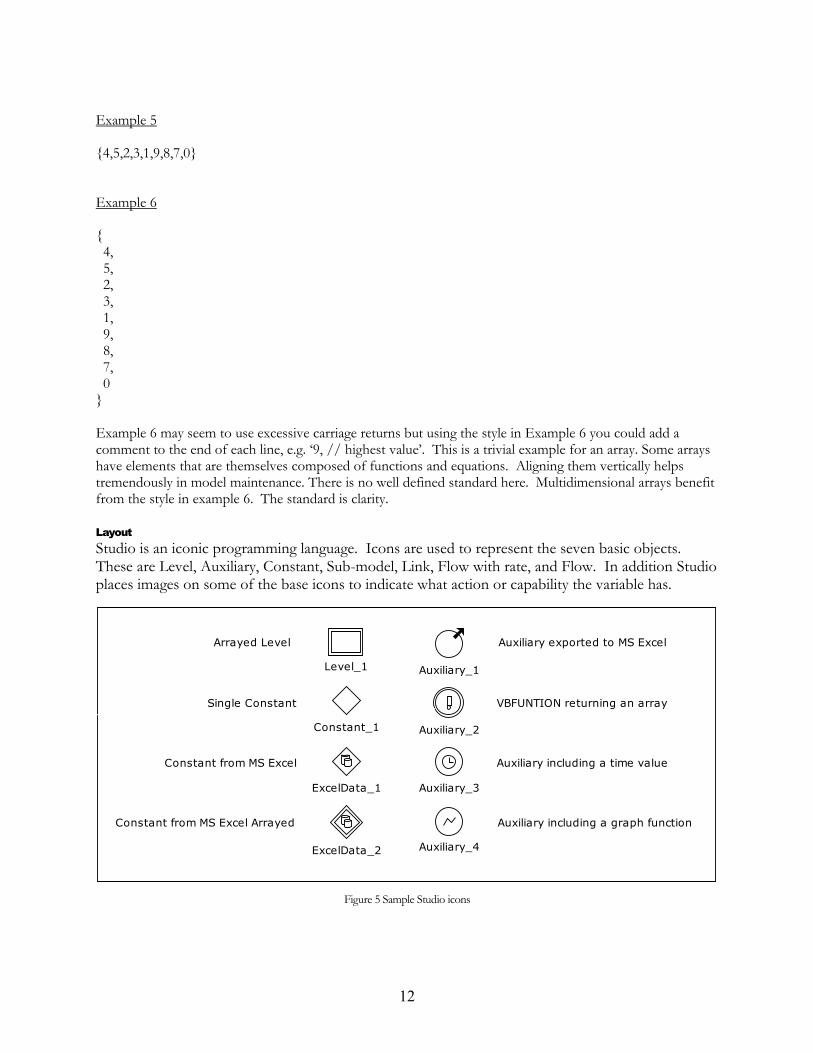
Studio is an iconic programming language. Icons are used to represent the seven basic objects. These are Level, Auxiliary, Constant, Sub-model, Link, Flow with rate, and Flow. In addition Studio places images on some of the base icons to indicate what action or capability the variable has.
Figure 5 Sample Studio icons
Arrayed Level
Single Constant
Auxiliary exported to MS Excel
Constant from MS Excel Arrayed
VBFUNTION returning an array
Constant from MS Excel Auxiliary including a time value
Auxiliary including a graph function
Level_1 Auxiliary_1
Constant_1 Auxiliary_2
ExcelData_1
ExcelData_2
Auxiliary_3
Auxiliary_4
13
An iconic programming language has an additional layer of information, the layout of the icons themselves, this is in addition to the code, contained within the icon, which defines it. Studio adds more information to the icons besides the traditional level, auxiliary and flow rate icons. Some of these additions can be seen in Figure 5. Briefly:
1. A „diamond‟ shape to indicate a constant
2. A „double walled‟ icon to indicate an arrayed variable
3. A „clock face‟ to indicate that a TIME function is part of the variable definition
4. An „exclamation point‟ to indicate VBFUNCTION() use
5. A „line graph‟ to indicate the use of a GRAPH() function
6. A „cylinder‟ to indicate an XLDATA() connection
7. An outgoing or incoming arrow to indicate export/import of data
The layout of Studio the objects on a Constructor diagram (sheet) does as much for model documentation as any other technique (e.g. text documentation, color, indentation, etc.). Good layout is the minimum set of documentation. Shortcut variables
Shortcuts are like copies of variables. The only purpose they serve is to improve the layout of the diagram. This is a simple as saying, make your diagrams clear.
Documentation
The Studio Definition window has locations for both Documentation and Notes. In addition it is possible to add in-line documentation in the definition window. My recommendations are:
1. Use as little in-line documentation as possible. Use it only to describe logic. Never make it the first line of a definition.
2. Put data sources and algorithm notes in the Documentation tab.
3. Leave the Notes tab blank (it will be used later for modularity management).
Coding Pitfalls
There are a few techniques that, if practiced, may keep some of your more difficult to track errors to a minimum.
DIVZ0
The first of these is to carefully use the / (division) operator. Although good modeling practice recommends extreme values tests (Zagonel and Corbet, 2006) we often do not perform them. Use the DIVZ0 function. It will assign a value of zero when the denominator evaluates to zero.
Equation complexity
Use auxiliaries. George Richardson of SUNY Albany suggests that no variable equation include more than three input variables (Richardson‟s Rule). Following that rule will increase the number of variables in a model and make it more understandable. The Studio Interactive Development Environment (IDE),
14
termed „Workspace‟, has so many advantages that this rule is often broken. I do not recommend it except for novice modelers.
Techniques
Getting started on a model
I believe that the most important technique here is „outside-in‟, Ozgur Ozgun told me this several years ago. Essentially, as you create a model start with the constants. Make sure that they have the appropriate units. This is especially true for the initial values of Levels. Studio will then „inherit‟ the units from these constants as you make use of them in the model.
Data Considerations
Input
There are several ways to input data into a Studio model.
Dataset Connection XLDATA function Relational database or SAP BI Studio dataset User interaction
Output
There is really only one way to output data from a Studio model, use a Dataset Connection. This section speaks to the issues surrounding the output of data.
Datasets are cognizant of time dependence, data transfer type, units, labeling, and more. Since we add units to all of our Studio variables, datasets require that each dataset variable has the same units as the variable being exported or imported.
Model naming
Studio does not have a built-in configuration management feature at the time of this writing (05-2011). Experience has shown that saving your model frequently is a good practice (especially if using the VBFUNCTION17). Experience on the user group site and our own experience suggests that models be named this way:
Name [Date][a] S8FP2SR5
e.g. FlyswatterSales 20101022 S8FP2SR5.sip
Where:
„Name‟ is an acronym or name for the model content, e.g. FlyswatterSales
„Date‟ is yyyymmdd
17 VBFUNCTION lets the modeler embed VBScript code into an auxiliary. VBScript has the ability to perform loops within an auxiliary. A coding error could cause an infinite loop to occur. There is no way to break out of an infinite loop in an auxiliary except to kill the Powersim Studio application in the Windows task manager. Save often!
15
„a‟ is an optional letter of the alphabet just in case you want to save multiple models on the same day. The MS Windows time stamp on the *.sip file can serve the same purpose.
„S8FP2SR5‟ is Studio 818, Feature Pack 2, Service Release 5
We save copies of the model as it gets built. This prevents what software developers call „bridge burning edits‟, you find that your current model has a bug and wish you could return to an earlier version but it is gone. Note that Studio does save a backup of your file with the „.~si‟ file extension. Model delivery may use a different convention using numbering that indicates the release number.
Interface Design
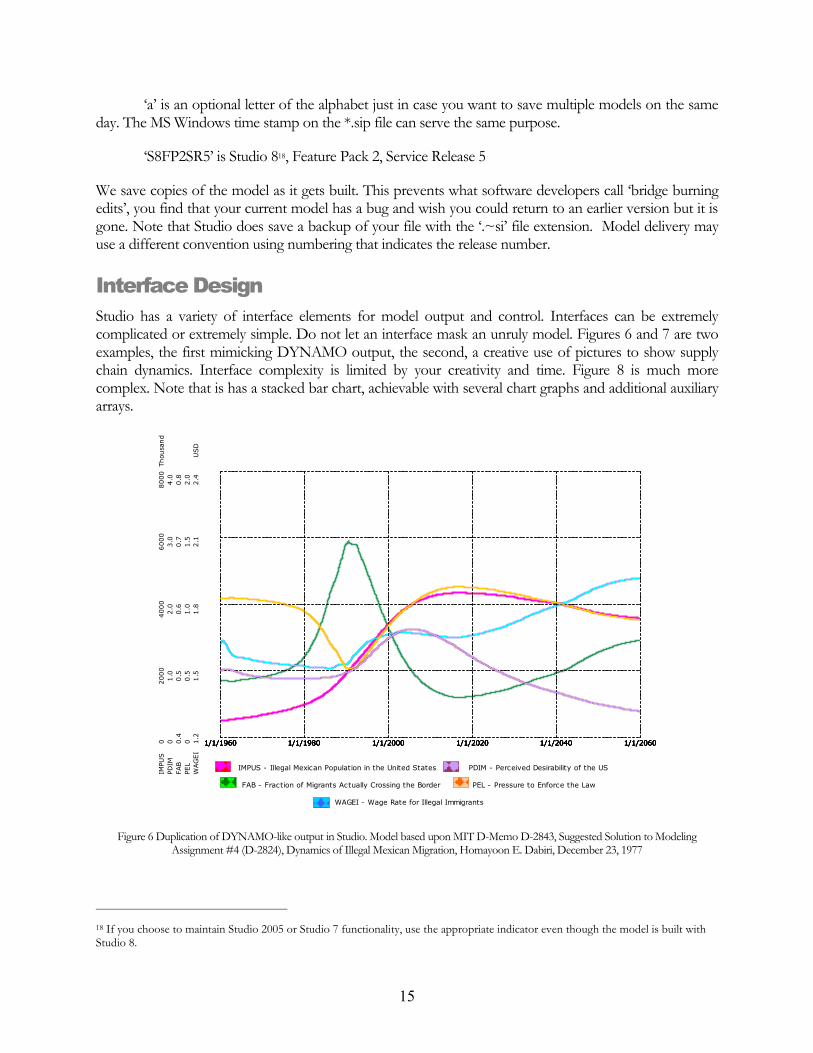
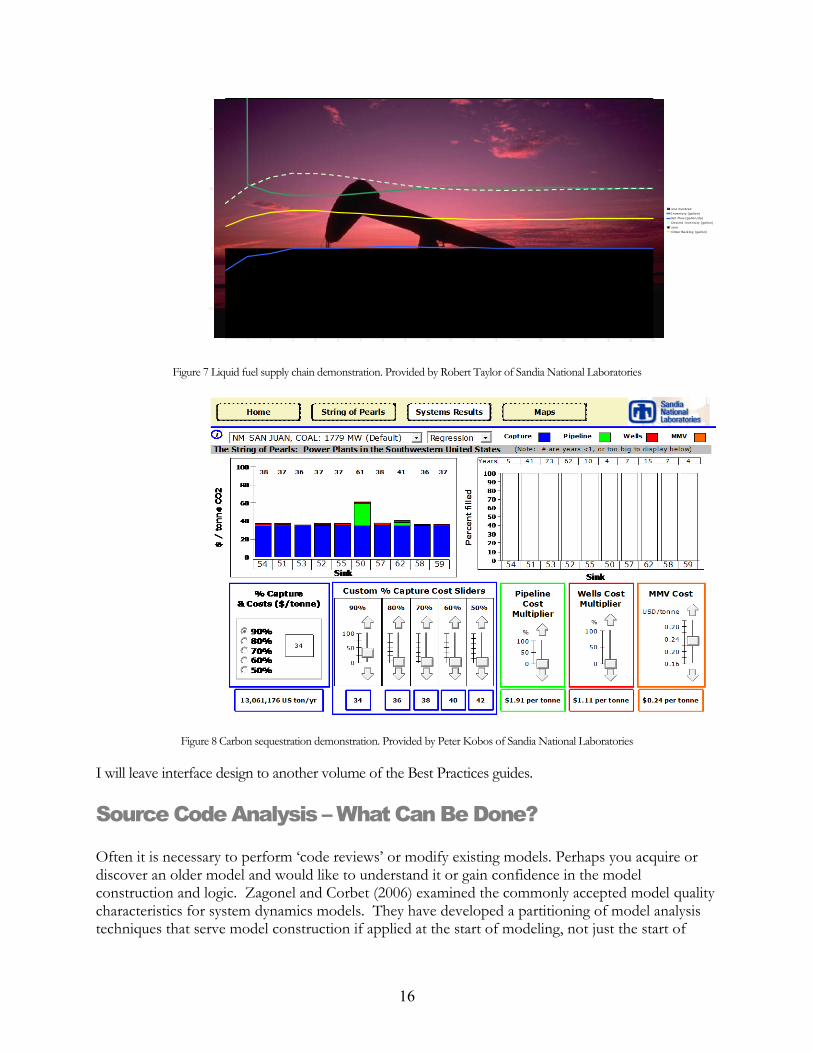
Studio has a variety of interface elements for model output and control. Interfaces can be extremely complicated or extremely simple. Do not let an interface mask an unruly model. Figures 6 and 7 are two examples, the first mimicking DYNAMO output, the second, a creative use of pictures to show supply chain dynamics. Interface complexity is limited by your creativity and time. Figure 8 is much more complex. Note that is has a stacked bar chart, achievable with several chart graphs and additional auxiliary arrays.
Figure 6 Duplication of DYNAMO-like output in Studio. Model based upon MIT D-Memo D-2843, Suggested Solution to Modeling Assignment #4 (D-2824), Dynamics of Illegal Mexican Migration, Homayoon E. Dabiri, December 23, 1977
18 If you choose to maintain Studio 2005 or Studio 7 functionality, use the appropriate indicator even though the model is built with Studio 8.
1/1/1960 1/1/1980 1/1/2000 1/1/2020 1/1/2040 1/1/20601/1/1960 1/1/1980 1/1/2000 1/1/2020 1/1/2040 1/1/20601/1/1960 1/1/1980 1/1/2000 1/1/2020 1/1/2040 1/1/20601/1/1960 1/1/1980 1/1/2000 1/1/2020 1/1/2040 1/1/20601/1/1960 1/1/1980 1/1/2000 1/1/2020 1/1/2040 1/1/20600 0 0.4
0 1.2
2000
1.0
0.5
0.5
1.5
4000
2.0
0.6
1.0
1.8
6000
3.0
0.7
1.5
2.1
8000
4.0
0.8
2.0
2.4
Thousand
USD
IMPU
S
PD
IM
FAB
PEL
WAG
EI
IMPUS - Illegal Mexican Population in the United States PDIM - Perceived Desirability of the US
FAB - Fraction of Migrants Actually Crossing the Border PEL - Pressure to Enforce the Law
WAGEI - Wage Rate for Illegal Immigrants
16
Figure 7 Liquid fuel supply chain demonstration. Provided by Robert Taylor of Sandia National Laboratories
Figure 8 Carbon sequestration demonstration. Provided by Peter Kobos of Sandia National Laboratories
I will leave interface design to another volume of the Best Practices guides.
Source Code Analysis – What Can Be Done?
Often it is necessary to perform „code reviews‟ or modify existing models. Perhaps you acquire or discover an older model and would like to understand it or gain confidence in the model construction and logic. Zagonel and Corbet (2006) examined the commonly accepted model quality characteristics for system dynamics models. They have developed a partitioning of model analysis techniques that serve model construction if applied at the start of modeling, not just the start of
1 2 3 4 5 6 7 8 9 10 11 12 13 14 15 16 17 18 19 20
-20
0
20
40
one hundred
Inventory (gallon)
Net Flow (gallon/da)
Desired Inventory (gallon)
zero
Order Backlog (gallon)
17
model construction. In this case we are considering a post hoc situation; you have a model and want to determine its quality.
The process of determining the quality of an existing model can be separated into objective and subjective tests for quality. Historically, software engineers19 have had a hierarchy for examining code quality. Typically the first test is, “Does the code run?” In the case of Studio models we propose a similar hierarchy as follows:
1. OBJECTIVELY
a. Are there undefined or problematic variables? b. Does every variable have a well defined unit assigned to it? c. Does the model follow „standard‟ naming conventions? d. Does the model contain embedded constants? e. Are stocks initialized internally with other than non-zero values? f. Are Links marked with # (indicating they are not used in the variable they connect
to) g. Is every variable used by another variable? If not why not? h. Do variables exist in the Equations View and not on any of the model sheets? Also
known as Excluded Variables in Studio 8 Feature Pack 3.
2. SUBJECTIVELY
a. Are variable names well constructed?
b. Do modules exist?
c. Is the layout of Constructor diagrams (sheets) instructive?
d. Does documentation exist?
e. Do arrays follow good practice guidelines?
Some of these tests can be performed though observation, these are non-destructive. Other destructive tests, tests that require a modification of the model, can be performed to gain a better understanding of the model logic and its construction quality.
Coincidently, the analysis of other models can lead to and has lead to best practices for model construction. Much of what we criticize can be constructively used to guide better model building.
Are there undefined or problematic variables?
Poorly defined variables can be found in the „Go to an Object‟ (binoculars icon) and in Equations View (turn on the „Well Defined‟ column heading.
Does every variable have a well defined unit assigned to it?
Well defined units are units that are traceable back to a Studio System Unit or are atomic units.
Does the model follow ‘standard’ naming conventions?
Naming conventions are listed earlier in this document. Checking existing models for compliance (and correct them) is not easy. Studio 8 Feature Pack 3 now includes „Variable Type‟ as a display in Equations view. Using it will permit verification that constants are all in capital letters.
19 Much of the content here is based upon the ideas and principles of software engineering. See http://en.wikipedia.org/wiki/Software_engineering

18
Another quick check for model quality is to simply sort the variables by name and look for names like: Auxiliary_x Level_x Rate_x Copy of, Copy x, etc.
where x is a number. This may be a sign of poor understanding of the problem and how to model it, laziness, or violating a later rule.20 Does the model contain embedded constants?
Are stocks initialized internally with other than non-zero values?
Are Links marked with # (indicating they are not used in the variable they connect to)
Is every variable used by another variable? If not, why not?
Do variables exist in the Equations View and not on any of the model sheets?
In Studio 8 a new Workspace icon appears if there are variables that exist but they are not included on any Constructor diagram (Sheet). The icon will appear just to the left of the leftmost tab or sheet name.
Units Checking
Use equation view, Global Units and Local Units for unit checking.21
Using the Find and Go to Variable Tools
These tools provide an efficient way to look for errors and navigate your model.
20 Never close and save a model unless it runs and all variables are well defined.
21 Please be aware that variables may exist in the Equations View that are not used on any of the Constructor Diagrams. These are easy to find (probably not to fix) using Studio 8 Feature Pack 3‟s new Excluded Variables tool.
19
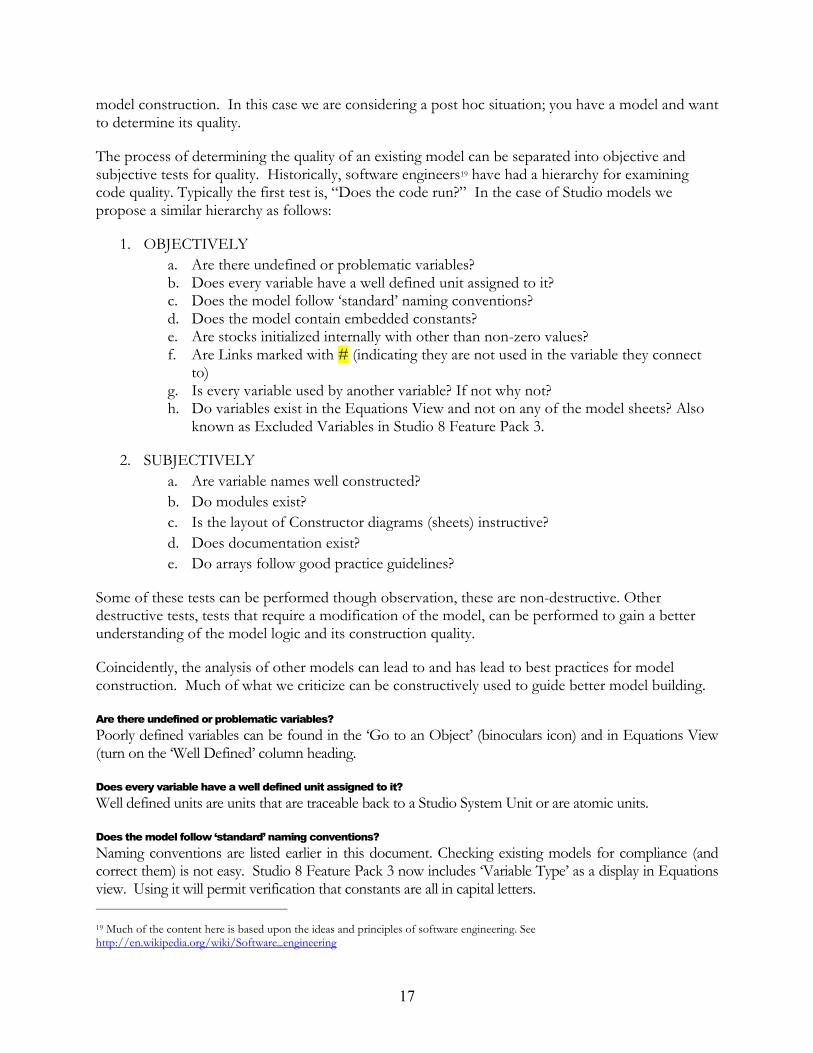
Figure 9 Studio Go To Variable window
A very useful but often overlooked feature of the Edit command is Select Special. Select Special is invaluable for selecting sets of variables when you want to apply the same format to several variables at once.
Figure 10 Studio Select Special window
Automatic Errors and Warnings – Executable Code at Every Stopping Point
The Studio built in warning (yellow #) and error (? in a red circle) give immediate feedback while coding. Every time a model is saved there should be no poorly or undefined variables. An exception can be made
20
if these variables are copied as shortcuts to a separate sheet before saving the model. This makes it easy to find the problematic variables the first time you run the model.
Checklists
During model construction (please see Appendix C. Model Construction Checklist):
During model analysis (please see Appendix D. Model Analysis Checklist):
Units
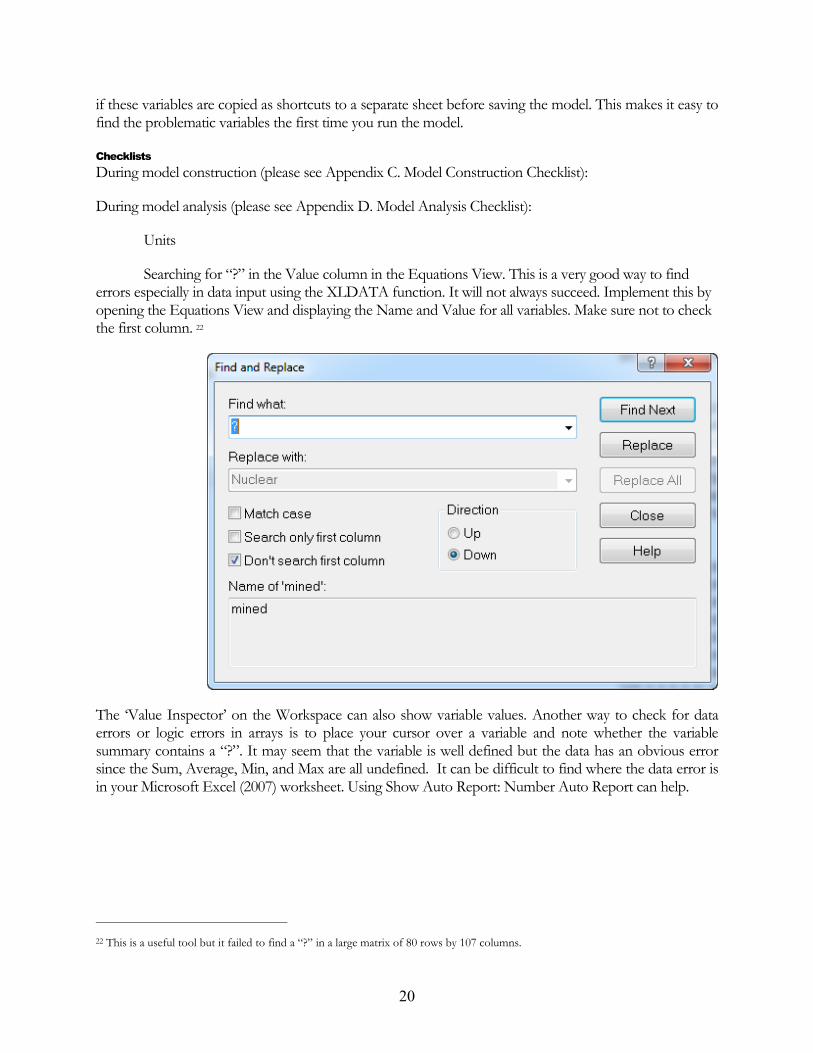
Searching for “?” in the Value column in the Equations View. This is a very good way to find errors especially in data input using the XLDATA function. It will not always succeed. Implement this by opening the Equations View and displaying the Name and Value for all variables. Make sure not to check the first column. 22
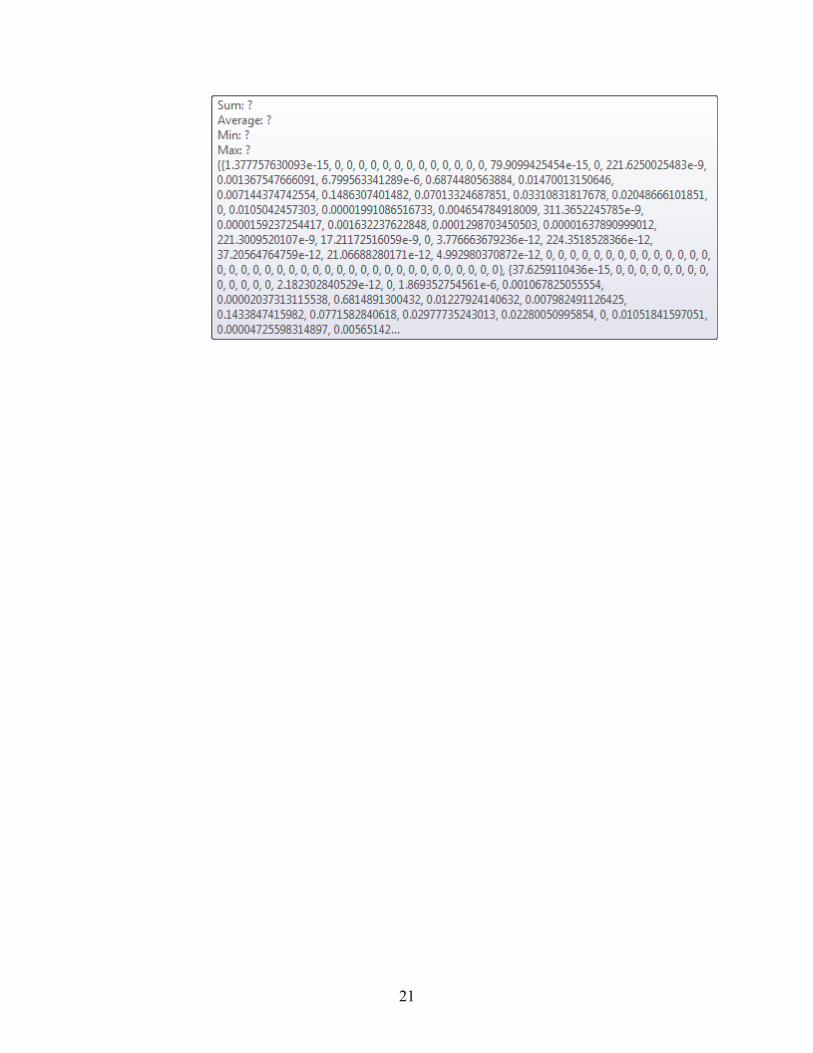
The „Value Inspector‟ on the Workspace can also show variable values. Another way to check for data errors or logic errors in arrays is to place your cursor over a variable and note whether the variable summary contains a “?”. It may seem that the variable is well defined but the data has an obvious error since the Sum, Average, Min, and Max are all undefined. It can be difficult to find where the data error is in your Microsoft Excel (2007) worksheet. Using Show Auto Report: Number Auto Report can help.
22 This is a useful tool but it failed to find a “?” in a large matrix of 80 rows by 107 columns.
21
22
Summary and Conclusion
After many years in the software engineering and economics fields I was introduced to system dynamics. It wasn‟t until 2001 that I was able to use Powersim Constructor for a very rapid turnaround project. I was hooked on system dynamics and the tool.
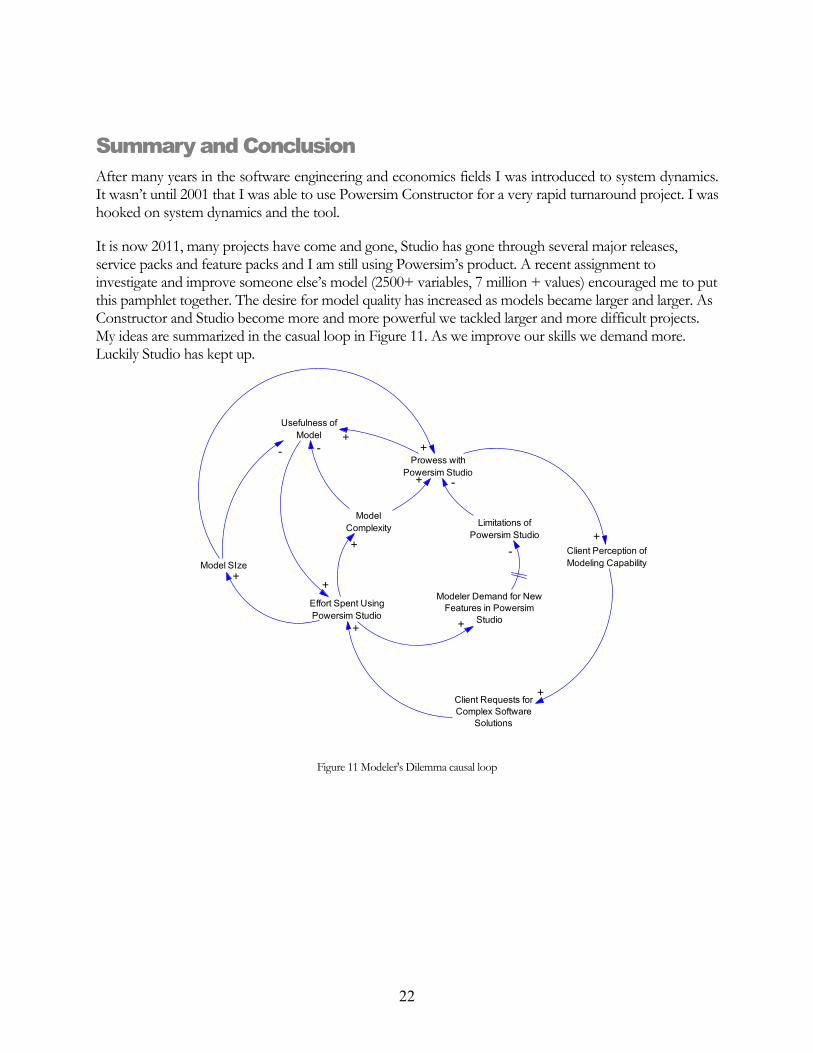
It is now 2011, many projects have come and gone, Studio has gone through several major releases, service packs and feature packs and I am still using Powersim‟s product. A recent assignment to investigate and improve someone else‟s model (2500+ variables, 7 million + values) encouraged me to put this pamphlet together. The desire for model quality has increased as models became larger and larger. As Constructor and Studio become more and more powerful we tackled larger and more difficult projects. My ideas are summarized in the casual loop in Figure 11. As we improve our skills we demand more. Luckily Studio has kept up.
Figure 11 Modeler's Dilemma causal loop
Prowess with
Powersim Studio
Client Perception of
Modeling Capability
Client Requests for
Complex Software
Solutions
+
+
Limitations of
Powersim Studio
Usefulness of
Model
Model SIze
-
+
-
Model
Complexity
-
Effort Spent Using
Powersim Studio
+
+
+
+
+
Modeler Demand for New
Features in Powersim
Studio+
-
+
23
Appendices
Appendix A: Assigning Constructor Diagram Names (sheet
names) to Variables
Studio does not permit one to see the name of the diagram on which a variable exists in Equation View. Studio does permit a modeler to view the variable class (level, rate, etc.) in Equation View; just choose „Variable Type‟ as one of the columns. These two capabilities are very useful in model analysis. This is especially true for understanding the coupling and cohesion in a model. Once understood, the model can be redesigned to be more modular. Use this technique for assigning tab names and object types to model objects.
1. On a model sheet, use Select Special to select the object type (Level, Auxiliary, Constant)
choose only one, for example Level.
2. Open the Properties->Notes and type “sheet name” (you can get the sheet name by first
asking to rename the sheet then Ctrl-C to copy the name, and Ctrl-V to paste it into the
object's Note box). For example: Population23
3. Immediately switch to Equation View and select the equations that belong to the just
modified sheet and copy them to Microsoft Excel (2007) (When exporting equations
from the Equations view make sure Notes is visible). You need to do this one sheet at a
time since many variables appear on multiple sheets.
4. Repeat steps 1-3 for each sheet in the model
5. In Microsoft Excel (2007), remove the duplicate column headers.
6. Import this data into Microsoft Access (2007).
7. Prepare 1-to-many set up between tab and variable
8. Run query to get": sheet name<=>variable name<=>sheet name
9. Export to the table/query back to Microsoft Excel (2007)
10. Optional: Import into a network diagramming tool for coupling cohesion diagram
Once you have an electronic file of variable names and modules you can produce tables and graphics that indicate what variables are used in what modules.
23 With older versions of Studio prior to Studio 8 SR6a, you will need to add variable type manually, e.g. Population:Level and parse into Sheet and Variable Type in Microsoft Excel (2007) as required in Step 5.

24
Appendix B: Creating ranges names from external data files
Range24 names are useful when dealing with arrays in Studio. In many modeling situations the data that are used in the model are assigned to individual array elements by name. An example might be the initial population by province or state. Often that data is obtained from a spreadsheet or document and that spreadsheet or document contains a list of range names that would be burdensome to type by hand or error prone to retyping in Studio.
The goal is to get a comma delimited set of ranges names into a text file format. That text can then be pasted into Studio under the „Custom‟ range name screen. This sounds simple but there are a few complications.
1. Names that have spaces or special characters
2. Names that are not unique across names in all ranges except sub-ranges
3. Text editors that have left and right ticks or apostrophes
Range names that have spaces in them have to be delimited by „, an apostrophe or tick. MS Word, as an example, has a left (`) and a right („) apostrophe. Make sure to only use right apostrophes (this is the character below the double quote symbol on English keyboards). Use a text editor such as Word Pad to be safe.
If the range names are in Microsoft Excel (2007) it is easiest to copy the names to Microsoft Word (2007) first. Doing this will create a table in Microsoft Word (2007). The table needs to be converted to text. Then separate the names with commas and apostrophes as needed using Microsoft Word (2007) Find and Replace features.
Here is a list of counties and municipios along the Mexico United States border. I would like to convert this list into a Range in Studio but I don‟t want to re-type the names.
Chihuahua – Ascension
Chihuahua – Guadalupe
Chihuahua – Janos
Chihuahua – Juarez
Chihuahua – Ojinaga
Chihuahua - PG Guerrero
New Mexico - Dona Ana
New Mexico - Hidalgo
New Mexico - Luna
Texas - Brewster
Texas - El Paso
24 Studio 8 Feature Pack 3 has many new range features. I have not been able to keep up with all of them! Please see the Powersim AS website for full details, www.powersim.com.

25
Texas - Hudspeth
Texas - Presidio
Steps:
1. Select the table and paste into Microsoft Word (2007)
2. In Microsoft Word (2007), select the table and convert it to text
3. Using find and replace, change all carriage returns into commas
4. Copy all the text and paste it into Microsoft Word Pad (2007)
5. Using find and replace, change all the commas into „, „ (tick comma space tick)
6. Add a tick to the first element and check the last element for extra ticks and commas
7. Start a new range in Studio, choose custom
8. Return to Microsoft Word Pad (2007), select and copy the text
9. Return to Studio and paste the text
26
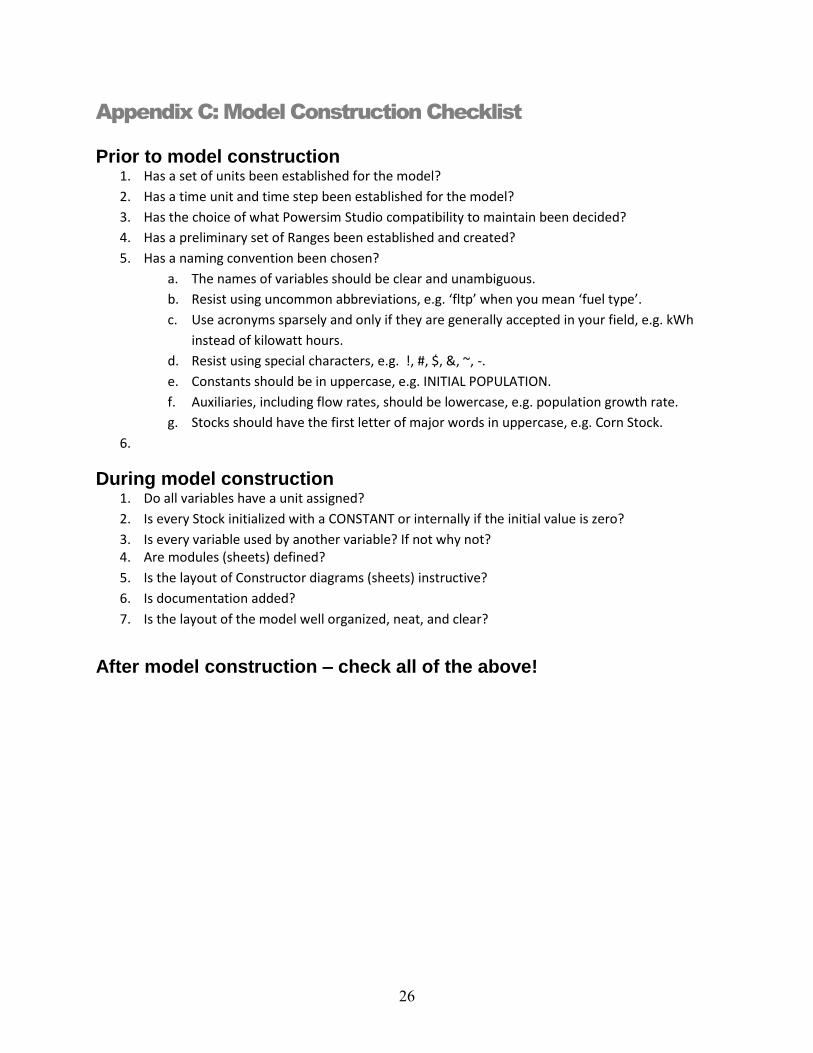
Appendix C: Model Construction Checklist
Prior to model construction 1. Has a set of units been established for the model?
2. Has a time unit and time step been established for the model?
3. Has the choice of what Powersim Studio compatibility to maintain been decided?
4. Has a preliminary set of Ranges been established and created?
5. Has a naming convention been chosen?
a. The names of variables should be clear and unambiguous.
b. Resist using uncommon abbreviations, e.g. ‘fltp’ when you mean ‘fuel type’.
c. Use acronyms sparsely and only if they are generally accepted in your field, e.g. kWh
instead of kilowatt hours.
d. Resist using special characters, e.g. !, #, $, &, ~, -.
e. Constants should be in uppercase, e.g. INITIAL POPULATION.
f. Auxiliaries, including flow rates, should be lowercase, e.g. population growth rate.
g. Stocks should have the first letter of major words in uppercase, e.g. Corn Stock.
6.
During model construction 1. Do all variables have a unit assigned?
2. Is every Stock initialized with a CONSTANT or internally if the initial value is zero?
3. Is every variable used by another variable? If not why not? 4. Are modules (sheets) defined?
5. Is the layout of Constructor diagrams (sheets) instructive?
6. Is documentation added?
7. Is the layout of the model well organized, neat, and clear?
After model construction – check all of the above!
27
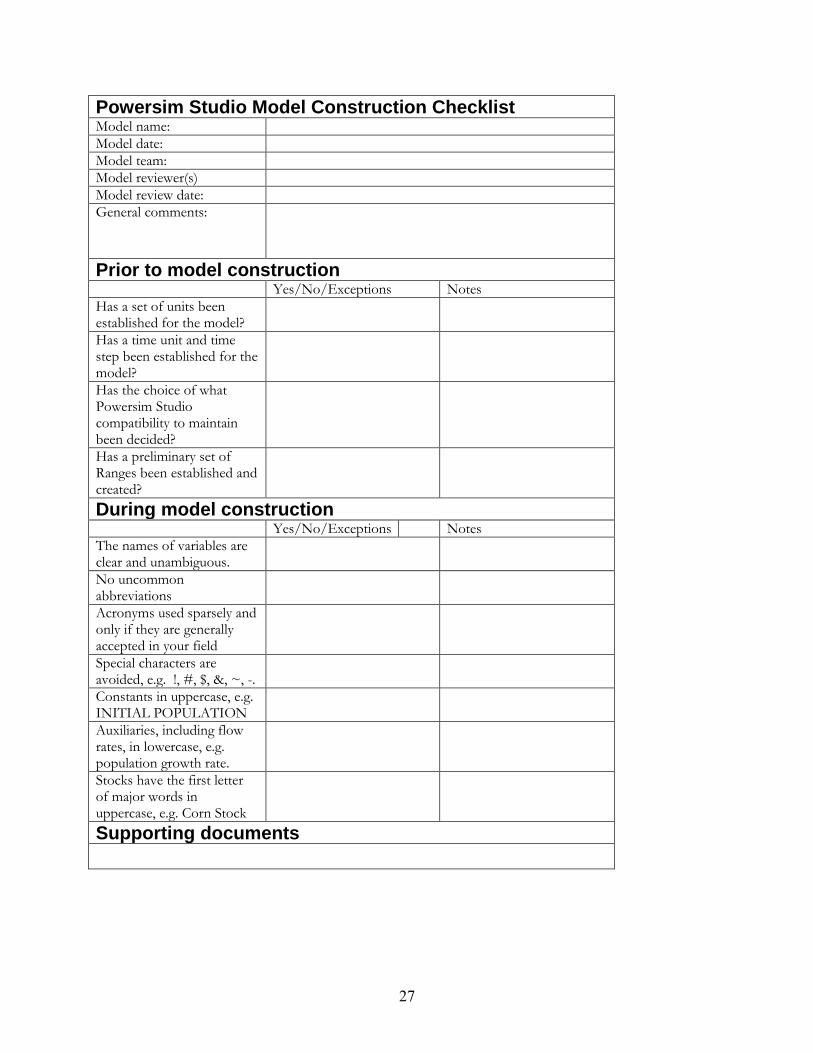
Powersim Studio Model Construction Checklist
Model name:
Model date:
Model team:
Model reviewer(s)
Model review date:
General comments:
Prior to model construction
Yes/No/Exceptions Notes
Has a set of units been established for the model?
Has a time unit and time step been established for the model?
Has the choice of what Powersim Studio compatibility to maintain been decided?
Has a preliminary set of Ranges been established and created?
During model construction
Yes/No/Exceptions Notes
The names of variables are clear and unambiguous.
No uncommon abbreviations
Acronyms used sparsely and only if they are generally accepted in your field
Special characters are avoided, e.g. !, #, $, &, ~, -.
Constants in uppercase, e.g. INITIAL POPULATION
Auxiliaries, including flow rates, in lowercase, e.g. population growth rate.
Stocks have the first letter of major words in uppercase, e.g. Corn Stock
Supporting documents
28
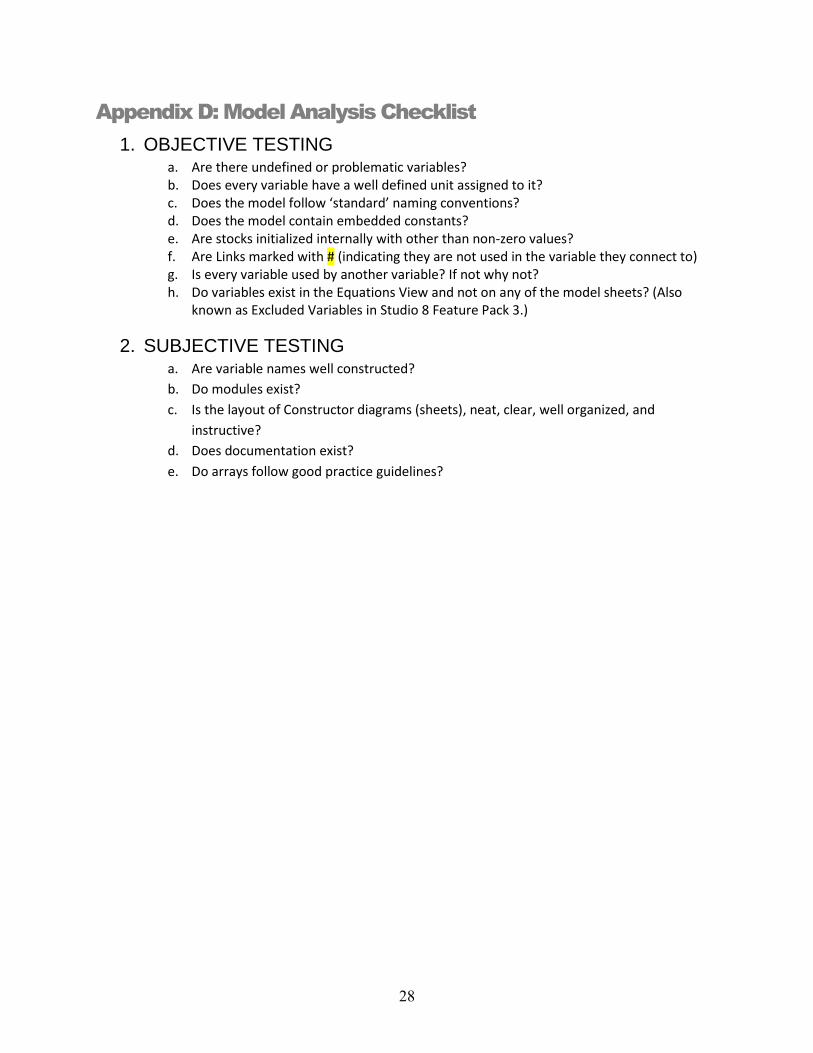
Appendix D: Model Analysis Checklist
1. OBJECTIVE TESTING a. Are there undefined or problematic variables? b. Does every variable have a well defined unit assigned to it? c. Does the model follow ‘standard’ naming conventions? d. Does the model contain embedded constants? e. Are stocks initialized internally with other than non-zero values? f. Are Links marked with # (indicating they are not used in the variable they connect to) g. Is every variable used by another variable? If not why not? h. Do variables exist in the Equations View and not on any of the model sheets? (Also
known as Excluded Variables in Studio 8 Feature Pack 3.)
2. SUBJECTIVE TESTING a. Are variable names well constructed?
b. Do modules exist?
c. Is the layout of Constructor diagrams (sheets), neat, clear, well organized, and
instructive?
d. Does documentation exist?
e. Do arrays follow good practice guidelines?
29
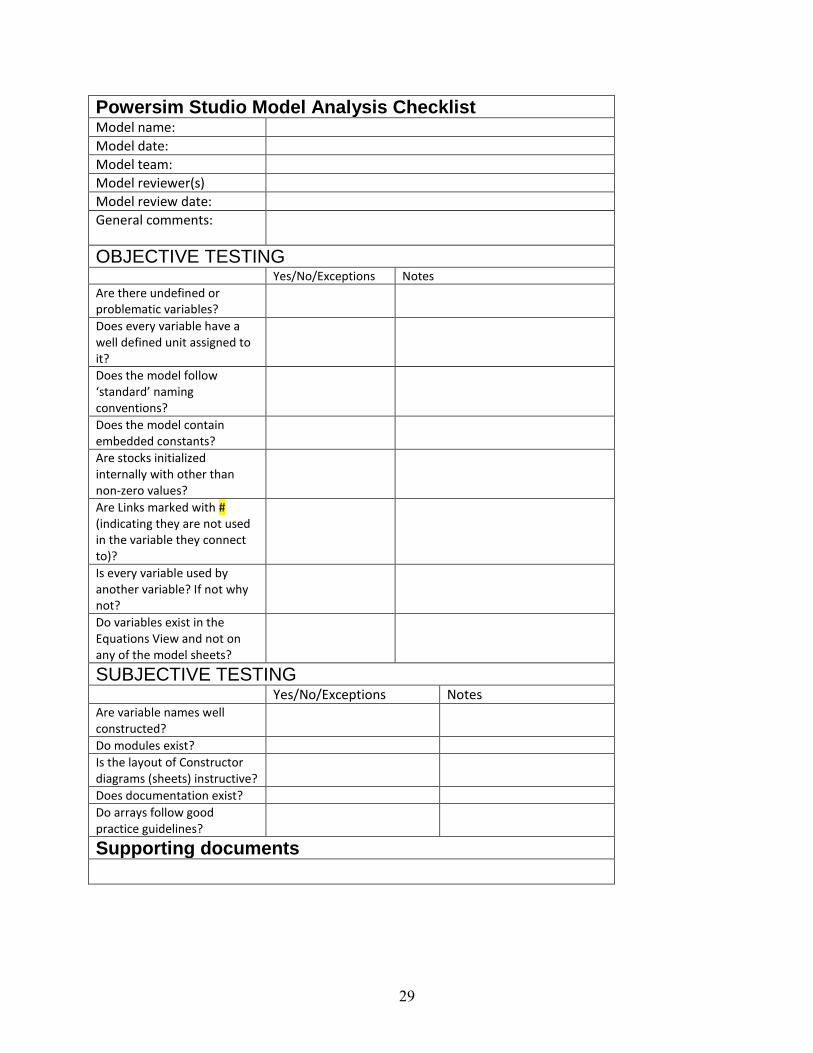
Powersim Studio Model Analysis Checklist
Model name:
Model date:
Model team:
Model reviewer(s)
Model review date:
General comments:
OBJECTIVE TESTING
Yes/No/Exceptions Notes
Are there undefined or problematic variables?
Does every variable have a well defined unit assigned to it?
Does the model follow ‘standard’ naming conventions?
Does the model contain embedded constants?
Are stocks initialized internally with other than non-zero values?
Are Links marked with # (indicating they are not used in the variable they connect to)?
Is every variable used by another variable? If not why not?
Do variables exist in the Equations View and not on any of the model sheets?
SUBJECTIVE TESTING
Yes/No/Exceptions Notes Are variable names well constructed?
Do modules exist?
Is the layout of Constructor diagrams (sheets) instructive?
Does documentation exist?
Do arrays follow good practice guidelines?
Supporting documents

30
References
McConnell, Steve. Code Complete. 2nd Edition, Microsoft Press, 2004.
Page-Jones, Meilir. The Practical Guide to Structured Systems Design. Yourdon Press, New York, NY, 1980.
Lai, Danny and Rebekah Wahba, „System Dynamics Model Correctness Checklist‟, MIT D-Memo D-4851, 01/15/2001.

31
Distribution
External Distribution
1 Hilde Martinussen, Powersim AS, Bergen, Norway, [email protected] 1 F. Dromigny,Strateco Sàrl, [email protected]
1 George Papachristos, [email protected] 1 Bill Braun, [email protected] 1 Jacob Jacobson INL Idaho Falls, ID, [email protected] 1 Keith Linard, [email protected] 1 Frederic Taes, [email protected]
Sandia Internal Distribution
1 MS 0899 Technical Library 1 MS 0735 Peter Kobos 1 MS 0735 Jesse Roach 1 MS 1137 Cesar Castillo 1 MS 1137 Will Peplinski 1 MS 1137 Vince Tidwell 1 MS 1137 Marissa Reno 1 MS 1137 Howard Passell 1 MS 1137 Thomas Lowry 1 MS 1137 Thomas Drennen 1 MS 1137 La Tonya Walker 1 MS 0828 Asmeret Bier 1 MS 1137 Stephanie Kuzio 2 MS 1137 Len Malczynski 1 MS 1137 Laura Cutler 1 MS 1137 Elizabeth Richards 1 MS 0735 Geoffery Klise 1 MS 9292 David Reichmuth 1 MS 9406 Todd West 1 MS 9406 Katherine Dunphy-Guzman 1 MS 9406 Donna Edwards 1 MS 9406 Jesse Westbrook


![Powersim Constructor Mini Model, version 07 · 2019. 2. 26. · Powersim Constructor Mini Model, version 08A 03-05-2002 . im Constructor Run-Time - [Native Inflow] View Simulate Window](https://img.pdfslide.us/doc/110x75/60d6567324bfca6b9a6f7d0d/powersim-constructor-mini-model-version-07-2019-2-26-powersim-constructor.jpg)