Embed Size (px)
Citation preview

Department for InternationalDevelopment, UK.
BEST PRACTICES FOR SUSTAINABLE DEVELOPMENTOF MICRO HYDRO POWER IN DEVELOPING COUNTRIES
FINAL SYNTHESIS REPORTContract R7215
Smail Khennas and Andrew BarnettIn association with
London Economics &deLucia Associates, Cambridge Massachusetts, USA
ForThe Department for International Development, UK
andThe World Bank
March 2000

Front page photograph of micro hydro penstock in Peru (ITDG E3 Peru X4.007).
iii
TABLE OF CONTENTS
Sources and Acknowledgements ...........................................................................................viiExecutive Summary ................................................................................................................ixAbbreviations and Acronyms ...............................................................................................xiiiUnits........................................................................................................................................xiv
1. INTRODUCTION...............................................................................................................1
1.1 The Place of Micro Hydro...........................................................................................11.2 The Differing Objectives of Micro Hydro Development............................................21.3 Technology Demonstration, Social Infrastructure, or Small Enterprise? ...................31.4 Hard Choices Have To Be Made in the Allocation of Scarce Resources ...................41.5 The Main Forms Of Support – Extending the Concept Of ‘Intermediation’..............51.6 The Importance of the Technology.............................................................................6
2. THE COST OF MICRO HYDRO AND ITS FINANCIAL PROFITABILITY...........9
2.1 The Cost Per Kilowatt Installed ..................................................................................92.2 Wide Variation in Costs ............................................................................................112.3 How Do the Costs of Hydro Compare with Other Options?.....................................122.4 Micro Hydro can be Financially Profitable...............................................................132.5 Cash Generating End-Uses........................................................................................152.6 Links To The Grid .....................................................................................................162.7 Making the ‘Profitable’ Social is Easier than Making the ‘Social’ Profitable! ........17
3. MEETING NEEDS AND THE CIRCUMSTANCES OF AFFORDABILITY...........19
3.1 Price and Demand .....................................................................................................193.2 The Benefits and Burdens of Remoteness.................................................................203.3 The Case for Subsidy................................................................................................203.4 Limitations of Financial Analyses.............................................................................213.5 Filling the Gap Between Full Cost Finance and Free Grants....................................213.6 Smarter Subsidies......................................................................................................223.7 The Poverty Impact of Micro Hydro.........................................................................233.8 Gender and Micro Hydro ..........................................................................................24
4. INTERMEDIATION IN PRACTICE: EXPANDING THE USE OF MHP...............27
4.1 Many Dimensions .....................................................................................................274.2 The Main Diffusion Strategies ..................................................................................284.3 The Key Agents Behind The ‘Strategy’ ....................................................................294.4 The Issue of Ownership and the Main ‘Clients’ of the Strategies ............................304.5 Intermediation and the Critical Importance of ‘Project Developers’........................314.6 Transaction Costs and the Cost of Intermediation....................................................324.7 The Size of the Micro Hydro Market........................................................................334.8 Specific Examples of Intermediation........................................................................34
4.8.1 Technological Intermediation..........................................................................344.8.2 Social Intermediation and Participative Approaches.......................................354.8.3 Village Catalysts ..............................................................................................364.8.4 Marketing and the ‘Creation’ of Demand ........................................................374.8.5 Lobbying ..........................................................................................................37
4.9 Financial Intermediation and the Main Funding Mechanisms..................................37

iv
4.10 Current Financing Models for Micro Hydro..........................................................404.11 Collateral and Guarantees .......................................................................................444.12 ‘Organisational Intermediation’ and the ‘Enabling Environment’ .........................454.13 The Regulatory Framework ....................................................................................464.14 The Special Case of Mozambique and Zimbabwe as New Entrants.......................48
5. BEST PRACTICES: THE LESSONS LEARNED........................................................51
5.1 The Critical Factors.................................................................................................515.2 Best Practice and Profitable End-uses.....................................................................515.3 Best practice and Tariff Setting...............................................................................525.4 Best Practice for Governments................................................................................525.5 Best Practice for Regulation....................................................................................525.6 Best Practice in Financing.......................................................................................535.7 Best Practice for Smarter Subsidies ........................................................................535.8 Best Practice for Donors .........................................................................................535.9 Best Practice for Project Developers.......................................................................545.10 Best Practice for Capacity Building........................................................................555.11 Best Practice for Management of Micro Hydro Plant.............................................55
ANNEX: SUMMARY OF THE CASE STUDIES .............................................................57
1. Sri Lanka .....................................................................................................................571.1 The Sample...........................................................................................................571.2 Case Study Details ...............................................................................................58
1.2.1 Site 1: Katepola ..............................................................................................581.2.2 Site 2: Kandal Oya .........................................................................................591.2.3 Site 3: Pathawita 2..........................................................................................601.2.4 Site 4: Seetha Eliya. .......................................................................................61
1.3 Financial and Economic Analysis........................................................................621.4 Conclusions from Sri Lanka.................................................................................63
2. Nepal ...........................................................................................................................642.1 The Sample and Assumptions..............................................................................64
2.2.1 Site 1: Barpak Micro Hydro Power Project ...................................................652.2.2 Site 2: Gorkhe Micro Hydro Project..............................................................662.2.3 Site 3: Ghandruk Micro Hydro Project..........................................................692.2.4 Site 4: Gaura Rice Mill (Harichaur Micro Hydro Project)............................71
3. Peru..............................................................................................................................743.1 The Sample...........................................................................................................743.2 Case Study Details ...............................................................................................75
3.2.1 Site 1: Atahualpa Farming Co-operative........................................................753.2.2 Site 2: Micro Hydro for Productive End-Use: Yumahual Scheme ................773.2.3 Site 3: Public Electricity Service in Pedro Ruiz.............................................793.2.4 Site 4: Public Electricity Service in Pucará District.......................................82
3.3 Key Conclusions Peru..........................................................................................844. Zimbabwe and Mozambique .......................................................................................86
4.1 Case Study Details ...............................................................................................864.1.1 Site 1: Nyafaru Micro Hydro Co-operative....................................................864.1.2 Site 2: Svinurai Micro Hydro Mill .................................................................894.1.3 Site 3: Elias Mill - A Private Micro Hydro Scheme (Mozambique)..............914.1.4 Site 4: Chitofu Mill (Mozambique)................................................................92

v
4.2 Summary of Findings of Micro Level Analysis……………………………...94
BIBLIOGRAPHY..................................................................................................................97
TABLES
Table 1-1: Summary Table Showing the Sample of Projects Studied In Detail................2Table 2-1: Summary of Financial Returns After Financing.............................................10Table 4-1: Sources of Finance from Micro Hydro Development in Peru........................41Table 4-2: Types of Finance from Micro Hydro Development in Peru...........................41Table 4-3: Summary of Current Financing Terms for Micro Hydro ...............................44Table A-1: Selected Sites and Criteria, Sri Lanka ...........................................................57Table A-2: Katepoloya Scheme Profile ..........................................................................59Table A-3: Kandal Oya Scheme Profile ..........................................................................60Table A-4: Pathawiata Scheme Profile ...........................................................................60Table A-5: Seetha Eliya Scheme Profile .........................................................................61Table A-6: Internal Rates of Return and Return on Capital Invested ..............................62Table A-7: Selected Sites and Criteria, Nepal..................................................................64Table A-8: Barpak Scheme Profile .................................................................................65Table A-9: Source of Financing Ropeway between Barpak and Rangrung ....................66Table A-10: Gorkhe Scheme Profile ...............................................................................67Table A-11: Ghandruk Scheme Profile ...........................................................................69Table A-12: Gaura Scheme Profile .................................................................................71Table A-13: Selected Micro Hydro Schemes in Peru......................................................74Table A-14: Atahualpa Scheme Profile ..........................................................................75Table A-15: Energy Consumption for Productive and Domestic End-Uses, Atahualpa .76Table A-16: Financing breakdown for Atahualpa Micro Hydro Plant ............................76Table A-17: Yumahual Scheme Profile ..........................................................................77Table A-18: Energy Distribution in the Incubating Plant, Yumahual..............................78Table A-19: Pedro Ruiz Scheme Profile .........................................................................79Table A-20: Structure of the Investment, Pedro Ruiz .....................................................80Table A-21: Income From the Sale of Electricity, Pedro Ruiz .......................................81Table A-22: Pucará Scheme Profile ................................................................................82Table A-23: Estimated Income, Pucará ...........................................................................83Table A-24: Nyafaru Scheme Profile ..............................................................................87Table A-25: Svinurai Scheme Profile .............................................................................89Table A-26: Elias Mill Scheme Profile ...........................................................................92Table A-27: Chitofu Mill Scheme Profile .......................................................................93
BOXES
Box 4-1: Electricity Consumer Societies ........................................................................35Box 4-2: Indicative Menu of Financing Options.............................................................38
FIGURES
Figure 2-2: IRR Without Subsidy....................................................................................14Figure A-1: Map showing the locations of the case study sites in Sri Lanka ..................58Figure A-2: Map showing the locations of the case study sites in Nepal........................64Figure A-3: Load Characteristics of Gorkhe Micro Hydro Plant.....................................68

vi
Figure A-4: Load Characteristics of Ghandruk Micro Hydro Plant.................................70Figure A-5: Load Characteristics of Gaura Micro Hydro Plant.......................................72Figure A-6: Map showing the locations of the case study sites in Peru...........................74Figure A-7: Map showing the locations of the case study sites in Zimbabwe.................90Figure A-8: Map showing the locations of the case study sites in Mozambique.............94

vii
SOURCES AND ACKNOWLEDGEMENTS
This research is the result of a collaborative effort involving numerous contributors.The project was managed by Intermediate Technology (known as The IntermediateTechnology Development Group or ITDG) under contract to the UK Department forInternational Development as part of the World Bank’s programme to determine bestpractice in a number of areas of rural energy development.
The project leader was Smail Khennas, Senior Energy Specialist from ITDG. The twomain authors produced the conceptual framework and Synthesis Report, with theassistance of Rona Wilkinson from Intermediate Technology Consultants (ITC).
This synthesis was based principally on the mass of material contained in reportsspecially produced by the four Country Teams. These teams documented micro hydroexperience in their countries and provided detailed empirical evidence on a number ofspecific micro hydro plants. The Country Teams were as follows:Kiran Dhanapala and Priyantha Wijayatunga, Sri LankaAlfonso Carrasco and Homero Miranda, PeruB Maboyi and W R Nyabeze , Zimbabwe and MozambiqueK B Rokaya and Devendra Bajracharya, Nepal
Mike Webb and William Derbyshire of London Economics provided comments onthe conceptual framework and validated the financial analyses in the Synthesis Report.Russell de Lucia of deLucia Associates provided comments throughout the process,assisted the Peruvian team and contributed both ideas and text to the Synthesis Report,particularly on financing and ‘intermediation’.Wolfgang Mostert, a Danish consultant, acted as an independent reviewer appointed bythe World Bank.Mac Cosgrove-Davies and Arun Sangvhi were the main contacts at the World Bank.Clive Caffall was the grant manager at the Department for International Development,UK.
The views expressed in this synthesis report are those of Smail Khennas and AndrewBarnett and do not necessarily represent the views of the sponsoring organisations, thereviewers or the other contributors. Responsibility for the accuracy of the empiricalevidence remains with the authors named as the main sources listed above.


ix
EXECUTIVE SUMMARY
This report synthesises the experience of micro hydro developments in Sri Lanka, Peru,Nepal, Zimbabwe and Mozambique. It attempts to draw out the Best Practice from thisexperience. Micro hydro plants are defined as having a capacity between 10 kW and200 kW. The report provides a rigorous comparative micro economic analysis of thecost and financial returns of a sample of plants across the five countries. It draws outthe macro economic, financial and other institutional arrangements that appearimportant to the scaling-up of micro hydro investments.
The case study material was provided by nationals of the countries according to a set ofmethodological guidelines that were developed at the start of the project, in an effort tomaximise the opportunities for valid comparisons between the countries. At the requestof the World Bank, a British consulting firm, London Economics was contracted tovalidate the methods used in the financial analyses and to ensure consistency in the data.
Summaries of the micro economic analysis of the case studies of individual micro hydroplants are included in the annex to this synthesis report. The lessons for ‘Best Practice’are brought together in summary form in Section 5.
Key Findings
• While the data were not perfect, the report probably represents the mostcomplete comparative review to date of micro hydro experience across a rangeof different countries and conditions.
• Micro hydro technology is now a mature technology that has benefited fromsubstantial improvements over the past 30 years. However, it remains relatively‘unfashionable’ and to some extent has been neglected by both major fundingprogrammes and governments.
• The data shows that in certain circumstances micro hydro can be moreappropriate and profitable than other energy supply options, and thereforeshould be treated as part of the ‘full menu’ of energy options to be considered inmeeting the needs of rural people.
• Investment in micro hydro has occurred in three broad phases:o a technological phase to improve and demonstrate the viability of the
technology;o a social phase where the objectives are largely to meet the needs of rural
people in just the same way that investments have been made in healthcentres and feeder roads; and,
o a financial phase, where the emphasis is on financially sustainable microhydro investments.
• The successes and failures attributed to micro hydro programmes have beenconfused as a result of the multiple and wide-ranging objectives set for suchprogrammes. These objectives range from the maximisation of micro hydroregardless of income or need, to providing rural people with electric lightbecause of its social impact and sense of belonging to the modern world, toproviding energy that can assist in securing the livelihoods of marginalized
x
people. The unit costs of micro hydro vary across a wide range as they are sitespecific, and like other decentralised energy systems, in practice the costs aregenerally higher than those cited in literature. The average capital cost (inconstant US$1998) of the sample investigated is $965 per kW1 for plants usedfor mechanical power and $3,085 per kW for plants generating electricity,including the costs of transmission, which clearly vary.
• Experience across the study countries shows a wide range of financialprofitability and some interesting common features. The microanalysis revealsthat there are plants that can be run profitably without subsidy. These tend to bethe plant installed initially or solely to produce mechanical power for aprofitable end-use such as milling. The micro hydro industry appears, therefore,to be faced with a particularly difficult paradox. Most of the financially viableinstallations provide mechanical power to productive enterprises, but the maindemand from consumers in a number of countries appears to be for electriclighting.
• There are clear circumstances in which micro hydro technology is most likely tobe financially sustainable. These include:
o a high load factor ;o a financially sustainable end-use,o costs are contained by good design and management; ando effective management of the installations, including the setting and
collection of tariffs that keep pace with inflation. Ownership is lessimportant for sustainability than business-like management.
• There is clear evidence of trade-off between the price charged for electricity andthe number and type of persons that can afford it. This means that there is also aclear trade-off between micro hydro projects capable of meeting the needs ofpeople and those that are profitable.
• Micro hydro appears to exhibit characteristics that indicate: ‘it is easier to makethe profitable social, than to make the social profitable’! In planning microhydro investments it appears important to consider means of using the plant tosecure livelihoods at an early stage, and to then see how the impact can bespread to marginalized people and to social activities such as lighting in healthcentres, schools, etc.
• There is a paradox that the main use for micro hydro appears to be for electriclighting, whilst financial sustainability depends largely on finding a profitableend-use.
• There is a constraint in that costs of micro hydro rise with the remoteness of thelocation but the cost of alternative options (particularly diesel generators) mayrise faster.
• Micro hydro compares well with the alternative energy supply options and hasan important niche in the range of decentralised energy supply options. Thisniche is tightly defined by the availability of adequate small-scale resource and asufficiently concentrated density of demand, consisting of a need combined withpurchasing power, to take advantage of a centralised, albeit small, power plant.
• In its niche, micro hydro compares well with other renewable and decentralisedenergy options and exhibits the standard characteristics of all renewables,
1 This figure seems to confirm the US$1,000 per kW benchmark very often quoted without specifying the basis ofcalculation nor the type of the micro plant (mechanical power, electricity generation) from which the figures arederived.

xi
namely relatively high initial capital costs and relatively low running cost. Thestrength of micro hydro is that it can provide real power, which can be put toproductive end-uses, capable of sustaining livelihoods. An additional strengthof micro hydro lies in its mini-grids which can ‘anchor’ or base end-uses to payfor increased access to energy for the poorer parts of the community. This canbe done through cross-subsidising the tariff, or more importantly, by poweringend-uses, such as milling, that benefit marginalised people, including women.
• Many tasks are required to implement a successful micro hydro programme.These are usefully considered as an extension of the concept of ‘intermediation’.Intermediation not only includes the task of organising the necessary finance,but also technical intermediation, social intermediation and organisationalintermediation. These are described in the report and examples of this are drawnfrom the case studies.
• The analysis confirms that ‘project developers’ perform a crucial role inundertaking the various forms of intermediation. The availability, skills andother capacities of project developers probably sets a limit on the extent towhich micro hydro programmes can expand in any country.
• The extent of project developers is largely a function of whether there is enoughwork for them (is there enough micro hydro plants that can be built and financedeach year) and how their costs can be met, either as a fee for service from plantowners, or from specific allocations of ‘soft’ money.
• It was difficult to establish of the scale of a micro hydro programme required toenable project developers and financial institutions to achieve economies ofscale in the delivery of their services.
• The costs of intermediation and related ‘transaction’ costs are high relative toproject costs. This is in part due to the remote location of the sites and the lowdensity of installations in any particular programme: there is little opportunityfor economies of scale in the delivery of these services. This means that there islikely to be a continuing need to combine soft and hard money in micro hydrodevelopment. Commercial financial institutions are unable or unwilling to coverthe transaction costs of funding micro hydro plants.
• In the case studies, Non-Governmental Organisations led most of theprogrammes initiated to spread the use of micro hydro. These organisations areessentially tax free enterprises with a commitment to marginalized people. Theexception to this is in Nepal where there was an active manufacturing sector andstrong, albeit intermittent, support from the Agricultural Development Bank.
• Many funding models were identified and described including: revolving funds;combinations of different types of hard and soft funding from many sources; andinnovative ways of dealing with risk and establishing collateral to secure loans.
• Subsidies have played an important role in micro hydro development. Thesynthesis suggests that there are clear characteristics for the use of ‘smartersubsidies’ that are market promoting rather than market destroying. These aredescribed.
• The case study countries illustrate many characteristics of the ‘enablingenvironment’ necessary for micro hydro systems to thrive. It appears that thereis not a clear strategy for the role of micro hydro in energy sector developmentor in increasing access of marginalized people to the energy services required forrural development.

xii
• It was not the purpose of the case studies to establish the poverty impact ofmicro hydro. Whilst the case looks strong it has not yet been rigorouslydocumented.
• The poverty and gender impact of micro hydro would appear to be highlydependent on the choice of the end-uses to which the power is applied.

xiii
ABBREVIATIONS AND ACRONYMS
ACAP Annapurna Conservation Area ProjectADBN Agriculture Development Bank of NepalADF African Development FoundationAID Agency for International DevelopmentCAPS Consultancy and Professional ServicesCCFT Cold Comfort TrustCCO Canadian Co-operation OfficeCEB Ceylon Electricity BoardCRT Centre for Renewable TechnologiesDCS Development Consultancy ServicesDFID Department for International DevelopmentECS Electricity Consumer SocietyELC Electronic Load ControllerENDA-TW Environment and Development - Third WorldETC Electricity Tariff CommissionESD Energy Services DeliveryFAO Food and Agriculture OrganisationFGCPC Fondo General Contravalor Peru CanadaGAA German Agro Action AidGEF Global Environment FacilityGOSL Government of Sri LankaHH HouseholdICIMOD International Centre for Integrated Mountain DevelopmentICS Improved Cooking StoveIDC Integrated Development ConsultantsIGC Induction Generator ControllerIRR Internal Rates of ReturnIRRci Internal Rates of Return on Capital InvestedITDG Intermediate Technology Development GroupITSL Intermediate Technology Sri LankaIWRA International Water Resources AssociationKMI Katamandu Metal IndustriesKSM Kwazai SimukaiMCB Miniature circuit breakerMH Micro hydroMHP Micro hydro powerMOWR Nepal the Ministry of Water ResourcesNEA Nepal Electricity AuthorityNGDG Northern Gorkha Development GroupNGO Non-Governmental OrganisationNHC Nyafaru Hydro CommitteeNMSS Nepal Machine and Steel StructureNTH Norwegian Institute of TechnologyODA Overseas Development AgencyPV PhotovoltaicsRADC Remote Area Development Committee

xiv
SADC Southern Africa Development CommunitySLEMA Sri Lanka Energy Managers AssociationTV TelevisionUK United KingdomUNDP United Nations Development ProgrammeUS United StatesVDC Village District CommitteeVH Village hydroWB World BankWEDS Water Energy and Development ServicesZERO Zimbabwe Energy Research OrganisationZESA Zimbabwe Electricity Supply Authority
UNITS
A Ampereskm KilometreKVA Kilovolt AmperekW KilowattkWh Kilowatt-hourm MeterRs RupiesV VoltsW WattsZ$ Zimbabwe dollar

1
1
INTRODUCTION
1.1 The Place of Micro Hydro
Micro hydro, defined as a plant between 10 kW and 200 kW, is perhaps the most matureof the modern small-scale decentralised energy supply technologies used in developingcountries. There are thought to be tens of thousands of plants in the ‘micro’ rangeoperating successfully in China 2, and significant numbers are operated in wide rangingcountries such as Nepal, Sri Lanka, Pakistan, Vietnam and Peru. This experience showsthat in certain circumstances micro hydro can be profitable in financial terms, while atothers, unprofitable plants can exhibit such strong positive impacts on the lives of poorpeople and the environment that they may well justify subsidies.
The evidence from this extensive experience shows such wide variation in terms of cost,profitability and impact, that it has often been difficult for investors and rural people todetermine whether, and under what circumstances, this technology is viable and bestmeets their needs.
Whilst supplying improved energy services to people for the first time is difficult,supplying such services profitably to very poor people who live far away from roadsand the electricity grid poses a particularly difficult challenge. This report shows thatmicro hydro compares well with other energy supply technologies in these difficultmarkets. Despite this micro hydro appears to have been relatively neglected by donors,the private sector and governments in the allocation of resources and attention. In thepast, rural electrification by means of grid extension was the option favoured by donors.More recently the fashion has switched towards photovoltaics, probably because of itshigher foreign content, and the higher added value returned to the metropolitancountries.
The relative neglect of micro hydro has also been in part due to the fact that thecircumstances under which it is financially profitable have not been systematicallyestablished, at least not in ways that investors find credible. In addition, while it isknown that the growth and sustainability of the micro hydro sub-sector depends oncertain types of infrastructure and institutional investments, it was often not clear whichelements of this ‘enabling environment’ were essential, nor how they were bestfinanced.
2 In 1979 the total generating capacity of all small plants was 6300 MW, with 40,000 stations built in the period from1975 to 1979 having an average size of 85 kW. Ian Juang, draft document on micro power in China, to be submittedfor an MSc dissertation, Oxford University, October 1999.

2 Best Practices for Sustainable Development of Micro Hydro Power
This study attempts to rectify these omissions by analysing and then synthesising theexperience of micro hydro over many years, across a broad range of developingcountries. Primary evidence was obtained from Peru, Nepal, Sri Lanka, Zimbabwe andMozambique. On the basis of this evidence an attempt has been made to establish ‘BestPractice’ in terms of the implementation and operation of sustainable installations.
National teams, usually consisting of an independent consultant and a staff member ofThe Intermediate Technology Development Group, carried out the work using acommon methodology developed at the start of the work. National reports were writtenseparately and were subject to review at national workshops involving the key actors inthe sector.
The microanalysis sought to examine a sample of specific installations. The sample wasdrawn from comprehensive databases of micro hydro plants in each of the fivecountries. It was selected using a typology which combined end-uses (productive uses,electricity for lighting, combined end-uses, etc.) with types of ownership (community-led projects, projects implemented by central bodies such as the utilities, and projectsinitiated by private entrepreneurs).
Table 1-1: Summary Table Showing the Sample of Projects Studied In Detail
Community-ledprojects
Top Down-led projects ( utilities )
PrivateEntrepreneur
Total
Shaft power only Zimbabwe (1) Mozambique (2) 3
Electricity fordomestic end uses andservices
Sri Lanka (2)KandaloyaPathavita
Peru (2)Pedro RuizPucará
4
Lighting andproductive uses ofelectricity
Zimbabwe ( 1)Nepal ( 1)Peru (2)Sri Lanka (1)
Nepal ( 3)Sri Lanka (1)
9
TOTAL 8 2 6 16* The numbers in brackets show the number of schemes per country.
Although Zimbabwe and Mozambique have relatively few micro hydro plantsoperating, it was decided to include them in the sample to illustrate some of the specialissues that are faced by countries trying to start programmes. The implication of thisexperience for other countries is brought together in Section 4.14.
1.2 The Differing Objectives of Micro Hydro Development
One of the most important findings to emerge from the study of this experience is thatmicro hydro plants can achieve a wide range of quite different objectives. Muchconfusion and misunderstanding arises when all micro hydro plants are treated as ahomogenous category. Analytically it is therefore important to judge the viability ofeach micro hydro investment in terms of a specific objective. Similarly in theformulation of government or donor policy, it is important not to expect micro hydro toachieve many, often conflicting, objectives. For instance, it is not possible to provide

Introduction 3
electricity to very poor people in remote locations through micro hydro and make areturn on capital similar to that achieved in London capital markets.
1.3 Technology Demonstration, Social Infrastructure, or Small Enterprise?
The field of micro hydro is ‘evolving’, particularly in relation to the motivation ofproject developers. Recently the majority of initial installations in each country mightbe said to be the result of a ‘technology push’. That is, plants were installed to test theirtechnical viability and their acceptability. This experience has established the technicalreliability of the micro hydro systems, reduced their cost, and has resulted in substantialtechnical improvement. Micro hydro is now a mature technology that has been greatlyimproved by electronic load controllers, low cost turbine designs, the use of electricmotors as generators3, and the use of plastics in pipe work and penstocks.
The next group of projects is characterised by investments in micro hydro that wereseen as part of the ‘social infrastructure’ more akin to the provision of health services,roads or schools. Due to their social objectives, these experiences have often generatedlittle information on the capital and operating costs or cash flow returns of theinvestment, particularly of a form and quality that would be regarded as reliable bypotential investors in conventional financial institutions. Indeed many of the promotersof this type of project justify their work solely in terms of contributions to social justice,the quality of life of marginalized people, and to the environment. In Sri Lanka, forinstance, many micro hydro plants have been installed primarily to “improve the qualityof life by providing electric light4”. In Peru the key question for many projectdevelopers was “how long will the plant last”, rather than “how high is its rate ofreturn”, or “how quickly the capital will be paid back”5.
More recently support programmes have returned to what might be called an oldervision what might be considered an earlier approach, where micro hydro is seenprimarily in terms of securing livelihoods and for the development of small profit-making businesses. This can be seen in part as an admission that, like the previousattempts at rural electrification through grid extension, the sustainability of grant-basedprogrammes is limited. Methods must be established to attract private capital if theseprogrammes are to have anything but a marginal impact. Nepal has shown that small,almost subsistence businesses can survive using micro hydro power to mill grain. Over900 micro hydro plants had been installed in Nepal by 1996, and over 80% of thesewere for grinding grain. In recent years there has been quite a rapid take-up of the small(1 kW) ‘peltric’ sets for generating small amounts of electricity. Introduced in the early1990’s, there were said to be over 250 operating in the first five years6.
These very different starting points, along with the performance indicators used toevaluate projects, have important implications for what is regarded as a success. Microhydro as ‘social infrastructure’ uses the approaches and indicators appropriate toschemes for the supply of drinking water, health clinics and schools. Micro hydro as‘physical infrastructure’ uses the approaches applied to electric power generation moregenerally, and to such investments as the provision of roads and irrigation systems. 3See for instance Nigel Smith, Motors as Generators for Micro Hydro Power , 1994, Intermediate TechnologyPublications, London, ISBN 1 85339 286 34 Sri Lanka Report, Section 3.4.5 Peru Report, Section 1.1.6 See Nepal Report.

4 Best Practices for Sustainable Development of Micro Hydro Power
Even more recently micro hydro has been seen in terms of small and medium enterprisedevelopment, and the role that such enterprises can play in ‘securing livelihoods’.
There is little to be gained from arguing that one approach is superior to another, as inall probability each strand has a role to play. But failure to distinguish these verydifferent motivations has lead to confusion and ineffective policy advice. Eachapproach is associated with very different mindsets of the people involved, and thediffering objectives will result in quite different management7, allocation of resources,approaches and even site selection.
1.4 Hard Choices Have To Be Made in the Allocation of Scarce Resources
Investments that are primarily intended to increase the adoption of micro hydro arelikely to need to be financially viable and will therefore be located where there areconcentrations of effective demand, or there are so-called ‘anchor customers’ who canpay for the bulk of the power supplied. This might include sales to the grid wherepossible and profitable. Programmes that are intended primarily to increase the ‘access’of specific groups of people to improved energy supplies are likely to be located wherepoor live. This will frequently be in more remote areas that will not be reached by thecentral grid for some time, if ever, where all other options will also be expensive butwhere micro hydro is the least cost8.
Examples of the strategy to increase sales, regardless of their income or need, can befound in a number of renewable energy programmes, particularly in photovoltaics.Here it is argued that increased sales will reduce the cost of production, and moreimportantly, enable the overhead costs of providing technical support and supplying‘retail’ credit to be spread over a larger number of unit sales. The danger is that some ofthe soft money that is intended for social investment is used to subsidise the costs ofthese supply options for those who can already afford to pay for it.
A key dimension of the trade-off is that the benefits and burdens of the choices madefall on different social groups. The people who can pay the full cost of energy supplyoften reside in different parts of the country from those with the greatest need. Thismeans that if concepts of fairness are introduced to government policy or, moregenerally, into the allocation of resources, micro hydro is likely to have an importantrole in spreading access to electricity, even if the users cannot pay the full cost. Thereview of programmes in Nepal and Sri Lanka both suggest that they have both beenexplicitly motivated by ideas of social justice and fairness. Certainly rural people inmany countries can be expected to ask why they should not they be entitled to the levelsof subsidy provided to urban dwellers.
Micro hydro developers and the financial institutions that they work with have to makechoices between these two extremes of profitability and social impact. There is likely tobe a middle ground where social impacts can be achieved profitably, but its size is notyet known. What is clear, is that many rural people will remain without electricityunless there is some sort of redistribution of income from urban to rural areas.
7 See Peru Report, Section 5.8 See Peru Report, “there is no guarantee that electrification exclusively under the private sector would increase theelectrification rate, although it would increase energy consumption …due to the relatively high consumption of aminority”.
Introduction 5
There is a parallel here with arguments between the advocates of micro hydro andMinistries of Energy and their conventional utilities. Proponents of micro hydro areoften disappointed that utilities will not take them seriously. Certainly micro hydrooften faces unfair competition from a highly subsidised grid, and from subsidised fossilfuels. But, there is a genuine trade-off between maximising the access of people to‘efficient and affordable energy’, and doing so in those places where micro hydro (andother renewable energy) is the least cost. The scarce resource is not energy, but thecapital to make energy accessible. If the objective is to provide electricity to as manypeople as possible rather than to distribute electricity evenly across the country, themost effective way of doing it may well be through extensions of the grid, or morelikely ‘intensification’ of the use to which the grid is put. Similarly where utilities havevery severe limits on capital, the ‘opportunity cost’ of capital at the margin rises to veryhigh levels, explaining perhaps why they then opt for diesel generators rather than hydrowith its higher initial capital cost..
1.5 The Main Forms Of Support – Extending the Concept Of‘Intermediation’
The case studies show that a wide range of actions have to be brought together to ensurethe success of micro hydro investments. These actions take place a various levels: at themicro level of particular investment in a hydro plant at a particular location; at themacro level of policy formulation; and in the design and implementation of programmesof financial and other support mechanisms.
In undertaking the case studies, it was found that the idea of ‘intermediation’ offered aconvenient way to group the many hundreds of tasks that were identified as necessary.This provided considerable analytical insight about how policies might be developed toensure that these tasks were indeed performed and integrated into the costings. Theapproach extends the idea of ‘financial intermediation’ and considers three additionalforms of intermediation, namely technical intermediation, social intermediation andorganisational intermediation.
Financial Intermediation involves putting in place all the elements of a financialpackage to build and operate a micro hydro plant. A process sometimes referred to as‘financial engineering’. It covers:
• the transaction costs of assembling the equity and securing loans;• obtaining subsidies;• the assessment and assurance of the financial viability of schemes;• assessment and assurance of the financial credibility of borrower;• the management of guarantees;• the establishment of collateral (‘financial conditioning’); and• the management of loan repayment and dividends to equity holders.
Financial Intermediation can also be used to cover whole schemes rather than justinvestment in an individual plant. In this way projects can be ‘bundled’ together tomake them attractive to finance agencies, to establish the supply of finance on a‘wholesale’ basis from aid agencies, governments, and development banks, and tocreate the mechanisms to convert it into a supply of retail finance (equity finance, andloan finance at the project level).

6 Best Practices for Sustainable Development of Micro Hydro Power
Technical Intermediation involves the ‘upstream’ work of improving the technicaloptions by undertaking R and D and importing the technology and know-how, ‘down’through the development of the capacities to supply the necessary goods and services.These goods and services include: site selection; system design; technology selectionand acquisition; construction and installation of civil, electro-mechanical and electricalcomponents; operation; maintenance; Trouble Shooting; overhaul; and refurbishment.
Organisational Intermediation involves not only the initiation and implementation ofthe programmes, but also the lobbying for the policy change required to construct an‘environment’ of regulation and support in which micro hydro technology and thevarious players can thrive. This involves putting in place the necessary infrastructure,and getting the incentives right to encourage owners, contractors, and financiers.
The case studies show that this organisational intermediation is also usefullydistinguished from the Social Intermediation. Social Intermediation involves theidentification of owners and beneficiaries of projects and the ‘community development’necessary to enable a group of people to acquire the capabilities to take on and run eachindividual investment project.
1.6 The Importance of the Technology
While the rest of this is report focuses mainly on the ‘software’ of finance, managementand social development, it would not be right to end this introduction without stressingthe importance of the hardware and engineering skills in the success of micro hydrodevelopment. The experiences reviewed here repeatedly confront the need to get thetechnology right, and develop the technical skills necessary to build, install, operate andmaintain the equipment and the associated civil works.
A study on the functional status of the state of existing micro hydro plants in Nepal9
emphasises the point. Despite much work on manuals, standards, training, andcorrecting faulty engineering and associated errors, the physical assets remain asubstantial cause of failure. A study on the functional status of the state of existingmicro hydro plants in Nepal10 emphasises the point that despite much work on manuals,standards and training, faulty engineering and associated errors, the physical assetsremain a substantial cause of failure. Some 30% of the installations were not operating,due in part to:
• Poor site selection, inadequate/inaccurate surveys, wrong size, poorinstallation, faulty equipment;
• Plants affected by floods and land slides;• Poor estimation of hydrology, in part due to surveys being conducted in the
rainy season;• Uneconomic canal length, bad canal design;• Neglect of civil works;• Inability of owners to replace generators after breakdown; and
9 Earth Consult (P.) Ltd, 'A Report of Random Sample to Determine Actual Status of Private Micro Hydro PowerPlants in Nepal' , ICIMOD-ITDG Nepal, May 1998.10 Earth Consult (P.) Ltd, 'A Report of Random Sample to Determine Actual Status of Private Micro Hydro PowerPlants in Nepal' , ICIMOD-ITDG Nepal, May 1998.

Introduction 7
• Wrong estimation of raw materials, of demand, of end-use possibilities,oversized plants, over-estimation of tariff collection, inappropriate rates,ignorance of competition with diesel11.
Furthermore, there are still anumber of unresolved technicalissues. In particular there is atrade-off between the quality(and therefore the costs) of thecivil works and the resultingcosts of operation andmaintenance. Low cost civilworks tend to be swept away bythe monsoon rains and have tobe substantially repaired eachyear. It is not yet clear wherethe optimum balance liesbetween these two types ofcost12.
Turbine Manufacturing in Sri Lanka
11 See also Wolfgang Mostert, 'Scaling-up Micro Hydro, Lessons from Nepal, and a few Notes on Solar HomeSystems', Village Power 98 Conference, NREL/ World Bank, Washington October 6-8, 1998.12 Wolfgang Mostert, personal communication .
ITD
G
E3
Sri
Lank
a J6
.20


9
2
THE COST OF MICRO HYDRO AND ITS FINANCIALPROFITABILITY
2.1 The Cost Per Kilowatt Installed
In the examples examined in the five countries, the capital cost13 of micro hydro plants, limitedto shaft power, ranged from US$714 (Nepal, Zimbabwe) to US$1,233 (Mozambique). Theaverage cost is US$965 per installed kW which is in line with the figures quoted in somestudies. The installed costs for electricity generation schemes are much higher. The installedcost per kW ranged from US$1,136 (Pucará, Peru) to US$5,630 (Pedro Ruiz, Peru) with anaverage installed cost of US$3,085. The data for the complete sample and detailed summary ofthe financial analyses of the 16 sample projects is provided in the annex to this report.
An important observation is that the cost per installed kilowatt is higher than the figures usuallycited in the literature. This is partly due to the difficulty analysts have in establishing full costson a genuinely comparative basis. A significant part of micro hydro costs can be met withdifficult to value labour provided by the local community as ‘sweat equity’. Meaningful dollarvalues for local costs are difficult to establish when they are inflating and rapidly depreciatingrelative to hard currencies. In addition, there is little consistency in the definition of boundariesof the systems being compared, for instance, how much of the distribution cost, or housewiring, is included, how much of the cost of the civil works contribute to water managementand irrigation, and so forth.
In this study very great care was taken to produce estimates of the actual costs on a rigorouslycomparable basis. It is for example of paramount importance to distinguish between schemeslimited to mechanical power only and schemes which include electricity generation.
As with any de-centralised energy supply system, the comparison of actual costs at the ‘micro’level of individual plants can also be misleading. Successful programmes require investmentsin the systems necessary for training, repair, and marketing. The critical issue is that thesetasks exhibit substantial economies of scale in that the cost per micro hydro plant installed fallsas the number of plants increases. Comparisons based on average costs will therefore bestrongly influenced by the number of plants built.
Estimates of these ‘macro’ costs associated with developing and supporting a programme –sometimes referred to as “system overhead costs”14 are also difficult to establish, particularly asmany of the costs associated with Research and Development and the training of engineeringworkshops are ‘sunk costs’ which took place over many years.
13 All monetary values in US$1998 unless specified.14 These activities were first identified as “system overhead costs” in the late 1980’s, see A Barnett, The Diffusion of EnergyTechnologies in the Rural Areas of Developing Countries: A Synthesis of Recent Experience, World Development, PergamonPress, Vol. 18, No. 4, April 1990, pp.539-553.

10 Best Practices for Sustainable Development of Micro Hydro Power
Table 2-1: Summary of Financial Returns on Sample Micro Hydro Plants AfterFinancing
Cost per kW including transmission (US$1998)
Year ofInstallation
CapacitykW
Cost perinstalled kW
IRRCI % IRR % End-uses
( main end use cited first)
Sri Lanka cur con* cur con
Katepola 1994 35 $2,181 14.7 8 No return Electricity for domestic enduses and services
Kandal Oya 1997 10 $3,115 15 9.3 10 6.9 Electricity for domestic enduses and services
Pathavita 2 1997 10 $2,203 32 16.3 6 3.1 Electricity for domestic enduses and services
Seetha Eliya 1983 60 $3,761 24 12.4 24 12.4 Tea factory. Electricity fordomestic end uses
Nepal cur con cur con
Barpak 1992 50 $2,345 33 27 22.8 17 Mechanical power (millingetc); Electricity for domesticend uses
Gorkhe(Rupatar)
1984-6 25 $714 42 32 17.4 4 Mechanical power (millingetc); Electricity for domesticend uses
Ghandruk 1985-8 50 $2,446 10.48 1 No return Electricity for domestic enduses; Mechanical power(milling etc);
Gaura 1987 25 $2,277 13.2 3 7.39 NA Mechanical power (millingetc); Electricity for domesticend uses
Peru cur con cur con
Atahualpa 1992 35 $2,358 NA 17.5 14.5 Electricity for domestic enduses and services;Mechanical power
Yumahual 1998 11 $3,371 NA 17.6 14.6 Electricity for incubatingplant
Pedro Ruiz 1980 200 $5,630 NA No Return Electricity for domestic enduses and services
Pucará 1986 2x200 $1,136 NA 7 3 Electricity for domestic enduses and services
Zimbabwe cur con cur con
Nyafaru 1995 20 $3,307 Grant 8 NA Electricity for domestic enduses and services
Svinurai 1993 13 $715 Grant 48 20 Mechanical power only(grain milling)
Mozambique cur con cur con
Elias 1996 15 $1,200 NA insufficientaccuratedata
Mechanical power only(grain milling)
Chitofu 1995 15 $1,233 insufficientaccuratedata
Mechanical power only(grain milling)

The Cost of Micro Hydro and its Financial Profitability 11
• All currencies in $1998 unless specified.• *Calculations carried out in constant dollars 1998.• In current local currencies apart from Peru and Mozambique which are in current US$.• N/A applies where the project was funded entirely or to a large extent from non-reimbursable external
sources, the IRR on capital invested is extremely high.• The results regarding the internal rate of return (IRR) and the return on capital invested refer to
calculations after financing, when loans were taken up.• IRR for Mozambique were not calculated due insufficient accurate data.• For schemes where the producer is also the only consumer (ex. Yumahual in Peru, Seethe Eliya in Sri
Lanka) the analysis assumes that the production is sold at the opportunity cost of electricity generated by acredible alternative, either the grid or diesel.
2.2 Wide Variation in Costs
The variations in capital costs have a number of explanations. While common-sense suggeststhat micro hydro is likely to experience some economies of scale in the size of each plant15, thiscannot be concluded from this particular sample. The main explanation appears to lie in thetwo types of project, namely: schemes designed to provide mechanical power for productiveactivities such as agro-processing; and schemes for which the bulk of the production is tosupply electricity for domestic end-uses and services. The investment cost for mechanicalpower is relatively low (US$714 to US$1,233), as there are no transmission lines, connections,or generator. The lowest cost per kilowatt installed were found in Gorkhe, originally built tosupply mechanical power, Svinurai, Chifotu and Elias which supply mechanical power only.
Figure 2-1 Installed Cost per kW (US$1998)
Electricity generation schemes, as expected have a higher installed cost per kW. there are alsosome differences between countries and even within the same country which might beexplained by the following parameters: 15 Economies of scale arising from the size of each individual plant should not be confused with economies of scale associatedwith the size of the programmes supporting micro hydro expansion discussed in Section 2.1.
0
1000
2000
3000
4000
5000
6000
Mechan power
Electricity
US$ per kW

12 Best Practices for Sustainable Development of Micro Hydro Power
• Site characteristics;• Transport to site (in Nepal transport is said to constitute 25% of total costs16);• The labour content, and the wide variation between the cost of labour in the countries
studied;• Standards17;• Sizing (municipal plants in Peru were often over sized); and• Transmission and distribution costs.
A major conclusion can be drawn from this: Costs are highly site specific, are controllable withgood management, proper sizing and appropriate standards.
Two other issues emerge from this analysis of costs. In addition to the costs identified here forsupplying energy, all systems also require substantial investment in end-use technologies tomake the supplied energy useful.
Furthermore, a major advantage of micro hydro is that it can be built locally at considerablyless cost than it can be imported18, and the costs of local manufacture can be reduced stillfurther by developing local engineering capabilities and advisory services. For instance in SriLanka imported turbine generating sets up to 100 kW cost approximately Rs.50,000 toRs.150,000 (US$700-US$2,000) per kW, while the local manufacturers are now capable ofdelivering them at Rs.10,000 to Rs.15,000 (US$140-US$200) per kW, with marginally reducedturbine efficiencies19.
2.3 How Do the Costs of Hydro Compare with Other Options?
The picture seems quite favourable to micro hydro. When bringing improved energy servicesto poor people is the priority, the focus moves to the type of energy services they require andtheir locations. If minimum lighting is the only energy end-use required in remote locations,photovoltaics may be the main alternative, being cheaper than dry cell batteries, and capable ofproducing a better light than kerosene. Where falling water is available, micro hydro compareswell with photovoltaics. In Peru the cost of 50-Watt systems (modules, regulator, battery, 3lamps, other components and installation) is said to be $1,02020. In South Africa it is currentlysuggested that the unsubsidised delivered cost of Solar Home systems is approximatelyUS$625 for a 50 Watt system (including battery, controller, wiring and 4 lights), giving aUS$10/month break even cost using money at 14% real21. This is equivalent to about $12,500per kW and would therefore appear to be much more expensive than the cost of the mostexpensive electricity from micro hydro.
Fossil fuels (particularly kerosene) will remain the main alternative to biomass fuel for poorpeople, as it can be purchased in the tiny quantities and for the small sums of money that aremost consistent with poor people’s cash availability22. Micro hydro, like many other
16 World Bank, Rural Energy and Development, page 51.17 Tampoe notes that early schemes spent about Rs. 2,000-3,000 on household wiring per household but this increased to Rs.4,000-8,000 in later schemes in 1996/7 where the CEB standards were applied (Tampoe, M., 1998, unpublished report toITDG pp140).18 However, very inexpensive (but possibly unreliable) micro hydro equipment is sometimes available from China and othercountries that are keen to obtain foreign exchange at almost any price.19 Sri Lanka Report Section 5.3.20 Peru Report.21 Personal observation, 1999.22 It is perhaps important to note, in passing, the favourable environmental consequences of using kerosene. Professor KirkSmith and others have shown that a switch from biomass to kerosene and LPG as a cooking fuel would result in a considerable
The Cost of Micro Hydro and its Financial Profitability 13
decentralised renewable energy options, are characterised by high initial capital costs (certainlyhigher than diesel systems) which are offset to some extent by relative low recurrent costs.This means that ‘entry costs’ are likely to be beyond the reach of poor people, even if thelifetime costs of these options is lowest23.
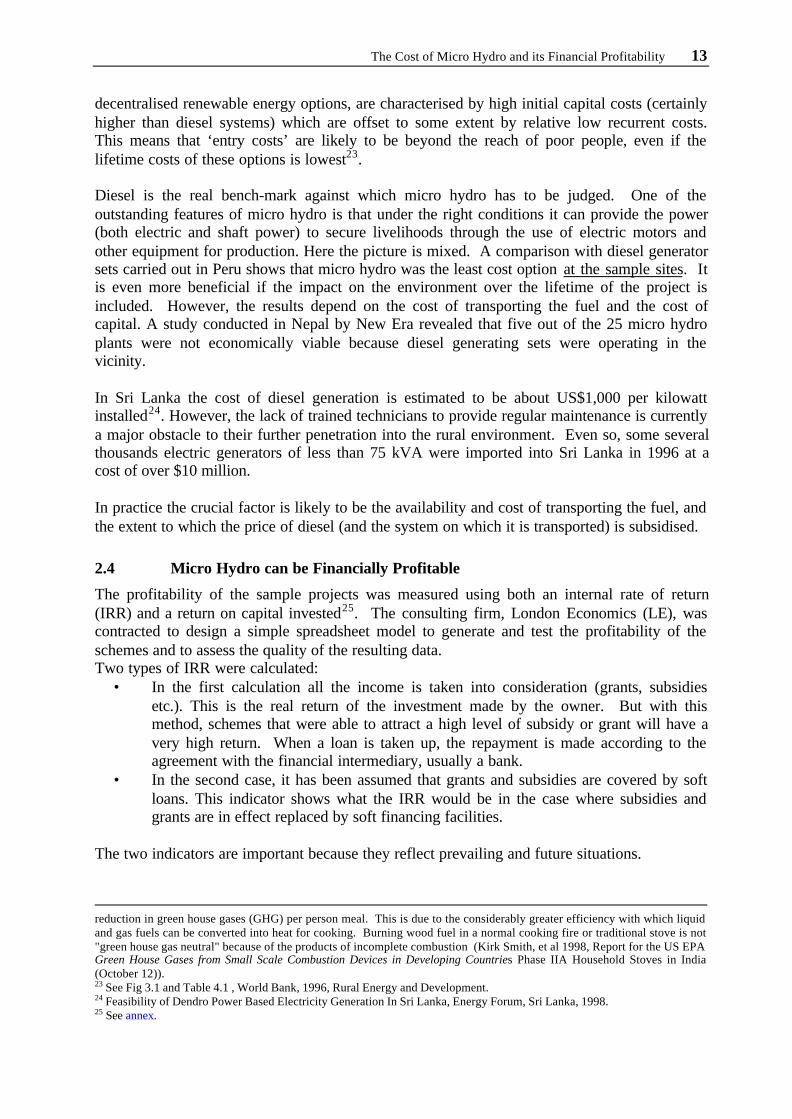
Diesel is the real bench-mark against which micro hydro has to be judged. One of theoutstanding features of micro hydro is that under the right conditions it can provide the power(both electric and shaft power) to secure livelihoods through the use of electric motors andother equipment for production. Here the picture is mixed. A comparison with diesel generatorsets carried out in Peru shows that micro hydro was the least cost option at the sample sites. Itis even more beneficial if the impact on the environment over the lifetime of the project isincluded. However, the results depend on the cost of transporting the fuel and the cost ofcapital. A study conducted in Nepal by New Era revealed that five out of the 25 micro hydroplants were not economically viable because diesel generating sets were operating in thevicinity.
In Sri Lanka the cost of diesel generation is estimated to be about US$1,000 per kilowattinstalled24. However, the lack of trained technicians to provide regular maintenance is currentlya major obstacle to their further penetration into the rural environment. Even so, some severalthousands electric generators of less than 75 kVA were imported into Sri Lanka in 1996 at acost of over $10 million.
In practice the crucial factor is likely to be the availability and cost of transporting the fuel, andthe extent to which the price of diesel (and the system on which it is transported) is subsidised.
2.4 Micro Hydro can be Financially Profitable
The profitability of the sample projects was measured using both an internal rate of return(IRR) and a return on capital invested25. The consulting firm, London Economics (LE), wascontracted to design a simple spreadsheet model to generate and test the profitability of theschemes and to assess the quality of the resulting data.Two types of IRR were calculated:
• In the first calculation all the income is taken into consideration (grants, subsidiesetc.). This is the real return of the investment made by the owner. But with thismethod, schemes that were able to attract a high level of subsidy or grant will have avery high return. When a loan is taken up, the repayment is made according to theagreement with the financial intermediary, usually a bank.
• In the second case, it has been assumed that grants and subsidies are covered by softloans. This indicator shows what the IRR would be in the case where subsidies andgrants are in effect replaced by soft financing facilities.
The two indicators are important because they reflect prevailing and future situations.
reduction in green house gases (GHG) per person meal. This is due to the considerably greater efficiency with which liquidand gas fuels can be converted into heat for cooking. Burning wood fuel in a normal cooking fire or traditional stove is not"green house gas neutral" because of the products of incomplete combustion (Kirk Smith, et al 1998, Report for the US EPAGreen House Gases from Small Scale Combustion Devices in Developing Countries Phase IIA Household Stoves in India(October 12)).23 See Fig 3.1 and Table 4.1 , World Bank, 1996, Rural Energy and Development.24 Feasibility of Dendro Power Based Electricity Generation In Sri Lanka, Energy Forum, Sri Lanka, 1998.25 See annex.

14 Best Practices for Sustainable Development of Micro Hydro Power
All IRR were calculated after financing. When a scheme was almost entirely financed bygrants and subsidies, it has been assumed that the scheme was financed by a soft loan, at rateswhich vary between the countries in which the plant is located. The IRR were calculated incurrent and constant US dollars. Assumptions were made about what the inflation rate wouldbe for the lifetime of those schemes that were implemented only recently .
Experience across the study countries shows a wide range of financial profitability26 and someinteresting common features. The microanalysis reveals that there are plants that can be runprofitably without subsidy. These are the projects with a constant price rate of return of morethan 8%. These plants are Seetha Eliya (12.4%), Barpak (17%), Atahualpa (20.5%) Yumahual(14%) and Svinurai (20%), plus possibly the two mechanical plants in Mozambique 27. Allthese tend to be the plant installed initially or solely to produce mechanical power for aprofitable end-use such as milling.
Where plants are used exclusively for electric lighting, operating costs can usually be coveredby electricity sales, but the capital costs will have to be subsidised by grants.
The analyses in current prices inevitably have higher IRR than those in constant prices. This isbecause tariff setting is often very poor and therefore the price of electricity is not beingadjusted to keep pace with the rate of inflation. An important conclusion of the review is,therefore, that the financial return of many of the projects could have been improvedconsiderably if the tariffs had been adjusted merely to keep level with inflation. This isparticularly the case in Seetha Eliya in Sri Lanka and Svinurai in Zimbabwe (see Table 2.1).
Figure 2-2: IRR Without Subsidy
At a more fundamental level, variation in financial performance of the projects reviewed wasdue to variation in load factor. High load factors were achieved in schemes supplyingmechanical power or electricity to motors rather than those installed primarily for lighting.Lighting for 4-5 hours a day can theoretically give maximum plant factors in the order of 0.15to 0.20. This is indeed the typical plant factor for many micro hydro plants examined. InNepal 90 % of the schemes are supplying mechanical power. These schemes have a betterprofitability and can be financially sustainable in remote locations. 26 As a result of some gaps in the data and assumptions made, the internal rates should be seen a broad indicators and trends,rather than precise returns actually achieved in each plant. (See annex for details.)27 Due to insufficient accurate data, we did not include the IRR for the two Mozambican schemes investigated.
IRR without subsidy
0
10
20
30
40
50
60
IRR current
IRR constant
%

The Cost of Micro Hydro and its Financial Profitability 15
The micro hydro industry appears, therefore, to be faced with a particularly difficult paradox.Most of the financially viable installations provide mechanical power to productive enterprises,but the main demand from consumers in a number of countries appears to be for electriclighting.
Micro hydro is therefore most likely to be profitable or at least financially self-sustaining,where there is:
• a high load factor (the actual consumption as a proportion of total possible generation),• a financially sustainable end-use,• costs are contained by good design and management, and• effective management of the installations, including the setting and collection of tariffs
that keep pace with inflation.
2.5 Cash Generating End-Uses.
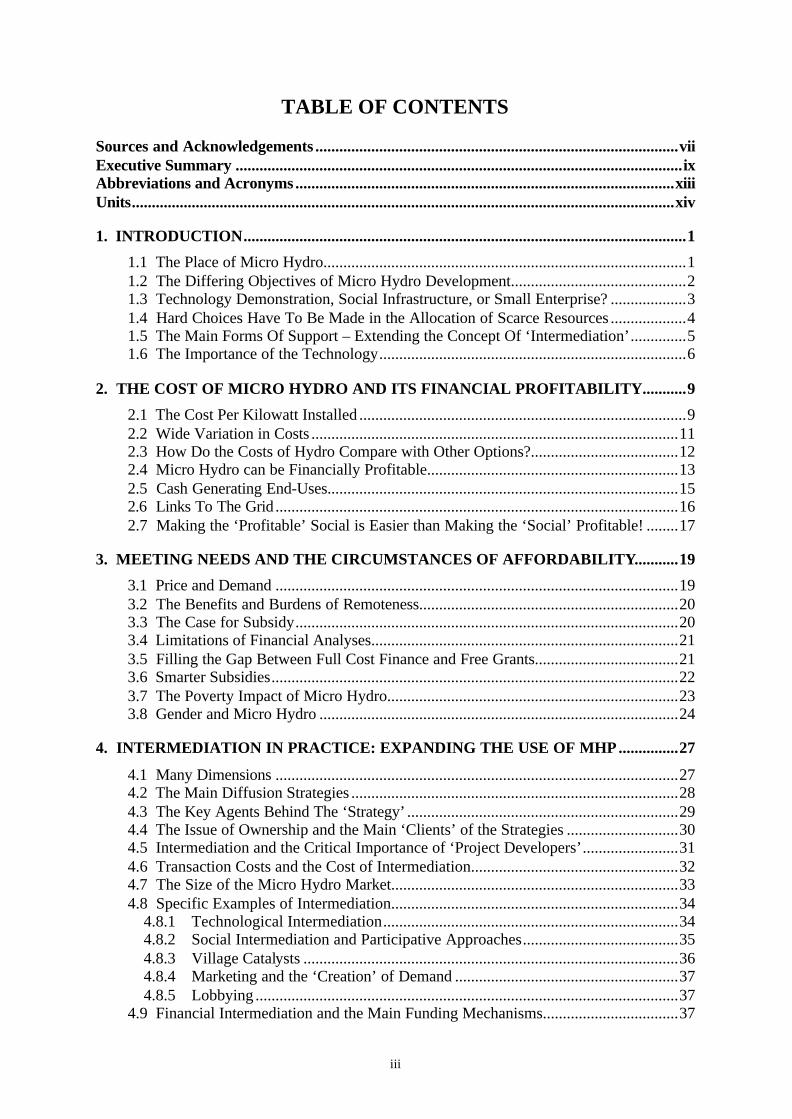
It is a truism to say that MHP is likely to be more financially viable if the electricity generatedcan be used to supply power to a profitable cash generating enterprise. The use of a single millfor a few hours per day can clearly raise plant load factors substantially. Furthermore thechoice of end-uses can have a profound effect on extending the benefits of micro hydro tohouseholds that cannot be connected directly to the system, either for reasons of cost orlocation. Such end-uses range from street lighting, access to public television, battery chargingcentres, to mills and other forms of agro processing. However, the studies show that suchenterprises are often difficult to develop. Combining new micro hydro installations with newincome generating enterprises that have a daytime use for hydro electricity in remote locationsis difficult, not least because local markets are small and isolated.
In discussions of this review in Sri Lanka, for instance, both practitioners and policy makerswere united in expressing their extreme scepticism about the creation of such enterprises. Theyargued that:
• Attempts to create electricity using enterprises in the past have tended to increasesocial tensions within the village and within the management of the ElectricityConsumer Societies that own the hydro plant. It is seen as offensive that the publicasset of water is being used to increase the power and wealth of an individual.
• Community-owned enterprises, such as rice mills, have often been too large in relationto the local small and isolated market, too costly in relation to the capital available inthe village and too difficult to manage in relation to the managerial capacities in thevillage. It is to assume away the problems of underdevelopment to assume that suchenterprises will start up spontaneously after the arrival of electricity.
• The support for small and micro enterprises that is offered in Sri Lanka is said to belimited and could not be assumed to be available to people or groups setting upbusinesses to use micro hydro plants.
16 Best Practices for Sustainable Development of Micro Hydro Power
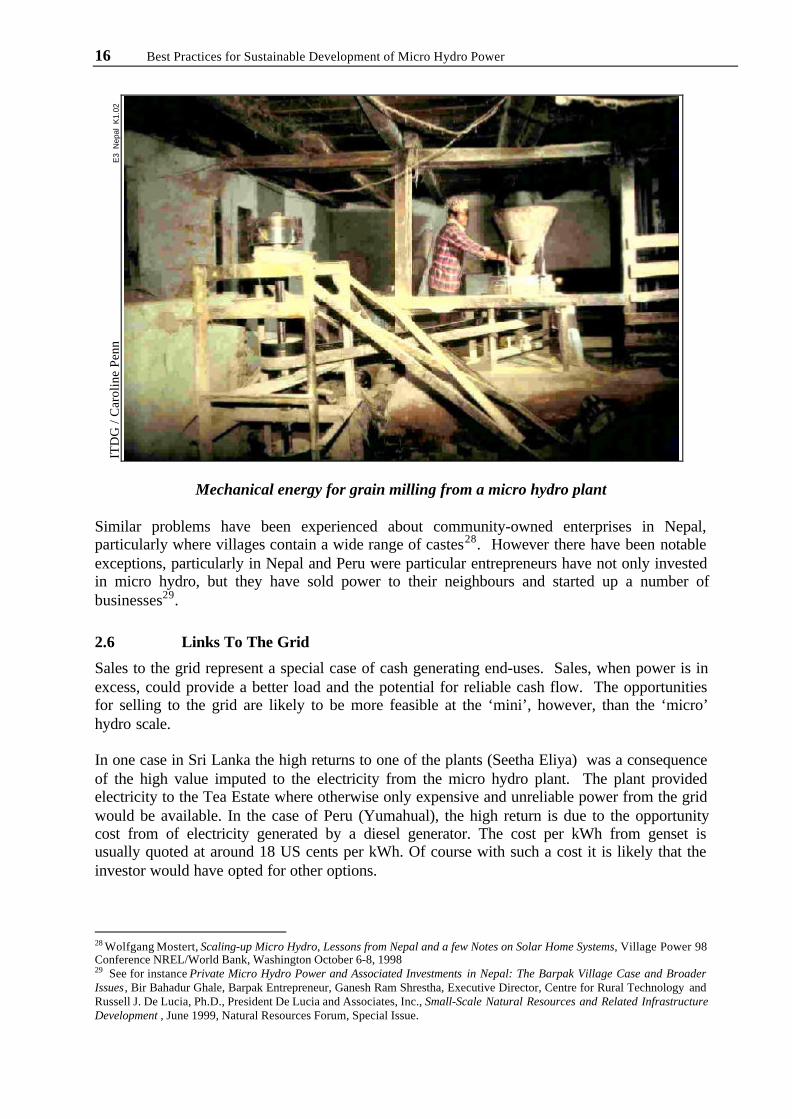
Mechanical energy for grain milling from a micro hydro plant
Similar problems have been experienced about community-owned enterprises in Nepal,particularly where villages contain a wide range of castes28. However there have been notableexceptions, particularly in Nepal and Peru were particular entrepreneurs have not only investedin micro hydro, but they have sold power to their neighbours and started up a number ofbusinesses29.
2.6 Links To The Grid
Sales to the grid represent a special case of cash generating end-uses. Sales, when power is inexcess, could provide a better load and the potential for reliable cash flow. The opportunitiesfor selling to the grid are likely to be more feasible at the ‘mini’, however, than the ‘micro’hydro scale.
In one case in Sri Lanka the high returns to one of the plants (Seetha Eliya) was a consequenceof the high value imputed to the electricity from the micro hydro plant. The plant providedelectricity to the Tea Estate where otherwise only expensive and unreliable power from the gridwould be available. In the case of Peru (Yumahual), the high return is due to the opportunitycost from of electricity generated by a diesel generator. The cost per kWh from genset isusually quoted at around 18 US cents per kWh. Of course with such a cost it is likely that theinvestor would have opted for other options.
28 Wolfgang Mostert, Scaling-up Micro Hydro, Lessons from Nepal and a few Notes on Solar Home Systems, Village Power 98Conference NREL/World Bank, Washington October 6-8, 199829 See for instance Private Micro Hydro Power and Associated Investments in Nepal: The Barpak Village Case and BroaderIssues , Bir Bahadur Ghale, Barpak Entrepreneur, Ganesh Ram Shrestha, Executive Director, Centre for Rural Technology andRussell J. De Lucia, Ph.D., President De Lucia and Associates, Inc., Small-Scale Natural Resources and Related InfrastructureDevelopment , June 1999, Natural Resources Forum, Special Issue.
ITD
G /
Car
olin
e Pe
nn
E
3 N
epal
K1.
02

The Cost of Micro Hydro and its Financial Profitability 17
In Sri Lanka the Ceylon Electricity Board (CEB) introduced the small Power PurchaseAgreements (PPAs) in 1996, and specified the prices they would pay for energy from gridconnected small power producers with generation capacities of up to 10 MW. These prices areset by the CEB on the basis of their avoided costs. Consequently the prices vary according tothe time of the year and the availability of water in large hydro reservoirs. These prices do notreflect the environmental costs and benefits from small hydro development. The profitabilityof this option clearly depends on the regulatory framework and the price that the utility isprepared to pay.
In 1999 the prices offered for the dry season were 4.6 US cents per kWh and in the wet season3.9 US cents per kWh30. This would appear to be in line with the average cost of production ofa properly run micro hydro plant and with a significant load factor.
Proximity to the grid nonetheless poses its own problems. For many rural people the presenceof grid electricity puts the purpose of a hydro plant into doubt. In Sri Lanka it is feared thatwhere an Electricity Consumer Society (ECS) is near enough to the grid to make the necessaryconnections the ECS members will abandon the MH power and buy directly from the grid at aprice that currently is below the cost of production. Similarly in Nepal a study carried out in1998 found that 38% of the 60 micro hydro plants reviewed were located within 10 km of thegrid (particularly in the Central Development Region) and this had an adverse effect on theirbusiness31.
Uncertainty about when the grid will arrive in a village, often as a result of politicians makingfalse promises prior to elections, considerably increases the risk of investing in a micro hydroplant. Such risks could be reduced by government or the utility developing a clear plan for gridextension, and making it publicly available. Similarly where the private sector is involved inextending central grids near to existing micro hydro plants, it will be important to have aregulatory framework that requires the grid to buy power from the hydro plant at a reasonableprice, or buy the plant at its depreciated value.
In Sri Lanka it is estimated that in general micro hydro will not be financially viable if thenational grid is available within 4 km to 5 km. The cost of grid extension is currently estimatedat US$7,200 per km of primary distribution lines.
2.7 Making the ‘Profitable’ Social is Easier than Making the ‘Social’ Profitable!
A clear lesson that emerges from the review at this stage is that projects that start out primarilywith social objectives find it very difficult to add on profitable end-uses. Micro hydroinvestments envisaged at the outset as primarily supplying power to a business venture canmore easily add on the provision of a social service such as lighting, or power for schools orhealth clinics.
30 Source: Government press notices, Daily News, Sri Lanka, various dates.31 Earth Consult (P) Ltd. in 1998.


19
3
MEETING NEEDS AND THE CIRCUMSTANCES OFAFFORDABILITY
3.1 Price and Demand
The cases show that micro hydro can be profitable, but they also show that when it is profitableit is not necessarily also affordable. A recent report from the World Bank confirms the viewheld by many people involved in the practical implementation of rural energy schemes when itsays that:
“It is illusory to expect that increasing access to electricity for a significant part ofthe population traditionally excluded from grid based electricity can be financedonly by the private sector”32.
The case studies support this view. Tariffs that are considered high in relation to localconditions can have a marked effect in choking off demand. In Peru, State owned micro hydroplants charge $10/month, and private companies charge $9/month. It was found that “althoughthe service is reliable, it is evident that the high rates (three times higher than those paid bycompanies run by communities or municipalities) restrict the service coverage”. At these ratesonly 50% of households can afford power compared to 70% of households buying frommunicipal plants charging lower rates33.
A Dutch funded scheme appears to have had a similar experience. The government of theNetherlands has been particularly innovative and an early supporter of decentralised energyoptions. But its assistance to micro hydro development in Peru does not appear to have beensuccessful. In an effort to push the schemes to a more financially sustainable orientation thescheme had very few takers prepared to borrow at rates of interest which were similar to thenormal (high) commercial rates34.
These experiences lead the Peruvian report to conclude that if the private sector were to takeover all rural electrification, they would tend to select the more profitable markets and expandonly slowly towards users with lower income using less energy. In their experience privateforms of ownership tend to be more sustainable in both financial and administrative terms, buttend to neglect service coverage. Similarly, municipal schemes tend to be less financiallysustainable, but when they work properly they tend to have a wider coverage.35
32 Best Practice Manual: Promoting Decentralised Electrification Investment, ESMAP World Bank, 1999, Page 10. (See thispage also for characteristics of Smart Subsidy.)33 See Peru Report, Section 5.34Tarnawiecki, Donald: Why is Dutch Aid Ineffective in Peru? In Renewable America No. 2, September 1997, PUC, Lima.35 Peru Report.

20 Best Practices for Sustainable Development of Micro Hydro Power
3.2 The Benefits and Burdens of Remoteness
Even if micro hydro were affordable to poor people with easy access to equipment, advice andcredit, it is certainly likely to be more expensive and more difficult for people in isolated ruralcommunities. This is particularly so for families that earn less than US$500 a year in areaswhere municipal resources are scant. They do not have sufficient information and contacts toidentify credit sources, credit terms, existing technical alternatives, etc. These are the typicaland recurrent failures of both markets and policies that affect activities in remote rural areas. Inthis context, development activities with such populations result in high transaction costs forboth financial institutions and for the suppliers of equipment and technical assistance, makingthem unattractive to customers. Consequently, this section of the population is effectively‘excluded’ from the market36.
At the same time this remoteness adds to the costs of all energy supply options, albeit not in thesame way. Remoteness increases the comparative advantage of micro hydro relative to otheroptions that require transportation of fuels, or frequent visits from urban-based technicians orrevenue collectors.
3.3 The Case for Subsidy
If the price of the energy supplied by micro hydro is too expensive for poor people who need it,then the issue of subsidies and/or grants cannot be avoided. The political acceptability ofsubsidies has undergone wild fluctuations in recent years. All governments provide subsidies,but it is clear that some have done more harm than good. The essential question that hasemerged from the ideological posturing of recent years is less about the rights and wrongs ofsubsidies in principle, but rather whether a particular form of subsidy actually achieves itsintended purpose.
The arguments for using money that is supplied at less than full commercial rates of interest areoverwhelming if large numbers of people are to be given access to improved energy services.This ‘soft money’ will be required to enable people with insufficient purchasing power to gainaccess to electricity, and to other more convenient forms of energy.
In the most general terms, the reasons why agencies of the state, whether national ormultinational, should provide soft money are well known:
• to capture the existence of many positive ‘externalities’ not reflected in market prices,such as the benefits of health, education, welfare, and environment;
• to redistribute income from richer to poorer parts of the community for reasons ofequity and or human rights;
• to kick start an ‘infant’ industry by enabling the volume of production to be increasedand skills developed to the extent that unit costs of production fall to levels where thetarget consumers can afford to buy them on a sustainable basis in the future;
• to remove or reduce the barriers associated with inefficient operation of the market.Usually including the unequal distribution of information between buyers and sellers,monopoly elements among both buyers and sellers, and hostile features of the‘enabling’ environment, such as the unintended consequences of taxes, subsidies tocompeting options, lack of appropriate regulation, inadequate financial and physicalinfrastructure, etc.; and
36 Peru, country report

Meeting Needs and the Circumstances of Affordability 21
• to assist users in overcoming the high initial costs of purchases that are ‘least cost’when considered over the their operational lifetime.
While subsidies to ‘pump prime’ markets are quite different from those intended to lower thecost of ‘social infrastructure’, perhaps the most persuasive argument for subsidising microhydro is made in terms of ‘levelling the playing field’ with other competing options andconcern about ‘fairness’. This arguments suggests that:
• micro hydro should receive subsidies that are equivalent to those received bycompeting options such as the grid or PV;
• micro hydro needs to be compensated as it is unfairly discriminated against in-so-faras it does not get the same tax breaks and other concessions as other technologies;
• micro hydro needs to be compensated because the full cost of other options is notincluded in the price. For example, the environmental costs of using fossil fuels suchas petrol, or biomass fuels such as woodfuel.
There is also weight in the argument that people in remote locations ‘deserve’ electricity asmuch as poor people in other parts of the country. Furthermore, subsidies to micro hydro maywell be justified because they are the least cost way of achieving other development objectives,such as motive power to secure livelihoods, lighting for health and education, refrigeration forthe storage of food or medicines.
3.4 Limitations of Financial Analyses
The aforementioned arguments suggest that in the analysis of competing options, such as on thebasis of ‘least cost’, conclusions are likely to be misleading if the analysis is restricted tomarket prices alone. Clearly if the arguments listed here are accepted, market prices for goodsand services are unlikely to fully reflect their value to poor people or to the nation. Finding the‘true value’ of electricity becomes particularly complex if it is to take into account the so-called‘externalities’ mentioned earlier. When externalities are considered, gains are made by, forexample, calculating the value of other sources of energy not used (kerosene, dry batteries), andthe improvements made to the quality of life of those people switching to electricity from othersources of energy. More fundamentally, prices cannot reflect value if the existing distributionof income is judged to be unacceptable, as this restricts the consumers’ communicating their‘willingness to pay’ to meet their basic needs, by their ‘ability to pay’ for them.
Most international financial institutions such as the World Bank accept the validity of thesearguments and make the necessary adjustments by using some form of ‘economic’ or realresource cost analysis in combination with financial analyses based on market prices37.However, it is market prices that consumers have to pay to gain access to micro hydro power,and therefore it is important that the regulatory framework brings market prices closer to‘economic’ values, and that subsidies compensate for the remaining ‘distortions’.
3.5 Filling the Gap Between Full Cost Finance and Free Grants
Before considering subsidies in more detail, it is important to stress two points that haveemerged in the current debate. Firstly, the ability of governments, aid agencies or charities toprovide subsidies is severely limited in relation to the numbers of people who do not haveaccess to modern forms of energy. Secondly, there is probably more energy-related purchasing
37 The World Bank’s own approach is set out in L Squire and H.G van der Tak “The Economic Analysis of Projects” 1975John Hopkins Press.

22 Best Practices for Sustainable Development of Micro Hydro Power
power in poor communities than was previously thought. There is now substantial evidence38
that people currently excluded from most ‘modern forms of energy’ do already spendconsiderable amounts of money to meet their energy requirements, on charcoal, dry cell andlead acid batteries, candles and kerosene, and in some locations, on fuel wood.
This variability in the ability of even poor people to pay for energy services suggests that froma policy perspective it will be important to distinguish at least three types of financialsustainability. In this way subsidies are used to maximise access and are not wasted on peoplewho already have the ability to pay. This approach forms the basis of recent changes in thePeruvian government’s policies for rural electrification. In this case the NationalElectrification Plan established three types of electricity expansion projects, depending on theeconomic characteristics of the target market:
Class I Projects: Profitable Projects. These projects are intended to make a profit, andunder the provisions established in the Electricity Concessions Law, any entrepreneur whoidentifies a profitable energy project is given the opportunity and the necessary guarantees toimplement it.
Class II Projects: Non-profitable but sustainable projects. If these projects areadequately managed they are capable of covering their operating and maintenance costs, even ifthey do not make a profit. In this case, the State tries to implement joint financing programmesin order to obtain the so-called ‘investment commitments’ from the private sector. Suchprojects include those built with State funds but which are subsequently transferred to privateor other companies for their operational phase.
Class III Projects: Non-profitable and non-sustainable projects. These are projectsaimed at expanding the electrical frontier, for which all that is required is to selecttechnological alternatives that produce the least operating and maintenance costs39.
The experience in Sri Lanka reflects a similar situation where micro hydro schemes that aredesigned for industrial activities on the Tea Estates can be highly profitable (i.e. Class I)because of the size of the costs avoided by not using grid electricity. Schemes that supplyelectricity for rural communities are unlikely to be financially viable without soft money. Buteven in this sub-market, relatively small one-off grants can result in schemes that can befinancially sustainable in this more limited sense (i.e. Class II)40.
3.6 Smarter Subsidies
If the case can be made for subsidies, experience suggests that the use of soft money can bothhelp the expansion of the micro hydro sector and harm it. As always the ‘devil is in the detail’and in the specifics of each context. Hence the phrase ‘smart subsidies’ 41 has been coined toput some distance between current forms of subsidy and the earlier forms that were shown tostultify innovation, destroy markets, and support the already rich. Examples of this were thesubsidies for grid-based electricity, kerosene and diesel.
38 For instance from studies in India, Uganda and Zimbabwe undertaken by the UNDP/World Bank’s ESMAP programme.39 Peru , Section 4.2. However under the current schemes in Peru there is a market segment who are not being served by thesystems run by private concession holders, and which are also not included in the medium-term plans of the small systems orfacilities run by the State. This is the segment that is currently met by NGO.40 Sri Lanka, Section 4.41 See Dr Subodh Mathur, Presentation to the World Bank/NREL Village Power 98 Conference, Washington DC, October1998 and Best Practice Manual: Promoting Decentralised Electrification Investment, ESMAP World Bank, 1999 Page 10.

Meeting Needs and the Circumstances of Affordability 23
The key lesson from past experience appears to be to avoid applying un-ending subsidies to therecurrent costs of micro hydro operation, or more specifically do not directly subsidise theprice charged to the energy end-user.
‘Smart subsidies’ should be designed in such a way as to re-enforce the commercial orientationof micro hydro schemes to reduce costs and improve service. In most cases this will meanfocussing on reducing the cost of the initial investment, thereby increasing the numbers ofpeople who have access to electricity, rather than continuously subsidising the recurrent cost ofoperation42.
More generally subsidies that are based on rules and are transparent to all parties and wellknown before investments have taken place are less likely to result in waste and corruption.
It is also important to consider a wide range of ways in which the costs of the whole microhydro development can be reduced, and not just be a subsidy to the providers of finance.Providing subsidised assistance for the training of turbine manufacturers, or independent on-site feasibility studies appears to be particularly effective in reducing costs to the user, and inreducing the risks to the investor.
A particular problem with current subsidies provided by bilateral donors is that they have atendency to ‘pollute the well’ – that is, they use their subsidies to spoil the market for others.This can occur if aid subsidies are available to a particular technology thereby making it verydifficult for other technologies to compete. This again happens where subsidies are tied to aparticular supplier, usually nationals of the donor country, thereby giving them an unfairadvantage. Donor subsidies are currently even being awarded to huge multinationalcorporations in a number of areas of renewable energy and in particular countries, which makesit particularly difficult for smaller local suppliers to compete.
3.7 The Poverty Impact of Micro Hydro
It was not the intention of this study to measure the poverty impact of micro hydro. HoweverDavid Fulford, Paul Mosley and others have recently attempted this very difficult task in aparallel study commissioned by the UK’s Department for International Development. As theseauthors point out, it is conceptually and empirically difficult to attribute measurable povertyimpacts to relatively small investments, such as micro hydro. This is because in such casesthere are many other circumstances, such as climatic variation and macro economic change thataffect the measurable poverty status of remote communities over any particular time period.
However, these researchers used a ‘second best’ approach, consisting of tracking, by partialequilibrium methods, the effects of micro hydro on the incomes of the poor through changes inentrepreneurs’ incomes, labour incomes, consumer real incomes and backward and forwardlinkages. Following this approach the researchers found:
“in relation to the number of schemes in existence the poverty reductionperformance of micro hydro is impressive, particularly in Nepal andEthiopia….micro hydro is indeed a relatively efficient method of poverty reduction,in terms of costs per person moved across the poverty line. The poverty gapmeasure suggests that micro hydro is also able to reach a number of the extremely
42 Lifeline tariffs may well be an exception to this, but may be justified where the subsidy is essentially paid by a “crosssubsidy” from richer consumers, so preserving the idea that the whole enterprise covers its operating costs.

24 Best Practices for Sustainable Development of Micro Hydro Power
poor…. through the channel of wage employment in micro hydro schemesthemselves and linkage activities derived from those schemes. In addition, webelieve that the estimates of poverty reduction from micro hydro.. systematicallyunderstate poverty impact, as they exclude a range of very difficult to measure butimportant effects such as time savings from no longer having to carry kerosene orother fuel, improved education from the availability of electric light and improvedhealth and agricultural production from drinking and irrigation water madeavailable out of channels originally developed for micro hydro schemes.”
“On the preliminary data presented here, therefore, there would seem to beevidence enabling a poverty reduction case to be made for the promotion of microhydro, in particular through the policy instruments specified. Whether that indeedturns out to be the case depends on whether the estimates presented here can bevalidated by a broader range of data, both from the countries considered here andelsewhere”.43.
3.8 Gender and Micro Hydro
The five country reports provide little or no gender disaggregated information. However one ofthe authors had carried out a path-breaking piece of research on the gender related impact ofmicro hydro in Sri Lanka in the mid 1990’s. This covered a sample of 5 plants, selected torepresent different income levels and end-uses. Unfortunately only one of the sampled plantswas also covered in the more recent survey (Pathavita)44. A random sample of some 86connected and unconnected households were investigated (within which a sub-sample of 45households was selected where both male and female members of the household wereinterviewed).
While participation in village activities was generally found to be higher for males thanfemales, the sample showed a wide variation between the villages in the extent of femaleparticipation in the hydro schemes. As might be expected, those households that are connectedto the hydro system participated considerably more than those that were not. Generally malesdominated the planning and initiation stages of the projects. In some Electricity ConsumerSocieties women were “not regarded as decision makers” while in others they wereencouraged. ECS meetings were frequently held on weekday evenings, which wereparticularly difficult for women to attend. Technical issues were frequently regarded as “male”.
The benefits were largely at the household level (lighting, TV and battery charging) forconnected households, but unconnected households benefited by access to TV and thepossibility of hiring lights for special occasions. Women tended to see the benefit of electricitylargely in terms of reducing their workload, health, reduced expenditures. Whereas the mensaw benefits in terms of leisure, quality of life and the education of children. In connectedhouseholds the benefits of lighting (“a public good”) were equally distributed between malesand females, but in unconnected households, the males were able to obtain more benefit as thewomen were often excluded. Most Perhaps the most important finding was that the impactupon unconnected households was greatly affected by the choice of end-uses. For example, it
43 Micro hydro generation as instrument of poverty reduction: Asian achievement and African potential, by David Fulford,Alistair Gill and Paul Mosley, Reports to DFID, Reading University.44 Kiran Dhanapala, 1995, Report on the Gender Related Impact of Micro Hydro technology at the Village Level, IntermediateTechnology, Study Report Number 2, 59 pages.

Meeting Needs and the Circumstances of Affordability 25
is suggested that the addition of a chilli mill would probably produce more benefits to theexcluded group than say the addition of a battery charging station.
The survey showed that typically less than 50% of the households benefited from micro hydro,re-enforcing village level power structures or increasing friction within the village. Thisevidence has implications for poverty alleviation policy. Earlier we saw the impact the chosenend-use had upon the type and distribution of benefits between households and between menand women. Together these observations underline the importance of including both womenand non-connected households in the decision-making process if poverty impact is to bemaximised.
In Nepal, an assessment of the impact of Gandruk hydro plant suggested that the advent oftelevision had a significant ‘cultural impact’. Women could see that they, “don’t have to remainas second class citizens”45.
45 Social Impacts of Electrification: Micro Hydro in Gandruk, Nepal, by Joshua Thumim, MSc Thesis, 1999, Imperial CollegeLondon. In this case only one quarter of the households were electrified, with the richer households consuming more powerthan the poorer ones. Thirty households were interviewed (of which some 30% of the interviews were with women). The dataare not disaggregated by gender.


27
4
INTERMEDIATION IN PRACTICE: EXPANDING THEUSE OF MICRO HYDRO
4.1 Many Dimensions
A variety of approaches have been used to diffuse micro hydro. The chosen strategies varyaccording to local circumstances and how long the programmes have been going. In the earlydays the approach typically involved a small group of enthusiasts (usually engineers in NGO)who raised awareness of the possibilities by building and demonstrating plants, while moremature programmes involved strong interactions with the main agencies of government anddevelopment assistance. Broadly speaking each strategy involves a combination of thefollowing five elements:
ProjectPromoters:
• Government owned utilities• Non-Governmental Organisations• Equipment manufacturers• Individual entrepreneurs• Multilateral or bilateral aid agencies
FinancingMechanisms
• Formal development bank loans and grants• Grants from charities• Equity from private (local) savings and
contributions in kind
Plant Owners/ Managers
• Utilities• Municipal authorities• Existing formal businesses such as Tea Estates• Individual (village based) entrepreneurs• Village or community groups
TechnicalSupportMechanisms
• Change agents (Village Catalysts, barefootengineers)
• Engineering workshops• Existing consulting engineers• NGO
Main End-uses
• Domestic lighting / radios• Social services (to schools, health centres, street
lights)• Productive end-uses, usually using motive power

28 Best Practices for Sustainable Development of Micro Hydro Power
4.2 The Main Diffusion Strategies
The uncertainty surrounding the best method of expanding micro hydro was due to a number offactors: the situation was changing rapidly; the current strategies were not necessarily fullydocumented46; and due to the number of different actors involved, each with a differentstrategy, some of which were implicit rather than explicit.
In most cases it would appear that the governments in the countries examined do not havepolicies specifically for the development of micro hydro. Although some had policies toencourage rural electrification, these were usually through grid extension. Where there werepolicies to support a particular technology, such as solar photovoltaics, these tended to bedriven by external donors.
The main elements of the current expansion strategy can be characterised as follows.
Summary of Strategies to Expand the Use of Micro Hydro Plants in Selected Countries
Peru An NGO led strategy based on a revolving fund financed by the Inter-AmericanDevelopment Bank.
• The Government’s Executive Projects Directorate (DEP) created astrategy for isolated areas (1997-2000) but in practice this focuseslargely on mini hydro power plants (60) and diesel generators (72).
• There is no explicit strategy for the smaller, micro hydro power.• The regulatory framework is aimed at promoting private investment in
generating and distributing electricity but the Government’s clearpreference is to support grid based electrification.
Sri Lanka A long standing programme in many phases:• Initiated in 1979 by the Alternative Energy Unit of the state owned
utility.• Followed by an NGO-led strategy based initially on the refurbishment
and demonstration of MHP in the Teas Estates and subsequently onworkshop training programmes and the creation of village-basedElectricity Supply Committees (#check name)
• A Technical Assistance Committee (subsequently Energy Forum)provided co-ordination and direction between government, NGO andprivate companies.
• The current phase based on World Bank funding of more commerciallyorientated approaches through the Energy Services Delivery Projectoperated by the Development Finance Corporation of Ceylon.
Nepal A long standing programme based on:• The provision of subsidies to micro hydro through the Agricultural
Development Bank of Nepal (ADB/N).• Credit support through the ABD/N.• NGOs drove the sector, and combined building-up the capability of the
local turbine manufacturers with the development of a number of
46 Peru, page 9.

Intermediation in Practice 29
technical improvements (the electronic load controller and the use ofelectric motors as turbines).
• A significant part of the sector (turbines for milling grain) is financiallyself-sustaining, and receives no subsidised support.
• The current phase of the strategy involved the creation of The AlternativeEnergy Promotion Centre (AEPC) in 1996 as an autonomous body underthe Development Committee Act, and is overseen by the Ministry ofScience and Technology (MST). The mandate of AEPC is to promoterenewal energy technologies to meet the needs in rural areas of Nepal.DANIDA is assisting those elements of the programme that promotemicro hydro development and PV.
Zimbabwe An NGO led strategy, currently at the early stage of awareness raising and theconstruction of demonstration plants.
• An important element of the strategy is the Energy Forum of Zimbabwe(EFORZ), originally the Hydro Forum. The forum draws itsmembership from interested individuals, NGOs, governmentdepartments, universities, tertiary education institutions, researchinstitutions and the private sector. EFORZ works closely withgovernment on policy and planning of micro hydro development.
Mozambique An NGO-led strategy, currently at the early stage of awareness raising andconstructing demonstration plants.
• The development of new and renewable sources of energy is a result ofisolated initiatives and no institution has staff oriented solely to theseactivities. The Government is investigating alternative methods ofsupplying household and small industrial concerns with energy.
• A local NGO, KMS, funded by FOS-Belgium, is working with ITDG torehabilitate a number of schemes to raise awareness and demonstrate thetechnology.
4.3 The Key Agents Behind The ‘Strategy’
The case studies showed that even the most modest hydro development programme is likely toinvolve many stakeholders: government (national and local); utilities; project owners andoperators; aid agencies; financial institutions; equipment manufacturers, assemblers andsuppliers; providers of Technical Assistance; contractors plant owners; community developers(‘animators’); communities; and the beneficiaries.
Agents of the state have played a particularly significant, if intermittent, role in encouragingmicro hydro. In Nepal, the Agricultural Development Bank appears to have been the leadinstitution, drawing on the services of NGOs. In Sri Lanka, the utilities (the Ceylon ElectricityBoard) similarly expressed an early interest in micro hydro and then drew on the services of anNGO and local consultant engineers.
The international financial institutions, both multilateral and bilateral, now appear to be takingan interest in micro hydro. In the 1960’s and 1970’s these aid agencies invested heavily inrural electrification, but this was almost entirely through grid extensions. This experience, andparticularly the sense that rural electrification was a bottomless pit of financially unsustainableprojects, meant that they remained reluctant to fund more recent, decentralised systems.

30 Best Practices for Sustainable Development of Micro Hydro Power
However, they have begun tore-consider decentralisedenergy options, prompted nodoubt by their new interest inrenewable sources of energy47
and by the enthusiasm ofmanufacturers ofphotovoltaics in industrialisedcountries.
In Sri Lanka the World Bankincluded micro hydro in itsEnergy Services Deliveryloan, which was initiallyenvisaged to cover only solarPV. In Nepal substantialfunding is now coming fromDanida aimed at increasing
the scale of the effort devoted to micro hydro (and PV), and to put the schemes on a morefinancially secure basis.
4.4 The Issue of Ownership and the Main ‘Clients’ of the Strategies
The cases show that there is a wide variation in the types of actors that own and operate MHPand that this determines both what support they require, and also the objectives that they areattempting to achieve, and even the cost at which they do it.
In Peru the municipal authorities have played a particularly important role in owning andoperating micro hydro installations. This is partly because they are the entity that has access togovernment funds and can raise local resources through taxation. The municipalities areusually district or provincial capitals with a population that usually exceeds 500 people (100families). The electricity services managed by them tends to have a greater coverage (higherelectrification coefficient) than those operated by ‘peasant communities’ or private operators,because the Mayors tend to justify themselves by providing services to as many families aspossible.
However, this political factor also has negative consequences, as there is a change over ofMicro Hydro operating staff at each change of mayor (re-elected every four years).Furthermore, access to central government funds means mayors are under no pressure to chargecost-covering rates for the service and generally politicians are reluctant to raise tariffs. All butone of the municipal plants reviewed had a negative financial balance and high rates ofoutstanding payments (23%) even though rates are relatively low, equivalent to $3.2 per monthper user.
In Sri Lanka in village hydro schemes, the ownership, management, financial control and loadregulation are carried out by the Electricity Consumer Society (ECS). These are societies
47 Interestingly the enthusiasm for “new renewables” has taken place at time during which lending for conventional scale hydroelectricity has declined rapidly. This probably means that there has been a net fall in donors’ contribution to energy suppliesfrom renewable sources. See, for instance, World Bank Operations Evaluation Department Report No. 17359, Feb. 1998, onRenewable Energy, pages 57 and 58.
Installation of hydro system in Sri Lanka
ITD
G
E3
Sri
Lank
a
L2.1
1

Intermediation in Practice 31
formed by the villagers that consume the power delivered by the village hydro plants (see Box).However, under the more ‘commercial orientation’ of the World Bank programme, the ECSwere not eligible for loans and have to be converted into limited liability Electricity ConsumerCompanies (ECC). An unfortunate consequence of this is, apparently, that the consumers feelless like ‘owners’. There is less motivation to stay with the village hydro scheme or to pay backthe loan, as responsibility lies with the ECC48.
Where utilities are the owners or substantial contributors to micro hydro, there is a tendency forthe technical standards to be higher, thus raising the cost of supply substantially49 (see Section4.13).
Private owners have also played an important ownership role. For instance, Tea Estates havebeen particularly important in Sri Lanka, as many of the initial micro hydro plants were locatedthere and their refurbishment enabled the technology to be demonstrated, and experience to begained. However, private companies have had difficulty in getting the necessary approvals touse publicly owned resources such as river water or the river bank (which in Sri Lanka at leastis usually owned by the state), or the necessary ‘way leave’ to allow conductors to cross apublic road. Individual owners may face similar constraints, but they have also been importantplayers and have successfully developed and owned micro hydro businesses (see footnote 29).
The case studies also contain many different forms of ownership and different styles (andquality) of management. This is particularly taken up in the Peru report (Section 5). Generallythe reports do not support the view that there is a relationship between the quality ofmanagement and type of ownership. Small owner operators tend to have weak management(e.g. in Mozambique), while politically dominated management experienced in Municipalplants and co-operatives are likely not to raise tariffs with inflation.
Experience around the world suggests that it is possible to have efficient ‘business-like’management, whether the plant is owned by individuals, state-owned utilities, or communitygroups. The lesson from big utilities is to ensure that the regulatory authority is able to producethe incentives necessary for effective management. In the smaller decentralised systems, suchas micro hydro mini grids, this also probably means setting up (corporate) structures thatminimise political interference, and provide clear delegated authority to a management toachieve clearly stated objectives (related to profitability, coverage and the quality of service).
4.5 Intermediation and the Critical Importance of ‘Project Developers’
But perhaps the most important ‘agent’ in the implementation of strategies for micro hydro hasbeen the ‘project developer’. ‘Project developers’ are the people or agencies that: identify thesites; help organise the community into an organisation (such as the Electricity ConsumerSocieties in Sri Lanka); act for the community or plant owner to arrange the finance; obtain theequipment; supervise design and installation; train the operators; and press for change in theregulatory environment, etc.
48 The ECC at Pathawita is facing a severe threat to its existence with the national grid penetrating into its area. The loss ofexisting consumers and the difficulty of attracting new customers may result in difficulties paying back the 8-year loan underthe ESD program.49 Tampoe notes that early schemes spent about Rs. 2,000-3,000 on household wiring per household but this increased to Rs.4,000-8,000 in later schemes in 1996/7 where the CEB standards were applied (Tampoe, M., 1998, unpublished report toITDG pp140).

32 Best Practices for Sustainable Development of Micro Hydro Power
NGOs have been major suppliers of ‘project development services’ as they saw the provision ofthese services as a necessary step in demonstrating the technology, or as their contribution tohelping a specific group of marginalized people gain access to improved energy supplies.However, there are also important cases where individual entrepreneurs have acted as their ownproject developers50.
Almost regardless of the financing mechanisms or the strategies of governments and aidagencies, the critical factor in the development of micro hydro programmes has been theexistence of the aforementioned individuals or agencies. They have had the skill to put thevarious elements of a micro hydro project together and the tenacity to see it through tooperation. This suggests another key conclusion: the rate at which the micro hydro sector canbe expanded will be dependent on the rate at which such project development capabilities canbe developed, expanded and paid for.
4.6 Transaction Costs and the Cost of Intermediation
While the case studies showed the importance of the various types of intermediation, they alsoshowed that there was very little knowledge about how much each of them cost. For instance,the long process of technology development and capacity building took place over many yearsand involved substantial investments by the companies involved, institutions such as theADB/N, numerous aid agencies and international NGOs. No estimate has been made of theamount involved, but if micro hydro is to be successful in other countries similar investmentswill have to be made.
Similarly the costs of ‘animating’ the communities to own and operate micro hydroinstallations is difficult to establish, but again the investment is likely to be considerable andthe process likely to last many years, with each community.
A key conclusion therefore is that finding the funds to cover the costs of intermediation islikely to be a key factor in the successful introduction and scaling up of micro hydroprogrammes. As with other decentralised energy options, private financial institutions cannotor will not cover the cost associated with many of the transactions necessary to get these energyoptions installed. Indeed many financial institutions will probably have considerable difficultyeven in covering the relatively high transaction costs of ‘retailing’ their capital resources to thepeople who want power from micro hydro plant.
This situation is well illustrated by the case in Sri Lanka. When the World Bank funded theEnergy Services Delivery (ESD) project, the supervision and certification of loans became amajor cost element. Many of these tasks were originally carried out ‘for free’ by IntermediateTechnology for both village people and financial institutions. With ESD they either had to besupplied at very much greater cost by local consulting engineers or did not take place at all.This meant that the draw down of the loan funds was very low until additional funds weremade available through a grant from the Global Environmental Facility (GEF). After this point,it was possible to undertake the tasks associated with loan monitoring, and the establishing oftitle to land for the purposes of providing collateral for the loans.Similarly in Peru relatively few people initially applied for support from the IDB fundedrevolving Credit Fund. The ‘marketing’ programme that was then initiated required aconsiderable effort of visits to the target areas. Luckily it was possible to cover the costs of thiswith non-reimbursable funds provided by the IDB. In addition it would appear that for every 50 A particularly interesting example is that of Bir Bahadur Ghale, from Barpak in Nepal, referred to in footnote 29.

Intermediation in Practice 33
$100 spent on a micro hydro plant in Peru (from grant or loan) an additional $15 is currentlyspent on the system over head costs (for a $36,000 plant these costs would be $5,400).
But private entrepreneurs who develop their own projects also incur huge intermediation costs.The most fully documented case is in Nepal where a private individual took about two years todevelop a basic micro hydro scheme. During the period, according to his own account, hemade ‘forty-one trips to Kathmandu to meet with suppliers, government officials, bankers andothers including ITDG in order to build his scheme’51.
Such activities are systematically omitted from the estimation of costs in the comparison ofoptions for decentralised energy supply (see the earlier discussion in Section 2.1). The result isthat no account is taken of the size of a programme that is necessary to capture the economiesof scale associated with the provision of the necessary elements of ‘intermediation’ (seefootnote 15).
In the case studies reported here an attempt was made to identify all the activities associatedwith the installation and operation of the individual plant (and quantify the associated costs),and all of the various actors who performed them (manufacturers, contractors, plant owners,customers and other beneficiaries, government, banks, utilities, and the various‘intermediators’).
4.7 The Size of the Micro Hydro Market and the Sustainability of CurrentSupport Mechanisms
The relatively high cost of intermediation frequently means that the tasks of projectdevelopment will often fall to NGOs. Certainly it is NGOs that can most easily access the softmoney that these projects will need if poor people are to benefit from them. But it will alsooften only be not-for-profit agencies, such as NGOs, that can cope with the high transactioncosts involved. The costs of these ‘intermediation’ activities are frequently absorbed in thegeneral programme costs of NGOs and cannot be separately identified. Indeed none of theNGOs investigated could tell the researchers how much they had spent on this type of generalsupport activity over the many years that they had been involved. This means that NGOs willnot be in a position to scale up their operations, not only because such activities are dependenton the size of the grants they receive, but also because installing hydro plant is rarely the solepurpose of these NGOs.
This raises the critical questions of whether NGO dominated programmes are in factsustainable in the longer term, and whether such programmes can be scaled-up withoutadequate funding for more mainstream and commercial project development mechanisms. Thecurrent reliance on NGOs is often too ad hoc and the programmes too small to capture theeconomies of scale, in these ‘system overheads’ costs. This is likely to prove a difficult barrierto overcome when the programmes are to be scaled-up and these costs dealt with on a morecommercial basis.
In principle these project development functions could be spun off into separate entities, eithersingle purpose NGOs or consulting firms. But it is precisely these entities that have proven tobe so difficult to fund in the past52. It is not yet clear whether there will be enough work for
51 See reference in footnote 2952 In one of the most innovative programmes to create business plans for the renewable energy businesses in Africa (FINESSE)the main constraint appears to be the lack of institutions who can operate as project developers working between the people

34 Best Practices for Sustainable Development of Micro Hydro Power
such businesses to be run on a financially self-sustaining basis. There is great uncertainty aboutthe size of the micro hydro market, particularly as the demand will be affected greatly by thelevel of soft money available and how the money is used.
Many of the estimates of the potential for micro hydro are based on overly simplistic viewsabout micro hydro potential, based solely on approximations of appropriate sites with fallingwater. For instance, in Sri Lanka conservative estimates of the technical potential of MH areabout 80-90 MW. But these estimates do not include the costs of harnessing this potential. Aswith other energy resources, such as PV or natural gas, there is rarely a shortage energy, butrather a shortage of the skills and capital to make use of it.
In Peru market development is said to be limited. This is in part due to the lack of informationon consumers that fall between ‘real’ markets (profitable and in charge of private concessionholders) and consumers whose only chance of gaining access to electricity (in the mediumterm) is a state subsidy. In at least one case, the government over estimated the demand andoffered a concession. However, when the grid extension projects were implemented, it wasfound that the demand was much lower than anticipated and in some cases non-existent. TheState ended up covering the deficit.
In the case of Sri Lanka an attempt has been made to develop the capacity to perform someproject development tasks as self-sustaining businesses in the form of ‘Village Catalysts’.These people do appear to provide an important function in stimulating demand and providingsome technical input to the projects. However, the new sources of finance (such as the WorldBank financed ESD project) appear to require ‘certification’ of project designs and the qualityof construction from people more formally qualified than the village catalyst. Either aidagencies and foreign NGOs will have to adapt their requirements of the people who arrangeloan and subsidy finance or Village Catalysts will have to have their skills enhanced stillfurther. The issue is one of balance between the cost of high quality intermediation and thereduction in risk that results from using more skilled people.
In Nepal equipment suppliers themselves perform some of the project development tasks. Buthere there would appear to be at least the potential for a conflict of interest and lack ofindependence in the advice given to the purchaser53.
The scale and manner in which these ‘intermediation services’ will be performed will thereforedepend on the form and scale of the money necessary to pay for them.
4.8 Specific Examples of Intermediation
The case studies show a number of interesting examples of the extent of intermediation.
4.8.1 Technological IntermediationA great deal of the current success of micro hydro results from the early attempts to buildtechnological capability with existing metal workshops in Nepal. The first oil crisis in 1973stimulated the Nepalese government to look for alternative energy sources. A number ofcompanies that had experience in building the traditional water wheel, graduated to adding
with a need and the people with the finance.53 Wolfgang Mostert, personal communication.

Intermediation in Practice 35
electricity generation onto improved water turbines54. By 1979 ADB/N had established theirAppropriate Technology Units (ATU) to promote micro hydro and other technologies.Intermediate Technology Development Group (ITDG) became involved at this stage andworked with a number of the existing engineering companies to develop the technology. Thecapabilities of the manufactures was further enhances through a series of training programmestarting in 1987 financed by ADB/N and ITDG. This experience was then transferred, andadapted, to other parts of the developing world55.
4.8.2 Social Intermediation and Participative Approaches to the Management ofTechnical Change56
A major theme in the development of micro hydro technology has been the huge effort put in to‘Participative Approaches’ to create, nurture and capacitate communities to build, own andoperate micro hydro plant. These efforts trace their origins to the more general use ofparticipatory development methodologies in the implementation of technology based projects.In Sri Lanka this process evolved into the development of Electricity Consumer Societies(ECS).
Box 4-1: ELECTRICITY CONSUMER SOCIETIES
The village hydro schemes of Sri Lanka are usually managed by an Electricity Consumer Society(ECS) or its legal and more recent equivalent, the Electricity Consumer Company (ECC), establishedfor each project. These innovative mechanisms facilitate the participatory ownership andmanagement of micro hydro schemes within village communities. Assistance in setting up the ECSwas generally provided by an outside agency (a Non-Government Organisation, such as ITDG). ASociety (ECS) was created in each village before it was able to request technical assistance toundertake a scheme. The ECS involves all potential beneficiaries of the scheme and becomes theoperational and implementation conduit for the project. As the scheme moves into the operationalphase it takes on a more managerial and regulatory role, although the structure and composition of theorganisation remained the same.
The ECS became a pivotal institution within the village community. The office bearers would beselected at an annual general meeting, and sometimes include women. They would manage suchissues as financial control, tariff setting, load regulation, agreeing electricity end-uses, taking actionfollowing breakdowns, and settling disputes arising from electricity usage within the community.
With the advent of bank finance for micro hydro the ECS had to be formalised into ElectricityConsumer Companies in order to become a legal body, with a status of a small company. Any loanrepayment thereby became the sole responsibility of the ECC.
54 Prominent among these were Balaju Yantra Shala (BYS) established in 1960 with the assistance of Swiss DevelopmentCorporation (SDC); Butwal Technical Institute (BTI) established with the assistance of United Mission to Nepal (UMN),National Structure (1963) Thapa Engineering Works at Butwal (1972); and The Engineering Company at Kathmandu (1973).In 1975 Butwal Engineering Works (BEW), a sister concern of BTI, designed and tested the first Pelton turbines. Nepal YantraShala (NYS) also started turbine manufacture in 1975. BEW fabricated the first Crossflow turbine in 1976. BYS fabricated thefirst turbine for generating 6 kW in 1978. In the same year Thapa Engineering Works built their first crossflow turbine,Kathmandu metal Industries (KMI), and National Structure and Engineering developed and installed the first Multi PurposePower Unit (MPPU) to improve the traditional ghatta (water wheel).55 See for instance “Micro Hydro Design Manual” by Adam Harvey, Andy Brown, Priyantha Hettiarachi and Allen Inversin,IT Publications, London, 1993 228 pp, ISBN 1 85339 103 4.56 These issues are dealt with at greater length in “Participative Planning Guidelines for Off-grid Electricity” October 1999(this material is available from IT Consultants www.itchltd.com). It provides evidence of a need for technical and managerialcapacity being built at the project level at an early stage of project planning. Furthermore, unlike in other sectors, participationin micro hydro appears to need people with technical knowledge such as the “Village Catalysts” of Sri Lanka.

36 Best Practices for Sustainable Development of Micro Hydro Power
Similar village committees build and operate many of the hydro schemes examined in Nepal.They are responsible for the loans, set tariffs, and appoint the staff who operate the plant. InPeru rural people also had to organise themselves into ‘pre-electrification committees’ or otherad-hoc organisations in order to gain formal access to credit. This represents a majorcontribution that the IDB/ITDG revolving credit scheme made to building institutions with civilsociety in rural areas.Community participation not only facilitates involvement in the design and operation of hydroplant, but it also enables costs to be reduced in three ways:
• it allows people to contribute their labour (or other communally owned asset such asland57) to the scheme. If people are under employed the opportunity cost of this labourcan be close to zero, and its use need not involve the transfer of cash. This is oftendescribed as ‘sweat equity’ in that by contributing its labour the community gains ashare in the ownership of the scheme;
• involvement of the whole community enables the richer elements (richer households,small mills and shop owners) to carry the bulk of the costs and thereby make a serviceavailable to the poorer people in the community. This can be done either throughactual cross subsidy to the selling price (through a ‘lifeline tariff’) or by allowing theminto the scheme at the marginal cost of including extra consumers rather than theaverage cost;
• increasing the number of people involved in a scheme can reduce the cost to everyonewhen micro hydro schemes exhibit economies of scale.
However, while involvement of the community is certainly a necessary condition for thesuccess of some types of schemes, and can lower costs, the process itself is costly and timeconsuming. These costs are associated with understanding the needs of different users (forinstance including both men and women), developing community motivation and ‘ownership’,and in training. Such processes may take a number of years and can add significantly to thecosts of the NGO or other agency involved in project development58. If a single entrepreneuror a municipality is able to raise all the capital, it may well be that they can avoid the cost ofcommunity development and still have a successful micro hydro scheme.
4.8.3 Village CatalystsIn Sri Lanka another major element of the participative elements of village hydro programmeswas the training of ‘Village Catalysts’ (sometimes known as ‘barefoot’ technologists). Tencatalysts have been trained. These were usually village level electricians or electrical repairtechnicians whose skills were upgraded by ITDG and their services re-orientated towardoperational and maintenance support to village hydro schemes. They met the need to have‘trouble-shooting’ capacity located near to the sites. Some catalysts are also capable ofdesigning and manufacturing Pelton turbines up to 5 kW or so in capacity. In some areas thereis sufficient demand to enable these catalysts to grow into entrepreneurs workingindependently. But despite their business-like approach they still perform services free ofcharge or at low cost to certain communities due to a sense of personal loyalty. Catalysts alsopromote hydro in other villages and are often the first point of contact for potentialbeneficiaries and respond to inquiries and demands of Provincial Councils. However, as
57 The contribution of land is said to be crucial to the success of schemes in Sri Lanka where the state owns river banks, andwould be unlikely to grant permission for individuals to use this land for their own profit.58 It has also been suggested that where community assets are used to build a hydro plant, such as the publicly ‘shared assets’of the river bank or river water, there may be an insistence that 100% of the households are connected. This may affect costs,profitability and timing of the project. Diesel generating sets are said not to suffer from this “100% connection rate syndrome”(Wolfgang Mostert, personal communication).

Intermediation in Practice 37
suggested in Section 4.5, these catalysts cannot perform all the roles of project developer, asthey are not yet perceived as sufficiently credible to financial institutions.
4.8.4 Marketing and the ‘Creation’ of DemandThe need to stimulate the demand for micro hydro through ‘marketing’ and publicising theexistence of the necessary funding opportunities is a particularly important element of socialintermediation in the examples cited in the Peru case study. This activity was an essentialelement in the success of the programme as relatively few people initially applied for supportfrom the IDB funded, revolving Credit Fund. Even though interest rates and paymentconditions seemed attractive when started, virtually no effective loans were made when thescheme was first set up. It was therefore necessary to adjust the strategy. Programmes thatincluded visits of a team of promoters to the target towns to explain the details of the proposedfunding scheme were established, including the participation in local and regional events, useof the radio and visits of students and others. Over a period of two years (1996 and 1997),nearly 40 visits were made, many of them to areas that involve many hours of travel from thenearest small town on a bridle path, the only means of access.
4.8.5 LobbyingIn most countries, technical competence in micro hydro has had to be complemented with thecapacity to lobby for micro hydro development and the conditions that would at least give thistechnical option a fair hearing in the allocation of resources and in the formulation of policy.The most formal and successful of this advocacy function is probably the formation in 1990/1of a Technical Assistance Committee (TAC) Sri Lanka which united a diverse set ofindividuals and organisations interested in micro hydro. Participants included representative ofall sectors but, mainly NGO and the private sector. Staff from the utility were also activemembers. Its initial strategy was to incorporate micro hydro into the government’s RuralDevelopment plan but later facilitated greater co-ordination among all the actors working onmicro hydro initiatives. More recently the TAC evolved into an ‘Energy Forum’ that lobbiesfor all decentralised and renewable energy options. Similar Forums have proved effective inNepal and Zimbabwe and Peru.
4.9 Financial Intermediation and the Main Funding Mechanisms 59
Micro hydro investments are costly and capital intensive. Therefore, access to appropriateforms of medium / long-term financing is critical. This means financial intermediation servicesin rural markets – the supply of debt and other financing to both suppliers of electricity (microhydro owners) and to electricity users.
There are two broad channels for the flow of financing and related support to investor/ownersand the ultimate energy end-users:
• the first channel is one of direct access by investors to finance the purchase to thetechnology and know-how and provide the necessary working capital;
• the second channel is indirect and supplies support through intermediaries who delivertechnical and financial intermediation services to the investor or end-use consumer.
A number of business models employ versions of the indirect channel. For example, ratherthan a direct sale, an equipment supplier might provide an owner with a micro hydro turbineunder a lease, or lease towards purchase (‘hire purchase’) arrangement. But the more common 59 In addition to evidence provided by the country reports, this section draws heavily on a paper specially commissioned fromDr Russell deLucia.

38 Best Practices for Sustainable Development of Micro Hydro Power
of indirect approaches is in the form of a ‘utility’ or ‘energy service company’ (ESCO). In themost straight-forward of these, the owner not only sells electricity to the end-user but providesfinance at least for the customer connection and perhaps end-use equipment (lights, TV etc).The investor/owner role is maintained for a long period or indefinitely.
The old-fashioned (but still existent) micro hydro grain mills are a form of ESCOs, thecustomer pays only for the energy-service (e.g. grain milled) and perhaps even pays in kind (asmall fraction of the milled grain). In modern variants the customer pays only for energy (e.g.kWh), or energy-service (lighting or water being pumped).
Box 4-2 presents an indicative menu of the broad types of financing, structures and theirsources. This draws on the body of experience on options that have been successfully used inOECD countries in supporting market penetration of small energy investments. Increasinglythese options are now being used in a growing number of developing countries. While thismenu is generally representative of the direct project financing approach, in many instances it isalso indicative of the indirect financing approach.
Box 4-2: Indicative Menu of Financing Options (Types and Sources)
Equity Financing with financial resource mobilisation from:• internal funds from the project sponsor / active investors / users;• other active investors, such as venture capital funds, or investments by merchant banks;• supplier (e.g. of equipment) as investor (part or all of equipment costs);• passive investors through ‘private placement’ of equity financial-security instruments (e.g.
shares certificate);• passive investors through public (security-agency-regulated) placement/offering; and• special categories of above where the investor has additional (non-financial) objectives, such
as targeting environmental/green project or entity investments.
Primary and Secondary (mezzanine*) Debt Financing with financial resource mobilisation from:• commercial and/or development bank and other Financial Institution providing working
capital and term loans (limited recourse or balance sheet);• complementary and/or alternative (often mezzanine) debt from ‘active/directly involved’
equity sources (categories 1.(a-c) above);• export credit agency (ECA) source when equipment is imported;• investment grade term-debt instrument (e.g. bonds) placed through limited offering to sources
for which fiduciary and/or other constraints limit portfolio positions largely to such investmentgrade instruments;
• as in (d) but from a broader range of sources through a registered offering;• ‘junk’ (non-investment grade) bonds (the more general case) placed to similar sources as in (d)
and (e) but participation of sources for (d) constrained as noted; and• analogy of 1.(f) for debt, sometimes as complementing equity position.
Other Financing/Financial Support – with financial resource mobilisation and/or support from:• grants/contingent grants, cost shares sometimes for specific costs (e.g. pre-investment studies)
or cost components from public agencies at federal, state or local level;• depreciation and/or tax credits from federal, state or local authorities, which, in effect, lower
the cost of debt and/or equity financing;• lease financing from equipment suppliers, or through arrangements with Financial Institutions; and• myriad guarantees, credit enhancements and/or other support usually from Development
Finance Institutions’ support by federal, state or local governments; to facilitate one or anotherof financing options above, or the creation of subcategory of one of these options such as ‘tax-free’ development, pollution control or other special bonds.

Intermediation in Practice 39
Source: modified from tables in previous deLucia and Associates, Inc. reports and papers.Mezzanine finance is defined as “unsecured, higher yielding loans that are subordinate to banks and securedloans but rank above equity” (Encarta, 1998).
The most critical question in financial intermediation is who is responsible for transactiondecisions and who bears what risks. If support from an International Financial Institution (IFI) isto work, experience suggests two very clear lessons. First, given the nature of transaction costs,this support can only be cost-effective if the Institution ‘off-loads’ most if not all transactionalresponsibilities to intermediaries. The smaller the scale of the investment transaction, the morenecessary is this ‘off-loading’. However the IFI must retain the responsibility of the appraisal andevaluation of the intermediaries, at least those at the highest level.
Secondly, the intermediaries must be responsible for the appraisal of the transaction (theinvestment and the credit worthiness of the borrower or end-user), the management of financialand associated risks, and of course, be responsible for ensuring transaction re-flows (therepayments).
A recent review of IFI operations in support of micro hydro and other small energy investmentssuggests three useful but sometimes overlapping representative categories of financialintermediaries60:
� ‘Classical’ Intermediation via Bank or Non-Bank Financial Institutions. Nepal’sAgricultural Development Bank of Nepal is perhaps the most well known example forfinancing micro hydro. ADB/N is a government owned bank which serves as anintermediary for the government’s micro hydro (and other) programs; it has also been anintermediary for various International Financial Institutions. More recently the Sri LankaDevelopment Finance Corporation of Ceylon (DFCC) acts as one of the intermediariesfor the funds provided by the World Bank under its Energy Services Delivery loan.
� Intermediation via Other Non-Bank Specialised Financial Institutions. Again citing anexample with micro hydro experience, perhaps most well known of such institutions isIREDA – The Indian Renewable Energy Development Agency Ltd. IREDA was createdin 1987 as a public limited company owned by the Central Government to promoterenewable energy and to serve as a ‘channel’ for Government and International FinancialInstitution external funds. IREDA has supported a number of micro/mini/small hydroprojects.
� Intermediation via Non-Financial Institutions. This is an envelope category includingsuch entities as utilities, ESCOs, special purpose investment entities (e.g. developmentauthorities, infrastructure funds) and others, including NGOs. An example of this is therevolving fund operated by ITDG Peru using funds sourced from the Inter AmericanDevelopment Bank.
The World Bank and other international development finance institutions are increasingly using aclass of intermediaries which are financing funds or facilities whose management is theresponsibility of a local bank or non-bank Financial Institution (or consortium). SuchInternational Financial Institution operations, referred here as Fund or Facility Operations, areusually designed to provide a mechanism for the International Financial Institution to support 60Each of these categories is discussed, along with examples in the aforementioned report (De Lucia and Associates, Inc. July1998) which is available from the World Bank.
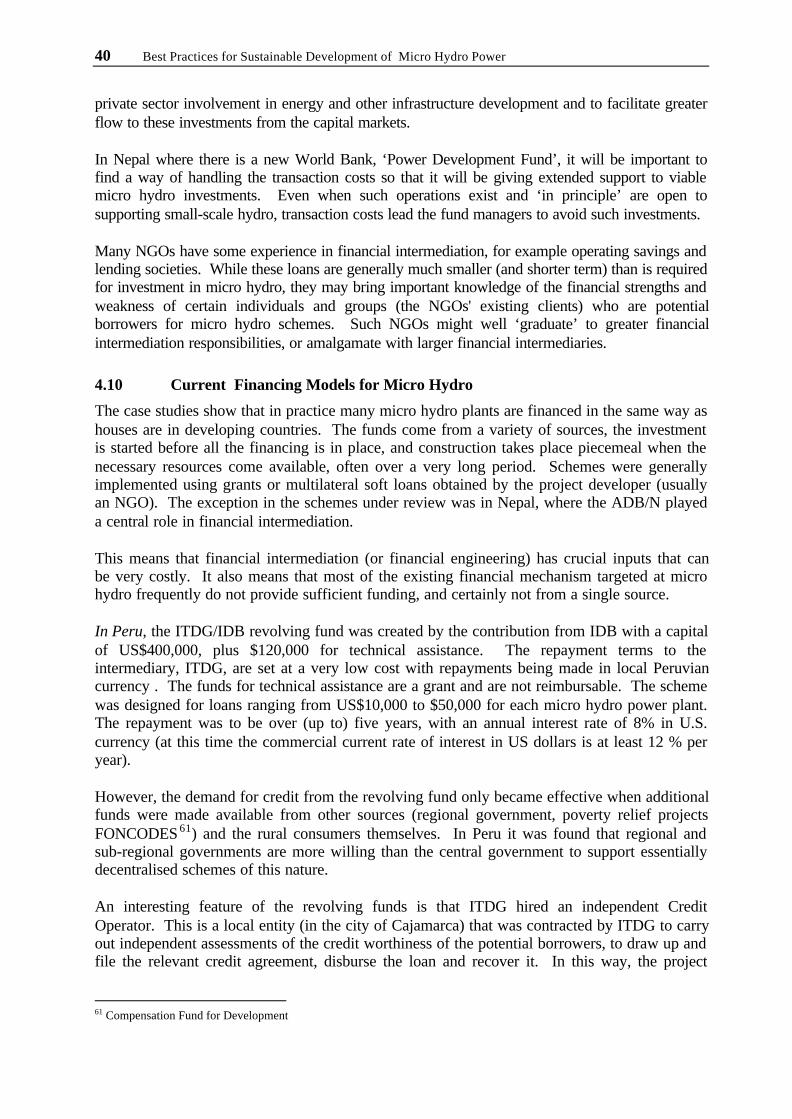
40 Best Practices for Sustainable Development of Micro Hydro Power
private sector involvement in energy and other infrastructure development and to facilitate greaterflow to these investments from the capital markets.
In Nepal where there is a new World Bank, ‘Power Development Fund’, it will be important tofind a way of handling the transaction costs so that it will be giving extended support to viablemicro hydro investments. Even when such operations exist and ‘in principle’ are open tosupporting small-scale hydro, transaction costs lead the fund managers to avoid such investments.
Many NGOs have some experience in financial intermediation, for example operating savings andlending societies. While these loans are generally much smaller (and shorter term) than is requiredfor investment in micro hydro, they may bring important knowledge of the financial strengths andweakness of certain individuals and groups (the NGOs' existing clients) who are potentialborrowers for micro hydro schemes. Such NGOs might well ‘graduate’ to greater financialintermediation responsibilities, or amalgamate with larger financial intermediaries.
4.10 Current Financing Models for Micro Hydro
The case studies show that in practice many micro hydro plants are financed in the same way ashouses are in developing countries. The funds come from a variety of sources, the investmentis started before all the financing is in place, and construction takes place piecemeal when thenecessary resources come available, often over a very long period. Schemes were generallyimplemented using grants or multilateral soft loans obtained by the project developer (usuallyan NGO). The exception in the schemes under review was in Nepal, where the ADB/N playeda central role in financial intermediation.
This means that financial intermediation (or financial engineering) has crucial inputs that canbe very costly. It also means that most of the existing financial mechanism targeted at microhydro frequently do not provide sufficient funding, and certainly not from a single source.
In Peru, the ITDG/IDB revolving fund was created by the contribution from IDB with a capitalof US$400,000, plus $120,000 for technical assistance. The repayment terms to theintermediary, ITDG, are set at a very low cost with repayments being made in local Peruviancurrency . The funds for technical assistance are a grant and are not reimbursable. The schemewas designed for loans ranging from US$10,000 to $50,000 for each micro hydro power plant.The repayment was to be over (up to) five years, with an annual interest rate of 8% in U.S.currency (at this time the commercial current rate of interest in US dollars is at least 12 % peryear).
However, the demand for credit from the revolving fund only became effective when additionalfunds were made available from other sources (regional government, poverty relief projectsFONCODES 61) and the rural consumers themselves. In Peru it was found that regional andsub-regional governments are more willing than the central government to support essentiallydecentralised schemes of this nature.
An interesting feature of the revolving funds is that ITDG hired an independent CreditOperator. This is a local entity (in the city of Cajamarca) that was contracted by ITDG to carryout independent assessments of the credit worthiness of the potential borrowers, to draw up andfile the relevant credit agreement, disburse the loan and recover it. In this way, the project
61 Compensation Fund for Development

Intermediation in Practice 41
developer, ITDG, was able to concentrate on the promotion, technical assistance and generalsupervision of the projects.
By the beginning of 1999 15 loans, totalling US$465,718, had been granted from the revolvingloan. A total investment of $ 1,730,000 had been made for the installation of 15 micro hydropower plants in small towns in Cajamarca, Apurimac, Amazonas and Lambayeque.Repayment has been at a high level.
The following tables summarises this scheme:
Table 4-1: Sources of Finance from Micro Hydro Development in Peru
Source Amount %
ITDG/IDB Credit $465,718 27
Regional and Sub-regionalGovernment
$418,044 24
FONCODES $328,475 19
Direct contribution ofmunicipalities and smallbusinesses
$242,730 14
Local contribution (population) $47,330 3
Others (*) $226,852 13
TOTAL $1,729,149 100*Including technical assistance and promotion funds provided by IDB (up toUS$120 thousand) and other donors.
Table 4-2: Types of Finance from Micro Hydro Development in Peru
Financial Component Use of Funds % of totalcosts
Loans Civil works and electro-mechanicalequipment
27%
Contribution bymunicipalities and smallbusinesses
Pre-investment and other complementaryexpenses
14%
Grants Technical assistance and promotion (13%)Civil works and distribution lines (43%)
56%
Contribution by localpeople
Manpower, materials 3%
TOTAL 100%
When a municipality is the owner of the micro hydro funds are sourced from both centralgovernment (transferred to municipalities), and from the local population through taxes.Indeed municipalities raise commercial loans against the guarantee of a ‘retention’, that if theydo not service the debt, the payments will be deducted directly by central government fromnational tax revenues payable to the municipality.

42 Best Practices for Sustainable Development of Micro Hydro Power
In Sri Lanka, until the recent advent of the World Bank financed ESD project, funding for eachproject had come from a wide range of sources such as foreign donors, the government’spoverty alleviation programs, local government bodies and charities such as the Rotary Club.Contributions in kind (sweat equity), mainly for the civil works, were a significant element inresource mobilisation. The cases showed that this source could be significant: at theKatepoloya scheme in Sri Lanka this was as high as 44%62 of all costs, including labour . Moregenerally in Sri Lanka beneficiaries provided some 30 % of the total project cost, when sweatequity is properly costed.
The World Bank is now the major contributor to village hydro finance in Sri Lanka by meansof its Energy Services Delivery (ESD) project. The ESD provides a credit line to ParticipatingCredit Institutions (PCIs) for medium and long-term credit for many renewable energy anddemand side management projects. This includes village micro hydro and the rehabilitation ofTea Estate mini hydro sites. Finance for electricity end-uses at the community level is notspecifically included, though it is implicitly recognised as a part of the project cost. However,existing micro credit institutions in rural areas (such as Sarvodaya and Sanasa) can provideboth business development support services and micro-finance to new businesses based onelectricity.
The Development Finance Corporation of Ceylon (DFCC) is the main operator of the WorldBank programme and manages the loans to the Participating Credit Institutions. These loansare usually based on Average Weighted Deposit Rates (AWDR) in the commercial bankingsector and PCI are free to on-lend at market rates. PCIs are free to adopt their own eligibilitycriteria with no specifications on debt to equity ratios as often the case with previous otherWorld Bank loans. Nominal market interest rates usually vary but range between 15%-22% incurrent prices in local currency (inflation is currently about 7%). Rates are dependent on bankpolicies and individual project situations. The loan period is a maximum of 10 years includinga maximum two-year grace period.
Borrowers repay ESD loans to the PCIs, and the PCIs make repayments in stages to the DFCCwhich in turn repays the money to the Government of Sri Lanka (GOSL) five years afterinitially drawing down the funds. The Government then repays the loan to the World Bankafter a time lag.
The ESD provides grant funds for capacity building through training and through technical andgeneric market support for renewable energy services, by supporting educational promotioncampaigns for off-grid energy technologies. This activity is subcontracted out to the Sri LankaBusiness Development Centre (SLBDC).
Collateral in the Sri Lankan ESD programme is provided by the project’s capital equipment andland leasehold rights. In such projects, land is often state or Crown land leased on a long-termbasis and then mortgaged. In the event of defaulting, the site and land can be transferred andsold as a going concern.
As in the case of the Peruvian programme, ESD has required additional grant funds to get theirprogrammes off the ground. These have been provided mainly through co-financing from theGlobal Environment Facility (GEF). These grant initiatives came into effect one year intoproject implementation following representation from banks, equipment dealers, and 62 This figure seems quite high. However in schemes where a great deal of civil work is necessary, in kind contribution frombeneficiaries might be significant.

Intermediation in Practice 43
consultants. In effect hard commercial funds from the private sector are ‘leveraged’ with softerpublic funds in order to cover the ‘system overhead costs’.
The grant elements associated with ESD now includes:• Grant co-finance for loan applicants. These are $400 for each kilowatt up to $20,000
for micro hydro plant (compared to $100 per 30 Watt Solar Home Systems – SHS);• Grants for Project Preparation. These cover 95% of costs up to $9,000 for Micro
Hydro (90% up to $6,500 for SHS);• A campaign to promote off-grid electricity;• Grants to the PCU for Project Supervision. Currently these are $1,200 for each micro
hydro project ($50/SHS up to $600/sub project);• Grants for project supervision. These grants enable consultants to verify the design of
micro hydro projects and site specifications before loan disbursements.• Consumer education and protection facility. This currently applies only to solar home
systems and is a facility to investigate consumer complaints about dealers and to seekappropriate solutions.
It also appears that additional grant support is required for technical assistance to micro hydrodevelopment through ESD schemes and is currently being arranged through additional softfunds.
The ESD project started at the end of 1997 and has been in operation almost two years. To dateit has approved around 13 grid connected and 7 off-grid micro hydro schemes.
In Nepal the Government requires commercial banks to invest 7 percent of their total depositsin the priority sectors. However the Government has to rely on the Agricultural DevelopmentBank of Nepal (ADB/N) to administer its subsidy scheme for micro hydro. Formal financialinstitutions have been reluctant to provide rural credit. Commercial Banks (such as the NepalBank Limited and Rashtriya Banijya Bank) have a strong network of field offices and are ableto provide credit in rural areas. The new joint venture banks have so far failed, however, toprovide such services due to their inexperience in this sector. They mobilise funds throughcontractual arrangements with ADB/N.
Subsidies are provided for rural electrification programme through ADB/N. The terms of thesubsidy have changed over the years, but currently they are available for systems up to 100 kWfor water turbine and Peltric sets. The subsidy is available for the electrical components andvaries from 75 percent for remote areas and 50 percent for other hill areas63. In effect thismeans that the subsidy is approximately 20-25% of the total investment cost. The micro hydrosubsidy covers generators, load controllers, ballast heaters, earthing set, lighting arrestor, circuitbreakers, drive system and transmission components including transmission cables, poles,insulators, stay wires and transformers. The subsidy on Peltric set is limited to capacities up to5 kW. The limiting size of the penstock pipe for Peltric set is set at 100 m in length and 150mm internal diameter High Density Polyethylene pipe. US $ 67/kW is provided fortransmission poles in remote areas, US$75/kW is provided for other hilly areas. The subsidyfor poles cannot exceed the cost of the turbine in the case of Peltric set. No subsidy is givenspecifically for household wiring, but a loan is provided to each household up to US $ 20.
63 Information supplied by Devendra Prasad Adhhiari, Agricultural Development Bank.

44 Best Practices for Sustainable Development of Micro Hydro Power
Over the past 12 years ADBN has changed its interest rate for micro hydro development. As aresult of price escalation, the higher cost of borrowing and the higher cost of lending, the ratehas grown in stages from 11 percent to 19 percent. The current ADB/N’s interest rates are highand appear to discourage borrowers.
Normally in Nepal some 20% of the total project cost must be found by the prospective ‘owner’usually in the form of local labour. However in the case of Barpak, the local contribution (forthe civil works) represented only 7% of the total costs.
Table 4-3: Summary of Current Financing Terms for Micro Hydro
PrimaryActors
Funds Financing Models
Peru ITDG Inter AmericanDevelopment Bank,Local Government,
Revolving FundPlus grants for projectdevelopment.
Sri Lanka UtilityEnergy ForumITDGWorld Bank(recently)
Multiple sources ‘Ad Hoc’ multi donor,local grants, banks.World Bank ESD loansat 16%Grants.
Nepal ADB/N loans andGovernment Subsidy
Rural EnergyDevelopmentProgramme
RADC
ABD/N and government
UNDP funds, plusADB/N loans, andcontributions fromDistrict and VillageDevelopmentCommittees
Government funds
Loans and Governmentsubsidy.
Zimbabwe ITDG ITDG Grants onlyMozambique ITDG and KSM* ITDG Grants only, private
contribution *KSM (Kwasai Simukai) is a Mozambican NGO.
4.11 Collateral and Guarantees
Securing loans by means of collateral has frequently posed problems in micro hydrodevelopment, particularly in community-owned schemes. As with many project loans, theproject’s capital equipment and land leasehold rights are used as collateral. But in the case ofmicro hydro in Sri Lanka, land is often state or Crown land that is leased on a long-term leaseand then mortgaged. In the event of defaulting, the site and land can be transferred to anotherand sold as a going concern. However, in practice it often takes time and considerable effort toestablish title to the land, and particularly when the loan is to be raised by a limited liabilitycompany rather than the whole community.
Furthermore, the lack of technical expertise within financial institutions means that they areoften unable to effectively monitor the construction and operation of the schemes that act as the

Intermediation in Practice 45
collateral for the loans. This has also handicapped the financing mechanisms of the microhydro sector in Sri Lanka.
In Peru the risks of loans has been reduced in a number of innovative ways. In one case (the‘Atahualpa’ Farming Co-operative) the loan was guaranteed by ‘hypothecating’ rights to theincome stream from the future sales of milk.
In the case of municipalities the loans are guaranteed by means of an ‘intercept’, whereby if themunicipality defaults on the loan, the loan repayment is deducted at source from futuretransfers of resources from the central government to the municipality.
4.12 ‘Organisational Intermediation’ and the ‘Enabling Environment’
The success of micro hydro is clearly context specific. This specificity refers not only to thelocation of a particular site (is there enough water and a sufficiently ‘concentrated’ demand) atthe micro level of analysis, but also at the specifics of the institutional arrangements at themacro level. The development of micro hydro has required one or more organisations todevelop the national energy context – the ‘enabling environment’ - in ways that support (or areat least not hostile to) micro hydro development.
The characteristics of a favourable ‘enabling environment’ are relatively easy to list, but oftenrequires huge effort to put in place. They are likely to include:
• A legal framework for contracts and effective means of their enforcement;• A ‘level playing field’ in relation to the aid, taxes, subsidies and regulations that are
provided to the main alternatives to hydro (grid electricity, fossil fuels, PV, etc.);• A transparent policy framework (provided by the government or utility) for the
development of energy options in general and the expansion of the electricity grid inparticular (to reduce the risk of arbitrary or politically motivate expansion of the gridor other subsidised alternatives, such as PV);
• Capital supply systems (capital markets) able to supply adequate financial resources(grants, soft and hard loans, equity);
• Reasonable arrangements for collateral;• Government support to training, R and D, and ‘public goods’ such as information
about the resource base;• Systems for the competitive supply of technical and business support that is suited to
small scale enterprise in rural areas;• Adequate access to competitively priced micro hydro technology and related
knowledge;• Sufficient competitive suppliers with the technical capacity to select, design, install,
test, operate, and maintain the plant, equipment and civil works required by microhydro;
• Systems for defining and enforcing appropriate technical standards; and• Transparent and fair mechanisms for the sale of micro hydro electricity to the grid.
The following sections describe some of the features of the ‘enabling’ or indeed ‘disabling’environment that is confronting the expansion of micro hydro in practice. Much of the pre-existing policy environment was not designed specifically for micro hydro, and whilst it mayhave not been actively discriminated against, a large amount of complaints stem from the factthat governments forget about it as a viable option. Many of the negative effects are likely tobe unplanned. For instance governments subsidise grid electricity explicitly and implicitly for

46 Best Practices for Sustainable Development of Micro Hydro Power
a variety of reasons, but are unwilling or unable to extend the same concessions to micro hydro.Diesel engines are imported free of duty but not the technology associated with micro hydro,and so on.
But those that seek to ‘regulate’ the development of the micro hydro sector need to keep inmind that many of the regulations governing rural development merely provide anothermechanism by which those in power can exploit the weak by demanding bribes and other kindsof ‘rent seeking behaviour’.
4.13 The Regulatory Framework
The ad hoc nature of the regulatory framework governing micro hydro is illustrated by the caseof Sri Lanka. The regulatory framework is unclear and is characterised by a multiplicity ofinstitutions at various levels. The required approvals are illustrated in the following table:
Table 4-5: Approval Required for Micro Hydro Installations in Sri Lanka
Environmental approval or Licence InstitutionLetter of Support on general project viability & willingnessto purchase electricity (for Grid connected sites) tofacilitate other agency approvals
Ceylon Electricity Board(CEB)
Use of water resources, road development, construction ofbuildings & canals
Divisional Secretary /Irrigation Engineer etc. or,Pradeshi Sabha
Letter on site observations & recommendations onenvironmental impacts based on Environmental ImpactAssessment Questionnaire for Micro Hydro (1997)
Pradeshi Sabha orDivisional Secretariat to TheCentral EnvironmentalAuthority (CEA)
Electricity Licence to generate & sell electricity Chief Electrical Inspector,Ministry of Irrigation & Power
Investment & Tax concession for large infrastructureprojects
Board of Investments
Title or lease or permission on land use Land owner or DivisionalSecretary
In Sri Lanka, the Electricity Utility (CEB) limits its regulatory role to determining the standardsfor connecting private power generation to the national grid. Otherwise there is very limitedregulation in relation to off grid micro hydro. That regulation that does impinge on microhydro relates to use of natural resources such as lands, water and forestry resources. Land useis dependent on property rights where the use of public lands requires local government (at thelevel of the Pradeshi Sabha). The same approval is required with use of waterways.Regulation of waterways feeding irrigation channels come under the purview of a separateentity, the Irrigation Department.
When transmission lines within a village cross public land they do so without any permissionor approvals being sought and with no formalities encountered. If a micro hydro site requiressignificant use of public land however, either by a private developer or rural community,government lease procedures may apply and approvals obtained from both the Minister ofLands and the President. Private land is frequently used for the construction of micro hydro

Intermediation in Practice 47
powerhouse buildings with little regulation except for verbal agreements with the landownerwho is almost always a beneficiary in the project.
In Sri Lanka, non-state actors have often stepped in to fill gaps left within the state structure.Developments in micro hydro tend to ‘fall out’ of the plans and procedures of the formalelectricity generation and distribution systems. While there are specific standards forconstruction and installation of all electricity installations in Sri Lanka, they are not strictlyenforced in the village hydro sector, and were not specifically designed for the village energyuse. Construction and safety standards depend entirely on the people involved with the projectand the requirements of the institutions that provide the funds. In order to tackle this problemthe World Bank financed Energy Services Delivery (ESD) programme has commissioned astudy to establish appropriate standards in village-hydro electricity distribution systems64.
It is likely that environmental regulation will become an important feature of the regulationsgoverning micro hydro in Sri Lanka. The Central Environmental Authority (CEA) the mainbody overseeing environmental policy and regulatory processes developed an EnvironmentalImpact Assessment Questionnaire for Micro Hydro in 1997. This has many shortcomings, notleast that it does not distinguish between different scales of micro hydro plant, adding aconsiderable burden to very small systems65. Implementation is variable, as local governmentcapacity on environmental issues and regulations is generally weak and unclear. SomeProvincial Councils do have Environmental Officers but they are often marginalized in theinstitutional process and have little authority.
The situation regarding private power producers in Sri Lanka is still evolving. Private PowerProducers can only legally sell power to the Ceylon Electricity Board. However there can beexceptions if specific approval is given, although this permission is rare. Electricity ConsumerSocieties (in villages) avoid this problem by selling power only to their members (andtechnically they pay a ‘membership fee’ rather than a ‘fee for electricity’).
In Peru the regulatory environment also appears to by-pass micro hydro. What exists is aregulatory framework, largely related to the allocation of concessions aimed at promotingprivate investment in generating and distributing electricity. The legislation essentially leaves itto ‘market forces’ to select the technologies to be used to generate power and distributeelectricity to areas not covered by the electricity grid. In practice, however, the incentivestructure demonstrates a clear preference to support grid based electrification.
As far as the public sector is concerned, the institutional framework for rural electrificationconsists of The Ministry of Energy and Mines. Through its Executive Projects Directorate(DEP) it is responsible for expanding the electrical frontier throughout the country. A numberof other government institutions are involved, but their role is limited to financing schemes inrural areas. With the restructuring of the power sector since 1990, several municipalities willbe handing over the electricity services to concession companies, given the legal, financial andeconomic guarantees that make it attractive.
64 These specifications are based on relevant national and international standards. They specify separate standards for systemsunder 5 kW, between 5 to 15 kW and, systems between 15kW to 50kW (Village Hydro Distribution System Specifications forthe ESD Project, March 1999 Draft version, Intermediate Technology Sri Lanka). These specifications have been in use sinceJune 1999.65 Currently even sites 2-3 kW in capacity have to go through the process of filling in these environmental clearance forms andgetting the necessary approvals from the CEA and Provincial Councils.

48 Best Practices for Sustainable Development of Micro Hydro Power
Experience with Peru’s revolving fund shows that the criteria generally used in largerconstruction works in urban areas cannot be applied to micro hydro installations in rural areas.Technical standards and the costs of equipment, and machinery must be modified for smallprojects of this nature to ensure that they are appropriate to their rural surroundings.
In Nepal the Ministry of Water Resources (MOWR) is directly responsible for electricity andsupervises the Nepal Electricity (NEA) and Electricity Development Centre (EDC). EDC wasestablished in 1993 under MOWR to promote private sector participation and license both NEAand private power producers on behalf of MOWR. The EDC grants licenses for independentgeneration and sale to NEA and assists Independent Power Producers through a range ofactivities including site identification for small and medium scale projects. EDC supports theElectricity Tariff Commission (ETC) which was set up in 1993 as an independent body toregulate electricity tariffs and ultimately to arrange for the power sales between NEA andprivate power producers.
The Ministry of Science and Technology (MST) has a mandate to promote national science andtechnology and oversees the Alternative Energy Promotion Centre (AEPC). The mandate ofAEPC is to promote renewal energy technologies to meet the needs in rural areas of Nepal, butas a technology based organisation it does not become involved in creating appropriateframeworks for rural tariffs or the organisational frameworks necessary for the creation ofdecentralised power companies.
The Nepal Electricity Authority (NEA) is a semi-autonomous institution responsible for thegeneration and supply of energy. However neither NEA nor any other government authorityappears to be responsible for isolated grids. NEA has been able to cover 15 percent of the totalpopulation through expansions from the national grid. The service provided by NEA is largelybeen limited to urban and semi-urban areas. Micro hydro development is governed by two actspassed in 1992: the Water Resources Act; and the Hydropower Development Policy Act.Licenses are not required for running water mills, as they are considered a cottage industry. TheElectricity Act of 1993 opened up investment opportunities in the electricity sector fromnational, foreign or joint venture companies and made provision for concessional loans togenerate and distribute electricity. The policy has also waived the license fee for surveys,generation, transmission and distribution and stipulated that the Nepal Electricity Authority(NEA) will provide compensation to existing private owners and operators of micro hydroplant if the grid is extended to their customer area.
A particular void in appropriate institutional arrangements concerns the standardisation of theturbine-related components and quality assurance of the technical performance of the turbines.The Nepal Bureau of Standard could take a lead role in this.
4.14 The Special Case of Mozambique and Zimbabwe as New Entrants Into TheMicro Hydro Sector
Zimbabwe and Mozambique were included in the case studies to illustrate programmes at theearliest stages of development. In both countries the first micro hydro power plants wereinstalled in the 1930s. However, interest in this technology faded with the coming of gridelectricity and the hope that this would be extended to the remotest users. Both economieshave suffered civil war and although Mozambique seemed to be faring better than Zimbabwe interms of recent economic growth (at least before the devastating floods in 2000), every sectorof each economy has to compete for the available but inadequate resources. There is therefore

Intermediation in Practice 49
pressure to use the available resources (such as renewable energy resources) more efficientlyand to direct them towards sustainable options in trying to achieve economic growth.
In Zimbabwe the energy sector is going through important change. New policies and strategiesare being formulated to address needs, meet national objectives, regional and internationalobligations. There is also a renewed interest in decentralised (often renewable) energyresources. Most investment in the energy sector goes to the standard energy options of liquidfuels, coal and grid electricity, but this investment serves only between 10%-20% of thepopulation while the remainder, mainly in the rural areas, do not have access to modern formsof energy.
In both countries the utilities see the expansion of decentralised and small scale energy optionsas against their commercial objectives. There has been more activity and interest in small scalerenewables in Zimbabwe than in Mozambique. In Zimbabwe a range of stakeholders includingforeign donors have begun to develop the renewable energy sub-sector, spurred by suchprocesses as the World Solar Summit Process, and the attentions of the Global EnvironmentFund.
Zimbabwe has accumulated some experience on renewable energy technologies among them:wind; solar PV; solar water heaters; solar dryers; micro hydro; biogas; and, other biomasstechnologies. However, in Mozambique very few elements of the ‘enabling environment’ areyet in place at the national level for decentralised energy supply to thrive. The government’sability to formulate energy policy is professionally weak, and there is a clear need tosystematically review policies relating to energy pricing in general and electricity tariffs inparticular. Policies for supporting and financing small scale renewables also need to becomemore consistent. Local financing mechanisms are totally absent, and most of the initiatives inthe small renewables sub-sector have relied on external donor funding.
In both countries the strategy has been to demonstrate what micro hydro technology can do,using this experience both to gain familiarity with the technologies and to lobby government,and other agencies, about the role of decentralised (largely renewable) energy technologies.
In Zimbabwe a few plants providing milling services and electricity to remote rural areas havedemonstrated the potential of this technology. Some of the locations have had electricity morethan thirty years ahead of grid electrification, and at a significantly lower cost than competingoptions such as diesel engine generator sets or PVs.
Two micro hydro plants were examined in detail in each country. In Zimbabwe they werelocated at Nyafaru and Svinurai, and are both community-owned and benefiting from localsubsidies. In Mozambique the two plants selected were at Elias and Chitofu. In contrast theseare both privately owned schemes and were grant financed.
A conventional financial analysis shows schemes intended to produce mechanical power mightbe financially profitable whereas there is no return for Nyafaru which main purpose iselectricity generation for domestic end uses. This is mainly due to the high capital costs of theinstallation, low tariffs and low plant utilisation, usually at less than 50% capacity. In all theschemes, social objectives dominate the setting of tariffs, and no allowance was made fordepreciation in tariffs. Such schemes cannot be used to model loan finance unless theirutilisation can be increased and the tariffs raised.

50 Best Practices for Sustainable Development of Micro Hydro Power
In the Zimbabwe cases each type of consumer pays a different tariff, with households payingless than more commercial enterprises. Steps are being taken at both Svinurai and Nyafaruschemes to improve the utilisation of the plant and then increase the tariffs. At Svinurai agenerator awaits commissioning, due to extend power to commercial units at the farm. AtNyafaru there is a proposal to move down from around 5 Amp miniature circuit breaker (MCB)to 3.5 Amp MCB, in order to increase the number of users but maintain the same tariff at leastin the short term.
In both cases the communities and entrepreneurs do not look at the hydro plants as stand-alonebusiness units, but as part of bigger enterprises. All four plants show cross subsidies at thelocal level. However the movement and cost of finance, labour and materials at the local levelare not easy to track. This could be best tackled by building up the capacity to account for suchmovements and costs at the local level. Local capacity to account for costs and income shouldcomplement the capacity to operate and manage management such small enterprises. In thecase of Svinurai this is already happening through the efforts of various stakeholders assistingin building up the management capacity of the co-operative.

51
5
BEST PRACTICES: THE LESSONS LEARNED
5.1 The Critical Factors
• Micro hydro programmes and projects need clear objectives. Is the project orprogramme:
o An investment in social infrastructure (that will be considered in the same wayas a training scheme, a safe water supply, school, a health programme?);
o A programme to sell as many micro hydro schemes as possible (regardless onthe users' needs); and
o To create small profit making enterprises that are financially self-sustaining.• Financially self-sustaining projects have cash generating (usually day time) end-uses to
produce cash flow and increase the use of the plant (load factor). Lighting-only systemswill have the greatest difficulty in achieving financial sustainability.
• Subsidies are likely to be necessary if micro hydro schemes are to substantially improvethe access of poor people to electricity.
• The cost of micro hydro plants is dependent on location and standards althougheffective management can contain this.
• The form of ownership of micro hydro plant is probably less important to success thancreating an effective business-like style of management.
• Selecting and acquiring micro hydro technology that is appropriate to the location andtask remains a necessary condition for success (wrongly sized plant and inappropriatestandards remain a constant threat).
5.2 Best Practice and Profitable End-uses
• It is easier to make a profitable micro hydro plant socially beneficial than to make asocially beneficial plant profitable
• Profitable end-uses are difficult to develop because of the limited size of the localmarket and the general difficulty of small and micro enterprise development in remotelocations.
• Financial institutions willing to finance micro hydro should consider funding associatedend-use investments in order to build profitable load.
• It may well be that micro hydro should be promoted for its role in securing livelihoods,or developing small enterprises, rather than as an ‘energy programme’.
• The choice of end-use can affect those who benefit from micro hydro and will thereforeeffect the poverty and gender impacts, even if not all the community has direct access tothe energy.

52 Best Practices for Sustainable Development of Micro Hydro Power
5.3 Best practice and Tariff Setting
• The financial performance of all micro hydro plant could be improved if the averagetariff was kept in line with local inflation.
• Life line tariffs under which the richer consumers cross subsidise households thatcannot pay will spread the poverty reducing benefits of micro hydro - as long as thetotal revenue is adequate.
• While there is clear evidence that demand is sensitive to the tariff charged (manypotential users would be excluded by full cost covering tariffs in many locations), thereis also evidence that the ability of some people to pay is higher than originally thought.
5.4 Best Practice for Governments
• Governments need to assign clear responsibilities for micro hydro development and thedevelopment of the necessary ‘enabling environment’. Best Practice suggests that thiswould ideally be part of assigning more general responsibilities for the provision of de-centralised energy services to rural (or marginalized).
• Governments need to treat all energy supply options equally (‘offer the full menu ofoptions’) and to favour what best meets the needs of the consumer in different locations.
• Governments need to ensure fair competition between competing supply options andprovide equal access to aid and other concessional funds, subsidies, tax breaks andsupport.
• Plans for the expansion of the electricity grid should be rule based, and in the publicdomain to reduce the uncertainty about when the grid will reach a particular location.Clear rules should be published regarding the actions the grid supplier must make tocompensate micro hydro owners when the grid arrives (either to buy out the plant atwritten down costs or to buy the hydro electricity produced).
• While government finance tends to favour large scale energy investments (in say poweror fossil fuels), micro hydro has the opportunity of utilising local capital (even thecreation of capital through direct labour to build civil works) and it is part of the newtrend towards ‘distributed’ power with much reduced costs of transmission.
5.5 Best Practice for Regulation
• Regulation should aim to produce a structure of incentives that result in the needs ofconsumers being met most cost-effectively. It should be technologically neutral, and atcosts that are in keeping with the scale of the investment and the ability of the variousparties to pay.
• Regulation should be transparent, stable and free from arbitrary political interference soas to foster competition between suppliers of technology, services and finance.
• Regulation should set standards that are appropriate to the project cost and the ability ofthe various actors to pay.
• Quality and safety standards should be enforced to prevent the users being exploited byshoddy equipment and installations.
• Regulations should be designed so that they do not merely increase the opportunities for“rent seeking behaviour" of officials.
• Regulations should be set so that: independent power producers can supply power to thegrid at ‘realistic’ prices; and connection standards are appropriate for the power to besold. Rules should be transparent and stable.

Best Practices: The Lessons Learnt 53
5.6 Best Practice in Financing
• Best practice suggests that the expansion of micro hydro will continue to need both ‘softfunds’ and funds at commercial rates, particularly if micro hydro is to meet the needs ofpeople with low money incomes.
• Funding will be needed to cover capital costs, technical assistance andsocial/organisational ‘intermediation’.
• Micro hydro development will need to leverage funds from many sources includingthose for small enterprise development, livelihood development, technical assistancesocial infrastructure, as well as the more usual energy and environment sources.
• Micro hydro will need to widen the menu of financing options for acquiring both debtand equity, including leasing, novel forms of debt guarantee, and novel forms ofcollateral (e.g. in Peru the hypothecation of the cash flow from energy end-use, andmunicipal loans guaranteed by ‘intercept’ on revenues from Central government).
• Loan conditions should be simplified, and collateral conditions modified to suit localconditions for asset (land, equipment) ownership.
• Some financial institutions are likely to require training to understand the special needsand risks of micro hydro, or to build on analogous experience in other forms of ruralinvestment.
5.7 Best Practice for Smarter Subsidies
• Subsidies should be designed to achieve clearly stated objectives and should developrather than destroy markets.
• A particular problem with current subsidies provided by bilateral donors is that theyhave a tendency to ‘pollute the well’ – that is, they use their subsidies to spoil themarket for others.
• Smart subsidies should:o follow pre-established rules that are clear, and transparent to all parties;o focus on increasing access by lowering the initial costs (technical advice, capital
investment) rather than lowering the operating costs;o Provide strong cost minimisation incentives such as retaining the commercial
orientation to reduce costs;o remain technologically neutral;o cover all aspects of the project including end-use investments, particularly to
encourage pro-poor end-uses; ando use ‘cross subsidies’ within the project to pay for life line tariffs and other ‘pro-
poor’ recurrent cost subsidies (e.g. enable transfer from richer sections of thecommunity, and commercial users to marginal connections).
5.8 Best Practice for Donors
• Build programmes on a thorough understanding of what has already been tried before inthe country and elsewhere.
• Adopt funding strategies that enhance (rather than duplicate or destroy) localcapabilities including organisations, regulatory frameworks, and technical capacities.
• Maintain the ‘full menu’ of options, so as to give micro hydro the same chances forfunding as other decentralised energy supply options.
• Ensure funds build markets rather than destroy them - apply the principles of ‘smartersubsidies’

54 Best Practices for Sustainable Development of Micro Hydro Power
• Ensure funds are available for both micro hydro and associated end-uses. Giveparticular attention to the encouragement of pro-poor end-uses (and the views of womenas major players in traditional energy systems).
• Ensure funds are available for all aspects of project development.• Use soft funds to leverage access to large flows of more conventional loan and equity
finance.• Be transparent to make others aware of what you are doing and try to harmonise
activities with other donors, partners, equipment suppliers, contractors, and governmentprogrammes.
5.9 Best Practice for Project Developers
• Project developers who have the skill and tenacity to put all the elements of a microhydro plant together are crucial to the success of programmes, and are likely to be themain constraint to programme expansion, particularly if their costs cannot be coveredby grants
• Successful micro hydro programmes will need to be sufficiently large to producesufficient work for the project developers and to achieve economies of scale in thesupply of such services - such as where there are a number of plant in the same areaallowing for costs of site visits to be shared by a number of installations.
• Financial institutions and regulatory agencies need to strike a balance between theirneed for project developers they regard as credible (speaking English with formalqualifications in engineering and accountancy) and their cost. Best practice probablyrequires lower cost project developers with specific practical experience with microhydro and the communities that use them.
• The costs of ‘intermediation’ in project development should be recorded, and attemptsmade to cover them directly with grant funding.
• Efforts should be made to estimate the realistic size of the market for micro hydro,taking into account, costs, alternatives, and the likely availability of finance, so as todetermine whether the process of project development can be put on a more sustainablefinancial basis (including grants). Additionally the scale of project developmentcapabilities should be increased sufficiently so as to reduce unit costs by capturing theeconomies of scale.
• Technical assistance services should be separated from credit functions to ensure thatsound judgements are made about the financial viability of each project (with or withoutsubsidies) and credit worthiness of project owners.
• Consideration should be given to productive end-uses from the outset, and treat microhydro investment as a small enterprise (regardless of actual ownership structure).
• Endeavour to create a business like management structure, even if co-operative or otherforms of joint ownership are used.
• Attempt to institute rules for tariff setting and for inflation adjustments that aretechnical and routine rather than arbitrary and politicised (e.g. link the price ofelectricity to some other freely traded commodity - such as a staple crop, kerosene, orcandles).
• Successful programmes include activities that stimulate demand for hydro and thefinancial and other support activities that are available.
• Successful programmes include activities that lobby for changes in the ‘enablingenvironment’ created by government, financial institutions and donors. These are

Best Practices: The Lessons Learnt 55
probably most effective when operating as an ‘Energy Forum’ combining the interestsof all people interested in rural, ‘alternative’, or decentralised energy options.
• Project development would benefit from technical catalysts who can work in closeproximity to villagers at relatively low cost.
5.10 Best Practice for Capacity Building
• There would appear to be no short cuts in developing local capacities. The processtakes a long time and is costly, but without such capacities micro hydro programmescannot succeed.
• Local capacities to build micro hydro plants locally appear to substantially reduce costs• Local capacities to manage, operate and maintain micro hydro plants are a necessary
condition for success and resources will need to be devoted to building this capacity.
5.11 Best Practice for Management of Micro Hydro Plant
• Regardless of ownership structure, it would appear that the successful management ofmicro hydro plants requires a ‘corporate structure’ that minimises political interference(e.g. from municipal authorities or powerful community members) by providing cleardelegated authority to a management to achieve clearly stated objectives related toprofitability, coverage, and the quality of the service to be provided.


57
ANNEX
SUMMARY OF THE CASE STUDIES
1. SRI LANKA
1.1 The SampleThere are approximately 130 MHP plants66 currently in operation in Sri Lanka. Mostare less than 100 kW in capacity. The sample of projects were drawn from a total ofabout 7067 village micro hydro plants and 13 estate MHP sites. There is estimated to be60 estate MHP plants in operation. This number has been obtained from variousinformation sources68 as there are no database records for this category of MHP.
Although MH development dates back to the tea plantations in the pre-independenceBritish colonial era, the availability of data is extremely limited. The recent resurgenceof interest in MH in the 1980’s has generated a great deal of experience of improvedtechnology, but systematic data remains scarce.
Study criteria led to purposive selection of sites for in-depth review and assessment.The selected sites and the criteria are given in the table below:
Table A-1: Selected Sites and Criteria, Sri Lanka
Site Name District Date Ownership Capacity Source of Finance End-usePathavita 2 Matara 1997 Community 10 kW Loan + Comm. Ironing
centreKandaloya Kegalle 1998 Community 10 kW Loan + Grant /
Comm.Fridge &ice-making
Katepola Ratnapura 1995 ECS* 24 kW Grant + Comm. Rice millSeethaEliya
Matara 1985 Private 60 kW Private + Bank +Grant
Tea factory+ lighting
*Electricity Consumer Society
Four micro hydro sites representing different financing arrangements and end-uses wereselected to carry out the sample analysis on financial viability of such projects. Three ofthe sites have been established only during the last two to three years while the other hasbeen in operation for 14 years. At the first three sites energy sales to individualhouseholds are not metered; each household pays a fixed monthly fee with theunderstanding that the restriction on power use is adhered to.
66 Details of these sites are available through Intermediate Technology Development Group’s (ITDG) Sri Lankadatabase on MH (referred to as ITSL). These are listed briefly in the annex.67 This number is derived from ITDG’s Sri Lanka database, January 1999. Figures change periodically as more MHsites enter the pipeline or are implemented and incorporated accordingly into the database. See annex 1 for excerptsfrom this database.68 For more details see Country Report for Sri Lanka, December 1999.
58 Best Practices for Sustainable Development of Micro Hydro Power
Figure A-1: Map showing the locations of the case study sites in Sri Lanka
1.2 Case Study Details1.2.1 Site 1: KatepolaKatepola, a community-based village hydro project, is predominately financed bygrants, with equity contributions made by villagers in the form of labour and finance.No commercial loans have been used.
Village OverviewKatepola is a village with a population of 350 families situated in Ayagama secretarialdivision in the Ratnapura District. Inhabitants of Katepola are generally in the low-income category, earning their living from rubber, cinnamon and paddy cultivation, orby employment at the Dumbara Estate. The neighbouring village of Katepola,Umangedara, is home to the first village hydro scheme established by ITDG Sri Lanka.
Project OverviewThe Katepola village hydro plant using the flow of Thundola stream, has a capacity of25 kW. It consists of a stand-alone synchronous generator with an Electronic LoadController (ELC), supplying power to 106 houses and a rice-mill.

Annex: Summary of Case Studies 59
A significant part of the project cost was born by the ECS, whilst importantcontributions in the areas of technical assistance and financial co-ordination were madeby ITDG.
Table A-2: Katepoloya Scheme Profile (US$1998)
Capacity of MHP: 25 kWStart date: 1994Total Capital cost:of which Electromechanical:
Civil:Other* (incl transp/distrib)
US$54,529 US$21,664 (39.7 %)
US$23,874 ( 43.8 %)US$8,991 (16.5 %)
Grant: US$34,654
Connection charge per HH: US$64 in 1995 then US$174 from 1997HH allocation in Watts: 200 WHours of HH usage per day: 5 hoursCost per installed kW: US$2,181
Other costs: mainly transport and distribution for electricity generation schemes.
The management, financial control and load regulation is carried out by the ElectricityConsumer Society (ECS) established at the conceptual stages of the project. This is asociety formed by the villagers consuming the electrical power delivered by the villagehydro plant. The office bearers, selected at an annual general meeting are responsiblefor the management, which includes taking necessary action for breakdowns and anyother disputes arising from electricity usage within the community.
This village hydro scheme provides electricity to 106 houses; each supplied with 200Watts of power at a monthly charge of US$1.43 (Rs 100 in 1999) per household. Thescheme also powers a rice mill, which is supported through grant funding from ITDGand operated solely during the daytime. The mill is supplied with electricity free ofcharge while the income from rice milling is credited to the ECS after paying theoperator.
1.2.2 Site 2: Kandal OyaThis is a community-based project, predominately financed through the Energy ServicesDelivery (ESD) scheme, with equity contributions made by villagers in the form oflabour and finance. There is a great diversity of small-scale end-uses at this site.
Village OverviewKandal Oya is a remote rural village located approximately 23 km away fromYatiyantota, in Yatiyantota divisional secretariat of Ratnapura District. The communityis largely agricultural, with a reasonable household income. There is a high demand forelectricity for lighting and other household requirements.
Project OverviewThe project consists of a 10 kW stand-alone induction generator with an inductiongenerator controller (IGC) and presently serves about 88 households. This villagehydro scheme has been financed through the World Bank’s ESD project. The scheme isowned by a limited liability company formed by the membership of Electricity

60 Best Practices for Sustainable Development of Micro Hydro Power
Consumer Society, consisting of connected households. This is a legal entity set up tofacilitate the management and to support long-term financing and repayment.
Table A-3: Kandal Oya Scheme Profile (US$1998)
Capacity of MHP: 10 kWStart date: 1997Total Capital cost:of which Electromechanical:
CivilOther (inclu trans/dist):
US$31,148US$6,152 (19.8%)US$9,822 (31.5%)US$15,174 (48.7 %)
Loan interest: 0.16%Loan amount: US$8274Grant component of the loan: US$4468Repayment period: 5 yearsHH allocation in Watts: 100 WHours of HH usage per day: 5 hoursTariff per HH/month: US$3.85Cost per installed kW: US$3,115
1.2.3 Site 3: Pathawita 2This is a community-based project, funded through the ESD project, with equitycontributions from villagers in the form of labour and money.
Village OverviewPathawita is a remote village situated in the Matara District of the Southern Province,about 200 km from Colombo. The village, separated into two major sections by amountain, consists of around 200 houses spread over a large area of land. Thisdispersal of housing has created major barriers in supplying electricity to the wholevillage economically, and with an acceptable voltage profile. The closest access to thevillage is through Kotapola and off Beralapanathara in Kotapola Divisional secretariat.
Project OverviewThe site identified for the establishment of a hydro plant had a continuous potential of10 kW. With the financial assistance of the Rotary Club of Colombo-West, aninduction generator (capacity 5.5 kW) and an induction generator controller made inChina were imported and installed. At the initial stage, the project could supply powerto only 66 houses.
Table A-4: Pathawiata Scheme Profile (US$1998)
Capacity of MHP: 10 kWStart date: March 1997Total costs:of which Electromechanical:
Civil work:Other (inc.trans/dist)
US$22,031 12,811 (58.1 %)
5,926 (26.1%)3,294 (15 %)
Loan interest: 16%Loan amount: US$8,274Grant Component of the Loan: US$2,797
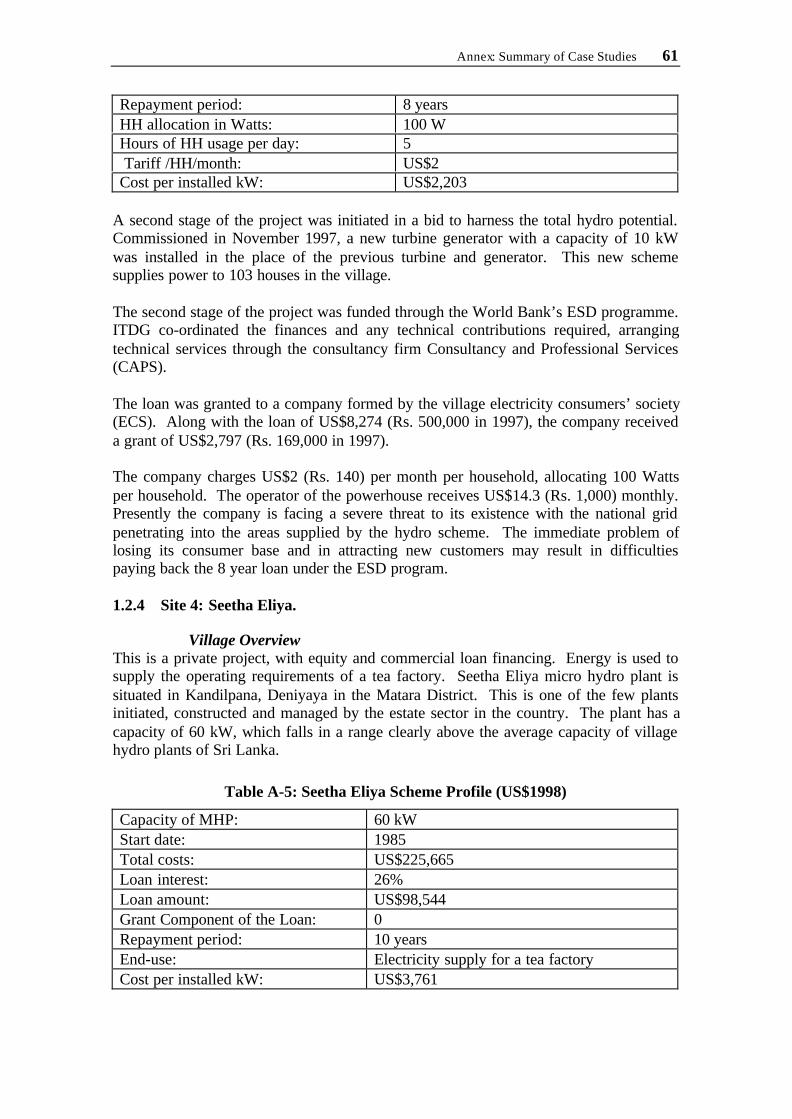
Annex: Summary of Case Studies 61
Repayment period: 8 yearsHH allocation in Watts: 100 WHours of HH usage per day: 5 Tariff /HH/month: US$2Cost per installed kW: US$2,203
A second stage of the project was initiated in a bid to harness the total hydro potential.Commissioned in November 1997, a new turbine generator with a capacity of 10 kWwas installed in the place of the previous turbine and generator. This new schemesupplies power to 103 houses in the village.
The second stage of the project was funded through the World Bank’s ESD programme.ITDG co-ordinated the finances and any technical contributions required, arrangingtechnical services through the consultancy firm Consultancy and Professional Services(CAPS).
The loan was granted to a company formed by the village electricity consumers’ society(ECS). Along with the loan of US$8,274 (Rs. 500,000 in 1997), the company receiveda grant of US$2,797 (Rs. 169,000 in 1997).
The company charges US$2 (Rs. 140) per month per household, allocating 100 Wattsper household. The operator of the powerhouse receives US$14.3 (Rs. 1,000) monthly.Presently the company is facing a severe threat to its existence with the national gridpenetrating into the areas supplied by the hydro scheme. The immediate problem oflosing its consumer base and in attracting new customers may result in difficultiespaying back the 8 year loan under the ESD program.
1.2.4 Site 4: Seetha Eliya.
Village OverviewThis is a private project, with equity and commercial loan financing. Energy is used tosupply the operating requirements of a tea factory. Seetha Eliya micro hydro plant issituated in Kandilpana, Deniyaya in the Matara District. This is one of the few plantsinitiated, constructed and managed by the estate sector in the country. The plant has acapacity of 60 kW, which falls in a range clearly above the average capacity of villagehydro plants of Sri Lanka.
Table A-5: Seetha Eliya Scheme Profile (US$1998)
Capacity of MHP: 60 kWStart date: 1985Total costs:of which Electromechanical:
US$225,665 US$102,748 (45.5%)Loan interest: 26%
Loan amount: US$98,544Grant Component of the Loan: 0Repayment period: 10 yearsEnd-use: Electricity supply for a tea factoryCost per installed kW: US$3,761

62 Best Practices for Sustainable Development of Micro Hydro Power
Project OverviewThis plant was constructed by Seetha Eliya Tea Factory with the main intention ofsupplying power to the operations of the factory, including lighting. The total cost hasbeen borne by a loan and an equity investment by the tea factory.
The plant was initiated with the aim of using streams in the land of the Seetha Eliya TeaEstate, thus relieving the burden of costly electricity bills. Construction of the plantstarted in 1983 and the plant was commissioned in 1985. Initially an inductiongenerator was used; later generation was transferred to a synchronous generator. Unlikeother micro hydro schemes, there was no grant component associated with the loan.Project financing was done through a commercial loan at an interest of 26%. Themanagement, financial control and load regulation is carried out by the factory itself.There is no separate management body for the plant and no separate income stream,apart from the avoided cost of grid electricity.
A major difficulty faced in the process of construction was getting the required approvalfrom local authorities. Most of the land within the tea estate has been used for theproject apart from around 0.5 hectares of land, donated by the owner of the estate tooutsiders in return for using their land for the pipelines.
1.3 Financial and Economic AnalysisThe key results and findings are presented in Table 669. Two sets of scenario wereconsidered.
Table A-6: Internal Rates of Return and Return on Capital Invested (IRRci)After Financing (%)
Katepolacur const
Kandaloya cur const
Pathewita 2 cur const
Seetha Eliya cur const
IRRci 14.7 8 15 9.3 32 16.3 24 12.4IRR Negative 10 6.9 6 3.1 24 12.4
The community-based projects with financing from the ESD programme (Kandaloyaand Pathewita) have an IRR in constant dollars of around 7% and 3%, while the schemewith total grant funding (Katepola) has a very low or negative IRR. The privately-owned project (Seethe Eliya) has a very high IRR, 24% and 12.4% respectively incurrent and constant dollars.
The return on capital invested (IRRci) in ESD project-based schemes is around 9% and16% in constant dollars. The present bank interest rates for cash deposits, and interestrates for treasury bills vary between 7% to 12% depending on the type of deposit.Considering these rates and the IRRci, it is apparent that projects financed under theconditions similar to those of the ESD project can be justified not only on socialgrounds, as in the case of all village hydro schemes, but also on financial grounds. Itcan be seen that IRRs of projects are below the interest rates paid for the loans (16%).If there is no grant component associated with the project, the community will find itdifficult to pay off the loan solely with the income they receive from the sale of
69 Detailed methodology and calculations are available from the country reports.

Annex: Summary of Case Studies 63
electricity. Unlike the ESD project-based schemes, the charging rate at Site 1 is notsatisfactory for it to remain financially viable.
Clearly the investment in Seetha Eliya can easily be justified by private sector financingowing to its high IRR, while Seetha Eliya itself avoids the high cost of grid-suppliedelectricity.
In the sensitivity analysis we considered several cases, in particular the impact on thevariations of the capital costs and the financing conditions on the IRR and the IRRci.Among the series of cases analysed, the most important was the sensitivity of IRR andIRRci to the capital costs and tariffs. This implies that the profitability andsustainability of the schemes will depend a great deal on the ability to build low costschemes with high plant factors, and deliver services based on realistic tariffs, i.e. adynamic policy of tariffs, while taking into consideration the ability of the beneficiariesto pay.
1.4 Conclusions from Sri Lanka• Village hydro70 projects are primarily meant for off-grid rural electrification in
remote locations and they tend to show poor financial viability on their own.• With a grant component similar to that of the ESD project, these schemes could
be financially viable, but the electricity tariffs need to be kept at a reasonablelevel as in the case of Kandaloya site.
• Within the community-owned village hydro (VH), small-scale individual end-use activities such as battery charging and ice-making are more sustainablethan large community-owned end-use activities such as rice milling.
• Private, productive end-use activities such as electricity use in a tea factorymake MH schemes very attractive in terms of their financial viability.
• Extension of the national grid into areas where village hydro schemes havealready been established jeopardises cost recuperation, contributing to poorsustainability of these projects due to their customer base being affected.
• It is worthwhile exploring the possibility of grid connection of such microhydro projects as an end-use where excess energy can be sold.
70 The concept of village hydro was introduced by ITSL and refers not only to the implementation of the scheme, butalso to the involvement of the local population from the decision-making process until the management.

64 Best Practices for Sustainable Development of Micro Hydro Power
2. NEPAL
2.1 The Sample and AssumptionsThe study areas include three MHPs located in the hilly regions of Nepal in the WesternDevelopment Region in the districts of Gorkhe, Kaski and Baglung where about 134MHP plants of more than 10 kW capacity (about 37%) are located. One MHP has beenconsidered from Illam District of Eastern Development Region where there were 35MHP (about 10%) above 10 kW capacity. Attention was given to the selection of plantswith electrification as well as processing facilities where power has been generatedusing cross flow and Pelton turbines.
Figure A-2: Map showing the locations of the case study sites in Nepal
The general characteristics of the selected plants are as presented in the table below.
Table A-7: Selected Sites and Criteria, Nepal
Region Scheme Owner Capacity(kW)
Turbine End-uses
Western Barpak Community 50 Pelton Milling Lighting Other
Western Gorkhe Private 25 Pelton Milling Lighting Other
Western Ghandruk Private 50 Pelton Milling Lighting Other
Eastern Gaura Private 25 Cross flow Milling Lighting Other

Annex: Summary of Case Studies 65
2.2 Case Study Details2.2.1 Site 1: Barpak Micro Hydro Power Project
Village and Project OverviewThis plant is located in Chhara Village, ward No.5 of Barpak Village DistrictCommittee (VDC) in the Gorkhe District situated in Western Development Region..The site is situated in the northern part of Gorkhe District and is not accessible by theroad. The plant is located 3.2 km from the settlement area. The source, Ghatte Khola,is located 375 m from the powerhouse. The annual income of the users is estimated atUS$36-72.
Works started in September 1990 and were completed in June 1992. There were nomajor problems apart than difficulties in the transportation of construction materials andplant to the site. The plant has been able to provide services to 538 households, covering3,362 people.
The consumers and other local residents were involved in civil construction works. Theconsumers contributed labour while other local residents were paid on a daily basisaccording to their skill. The borrower had to bear the cost toward the civil construction.
Table A-8: Barpak Scheme Profile (US$1998)
Capacity of MHP: Design capacity: 50 kWEffective capacity: 30 kW71
Start date: 1992Total Capital cost ($1990):of which Electromechanical:
Civil works: Other ( inc. trans/dist)
US$64,757 US$57,356 (88.6 %) US$4,344 (6.7 %)
US$3,057 (4.7 %)Loan interest: 17%Loan amount: US$35,913Subsidy: US$15,812Household end-uses: On average 3 bulbs of 25 Watts per household.
Morning 05.00h-06.00h, evening 17.30h-22.00h.
Productive end-uses: Ropeway, sawmill, grain milling.Tariff for domestic use in 1999:
Productive end-uses (sawmill, etc.):
38 US cents per month for 25 W bulb (fixedtariff)6 US to 7 US cents per kWh (metered)
Cost per installed kW: US$1,295
The use of power for commercial application seemed encouraging. A ropeway72 of 2.3km in length was established to operate cable cars, linking Barpak with Rangrungvillage. It was designed by Himal Hydro General Construction Co, Nepal, with a totalload capacity of 300 kg. Two cable cars are attached with 150 kg payload each. A totalof 30 kW is required to operate the system. The carrying time from Rangrung toBarpak is 15 minutes. The total system was completed at the cost of US$100,000,
71 Effective capacity in 1998, source ITDG.72 This scheme was badly damaged. The topography and the design seem to be the main causes.

66 Best Practices for Sustainable Development of Micro Hydro Power
funded jointly by British Embassy, ITDG and Northern Gorkha Development Group(NGDG). Local people contributed about 9 percent of the total cost in kind.
Table A-9: Source of Financing Ropeway between Barpak and Rangrung
SN Source of Funding Amount in US $ %1 British Embassy 65,714.29 65.712 ITDG 14,285.71 14.293 NGDG 11,428.57 11.434 People Contribution 8571.43 8.57Total 100,000.00 100.00
The ropeway is completely managed by the community. It has a nine-membermanagement committee fully responsible for operating and managing the system. Themanagement charges US$0.07 per kg for goods transported.
The owner established an agro-processing mill, at a cost of about US$971, which wassupplied by Katamandu Metal Industries (KMI). The mill has one rice huller and onegrinder, consuming 4 kW of power for each unit. The respective processing costs are 1US cent per kg and 0.9 US cents per kg. The huller has capacity to process 50-75 kgper hour while the grinder can process 34-41 kg per hour. A total of 20,000-25,000 kgof paddy is hulled annually at present. The grinder is able to process 60,000-80,000 kgof wheat, maize and millet annually.
Other Micro Hydro PlantsA traditional water wheel is still working at Baluwa village, located at Bhalswara, about4 km from Barpak village. It is mainly operated for agro-processing and the rates aresome 14 percent higher than those fixed by the owner of Barpak. However, the rate forgrinding is about 13 percent lower than the rate fixed by Barpak’s owner. In additionthere is one peltric set of 1 kW capacity installed around 6 km outside of the Barpakvillage. The power is used for lighting the owner’s own house only. The national gridis located roughly 1.5 days walking distance away.
Financial ResultsThe results show that without subsidy the IRR after financing, expressed in currentvalues, is 22.8%, which is a good return. However, the results expressed in constantdollars show a lower return of 17%. This latter rate is still in-line with the interest ratecharged by ADBN. The main explanation is that the increment of prices in currentterms is not correlated with inflation.
2.2.2 Site 2:Gorkhe Micro Hydro Project
Village OverviewThis plant is located at Rupatar village of Illam District in Eastern Development Region.The plant is situated at a walking distance73 of about 2 hours from the nearest roadheadwhereas the source, Jogmai Khola, is located at about 500 m from the powerhouse.
The annual income of the middle-class consumers is estimated at US$429-714. Theaverage income of the lower class family is estimated at US$171-286. The plant is 73 All distances expressed in hours are walking distance.

Annex: Summary of Case Studies 67
currently providing electricity services to 12 households with a population of about 80.The owner intends to expand the services to include an additional 55 households with apopulation of 450.
Project OverviewThe Gorkhe water turbine mill was completed in 1984. The plant has a 25 kW capacityand was the first plant installed in the Illam District. The cross flow turbine wasdesigned, manufactured, supplied, and installed by Development Consultancy Services(DCS), who carried out the technical survey. ADBN sub-branch office at Nayabazarconducted the financial feasibility analysis. The owner supervised and supported thecosts of all the civil works.
The electrification component was added in 1986, with battery charging and a drierinstalled in 1988. Domestically, electricity is used for lighting, radio, televisions andironing. The bulbs are easily available for US$0.43-1.00 in local markets. Theconsumers are also using low wattage electric cookers known in Nepal as ‘BijuliDekchi’.
Table A-10: Gorkhe Scheme Profile (US$1998)
Capacity of MHP: 25 kWStart date: Milling – 1984
Electrification, Battery Charging and CardamomDrying – 1986
Total Capital cost:of which Electromechanical: Civil:
Other
US$16,374 US$10,311 (63 %)
US$3,479 (21.2 %)US$2,584 (15.8 %)
Loan: US$8,269Subsidy: US$5,469Repayment period: 10 yearsHH consumption: 2-5 bulbs, 1 h/morning and 4.5 h/evening.Productive end-uses: Battery charger, cardamom drier.Tariff domestic end-use: 31 cents per month for 40 Watts (fixed tariff)Cost per installed kW: $655
Other facilities for income generating activities were installed in the next phases. Theowner installed a processing mill and agro-processing units at the cost of US$1,332 andUS$1,645 respectively. The facilities comprise of a huller, grinder and oil expeller. Heborrowed US$893 from ADBN as a working capital in 1986. The processing charges in1999 were: hulling, 0.6 US cents per kg; grinding, 1.25 cents/kg; and expelling, 1.56cents/kg. These rates are higher, in nominal terms, than those fixed some years ago.
The owner expanded his activity further in 1988, installing a cardamom drier suppliedby DCS as a pilot project. The drier was supplied at a cost of US$1,343, of which DCSpaid 50 percent as part of their promotion. The owner has contributed the balance -US$672, as his equity. The cardamom processing unit works seasonally for about fourmonths between August and November. The owner dries the cardamom harvested onhis farm, producing around 125 kg of dried cardamom annually from 400 kg of greencardamom. The final dried cardamom is of a fine quality and fetches a good price in the

68 Best Practices for Sustainable Development of Micro Hydro Power
market compared with cardamom dried in the traditional way.
The owner used his own resources to establish the battery charger. There is a constantload of 2 kW from the battery charger throughout the day. The load increases duringdaytime mainly due to the operation of a processing mill. The load characteristics of theplant are presented below. The rate for battery charging varies as per its capacity and isset at 63, 31 and 19 US cents for 12, 8 and 6 volt batteries respectively.
Figure A-3: Load Characteristics of Gorkhe Micro Hydro Plant
The owner fixes tariffs for domestic end-uses and income generating activities. Theconsumers have no complaint about the present tariff levels. An increment was madeon initial processing charges fixed during the year 1985-1990 for hulling, grinding andexpelling by 100, 300 and 50 percent respectively. This rate remained unchanged forthe years 1991-1995. The processing charges were again revised in 1996 and fixed at33 and 100 percent above the 1991 rates for hulling and grinding, whilst the rate for oilexpelling was reduced to 33 percent of the 1991 fixed rate.
Financial AnalysisGorkhe has the lowest cost per installed kW. This is certainly due to the fact that it isprincipally aimed at providing mechanical power and as such the capital cost perinstalled kW is relatively low. The return on the capital invested is 32% in constantdollars. If the scheme was not subsidised, the internal rate of return is above 17% incurrent dollars, but just 4% in constant dollars because of the disconnection between therate of inflation and tariffs.
Other Existing Micro Hydro PlantsA traditional water wheel is located about 4 km walking distance from the plant and ismainly used for agro-processing. The charge for processing is 1.4 US cents per kg, 0.7cents/kg and 2.15 cents/kg for hulling, grinding and oil expelling respectively74. Thecharge for hulling is 150 percent higher than that fixed by Barpak’s owner, the rate foroil expelling is maintained at the same level and the rate for grinding has beenmaintained at around 38 percent less. There is also a MHP plant of 64 kW, GorkheSana Jal Vidyut, located at about 1 hour walking distance. The plant was established bythe Small Hydro Power Development Project, funded by the Nepalese Government.
74 Usually charges are per 40 kg.
Load Management
-
5.00
10.00
1 4 7 10 13 16 19 22
Time
Loa
d in
kW

Annex: Summary of Case Studies 69
The plant is currently under utilised due to limited end-uses and NEA district officeapproached the owner to take over the plant. It requires highly skilled operators tooperate the plant and there is no plan at present to expand its services. The national gridis located at about 1 hour walking distance and there is no programme to expand theirline to that area.
2.2.3 Site 3:Ghandruk Micro Hydro Project
Village OverviewThe plant is located in Ghandruk village, in Kaski District, Western DevelopmentRegion. It is about 6 hours walking distance from the nearest roadhead. The distancefrom the nearest trail road to the site is about 100 m. The plant is located at about 200m from the settlement area, whereas the source, Chane stream, is located at 2.3 km fromthe powerhouse.
The average annual income of consumers involved in business is estimated asUS$2,000-US$7,000. The average annual income of the middle class and lower classfamily is estimated as US$430-US$700 and US$170-US$210 respectively. Agriculturalproduction and tourism are the main occupations of the community. The village is en-route to Annapurna base camp and is considered as one of most beautiful Nepalesevillages.
Project OverviewThe agro-processing mill was completed in 1985 and the electrification component wasadded in 1988. During the implementation phase there were no major problems apartfrom the transportation of construction materials and plant machinery to the site. Apelton turbine and generator were imported from Stamford, UK. The system wasdesigned, installed and supervised by DCS.
The plant experienced serious technical problems after it came on stream: low outputwas observed and the turbine shaft was broken after installation. The penstock pipe wasdamaged during the test run of the plant as a result of its poor quality and poorworkmanship. DCS reinstalled the penstock pipe free of charge. Because of thisincident the supplier installed a separate 16 kVA diesel generator in July 1991 whichsupplied power nightly until the MHP plant started operating again.
Table A-11: Ghandruk Scheme Profile (US$1998)
Capacity of MHP: 50 kWTotal Capital costof which Electromechanical: Civil:
Other
US$112,597 US$89,910 (79.9 %) US$19,308 (17.1 %)
US$3,379 (3 %)Start date: Mill – 1985, Electrification – 1988.Loan interest: 17%Loan: US$14,481Subsidy: US$73,499Hours of usage per day: Processing mill 6 hours per day.Tariff for domestic end-use:Hotel and lodges:Productive (sawmill):
0.8 cents /W/month1.2 cents /W/month1.2 cents /W/month
Cost per installed kW: US$2,252
70 Best Practices for Sustainable Development of Micro Hydro Power
The power plant supplies electricity to 241 households covering a total population of1900 people. The plant also supplies power to 22 hotels/lodges and 6 restaurants.Heating appliances are used by all the hotels and lodges. The plant is managed andoperated by the community with the support from Annapurna Conservation AreaProject (ACAP), a Non-Governmental Organisation (NGO). The community providedboth cash and voluntary work estimated at US$8,132. Daily wages were paid to thenon-beneficiaries. The borrower and ACAP contributed the remaining amount requiredfor the establishment of plant.
Most of the energy consumption takes place during the morning as a result of the waterheaters and refrigerators used at hotels and lodges. The load improved after theoperation of processing and saw mill units. Now the load is relatively uniform duringwhole day and evening. Load management becomes difficult during the dry season andwith the increase of domestic consumption. The load characteristic of Ghandruk MHPplant is shown below.
Figure A-4: Load Characteristics of Ghandruk Micro Hydro Plant
There are no connection or fixed charges, but a reconnection charge of US$1.43 appliesif the consumer’s consumption exceeds the power allocated75. For the processing unit,power supply is available from 10am to 4pm.
Financial AnalysisGhandruk is the least profitable scheme in financial terms. Even with the subsidy, thereturn for the investor is just over 10% in current values and 1% in constant dollars.The relatively high initial capital cost76 and the tariffs policy are key factors, explainingthis low profitability.
Other Micro Hydro PlantsA traditional water wheel, mainly used for agro-processing, is located two hourswalking distance from the plant. The processing charges are US cents 0.4 per kg forhulling and US cents 1.1 per kg for grinding.
A micro hydro plant has recently been installed at ward no 9 of Ghandruk with a totalinstalled capacity of 6 kW. It is located at a walking distance of about 3 hours from theexisting MHP plant. The plant is managed and operated by the community and the
75 Households are fitted with low cost circuit breakers. Power is automatically cut off when consumers use morethan the wattage allocated. Allocated supply usually falls between 40 W - 100 W.76. The capital cost per kW of Ghandruk is the highest of the four schemes of the Nepalese sample.
Load Management (Ghandruk)
-
20.00
40.00
60.00
1 4 7 10 13 16 19 22
Time
Loa
d in
kW

Annex: Summary of Case Studies 71
users’ committee fixes the tariff. The tariff is US$0.57 per month for 40 Watt. This isat least 100 percent higher than the tariff of the existing MHP plant in Ghandruk. Anewly constructed hotel has installed a diesel generator due to the lack of availablepower from the existing MH plant.
The charge for hulling is 150 percent higher than the rate at Ghandruk MHP. The ratefor oil expelling is maintained at the same level whereas the rate for grinding is about 38percent lower than the rate fixed by the owner of Ghandruk MHP. The national grid islocated about 1 hours walking distance away.
2.2.4 Site 4: Gaura Rice Mill (Harichaur Micro Hydro Project)
Village OverviewThe plant is located in Harichaur village in Baglung District in Western DevelopmentRegion. It is 8 hours walking distance from the nearest roadhead and 30 minuteswalking distance from the nearest trail road. The plant is located at the bank of DaramKhola, which is about 700 m from the village. Harichaur was previously the districtheadquarter, later shifted to Baglung. It is situated en-route to Dhorpatan, one of thepromising areas for tourists and trekkers. There is a holy place called Utar Ganga,which is located at a walking distance of about 3-days from the settlement. There is apolice station, a hospital, boarding school and short-wave communication transmittingstation. The main occupation of the community is agricultural production.
The annual average income of the consumers is estimated as US$170-US$290. Theplant supplies electricity to 236 households including 11 offices and institutionscovering 1575 people. Most of the power is used for household lighting, television andradios and to run the agro-processing plant.
The daily time saving of 1-2 hours has been used by the community to set up a kitchengarden and operate a Non Formal Education (NFE) programme. It is estimated thatabout 70 percent of the community (an increase of about 45 percent) have becomeliterate and the enrolment of girl students has increased every year. The study hours ofthe students has also increased, by 1-1.5 hours daily.
Project OverviewThe initial system was designed, installed and supervised by DCS who manufacturedand supplied the cross flow turbine. Nepal Machine and Steel Structure (NMSS) alsodesigned and installed a new turbine in 1997 which enhanced the output by anadditional 2 kW.
Table A-12: Gaura Scheme Profile (US$1998)
Capacity of MHP: 25 kWStart date: 1987Total capital cost:of which Electromechanical: Civil:
Other costs ( incl. transp/dist.)
US$54,000 US$35,785 (66.3%) US$15,330 (28.4 %)
US$2,885 (5.3 %)Loan interest: 17% average interest rateLoan: US$26,394
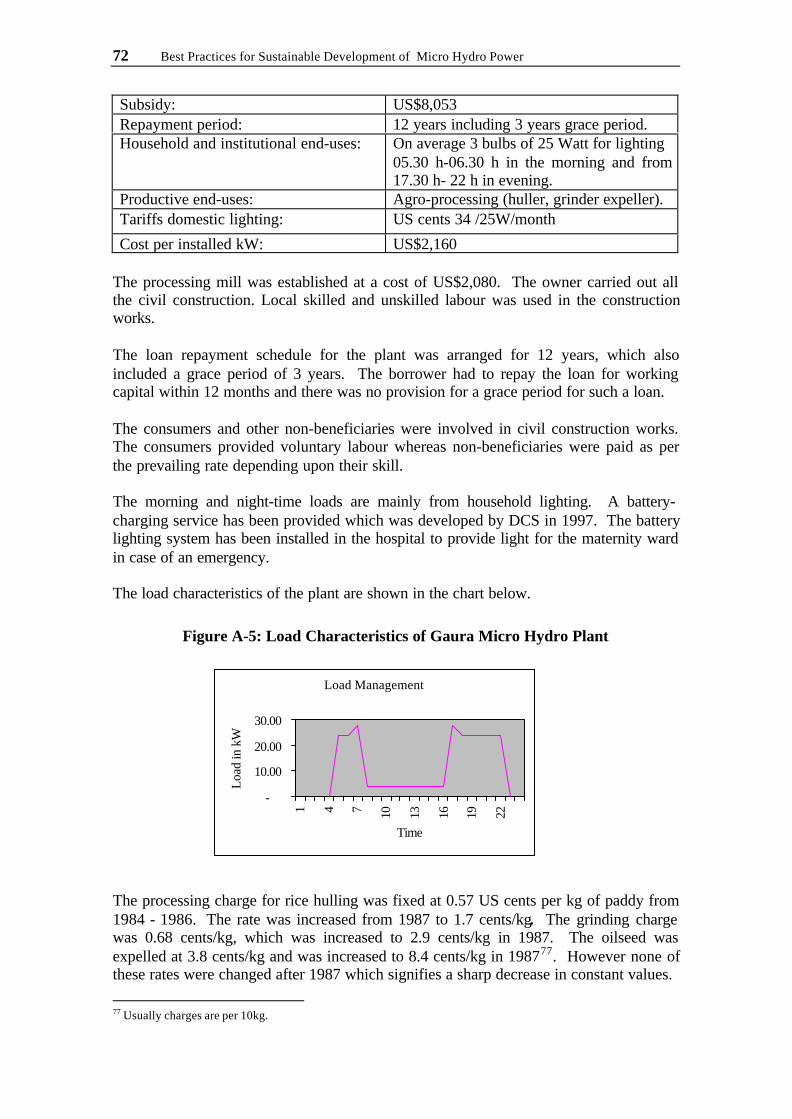
72 Best Practices for Sustainable Development of Micro Hydro Power
Subsidy: US$8,053Repayment period: 12 years including 3 years grace period.Household and institutional end-uses: On average 3 bulbs of 25 Watt for lighting
05.30 h-06.30 h in the morning and from17.30 h- 22 h in evening.
Productive end-uses: Agro-processing (huller, grinder expeller).Tariffs domestic lighting: US cents 34 /25W/month
Cost per installed kW: US$2,160
The processing mill was established at a cost of US$2,080. The owner carried out allthe civil construction. Local skilled and unskilled labour was used in the constructionworks.
The loan repayment schedule for the plant was arranged for 12 years, which alsoincluded a grace period of 3 years. The borrower had to repay the loan for workingcapital within 12 months and there was no provision for a grace period for such a loan.
The consumers and other non-beneficiaries were involved in civil construction works.The consumers provided voluntary labour whereas non-beneficiaries were paid as perthe prevailing rate depending upon their skill.
The morning and night-time loads are mainly from household lighting. A battery-charging service has been provided which was developed by DCS in 1997. The batterylighting system has been installed in the hospital to provide light for the maternity wardin case of an emergency.
The load characteristics of the plant are shown in the chart below.
Figure A-5: Load Characteristics of Gaura Micro Hydro Plant
The processing charge for rice hulling was fixed at 0.57 US cents per kg of paddy from1984 - 1986. The rate was increased from 1987 to 1.7 cents/kg. The grinding chargewas 0.68 cents/kg, which was increased to 2.9 cents/kg in 1987. The oilseed wasexpelled at 3.8 cents/kg and was increased to 8.4 cents/kg in 198777. However none ofthese rates were changed after 1987 which signifies a sharp decrease in constant values.
77 Usually charges are per 10kg.
Load Management
-
10.00
20.00
30.00
1 4 7 10 13 16 19 22
Time
Loa
d in
kW

Annex: Summary of Case Studies 73
Financial AnalysisThe internal rate of return on the capital invested is over 13% in current values but just3% in constant values. If we assume that the plant was not subsidised, the internal rateof return would be 7.39% in current values, with no return in constant values. This ispredominately the result of the stabilised processing tariffs which were kept unchangedfrom 1987 onwards.
Other Micro Hydro PlantsHarichour has numerous MHPs in its vicinity. An improved water wheel wasestablished in 1980 and is located at Hatiya village; about 45 minutes walk from theMHP. It has the same rates as the plant investigated. Also, a MHP plant of 7 kWcapacity was installed a decade ago under the loan assistance from ADBN and withsubsidies from the Nepalese Government. The national grid line is about 1-dayswalking distance from Harichour. A community-managed micro hydro of 50 kWcapacity has recently being installed at a working distance of about 45 minutes. Theplant was established with the grant assistance of US$29,851 from the Canadian Co-operation Office (CCO). The balance fund was arranged through a subsidy from theGovernment of Nepal, a loan from ADBN and equity from the community.

74 Best Practices for Sustainable Development of Micro Hydro Power
3. PERU
3.1 The SampleThis economic and financial analysis is based on four small-scale hydroelectric plants.The first case concerns Atahualpa farming co-operative. The power generated by thisMHP is used for income-generating activities, as well as for domestic and institutionalpurposes. A small entrepreneur owns the second plant and the power generated is usedentirely for an incubating plant. The third case consists of a public electricity service inthe district capital of Pedro Ruiz. The MHP is managed by the municipality andprovides electricity to the town of Pedro Ruiz. The fourth case is a public service in thePucará District, managed by an electricity distribution company.
Table A-13: Selected Micro Hydro Schemes in Peru
Atahualpa Yumahual Pedro Ruiz Pucará
Owned by Community Private Owner Community Private Owner
Capacity (kW) 35 10 185 2 x 200
Figure A-6: Map showing the locations of the case study sites in Peru

Annex: Summary of Case Studies 75
3.2 Case Study Details3.2.1 Site 1: Atahualpa Farming Co-operative
Village OverviewThe project’s objective was to provide the co-operative with a permanent and reliablesource of energy to improve the development of a previously implemented andflourishing agro-industrial activity. Before putting the MHP plant into operation, theco-operative had facilities for transforming farm products and had other machinery.These were fed by a low powered diesel generator with limited output and highproduction costs. The farming co-operative of Atahualpa-Jerusalén Workers has about58 members at present, of which 48 are active members and the other 10 are retired.
Project OverviewThe 35 kW MHP was set up as part of a demonstration project that ITDG promoted inCajamarca. The power generated by the MHP is used for productive activities, and fordomestic and institutional purposes.
Table A-14: Atahualpa Scheme Profile (US$1998)
Department, Province and District: CajamarcaSettlement: PorcónOwner: Atahualpa-Jerusalén Farm Workers’ Co-operativePlant capacity: 35 kWStart date: March 1992Total project cost:of which Electromechanical: Civil work:
Other costs
US$82,541US$31,116 (37.7%)US$19,009 (23 %)US$32,416 (39.3 %)
Number of domestic users: 28 families, no charges, assumed part of thebenefits of the Co-operative.
Use of energy: Carpentry workshops and milk processing plants.Domestic and institutional purposes (lighting,cooking, TV and radio); battery charging, andother services.
Cost per installed kW in US$2,358
The only workshops that produce earnings using the electricity generated in the MHPare the carpentry workshop and the milking and dairy unit. Both are seasonal activitiesand the annual consumption was estimated taking into consideration this importantparameter. In fact, the bulk of the consumption is currently absorbed by domestic end-uses.
The co-operative has a registry of users in which they record the number of fluorescenttubes and light bulbs. On average 3 fluorescent tubes and one light bulb per home areused, as well as electric appliances for both domestic and institutional purposes. Theannual consumption78 was estimated at 56,337 kWh/year according to the followingbreakdown.
78 Unfortunately the electricity meter installed in the MHP was not working properly and these figures had to beestimated.

76 Best Practices for Sustainable Development of Micro Hydro Power
Table A-15: Energy Consumption for Productive and Domestic End-Uses (kWh),Atahualpa
Domestic and institutional end-uses 47 347
Carpentry workshop 6 909
Milk and dairy 2 081
Total 56 337
Financial AnalysisThe MHP was financed with contributions from the Peru-Canada Countervalue Fund(67%), ITDG (12%) and the Atahualpa Co-operative, which provided US$12,000 formachinery as well as manpower and local materials for civil works. ITDG assumed thecommitment to supervise the works from start to finish and to train the operating andmaintenance staff. The finance structure was as follows (overleaf):
Table A-16: Financing breakdown for Atahualpa Micro Hydro Plant (US$)
Own FGCPC79 ITDGTotal Contribution Contribution
1. Institutionalexpenses
1,736,600 0 1,260,400 476,200
2. Investments 4,188,400 1,488,400 2,700,000 03. Installations 500,000 0 500,000 04. Transport 472,000 0 171,000 301,000TOTAL 6,897,000 1,488400 4,631,400 777,200Source: Power and Productive Development of the Cajamarca River Basin, MHP of Huacatas andAtahualpa, June 1990. Average exchange rate = 0.21 Soles per dollar (according to Cuanto S.A.Institute).
The selling price of the electricity was derived from the opportunity cost of theelectricity produced by a diesel generator, estimated at 18 US cents per kWh in 1998.The calculations were based on the average price of the fuel in the area, obtained fromlocal distributors and gave a life expectancy of 7 years for the diesel generator. Wehave assumed that the selling price increases according to the inflation rate.
Under these assumptions, the internal rate of return is 17.5% in current dollars and14.5% in constant dollars. Our calculations show that the project could be financiallyviable. However, this remains linked to the management of the scheme and policyregarding the payment of the electricity. Domestic users, who are not charged for thisservice, absorb the bulk of the power produced. It is obvious that a system of tariffs inline with the purchasing power of poor end-users will lead to a much lower IRR.
The initial investment in Atahualpa’s MHP had a high grant component as ITDG waspromoting it as a demonstration project. Standards of living have improved as a resultof the domestic supply of electricity for lighting, entertainment and even for cooking (1kW to 2 kW electric cookers). Despite this, little value is placed on the energy
79 FGCPC: Fondo General Contravalor Peru Canada.

Annex: Summary of Case Studies 77
produced by the MHP, due to the lack of control, limited internal regulations and aboveall, the non-existence of a charge for its use.
By making more electricity available, the project has also had a considerable impact oninstitution building. This is evident in the mechanisation of inventory and cost controls,lighting of public areas such as roads, and stronger income-generating industries.Religious activities have also been boosted by a radio station and lighting for thechurch. It is worth pointing out that religion plays a prominent role in community lifeand religious activities have been made more comfortable since spot lights,loudspeakers, videos and electric organs were installed.
3.2.2 Site 2: Micro Hydro for Productive End-Use: Yumahual Scheme
Business OverviewAll the production of Yumahual scheme is devoted to supply power to a privately-owned broiler chicken farm. The micro hydro scheme and the chicken farm belong tothe same person. The initiative to incubate fertilised eggs was promoted as an across-the-board business strategy aimed at reducing costs by incorporating activities and/orprocesses, thus severing the dependence on suppliers of broiler chicks. Only one personin the MHP is involved in supplying energy to the incubating plant. The same person isalso responsible for maintenance, for the entire process of incubation and hatching ofbaby chicks, as well as for selling soft drinks.
Project OverviewThe MHP has the capacity for 11 kW, of which 8.77 kW are used for incubation and theremaining 2.33 kW would be for future operations. The initial investment in the MHPin Yunahual was US$37,082, which was financed partly with a loan from a financialentity (82.2%) and partly with a donation from ITDG (10.3%). The investor contributedthe remaining 7.6%.
Table A-17: Yumahual Scheme Profile (US$1998)
Department and Province: CajamarcaDistrict and Settlement: Magdalena, YumahualStart date: October 1998Plant capacity: 11 kW (for 4 months a year the capacity of the
MHP is 4 kW due to the shortage of water)Owner: Mr. Andrés Leoncio Sangay TerronesTotal project cost:of which Electromechanical: Civil works:
Other ( inc. trans/dist)
US$37,082 US$14,062 (37.9 %) US$13,640 (36.8 %)
US$9,380 (25.3 %)Loan: US$30,000 in 1997Interest and repayment period: On average 6.5% per year; 5 years.Use of energy: Operation of an incubating plant.Cost per kW installed: 3,371 US$

78 Best Practices for Sustainable Development of Micro Hydro Power
In practice the effective capacity is 4 kW during low water stages in the Yumahualwatercourse (four months a year). The following will be the maximum annualproduction capacity of the MHP:
3 months × 30 days × 24 hours × 4 kW = 11,520 kWh8 months × 30 days × 24 hours × 11 kW = 63,360 kWh
This means that the MHP will have a maximum annual production capacity of 74,880kWh a year. This limited capacity requires an adequate management of the annual load.
It is worth noting that there were maintenance problems as rocks shifted due to rainfall,causing the MHP to stop operating on four occasions when it was necessary to resort toa small generator that was used for more than 26 hours in 1999, consuming 12½ gallonsof petrol.
The MHP supplies electricity for the incubation and hatching compartments, lightinginside and outside the incubating plant as well as for charging a battery that suppliespower to a short wave radio receiver/transmitter used for communication with the farm.
Table A-18: Energy Distribution in the Incubating Plant, Yumahual
Load Power (kW) Daily workinghours
Energy (kWh)
Incubator (1 of 3 units) 4,5 24 108,0Hatcher 4,0 24 96,0Battery charger 0,3 12 3,6Lighting 0,4 6 2,4Total 210
Source: Interview with the power plant operator.
A correcting factor of 0.8 was considered, because the incubator does not consume 4.5kW continuously as it has a power capacity of 1.5 kW that works perfectly. The totalannual consumption is therefore:
210 kWh/day × 30 days × 12 months × 0.8 = 60,480 kWh/year.
Our analysis is based on this figure.
CommentsThe same methodology and assumption as Athahualpa were used for Yumahual. Theselling price of the electricity was derived from the opportunity cost of the dieselgenerator, which was estimated at 17 US cents per kWh in 1998. The calculations werebased on the average price of the fuel in the area, obtained from local distributors and alife expectancy of 7 years for the diesel generators. We have assumed that the sellingprice increases according to the inflation rate.
Under these assumptions, the internal rate of return in current dollars is 17.6% and14.6% in constant dollars. This shows that the project could be financially viable. Forthe entrepreneur the choice of micro hydro for electricity generation seems a betteroption since the cost per kWh is cheaper than the cost of a diesel generator. However, if

Annex: Summary of Case Studies 79
we assume that there are no incentives, such as soft loans, the up-front capital could be amajor constraint in the replication of similar micro hydro projects.
The promotion of small-scale companies in Cajamarca requires a change in behaviourpatterns, as, by tradition, this area primarily produces consumer goods (mainly farmproducts). In this respect, the Yumahual MHP has two potential roles, the first togenerate income, and the second, in demonstrating alternative end-uses for MH power.
3.2.3 Site 3: Public Electricity Service in Pedro Ruiz
Village OverviewPedro Ruiz town is strategically situated at the junction of two main highways. The firstof these connects the higher jungle with the northern coast (Chiclayo, Piura, etc.), andthe second links the coast and the highlands (Chachapoyas, Celendin, etc.).Consequently, Pedro Ruiz is a resting point for travellers to these areas.
Project OverviewElectricity generating comes from two watercourses - Ingenio and Asnac. The plantdesign capacity is 200 kW and the effective capacity is 140 kW leading to someshortage of electricity supply in the growing town of Pedro Ruiz. In 1980, MHPactivities began under the responsibility of Electronorte (a state-owned regionaldistribution company). Ten years later, the district municipality of Jazán took over therunning of the MHP.
The staff here have not been adequately trained to carry out their jobs. One operator hasbeen there since the previous administration and he took it upon himself to teach theother operator despite the fact he was not well trained. No consideration was given tousing skilled staff for corrective plant maintenance, instead people with no MHPtraining were hired, for example, electricians used to solve the mechanical problems.The plant is consequently rapidly deteriorating.
Table A-19: Pedro Ruiz Scheme Profile (US$1998)
Department, Province and District: Amazonas, Bongara, JazánTown: Pedro RuizOwner: District Municipality of JazánStart date: 1985Plant capacity: Design capacity 200 kW; Effective capacity
140 kWTotal project cost:of which Civil works: Electromechanical:
Other costs (inc.trans/dist)
US$1,126,075US$28,477 (2.5 %)US$806,162 (71.6 %)US$291,436 (25.9%)
Number of users and loadmanagement:
722 users.• Monday to Fridays: 10:00 a.m. to 5:00
a.m. (total: 95 hours)• Saturdays: 2:00 p.m. to 5:00 a.m.
(15 hours)• Sundays: from 8:00 a.m. to 5:00 a.m.
(total: 21 hours)Cost per installed kW US$5,630

80 Best Practices for Sustainable Development of Micro Hydro Power
In order to save energy, the use of fluorescent lights was established, both for domesticpurposes and for public lighting. The peak hour is 6:00 p.m., which causes difficultiesfor certain commercial activities, such as photocopiers.
Financial AnalysisThe calculations are based on a historical interpolation from 1996 data - assumingenergy demand from 1980 to 1996 grew at 3.10% and connections grew at the rate ofpopulation growth (i.e. the 1996 figure for sales is extrapolated backwards). Theeconomic-financial analysis of Pedro Ruiz shows that there is no return in constantdollars when the plant was financed by relatively soft loans. This is mainly due to thehigh initial capital costs80 and relatively low tariffs.
The following entities participated in the construction and implementation of the MHP:
Project Funding: Central Government
Civil Works: The firm Opil
Electrical-mechanicalEquipment and Networks:
Electronorte
Manpower: Population of Pedro Ruiz andneighbouring communities.
The total investment was slightly over US$0.5 million in 1979.
Table A-20: Structure of the Investment, Pedro Ruiz (US$Current)
Total US$
1. Land in which the power house is situated 55,728
2. Civil works 1,268,401
3. Electro-mechanical equipment 35,906,336
4. Grids and electrical facilities 12,924,882
Total (US$) 50,153,346Source: Initial Inventory of the Electricity Area at 17th October 1990 adjusted to December 1979.
There are three main categories of income: connections for new subscribers; sales ofenergy; and other income, such as reconnections or payments for arrears. Newsubscribers were taken into account for the calculation of the MHP’s income from thesale of electricity and other income. Meters were considered part of the capitalcontribution as the municipality considers them as fixed assets. On average, 92% of theincome is obtained from selling the service and from subscriptions.
The rate structure has hardly changed since 1996. Payment dates vary between the firstten days of each month, after which default interest is charged. The rates were
80 Out of the16 schemes investigated, Pedro Ruiz has the highest cost per installed kW.

Annex: Summary of Case Studies 81
established during the previous municipal government by agreement with the council.The population’s interest in keeping the service as cheap as possible prevailed.
The registration fee for new users is US$49.00 (since 1997) and they have to buy theirown meter and accessories. The average rate per kWh charged is US$0.032. In case ofno payment the following sanctions are contemplated:
• Simple re-connection: US$1.12• Re-connection due to overdue payment: US$1.87• Unauthorised handling of meter: US$3.74• Extending the service to another home: US$5.61• Repetition of (a) and (b): service suspended for 8, 15 and 30 days, respectively.
The default interest rate is equivalent to 4% of the monthly bill per day; the electricity iscut off after 60 days. According to the administrator, no sanctions are being applied atpresent due to a change in the municipal administration, indicating that consumers havebecome used to paying their bills on time.
As regards the theft of posts and cables, the administration addresses the culpritsdirectly and demands the respective payment; if payment is refused then a complaint isfiled at the police station. There is no fine for offences of this nature.
Table A-21: Income From the Sale of Electricity, Pedro Ruiz (US$Current)
1996 1997 1998
Income from the sale of energy (US$) Average annual consumption
2,134,152661,680
2307629682197
2,518,682703,351
Average Price of Energy (US$) 32 34 36Other income (US$) of which 725,690 632,120 659,607 Reconnections 60,220 15,341 13,932 Payment arrears 174,510 215,511 182,792 Various changes 319,115 408,268 462,883 Others 171,845 - -
Total income Source: District Municipality of Jazán, Electricity Area
Cost AnalysisThe total costs are summarised in the following table. Under our assumptions the costper kWh comes to US$0.14.
Comments:The initiative of the authorities of Pedro Ruiz and the population in general to take overthe MHP marked a significant change in the quality of the services. It must be stressed,however, that municipal elections and consequent changes of authorities do notinfluence the electricity service. The funds are managed adequately despite the technicaland economic limitations. In this respect the current administration has been successful.Nevertheless, the management model is far from being worth replicating, considering itsearning potential and the size of its user-base.

82 Best Practices for Sustainable Development of Micro Hydro Power
It is also worth mentioning that the entire economy was going through a serious crisis in1990 that affected the management and supply of electricity services. The new legaland institutional framework governing the electricity sector promotes private investmentas well as quality. As a result of this state initiative, several municipalities will behanding over the electricity services to concession companies, given the legal, financialand economic guarantees that make it attractive to meet the electricity requirements ofusers in remote areas.
3.2.4 Site 4: Public Electricity Service in Pucará District
Town OverviewThe town of Pucará is a nexus for cities like Chiclayo, Trujillo and Lima, as all farmtraders and transport are required to drive through it. Like the town of Pedro Ruiz,farming is the main activity, and the main crops are coffee, cocoa, rice and fruit. Themain access to Pucará is the “Marginal de la Selva” highway, a fully paved road(Chilcayo-Pucará) that connects the town with the main towns on the coast and in thejungle (Jaén, Bagua, and Chachapoyas). Pucará is home to major institutions: thedistrict municipality, the medical post, the national police force, and Electronorte,among others.
Project’s OverviewThe MHP supplies electricity to 972 users in the towns of Pucará and Pomahuaca,consuming an average of 98.4 kWh/month per family, with an estimated power capacityof 53.3%, given the peak hour demand of 120 kW. Business activities have increasedsince this plant started operating, as farm products can now be traded withoutrestriction. Furthermore, service activities have developed, such as small restaurants,shops, photocopying services, welding, carpentry and sewing workshops, etc.
Table A-22: Pucará Scheme Profile (US$1998)
Department, Province and District: Cajamarca, Jaén, PucaráTown: PucaráOwner: 1986 – 1991, Electroperú
1991 – 1998, Electronorte1998 onwards, Gloria Group
Start date: 1986Number of users: 972 current users, of which 810 have a
meter.Plant capacity: 2 x 200 kW, Effective capacity 200 kW.Total project cost: US$454,460Cost per kW installed : US$1,136
Water for generating electricity is obtained from El Chaupe watercourse. The MHP hasa plant capacity of 400 kW with two power generating units of 200 kW each. Themaximum demand is 284 kW. The plant’s effective capacity is currently equivalent tothat of one generator as the speed regulator of the second unit is damaged and there is ashortage of water during the low-water stage. Consequently, there is an auxiliarythermal generator with an effective potential of 150 kW. The demand during 18 hours aday does not exceed 150 kW, which is equivalent to the power generated by onehydroelectric generator, providing that water is available.

Annex: Summary of Case Studies 83
The MHP came on stream in 1986 under the responsibility of Electroperú.Subsequently, in 1991, the management was transferred to the regional companyElectronorte. This firm was transferred to the private sector in 1998 and the Gloriagroup became the plant’s new owners. The Electronorte Office in Jaén (a unit ofCajamarca), which depends on the main office in Chiclayo, is responsible for thesystem.
The MHP in Pucará was financed with the participation of the Agency for InternationalDevelopment (AID) and Electroperú. The latter was responsible for implementing theproject. As far as the finance structure is concerned, only the Physical Inventory of theworks was accessible, showing the network expansion structure but not civil works orelectrical-mechanical equipment. Nevertheless, according to the information obtainedfrom Ministry of Energy and Mines publications, the cost of the MHP was equivalent toUS$454,460.
Source of IncomeThe registration fee for new users is US$50.00. The Jaén office establishes this fee andthe finance method. By December 1998, 972 authorised users were registered.
Income from new users’ subscriptions, sale of energy and other income were taken intoaccount to calculate the MHP’s income.
Table A-23: Estimated Income, Pucará (US$Current)
1996 1997 1998Annual Average Energy (kWh)Income from the sale of energy(US$)
1,306,80079,458
1,337,42883,721
1,368,77459,763
Average price of energy (US$) 6 6 4Other income (US$) of which 725,690 632,120 659,607 Payment arrears and interest 165,600 267,800 235,600 Reconnection 146,600 76,600 55,400 Replacement and maintenance charges
189,500 172,300 156,400
Source: Interview with the power plant’s operator.
The total running costs estimated for 1998 were US$59,351. More than half of thisamount was spent on paying the operating and maintenance staff (54%), whilst securityservice costs were equivalent to 46% of the total cost. Hence the decision to reduce thenumber of staff.
Financial AnalysisThe calculations show that the internal rate of return before financing is just 8% whencalculations are expressed in nominal values. This is beyond the discount rate of 18%usually used for projects implemented in Peru. In constant terms and after financing,there is no return.
84 Best Practices for Sustainable Development of Micro Hydro Power
CommentsTaking into consideration the government’s plans to expand the networks, it is verylikely that the Pucará MHP plant will be connected to the general Electronorte networkin the medium term. This would certainly improve the project’s profit margin as thediesel generator would be no longer needed, and staff expenses would be cut down asthe electricity supply in Pucará and Pomahuaca would be re-organised and sold throughthe grids.
The electricity service in Pucará has become more profitable as the management hasimproved. This improvement in management is in part due to the restructuring of thedistribution company that took place before it was privatised.
As in the previous case, the donation is critical in the project’s earning capacity,suggesting that even for services of the size of those provided in Pucará, a soft loanfinancing scheme is required. Pucará is probably within the limits of the type ofprojects that need strong financial backing in order to operate under the currentcircumstances in this country. Larger projects would have to be self-sufficient, even ifthe management acquired higher skills in order to reduce energy production costs andlosses, improve distribution and increase income and collections.
3.3 Key Conclusions PeruIn all these cases part of the investment was covered by a grant provided by privateorganisations or the state. It was difficult to obtain examples of plants where costs werefully covered by the owner. Even in the case of the private owners, part of the totalinvestment (studies, technical assistance among others) was provided in the form of agrant.
At first sight, the financial situation of the projects analysed is not very encouraging.Future prospects may be better however: the economy is fairly stable (the possibility oftraumatic changes seems remote); the government is promoting clear regulations for theelectricity business; and government policies are placing priority on the struggle againstpoverty, showing a preference for overall projects in which energy is a component. It istherefore expected that experiences like those of Atahualpa or Yumahual (less than 100kW) will be disseminated and that under the current regulatory framework, appropriatemanagement alternatives will be proposed for projects like Pucará and Pedro Ruiz(more than 100 kW).
The following are the key lessons to be considered for the future:• The sustainability of micro hydro plants requires not only adequate technical
training in operation and maintenance but also business and managerialtraining from the design stages of the project.
• The lack of credit for micro hydro is a constraint, but its availability does notguarantee project sustainability. Good project design and careful risk analysisof productive activities are a must.
• The best prospects for economic and financial sustainability exist for projectsthat use the energy produced for a diversified portfolio of productive activities,and not just for domestic lighting.

Annex: Summary of Case Studies 85
• Financial and economical sustainability of a plant will be adversely affectedwhere there are high costs associated with plant installation (due for instance toover-design, wrong selection of equipment.
• Although no conflicts over the use of water were observed in these cases, it isnecessary to establish a water utilisation system for low water stages, whichdoes not limit the power generating capacity.

86 Best Practices for Sustainable Development of Micro Hydro Power
4. ZIMBABWE AND MOZAMBIQUE
4.1 Case Study Details
4.1.1 Site 1: Nyafaru Micro Hydro Co-operative: Domestic and Services End-Uses
Village OverviewNyafaru Co-operative Farm covers 600 hectares of land. It is run by a committee ofseven chosen from the membership at the farm. The committee is accountable to aboard of trustees. For purposes of management the farm is divided into units including:the clinic; fisheries; schools crop production and retail. Sub-committees run each ofthese units.
Until the current hydro project was commissioned, people on the farm depended onparaffin and candles for lighting. A wind generator installed at Nyafaru more thanfifteen years ago was never commissioned because it was wrongly designed for the siteconditions. The use of solar PV at the clinic and a wind electricity generator at the shopwere discontinued with the advent of hydro electricity because the micro hydro plant ismore reliable. A diesel engine generatorthat had been operating on the farm wasalso disconnected because of highoperational costs.
Project OverviewThe Nyafaru plant was commissioned in1995. A Nepalese expert in designing andmanufacturing cross flow turbines washired to help with local construction of across flow machine. Four local technicianswere simultaneously involved in building-up the turbine and in training with aNepalese expert. ITDG planned the courseand provided overall guidance. Thetraining covered all components of theproject, including installation,commissioning, operation andmaintenance. A small-scale workshop atCold Comfort Trust (CCFT) in Harare andthe University of Zimbabwe’s mechanicalengineering workshop provided facilitiesand materials.
The plant generates about 20 kW reliably,which is used by a shop, a clinic, one primary and one secondary school, and farm staffhouses. The scheme is run by the Nyafaru Hydro Committee (NHC), composed ofrepresentatives from the various units using the electricity, the chairperson of the co-operative, and three co-opted teachers. The hydro committee is responsible for setting-
Nyafaru, Zimbabwe, inside the powerhouse
E3 Z
imbabw
e A5.10
ITD
G / Z
ul

Annex: Summary of Case Studies 87
up and implementing electricity tariffs. A fixed monthly charge is levied on each user.The tariff levied per user depends on the upper limit of the load for that consumer. Aminiature circuit breaker (MCB) installed at each user sets this upper limit. The tariffsare set at socially attractive levels supported by a generous subsidy from the school.When the hydro plant incurred a debt of about US$532 in 1998 (Z$ 11,400), the schoolprovided an interest free loan.
The domestic load consists of about twenty households, mostly teachers, nursing staffand the co-operative chairman. Other farm workers have not yet been connected mainlybecause they have not been able to afford the installation charge. Of the connectedhouseholds about 80% already have radios and televisions powered by the plant.Benefits have been spread to the community beyond the farm through electrification ofthe clinic, schools and shop. Over 200 school children on the boarding facility havemoved away from using paraffin lights and candles, to electricity. A weaving shop usedmainly by women has been electrified. This has enabled the women to engage in theirweaving activities well into the evenings. The improved service at the clinic benefitsmainly women and children who are in the majority within the farm and the surroundingrural community. Women’s presence in the committee is a sign of their participation inthe running of the plant. The provision of electricity for refrigeration has played a vitalrole in increasing sales to a larger number of customers, some coming from distantplaces like Magadzire, Tsatse and Gairezi.
There is a marked difference between the load pattern at planning stage and aftercommissioning. During the planning phase an analysis of demand showed a peak of17.5 kW and an average of 6 kW. However, the demand forecast included a mill and atrout farm, which have not been connected.
Table A-24: Nyafaru Scheme Profile (US$1998)
Capacity of MHP: 20 kWStart Date: 1995Total Capital Cost:of which Electromechanical: Civil:
US$66,156 US$21,382 (32.3 %)
US$14,980 (22.6 %)US$29,794 (45 %)
Connection charge per HH: US$73End-Uses: Domestic, services.Tariff hh/month: US$2.65 (Z$30) per 5A connected
initially, now US$7.1 (Z$80) per 5Aconnected (1999).
Cost per installed kW: US$3,307
Financial and Economic AnalysisThe Nyafaru scheme was financed through grants from external organisations andcontributions by the Nyafaru community. The grants were negotiated by ITDG in closeliaison with the community. The main funders for the design and construction of thisscheme included: the European Commission; Cadburys; the UK Overseas DevelopmentAgency (ODA); and German Agro Action (GAA). These funds covered technicalinputs from ITDG, local contractors, local and external consultants, local labour and allmaterials including electricity transmission and distribution lines. The grants were also

88 Best Practices for Sustainable Development of Micro Hydro Power
extended to connecting the shop, clinic and a few blocks at the school. Each of theconnected user/group paid for their connection. These users consisted of the remainingschool blocks, teachers’ and nurses’ houses.
The investment cost of the scheme was about US$3 307 per kW81. However, this was aprototype project with high external costs and the design was rather conservative.A tariff based on meeting operation, maintenance and depreciation costs has beenrecommended, but the hydro committee is not yet implementing it. Indications are thatunless tied with some income generating activities the communities are unable to meetthe tariff. When the project came on stream only the shop, the clinic and the schoolwere connected. By the end of 1996 about nine households had been connected. Thefixed monthly charge of US$2.5 (Z$30) for each 5A connected in 1996, had risen toUS$7.1 (Z$80) in 1999. In other words, a consumer with a 15A supply paid US$21 permonth. This type of tariff structure has encouraged the consumer to fully utilise theinstalled capacity whilst stimulating the connection of new consumers.
From the records available the plant has experienced down time of about 50 days peryear. The annual electricity consumption is estimated at about 57 000 kWh. However,meter readings of power over a nine-month period from November 1997 seem tosuggest that the load factor is around 43%.
In trying to build up a picture of the cashflow situation for the plant the following pointswere noted:
• The cost of getting the power from the nearest distribution pole to the userconstitutes the connection costs and this is borne by the user.
• Average connection costs have been used in the analysis.• It is assumed that the Civil Engineering Index on plant can be used to predict
inflation on the power plant.• It is assumed that investment costs for the plant was incurred over one year
only.• Inflation on labour is assumed to be about 30% per annum. This is confirmed
by an analysis of the payments to the operator.• The US$532 (Z$11,400) borrowed from the school to pay for otherwise
avoidable damage to the equipment was in the first quarter of 1998. It isassumed that in future preventive maintenance will be practised to avoid suchdisasters.
• It is assumed the tariff increases by 15% each year. ZESA is increasing itstariffs at 15% per quarter.
Nyafaru scheme was almost entirely funded by grants. The IRR is extremely high if thegrants are considered as an income. We have therefore assumed that the capital isborrowed from a renewable energy fund such as the UNDG-GEF Solar fund. This fundlevies an annual interest rate of 15%. We have considered a repayment period of fiveyears. A period of twenty-five years has been selected as the minimum life of the plant.Under these assumptions the internal rate of return is 8% in current terms and there is noreturn in constant dollars. This is largely due to the rather low load factor and the highinitial capital cost, and the tariffs increase which is below the rate of inflation.
81 S Fernando, S Khennas and K Rai, ITDG Zimbabwe Micro Hydro Project Evaluation, 1997.

Annex: Summary of Case Studies 89
4.1.2 Site 2: Svinurai Micro Hydro Mill
Village OverviewThis was originally a commercial farm called Tabanchu. It is located at Cashel, about80 km south of Mutare. In the early 1980s, government bought it for resettlementpurposes. This scheme is run by a Micro Hydro Committee, which is composed ofelected people from the general membership of the co-operative. The committee is alsoresponsible for setting and implementing electricity tariffs after consulting the generalmembership. Membership of the co-operative has fluctuated over the years, butaverages about 23 people. A committee of seven runs the farm.
Milling is one of the minor activities at the farm. Although it does not stand out as amajor activity, the mill has provided the co-operative with a more consistent source ofincome than the other activities. Apart from the co-operative members, the 280households in the surrounding community benefit from the milling service. The mainbeneficiaries are women and children who would otherwise walk up to 8 km to thenearest mill, which is powered by a diesel engine. Apart from unreliability of thediesel-powered mills users would have to pay up to 50% more per bucket milled.
Project OverviewIn 1993 rehabilitation work started with the assistance of ITDG. The mill is operated byan worker who checks the whole system about three times a week on average. Theoperator is a member of the co-operative and is employed full-time. Virtually all repairsare now done at the farm. During peak times the mill operates on three eight hourshifts, seven days a week. A single eight hour shift is the normal mode of operation.Routine maintenance is carried-out by the committee. This involves greasing andreplacing bearings, replacing belts and cleaning the intake, channel and forebay.
All members of the co-operative benefit from the milling service and therefore theywould like to enjoy a low tariff. However, they also get a monthly allowance as part oftheir income from the farm activities. Co-operative members are charged 1.5 US centsless per bucket milled than non-members. This forces them to charge reasonable tariffsas they both try to maximise their income and avoid getting overcharged themselves.The operator gets the same monthly allowance and milling tariffs as other members ofthe co-operative.
Table A-25: Svinurai Scheme Profile (US$1998)
Capacity of MHP: 13 kWStart Date: 1993Total Capital Cost:of which Electromechanical: Civil:
US$9,296 US$662 US$8,634
Cost per installed kW: US$715

90 Best Practices for Sustainable Development of Micro Hydro Power
Figure A-7: Map showing the locations of the case study sites in Zimbabwe
Financial and Economic AnalysisThe rehabilitation works were funded through grants. The estimated cost for restoringmilling and electricity at the Svinurai scheme was US$9,296 including the co-operative’s contribution. The grants were negotiated by ITDG in close liaison with thecommunity. The Svinurai community contributed all the labour for the rehabilitation ofthe civil works, penstock and powerhouse, including the installation of a new mill.African Development Foundation (ADF) funded the irrigation component includingmanagement support and training. Funds for the first and second stage rehabilitationwere secured from the States of Guernsey. For the electrification component fundswere secured from a grant raised through an individual’s cycling trip around Zimbabwe.
Calculations were based on a twenty-five year life expectancy. The tariff for a hydromilling service is set per bucket of milled grain. No rigorous analysis has been done onthe tariff but the revenue generated has been shown to meet the operation, maintenanceand management costs. An analysis of the co-operative’s books shows that the mill isnot regarded as a stand-alone enterprise. There is evidence that costs incurred on otherfarm activities are financed from the mill income while records show that operation,maintenance and repairs of the hydro mill are only financed from the mill income.Milling tariffs are set from a social standpoint and are generally below those ofcompeting diesel fuelled mills. Income from the mill has not been consistent over the

Annex: Summary of Case Studies 91
years and this can be attributed to various factors, chief of which is the lack of target-oriented management.
The financial analysis shows that if tariffs are constant in current terms over the lifetime of the project there is a very good return, 48% in current currency and 20% inconstant dollars. We have assumed that the capital is borrowed from a renewable energyfund such as the UNDG-GEF Solar fund. This demonstrates once more the issue ofservices pricing.
4.1.3 Site 3: Elias Mill - A Private Micro Hydro Scheme (Mozambique)
Village OverviewThis mill is in the Manica District of Mozambique, within 16km of Manica town. Themain focus of the Elias plant is hydro milling. There has been no extension of theenterprise to other end-uses. Electricity generation from this plant is possible but as thehouses are scattered, the number of beneficiaries may be very limited. The owner couldhowever, install a pico-hydro plant for use at the mill and homestead. Such a generatorwould provide electricity for lighting, communication and small-scale enterprises.
Elias mill is an old scheme using an old pelton turbine to drive a rudimentary mill. Thepowerhouse is a simple timber off-cut structure thatched with grass. The Portuguesefirst installed this equipment around the 1930s at a different site. Mr Elias lateracquired the equipment from them and installed it at his homestead. The capacity ofthis scheme is about 15 kW.
Project OverviewThis scheme was identified by a Mozambican non-governmental organisation, KwazaiSimukai (KSM), who invited ITDG to provide them with the technical skills for themill’s rehabilitation. Up until 1999 the owner did most of the work on repairs followingadvice from ITDG. KSM is close to the site and, as such, does most of the follow-up.In addition KSM’s in-house staff received intensive training on feasibility studies ofmicro hydro schemes from ITDG and turbine manufacturing from Water Energy andDevelopment Services (WEDS) - a small Zimbabwean consultancy Company. Themain funder of KSM has been exploring the possibility of Elias receiving creditassistance for components that have to be bought and involve large amounts of moneyrelative to the monthly income from the mill. These include cement, the penstock,turbine and mill. The owner has already accepted the working arrangement, andmanufacture of the turbine is already at an advanced stage. This is being done by localtechnicians with technical support from WEDS of Zimbabwe.
The owner runs this scheme with assistance from his family. In fact it is run as a familybusiness and no payments are made to any associated family labour contributions. Insome rare situations external labour is hired, for example when major repairs on thecivil works are necessary. This labour is paid from family income without regard towhether the money was generated from the mill or not. Family members interviewedindicated that they were very comfortable with this situation. Their motivation seems tobe driven by a strong household head committed to the well being of the family. Thismill serves about 300 households mainly from Ndirire village 82.
82 Funding Proposal for Three Micro Hydro Schemes in Mozambique, ITDG, 1996.

92 Best Practices for Sustainable Development of Micro Hydro Power
The mill operates an average eight hours per day six days a week. In emergencies itopens briefly on the seventh day. Routine maintenance is done especially on greasingand replacing bearings, belts and cleaning the intake, channel and forebay.
Table A-26: Elias Mill Scheme Profile (US$Current)
Capacity of MHP: 15 kWStart Date: 1996Total Capital Cost: US$18,000Grant: US$10,000Hours of usage per day: 8 hoursCost per installed kW: US$1,200
Financial and Economic AnalysisIn 1996 the estimated cost of rehabilitating the power plant was US$16,000 (£10,000),excluding training, monitoring, evaluation, administrative overheads and contributionsby the owner83. Part of the funding for ITDG’s technical input on the first stage ofrehabilitation was provided by Andersen Consulting, UK. A grant secured by KSMfrom FOS-Belgium financed designs of the turbine and a training course leading to theproduction of a prototype. The total amount on this grant was estimated at US$8,000.
The income and expenditure of this mill was monitored over a month. This data wasused to extrapolate to 25 years guided by some basic assumptions on external factorsand on the performance of the mill84. Our calculations show an internal rate of return of9% assuming that the capital is borrowed at an annual interest rate of 15% over therepayment period. It is assumed that the turbine currently being fabricated will beinstalled in 1999 and the mill will be replaced the same year. It is also assumed that thecivil works will be rehabilitated in 2000.
4.1.4 Site 4: Chitofu Mill (Mozambique)
Village OverviewThe Chitofu hydro mill is in the Manica District of Mozambique, within 18km ofManica town. The owner runs this scheme with assistance from his family. The millhas served a community of over 100 households with an average of six members forover sixty years. These come from two villages, namely Maridza and Nyaronga, wherethe alternative mill is powered by a diesel engine and charges up to 50% more than theChitofu mill. Poorer people get the service on credit ad sometimes on barter. Theowner sets tariffs for the Chitofu mill, driven by both social and business objectives. Itis evident that the deployment of resources on operation and maintenance has been keptat a level just high enough for minor repairs.
Project OverviewThis is an old scheme using an old pelton turbine to drive a mill. The powerhouse is asimple brick structure with corrugated iron roofing. The scheme has a capacity of about15 kW. The owner used his own resources to develop the plant but has been gettingassistance form ITDG and KSM to rehabilitate it85.
83 These costs were estimated at US$2,000 according to interviews with the owner and ITDG records.84 A Project for Rehabilitation of Two Micro Hydro Plants in Mozambique, G Goncalves, 1998.85 Mini Project Proposal, Nyaronga –Chitofu, ITDG, 1995.

Annex: Summary of Case Studies 93
Like the Chitofu mill this scheme was identified by KSM who invited ITDG to providetechnical skills and financial assistance for its rehabilitation. The memorandum ofunderstanding signed in 1995 also governed the co-operation between KSM and ITDGon this project. The owner has done most of the work on repairs following advice formITDG. The first task done was the replacement of the old-worn out bearings with newones. At the same time some repairs were done to the old mill and penstock. A secondstage involved repairs to the channel, forebay tank, penstock, powerhouse andreplacement of the old mill with a new one. The owner provided labour for all therehabilitation work. KSM continues to provide most of the follow-up because of itsproximity to the project site.
As in the case of the Elias mill, the local authority under which the scheme falls had notbeen involved in the planning or implementation of the rehabilitation work. The milloperates an average eight hours per day, six days per week, but in emergencies it opensbriefly on the seventh day. Routine maintenance is done especially on greasing andreplacing bearings, replacing belts and cleaning the intake, channel and forebay.
The main focus of the Chitofu plant is hydro milling. There has been no extension ofthe enterprise to other end-uses. Current efforts are to improve this service but there ispotential to use the same plant to generate electricity. This would be a very attractiveoption considering that within 600 m of the plant there is a school, clustered houses anda business centre. Small-scale industries could also surface provided other conditionssuch as finance and training are attractive.
Table A-27: Chitofu Mill Scheme Profile (US$1996)
Capacity of MHP: 15 kWStart Date: 1995Total Capital Cost: US$18,500End-use: Grain millingHours of household usage per day 8Cost per installed kW US$1,233
Financial AnalysisA combination of grants and owner finance has been used to rehabilitate the scheme.Estimates for rehabilitation of this mill were done at the same time as for Elias, and afigure of US$16,000 (£10,000) was reached. This excludes training, monitoring,evaluation, administrative overheads and contributions by the owner86. The core fundingfor this project was a grant secured by ITDG from Andersen Consulting and the DFIDof the United Kingdom. These funds covered materials for repair to the powerhouse,the turbine housing and replacement of bearings, repairs to the old mill and its eventualreplacement and the technical inputs by ITDG. Chitofu contributed labour during therepairs. The owner also provided labour for repairs to the intake works, canal, forebaytank and penstock.
No systematic monitoring of income and expenditure has been done on this scheme.Historical data has been generated through interviews with the members of the familyresponsible for milling. Our calculations show an internal rate of return of 9%,
86 Estimated at US$2,500 from interviews with owner and ITDG’s records.

94 Best Practices for Sustainable Development of Micro Hydro Power
assuming that the capital is borrowed at an annual interest rate of 15% over therepayment period.
Figure A-8: Map showing the locations of the case study sites in Mozambique
4.2 Summary of Findings of Micro Level AnalysisSignificant effort has been made by NGOs working with various stakeholders todemonstrate that micro hydro can supply much needed energy to remote ruralcommunities. The four cases selected for Zimbabwe and Mozambique are a cleardemonstration of the technical viability of hydro as an alternative energy source andcan, therefore, be replicated with relative ease. Management of such schemes appearsto be within the grasp of the ordinary rural farmers. Moreover, their capabilities can beextended with additional training, and personnel should only need to be brought in in
Annex: Summary of Case Studies 95
exceptional cases where system failures are experienced. The only apparent constraintsconcern financial management, particularly regarding the approach taken on tariffsetting. All four schemes need to improve on the utilisation of the available power.This can in turn improve on the returns from the investment.
A point of concern, however, is the cost involved in micro hydro technology. The costis prohibitive particularly for rural productive operations, which often have low outputdue to the demand conditions that prevail in the rural areas. The technology lends itselfwell to variations in scale thus allowing different size systems to be installed to suitparticular needs or particular resource potentials.
In both Zimbabwe and Mozambique lack of energy planning at the local and regionallevels can be attributed in part to lack of awareness on energy options available at thatlevel. This highlights the fact that energy provision has not yet been recognised as anintegral part of the development process that needs to be planned for. The tendency isto regard the national grid as the only energy source of electricity. This is only suppliedby utilities, and at the local level electrical power has tended to be synonymous with theutilities.
The process of getting information from the rural communities on local resources anddevelopment needs could also be improved to allow for better planning that would,hopefully, incorporate energy issues. Embarking on community empowermentexercises that would give communities an insight into their role in the development oftheir ward or district could further facilitate this.
The environmental impacts of the four micro hydro schemes selected for this study canbe classified as minor according to Zimbabwe’s guidelines on environmental impactassessment.


97
BIBLIOGRAPHY
NEPAL
Aitken, J.M., Cromwel, G., and Wishart, G., Mini and Micro Hydropower in Nepal,International Centre for Integrated Mountain Development, Occasional Paper No.16, Kathmandu, Nepal, 1991.
Agriculture Development Bank of Nepal, Small Farmer Development Program: TwoDecades of Crusade Against Poverty, Vol. I and II, ADBN, Kathmandu, 1996.
Alternative Hydro Energy Centre, University of Roorkee, Promotion of Private SectorMicro-Hydro in Nepal, Report on National Seminar on Small Scale Hydro PowerDevelopment in the Himalayan Region, AHEC, January 1995.
Annapurna Conservation Area Project, A New Approach in Protected AreaManagement, Pokhara, 1996.
Amattya, V. B. and Joshi, R. D., Report of a National Seminar on Mini and MicroHydropower Development in the Hindu Kush Himalayan Region, ICIMOD,September 1994.
Asian Development Bank, Project Performance Audit Report, Mini-HydropowerProject, ADB, January 1998.
Asian Institute of Technology in Association with International Water ResourcesAssociation, Proceedings from the International Conference on Environmentallysound Water Resources Utilisation, November 1992.
Centre for Renewable Technologies, Nepalese - Gaon Micro Hydro ElectrificationPlant. Plant Installation Report, CRT, January 1997.
Centre for Renewable Technologies, Proposal and Dissemination of Improved WaterMill (Ghatta) Support Programme in Nepal, prepared by CRT on request byDANIDA, November 1997.
Centre for Renewable Technologies, Rural Electrification from Improved Ghatta atNepane – Gaun, Newsletter, Volume 6, No.1, April 1997.
COWI, Wind Energy Utilisation Nepal, 1994.DANIDA, Nepal Energy Sector Programme Support Document, Ministry of Foreign
Affairs, Danida Publications, no date.DANIDA, Evaluation of Poverty Reduction in Danish Bilateral Assistance at Policy,
Sector and Country Level, Danida Publications, 1996.DANIDA, Poverty Alleviation: Nepal Country Programme, Evaluation Report, Vol. I,
Main Report, and Vol. II, Participatory Study, Danida Publications, 1995.Department of Trade and Industry, Development of Small Scale Hydro in Britain,
Renewable Energy News, UK, 1994.Development Consultancy Services, Making Technology Work in Nepal, Butwal,
Leaflet, January 1996.Earth Consult (P.) Ltd., A Report of Study on Functional Status of Private Micro
Hydropower Plants in Nepal, ICIMOD, October 1995.East Consult (P.) Ltd., Socio - Economic Evaluation of Micro Hydro Schemes on Rural
Communities of Nepal, Prepared for ITDG, Kathmandu, Nepal, 1990.Edwards, A. Brown, A., The Role of International Agencies in Promoting Sustainable
Micro and Mini Hydro Activity in Developing Countries, Proceedings of ESHAConference, Nice, France, 1991.
Environment Protection Council, Environment Protection Regulations 2054, Nepal1997.

98 Best Practices for Sustainable Development of Micro Hydro Power
Govind, Dr., A Study on Micro - Hydro Inventory Study of Syangja District. FinalReport, WECS, June 1997.
Govinda, A Report on Random Sample Survey to Determine Actual Status of PrivateMicro- Hydropower Plants in Nepal, East Consult, Nepal,1998.
Harvey, A. H,. Hettiarachi, P., and Iversin, A. R., Micro Hydro Design Manual, ITDG,UK, 1993.
Hveding, V., Hydropower Development in Norway, Hydropower Development Series,Vol. I, NTH, The University of Trondheim, Norway, 1992.
Integrated Development Consultants, Bagmati Watershed Project: Improved CookstoveConstruction Manual, Heidelberg, Germany, 1997.
Intermediate Technology Group and Bell, J., Cook Electric: The Ghandruk Experience,Kathmandu, 1994.
International Centre for Integrated Mountain Development, A Reference Manual forDecision Makers, Planers and Assessors, ICIMOD, 1996.
International Centre for Integrated Mountain Development / Banskota, K. Sharma, B.,Case Studies from Ghandruk: Impact of Alternative Energy Technology inReducing Pressure on Forest Resources contribution of Tourism Expenditure to theLocal Economy in the Annapurna Area, Kathmandu, 1997.
International Centre for Integrated Mountain Development /SNV, Districts of Nepal:Indicators of Development, Kathmandu, 1997.
International Centre for Integrated Mountain Development and Pakistan Council ofAppropriate Technology, Proceedings of the Pakistan National Seminar on Mini -and Micro - Hydropower Development in the Hindu - Kush - Himalayan Region,October 1994.
International Centre for Integrated Mountain Development, Case Studies fromGhandruk, Discussion Paper Series No. MEI 97/5, ICIMOD, 1997.
International Centre for Integrated Mountain Development, Development of Mini-andMicro - Hydropower for Mountain Development in the Hindu Kush Region,International Experts' Consultative Meeting, ICIMOD, June 1994.
International Centre for Integrated Mountain Development, Development of Mini-andMicro - Hydropower: Issues and Constraints, in Issues in Mountain Development,ICIMOD, 1997/2.
International Centre for Integrated Mountain Development, Manual on Private andCommunity - base Mini - and Micro - Hydropower Project, ICIMOD, Kathmandu,August 1994.
International Centre for Integrated Mountain Development, Mountain TourismConstraints and Opportunities, Newsletter No. 28, ICIMOD, 1997.
International Centre for Integrated Mountain Development, The Orientation - Cum -Training Programme on Mini - and Micro Hydropower Development in the Hindu-Kush Region, ICIMOD, February 1995.
International Centre for Integrated Mountain Development, Mini and MicroHydropower for Mountain Development in the HKH Region, Report of theInternational Expert's Consultative Meeting, ICIMOD, Kathmandu, Nepal, 1994.
ADBN, Impact of Water Turbine, Agricultural Development Bank, Nepal, 1987Intermediate Technology Development Group, Micro Hydro End-Uses Catalogue, IT
Publications, Nepal, January 1997.Intermediate Technology Development Group, Why Micro-Hydropowe, Micro-Hydro in
Remote Areas, Upwards Bound, Vol. 2, No. 2, December 1996.

Bibliography 99
Intermediate Technology Development Group in co-operation with the AgriculturalDevelopment Bank, Micro Hydropower in Humla, with special reference to theYangar Project, August 1994
Intermediate Technology Development Group/ Centre for Renewable Technologies,Comparative Study of Agro - Processing Mills in Sindhupalchowk District, ITPublications, May 1995.
Intermediate Technology Development Group, Financial Guidelines for Micro HydroProjects, IT Publications, Nepal 1997.
Inversin, A.R., New Designs for Rural Electrification: Private Sector Experiences inNepal, National Rural Electric Supply Co-operative Association, USA, 1994.
Jantzen, Daniel E. and Koirala, K., Micro Hydro Power in Nepal, Bikash Enterprise Inc.with No - Frills Development Consultants, No date.
Ministry of Population and Environment, Environmental Impact Assessment Guidelinesfor the Water Resource Sector (Power and Irrigation), (Final Draft), MPE, June1997.
Junejo, Anwar A., A Manual of Private and Community Based Mini and Micro HydroPower Development in the Hindu - Kush Himalayas, ICIMOD/NORAD, 1997.
Junejo, Anwar A., Mini and Micro Hydro Power Development in the Hindu KushHimalayan Region - Status, Prospects and Problems (unpublished), ICIMOD,Kathmandu, Nepal, 1994.
Lotus Energy (Pvt.) Ltd., Company Profile, year.MOWR, Nepalese Legal Provisions on Hydro Power Development, HMG, January
1994.Nafziger, D. L., A Synopsis of Domestic - Sector Impacts at the Adhi Khola Hydel and
Rural Electrification Project and their implication for future Butwal PowerCompany Rural Electrification Planning, A Butwal Power Company Report(unpublished), 1994.
NEA/Norconsult, Load Forecast, Draft Report, October 1997.NEA Planning Directorate, Report on Investment Programme and Financial Analysis,
NEA, July 1997NEA Technical Service Department, Standardisation of Engineering and Construction
Practices, Electrical Distribution Systems, Ashad 2050.NEA, A Year in Review, 1997/98, Annual Report, NEA, August 1997NEA, Report of Khimti - Dhalkebar 132 kV Transmission Line Project, NEA, June
1994.NEA /CIWAC, Medium Hydropower Study Project Phase I, Fine Screening and
Ranking Report, Volume I, NEA, March 1997.NEA /GTZ, Screening and Ranking Methodology, Implementation of Master Plan for
Small Hydropower, NEA, 1997.NEA /SHPD, Reconnaissance Study Report of Naugarh Gad Small Hydropower
Project, NEA, September 1995.Nepal Machine and Steel Structures (NMASS), Micro Hydro Turbines Installed by
NMASS Butwal Past 9 Years, Butwal, 1997.Norconsult, Power System Master Plan for Nepal, Lord Forecast Draft Report, October
1997.Norplan, Independent Review of the Rural Energy Development Programme, Nepal,
UNDP, NEP/95/016, 1995.NRECA, Ten Year Rural Electrification Study, Volume I, II & III, Washington DC,
July 1991.

100 Best Practices for Sustainable Development of Micro Hydro Power
NRECA/ USAgency for International Development, New Design for RuralElectrification, Private-Sector Experiences in Nepal,1994.
Pandey, B, Local Benefits from Hydro Development, Studies in Nepali History andSociety, A Mandela Book Point Journal, Vol. 1, No.2, December 1996.
PV Water Pumping (demo) in Nepal, Showa/NEDO, 1997.SAPPROS, Experience in Grassroot Level Institutional Development, 1997.Shah, Ishwari, Credit to Women: Agriculture Development Bank of Nepal Policies and
Experiences, Agriculture Development Bank of Nepal, Kathmandu.Shah, Ishwari, Access of Women to Formal Credit and Financial Institutions in Nepal:
Present Problems, Issues and Recent Developments in Policies, Procedures andPractices, Agriculture Development Bank of Nepal, Hanoi, Viet Nam ,1997.
Shrestha, Bihari Krishna, Report on the Status of Renewable Energy in Nepal, DanishEmbassy, Nepal July 1995.
SILT Consultant (P) Ltd., Development in the Hindu Kush - Himalayas, Kathmandu1997.
Anderson T., Doig A, Rees A and Khennas, S., Rural energy services, DFID, TheBritish Council, IT Publications, 1999.
United Nations Development Programme, Rural Energy Development Programme.Project Document and Progress Report, 1996-1997, UNDP, September 1997.
WECS/United Nations Development Programme, A Study on Improvement of EconomicViability of Micro Hydropower Plants, Water and Energy Commission Secretariat,Kathmandu, Nepal, 1994.
WECS, Report of the Task Force on Rural Electrification Impacts in Nepal, Report No.4/4/220688/1/1, sequence 308, Water and Energy Commission Secretariat,Kathmandu, Nepal,1998.
World Bank, Power Development Project. Sectoral Environment Assessment, WB,1997.World Bank Mission Aide Memoir, Nepal Power Development Project, 15/7/97, WB,
1997.
SRI LANKA
Barnett, A., The Problem of Access through the expansion of Micro Hydro and Mini-grids, Presentation to the World Bank Conference on Village Power, UK, pp.1-18,1998.
Central Bank of Sri Lanka, Annual Report 1998, CBSL, 1999.Ceylon Electricity Board, Long term Generation Expansion Planning studies 1998-
2012, Generation Planning Branch, CEB, Colombo, Sri Lanka, 1998.Ceylon Electricity Board, Long Term Generation Expansion Planning Studies 1998-
2012, CEB, Colombo, Sri Lanka, 1998.Ceylon Electricity Board, 25th Anniversary Supplement, Alternative Energy
Development Section, CEB, 1994.Ceylon Electricity Board, undated and various annual issues of Activity reports on the
Alternative Energy Development Unit.Ceylon Electricity Board, Master plan for electricity supply for Sri Lanka, CEB, Sri
Lanka, 1988.Daranagama, U., Wijayatunga, P., Ariyadasa, K. P., Kumarasiri, W. K. K., Feasibility
of Dendro Power Based Electricity Generation In Sri Lanka, Energy Forum, SriLanka, 1999.
Energy Conservation Fund, Energy Balance 1995, Ministry of Science and Technology,Sri Lanka, 1996.

Bibliography 101
Fernando, Shavindranath, Dhanapala, Kiran, and Ariyadasa, L., Financing EnergyServices and Income Generating Opportunities for the Poor, Sri Lanka CountryReport for Asia Pacific Development Centre and United Nations DevelopmentProgramme, Sri Lanka Energy Managers Association, Sri Lanka, (pp1-70), 1998.
Fernando, Sunith, Small Thoughts & Experiences on Wind and Micro Hydro Power”,Economic Review, August 96, Peoples Bank, Colombo, Sri Lanka, 1996.
Government of Sri Lanka, Power Sector Policy Directions, Ministry of Irrigation andPower, GOSL, (pp.1-17),1996.
Government of Sri Lanka, National Environment Action Plan 1992-1996, Ministry ofEnvironment and Parliamentary Affairs, GOS, Colombo, Sri Lanka, (pp. 1-97),October 1991.
Government of Sri Lanka , Ministry of Irrigation, Power and Energy, May 1997, DraftEnergy Policy for Sri Lanka Report of the National Committee on Energy Policy,Colombo, Sri Lanka, (pp1-5-16), GOSL, 1997.
Government of Sri Lanka , Ministry of Irrigation and Power, 1996, Power Sector PolicyDirections, Colombo, Sri Lanka, (pp.1-17), GOSL, 1996.
Hislop, D., Upgrading Micro Hydro in Sri Lanka – Case Study 2, IntermediateTechnology Publications, (pp.1-63), 1986.
Intermediate Technology Sri Lanka, Study on Economic and Environmental Linkages ofMH & Biomass Energy Use in the Tea Plantation Sector in Sri Lanka, Study byIntermediate Technology Development Group, Sri Lanka to Ministry ofEnvironment, GOSL, Sri Lanka, (pp18-9), July 1998.
Intermediate Technology Sri Lanka, Database on Micro Hydro Schemes to Date,Colombo, Sri Lanka, ITSL, 1998.
Intermediate Technology Development Group, Study on Economic and EnvironmentalImpacts & Linkages of MH and Biomass energy use in the Tea plantation sector,Sri Lanka, Report to Ministry of Environment, GOSL, Colombo, Sri Lanka, (pp.1-74), 1998.
Munasinghe, M., Ekanayake, A., et al, Linkages Between Economic Policies and theEnvironment in Sri Lanka, Working Paper Series No.1, Lanka International Forumon Environment and Sustainable Development, Sri Lanka, (pp.1-45), December1998.
Posch & Partners Consulting Engineers, Sri Lanka Micro Hydro Feasibility Study,CEB, Sri Lanka, 1993.
Siyambalapitiya, T., Electricity Pricing Policy in Sri Lanka, Research Studies onEnergy & Environmental Economics Series No. 8, Institute of Policy Studies,Colombo, Sri Lanka, (pp.1-51), July 1997.
Tampoe, M., Village Hydro Project, Sri Lanka, Draft Version of a Project CompletionReport, ITSL, Colombo, Sri Lanka, 1998.
United Nations Development Program, National Human Development Report 1998:Regional Dimensions of Human Development, UNDP, Sri Lanka, (pp.1-77), 1998.
Wallace, Dr. A. R., Wilkinson, R. E., Mattinson, J., Report on Visit to Sri Lanka ,Energy Systems Group, University of Edinburgh and Gilbert Gilkes and Gordon,(pp.1-35), 1995..
Wijayatunga, P. D.C., Prospects of New and Renewable Energy Sources in Sri LankaPricing & Other Issues, Paper for LIFE Seminar, December 1997, Colombo, SriLanka.
World Bank, Energy Services Delivery Project Documentation, WB, Sri Lanka, 1997.World Bank, World Development Report 1998, WB, 1998.

102 Best Practices for Sustainable Development of Micro Hydro Power
PERU
CER-UNI., Study of Renewable Energies in Peru, April 1996.Carrasco, A., Electrification and Rural Development: Electrification Project in Rural
Cusco, University of Helsinki publication, 1990.Congress Legislation No. 870, Fonavi Application: Replacement of Article of Decree
Law No.26750,Congress Legislation No. 870, Rules governing the Application of the FONAVI tax
rate. Law No.26750.Congress Law No. 26969, Rules governing the redemption of Electrification Debts and
replacement of the FONAVI contribution by the Extraordinary Solidarity Tax.,August 27, 1998.
Congress Complementary Law to Law No. 26969, Law governing the redemption ofElectrification Debts and replacement of the FONAVI contribution by theExtraordinary Solidarity Tax. Law No. 27044., January 5, 1999.
Electricity Rating Committee, Rating Status in the Peruvian Electricity Sector, March1998
Empresas Electricas Asociadas, 60 Years of Empresas Electricas Asociadas, EEA,November 1966.
INFOLEX, Main legal standards concerning mini and micro hydro power, Annex 7,November 1995.
INFOLEX, entire text of legal standards concerning mini and micro hydro power I,Annex 8, November 1995.
INFOLEX, entire text of legal standards concerning mini and micro hydro power II,Annex 9, November 1995.
Khennas S, Kavita R and Fernando S, IT Zimbabwe Micro hydro project evaluation ,1997.
Ministry of Energy and Mines, National Electrification Plan: Investment Programmefor 1997-2000, 1997.
Ministry of Energy and Mines, 1995-1996 Performance: Executive ProjectsDirectorate, 1996.
Ministry of Energy and Mines, Annual of Statistics: HIDROCARBONS Peru 1996-1997.
Ministry of Energy and Mines, New Electrification Strategies for Isolated and RemoteAreas, June 1995.
Ministry of Energy and Mines. Electricity: 1997 Annual of Statistics, GeneralElectricity Directorate.
Ministry of Energy and Mines. 1995-1996 Annual Report of PAE. PAE-MEM, 1997.Ministry of the Presidency. General Balance Sheet for Energy 1995, 1995.Ministry of the Presidency. General Balance Sheet for Energy 1996, 1996.Ministry of the Presidency. Hydrocarbons 1996-1997, 1997.PRODER. Renewable Energies Development Committee: Integrated renewal energies
development programme, June 1996.RAMIREZ-GASTON, Javier. System of Information on mini and micro hydro power
in Peru, Intermediate Technology Development Group, December 1995.National Mining, Oil and Engineering Association, 1997 Annual Report, 1997.Special Supplement of El Comercio, We Want to Achieve a 75% Electricity Coverage,
El Comercio, November 8, 1998.Special Supplement of El Comercio. On The Right Track, November 8, 1998.Special Supplement of El Comercio. Energy Development in the Country: Light of the
Future, November 8, 1998.

Bibliography 103
U.S. Congress, Office of Technology Assessment, Fuelling Development: EnergyTechnologies for Developing Countries, OTA-E-516 Washington, DC: U.S.Government Printing Office, April 1992.
UTE-FONAVI, UTE-FONAVI VI: 1992-1995 Annual Report, 1995.Velasquez, A.M., Study of the Energy Sector in Peru, 1950 – 1988: Main Strategic
Guidelines, 1989.Wolfseson, Azi, The Great Challenge, Intergrafica de Servicios S.A. workshops, 1981.World Bank, Rural Energy and Development: Improving Energy Supplies for Two
Billion People, International Bank for Reconstruction and Development/WorldBank, 1996.
ZERO, Energy Needs for Rural Development - An Assessment of the Interface BetweenRural Development and Energy Planning, Zero - A Regional EnvironmentOrganisation, 1997.
MOZAMBIQUE
Anderson, D., and Ahmed, K., The Case for Solar Energy Investments, World Bank,Washington D.C, 1995.
Borg, M., Financial and Economic Analysis of Rural Electrification in DevelopingCountries: A Computer Model for Appraisal, SEI, Stockholm, 1999.
Brito, L., Fernandes, Y., Manso, O., Williams, A., Mozambique Country Energy Report,1997.
Bronstein, H., et al., Analysis of Trade and Investment Constraints in SADC forUSAgency for International Development's Regional Centre for Southern Africa(unpublished), 1996.
Conceição, C., et al, Mozambique, National integrated Household Energy Plan,Synthesis Report, 1998
Eberhard, A., and Theron, P. (Ed), International Experience in Energy Policy Researchand Planning, University of Cape Town, Elan Press, 1992.
Eberhard, A., and van Horen, C., Poverty and Power: Energy and the South AfricanState, UCT Press and Pluto Press, Cape Town, 1995.
Eleri, E.O., Energy-related Environmental Problems in Southern Africa, A paperPresented at the Southern African Energy and Environment Policy Workshop forStakeholders, Cape Town, November 6-8 1995, 1995.
ENDA-TW, Assessment of Solar and Wind Energy Utilization in Africa, Dakar, 1994.ETC, SADCC Energy Development: Fuelwood Study: Report on Mozambique, Leusden,
the Netherlands, 1987.Foley, G. (Ed ), Rural Electrification in Mozambique, Tanzania, Zambia and
Zimbabwe: Synthesis Report from the SEI/BUN Workshop on Rural Electrification,Stockholm Environment Institute, Stockholm, Sweden, 1993.
Goncalves, G., A Project for Rehabilitation of Two Micro Hydro Plants in Mozambique,1998.
Intermediate Technology Development Group, Mini Project Proposal, Nyaronga –Chitofu, ITDG, 1995.
Intermediate Technology Development Group, Funding Proposal for Three MicroHydro Schemes in Mozambique, 1996.
Katerere, Y., Energy Policy in the SADC Region, ZERO, Harare, 1991.Nyabeze, W. R., A Proposal on Micro Hydro Plants to Include in The Review and
Synthesis of Cases of Existing Micro Hydro Plants in Zimbabwe and Mozambiquefor DFID/World Bank, 1999.

104 Best Practices for Sustainable Development of Micro Hydro Power
Simoes, J.T.C. (Ed.), SADCC: Energy and Development to the Year 2000, BeijerInstitute, Stockholm, Sweden, 1984.
Sundgren, J., Renewable Energy Sources in Developing Countries: State of the Art,DNV, Norway, 1993.
UNDP/WB Energy Sector Assessment Program, Mozambique: Issues and Options inthe Energy Sector, WB, Washington, D.C., 1987.
ZIMBABWE
Anderson, D., and Ahmed, K., The Case for Solar Energy Investments, World Bank,Washington D.C, 1995.
APTECH, Case Study on the Zimbabwe - Photovoltaics for Household and CommunityUse project, Harare, 1996.
Borg, M., Financial and Economic Analysis of Rural Electrification in DevelopingCountries: A Computer Model for Appraisal, SEI, Stockholm, 1990.
Bronstein, H. et al, Analysis of Trade and Investment Constraints in SADC, US Agencyfor International Development's Regional Centre for Southern Africa (unpublished),1996.
Chandiwana, D., Challenges for a Finer Conventional and Renewable Energy Use,SAPHO, Harare, 1996.
Cormack, S .,and Shepherd, G. (Ed), Report of the Conference on Rural Developmentin Zimbabwe, held at the Zimbabwe Institute of Public Administration andManagement, 21 to 25 September 1992, 1992.
Denconsult, Sector Studies under ZACPLAN, Sector Study No. 5 - HydropowerGeneration, (unpublished), 1998.
Eberhard, A., and Theron, P. (Ed.), International Experience in Energy Policy Researchand Planning, University of Cape Town, Elan Press, 1992.
Eberhard, A., and van Horen, C., Poverty and Power: Energy and the South AfricanState, UCT Press and Pluto Press, Cape Town, 1995.
Eberhard, A., Integrated Energy Planning: A Methodology for Policy Analysis andResearch, EDRC, University of Cape Town, no date.
Eleri, E.O, Energy-Related Environmental Problems in Southern Africa, A paperPresented at the Southern African Energy and Environment Policy Workshop forStakeholders, Cape Town, November 6-8 1995, 1995.
ENDA-TW, Assessment of Solar and Wind Energy Utilization in Africa, Dakar, 1994.Energy Forum, Proceedings of the Energy Forum Workshop on Current Practice,
Opportunities and Constraints in Energy Supply to Rural Communities, BronteHotel, 7-8 May 1996, 1996.
ETC, SADCC Energy Development: Fuelwood Study: Report on Mozambique, Leusden,the Netherlands,1987.
Foley, G. (Ed.), Rural electrification in Mozambique, Tanzania, Zambia and Zimbabwe:Synthesis Report, SEI/BUN Workshop on Rural Electrification, StockholmEnvironment Institute, Stockholm, Sweden, 1993.
Hosier, R.H., Zimbabwe: Energy Planning for National Development, Beijer Institute,Sweden, 1986.
Katerere, Y., Energy Policy in the SADC Region, ZERO, Harare, 1991.Klunne, W., Hydro-power End-Uses at Svinurai Co-operative, ITDG, Harare, 1993.Maboyi, B., Women and Sustainable Energy, ITDG, Harare, 1998.Mapako, M., Review of On-going Alternative Energy for the Department of Energy,
GTZ, Harare, 1997.

Bibliography 105
Materekwe, D. U., Socio-economic Aspects of Biogas Technology in Zimbabwe, ZERO,Harare, 1997.
Muguti, E., Zimbabwe Energy Policy and Efforts at the Provision of SustainableEnergy, ITDG, Harare, no date.
Nyabeze, W., Technology Assessment of Bread Making, Brick Making and BeerBrewing Industries in Zimbabwe, ZERO, Harare, 1991.
Nyabeze, W. R, A Proposal on Micro Hydro Plants to Include in The Review andSynthesis of Cases of Existing Micro Hydro Plants in Zimbabwe and Mozambique,DFID/World Bank, 1999.
Petringa, N., Decentralised Power Production: Potential of Renewable EnergyTechnologies to Meet the Needs of Rural People in Zimbabwe, Biomass UsersNetwork, Harare, 1993.
Republic of Zimbabwe, Second Five-Year National Development Plan 1991-1995,Government Printers, Harare
Simoes, J.T.C (Ed.), SADCC: Energy and Development to the Year 2000, BeijerInstitute, Stockholm, Sweden, 1984.
Southern Centre for Energy and Environment, Energy and Environment Challenges inSouthern Africa: The Case of Zimbabwe, Harare, 1995.
Sundgren, J., Renewable Energy Sources in Developing Countries: State of the Art,DNV, Norway, 1993.