Embed Size (px)
Citation preview

BEST PRACTICES FOR PREVENTION AND MANAGEMENT OF
SUSTAINED CASING PRESSURE
Joint Industry Project Report
OCTOBER, 2001
Stress Engineering Services, Inc.
13800 Westfair East Drive Houston, Texas 77041-1101

BEST PRACTICES FOR PREVENTION AND MANAGEMENT OF SUSTAINED CASING PRESSURE
Joint Industry Project Report
SECTION I Prepared By: U.B. Sathuvalli and P.V. Suryanarayana Blade Energy Partners SECTION II Prepared By: W.T. Asbill Stress Engineering Services, Inc. SECTION III Prepared By: R.A. Sukup and B.D. Scott Magnolia Global Energy SECTION IV and V Prepared By: K.R. Riggs Stress Engineering Services REPORT EDITED BY: K.R. Riggs Stress Engineering Services
Stress Engineering Services, Inc.
13800 Westfair East Drive Houston, Texas 77041-1101

i
Table of Contents
EXECUTIVE SUMMARY ...........................................................................................................................................v SECTION I: SUSTAINED CASING PRESSURE FUNDAMENTALS......................................................................1
1) Introduction ...........................................................................................................................................................1 2) Structure and Scope of this Document ..................................................................................................................6 3) Causes of Sustained Casing Pressure ....................................................................................................................8
3.1) Thermal Effects ..............................................................................................................................................8 3.2) Leak in tubing or Sealing Elements................................................................................................................8 3.3) Failure of Casing ............................................................................................................................................8 3.4) Failure of cement............................................................................................................................................9
4) An Overview of the LSU Study ..........................................................................................................................10 4.1) Data Analysis ...............................................................................................................................................11 4.2) Case Histories...............................................................................................................................................13
5) Management of Sustained Casing Pressure in the Primary Annulus...................................................................15 5.1) Design ..........................................................................................................................................................15 5.2) Tubing Material Selection ............................................................................................................................29 5.3) Installation and Testing ................................................................................................................................33 5.4) Diagnostics ...................................................................................................................................................36 5.5) What do current MMS regulations mean?....................................................................................................43 5.6) Well Integrity Assessment............................................................................................................................48
6) Conclusions .........................................................................................................................................................50 7) Nomenclature and Abbreviations ........................................................................................................................52
7.1) Roman Symbols ...........................................................................................................................................52 7.2) Greek Symbols .............................................................................................................................................52 7.3) Abbreviations ...............................................................................................................................................52
8) References ...........................................................................................................................................................54 Appendix A: Survey of JIP Participants ..................................................................................................................59
A.1) Casing and Tubing Design for Management of Sustained Casing Pressure - Participant Survey ...............62 A.2) Casing and Tubing Running and Completion Practices ..............................................................................65 A.4) SCP and Corrective Action..........................................................................................................................74
Appendix B: Modeling Annular Pressure................................................................................................................79 B.1) Change in annular volume ...........................................................................................................................80 B.2) Ballooning of a thin walled cylinder............................................................................................................81 B.3) Annular Volume Change and Loads............................................................................................................82 B.4) Well shut-in .................................................................................................................................................83 B.5) Bleeding a heated annulus ...........................................................................................................................85
Appendix C: Estimating Annular Bleed Time.........................................................................................................87 Appendix D: Conclusions of the LSU Study...........................................................................................................91 Appendix E: An Example Tubing Running Procedure............................................................................................93 Appendix F: Attachments 1, 2, 3 & 4 ......................................................................................................................94
SECTION II: TUBING AND CASING CONNECTION SEALING TECHNOLOGY .............................................. II 1) Tubing and Casing Sealing Technology...............................................................................................................1
1.1) Thread Seal.....................................................................................................................................................1 1.2) Elastomer Seal................................................................................................................................................2 1.3) Metal to Metal Seal ........................................................................................................................................2 1.4) Connection Thread Compound Sealing Performance Requirements .............................................................3 1.5) Connection Testing Procedures and Leak Rates ............................................................................................4 1.6) Testing of Tubular Connections During Running ..........................................................................................6 1.7) Corrective Action for SCP..............................................................................................................................7
Appendix A, Attachments 1 through 13 ..................................................................................................................15 SECTION III: BASICS OF STRING DESIGN AND MORE ON SEALING TECHNOLOGY ...............................III
1) Introduction ...........................................................................................................................................................1 2) Scope, Objectives, Approach ................................................................................................................................2

ii
2.1) Scope ..............................................................................................................................................................2 2.2) Objectives.......................................................................................................................................................2 2.3) Approach ........................................................................................................................................................2
3) Annuli in the Well Construction Process ..............................................................................................................3 4) Basis of Design......................................................................................................................................................4
4.1) Connections....................................................................................................................................................4 4.2) Quality............................................................................................................................................................4 4.3) Verification of Design Basis .........................................................................................................................5 4.4) Elastomer Design ...........................................................................................................................................6 4.5) Performance Verification Test Procedure: ...................................................................................................22 4.6) Engineering Design Practices:......................................................................................................................25
5) Wellheads............................................................................................................................................................38 5.1) Product Description......................................................................................................................................38 5.2) Functional Requirements..............................................................................................................................38 5.3) Technical Requirements ...............................................................................................................................38 5.4) Supplier Equipment Ratings.........................................................................................................................39 5.5) Ratings Validation........................................................................................................................................39 5.6) Performance Demonstration.........................................................................................................................39 5.7) Wellhead and Accessories Leak Path...........................................................................................................39
6) Liner Hangers......................................................................................................................................................41 6.1) Description ...................................................................................................................................................41 6.2) Design Basis .................................................................................................................................................41 6.3) Potential Leak Paths .....................................................................................................................................41 6.4) Leak Prevention............................................................................................................................................41
7) Stage Cementing Tools .......................................................................................................................................43 7.1) Description ...................................................................................................................................................43
8) Sub Surface Safety Systems ................................................................................................................................44 8.1) Description ...................................................................................................................................................44 8.2) Functional Requirements..............................................................................................................................47 8.3) Design Basis .................................................................................................................................................48 8.4) Potential Leak Paths .....................................................................................................................................48 8.5) Leak Prevention............................................................................................................................................48 8.6) Remediation Options....................................................................................................................................48
9) Expansion Joint ...................................................................................................................................................50 9.1) Description ...................................................................................................................................................50 9.2) Design Basis .................................................................................................................................................50 9.3) Potential Leak Paths .....................................................................................................................................50 9.4) Leak Prevention............................................................................................................................................50 9.5) Remediation Options....................................................................................................................................50
10) Seating Nipples .................................................................................................................................................51 10.1) Description .................................................................................................................................................51 10.2) Design Basis ...............................................................................................................................................52 10.3) Potential Leak Paths ...................................................................................................................................52 10.4) Leak Prevention..........................................................................................................................................52 10.5) Remediation Options..................................................................................................................................52
11) Flow Couplings .................................................................................................................................................53 11.1) Description .................................................................................................................................................53 11.2) Design Basis ...............................................................................................................................................53 11.3) Potential Leak Paths ...................................................................................................................................53 11.4) Leak Prevention..........................................................................................................................................53 11.5) Remediation Options..................................................................................................................................53
12) Side Pocket Mandrels........................................................................................................................................54 12.1) Description .................................................................................................................................................54 12.2) Design Basis ...............................................................................................................................................54 12.3) Potential Leak Path.....................................................................................................................................54 12.4) Leak Prevention..........................................................................................................................................54

iii
12.5) Remediation Options..................................................................................................................................55 13) Sliding Sleeve....................................................................................................................................................56
13.1) Description .................................................................................................................................................56 13.2) Design Basis ...............................................................................................................................................56 13.3) Potential Leak Paths ...................................................................................................................................56 13.4) Leak Prevention..........................................................................................................................................56 13.5) Remediation Options..................................................................................................................................57
14) On Off Tool.......................................................................................................................................................58 14.1) Description .................................................................................................................................................58 14.2) Functional Requirements............................................................................................................................58 14.3) Design Basis ...............................................................................................................................................58 14.4) Potential Leak Paths ...................................................................................................................................58 14.5) Leak Prevention..........................................................................................................................................58 14.6) Remediation Options..................................................................................................................................58
15) Safety Joint........................................................................................................................................................60 15.1) Description .................................................................................................................................................60 15.2) Design Basis ...............................................................................................................................................60 15.3) Potential Leak Path.....................................................................................................................................60 15.4) Leak Prevention..........................................................................................................................................60 15.5) Remediation Options..................................................................................................................................60
16) Packers ..............................................................................................................................................................61 16.1) Description .................................................................................................................................................61 16.2) Permanent Packers .....................................................................................................................................62 16.3) Retrievable Packers ....................................................................................................................................65
17) Polished Bore Receptacles ................................................................................................................................67 17.1) Description .................................................................................................................................................67 17.2) Design Basis ...............................................................................................................................................67 17.3) Potential Leak Paths ...................................................................................................................................67 17.4) Leak Prevention..........................................................................................................................................67 17.5) Remediation Options..................................................................................................................................67
18) Conclusions .......................................................................................................................................................69 19) Recommendations .............................................................................................................................................70 20) References .........................................................................................................................................................71
20.1) Elastomers ..................................................................................................................................................71 20.2) Engineering Design Practices.....................................................................................................................71 20.3) Misc. Papers and Publications....................................................................................................................72
Appendix A: Diagrams ............................................................................................................................................73 SECTION IV: CORROSION CONSIDERATIONS IN SCP .................................................................................... IV
1) Introduction ...........................................................................................................................................................1 1.1) CO2 Corrosion ................................................................................................................................................1 1.2) H2S, Sulfide Stress Cracking..........................................................................................................................2 1.3) Other Damage/Degradation Mechanisms.......................................................................................................3 1.4) CO2 Corrosion Models ...................................................................................................................................4 1.5) Sulfide Stress Cracking ..................................................................................................................................5 1.6) Corrosion and Cracking in Environments Containing Both H2S and CO2 .....................................................6
2) Corrosion Prevention.............................................................................................................................................9 2.1) Corrosion Inhibitors .......................................................................................................................................9 2.2) Plastic Coatings ............................................................................................................................................10
3) Corrosion Monitoring..........................................................................................................................................12 3.1) Mechanical Calipers .....................................................................................................................................13 3.3) Electromagnetic Tools..................................................................................................................................14
4) Economic Considerations....................................................................................................................................16 5) Conclusions .........................................................................................................................................................17 TABLES..................................................................................................................................................................19
Table 1: Models ...................................................................................................................................................19 Table 2: Use of CRA (THOUSANDS OF METERS).........................................................................................20

iv
FIGURES ................................................................................................................................................................21 BIBLIOGRAPHY ...................................................................................................................................................23
References ...........................................................................................................................................................23 General Information Bibliography.......................................................................................................................25
Attachment A: Internet Information for CO2 Corrosion Models .............................................................................28 Attachment B: CRA Selection Guides.....................................................................................................................37 Attachment C: Internet Information on “Socrates” Expert System .........................................................................46 Attachment D: Coating Information ........................................................................................................................49 Attachment E: Abstracts of Economic “Case Studies”............................................................................................53
SECTION V: REVIEW OF ARPTD DATABASE .....................................................................................................V 1) The ARPTD Database ...........................................................................................................................................1 Attachment A: Information Showing the General Structure and Appearance of the Data Base Manager ................4 Figure 8Attachment B: Frequency Plots of Well “Age”, Static Bottom Hole Temperature and Initial Shut-In Pressure....................................................................................................................................................................10 Attachment B: Frequency Plots of Well “Age”, Static Bottom Hole Temperature and Initial Shut-In Pressure ....11

v
EXECUTIVE SUMMARY
The Joint Industry Project, “Analysis of Reliability of Production Tubing Design” (ARPTD), had the
originally stated objectives of documenting and evaluating the tubing string design and construction practices used
in GOM (Gulf of Mexico) oil and gas wells that had experienced sustained casing pressure (SCP) in the primary
(production tubing – production casing) annulus. The design of individual tubing strings is, of course, site-specific
and requires comparing the maximum load capacity of candidate string components with the maximum anticipated
loads that might be experienced by the production string during the life of the well. Assessing the acceptability of
individual production strings and components used in actual wells thus requires that detailed data be available
concerning the components of the production string, as well as the anticipated well conditions (temperatures,
pressures, axial loads etc.) expected during the life of the well.
A previously assembled database initially envisioned by Mohr Research and Engineering as the source of
the data to be used in the above evaluation did not contain information concerning the production tubing strings
involved in the SCP events. Under the direction of the JIP participants, Mohr Research and Engineering and, later,
Stress Engineering Services (SES) thus constructed a data collection and management system that could be accessed
by the JIP participants by way of the Internet. Unfortunately, upon completion of the data management system (and
after repeated requests by SES) only two of the participating operators in the JIP made any significant attempt to
enter data into the database. As a result, there was not enough data entered into the JIP database for any significant
correlations between well characteristics and SCP frequency to be developed. The primary original objectives of the
JIP thus proved to be unattainable by SES.
As an alternative to the original JIP objectives, SES was asked by the JIP participants to prepare a
document describing “best current practices” for preventing and/or managing SCP in the primary annulus. The aim
of this document is thus to identify causes of SCP problems, define and describe modeling and design approaches to
account for such problems, to identify occurrence of SCP, describe monitoring, detection and diagnostic procedures,
and describe the state-of-art and best practices in design and management of SCP problems. This document is not
prescriptive. Rather, it is intended to serve as a resource to better understand the SCP problem and to provide an
engineering methodology for the design and operation of wellbores to properly manage SCP. Since the choice of
best practice in any situation should be commensurate with the type of well, risk and consequences of SCP, and
design basis, a single sequence of actions cannot be termed universal best practice for SCP management.
In some respects, SCP in one or more of the annuli of a well may be viewed as inevitable in the operational
life of a well, particularly when the well is operated well beyond its original design life. All discussion of SCP
management must therefore begin by recognizing that casing pressure is another load event in the well life cycle and
that it must be treated as such. A suitable design basis can ensure that the pressure is manageable. In this document,

vi
the relationship between the annular capacity for elevated pressure and the design basis is discussed in detail.
However, proper handling and running techniques are also required to ensure that the basis of design is preserved in
the well and that components perform to their intended levels of design. Monitoring should be made (and it usually
is) the key feature during well operation.
In the opinion of many operators, current regulations that dictate operator response in an SCP incident are
adequate, and in fact, may be rather conservative. This could be especially true if the design basis and additional
best practices discussed in this document are applied. The operators feel that there may be several situations where
the SCP magnitude could exceed the current limits for departure application without compromising the safety of
personnel or the environment.
The relationship between risk and consequence of an SCP incident can be established by a risk assessment
study, which is outside the scope of this work. It is conceivable, however, that departures from current regulated
limits can be tied to a quantitative risk assessment of the wellbore, and if it can be established that the risk is within
acceptable limits, such departures could be granted, despite the extent to which they violate the current limits. Such
risk assessment is implicit in the decisions an operator currently makes regarding additional testing or monitoring
requirements. It can be aided immensely by a properly designed database of SCP incidents.

SECTION I: SUSTAINED CASING PRESSURE
FUNDAMENTALS

I:1
1) Introduction
A well is usually constructed such that uncemented annuli do not experience abnormal pressures. The
exception occurs in gas lifted wells where gas is injected into the production tubing–casing annulus. Under most
circumstances, a proper design process will ensure that annuli do not experience abnormal pressures. Thermal
expansion of the tubing and casing and the fluids in them may cause Annular Pressure Buildup (APB) when the
wells are placed on production. But this pressure can be bled off. Once relieved, the pressure does not re-appear on
the annuli if the well is in a normal production mode. If the casing pressure returns when the bleed valve is closed,
the casing is said to exhibit Sustained Casing Pressure (SCP). In this light, the Minerals Management Service
(MMS) defines SCP (MMS, 1995) as “a pressure measurable at the casinghead of a casing annulus that rebuilds
after being bled down,” and that SCP is “not solely due to temperature fluctuations,” nor “a pressure that has been
deliberately applied.”
Annuli differ from other well components in that they are usually not the result of purposeful design.
Rather, they are a consequence of the design of tubulars and the well construction process. Therefore, the ability of
an annulus to withstand loads that occur on its components is (or should be) evaluated at the end of the design
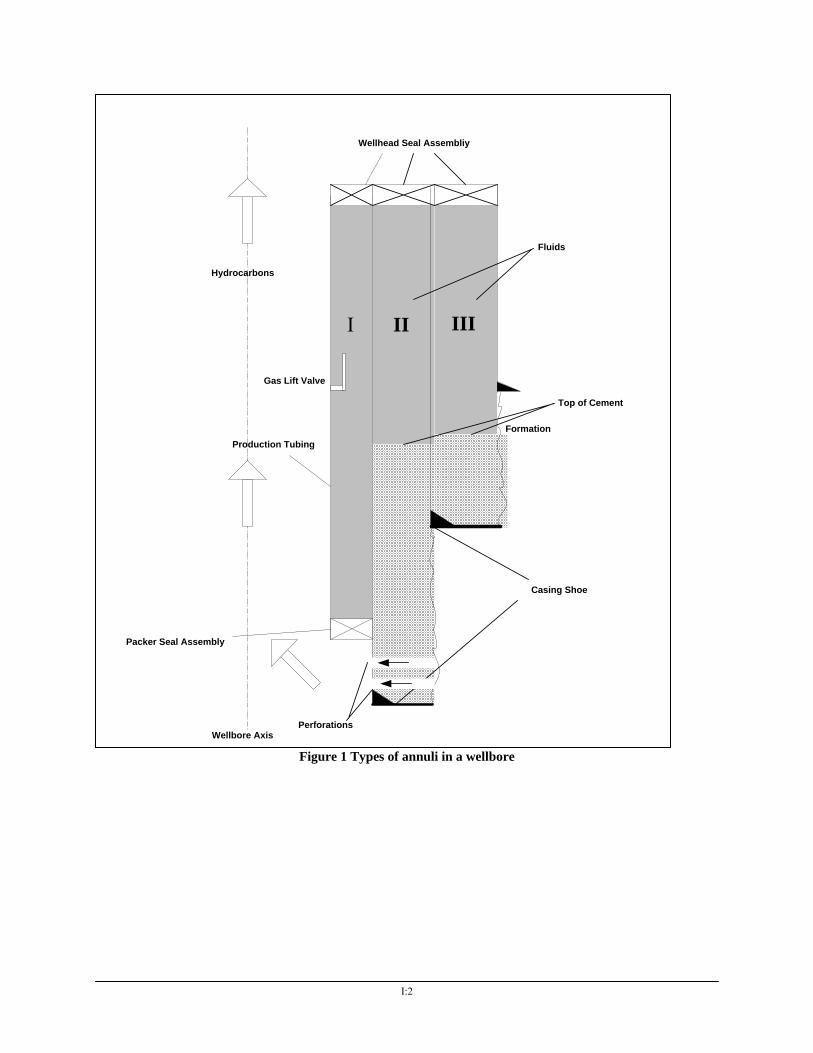
process. Figure 1 shows the different kinds of annuli in a well bore. The primary annulus (Type I) is formed by the
production tubing and casing. It is bounded on the top and bottom by the wellbore seal assembly and completion
hardware (including packers and seals) respectively. In addition, there may be an annular safety valve, gas lift valves
and related equipment depending on the nature of the well. The secondary annuli can be of two kinds- Types II and
III. The Type II annulus is formed by two adjacent casing strings. It is bounded at the top by the wellhead seal
assembly and at the bottom by the cement. The cement top in this instance is above the shoe of the outer string of
the annulus. The type III annulus is essentially similar, except that its bottom is open to the formation. The cement
top lies below the shoe of the outer casing string, either by design or accident. Instances where a section of the
annulus is deliberately left uncemented are discussed further ahead.
By definition (as well as design) an annulus is a sealed volume, and there should be no flow paths that
cause migration of fluids into (from) the annulus from (into) its surroundings. In principle, given the annular
configuration, all leak paths that can compromise its integrity should be identified. This identification is an integral
part of the design process and is the basis for the diagnosis and management of SCP, later in the life of the well.
Figure 2 and Figure 3 are a high level representation of the annular structure and may be used to identify
the potential leak paths that lead to annular breach or SCP. While these figures are by no means complete, it is
evident that the primary annulus is significantly more complex in comparison with the outer annuli. The
significantly larger number of components that comprise the primary annulus, creates a correspondingly higher
potential for annular breach.
All discussion of SCP management must begin by recognizing that casing pressure is a load event that a
well is likely to experience at some point in its life cycle, and that it must be treated as such. Just as a protective
casing string is designed to handle a kick or lost circulation or drilling wear, production tubing and casing should
ideally be designed for possible SCP scenarios among other things as described in section 5.1.
I:2
Figure 1 Types of annuli in a wellbore
I
Wellhead Seal Assembliy
Packer Seal Assembly
II III
Top of Cement
Casing Shoe
Perforations
Fluids
Gas Lift Valve
Wellbore Axis
FormationProduction Tubing
Hydrocarbons

I:3
Pipe Body ConnectionsCement
(Prod. csg./Lnr.)
Casing orCasing and Liner
Hangers
SealAssembly
ChristmasTree
Wellhead
ProductionPackers
Liner TopPackers
Completion
Gas LiftValves
AnnularSSV
Miscellaneous
DownholeHardware
Pipe Body Connections
Tubing orTubing and Tieback
Primary AnnulusProduction Tubing-Casing
Figure 2 Potential weak points in the primary annulus
Type II annulus
Pipe Body Connections Cement
Inner Casing
Hangers Seal Assembly Christmas Tree
Wellhead
Pipe Body Connections Cement
Outer Casing
Exposed Formation
Secondary Annulus(Types II & III)
Figure 3 Potential weak points in the secondary annuli

I:4
The next step is to ensure that the basis of design is preserved during well construction. This is
accomplished by handling and installation procedures that ensure continued performance of the components within
the intended design envelope. For example, if the design calls for premium connections, care must be taken to
follow special running procedures, if any, as recommended by the manufacturer. Alternatively, elevated levels of
running and handling care may be required to achieve consistently higher performance from API connections. This
requires special torque monitoring among other things. In short, appropriate operational techniques must accompany
design recommendations and they must be implemented during well construction. Arbitrarily applying torque
control or other methods will not necessarily ensure performance.
Component testing provides a limited level of assurance, i.e., an assurance that the component will perform
to the level to which it was tested. Tests provide confidence about the reliability of performance at different load
application levels. A test cannot guarantee performance for every condition the component experiences during its
service life. For example, a connection tested to an internal pressure of 3,000 psi with a tensile load of 100 kips, is
good till that load condition is exceeded. Whether the connection can perform at that level after being cycled
thermally and mechanically several years after installation can only be assessed qualitatively (or sometimes
quantitatively depending on data available). Design and proper implementation during well construction are thus the
primary safeguards to minimize SCP occurrence. Nevertheless, testing has an important role in ensuring that the
design basis is in place in the actual well.
In some respects, SCP may be an inalienable aspect of every offshore well. The principal aim of design is
to ensure that the pressure is manageable. Monitoring should be made (and usually, it is) the key feature during well
operation. In fact, a prescribed program of measuring pressures at the wellhead is followed by most operators. This
is complemented by appropriate production logging and diagnostic procedures. Monitoring programs should be
commensurate with age and characteristics of the well. This is analogous, for example, to drill pipe inspection,
where inspection intervals depend on the type of the well being drilled. Obviously, short radius rotary drilling calls
for more stringent inspection criteria. Similarly, the potential risk associated with an SCP event should determine the
monitoring program. In fact, most operators believe that current monitoring and design practices are adequate for the
management of SCP, and when implemented with prompt and appropriate diagnostic procedures, will go a long way
in mitigating SCP incidence.
Finally, there is always a small but finite chance that SCP will occur despite implementation of best
practices at every stage. When this occurs, proper diagnosis should be followed by a risk assessment and remedial
measures. This assessment feeds into the assessment of well integrity which takes all the well characteristics into
account.
The material presented in this document is a review of the state-of-the-art in SCP design and management.
It is based on experience, conversations with drilling and production engineers in operating and vendor/service
companies (including the JIP participants), and an exhaustive survey of well construction literature. Though the
problem of casing pressure has been recognized for sometime by the industry, there is little documentation in open
literature. In this respect, the present document is an attempt at piecing all the relevant information together. The

I:5
goal is to create a resource for better understanding of the SCP problem, its relationship to the design basis, and
current best practice choices available.
The authors acknowledge a significant debt to four (4) seminal papers attached to this document, i.e. the
papers by Attard (1991), Oudemann and Bacareza (1995), Michel (1991), and Greenip (1978). Attard’s paper
describes the repeated occurrence of SCP in the primary and secondary annuli of wells in the Hutton field in
offshore North Sea. This paper discusses the engineering basis for management and remedial actions that were
necessary following the discovery of SCP in the wells. The paper by Oudemann and Bacarezza provides the seed for
the development of a “unified” model of casing pressure. Though this paper is concerned with thermally induced
APB and its role on casing design, it provides valuable physical insight into what SCP is and how it should be
handled quantitatively. The paper by Michel deals with operational aspects of diagnosing SCP and isolating causes
with specific details pertinent to wells on the North Slope of Alaska. Finally, Greenip’s paper is about operational
issues related to design and running of casing. Though the paper is twenty two years old, the issues addressed in this
work continue to be as relevant today as they were at the time of publication.

I:6
2) Structure and Scope of this Document
In 1997, a Louisiana State University (LSU) study by Bourgoyne et al., (1999a, b) described the major
incidences of SCP in offshore wells. The study concluded that nearly 50% of SCP incidents in offshore Gulf of
Mexico (GOM) wells occurred on the production tubing-casing annulus, and that poor cementing was the major
source of SCP in the outer annuli. The findings of this study were also published in a paper presented at the 1999
Offshore technology Conference (OTC paper 11029, Bourgoyne et al. 1999). Appendix E is the list of the
conclusions excerpted from the LSU report. The present Joint Industry Project (JIP) was conceived in March 1999,
mainly to assess the integrity of the primary annulus and develop guidelines for best practices to mitigate SCP in
new wells and manage it in existing wells. In this light, our document focuses on the integrity of the production
tubing casing annulus (hereafter referred to as the primary annulus). The problem of SCP management in the outer
annuli are being addressed by other Joint Industry Projects.
The aim of this document is to identify causes of SCP problems in the primary annulus, define and describe
modeling and design approaches to account for such problems, to identify occurrence of SCP, describe monitoring,
detection and diagnostic procedures, and describe the state-of-art and best practices in design and management of
SCP problems. In the course of this document, we hope to provide answers or best available guidelines to questions
such as,
• Is the basic design approach appropriate to handle the presence of sustained casing pressure?
• Are the operations, testing and monitoring techniques adequate to identify and manage problematic occurrences of SCP?
• What choices exist when faced with SCP? Which choice is appropriate under what conditions?
The goal of this document is not to be prescriptive. Instead, the document is expected to serve as a
guideline and resource to better understand the SCP problem and to provide an engineering methodology for design
and operation of wellbores to properly manage SCP. Hopefully, such a document will be a useful resource and
reference to regulatory authorities, operating companies and vendors alike.
This document begins with a brief section that identifies the causes of SCP which were first made known
via the LSU study by Bourgoyne et al. (1999). This is followed by a re-examination of some of the conclusions in
the LSU study. In particular, we draw attention to the purported severity of the SCP problem incidence based on
reported case histories and statistical analysis of the data in the MMS database used in the LSU study. The rest of
the document is devoted to a discussion of the management of the SCP problem from the perspective of design,
running, installation and testing, and diagnostics. In each case, the focus is on tubulars, that form the primary
annulus and the associated completion hardware. Cementing issues are not addressed in this report. Remediation of
the SCP problem, by the very nature of the problem cannot be based on a general discussion. A key point that
emerges from the discussion ahead, is that mere adherence to best practices as documented in a manual is not an
automatic guarantee against SCP. Rather, the possibility of SCP must be incorporated into each stage of well
construction like other load cases such as a 100 year storm or a 100 barrel kick. As a consequence, remedial
practices to eliminate or mitigate the impact of SCP when it occurs must necessarily be treated on a case-by-case

I:7
basis. As a result, in each of these sections we focus on current best practice, identify potential problems and
describe the state of the art to the best of our knowledge.
We note here that this section (Section I) of the document must be read in conjunction with four other
sections. Section I was prepared by Blade Energy Partners.
Section II examines the role of sealing elements, i.e., tubular connections. This section has been addressed
separately by Tom Asbill of Stress Engineering Services.
Section III is a discussion of basic string design, properties of elastomeric seals and the characteristics of
other components of the production string that may experience leak problems. Section III was prepared by
Magnolia Global Energy.
Section IV is a discussion of the effect of corrosion and sour gas on tubulars and their role on annular
integrity. Section IV was written by Ken Riggs of Stress Engineering Services.
Section V contains a brief review of the well data that was collected from participating operators as part of
this JIP. This section was also prepared by Ken Riggs of Stress Engineering Services.
We only make a few summary remarks on the above topics to maintain internal consistency.
The document concludes with appendices and attachments. Appendix A contains the results of a survey of
current operational practices for managing SCP that was sent to participants in this JIP. Appendices B and C discuss
the modeling techniques used to quantify SCP problems. Also attached in Appendix F are four (4) seminal papers on
the SCP problem. These papers, explicitly or implicitly contain most of the points made in this document. In fact we
would go so far as to state, that by themselves, these papers form a “best practices document” for management of
SCP.

I:8
3) Causes of Sustained Casing Pressure
Depending upon the well location (offshore, onshore, subsea) and type (HPHT, oil, gas, ERD), SCP may
arise due to one or more of the following reasons:
3.1) Thermal Effects
As mentioned in Section 2, the temperature across the wellbore increases in comparison to its equilibrium
initial magnitude when the well is put on production. The temperature causes thermal expansion of the
incompressible annular fluids. Since the volume of the annulus does not expand to the same extent, the annular
pressure increases. The problem here is one of multiple annuli responding together to a change in temperature. At
equilibrium, the increase in pressure corresponds exactly to the final volume changes of the annuli and fluids. In
designing for this load condition, care must be taken to include all the uncemented annuli in the analysis. Often,
addressing the pressure build-up in one annulus may leave another annulus exposed to a failure-causing load. Such
pressure abnormalities can (and are) typically accounted for in the well design process by most well designers. The
procedures to do so are well documented in the oilfield literature (Adams, 1991; Halal and Mitchell, 1991;
MacEachran and Adams, 1991). Trapped annulus pressures are a natural phenomenon and do not arise due to a
problem of design or construction. Of course, they cannot be ignored and must be considered when designing
equipment to handle the expected loads. Nevertheless, the design methodology to handle such “unsustained” casing
pressure scenarios will prove instructive in our understanding of the causes and management of SCP, as discussed
ahead.
3.2) Leak in tubing or Sealing Elements
When the pressure integrity of the production tubing or the sealing element is lost, the primary annulus is
exposed to the reservoir pressure, usually resulting in an increase in the pressure. This condition may arise due to
poor tubing design, poor packer and seal design, or erosion/corrosion of the tubing and/or sealing elements. In
general, however, both the tubing and casing are designed for this load condition. Proper design ensures that the
casing can withstand the likely loads imposed due to a leak.
3.3) Failure of Casing
In some cases, the casing itself may fail, due to corrosion, wear, or thermal cycling. The failure could
either be at the connection or in the pipe body itself. At such times, it is possible for the annulus to be exposed to the
formation communicating with the failed portion. If this formation happens to be a high-pressure formation, once
again, an increase in annular pressure is observed.

I:9
3.4) Failure of cement
In annuli where sealing and isolation are achieved by a cement column, the cement column may fail during
the service life of the well, thus exposing the annulus to the pore pressure at the shoe of the shallower casing. This
could result in either an increase in pressure in the annulus, or a loss of fluid to the formation, which in turn could
result in a pressure increase. Poor cementing is a common cause of this condition.

I:10
4) An Overview of the LSU Study
The objectives of the LSU study were to compile data on the magnitude of the SCP problem, identify its
causes and methods of management/remediation, and to assist in the development of new technology to reduce
future SCP problems. A database of GOM wells for which SCP departures were given was compiled as part of this
study, and the data in this database were analyzed. In brief, the final report of this investigation (available at
ftp://www.mms.gov/TubingStudy/ ) contains
• a description of the current regulatory practices that MMS has in place to monitor SCP problems and grant departures,
• brief case histories of four (4) wells which suffered catastrophic consequences due to SCP (or rather its improper management),
• summary statistics of SCP occurrence in GOM wells grouped according to geographic location, type of well, type of annulus and casing pressure magnitude,
• a study of SCP causes, and
• a section on diagnostics and possible remediation techniques (illustrated with three (3) case histories of successful and unsuccessful applications.)
The conclusions drawn from this study are presented in Appendix E. Conclusions # 1, 8 through 11, 13 and
14 are relevant from the perspective of the current document and they are reproduced below for reference:
1. About 50 % of wells with sustained casing pressure have pressure on the production casing.
8. About 10 % of the casing strings exhibiting sustained casing pressure are intermediate casing strings.
2. About 30 % of the casing strings exhibiting sustained casing pressure are surface casing strings.
3. About 10 % of the casing strings exhibiting sustained casing pressure are conductor casing strings.
4. Only about one-third of the casing strings exhibiting sustained casing pressure are in wells that are active and producing.
13. About 90 % of sustained casing pressures observed are less than 1,000 psi in magnitude.
14. More than 90% of all sustained casing pressures observed are less than 30 % of the minimum internal yield.
Further to these conclusions, the study reports that “…most serious problems have resulted from tubing
leaks,” and recommends “…the most promising area for improvement is through prevention of SCP by use of better
tubular connectors, by use of better primary cementing practices, and by maintaining a reasonable margin between
pore pressure gradient and fracture pressure gradient in the open borehole being cemented.”
The purpose of this section is to examine some of the conclusions made by the LSU study, especially in the
light of the database analysis.

I:11
4.1) Data Analysis
The discussion in this section is based only on information that was available to Blade energy Partners. We
did not have access to the actual database or the raw data that was used to arrive at the conclusions reported by the
LSU study.
The LSU report is essentially a study of incidence of SCP as reported into the database. As in any
database, the only conclusions that can be drawn are a function of the data fidelity and characteristics. The report
does an excellent job of cataloging the reported incidences by geography, annulus type, and pressure magnitudes.
Several case histories are also reported, and the authors also attempt to identify causative factors in SCP. However,
given the database (or at least based on the report) it is difficult to assign causative links between the incidence of
SCP being reported and the design basis, well history, and diagnostic results. Operational reasons or physical
causes of SCP therefore are impossible to ascertain from the reported incidences. This is the main reason why most
of the conclusions of this report are statistical, and not phenomenological.
Since the present document addresses only issues related to the primary annulus, consider the statement (in
the LSU report) that most serious problems have resulted from tubing leaks and that the most promising area for
improvement is through the use of better tubular connectors. The only evidence cited for this is conclusion #1
which states that 50% of the SCP cases occur on the production casing. Although the conclusion is reasonable, the
data analysis by itself does not lead to this conclusion. For one, the database is also populated by incidences of
casing pressure as a result of thermal expansion of trapped annular fluids (recall that MMS regulations require the
reporting of casing pressure, even unsustained, if it exceeds 20% of the minimum internal yield pressure (MIYP)1 of
production casing). Secondly, if the incidence of casing pressure in the primary annulus is accompanied by pressure
in other annuli, then the cause of pressure in the primary annulus could be other than a leak in the tubing. Thirdly,
the primary annulus (as discussed later in this document) is assembled of components that present several leak paths,
all of which could have caused the leak, if a leak is the cause of the increased pressure. Despite these problems, as
stated earlier, the conclusion is reasonable. In general, experience and operator input indicate that the primary cause
of sustained pressure in the primary annulus is tubing leak, while the primary cause of sustained pressure in the
other annuli is poor cementing.
The report also assigns the casing pressure incidences by field. This is reproduced as Figure 4 in this report
(and is Figure 2 in OTC paper 11029). Although this figure is only for outer string annuli (i.e., not the primary
annulus), it is instructive. The data indicate that up to 35% of the outer strings have sustained pressure in some
fields. However, some fields exhibit a much higher incidence rate than others. The wells in Mississippi Canyon
seem to experience an unusually high percentage (35%) of SCP problems with Ewing Bank wells following closely.
Is there a reason for this (possibly geological, as hinted by the LSU report)? Why are only some wells in each field
1 The minimum internal yield pressure of a casing string is the internal pressure rating of a tubular as described by API 5CT. It is given by
( )tdσ
o
yp2 0.875MIYP API =
where σyp, do and t are the yield strength, outer diameter and wall thickness of the tubular respectively.

I:12
exhibiting SCP? How close are these fields together? What is the age of these wells? What is the average period of
SCP (i.e., how long has SCP been present on an average well)? Is there a higher incidence of sour gas (perhaps
being produced late in life)? Many such questions need to be addressed before making conclusions on the efficacy
of regulatory practice or SCP management.
Consider the data that shows the distribution of SCP by casing types. This is reproduced as Figure 5 in this
report (and is Figure 3 in OTC paper 11029). This data would be very useful if we could also determine the
percentage of cases where more than one string had pressure simultaneously. For instance, of all the surface casing
strings, what percentage had pressure on production casing? What percentage had pressure on all the strings?
Perhaps, a Venn diagram showing percentages of strings which experienced pressure simultaneously and strings that
were the only afflicted ones would be more appropriate. For example, if all of the surface strings had pressure on
other annuli as well as in a given field, conclusions about likely leaks paths could be made. However, given the
current data, it is not possible to assess the seriousness of the problem. Curiously, conclusion # 11 through 14
indicate that only a third of the wells with SCP are live producing wells. This fact is important to the discussion of
well integrity and risk assessment.
Figure 4 SCP by Area (Figure 2 of OTC Paper No. 11029)

I:13
Figure 5 SCP in MMS database by string (Figure 3 in OTC Paper No. 11029)
Finally, one rather important correlation statistic would be valuable in assessing the impact of SCP. The
report states that over 8,000 wells in the GOM have reported SCP. It would be useful to know the answer to the
simple question “for how long?”. If management of the SCP problem has been successful enough to allow pressure
for an extended period of time in some cases, this would indicate that adequate management practices are being
followed in those cases.
In summary, we believe that SCP databases need to be structured such that the statistical analysis of their
data can be correlated with the physical conditions of the wells. These well conditions should include factors such as
the age of the well, casing data, quality of cement jobs, nature of produced fluids, potential for corrosion, etc. These
are discussed further in the section on assessment of well integrity. This is arguably difficult, as the authors of the
LSU report worked from a specific database. We raise these questions here to highlight this difficulty, and to
suggest that making phenomenological conclusions from this work is also difficult.
Despite these difficulties, the report has successfully raised the issue of SCP incidence and potential for
dangerous consequences.
4.2) Case Histories
Brief outlines of four case histories are provided in the report as well as in OTC paper no. 11029. Case 1
describes a well that cratered due to SCP of 3,400 psi on the production casing. The only detail pertaining to the well
parameters is the MIYP of the production casing (6,900 psi). The case history concludes by stating that “It is
believed that the production casing became pressurized through tubing or packer leaks. Failure of the production
casing led to pressure on the outer strings through which the blowout occurred.” Though the outcome cannot be
disputed, it is difficult to make definite conclusions in the absence of a design basis, post-mortem or even a well
schematic. For instance, why did the production casing fail at 3,400 psi, if its pipe body yield is 6,900 psi? What was
the load state on the production casing (i.e., what was the differential pressure on it?). What kind of connections
were used? Is it possible that the blow-out was a consequence of pressure build up (or failure of cement) in the outer
casings, and was independent of the fact that the production casing also saw pressure? The only clue to probable
mismanagement of the problem during initial stages comes from the fact that the operator applied for a departure
when the SCP was measured at 3,400 psi (which is nearly 49% of the MIYP). Unless the basis for granting

I:14
departure and the diagnostic results prior to departure grant are known, among other things, it is difficult to re-
construct the events leading to the explosion.
Case 2 describes a well with an underground blowout which eventually caused platform settling at the
mudline. Holes in the tubing were discovered at 1500 ft. Once again, as in case 1, the cause and effect sequence is
not clear from the data presented.
Case 3 is not directly relevant to this study, as the incidence of SCP was limited to the surface
casing/conductor annulus, and the cause-effect analysis is also fairly clear from the reported history.
Case 4 describes a well on which departure was granted (soon after the well completion) when the SCP on
the intermediate casing was 4,600 psi. Although this case is also one of pressure in outer strings, we discuss it here
because of the possible role the primary annulus played in the case. The cause of the SCP was assumed to be
thermal pressure buildup. Again, it is not clear what the pressure on the primary annulus was when the intermediate
casing recorded 4,600 psi. Thermal pressure buildup effects are felt also in the primary annulus. It is surprising that
the primary annulus pressure is not reported in the discussion of the case history. Based on what eventually
happened, this case seems to be one of mis-diagnosis, since an underground blowout was the cause of the problem.
Regardless of the above comments, the case histories reported make a very important point which must not
be ignored- that SCP can have (and has had) disastrous consequences if it is poorly diagnosed or managed.
In summary, the authors of the LSU report have achieved an important purpose- elevating the issue of SCP
as a situation that must be addressed by regulatory authorities and operators alike. The most important conclusions
that can be drawn from the LSU report are:
1. There is a large incidence of sustained casing pressure in one or more annuli in GOM wells,
2. If poorly managed, SCP has the potential for dangerous consequences.
It is however, hasty to conclude from this report that current operational guidelines for well design must be
drastically revised to mitigate SCP, based solely on these incidents. Such a conclusion can only be made after a
more thorough review of the data and well histories, and a detailed post mortem of these and all other instances in
the MMS database.
In this light the current document makes an attempt to unify the best practices in design, running, handling,
monitoring, testing and diagnostics in order to provide a framework for operators, vendors and regulatory authorities
to better understand and manage incidence of sustained casing pressure in GOM wells.

I:15
5) Management of Sustained Casing Pressure in the Primary Annulus
5.1) Design
Figure 6 Purpose of Design
As shown in Figure 6 the purpose of good casing design is to ensure that the tubular can sustain all imposed
loads while ensuring safe well operation for the life cycle of the well, and minimizing material costs. The design
methodology involves two steps:
1. identification and determination of loads that the tubular will experience during its service life, and
2. selection of a suitable tubular with an acceptable level of safety.
Traditionally, the oil industry has used a methodology known as Working Stress Design (WSD) to design
oil well tubulars. Conventional WSD philosophy is based on maintaining a specific margin between the maximum
anticipated field load and the “published rating” of the tubular. The anticipated load is usually based on the worst
case load that can theoretically originate during given operations. For example, the worst load on the surface casing
string might be the internal pressure at the casing shoe during a pressure test. In this case the appropriate “published
rating“ of the tubular could be the “MIYP rating” as given by the manufacturer. The specific margin between the
maximum anticipated load and the published rating is known as the “safety factor” (SF) or the design factor, so that
1Load dAnticipate Max.
Rating Published>=SF . (1)
$
Reduce Tubular Cost by Identifyingoptimum Fit-for-Purpose Design
Maximize Tubular Reliabilitythrough quality assurance andfield running procedures
Safetyand
Reliability
I:16
Since the late 1980s, an alternative design approach known as Reliability Based Design (RBD) has been
applied by some operators (notably, ARCO, Mobil and Shell). This approach treats the anticipated loads and the
tubular strength as statistical distributions rather than fixed quantities. The details, comparison of RBD with WSD,
their relative merits and de-merits are beyond the scope of this document. In the context of the present document, it
suffices to say that there are several competing design methodologies currently being used for well designs. The
works listed in the bibliography by Payne and Swanson (1989), Payne et al. (1998), Brand et al. (1993) Gulati et al.
(1994) represent the work by ARCO and Mobil, while those by Bradley (1971 a, b), Parfitt and Thorogood (1994),
and Banon et al. (1991) highlight the work by Shell and BP Amoco.
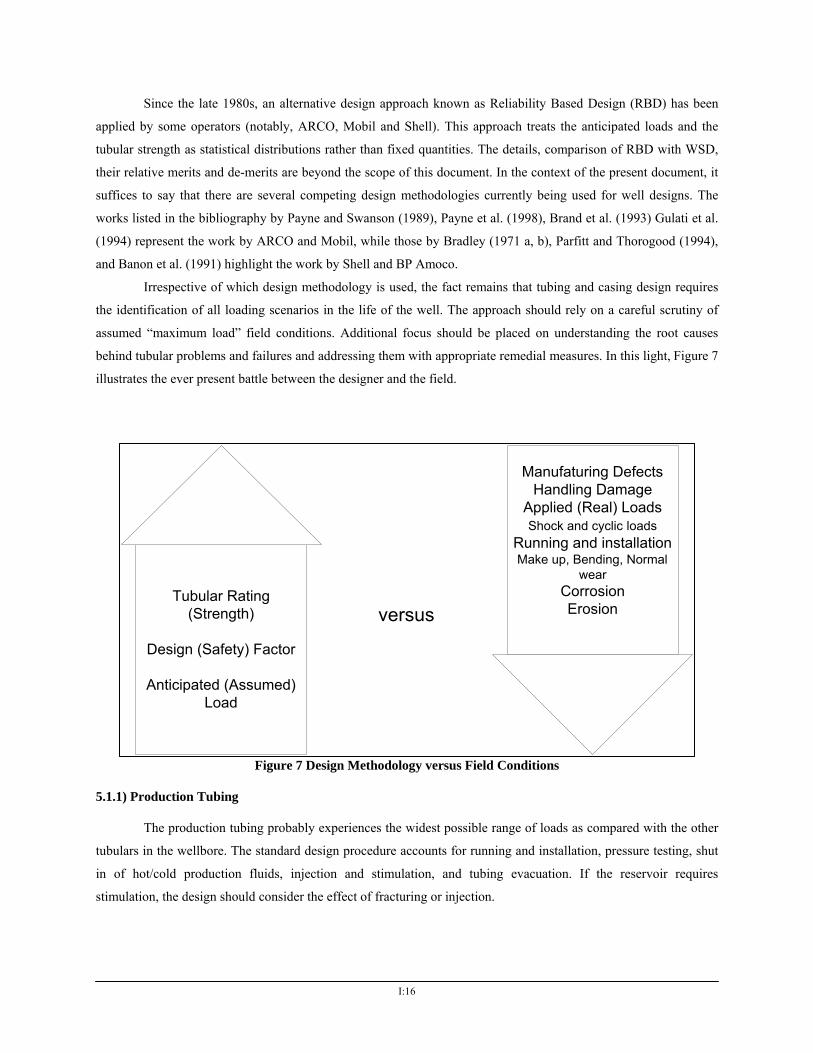
Irrespective of which design methodology is used, the fact remains that tubing and casing design requires
the identification of all loading scenarios in the life of the well. The approach should rely on a careful scrutiny of
assumed “maximum load” field conditions. Additional focus should be placed on understanding the root causes
behind tubular problems and failures and addressing them with appropriate remedial measures. In this light, Figure 7
illustrates the ever present battle between the designer and the field.
Figure 7 Design Methodology versus Field Conditions
5.1.1) Production Tubing
The production tubing probably experiences the widest possible range of loads as compared with the other
tubulars in the wellbore. The standard design procedure accounts for running and installation, pressure testing, shut
in of hot/cold production fluids, injection and stimulation, and tubing evacuation. If the reservoir requires
stimulation, the design should consider the effect of fracturing or injection.
Manufaturing DefectsHandling Damage
Applied (Real) LoadsShock and cyclic loads
Running and installationMake up, Bending, Normal
wearCorrosionErosion
Tubular Rating(Strength)
Design (Safety) Factor
Anticipated (Assumed)Load
versus

I:17
AFP IPP EPP TP OtherTbg. Limit
stateRunning and Installation Running weight. Drilling mud Drilling
mud Geostatic Bending & neg. dyn. loads
Pressure Test
Buoyed weight plus slack off or pick up and end effects.
Surface pressure on mud column
Packer fluid Geostatic Bending* Tension
Burst
Production
Buoyed weight plus slack off or pick up and end effects.
WHFP + hydrostatic prod. fluids + flow losses
Packer fluid Production
Bending* and buckling due to thermal loads+
Tension Burst
Well shut-in
Buoyed weight plus slack off or pick up and end effects.
Reservoir BHP + gas gradient for gas well. (Conservative for oil well.)
Packer fluid
Initially hot production temperature profile cools to geostatic after a few hours
Bending* and buckling+ due to thermal and SI pressure effects
Tension Burst
Evacuation or production from depleted reservoir
Buoyed weight plus slack off or pick up and end effects.
Near vacuum Packer fluid
Production (hot)
Bending* and buckling+ due to thermal and SI pressure effects.
Collapse
Tubing Leak at surface
Buoyed weight plus slack off or pick up and end effects.
Reservoir BHP + gas gradient for gas well. Conservative for oil well
Reservoir BHP on top of packer fluid
Production (hot) and/or geothermal
Bending* and buckling+ due to thermal and SI pressure effects.
Collapse
Injection
Buoyed weight plus slack off or pick up and end effects
Inj. Press. + hydrostatic + frictional losses
Packer fluid
Injection temperature (cold)
Bending* Tension Burst
Frac job
Buoyed weight plus slack off or pick up and end effects.
Screenout + hydrostatic
Packer fluid
Injection temperature (cold)
Bending* Tension Burst
AFP Axial Force Profile End effects due to packer type must be included in the determination of AFP
IPP Internal Pressure ProfileEPP External Pressure ProfileTP Temperature ProfileSI Shut-InBHP Bottom Hole PressureWHFP Well Head Flowing Pressure* If well is deviated
0
+ Depends on packer type Table 1 Standard tubing design load cases
Table 1 shows the loads normally anticipated by a tubing designer for production and injection wells. The
loading modes experienced by the pipe body under these well conditions are also described in the table. In most
cases, for a producing well, the tubing size and grade are ultimately governed by the loads experienced by it during
well shut-in and evacuation.

I:18
The tubing running procedure is designed such that before the well is set on production, the tubing is free
of thermal stresses. The stress state at any point in the tubing string is determined by the string weight and internal
and external pressures. The internal pressure is created by the completion fluid while the external pressure is created
by the packer fluid. When the well is set in production, the tubing heats up and its thermal expansion (or rather its
prevention due to constraints placed by the wellhead and the packer) causes thermal stress. This in turn can buckle
the string, lead to tubing movement (depending on the amount of motion allowed by the packer at the tubing tail),
and create corresponding stresses. The change in the internal pressure profile (from completion fluid to a less dense
production fluid) contributes to tubing motion and stresses. The analysis of tubing movement, the resulting tubing to
packer forces, and the forces transmitted to the casing via the packer are fundamental to tubing design. This analysis
consists of determining the changes in the length of the tubing due to four separate effects- length change due to the
string weight and mechanically applied axial forces (slack off or pick up), length change due to helical buckling of
the tubing if it occurs, a length change due to temperature change, length change due to pressure forces on the tubing
end (the piston effect) and a length change due to ballooning. The last effect refers to the axial response of length
changes in the pipe due to changes in the internal and external pressure of the tubing (i.e. changes in fluid density
and applied surface pressure) and is different from the length change due to the piston effect. These effects have
been thoroughly studied and well documented in the literature by Lubinski and Blenkarn (1957), Lubinski et al.
(1962), and Hammerlindl (1977). These well understood effects are included even in rudimentary casing and tubing
design procedures of most oil companies and tubing manufacturers, and they are documented in textbooks on casing
and tubing design (see for example, Craft et al. (1962), Aadnoy, (1996), Mitchell, Miska and Wagner, (1997)).
From the point of view of annular integrity, it must be noted that tubing movement analysis for different operating
conditions influences the design of the packer. As a result of the various length changes mentioned above, tubing to
packer forces are generated. In turn, these forces are transmitted to the casing via the packer (such that the casing to
packer force balances the resultant of the tubing packer force, the weight of the column of packer fluid, and the force
due to reservoir pressure at the bottom of the packer). Needless to say, the packer forces and magnitude of its motion
have a significant impact on the packer design which is one of the critical sealing components of the annulus. This is
discussed ahead in section 5.1.4.
When the production fluids have to be shut in for any reason during the life of the well, the inside of the
tubing is exposed to a hot column of pressurized fluid. The shut-in internal pressure profiles are likely to be less
severe in the case of oil wells as compared to gas wells. However, it is conservative to design for gas shut-in,
especially if it is an exploration well or there is uncertainty about the reservoir properties or the well has a high gas
to oil ratio or is likely to produce gas later in its life. Typically, the most stressed point occurs at the top of the tubing
where it experiences the vertical component of the buoyed weight of the tubing, thermal stresses, internal pressure
(approximately the reservoir BHP less the gas gradient times well TVD) and zero external pressure (since the packer
fluid has no backup pressure at surface under normal operating conditions). In WSD approaches, the body of the
tubing is designed such that the maximum triaxial equivalent stress does not exceed the working stress for the tubing

I:19
steel. For steel, the triaxial stress is the von Mises2 Equivalent (VME) stress, and the working stress is the yield
stress divided by an acceptable design factor. Finally, depending on the packer type, the worst case scenario could
occur when the production fluids have cooled and reached geothermal temperature. For example, if the packer does
not allow any motion, the tensile axial stress at the top of the tubing is mitigated by the compressive thermal stress
developed during production. When the wellbore cools down, the axial stress in this section of the tubing is likely to
be higher than the hot shut-in case. It is therefore prudent to check both hot and cold shut in conditions.
In injection wells, cold fluid is injected down the tubing and into the reservoir. This has the opposite effect
of production, in that it cools the tubing and produces tensile thermal stresses. Again, depending on the packer, the
tubing has to withstand internal pressure with tension.
The estimation of the thermal stresses in the above situations requires the calculation of the tubing
temperature profiles with changing well conditions, i.e. production, injection, shut in, etc. The thermal behavior of
wellbore has been studied under a variety of conditions (for example, see Ramey (1962), and Erpelding and Miller
(1994), for production and injection, Raymond (1969) and Corre et al. (1984) for drilling and circulation). More
recently, computer software programs known as wellbore thermal simulators are used in conjunction with casing
design programs to evaluate temperature profiles and thermal stresses prior to the determination of tubing movement
scenarios. These simulators are finite difference programs that are based on a two-dimensional axisymmetric
formulation of the heat transfer equations. Given the wellbore geometry, descriptions of annular fluids, and ambient
conditions, the programs calculate temperatures along the length of each casing string and annulus for the given
flow condition, for example, production. Wooley (1979, 1980) provides a detailed description of how these thermal
simulators are formulated and used in well design. Use of such simulators is now common in well design
procedures. At the least, a rule of thumb to estimate the maximum wellhead flowing temperature is used.
As the reservoir is produced, the sand face pressure declines towards the end of the life of the well. In this
instance, the pressure of the packer fluid in the annulus will exceed the internal pressure and the tubing should be
designed against collapse. Also, if for any reason, the perforations are plugged and the tubing is evacuated, it should
be able to resist collapse due to the external pressure of the packer fluid.
Apart from the above strength based considerations, the tubing must also be sized for erosion resistance,
potential corrosion and sour service as dictated by the nature of the well. Depending on the life expectancy of the
well and the anticipated solids production, acceptable erosional rates and production flow velocities are determined
(API, 1981, Salama and Venkatesh, 1983). This information in turn is used to size the tubing ID (Payne and Hurst,
1986).
The role of corrosion and sour service in tubing selection is being addressed in another section of the
current study (Riggs, 2000).
Sour service considerations place restrictions on the grade and metallurgy of the tubular steel (Ikeda, 1992,
Monrose and Boyer, 1992, Crusco, 1981, Stair and McInturff, 1983).
2 See Johnson et al. (1987) or Greenip (1977) for a discussion of how the notion of triaxial load capacity is used in tubing and casing design.

I:20
5.1.2) Production Casing
AFP IPP EPP TP OtherPipe body Limit state
Evacuation As cemented string weight
No fluid- complete evacuation
String mud weight
Geostatic Bending* Collapse
Tubing Leak at surface
As cemented string weight
Reservoir BHP or WH SIP on top of packer fluid
Pore pressure
Production (hot)
Bending* and buckling due to thermal loads if not cemented to surface
Tension burst
Annular Pressure Buildup (APB)
As cemented string weight Thermally induced Thermally
induced Production (hot)
Possibly wellhead movement in platform completions
Burst or collapse
AFP Axial Force Profile IPP Internal Pressure ProfileEPP External Pressure ProfileTP Temperature ProfileSI Shut-InBHP Bottom Hole PressureWHFP Well Head Flowing Pressure* If well is deviated
Table 2 Standard load cases for production casing
Table 2 shows the load cases that normally drive the design of the production casing. Though the load cases
are self-explanatory, it is important to note the following (assuming that the production casing is designed for these
cases):
1. If the well has to be shut-in for any reason and the wellhead seal assembly fails during the shut in and breaches the primary annulus, the casing can withstand the tension burst load imposed on it. If the tubing is designed for complete internal evacuation (and collapse due to the packer fluid), this condition automatically protects the annulus to a pressure equal to the wellhead shut in pressure based on the initial reservoir pressure.
2. By designing the casing to resist collapse due to the natural pore pressure gradient, we are once again protecting the integrity of the tubing in the event of the annulus losing the packer fluid.
In high temperature, high rate wells, or subsea wells which do not have access to the outer annuli, annular
pressure buildup effects must be explicitly considered during the design stage by using methods such as those
outlined by Adams (1991) or Halal and Mitchell (1993). An example of how annular pressure buildup influences
design is provided in the work by Goodman and Halal (1993) with respect to a high pressure high temperature
(HPHT) wells. The implications of designing for annular pressure on the current SCP problem are discussed in
section 5.1.4. When very high pressures are likely to be induced due to heating of the annular fluids during
production, stronger casing (by weight and/or grade) is used. Alternatively, depending on the well, the formations in
which the different strings are set and the pore pressure and fracture gradient profiles, an annulus where very high

I:21
pressures are expected may be left unsealed, creating a Type III annulus that was discussed in Section 2. If the
thermal pressure buildup exceeds the fracture pressure at the bottom of the annulus, the fluid leaks off, thus relieving
the pressure on the strings (Oudemann and Bacarezza, 1995). Sometimes, a highly compressible foam is used to fill
a part of the volume of the annulus in which pressure relief is sought (Leach and Adams, 1993).
In the event that a snubbing operation cannot be attempted if the tubing fails at surface, the casing must be
strong enough to withstand a bullhead kill on the live tubing string. In this case, this would be one of the design
criteria for the production casing.

I:22
Figure 8 Production casing loads during stimulation
The casing must be designed to withstand all the loads imposed during well stimulation. Figure 8 shows
possible scenarios when the production casing could be subject to severe collapse loads. If for some reason, the
cement behind the production casing is poor, a high drawdown situation could lead to point loading and premature
collapse of the casing. A similar situation could arise during fracturing in the neighborhood of a poorly cemented
zone.
Apart from these standard load scenarios, based on the specific well conditions, other loads such as well
subsidence may have to be considered. Gradual depletion of the reservoir leads to compaction of the producing
formation. This compaction transfers axial buckling loads and transverse crushing loads to the production casing.
The principal failure modes for the production casing have been identified as compression, buckling, shear and
bending (Bruno, 1990). Philips experienced such problems in the offshore Ekofisk field in North sea. Yudovich et
al. (1988) and Anvik and Gibson (1987) describe how to probabilistically predict such subsidence induced failures
and plan for them during the design stage.

I:23
Also, in high rate and/or high temperature gas wells, large tubing-to-packer forces are generated.
Depending on the design of the packer, these loads may be transmitted to the casing. This is an unlikely but possible
mode of casing failure/ annular breach.
Finally, the effects of the packer fluid on the production casing and tubing must be considered during the
design stage. This aspect is addressed in a separate document on corrosion (Riggs, 2000).
5.1.3) Connections
Connections and other sealing elements are discussed in greater detail in a separate section (Asbill, 2000).
A few points relevant to the discussion in this section are included here for completeness.
The selection of tubular connections is critical when constructing a well to avoid SCP. It is estimated that
connection failures account for 85% to 95% (or more) of oilfield tubular failures (Payne and Schwind, 1999). This
has significant implication in the SCP problem in the primary annulus. From a probabilistic view point, as there are
significantly greater numbers of connections than other sealing elements in the primary annulus, the probability of
SCP being caused by a connection leak is correspondlingly higher.
Tubular connections can generally be divided into two groups, API and premium. There could be
significant differences in the reliability or leak resistance between connections. Choosing the proper connection for a
particular application involves understanding the expected loads. Suggested application limits for different
connection types have been published by connection suppliers and users of connections (Klementich, 1995). Note
that many published ratings do not include combined load ratings, such as tension and burst. It is up to the designer
to determine the suitability of the connection for the intended application.
Studies have shown that the leak resistance of API 8-round connections is sensitive to a number of
parameters including variations in makeup turns, pipe diameter, grade, thread compound, and applied tension
(Schwind and Wooley, 1989). It should also be stated that API connections can provide a reliable leak resistant
connection for many applications. Proprietary makeup procedures for API connections have been developed to
improve the reliability of leak resistance. These include Torque-turn and Torque-position (Day et al. 1990).
Proprietary connections have manufacturer published ratings, and these are often used as the basis for
selection. There are instances when a connection is planned to be used in a well where the anticipated load
conditions do not fall in the set of load cases that the connection was tested for. In such cases, operators augment
connection tests performed by manufacturers with detailed finite element analyses or further testing to ensure
connection performance in an application.
Regardless of connection type, make-up practice has a significant impact on the leak resistance realized
from the connection. As discussed earlier, for API threads, proprietary make-up procedures have been developed to
augment leak resistance. Proprietary threads have special make-up procedures, which are well documented by the
manufacturer. These procedures must be followed, at a minimum, if the published performance is to be realized in
an application.
Tension or compression can cause a significant reduction in connection leak resistance for both API and
premium connections. The leak resistance under combined loading, such as, tension and burst, must be understood

I:24
in order to determine the suitability of connection. Tests have shown that connections are susceptible to leak when
loads are cycled. Since axial and bending stresses on a tubing vary considerably during its service life, the impact of
cycling the load on connection performance must be considered when selecting a connection.
An important issue that has received little attention is that of corrosion in connections, especially in the
threaded section of the runout sections (Moore, 2000). Moore speculates that residual stresses could initiate or even
catalyze galvanic corrosion in these sections of the connection geometry. Since threading is a cold working process,
it creates areas of residual stress concentration which can initiate corrosion. In principle, heat treatment can
eliminate the residual stresses. But API requires hot working only on C-90, T-95 and Q-125 grades. A majority of
tubing that is presently downhole belongs to the J, K, L, N and P grades. In this light, API Supplemental
Requirement SR-22 which prescribes tolerance specifications for API threads may have to be re-examined.
5.1.4) Packers and Sleeves
A packer provides a seal between the tubing and the casing, isolates the fluids in the primary annulus from
the reservoir. A sleeve is a downhole component used to obtain access from the tubing to the primary annulus to
permit fluid circulation (for any reason) or produce a previously isolated zone. Sleeves are essential components of
multi-zone completions, and they are typically placed above the packer in each producing zone. For a discussion of
the different kinds of packers, sleeves and other completion equipment see Buzarde et al. (1972: Pearson, (1987; or
Allen and Roberts, (1989).
In its simplest manifestation, a packer (Figure 9) consists of a sealing element surrounded by a set of slips
on either side. The slips are driven by a mechanical (setting) force so that they cut into the casing wall (the inner
surface) and engage to prevent relative motion between the slips and the casing. After the slips engage, the seal is
energized mechanically or hydraulically. Depending on the application, there is a bewildering array of packers
(retrievable, permanent-retrievable, inflatable) that are available from different manufacturers. However, from the
point of view of annular integrity, the design should be primarily based on a consideration of the allowable tubing
movement that the packer permits and the evaluation of the forces that are imposed on the tubing and the packer, as
a result of the end constraint. From a mechanical stand point, there are three types of packers – those that permit no
motion in the tubing at the packer end (latched), those that permit only upward motion and those that permit free
motion in either direction (landed).

I:25
Figure 9 Packer mechanism (after Buzarde et al. 1972)

I:26
Figure 10 Example calculation – piston force on a packer during injection
(after Allen and Roberts, 1989)

I:27
Figure 10 shows an example calculation for the piston force acting on a packer during injection. Forces
exerted on the packer for different well operating conditions must be evaluated before selection of the packer. For
example, consider the case of a limited motion packer (that does not permit downward motion of the tubing) in a
producing well. During the initial stages of production, the pressure differential across the packer is very small,
since in most cases the annular fluid has a density equal to the reservoir kill weight. Later in the life of the well, the
depletion of the sand face pressure increases the pressure differential, thus possibly increasing the tubing to packer
force. Once again, it is important to consider the service life of the tubing in design. Most casing/tubing design
programs incorporate a procedure that allows quick evaluation of these forces. Alternatively, these forces can be
calculated using the methods described by Lubinski et al. (1962) and Hammerlindl (1977, 1978) and implemented
on a spreadsheet to analyze various scenarios that characterize the load situations faced by the tubulars during the
life of the well. Finally, the mechanical action of the packer on the casing at the slips imposes local stresses on the
casing. These forces must also be accounted for during casing design.
In packer selection, consideration must be given to the behavior of the packer material if CO2 or H2S is
expected in the reservoir fluids. If alloys like K-Monel (which is resistant to hydrogen embrittlement) are used, the
possibility of galvanic corrosion at the interface of packer and casing steel must be examined.
In most completions with packers (with the exception of gas-lift wells), a packer fluid occupies the primary
annulus. The fluid is usually a brine, with low corrosive action. The density of the packer fluid is often chosen to be
such that it is “kill weight” for the expected reservoir pressure on day one. However, as the reservoir depletes, the
fluid places an additional differential pressure on the packer itself, and a collapse load on the tubing. These loads
must be considered in the selection of the packer fluid, as well as in the design of the packer and the tubing. In rare
instances, in the presence of SCP, the collapse load on the tubing could be severe, and must be checked for each
case of SCP (see section 5.5). SCP can increase the differential pressure on the packer, thus compromising the seal
integrity at the packer, and opening up an additional leak path.

I:28
5.1.5) Wellheads
Wellhead selection is generally the joint responsibility of the drilling and the production engineering teams.
Wellhead specifications are governed by API Spec 6A and procedures for basic design and selection may be found
in the works of Pearson (1987), Buzarde et al. (1972). References to advanced aspects of wellhead design and
construction are provided in the bibliography (DaMota, 1982; Britton and Henderson, 1988; McIver, 1991; Cowan,
1993). Detailed evaluation of the wellhead design procedures is beyond the scope of this document. Instead, only
issues relevant to the integrity of the casing annuli are discussed here.
The calculation of wellhead motion and forces exerted on the wellhead by the strings (especially during
production of hot gas) in platform completed wells is a crucial stage of wellhead and string design. The temperature
rise in the free standing sections of the tubulars (i.e. the sections above the mudline) causes thermal expansion.
Depending on the well conditions (i.e flow rate, reservoir temperature), the movement can be of the order of
magnitude of a few inches. In addition, thermally generated wellhead motion has the potential to generate very large
forces between the strings and the wellhead (at the hangars) and between the drive pipe and the formation at the
mudline.
Wellhead movement and forces are controlled by the steady state temperature distribution along the
different strings during production, their initial temperatures, the lengths that contribute to thermal expansion, string
stiffness, and frictional forces created due to differential motion between the conductor and formation and at steel-
cement interfaces of the inner tubulars. To a lesser order, wellhead movement is affected by pressure buildup due to
heating of fluids in uncemented annuli, well deviation, buckling of the relatively limber inner strings, and axial drag
between them. These effects are not difficult to manage if they are anticipated during the design stage. Options such
as pre-tensioning the strings, managing cement tops, tracking wellhead-tubing forces (through landing, cementing,
production, and shut-in) will ensure the integrity of the wellhead and annulus.
Though most offshore operators recognize, anticipate and design for this problem, there is no
comprehensive published literature that discusses these aspects of wellhead design. Kocian (1990) provides a
method to compute the distribution of forces at the wellhead during landing and cementing. Halal et al. (1997) and
Samuel and Gonzales (1999) discuss some of the basic modeling aspects of this problem.
In summary, the design of wellheads for critical wells- especially offshore hot gas wells (subsea as well as
platform completed) must include an evaluation of string expansion and stresses at the wellhead.

I:29
Figure 11 Tubing Manufacturing Process
5.2) Tubing Material Selection
This section highlights issues relevant to OCTG material performance properties and hence the tubular
design process. The basic processes and a typical sequence for manufacturing steel tubular goods are shown in
Figure 11. The preparation of a tubular for final use includes various finishing procedures apart from basic
shape-changing processes (i.e., heat treating, inspection, testing). The dimensions that are produced by any process
are subject to variation, and, in all cases, nondestructive inspection is necessary for controlling the process and for
assuring that the final product meets the required specifications. These nondestructive processes are defined in the
controlling API Specification 5CT. This specification defines an assortment of destructive and nondestructive tests
required for casing and tubing products to be qualified to the desired grade (Table 3 and Table 4). In addition to the
requirements defined in API 5CT, manufacturers have developed and implemented in-house testing procedures
which may sometimes exceed API 5CT requirements.

I:30
Table 3 API Spec. 5CT Test Requirements
Inspection
Grade Visual EMI UT
MPI
(Circular Field)
H-40, J-55, K-55, N-80 (N, N & T) R N N N
N-80 (Q & T), L-80, C-95 R A A A
P-110 R A A ----
C-90, T-95, Q-125 R B C B
R = Required, as specified in API 5CT Para. 9.6.
N = Not required.
A = One method or any combination of methods shall be used.
---- = Not applicable.
B = At least one method (excluding the visual method) shall be used in addition to UT to inspect
the outside surface.
C = UT shall be used to inspect the inside and outside surface.
Table 4 API Spec. 5CT Inspection Requirements
5.2.1) Inspection and Material Testing
Commercial pressures within the OCTG manufacturing community have led to the development and
application of very sophisticated process controls. These controls immediately detect processing parameters that go
astray and lead to production of tubulars outside the specified dimensional and property tolerance levels. Because of
the sophisticated nature of these process controls, properties of OCTG are strictly speaking not “random”. Instead,
tubular properties vary around fairly well controlled distributions. When tightly controlled, OCTG performance
Required for API Spec. 5CT, Group:
Test 1 2 3 4 1. Heat Analysis X X X X 2. Product Analysis X X X X 3. Tensile X X X X 4. Flattening Welded Welded Welded Welded 5. Impact - - - X 6. Hardness - L-80
C-90 T-95
- Thru - wall
7. Hydrostatic pressure X X X X 8. Height & trim of electric weld flash X X X X

I:31
properties have higher degrees of reliability. The consistency and tightness of these property distributions varies
between manufacturers, and should be well understood by the tubular designer (Payne et al. 1998). Most
manufacturers create control charts for this purpose. A typical procedure to quality control is as follows. First, the
process is examined to ascertain that it is normal (as in a Gaussian distribution) and that all assignable causes of
variation have been eliminated so that its operation is stable within the limits of chance variation. Next, a historical
record is made by plotting the mean values of a number of samples, the size, frequency, and selection of which have
been carefully predetermined after consideration of the process characteristics. These values are placed on two
charts, one for averages and one for ranges, and limits are calculated for each. If the limits used are ±3σ, where σ is
the standard deviation, not more than 0.2% of any plotted points would be expected to fall outside these lines.
Therefore, whenever a point does fall outside, the process is critically examined for an assignable cause. As the
process continues, current samples are plotted and compared with past history to ensure that the process remains in
control. In most processes, the mean is controllable by an adjustment of the process, but the range can be changed
only by finding and eliminating assignable causes.
Material testing is essential to verify properties and to document specific material performance. Material
testing is classified into non-destructive methods and destructive testing. A large number of direct tests are
destructive, for example, the yield, tensile, charpy, and collapse tests. This testing is usually a part of the
manufacturing process. Most OCTG manufacturers perform the API recommended tests (see Table 3) as part of the
manufacturing and qualification process. Further, though API 5CT does not require collapse testing to be performed,
many manufacturers can and do provide collapse data on various grades of tubulars, other than the commercially
advertised “high collapse” grades (Payne and Sathuvalli, 2000).
The final consequence of controlled manufacturing, inspection and in-plant testing is to ensure that
dimensional and material property specifications are in place. Specifications in turn guarantee product properties.
For example, consider the case of the API specified minimum internal yield pressure. Specifying 87.5% minimum
wall tolerance and no direct limit on the maximum wall thickness (other than maximum OD and drift) would
theoretically allow an eccentricity in the range of 12.5% to 15%. A detailed discussion of the impact of
manufacturing tolerances and specifications is beyond the scope of this document. Therefore we end this section
with an example that describes the role of property tolerances and statistical control on the internal pressure rating of
a tubular. Figure 12 shows a possible distribution for the wall thickness of a tubular. Assume that the distribution
can be described by a normal curve. Assuming that the yield strength and the OD of the tubular are constant at their
nominal values, we can calculate the variation in the internal pressure ratings of the tubular. Figure 13 illustrates this
variation and the importance of assuring manufacturing controls on dimensional and property variation on the
quality of tubular performance, especially in critical situations.

I:32
Figure 12 Example distribution of wall thickness
Figure 13 Variation of internal pressure ratings
5.5 in, 15.5 ppf, J-55
0
2
4
6
8
10
12
14
16
18
20
0.220
0.241
0.263
0.266
0.267
0.268
0.269
0.270
0.271
0.272
0.273
0.274
0.275
0.276
0.277
0.278
0.279
0.280
0.281
0.285
0.286
0.288
0.295
0.301
Wall thickness, in
Freq
uenc
y
0
10
20
30
40
50
60
70
80
900.263 0.268 0.273 0.278 0.283 0.288 0.293 0.298
Nominal WT 0.275 in
Minimum 0.263 inMaximum 0.301 in
Normal Distribution FitMean 0.274 inSD 0.005 inAPI Min. WT 0.241 in
Density function
0
0.0005
0.001
0.0015
0.002
0.0025
0.003
0.0035
0.004
0.0045
4000 4500 5000 5500 6000 6500
psi
Barlow
Lame
PFP
API MIYP
Nom Mean SDBarlow, psi 5500 5480 100Lame, psi 5773 5752 110PFP, psi 5940 5917 116API MIYP, psi 4813

I:33
5.3) Installation and Testing
5.3.1) Running and Handling
API RP 5C1 (1999) covers the use, transportation, storage, handling, and reconditioning of casing and
tubing. Raney and Lamb (1999) and Walstad and Crawford (1995) discuss the importance of maintaining the quality
of the equipment used in manufacturing and running. Field damage to connections during running is a leading cause
of rejected joints. Damaged connections lead to improperly made-up connections which in turn, result in leaks.
A quality system is necessary to ensure that equipment used in well construction is manufactured and
supplied according to the design requirements. A number of API specifications, Recommended Practices, Bulletins,
and ISO documents, cover the manufacture, inspection, performance properties, transportation, handling, etc., of
casing and tubing. Tubular quality control programs have been effective in improving the quality of tubing leak
resistance (Ridwan and Hull, 1984).
Various types of quality systems can be developed to ensure that the equipment used in well construction
meet some standard set of quality requirements. The quality system can be based on suppliers that are “qualified” to
deliver products of known quality. For tubular goods, this could include tube and coupling stock suppliers,
connection threaders, non-destructive testing services, and third party inspectors. The quality system must include
documentation with regard to the source of all materials, inspection requirements, etc.
Visual inspection of any tubing string regardless of grade should always be mandatory before tubing is run
in a well. Defects recognizable by visual inspection include mill defects such as seams, slugs, pits or cracks; poorly
machined threads; or shipping or handling damage to the pipe body, coupling and threads.
An alert crew can often prevent installation of pipe weakened by excessive slip or tong damage. High-
strength tubing can be more easily damaged by inadequate shipping and handling practices, or careless use of slips
and tongs. Improper use of tongs and slips is probably responsible for more critical damage than all other factors
combined. Proper handling practices are therefore absolutely essential for high-strength materials. Higher grade pipe
should be unloaded with a ginpole truck using a spreader, and nylon or webbing slings which will not scratch the
pipe. It must not be unloaded by the common practice of rolling from trucks to pipe racks. Woodsills should be
placed between the pipe rack and first row of pipe, and between each row of pipe to minimize pipe contact. Pipe
should be racked in a stairstep fashion away from the catwalk so that pipe from the top row never falls more than
one pipe diameter as it is rolled to the pipe rack. Appendix F describes an example set of guidelines for running
tubing. These guidelines have been excerpted from the monograph by Allen and Roberts (1989). These procedures
should be supplemented by appropriate connection make up procedures for the same reason when using higher
strength pipe.
The most critical part of running and handling that impacts the integrity of the primary annulus is the make-
up of connections. As briefly discussed in the section on connections, strict adherence to recommended make-up
practice is critical to achieving the highest possible leak resistance for a given connection. API threads have
recommended make-up practices, which have been strengthened by the development of proprietary make-up
techniques such as torque-turn and torque-position control. These methods essentially argue that a connection, in

I:34
order to achieve adequate leak resistance, should exhibit a certain torque when a certain number of turns are
completed, or a certain relative position is achieved between the box and pin ends. Failure to do so would indicate a
bad connection. API threads are also given different platings to allow higher torques and higher leak resistance.
Several proprietary (or “premium”) connections are also available, each of which has a published rating,
limits, and make up procedures. The make-up procedures must be strictly followed. In some cases, qualified
personnel from the manufactures assist in proper make-up, thus improving the chances that a given connection
realizes the highest leak resistance it can.
Use of thread compounds (dope) is common for all types of connections. Several different dope types are
available. As is well known, the dope also serves the function of creating a leak path barrier in the connection, thus
assisting in maintaining the integrity of the annulus. Therefore, care must be exercised in the application of dope.
Simple precautions such as maintaining the threads in a clean condition, and ensuring that no debris is trapped with
the dope go a long way in improving the leak resistance of a made-up connection.
5.3.2) Testing
Tubing and casing are also subjected to in-field and post-assembly testing to ensure adequate performance.
A number of different test methods have been used in the industry to pressure test tubulars and connections. These
include internal and external pressure, testing with different fluids, i.e., water and gas, testing while running, testing
after running, etc. The test procedure consists of applying a pressure load on the connection or tubular and waiting a
short period of time to see if the pressure bleeds off a detectable amount. The test time period is usually seconds or
minutes. Other procedures use a detector to “sniff” for the test gas that has leaked through the connection being
tested.
At a minimum, a hydrostatic test of the as-assembled structure (casing run and cemented, tubing run and
installed) is conducted, based on a maximum anticipated load. Although each individual component is already
tested to assure strength (for instance, API monogrammed pipe must successfully pass the API 5CT requirements), it
is very common for the user to seek an added measure of security and that the as-assembled structure is at least
capable of handling some estimate of maximum load. In this respect, pressure tests in well construction are different
from tests in all other engineered structures. In other structures, tests are based on strength, and are almost always
designed to verify claimed or assumed strength. The role of assuring performance is taken up by the design process
and the QA/QC process. Thus, although the implicit aim is to ensure the assembled tubing or casing has the
assumed strength, tests are administered based on a maximum load estimate. A thorough discussion of a rational
basis for testing is beyond the scope of this document, as modern structural testing practice invariably involves the
use of reliability theory. It is understood, however, that the primary purpose of the test is to verify the ability of the
assembly of the structure to withstand an arbitrary load, and to give the user a degree of confidence in the ability of
the fully-assembled structure to continue doing so during service life. Given this, the selection of a pressure test
value can be based on a number of parameters. These include:
1. Maximum anticipated surface pressure (MASP). This is based on the highest load expected during the service life of the string. It is also the most arbitrary since it depends on the accuracy of the designer’s ability to predict load magnitudes.

I:35
2. Pipe body minimum internal yield pressure (MIYP) times some factor of safety. This is a strength based value based on the tubular expected strength and is somewhat less arbitrary that Item 1.
3. Some statistical analysis of the probability of the load occurring, the magnitude of the load and the confidence level required such that the test value would exceed the load if it occurs. This requires the designer to have a sufficient amount of field data to be able to statistically determine a test value that will ensure that the load will not exceed the test value at a predetermined confidence level.
Most test pressure values are based on Items 1 or 2 since they are relatively easy to determine. The designer
should try to determine test pressure values on a consistent basis and have an understanding of the purpose of the
pressure test.
The main point to note here is that regardless of motivation, a hydrostatic test is imposed on tubing and
casing in almost all wells. It should also be noted that such tests only assess the burst capacity of the structure, and
collapse capacity is rarely tested. Thus, assurance of collapse performance is assumed, based on the design process
and burst performance during the test.
Since hydrostatic tests are imposed using a column of liquid in the tubing or casing, they are of necessity
incapable of testing the structure for the in-situ load which originally motivated the test (for example, casing is
tested based on a kick load, or a maximum anticipated surface pressure. However, a liquid column can never
recreate the load condition imposed by the kick). Moreover, since test pressures are typically held for time periods
that are much less than time periods required to guarantee absence of leaks, they are incapable of testing for small
leaks. Most small leaks are time dependent and require long periods of time (days to months) to pass before they are
noticed. Finally, such tests are also placed on the tubular before the connections and other sealing elements undergo
the unavoidable cycling of loads during the life of the well, they cannot test the capacity of the structure for the time
when the capacity is demanded by the load condition. Despite these shortcomings, pressure testing is useful for
finding gross leaks in connections and pipe bodies. Steps can be taken to locate and replace defective equipment
before the well is placed on production.
Pressure testing casing strings after the cement has set can cause the bond between the cement sheath and
the casing to fail, resulting in a micro-annulus leak path (Goodwin and Crook, 1984). The leak path created can
result in SCP. Subsequent pressure testing should only be done in situations where it is absolutely necessary, due to
the risk of causing the cement to fail, creating a leak path. The recommended procedure to test casing is therefore to
apply the pressure test immediately after bumping the plug and then bleeding the pressure to zero, assuming the
floats are holding.
In some cases where a high level of assurance of gas tight seals is desired (such as in high temperature,
high pressure, high rate gas wells), additional tests are conducted on each connection as the tubing (or casing) is run.
These include both internal and external tests, and several alternatives are available to conduct these tests. In some
cases, the connection can be subjected to an axial load while testing is in progress. While these tests do provide an
additional level of assurance as to the leak resistance capability of connections under both burst and collapse, they
too share several of the features discussed above (small time period, inability to recreate in-situ or post-cycling
conditions). An additional consideration for external testing is the hoop stress that is applied to the pin end of the

I:36
connection during the test. The pin end hoop stress of a highly torqued connection can be close to the yield strength
of the material. The additional stress from the pressure test can yield the pin end, causing a loss in bearing pressure
and a loss of leak resistance.
From a point of view of best practice, at a minimum, a properly designed hydrostatic test should be an
integral part of well construction. Coupled with proper running, handling and make-up, this gives satisfactory
assurance that the tubular has a high probability of providing leak-resistant performance through its service life.
This in turn gives the designer reasonable assurance that the annulus is unlikely to see pressure, and that if it does,
the surrounding tubulars are strong enough to allow such pressure to be managed properly to avoid dangerous
consequences.
5.4) Diagnostics
This section examines the notion of “annular” or “casing pressure” rating and it seeks to establish a causal
relationship with the basis of well design and eventually develop diagnostic and remedial guidelines. The SCP
problem immediately poses the following questions:
1. When does annular pressure threaten the safety of the well and the environment? Alternatively, what magnitude of pressure on a casing should set off the alarm for action?
2. What is the appropriate remedial action necessary to eliminate or mitigate the problem?
The first of these two questions obliquely states that all casing pressure is not necessarily deleterious to the
health of the well. In fact, thermally induced annular pressure, when properly accounted for is inevitable in the life
cycle of the well. The mere presence of annular pressure in a well does not signify the existence of a serious
mechanical problem that requires a drastic workover. Also, implicit in the question is the notion of the “capacity of
an annulus” or the pressure that an annulus can sustain without breach. This question is linked to the basis of design
discussed earlier. As pointed out before, a designer chooses the casing strings and completion equipment and the
annulus is a consequence.
5.4.1) Behavior of Annular Pressure
The capacity of an annulus is akin to the notion of a “rating”. It is not a magical number above which
dreadful things start happening immediately. Instead it is viewed as a number that defines the perimeter of a working
envelope, and that when exceeded should start an investigation. As Figure 1 demonstrates, the capacity of the
annulus is the capacity of its weakest link. In the case of the primary annulus, it is the lesser of the tubing collapse or
casing burst3, assuming that the wellheads, packers and other completion equipment are adequately rated. Similarly,
in the case of the Type III annulus, where the bottom of the annulus is exposed to the formation, annular capacity is
breached if the pressure exceeds either the burst or collapse of the bounding casing strings, or the fracture pressure
at the shoe of the shallower string. From the above it is clear that:
• annular capacity is not determined by a universal formula or algorithm;
3 For the sake of argument, assume tension effects are also included.

I:37
• it is well and annulus-specific and it is a function of the design basis;
• the capacity is determined by a close examination of the performance envelopes of the individual components that comprise the annulus and (very importantly) by using certain worst case assumptions about possible loading scenarios.
Consider an annulus filled with a fluid (either an incompressible liquid or a mixture of gas and liquid). The
pressure in the annulus depends on the state of the fluid, i.e. its density and temperature. The change in annulus
pressure can be wrought by one or all of the following:
1. a change in the volume of the annulus due to change in its physical dimensions;
2. a mass influx or efflux from the annulus volume;
3. a change in the temperature of the fluid.
The change in the volume of the annulus can be caused by thermal expansion (heating of the strings
bounding the annulus) or a change of pressure inside and outside or axial expansion of the tubing strings. In the
absence of the constraining annulus there would be no pressure increase due to effects # 2 and 3. Therefore, it is
reasonable to state that:
( )ann
ann.llooningthermal/ba
fluidfluxinflux/out
fluidexp. therm.
VVVV
pann Δ
Δ−Δ+Δ∝Δ
(2)
where Δdenotes a change and V and P denote volume and pressure respectively (with the subscripts and superscripts
being self-explanatory). The right hand side (RHS) of the above expression is essentially a volumetric strain (since
the denominator denotes the original volume of the annulus) and it can be considered as a “Hooke’s law” for fluids
if the proportionality is linear with the state of the fluid. The constant of proportionality in Eq. (2) depends on the
isothermal and isobaric bulk moduli of the fluid. The changes in the volume can be related to the pressure and
temperature changes in the annuli, so that the above expression eventually results in a set of equations which relates
the unknown pressures in the annuli to changes of state in the fluid and the strings and the bulk moduli of the fluid.
This is the approach used by every APB model. The difference arises in the methods used to calculate individual
volume changes which depend on the behavior of pressurized cylinders. The end result is a set of simultaneous
equations of varying degree of algebraic complexity. When APB models are a part of integrated casing design and
thermal simulator suites, it is not difficult to incorporate a detailed model as described by for example, Adams
(1991).
Irrespective of the mathematical details, the pressure changes in the annuli are most sensitive to thermal
coefficients of volumetric expansion of the fluid and to the fluid bulk moduli. This fact generates the following
considerations. Firstly, the mud in the annuli contain solids which occupy a fraction of the annular volume that
cannot be compressed (unlike the fluid). Effectively, the available volume in the annulus equals the annular volume
minus the volume of solids present in the fluid. Thus neglecting the content of solids in the annular fluids will
underestimate the increase in pressure. Secondly, the coefficient of volumetric expansion is a function of the
temperature for gases. For liquids it is a weak function (White, 1991)4 of temperature. Thirdly, to the best of the
4 The effect of thermophysical property variation on the thermal behavior of drilling patterns has been discussed by Fontenot and Clark (1974) and more recently by Zamora (1997). These studies imply that the range of pressure and

I:38
authors’ knowledge, there are no models that consider the effect of fluid influx or efflux in to the annulus. Oudeman
and Bacarreza (1995) consider this effect in an experimental study of APB in an HPHT well. They consider the
change of APB due to fracture at the base of an uncemented annulus in a HPHT well and interpret field data on
annular pressure measurements. Ability to model this effect is an important step in the understanding of SCP. A few
pointers and simplistic notions (which must be refined) to model this effect are described in Appendix C.
0
0.2
0.4
0.6
0.8
1
1.2
1.4
0 5 10 15 20 25
Time
Ann
ular
Pre
ssur
e
Well comes on lineNo annular pressure start up
Bleed off pressure
Bleed off initatedThermal Steady State- Wellhead is at WHFT
Well shut in
Thermal Steady State- Wellhead is at WHFT
Temporary rise in annular pressure due to shut in
Temporary rise in annular pressure due to shut in
Welllbore reaches thermal equlibrium.Pressure on annulus drops to a residual value
Annulus Rating based on design
Figure 14 Annular Pressure Trends
However, in the present instance it is useful to understand the behavior of annular pressures during the well
operation. Consider Figure 14. The figure shows a possible trend for the pressure in the primary annulus of an
offshore well. Let us assume that the dotted red line represents a pre-set pressure at which the annulus is to be bled
off. It could represent the API MIYP of the casing or the API rating for pipe body collapse for the tubing or a
number such as the MMS defined 20% of the MIYP of the casing. Let the solid brown line represent the pressure
that would cause breach of the annulus. This number can be rationally calculated from the basis of design for the
well (as explained in the earlier sections). When the well is set on production, the fluid in the annulus heats up and
temperature in deep HPHT wells are wide enough for property variations to be accounted for. In the case of annulus pressure, the change in temperature from geostatic to wellhead flowing temperature in a high gas rate well could be large enough to examine the effect of variation of coefficient of volumetric thermal expansion.

I:39
the pressure slowly builds to a value that can be calculated. The well eventually reaches a thermal steady state5 thus
increasing the pressure in the annulus. Assume that the pressure is allowed to go past the dotted red line and reach a
steady value. At this point, if the well is shut in for any reason, the annular pressure rises (by a small amount which
is estimated in section B.4 of Appendix B) to account for the increased ballooning of the tubing. However, the well
starts cooling down again (typically it takes about the same amount of time to cool down as to heat up) and reaches
the geostatic temperature. The pressure in the annulus falls in response and reaches a residual value due to the
ballooning in the tubing. Ideally, none of these pressures can or should compromise the annular integrity if due
consideration is given to all the aspects of the design. If on the other hand, the annulus is bled off when the pressure
exceeds the value represented by the dotted red line, the trend is depicted by the solid blue line for the same set of
reasons discussed before.
Such trend curves can be plotted for all the annuli and kept on hand. Most programs for detection of
problems in wells include regular monitoring of annular pressures6. Any abrupt pressure changes immediately
trigger an investigation into their cause. This is the first step in the diagnosis and management of SCP. Finally, it
must be noted that curves such as those shown in Figure 14 can be generated before the well comes on line and used
as a basis to check for annular integrity. These curves can be generated by using computer based casing design
programs, wellbore thermal simulators, and methods of analysis for pressure build up (analogous to those described
in the Appendices to this document).
Once the annular pressure limits for the safe operation are established, criteria for the unsafe operation must
be established. Examination of Figure 14 shows that the following criteria are potential trigger points for an
investigation:
1. unexplained reduction in the wellhead flowing pressure (and rate)
2. an increase in pressures in any of the annular pressures under normal operating conditions (production, shut-in, start-up);
3. a sudden decrease in the annular pressure preceded by a gradual or sudden increase;
4. communication between annular pressures, when the pressures in different annuli follow each other;
5. inability to bleed off the annular pressure, i.e. the pressure does not decrease with continued bleeding or recurs soon after the bleed valve is closed.
In short, any continued unexplained change of pressure in tubing or the annuli is cause for investigation.
Figure 15 shows an example decision tree for procedures needed to decide if SCP diagnosis and remediation should
be initiated. This chart is based on a decision tree used by Amoco to diagnose and control SCP problems in wells in
the Hutton field of North Sea (Attard, 1991).
5 The time taken to reach steady state can vary from a few hours to a few days depending on the nature of the well. In high rate hot gas wells, thermal steady state is reached in a few hours. The time can be estimated using wellbore thermal simulators or the methods outlined by Ramey(1962). 6 This is analogous to plotting curves showing the anticipated hook load while tripping in or out of the borehole with the drill string while drilling.

I:40
Monitor annular pressure per predetermined program
Are pressureswithin limits?
YES
NO
Is well flowing normally?Accidental shut in, change in
flowrate, etc?
YES
Check gages- stillpressure exceeded?
NO YESWellhead sealsokay? Re-energize sealswhere possible.
Pressure exceeded?
No
Bleed off pressure, Monitorreturns and examinepressure build up
YES
Does the change in wellflow conditions explainpressure increase and/or suggest control
method?
YESNO
Are therehydrocarbons in the
bleed fluids?
YES
NO
YESNO
YESNO
Can the pressure increasebe explained by bleed off
analysis?
Is safetycompromised?
Inform MMS and ProductionEngineering Team. Plan andimplement diagnostic procedure andremedial action
Is the annuluspressure manageable?
YES
NO
Figure 15 Example decision tree to initiate SCP troubleshooting
5.4.2) Problem isolation
For SCP to occur two self-evident conditions must be satisfied. Firstly, there should exist a leak path and
secondly a pressure gradient is needed to activate the leak. The diagnostic process consists of identifying these two
factors by using well geometry and methods commonly used in production logging analyses. In all cases the
underlying strategy rests on obtaining baseline results with the well in static and thermal equilibrium and then
altering conditions to induce temperature or pressure transients and analyzing them. An example of the baseline set
of conditions could include pressure profiles of the type shown in Figure 14 and temperature profiles across the
wellbore, etc.
Consider the case of the primary annulus. Pressure in the primary annulus is caused either due to a leak,
failure of cement or thermal effects. Figure 16 and Figure 17 illustrate a possible a troubleshooting sequence for a
leak in the tubing. Similar procedures must be developed to diagnose SCP problems in other annuli. These
procedures are based on production logging techniques that are routinely used to diagnose problems in producing
wells. In summary, the diagnostic process relies on the following:
• a well planned monitoring procedure that is commensurate with the well condition and the risk associated with a potential SCP situation. For example, very frequent monitoring may not be necessary in a well that is nearing depletion if it has had no history of SCP occurrence.
• Ability to verify stable operating conditions and respond to changes in conditions, as discussed in the preceding sections.

I:41
Pressure in primary annulus
Thermal APB
Cement failure
Component Leak
Causes of primary annulus pressure
Monitor primary annulus
IsSCP diagnosed for
the annulus?NO
Is pressure thermalAPB?
Implement standard procedure.
NO
YES
Implement leak detectionprocess.
(Potential leak points inFigure 2)
Figure 16 Diagnosis of the primary annulus

I:42
Figure 17 A possible tubing leak detection algorithm
Component Leak
Shut in well
Pressure equalization/communication in tubing
& annulus?
Leak on casing side orcement related. Useseparate flow chart.
YES
NO
Establish or bound depth ofleak and leak rate
Sound the annulus (leak isat or below liquid level)
Pressure bleed off and buildup data (high leak rates are shallowand vice versa)
NO
YESIs leak verydeep?
Run diagnostic logs
Run packer leak test.
Diagnostic Logs Temperature logs (Localized Joule Thomson cooling near leak spot) Noise Log Spinner Logs CCL logs
Packer test Set plug in tubing tailbelow packer Pump fluid through annulus If fluid recovered on tbg.side, packer failure isruled out
Wellhead sealsleaking?
Re-energize seals.YES

I:43
5.5) What do current MMS regulations mean?
The MMS regulations for SCP are currently described by 30 CFR 250.517. Strictly speaking, these
regulations require the operator to report any observed SCP immediately to the MMS. However, departures from
these regulations can be obtained, if the observed SCP
1. is less than 20% of the minimum internal yield pressure (MIYP) and
2. the pressure will bleed down to zero if bled through a ½ in. needle valve in 24 hours or less.
If both of these conditions are satisfied, departure is automatic (and is known as a “self-departure’). If
either of these conditions does not hold, the operator is expected to inform MMS and repair the well.
To the best of our knowledge, the sources or engineering bases for these criteria have not been noted in the
MMS documents that were available to us. Therefore, this section examines the implications of these current
regulations in the light of the design guidelines discussed until now.
Consider the first of these guidelines. As an example consider a production annulus formed by 4.5 in., 11.6
ppf, L-80 production tubing and 7 in., 23 ppf, J-55 production casing set at 10,000 ft. Assume the annulus is filled
with 8.4 ppg completion brine. Since the API MIYP of the production casing in this instance is 4,360 psi, SCP of
20% MIYP implies a pressure of 872 psi acting on a column of 10,000 ft of brine. This translates to an external
pressure of 5,240 psi on the tubing at packer depth, and is well within the API collapse rating of the tubing, which in
this case is 6,340 psi. Considering that the tubing is typically in compression (tensile load would reduce the collapse
rating of the tubular) near the packer, collapse of the tubing would not be an issue. In fact the collapse safety factor
here is at least 1.2. Now consider an annulus with the same tubing, but an annulus with a 7 in. liner and 9-5/8 in.,
53.5 ppf, J-55 tieback. Also, assume that the packer fluid is 10 ppg kill weight mud (for a reservoir with an initial
BHP of 5,000 psi) and that the packer is set at 10,000 ft between the tubing and the liner. The MIYP for the 9-5/8 in.
tieback is 7,927 psi. Therefore, SCP of 20% MIYP equals a surface pressure of 1,585 psi. This pressure acting on
the top of the packer fluid creates an external pressure of 6,785 psi on the tubing at the packer depth. This pressure
just exceeds the API collapse rating of the tubing, i.e. 6,340 psi7. However, if the tubing and the casing have been
designed for a shut-in tubing leak at surface, this load would not pose a problem, since the tubing would have been
designed to withstand a collapse load in the event of tubing evacuation (in which case the external pressure at packer
depth would be 5,200 psi). It appears that the MMS guideline on the maximum permissible SCP at the surface seems
to have been chosen such the pressure on the tubing at the packer could be in the neighborhood of its API collapse
rating. Deeper wells would strengthen this line of reasoning. However, this in itself could not lead to a catastrophe
since in most cases, the tubing would have its full collapse rating (i.e. not mitigated by tension) and be bolstered by
internal pressure in the event of such a leak. If the design procedures for tubing and casing account for a hot shut-in
7 This pressure would threaten the tubing only if the internal pressure in the tubing is very small. It is extremely unlikely to have such low internal pressures inside the tubing when there is a tubing leak. This unlikely scenario could threaten the tubing if a leak into the annulus from the casing side occurred and the perforations were plugged simultaneously!

I:44
tubing leak at surface, the annulus should be able to sustain an SCP of 20% MIYP with adequate safety margins.
Nevertheless, using this pressure as a trigger to initiate diagnostic and investigative procedures seems appropriate.
Consider the bleed-off criterion next. Figure 18 shows the primary annulus with a tubing side leak being
bled off. Assume that this is a gas well and that the annulus is full of gas due to a tubing leak8. We wish to determine
the time taken to bleed the annulus to atmospheric pressure via the bleed valve shown. If pt, p, and patm. denote the
pressure in the tubing, the annulus and the atmosphere respectively, the time t(pf) taken for the pressure in the
annulus to fall from an initial pressure pi to a final pressure pf ( ≥ patm) is shown in Appendix E to be given by
( )( ) ( )∫
=
≥≥−−−
=atm
f
atm
i
pp
ppp
atmt
tn
af ppp
ppppppd
RTAVpt ,
12 β (3)
where Va is the volume of the gas in the annulus, R is the gas constant and T is the average temperature of the gas. β
is the ratio of the flow area of the leak to the flow area of the nozzle, tp and p represent the ratio of the tubing
pressure and the annular pressure to the atmospheric pressure respectively. The model derived in Appendix C
assumes that the gas obeys the perfect gas law, and neglects the effect of temperature variations across the length of
the annulus. Further, it assumes that the influx from the tubing to the annulus and the efflux from the annulus to the
atmosphere is of the Bernoulli9 type. These effects can be added to the basic model described in Appendix C. While
Equation (3) can be integrated analytically, its solution is cumbersome. It is best to integrate the above expression
numerically (as was done in this study by using 32 point Gaussian quadrature in an EXCEL spreadsheet). When β is
set to zero, the situation represents the bleeding of a closed annulus without influx, and the time required to bleed
from an initial pressure, pi to atmospheric pressure reduces to
⎥⎥⎦
⎤
⎢⎢⎣
⎡−−= 1ln2)(
atm
i
atm
i
n
aatm p
ppp
RTAV
pt (4)
The time taken for a 7000 ft column of methane gas at an average temperature of 100o F to bleed off from
an initial pressure of 1,000 psi to atmospheric pressure (14 psi) is shown in Figure 19. The x-axis in the figure shows
the ratio of the flow area of the leak and the nozzle. The tubing pressure is assumed to be equal to the annulus
pressure at the time the bleed valve is opened, which would presumably be the case, since a tubing leak would
equalize pressures in the two volumes. The figure shows that the bleed off time is of the order of half an hour till the
leak size reaches a critical fraction of the nozzle size (i.e. 3.7%). When the leak flow area increases beyond this size,
the curve indicates that the annulus can never be bled off to atmospheric pressure. This can be expected since the
influx at these leak sizes is too much to be bled off. The drastic increase in the bleed off time occurs in the
neighborhood of 3.67% for other comparable conditions (and the reader is urged to verify this using the equations
8 There are three special cases of annular bleeding- gas bleed off , liquid bleed off and liquid-gas bleed off. The case of a pure liquid bleed off is relevant to thermally induced APB. The bleed off times are very small (~tens of seconds) as calculated in Appendix C. Gas takes longer to bleed off. Bleeding off liquid and gas is a more complicated problem that is beyond the scope of the present document. 9 Bernoulli type flows assume the gas is inviscid, and incompressible and the flow is isentropic and isothermal. Each of these assumptions can be justified for nozzle flows (see White, 1986, pp. 356) and flows from large reservoirs to large sinks.

I:45
and solutions provided in Appendix C). This suggests that any casing pressure that cannot be bled off in twenty four
hours indicates a fluid influx. The converse however is not true, since a pressure that can be bled off can still be due
to a very small influx, as suggested by the horizontal section of the curve in Figure 19. A large bleed time,
nevertheless, indicates a leak that could be a significant fraction of the bleed nozzle area. This regulation thus
ensures that the influx volumes responsible for SCP are manageable (since they can be bled off in a short period of
time). Another implication stems from the consideration of a leak due to a connection failure. Since connection leak
paths are tortuous, they result in a massive pressure drop across the leak path. As a result, the volume influx rate
may not be very high (Bollfrass, 1985). However, the ingress of fluids over a sustained period of time will be
significant enough so that bleeding takes a very long period of time. In reality, estimates of actual bleed off times
should account for these effects, i.e. the pressure drops across the leak path and the nozzle, the effect of viscous
dissipation at the nozzle, thermal effects and the effect of gas leaking into the liquid in the annulus. As a result, the
bleed off times are likely to be higher than those estimated in this document. The calculations shown here, however
illustrate the physics of the problem and the spirit of the MMS bleed off time regulation very well.
The above analysis leads to two corollaries. Firstly, the bleed off signature (i.e. pressure versus time)
provides very important information about the magnitude of the leak. The analysis of this profile (in conjunction
with the pressure build up curve) by using a suitable model will help diagnose the magnitude of the SCP problem
and isolate it (akin to a DST). Secondly, it may be impossible to bleed the pressure off to a zero value (as required
by the MMS) due to the reasons discussed above. Also, recall from the discussion in section 5.4.1 and Figure 14 that
there is a non-zero residual casing pressure, even when the well cools down and it is shut in. More importantly,
considerations similar to those discussed in the thermal APB modeling (Appendix B) indicate that bleeding to zero
pressure is not necessarily a solution. For example, bleeding the primary annulus could render the production casing
susceptible to collapse by pressure in the intermediate annulus. Therefore, based on APB type modeling, the time
required to bleed off the pressure in a given annulus to a sustainable value may have to be calculated. The inclusion
of these details and the development of a more appropriate model though necessary, is beyond the scope of the
present document.
In summary, the MMS regulations appear to have been conceived to minimize the impact of SCP. The 20%
MIYP rule sets a limit on the manageable pressure while the 24 hour bleed off time rule sets a limit on the volume of
influx. Together, it would appear that they set a qualitative tolerance level for an annular leak. Therefore, instances
of casing pressure where these regulations are not satisfied should seek a departure. The departure application must
implicitly be based on the design basis and a risk assessment of the possible breach in the annulus to the integrity of
the well. Since SCP appears to be very likely in the life of the well, leak tolerance levels for the various components
(connections, packer seals, wellheads, etc.) must be determined based on a risk assessment type approach. These
tolerance levels can then be translated to regulations about the allowable SCP and how to react when the thresholds
are exceeded.

I:46
Figure 18 Bleeding Pressure from the annulus
Tubing
Annulus
Atmosphere
Tubing leak
Wellbore Axis
Bleed valve
tp ( )tp
.atmp

I:47
Figure 19 Bleed time as a function of leak size- an example
0
5
10
15
20
25
30
35
40
0 0.5 1 1.5 2 2.5 3 3.5 4
Ratio of leak area to nozzle area, %
Tim
e to
ble
ed to
atm
osph
eric
pre
ssur
e, h
rs
Name of gas MethaneMoelcular weight 16.04ID of annulus 4.5 inOD of annulus 6.366 inLength of gas column 7000 ftTemperature of gas 100 oFInitial pressure of gas in annulus 1000 psiInitial pressure of gas in tubing 1000 psiTemperature of gas (in tubing and annulus) 100 oFDiameter of nozzle 0.5 in
Critical leak size

I:48
5.6) Well Integrity Assessment
For the most part, the discussion so far has considered the issue of how to mitigate the SCP problem in
future wells. This leaves open the question of the potential risk of SCP occurrence in existing wells in the GOM. As
the LSU study (Bourgoyne et. al., 1999) demonstrates, several existing wells exhibit SCP in the Gulf of Mexico. It
would be highly desirable to develop a logic to assess, for each of these incidences of SCP, whether the level of SCP
is manageable, poses no serious threat to personnel and environment, and is unlikely to worsen in time. For
instance, it is apparent from the LSU study that in most cases, the SCP incidences in the GOM are manageable and
pose little threat for uncontrollable and disastrous consequences. However, establishing this intuitive conclusion
requires proper risk assessment, which uses techniques from the disciplines of QRA and Hazop Analysis. Although
this is beyond the scope of the current work, we note here a few guidelines with the caveat that a detailed study
justly deserves the resources of a separate project.
The chief goal here is to determine the risk of SCP occurrence in a well, given certain conditions, and the
risk of danger to environment and personnel from the SCP occurrence. First, this depends upon the type of well and
the stage in its life cycle. Subsea wells or wells under extreme conditions of temperature, pressure and rate must be
treated differently from say, low pressure, low rate land wells far from human habitation. Likewise, gas wells pose
greater threat under SCP conditions than oil wells.
Several other factors must be considered in risk assessment. Clearly, the design basis used in the design of
the tubulars is a major factor in assessing the risk of SCP in a given well. The history of the field and the well are
also major factors. For example, there may be other wells in the field that are experiencing SCP. The well may have
been producing for a few years, and perhaps production logs indicate increasing levels of water due to coning in
addition to CO2 or other corrosive agents. Connection failures may have been reported on some neighboring wells.
Also, there may have been a workover on an upper producing zone, so on and so forth. Given these circumstances,
the goal is to determine the possibility of SCP occurrence and be able to respond to changing well conditions in a
timely manner.
The first step in this exercise is an in-depth analysis of all cases of SCP relevant to the well in question.
These analyses will identify factors which caused the problem and also explain situations when “assumed”
conditions about loads or component performance did not hold true. The next major step would be to create a flow
chart that would integrate the relevant well characteristics into a risk matrix or flow chart. The list should include
factors such as the age of well, basis of design, well construction logs (cement logs, stimulation logs etc.), casing
and tubular specifications, mud and cement programs, nature of produced fluids, corrosion potential of tubulars
(metallurgy) and fluids, nature and proximity of other wells, etc. Using QRA principles, the risk of SCP for the
well can be quantified based on these factors.
With this approach, it is possible to assess the risk of occurrence of SCP for a given well at a given time in
its life cycle. The typical output of this approach is a probability of occurrence of SCP as a function of time. The
implicit assumption here is that there is always a non-zero probability of occurrence of SCP in any well, which may
increase with time, and in response to the different factors discussed above.

I:49
Once an SCP event occurs, we seek an assessment of the risk to personnel and environment from that SCP
event. At this point, diagnostics and monitoring become paramount. Since one of the first diagnostic steps taken is
the bleed off test required by MMS, the results from this test give important clues as to the risk from the SCP event.
It has been argued in section 5.5 above that the bleed off signature, together with the build-up signature and annular
response models can be used to obtain a sound idea of the risk from the SCP incidence being diagnosed. Models
such as the ones discussed in section 5.5 above can be refined and improved to assist in this. In addition to the
bleed-off, other diagnostic tests can be conducted to better understand the source of the SCP problem. The
diagnostic results, together with the history and other factors discussed earlier in this section, can be used to assess
the likely progression of the SCP incident. Once again, the design basis is a key factor. Using the results of this
assessment, an SCP management procedure can be developed, be it a combination of diagnostics, bleed off and
monitoring, or a complete workover. One advantage of this approach is the costs and risks can be tied, thus
allowing rational decisions to be made.
The above assessment, which once again utilizes the techniques of QRA and HazOp analysis, is very
important when analyzing an existing SCP incident.
As mentioned at the beginning of this section, however, a rigorous development of risk assessment is
beyond the scope of this document. It is strongly recommended that the development of a risk assessment procedure
for SCP in GOM wells be undertaken as a separate (and subsequent) phase of this project.

I:50
6) Conclusions
This document is an attempt to provide an assessment of the current technology and state-of-the-art as
relevant to the problem of sustained casing pressure (SCP) in the primary tubing-casing annulus of oil and gas wells
in the Gulf of Mexico. The role of design basis in the management of SCP is discussed in great detail. Since the
annulus is a consequence of the design of the tubing, casing, packer and wellhead surrounding it, design and
selection of these components will impact the integrity and pressure capacity of the primary annulus. Current
practice and suggestions of best practices are discussed for running and handling (particularly make-up practice),
monitoring and testing. A logic of diagnostics and decision charts to aid the process of diagnosis in an SCP event
are provided. Current MMS regulations and their implicit basis and relevance to the management of SCP problems
is discussed. Simple models for annular pressure response and bleed off response have been built, and these are used
to illustrate the technical basis of the MMS regulations. Following is a summary of the key conclusions from this
document.
3. The LSU study has elevated the concern surrounding SCP incidents in the GOM. The study itself is concerned largely with statistical analysis of SCP incidence, and makes some key statistical conclusions. Unfortunately, given the nature of data gathered and analyzed, the study does not make any phenomenological conclusions or provide statistically supportable causative links between factors causing SCP and the incidence of SCP itself.
4. The most important conclusions that can be made from the LSU study are that a) there is a large incidence of SCP in GOM, and b) poor diagnosis and management of SCP can lead to disastrous conclusions.
5. Current MMS regulations are reasonable and adequate to address the problem of SCP. The 20% MIYP limit implicitly limits the collapse load on the tubing while keeping the pressure at manageable levels. The bleed off time of 24 hours is designed such that if there is a leak, the size of leak is small enough that the SCP incident is manageable even in the event of breach at surface.
6. An analysis of the physical reasoning behind these regulations reveals that the bleed off times are hyperbolic with leak size, and that at a critical leak size, it becomes nearly impossible to bleed off the annulus to atmospheric in any finite time frame. Therefore, 24 hours is not a rigid upper limit, and in general, if a leak can be bled off in times in the neighborhood of 24 hours, the size of the leak is still very small. Conversely, a leak just larger than the critical size will take much longer time than 24 hours to bleed off, and in theory, can never be bled off to atmospheric.
7. Simple models are presented for annular pressure build up and bleed off behavior. These models can be refined and used as part of diagnostics. The models can also be used to allow bleed off to pressures higher than atmospheric, should this be desirable from an operational or mechanical integrity view point.
8. Design basis should include proper tubing design to, at a minimum, a shut-in condition, a producing condition, and an abandonment (collapse load) condition. A pressure test load should also be checked in design.
9. Packer design should be based on both differential pressure and forces acting on the packer.
10. Overall design basis can be used to establish the annular pressure capacity. This includes the design of tubing, casing, packer, and wellheads; as well as materials selection, quality assurance and quality control.

I:51
11. Care must be taken in running and handling of the tubulars, particularly in make-up. In general, recommended make-up procedures must be adhered to. Common sense care while running and handling could dramatically reduce the risk of SCP occurrence.
12. A hydrostatic pressure test of casing and tubing is a minimum test requirement.
13. Diagnostic charts have been provided to assist in the diagnosis of an SCP incident.
14. In order to select a course of action in wells that exhibit SCP, in particular at a magnitude greater than MMS regulated value for “self departure”, a thorough risk assessment is required. Risk assessment is made up of two parts- risk of occurrence of SCP, and risk to personnel and environment from the SCP (i.e., risk of unmanageability), and is influenced by several factors including well type, well history and design basis.
15. A rigorous quantitative risk assessment (QRA) procedure should be developed and used to assess the existing cases of SCP in the GOM area. It is suggested that this be undertaken as part of a separate project.
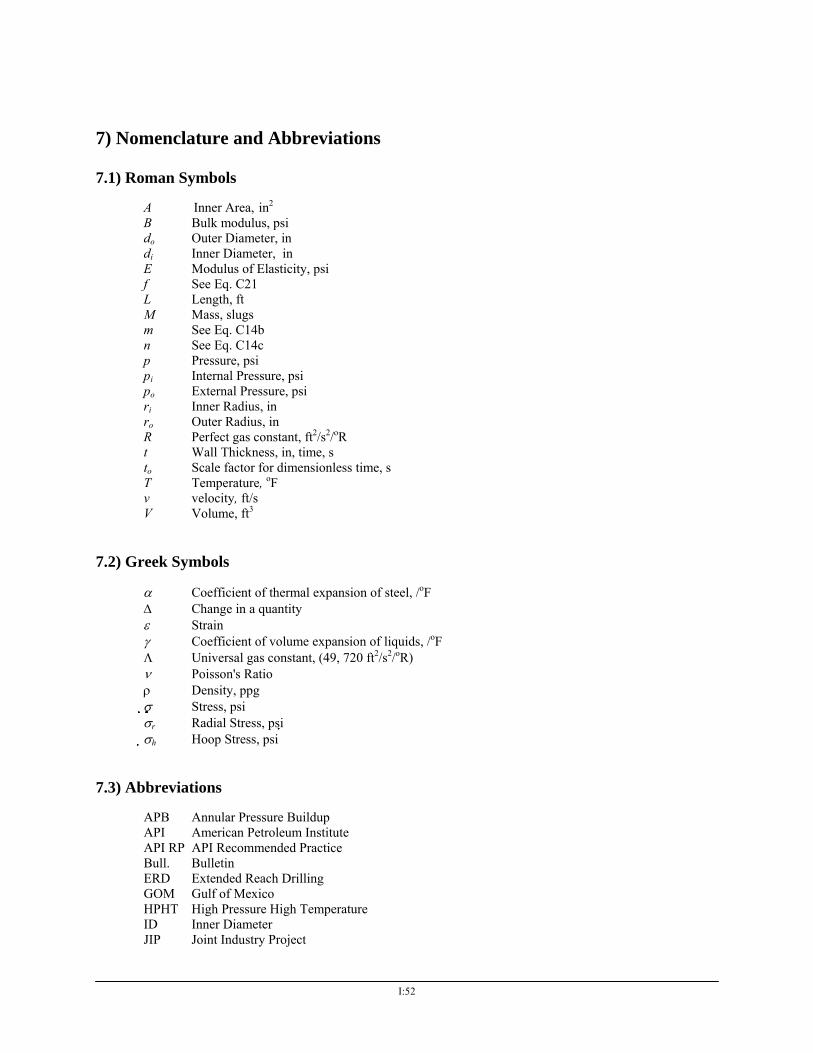
I:52
7) Nomenclature and Abbreviations
7.1) Roman Symbols
A Inner Area, in2 B Bulk modulus, psi do Outer Diameter, in di Inner Diameter, in E Modulus of Elasticity, psi f See Eq. C21 L Length, ft M Mass, slugs m See Eq. C14b n See Eq. C14c p Pressure, psi pi Internal Pressure, psi po External Pressure, psi ri Inner Radius, in ro Outer Radius, in R Perfect gas constant, ft2/s2/oR t Wall Thickness, in, time, s to Scale factor for dimensionless time, s T Temperature, oF v velocity, ft/s V Volume, ft3
7.2) Greek Symbols
α Coefficient of thermal expansion of steel, /oF Δ Change in a quantity ε Strain γ Coefficient of volume expansion of liquids, /oF Λ Universal gas constant, (49, 720 ft2/s2/oR) ν Poisson's Ratio ρ Density, ppg σ Stress, psi σr Radial Stress, psi σh Hoop Stress, psi
7.3) Abbreviations
APB Annular Pressure Buildup API American Petroleum Institute API RP API Recommended Practice Bull. Bulletin ERD Extended Reach Drilling GOM Gulf of Mexico HPHT High Pressure High Temperature ID Inner Diameter JIP Joint Industry Project

I:53
LSU Louisiana State University MIYP Minimum Internal Yield Pressure MMS Minerals Management Service OCTG Oil Country Tubular Goods OD Outer Diameter OTC Offshore Technology Conference PFP Plastic Failure Pressure QRA Quantitative Risk Analysis RBD Reliability Based Design RHS Right Hand Side SCP Sustained Casing Pressure Spec. Specification SR Supplemental requirement SCSSV Surface Controlled Sub Surface Safety Valve TR TVD True Vertical Depth VME von Mises Equivalent WSD Working Stress Design

I:54
8) References
API, 1981, Recommended practice for design and installation of offshore production platform piping system, API RP 4E, third edition, API, Dallas, TX. API RP 5C1, Care and Use of Casing and Tubing, 18th Edition, May, 1999. API Website. 18 August 2000. www.api.org/cat/pubcat.cgi Aadnoy, B. S., and Balkema, A. A., 1996, Modern Well Design, Rotterdam,The Netherlands. Adams, A. J., 1991, “How to design for annulus fluid heat-up,” SPE paper no. 22871, Presented at the 66th Annual Technical Conference and Exhibition, Dallas, TX, October 6-9. Adams, A. J., Parfitt, S. H. L., Reeves, T. B., and Thorogood, J. L., 1993, "Casing System Risk Analysis Using Structural Reliability," SPE/IADC paper no. 25693, Presented at the 1993 SPE/IADC Drilling Conference, Amsterdam, The Netherlands, Feb. 23-25. Allen, T. O., and Roberts, P. O., 1989, “Production operations: Well completions, workover and stimulation,” Vol. 1, Oil and Gas Consultants International Inc., Tulsa, OK, pp. 167-203. Anvik, H. K. and Gibson, W. R., 1987, “Drilling and workover experiences in Greater Ekofisk Area,” SPE/IADC paper no. 16510, Presented at the 1987 SPE/IADC Drilling Conference, New Orleans, LA, March 15-18. Asbill, T., 2000, Section of the Best Practices Manual addressing Connection Integrity Issues – Prepared by Stress Engineering Services. Attard, M., 1991, “The occurrence of annulus pressures in the North West Hutton Field: Problems and Solutions,” SPE paper no. 23136, Presented at the Offshore Europe Conference, Aberdeen, September 3-6. Banon, H, Johnson, D. V. and Hilbert, L. B., "Reliability Considerations in Design of Steel and CRA Production Tubing Strings," SPE paper no. 23483, Presented at the First International Conference on Health, Safety and Environment, Hague, The Netherlands, Nov. 10-14. Bollfrass, C. A., 1985, “Sealing tubular connections,” J. Pet. Tech., June 1985, pp. 955-965. Brand, P. R., Whitney, W. S., and Lewis, D. B., "Load and Resistance Factor Design Case Histories," OTC paper no. 7937. Britton, J. S. and Henderson, G., 1988, “Improving wellhead performance with programmed cement shortfall,:” SPE paper no. 16617, SPEDE. Bruno, M. S., 1990, “Subsidence-induced well failure,” SPE paper 22058, Presented at the 60th California Regional Meeting, Ventura, CA, April 4-6. Bourgoyne Jr., A. T., Scott, S. L., and Manowski, W., 1999a, “A review of sustained casing pressure occurring on the OCS,” Report Submitted to Minerals Management Service, Downloadable from MMS website ftp://www.mms.gov/TubingStudy/. Bourgoyne Jr., A. T., Scott, S. L., and Regg, J. B. 1999b, “Sustained Casing Pressure in Offshore Producing wells,” OTC paper no. 11029, Presented at the 1999 Offshore Technology Conference, Houston, TX, May 3-6.

I:55
Bourgoyne Jr., A. T., Millheim, K. K., Chenevert, M. E., Young, F. S., 1991, Applied Drilling Engineering, Second Printing, Society of Petroleum Engineers, Richardson, TX, pp. 292-294. Buzarde Jr., L. E., Kastor, R. L., Bell, W. T., and DePriester, C. L., 1972, “Production Operations Course I: Well Completions,” Society of Petroleum Engineers, Dallas TX., pp. 66-108. Corre, B., Eymard, E., and Guenot, A., 1984, “Numerical computation of temperature distribution in a wellbore while drilling,” SPE paper no. 13208, Presented at the 59th Annual technical Conference and Exhibition, Houston, TX, September 16-19. Cowan, W. S., 1993, “Independent load support in an 18 3/4-in., 15,000 psi subsea wellhead,” SPE paper no. 23116, Presented at the Latin American Petroleum Engineering Conference, Rio de Janeiro, October 14-19. Craft, B.C., Holden, W.R., and Graves Jr., E.D., 1962, Well Design: Drilling and Production, Prentice-Hall, Inc., Englewood Cliffs, New Jersey. Crusco, J., 1981, “Stress analysis aids selection of casing and tubing for sour gas environment,” Oil and gas Journal, October 26, pp. 127-138. DaMota, A. C., 1982, “Mathematical Modeling of 15-meter subsea wellheads,” SPE paper no. 12351, Presented at the 1982 European petroleum Conference, London, UK, October 25-28. Day, J. B., Moyer, M. C., and Hirshberg, A. J., 1990, “New Makeup Method for API Connections”, SPE paper 18697. Erpelding, P. and Miller, R. A., 1994, “Tubing temperature correlations for injection and production based on simulation and field experience,” OTC paper no. 7537, Presented at the 26th Annual OTC, Houston, TX, May 2-5. Fontenot, J. E. and Clark, R. K., 1974, “An improved method for calculating swab and surge pressures and circulating pressures in a drilling well,” SPE Journal, October 1974, pp. 451-62. Gulati, K. C., McKenna, D. L., Maes, M. A., Johnson, R. C., Lewis, D. B., Riekels, L. and Maute, R. E., 1994, "Reliability Based Design and Application of Drilling Tubulars," OTC paper no. 7557, Presented at the 26th Annual Ofshore Technology Conference, May 2-5, Houston, TX. Goodman, M. An. and Halal, A. S., 1993, “Case Study: HPHT Casing design achieved with multistring analysis,” SPE paper no. 26322, Presented at the 68th Annual technical conference and exhibition, Houston, TX October 3-6. Goodwin, K.J. and Crook, R.J.: “Cement Sheath Stress Failure,” SPE paper no. 20453, presented at the SPE Fall Meeting, New Orleans 1990. Greenip Jr., J. F., 1977, “Determining stress in tubing using triaxial evaluation,” SPE paper no. 6760. Halal, A. S. and Mitchell, R. F., 1993, “Casing design for trapped annulus pressure buildup,” SPE/IADC paper no. 25694, Presented at the 1993 SPE/IADC Drilling Conference, Amsterdam, February 23-25. Halal, A. S. Mitchell, R. F. and Wagner, R. R., 1997, “Multi-String Casing Design with Wellhead Movement”, SPE paper no. 37443 , Presented at the SPE Production Operations Symposium, held in Oklahoma City, Oklahoma, 9-11 March 1997. Hammerlindl, D. J., 1977, “Movement, forces and stress associated with combination tubing strings sealed in packers,” J. Pet. Tech. Trans. AIME, Vol. 263, pp. 195-208. Hammerlindl, D. J., 1978, “Packer to tubing forces for intermediate packers,” SPE paper no. 7552.

I:56
Johnson, R., Jellison, M. J., and Klementich, E., 1987, “Triaxial-load capacity diagrams provide new approach to casing and tubing design analysis,” SPE paper no. 13434. Ikeda, S., 1992, “Advanced casing design against stress corrosion cracking of grade P-110 casing in lignosulfonate mud,” SPE Drilling Engineering, Vol. 7, no. 2, pp. 141-147. Klementich, E.F.: ”Unraveling the Mysteries of Proprietary Connections”, Journal of Petroleum Technology, December, 1995. Kocian, E. M. 1990, “Compressive Loading Casing Design,” paper no. 19923, Presented at the 1990 IADC/SPE Drilling Conference, Houston, Texas, February 27-March 2. Leach, C.P. and Adams, A. J., 1993, “A new method for the relief of annular heat-up pressures,” SPE paper no. 25497, Presented at the Production Operations Symposium, Oklahoma City, OK, March 21-23. Lubinski, A., and Blenkarn, K. A., 1957, “Buckling of tubing in pumping wells, its effects and means for controlling it,” J. Pet. Tech., Trans. AIME, Vo. 210, pp. 73-88. Lubinski, A., Althouse, W. S. and Logan, J. L., 1962, “Helical buckling of tubing in sealed packers,” Trans. AIME, Vol. 225, pp. 655-670. MacEachran, A., and Adams, A. J., 1991, “Impact on casing design of thermal expansion of fluids,” SPE/IADC paper no. 21911, Presented at the 1991 SPE/IADC Drilling Conference, Amsterdam, March 11-14. McIver, D. B., 1991, “Effect of some design parameters on well completion stresses,” SPE paper no. 23048, Presented at the 1991 Offshore Europe Conference, Aberdeen, UK, September 3-6. Mitchell, R. F., Miska, S., and Wagner, R. R., 1997, “Casing and Tubing design,” Petroleum Engineering Handbook. Michel, C. M., 1991, “Methods of detecting and locating tubing and packer leaks in the Western operating area of Prudhoe Bay field,” SPE paper no. 21727, Presented at the 1991 Production Operations Symposium, Oklahoma City, OK April 709. Monrose, H. and Boyer, S., 1992, “Casing Corrosion: Origin and delection,” The Log Analyst, Nov. – Dec. 1992, pp. 507-519. Moore, P., 2000, Personal communication, SCP JIP Survey Interview on September 27, 2000. MMS NTL, 13 November 2000, “National Notices to Lessees,” 14 November 2000. http://www.mms.gov/ntls/ NACE documents Oudeman, P. and Bacarreza, L. J., 1995, “Field trial results of annular pressure behavior in high pressure/high temperature well,” SPE Drilling and Completion, June 1995, pp. 84 - 88. Payne, M. L. and Abbasian, F., 1996, “Advanced torque and drag considerations in extended-reach wells,” SPE/IADC paper no. 35102, Presented at the 1996 IAD/ SPE Drilling Conference, Amsterdam, March 12-15. Payne, M. L. and Hurst, D. M., 1986, “Heavy-wall production tubing design for special alloy steels,” SPE Production Engineering, July 1986, pp. 289-302. Payne, M. L., Sathuvalli, U. B., and Crabtree, S. R., 1998, “Select topics and applications of probabilistic OCTG design,” World Oil, July 1998, pp. 113-123.

I:57
Payne, M. L. and Sathuvalli, U. B., 2000, “Pipe Collapse Issues Provide Economic Opprtunities," Oil and Gas Journal, pp. 38-44., February 17, 2000. Payne, M. L. and Scwind, B. E., 1999, “A new international standard for casing/tubing connection testing,” SPE/IADC paper no. 52846, Presented at the 1999 SPE/IADC Drilling Conference, Amsterdam, March 9-11. Payne, M. L. and Swanson, J. D., 1989, “Application of Probabilistic Reliability Methods to Tubular Design”, paper SPE 19556, presented at the 64th Annual SPE Technical Conference and Exhibition, October 8-11, San Antonio, Texas. Re-presented by invitation at the 13th SPE Production Technology Symposium, November 13-14, 1989, Lubbock, Texas. Reprinted in SPE Drilling Engineering, December 1990 by Editorial selection. Pearson, R. M., 1987, “PE301 Petroleum Engineering,” Well Completion and Design Practices, Series Editor: D. A. T. Donohue, IHRDC Publishers, Boston, MA, pp. 75-127. Ramey, H. J., 1962, “Wellbore Heat Transmission,” Journal of Petroleum technology, April, 1962, pp. 427-435. Raney, J.B. and Lamb, J.F., 1989, “Running and Handling of a Premium Connection on a Rig”, SPE paper no. 18698, Presented at the SPE/IADC Drilling Conference, New Orleans, 1989. Raymond, L. R., 1969, “Temperature distribution in a circulating drilling fluid,” Journal of Petroleum Technology, September 1969, pp. 333- 341. Ridwan, A, and Hull, K.B.: “Arun Field Tubular Performance, Quality Control and Operating Experience”, SPE paper 12426 presented at the Offshore South East Asia Conference, Singapore, 1984. Riggs, K. R., 2000, Section on corrosion, SCP JIP Report. Prepared by Stress Engineering Services. Rusch, D.W. and Ellis, B.C.: “Use of Pressure Activated Sealants to Cure Sources of Casing Pressure”, SPE paper 55996, presented at the SPE Western Regional Meeting, Anchorage, 1999. Salama, M. M. and Venkatesh, E. S., 1983, “Evaluation of API RP 4E erosional velocity limitations for offshore gas wells,” OTC paper no. 4485, Presented at the 1983 Offshore Technology Conference, Houston, TX, May 2-5. Samuel, G. R. and Gonzales, A., 1999, “Optimization of multistring casing design with wellhead growth,” SPE 56762, Presented at the 1999 SPE Annual Technical Conference and Exhibition, Houston, TX, October 3-6. Schwind, B.E. and Wooley, G.R., 1989, “New Findings on Leak Resistance of API 8-Round Connectors”, SPE paper no. 15515. Stair, M. A. and McInturff, T. L., “Casing and tubing design considerations for deep sour gas wells,” SPE/IADC paper 11392, Presented at the 1983 IADC/SPE Conference, New Orleans, LA, February 20-23. Timoshenko, S., “Strength of Materials, Part 1,” Krieger, Malabar, Florida. Walstad, D.E. and Crawford, D.W., 1988, “The Importance of Correct Running and Handling Procedures for Premium Tubular Goods”, SPE paper 16107. White, F. M., 1974, Viscous Fluid Flow, Second Edition, McGraw Hill, New York, NY. White, F. M., 1986, Fluid Mechanics, McGraw Hill, New York, NY, pp. 147-154, pp. 511- 530. Wooley, G. R., 1979, Wellbore and Soil Thermal Simulation for Geothermal Wells, Comparison of GEOTEMP Predictions to field data and evaluation of flow variables, Report to Sandia Laboratories, Contract 13-0212, US Department of Energy, Geothermal Energy Division.

I:58
Wooley, G. R., 1980, “Computing downhole temperatures in circulation, injection and production wells,” J. Pet. Tech., September 1980, pp. 1509-1522. Yudovich, A., Chin, L. Y., and Morgan, D. R., 1988, “Casing deformation in Ekofisk,” OTC paper no. 5623, Presented at the 1988 Offshore Technology Conference, May 2-5. Zamora, M., 1997, “Virtual rheology and hydraulics improve use of oil and synthetic-based muds,” Oil and Gas Journal, March. 3, 1997.

I:59
Appendix A: Survey of JIP Participants
LIST OF PARTICIPANTS AND COMPANY REPRESENTATIVES BP AMOCO Phil Pattillo 501 Westlake Park Blvd. Houston, TX 77079 Phone: (281) 366-2133 [email protected] Mike Payne 501 Westlake Park Blvd. Houston, TX 77079 Phone: (281) 366-2848 [email protected] Perla Gonzales Lerma 501 Westlake Park Blvd. Houston, TX 77079 Phone: (281) 366-3653 Fax: (281) 366-2905 EEX (ENSEARCH) Tommy Bolin 2500 City West Blvd, Ste. 1400 Houston, TX 77042 Phone: (713) 243-3205 Fax: (713) 243-3191 [email protected] EXXON COMPANY USA Roger Frederickson 1555 Poydras Street, P. O. Box 61707 New Orleans, LA 70161-1701 Phone: (504O 561-4936 Fax: (504) 561-4936 [email protected] James Day [email protected] GRANT PRIDECO Pete Moore 1450 Lake Robbins Drive, Ste. 600 The Woodlands, TX 77380-0000 Phone: (281) 297-8624 Fax: (281) 297-8630 [email protected] LONE STAR STEEL Beau Urech

I:60
14681 Midway Rd., P. O. Box 803546 Dallas, TX 75380-0000 Phone: (972) 770-6448 Fax: (972) 770-6337 [email protected] MAVERICK TUBE CORPORATION Jessie Robbins PM 3083, P. O. Box 659 Conroe, TX 77305-0000 Phone: (409) 539-2136 Fax: (409) 539-9634 [email protected] SEAL-TITE INTERNATIONAL David W. Rusch 1795 West Causeway Mandelville, LA 70471-0000 Phone: (504) 674-3385 Cell: 504 630 0315 Fax: (504) 626-9416 [email protected] STRESS ENGINEERING SERVICES, INC. Ken Riggs 13800 Westfair East Dr. Houston, TX 77041 Phone: (281) 955-2900 Fax: (281) 955-2638 [email protected] Lee Eichberger [email protected] GATOR HAWK, TUBOSCOPE Bruce Hasha 18660 East Hardy Road Houston, TX 77073-0000 Phone: (281) 443-3343 [email protected] MARATHON OIL COMPANY Lee Nirider 5555 San Felipe, P. O. Box 3128 Houston, TX 77056-2725 (713) 296-3330 [email protected] VASTAR RESOURCES Marvin Miller 15375 Memorial Drive Houston, TX 77079-0000 Phone: (281) 584-3177 Fax: (281) 584-6306 DEVON ENERGY (713) 286-5700

I:61
Brian Stewart P. O. Box 4616 Houston, TX 77210 Phone: (713) 286-5908 [email protected] TEXACO Brad Marple 400 Poydras St. New Orleans, LA 70160 Phone: (504) 680-4024 Fax: (504) 680-4092 [email protected] HYDRIL COMPANY John Greenip 3300 N. Sam Houston Parkway E. P. O. Box 60458 Houston, TX 77205-0458 Phone: (281) 985-3360 Fax: (281) 985-3459 [email protected] Anjali Prasad [email protected] LOOMIS INTERNATIONAL Kent Padgett 100 North Richey, P. O. Box 6408 Pasadena, TX 77506-0000 Phone: (713) 477-7148 Fax: (713) 920-2463 [email protected]
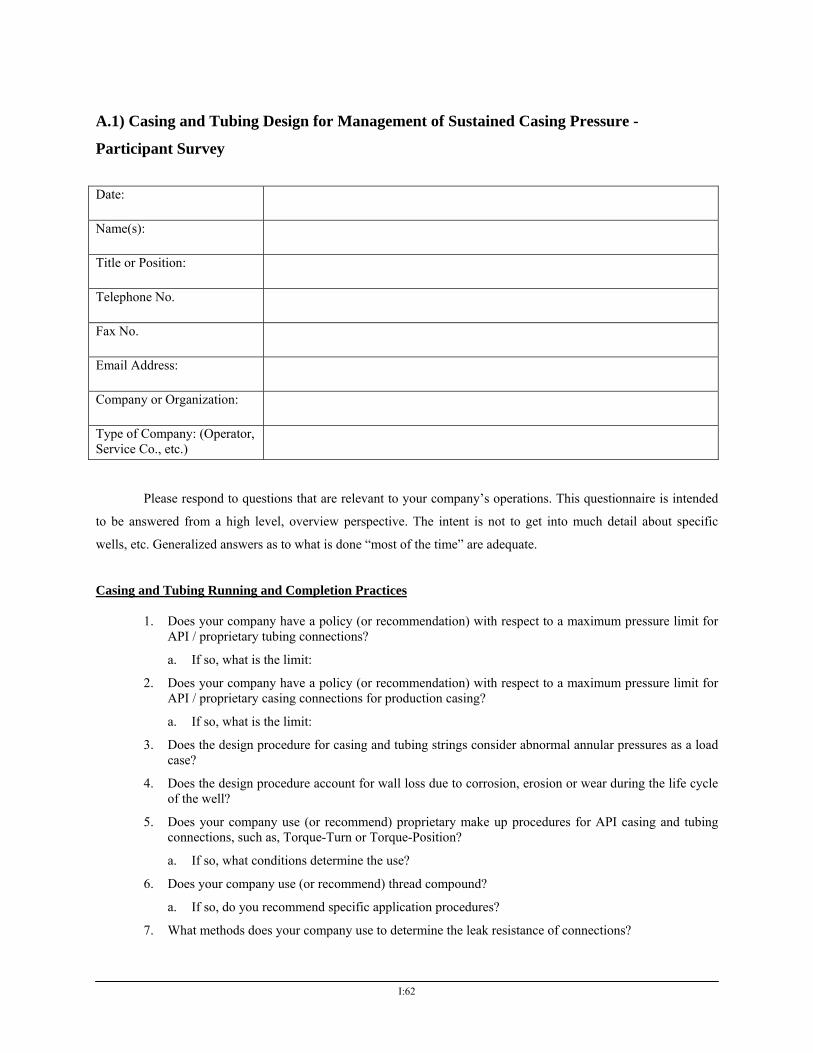
I:62
A.1) Casing and Tubing Design for Management of Sustained Casing Pressure -
Participant Survey
Date:
Name(s):
Title or Position:
Telephone No.
Fax No.
Email Address:
Company or Organization:
Type of Company: (Operator, Service Co., etc.)
Please respond to questions that are relevant to your company’s operations. This questionnaire is intended
to be answered from a high level, overview perspective. The intent is not to get into much detail about specific
wells, etc. Generalized answers as to what is done “most of the time” are adequate.
Casing and Tubing Running and Completion Practices
1. Does your company have a policy (or recommendation) with respect to a maximum pressure limit for API / proprietary tubing connections?
a. If so, what is the limit:
2. Does your company have a policy (or recommendation) with respect to a maximum pressure limit for API / proprietary casing connections for production casing?
a. If so, what is the limit:
3. Does the design procedure for casing and tubing strings consider abnormal annular pressures as a load case?
4. Does the design procedure account for wall loss due to corrosion, erosion or wear during the life cycle of the well?
5. Does your company use (or recommend) proprietary make up procedures for API casing and tubing connections, such as, Torque-Turn or Torque-Position?
a. If so, what conditions determine the use?
6. Does your company use (or recommend) thread compound?
a. If so, do you recommend specific application procedures?
7. What methods does your company use to determine the leak resistance of connections?

I:63
a. Supplier or vendor information and documentation.
b. Internal or external research.
c. Rules of thumb or past experience.
d. A combination of the above.
8. List any other best practices used (or recommended) that improve the integrity of tubing string to resist SCP problems?
9. What types of QA/QC procedures exist in your company for tubing and completion equipment?
Pressure Testing
1. What is your company policy (or recommendation) for pressure testing production casing?
a. Always test.
b. Never test.
c. Test sometimes.
If so, what are the conditions that require pressure testing?
d. What determines the test pressure?
e. Is the test done before or after cement sets?
2. What is your company policy (or recommendation) for pressure testing production tubing?
a. Always test.
b. Never test.
c. Test sometimes.
If so, what are the conditions that require pressure testing?
d. What determines the test pressure?
3. What is your company policy (or recommendation) for pressure testing production tubing while running?
a. If used, is internal or external testing used?
b. What determines the method used?
c. What is the test medium used, i.e. water, gas, etc.?
d. What determines the test pressure?
4. How do you pressure test liner laps?

I:64
SCP and Correction Action
1. What is the policy on monitoring pressure in the tubing and annuli of offshore wells?
Continuously Periodically
Tubing
Primary annulus
Outer annuli
(Please specify frequency if pressure monitoring is not continuous).
2. What methods does your company use to diagnose leaks?
3. How do you estimate the depth of the leak?
4. How do you determine the string that most likely has the leak?
5. What methods of repair for SCP has your company had success with?
6. What methods of repair for SCP has your company had limited success with?
Cementing
1. Does your company have a document of “Cementing Guidelines”? If so,
a. Does it require specific flow properties for the mud, prior to cementing?
b. Does it specify the use of spacers and flushes?
c. Does it recommend pipe rotation or reciprocation?
d. If so, what percent of casing strings are moved before an dudring the cement job?
e. Do the Cementing Guidelines specify casing centralization?
f. Does it specify a displacement rate?
g. Doe sit provide guidance on slurry composition?
h. Does it provide guidance on preventing gas migration, such as the use of foamed slurries?
i. Does it provide guidance on Wait and Cement Time?
List any cementing best practices that you have had success with.

I:65
A.2) Casing and Tubing Running and Completion Practices
CASING AND TUBING RUNNING AND COMPLETION PRACTICES QUESTION 1 Does your company have a policy (or recommendation) with respect to a maximum pressure limit
for API / proprietary tubing connections? a. If so, what is the limit?
Company A Proprietary Company B Yes.
a. MASP <3000 psi. Company C Company D Pressure limits based on FEA and physical testing.
a. Low stress connections used in sour service. Company E We have no specific policy. Each field or well is evaluated on its own merits. Company F Yes.
a. If the Shut-in tubing pressure is expected to be above 3500 psi, them premium connections are recommended.
Company G Yes. a. Recommendation - 5,000 psi or 60% of the internal/external pressure rating whichever is lower for service. Pressure-test pressures should not exceed 80% of the pipe pressure ratings.
Company H Company I Yes.
a. (1) For API thread seal connections, we recommend the operator consider auxiliary safeguards when the pressure exceeds 5000 psi for multi-phase systems and 3000 psi for dry gas systems. Corrosive environments and critical locations would reduce these pressures. Auxiliary safeguards include past experience with the product in that environment, utilizing specialized field service personnel to supervise the running operation, pressure testing during running, short term intermittent exposure, special torque application equipment. (2) For thread seal proprietary connections, we recommend the operator consider auxiliary safeguards when the pressure exceeds 8000 psi for multi-phase systems and 4000 psi for dry gas systems at temperatures above 250oF. Corrosive environments and critical locations would reduce these pressures. (3) For metal seal proprietary connections, no limitations below pipe body are recommended.
Company J No. Company K Yes.
a. 80% of the pipe body internal yield strength without limit. Company L Company M Not applicable. We cure leaks in tubing connections.

I:66
QUESTION 2 Does your company have a policy (or recommendation) with respect to a maximum pressure limit
for API / proprietary casing connections for production casing? a. If so what is the limit
Company A Proprietary Company B Yes.
a. Pressure differential < 4000 psi. Company C Company D Pressure limits based on FEA and physical testing.
a. Low stress connections used in sour service. Company E There should be no prescriptive policy on this topic. Company F No, but usually the casing design will cause premium connection on high pressure wells. Company G Yes. Recommendation.
a. 5,000 psi or 60 % or the internal/external pressure rating whichever is lower. Pressure-test pressures should not exceed 80% of the pipe pressure ratings.
Company H Company I Yes.
a. (1) For API thread seal connections, we recommend the operator consider auxiliary safeguards when the pressure exceeds 5000 – 7500 psi. Corrosive environments and critical locations would reduce these pressures. Auxiliary safeguards include past experience with the product in that environment, utilizing specialized field service personnel to supervise the running operation, pressure testing during running, special torque application equipment. (2) For thread seal proprietary connections, we recommend the operator consider auxiliary safeguards when the pressure exceeds 8000 - 10000 psi. Corrosive environments and critical locations would reduce these pressures. (3) For metal seal proprietary connections, no limitations below pipe body are recommended.
Company J No. Company K Yes.
a. 80% of the pipe body yield strength. Company L Company M Not applicable. We cure leaks in casing connections. QUESTION 3 Does the design procedure for casing and tubing strings consider abnormal annular pressures as
a load case? Company A Proprietary Company B Yes. Company C Company D Yes. Production casing design for shut-in tubing pressure. Company E Yes. Company F Yes – our casing design assumes that we have a tubing leak at the surface. Company G Any anticipated abnormal annular pressures should be considered in the design and treated as
the worst case scenario. This should include pressures both internal and external to either string, inclusive of the connections expected performance.
Company H Company I Not considered unless specifically identified by the operator to be of concern. Company J No. Company K No. Company L Company M Not applicable.

I:67
QUESTION 4 Does the design procedure account for wall loss due to corrosion, erosion or wear during the life
cycle of the well? Company A Proprietary Company B Yes. Company C Company D Design for production casing does not account for corrosion or erosion. Design accounts for
wear while drilling. Safety factors applied. Use of internal coating and CRA's used for tubing in corrosive environment.
Company E Yes. Company F Yes. Company G Every step should be taken to evaluate these conditions for any given well and the appropriate
safety factors should be employed. Company H Company I No. Company J Wear (by increasing DF). Company K No. Company L Company M Not applicable. QUESTION 5 Does your company use (or recommend) proprietary make up procedures for API casing and
tubing connections, such as, Torque-Turn or Torque-Position? a. If so, what conditions determine the use?
Company A Company B No.
a. Not applicable. Company C Company D Torque position.
a. All conditions in OCS. Company E No.
a. Special make up procedures and equipment are only use on premium connections. Company F Yes.
a. We use tubing torque-turn if we are using a high alloy tubing or if we are testing the connections
Company G We recommend the use of these procedures to evaluate the mechanical integrity of each connector. We also feel that since these procedures measure averages that they do not offer an absolute guarantee of leak resistance. Leak resistance is a measure of hydraulic/flow resistance integrity. While the number of possible leaks is reduced with this procedure, it does not fully eliminate them as our testing history when pressure testing in conjunction, still finds leaks in connections.
Company H Company I No recommendation. Company J No (make up in plant and check if torque is in nominal range). Company K Yes.
a. Use is based on specification of operator. We recommend use of Torque Monitoring for all-types of connection make-ups as it incorporates torque control via dump valve.
Company L Company M Not applicable.

I:68
QUESTION 6 Does your company use (or recommend) thread compound?
a. If so, do you recommend specific application procedures?
Company A Company B Yes Best-O-Life. Company C Company D Yes.
a. Use manufacturer’s recommendation for proprietary threads. Company E We have tried several over the years and found little consistent difference. We tend to follow the
recommendation of the thread manufacturer. a. We do spell out that in the completion procedure that the thread compound "should be applied sparingly, to the pin end only, with a one inch paint brush".
Company F Best-O-Life 2000. Company G No.
a. Operators' discretion depending upon connection and well conditions. Company H Company I Yes.
a. Application to the pin end only. Company J Best-O-Life 2000.
a. Torque Book Enclosed. Company K Yes. Company L Company M Not applicable.
QUESTION 7 What methods does your company use to determine the leak resistance of connections? a. Supplier or vendor information and documentation. b. Internal or external research. c. Rules of thumb or past experience. d. A combination of the above.
Company A Company B a. Yes.
c. Yes. d. Yes.
Company C Company D b. Rely heavily on FEA and physical testing. Company E All of the above are used, on most occasions. Company F d. Combination of vendor info and past experience. Company G Internal and External Pressure Testing with water, Nitrogen or Nitrogen with Helium Tracer
a. attached b. attached
Company H Company I a. Analytical methods (FEA, classical mechanics)
b. In-house testing c. past experience and historical usage d. yes
Company J API only: API method. Company K We provide internal water testing of couplings, internal water of full joint, external water of
coupling, internal helium/nitrogen of coupling and a combination of gas for coupling and water for pipe body. We feel the only true direct means of determining "leak resistance" of a tubing connection on the rig floor is by internal gas testing.
Company L Company M Not applicable. We perform leak diagnostics when leaks are discovered after the well is on
production.

I:69
QUESTION 8 List any other best practices used (or recommended) that improve the integrity of tubing string to resist SCP problems.
Company A Company B Use of chrome tubulars and associated hardware in corrosive environments. Company C Company D Tubing accessories (ie, landing nipplies, gas lift mandrets, etc) are assembled with pup joints to
provide _+30" assemblies and pressure tested prior to delivery. IPC tubing is drifted with teflon drift bars
Company E For high pressure or subsea or new connection design or exotic alloy or sour gas or other special considerations, we may request make and break tests, pressure sealing with bending load or other special shop testing.
Company F Not applicable Company G Not applicable. Company H Company I Additional "best practices" include past experience with the product in that environment, visual
inspection prior to running, utilizing specialized field service personnel to supervise the running operation, pressure testing during running, special torque application equipment during both running and buck-on.
Company J Pitch diameter measurements on all casing strings. Company K The following are our recommendations for best practices to eliminate SCP problems resulting
from tubular related leaks: a. Monitor the make-up torque of tubular to assure proper amount of torque (force) is applied to sealing surfaces in the connection per thread manufacturer's specifications. b. Perform internal helium test of each connection after monitored torque make-up.
Company L Company M Not applicable.
QUESTION 9 What types of QA/QC procedures exist in your company for tubing and completion equipment? Company A Company B Failure analyses. Company C Company D 100% full length ultrasonic inspection, special end area EMI by qualified inspection company.
Full traceability. Thread inspection and gauge. Pressure test accessories. Quality vendors. Company E Depending on the application, the Quality Assurance department may be asked to review and
comment on the manufacturer's quality plan, perform an audit of the manufacturing facility and/or assign a third party witness/inspector to the plant during manufacture of the tubing and/or cutting of the threads.
Company F Typically, no inspection but the engineer can specify any type of inspection that he deems necessary. If he deems it a critical application (high pressure) then full length drift, special end area and EMI inspections are performed.
Company G Not applicable. Company H Company I Employ conventional QA/QC systems for manufacturing – statistical process control, centrally
programmed computer numerically controlled machines, hardened and ground functional ring and plugs gauges, statistical sampling at appropriate AQL.
Company J Company K Not applicable. Company L Company M Not applicable.

I:70
A.3) Pressure Testing
PRESSURE TESTING QUESTION 1 What is your company policy (or recommendation) for pressure testing production casing?
a. Always test. b. Never test. c. Test sometimes. If so, what are the conditions that require pressure testing? d. What determines the test pressure? e. Is the test done before or after cement sets?
Company A Company B a. Always test.
d. MASP e. After cement sets.
Company C Company D Pressure test casing after it is in place and cemented.
a. Always test. d. Regulatory requirements. Anticipated pressure during life cycle of well. e. After.
Company E a. Always test. e. After the cement has set.
Company F a. Casing testing is an MMS requirement. d. MMS requires test to be 70% of rated burst pressure e. After the cement has set.
Company G a. Very few operators do this, that is pressure test production casing connections prior to running into the well. We are introducing a mill end tester at the SPE Show to check the coupling end. d. Percentage of pipe body pressure rating or well conditions, whichever is lower.
Company H Company I No recommendation. Company J a. Always test. Mill Hydro all pipe: Plain end or T and C at operations choice 80% SMYS.
d. API test pressure. Company K Not applicable. Company L Company M a. Always test.
d. Maximum working pressure of the casing. e. Not applicable.

I:71
QUESTION2 What is your company policy (or recommendation) for pressure testing production tubing?
a. Always test. b. Never test. c. Test sometimes. If so, what are the conditions that require pressure testing? d. What determines the test pressure?
Company A Company B c. Test sometimes-Yes. Dual completion strings, premium connections used for high pressure
gas wells d. MASP
Company C Company D a. Always test. After tubing is installed. If well is unperforated, test internally. If well is
perforated, test tubing/casing annulus. d. Regulation. Maximum SITP if well is unperforated.
Company E a. Test Always. Yes. d. Maximum pressure the tubing will see during its life cycle; often treating pressure during a stimulation.
Company F c. Test sometimes. Test internally only rotary sometimes. Test only if the expected shut-in tubing pressure is above 5000 psi. d. Completion engineer specifies a test pressure about 1500 psi above expected shut-in tubing pressure.
Company G When testing with either internal or external pressure it should be done with the pipe held in tension. a. Always test - one third of the operators fall into this category. b. Never test - one third of the operators fall into this category. c. Sometimes test - one third of the operators fall into this category. d. We recommend testing tubing to 80% of the pipe body rating or at least to the expected worst case well condition, whichever is lower.
Company H Company I No recommendation Company J a. Mill Hydro Company K Not applicable. Company L Company M a. Always test.
d. Maximum working pressure of the tubing.

I:72
QUESTION 3 What is your company policy (or recommendation) for pressure testing production tubing while
running? a. If used, is internal or external testing used? b. What determines the method used? c. What is the test medium used, i.e. water, gas, etc.? d. What determines the test pressure?
Company A Company B Test sometimes-Yes. Dual completion strings, premium connections used for high pressure gas
wells a. internal primarily b. company policy c. Water for lower pressure, dual oil well completions. Gas with helium tracers for high pressure, gas completions. d. MASP
Company C Company D Do not test tubing while running. Company E We have almost completely stopped testing tubing as it being run because we use high reliability
premium connections and rarely found any leaks. We do a full string test at some convenient point after the string is run.
Company F Test only if the expected shut-in tubing pressure is above 5000 psi. a. Usually internal. b. Specific application, cost. c. Gas. d. Completion engineer specifies a test pressure about 1500 psi above expected shut-in tubing pressure.
Company G Most threaders will say that their connections do not need to be tested, but they also do not object to the operator testing should the operator decide to do so as a risk management procedure. a. Both. b. The method used should be prioritized by 1) testing the connection to its lowest level of leak resistance; 2) tested based upon application and 3) tested based upon operational logistics and equipment capabilities. c. All can be used, but our experience shows that given the amount of test time when running pipe, that water with a surfactant can be just as effective as gas. The controlling factor is the pipe dope, its viscosity and the tortuous path of the threads. d. We recommend testing tubing to 80% of the pipe body rating or at least to the expected worst case well condition, whichever is lower.
Company H Company I Generally not recommended for metal seal connections. May be useful for thread seal
connections. a. If used, internal is recommended.
Company J Not applicable. Company K Not applicable. Company L Company M Not applicable.

I:73
QUESTION 4 How do you pressure test liner laps?
Company A Company B Both positive and negative. Company C Company D Typically perform a positive test and differential test. Company E The liner top is tested as soon as the casing above is cleaned out down to the liner top to remove
any excess cement. The entire liner including the top is tested as soon as the liner is cleaned out down to the float equipment, but before drilling out.
Company F Usually a positive test only but on critical liners we put both a positive and a negative test. Company G Not applicable. Company H Company I Not applicable. Company J Not applicable. Company K Not applicable. Company L Company M Not applicable.

I:74
A.4) SCP and Corrective Action
SCP AND CORRECTIVE ACTION
QUESTION 1 What is the policy on monitoring pressure in the tubing and annuli of offshore wells? (Please specify frequency if pressure monitoring is not continuous.)
Company A Company B Tubing: Continuously = in some cases, but seldom. Periodically = daily.
Primary Annulus: Periodically = weekly. Outer Annuli: Periodically = monthly.
Company C Company D Tubing: Continuously = yes.
Primary Annulus: Periodically = yes. Outer Annuli: Periodically = yes. Typically monthly unless pressure is detected. Once pressure is detected, monitoring frequency is dependant on pressure level and results of diagnostic bleed down.
Company E Tubing: Periodically = daily. Primary Annulus: Periodically = weekly. Outer Annuli: Periodically = monthly
Company F Continuous monitoring of tubing and primary annulus. Monthly on the outer annuli. Company G Not applicable. Company H Company I Not applicable. Company J Not applicable. Company K Not applicable. Company L Company M Not applicable. QUESTION 2 What methods does your company use to diagnose leaks?
Company A Company B Caliper surveys, “D&D” hole finders, pressure tests, etc. Company C Company D Bleed down, pony-tail, D&D hole finder, caliper. Company E Analysis of gas/fluid bleed off. Response of pressure to bleed off. Reoccurrence of pressure. Company F Monitor pressure on annuli, test tubing if suspicious. Company G Not applicable. Company H Company I Not applicable. Company J Not applicable. Company K Not applicable. Company L Company M Test pressure differential between tubing and each annuli. Test pressure increases and leak off
rates. Measure fluid level changes. Check for hangar leaks and other wellhead leaks using similar methods.

I:75
QUESTION 3 How do you estimate the depth of the leak?
Company A Company B Wireline measurements and caliper surveys. Company C Company D Bleed down, pony-tail, D&D hole finder, caliper. Company E Analysis of surface pressures, downhole tubing pressure and expected fluid gradients.
Company F Running wireline with a “ponytail”, caliper log or setting tubing plugs and bleeding.
Company G Temperature log is one procedure Company H Company I Not applicable. Company J Not applicable. Company K Company L Company M Temperature survey on tubing and Echometer on annuli.
QUESTION 4 How do you determine the string that most likely has the leak? Company A Company B Pressure testing Company C Company D Diagnostic bleed downs are performed. One casing string at a time while monitoring other
casing strings. Company E Analysis of gas/fluid bled off, analysis of well construction information such as cement tops with
respect to sand bodies and other relevant data. Company F Test the tubing. Company G Not applicable. Company H Company I Not applicable. Company J Not applicable. Company K Not applicable. Company L Company M Test each annuli in sequence starting from the outermost annuli.
QUESTION 5 What methods of repair for SCP has your company had success with? Company A Company B Packoffs – both wireline and coiled tubing deployed. Company C Company D Tubing leaks are corrected by replacing tubing or installing tubing packoffs. Company E None. Company F Rig workover to change tubing, setting wireline pack-offs Company G Not applicable. Company H Company I Not applicable. Company J Not applicable. Company K Not applicable. Company L Company M We cure wellhead, hangar, tubing and casing leaks using a pressure activated sealant. We have
a very good success rate with accurate leak data.

I:76
QUESTION 6 What methods of repair for SCP has your company had limited success with?
Company A Company B Liquid sealants. Company C Company D Limited success with pumping sealants. Company E None. Company F Company G Not applicable. Company H Company I Not applicable. Company J Not applicable. Company K Not applicable. Company L Company M Not applicable.

I:77
A.5) Cementing
CEMENTING QUESTION 1 Does your company have a document of “Cementing Guidelines”? If so, does it require specific
flow properties for the mud, prior to cementing? a. Does it require specific flow properties for the mud, prior to cementing? b. Does it specify the use of spacers and flushes? c. Does it recommend pipe rotation or reciprocation? d. If so, what percent of casing strings are moved before and during the cement job? e. Do the Cementing Guidelines specify casing centralization? f. Does it specify a displacement rate? g. Does it provide guidance on slurry composition? h. Does it provide guidance on preventing gas migration, such as the use of foamed
slurries? i. Does it provide guidance on Wait on Cement Time?
Company A Company B Yes.
a. Yes. b. Yes. c. Yes. d. No-date. e. Yes. f. No. Varies from case to case. g. No. Varies from case to case. h. No. Varies from case to case. i. No. Varies from case to case.
Company C Company D Training Course on primary and remedial cementing.
a. Not specific. b. Yes. c. Yes. d. ~50%. Unlikely on high angle wells. e. Yes. f. Displacement rate is dependant on many factories (i.e. hole size, PIT, ECD, etc.) g. General guidance. Slurry composition varies widely based on wellbore characteristics. h. Yes. Apply pressure. Use gas block additive. Does not specify foam. i. Yes.
Company E No. We use unwritten guidelines based on previous experience in the area. a. Yes. b. Yes. c. Yes. d. 90%. About 10% cannot be moved due to mechanical considerations. e. Yes. f. Yes. g. Yes. h. Yes. i. Yes.
Company F Yes. a. Yes. b. Yes. c. Yes. d. All longstrings that are not stuck prior to cementing or have some other mechanical limitation (like a mudline suspension) - probably 50% are reciprocated while cementing. e. Yes. f. It says to pump at the computer aided design rate. g. It says "mix cement at the correct density even if pump rate must be reduced to achieve this".h. Not specifically. i. No.
Company G Not applicable.

I:78
CEMENTING QUESTION 1 Does your company have a document of “Cementing Guidelines”? If so, does it require specific
flow properties for the mud, prior to cementing? a. Does it require specific flow properties for the mud, prior to cementing? b. Does it specify the use of spacers and flushes? c. Does it recommend pipe rotation or reciprocation? d. If so, what percent of casing strings are moved before and during the cement job? e. Do the Cementing Guidelines specify casing centralization? f. Does it specify a displacement rate? g. Does it provide guidance on slurry composition? h. Does it provide guidance on preventing gas migration, such as the use of foamed
slurries? i. Does it provide guidance on Wait on Cement Time?
Company H Company I Not applicable. Company J Not applicable. Company K Not applicable. Company L Company M Not applicable. QUESTION 2 List any cementing best practices that you have had success with?
Company A Company B Company C Company D *Mud conditioning prior to running casing and immediately prior to cementing.
*Centralization and pipe movement where possible. *Pre-flushed and spacers. *Cement slurry specifications. *Pump and displacement rate. *Bottom and top wiper plug designs. *Float shoe and float collar designs.
Company E All of the above. Also, we prefer salt saturated cements for open hole plugs when using synthetic muds. For all other cementing situations, we prefer to base our selection of cementing materials and techniques on the specific situation and NOT on some "Generalized Best Practices Document".
Company F Recommendations above are based on previous success. Company G Not applicable. Company H Company I Not applicable. Company J Not applicable. Company K Not applicable. Company L Company M We have a pressure activated sealant technology that is capable of curing microannular leaks in
existing cemented annuli. The success of the process is dependant on the conditions of the cement and annular fluid.

I:79
Appendix B: Modeling Annular Pressure
When the pressure or temperature in an annulus changes, the strings and the annuli in the well react to
reach a new state of mechanical and thermal equilibrium. In fact, the creation of a leak path is a response (albeit,
undesirable in most cases) of the strings and annuli moving towards equilibrium. The pressure at any point in the
annulus is a function of the mass of fluid m, volume Vann and temperature, T, so that
( )TVmpp annannann ,,= . (B1)
The changes in pressure due to the effects described in section 5.4.1, can be calculated from the definitions
of the isothermal and isobaric bulk moduli for a fluid.
The isothermal bulk modulus BT of a fluid is defined as the rate change of pressure with respect to
volumetric strain, at constant temperature, so that
( )T
T VVpB
ΔΔ
=. (B2)
The above definition enables the calculation of the change in pressure due to the effects described in
section 5.4.1, so that
( )
ann
ann.llooningthermal/ba
ann
fluidfluxinflux/out
ann
fluidexp. therm.
ann
ann.llooningthermal/ba
fluidfluxinflux/out
fluidexp. therm.
VV
BV
VBV
VB
VVVV
B
VVBp
TTT
T
T
Tann
Δ
Δ−
ΔΔ
+Δ
Δ=
Δ
Δ−Δ+Δ=
⎟⎠⎞
⎜⎝⎛ Δ
−=Δ
(B3)
Oudemann and Bacarezza (1995) obtain a similar expression for the change in the pressure of the annulus
by applying the chain rule of calculus to Eq. (1) and linearization so that
T
TpV
Vpm
mpp
annann Vm
annann
Tmann
ann
TV
annann Δ⎟
⎠
⎞⎜⎝
⎛∂
∂+Δ⎟⎟
⎠
⎞⎜⎜⎝
⎛∂∂
+Δ⎟⎠
⎞⎜⎝
⎛∂
∂=Δ
,,, (B4)
The first term on the RHS of the above equation represents the change in pressure caused by the fluid
influx into or efflux from the annulus. The second term on the RHS represents the change in the pressure of the
annulus due to a physical change in the annular volume. The last term on the RHS represents isothermal fluid
expansion. It is the volume by which the liquid or the gas (or the mixture) expands due to heating. The expansion is
obviously governed by the PVT behavior of the fluid. It now remains to calculate the volume change terms
described in Eq. (B3).

I:80
B.1) Change in annular volume
Consider a set of N annuli. The ith annulus is shown in Figure 20. Let the outer and inner radii of the annuli
be denoted by ri+1 and ri. Also assume that the inner and outer surfaces of the annulus are concentric thin walled
cylinders.
Figure 20 The ith annulus
Denote the thickness of the inner and outer cylinders by ti and ti+1 respectively. In the following we assume
that the cylinders are thin walled, i.e.
ri
ri+1
Fluid Filled SealedAnnulus
Annulus i Annulus i+1
ri+2
Annulus i-1
pi-1 pi pi+1

I:81
122
>i
i
tr
(B5)
for all i. This assumption is justifiable for most casing strings. The tubing is a thick walled cylinder. However, the
argument here serves to illustrate the physics of the problem. The volume of the ith annulus is therefore given by
( ) iiii LrrV 221 −= +π (B6)
where Li denotes its length. The change in the volume of this annulus is given by
ii
ii
i
ii
i
ii L
LV
rrV
rrV
V ΔΔΔΔ∂∂
+∂∂
+∂∂
= ++
11
(B7)
where Δri, Δri+1, and ΔLi denote the change in ri, ri+1, and Li respectively. Substituting Eq. (B6) in Eq. (B7), we
obtain
( ) iaiiiiiii VrrrrLV ,112 επ +−= ++ ΔΔΔ (B8a)
where
i
iia L
LΔ=,ε (B8b)
denotes the axial strain of the ith annulus.
B.2) Ballooning of a thin walled cylinder
Consider a thin walled cylinder of diameter d and wall thickness t subjected to internal pressure pin and
external pressure pout. For an open ended cylinder (L/d >>1), the radial stress σr and hoop stresses σh in the wall are
given by (Timoshenko, 1986)
( )outinr pp −=σ , (B9)
( )outinh ppt
d−=
2σ . (B10)
From Hooke's law the hoop strain due to these stresses is given by
( ) TE rhh Δανσσε +−=1 (B11)
where TΔ is the temperature rise in the cylinder wall and α is its coefficient of thermal expansion. E and ν denote
the elastic modulus and Poisson's ratio respectively. The change in the radius of the cylinder is given by
( ) Tdpp
td
Ed
dr
outin
h
Δ
Δ
αν
ε
222
2
+−⎟⎠⎞
⎜⎝⎛ −=
= (B12)
If the stresses are all elastic, then the above equation can re-written by replacing the pressures with changes
in pressure, to get

I:82
( ) nppmr outin +−= ΔΔΔ (B13a)
where
⎟⎠⎞
⎜⎝⎛ −= ν
td
Edm
22 (B13b)
Tdn Δα2
= (B13c)
Equation (B12) relates the change in the radial dimensions of a cylinder subjected to changes in pressure
and temperatures. Note that the first term on the RHS of Eq. (B13a) is the “ballooning” term since it describes the
changes in the radial dimensions due to changes in pressure and axial length*.
B.3) Annular Volume Change and Loads
The change in the volume of the ith annulus as given by Eq. (B8a) can be related to the annular pressures
via Eq. (B13) so that
( ){ }
( ){ } aiiiiiii
iiiiiiii V
nrppmrnrppmr
LV επ +⎥⎦
⎤⎢⎣
⎡+−−
+−=
−
+++++
ΔΔΔΔ
Δ1
111112
where all subscripted variables on the right hand side (except pressures), are evaluated at the corresponding radii
shown Figure 20. The above equation can be rearranged as
( ) ( )[ ] ( )( )( )
ai
iiiii
iiiiiiiiiiiiiii
VnrnrL
pmrLpmrmrLpmrLV
επ
πππ
+−+
−+++−=
++
+++++−
11
111111
2222 ΔΔΔΔ
(B14)
Let the fluid in the volume experience a temperature rise fiTΔ Then the fluid volume increase is given by
( fifi TV Δγ ) where γf denotes the thermal coefficient of volumetric expansion of the fluid. The net volume change is
given by the thermal expansion plus the influx/outflux, Vin-out, so that, the total unconstrained volume change is
fluxifiuc
i VTVV +Δ=Δ γ (B15)
The superscript "uc" implies that this is the unconstrained volume expansion. Since, the volume change in
the fluid and the volume change of the annulus per Eq. (B14) are not equal, the annular fluid experiences a pressure
increase. Since Eq. (B14) represents the volume change of the annulus in terms of the unknown pressure increases
Δpi-1, Δpi, and Δpi+1, the pressure increase in the annular fluid can be calculated. Using Eq. (B3), the definition of the
fluid bulk modulus, we obtain
uciiiiii VBVBpV ΔΔΔ =+ . (B16)
* Examination of the thermal and pressure expansion terms shows that their ratio is of the order of ( )
Tpptd outin
ΔΔ−Δ
400/
for steel, indicating that ballooning due to thermal expansion tends to dominate the volume change in most cases.

I:83
Equation (B16) can be written for each concentric annulus. For N concentric cylindrical surfaces that form
N-1 annuli, there exist N -1 unknown pressure changes. If we know the pressure change in the innermost cylinder,
we obtain a set of N-1 simultaneous equations that can be solved for the individual pressure changes. These
equations become linear if the influx/efflux term is zero. If this term is not zero, the equations become non-linear.
The model described so far can be easily implemented in a spreadsheet and used to estimate orders of magnitude of
the pressure build up. If APB is serious enough, detailed calculations based on refined models can be attempted.
The modeling of the volume influx/efflux term is a separate subject in itself. The authors of this document
are not aware of published work on this issue. Nevertheless, guidelines to estimate this quantity are proposed below.
The change of mass in the annulus is a result of leakage into or out of the annular space. The leakage is either due to
fracture into a formation (or influx from the formation) or mass diffusion into (or from) a neighboring annulus (or
tubing) through a component leak. As a first approximation, flow into or from a formation can be modeled by
methods used to interpret formation leak off tests, where the volume flow rate is proportional to the square root of
the pressure differential driving the flow (Bourgoyne et al.1991). The flow of gas via a component leak into a
neighboring fluid filled space is akin to the familiar problem of “time to empty a reservoir” formulated in
undergraduate courses in fluid mechanics. In this type of a problem, a fluid reservoir is drained through a nozzle,
and this process can be modeled as an isentropic efflux from a higher pressure to a lower pressure. The solution to
the problem of gas leak from a closed volume by using this method is described in Appendix C.
B.4) Well shut-in
This section uses the above development to estimate the increase in the pressure on the primary annulus
when a flowing well is shut in. As discussed in section 5.4.1 when the well is shut in there is an increase of
ballooning in the tubing which could lead to a slight increase in the pressure on the annuli. In order to estimate this,
it is sufficient to calculate the change in the pressure of the annuli due to the effect of the extra ballooning that
occurs at the time of shut in.* For the purposes of order of magnitude estimation, it is sufficient to consider only the
tubing and the primary annulus.
Let rt denote the outer radius of the tubing and t its thickness. Let rci denote the inner radius of the casing.
The volume capacity of the tubing of length L is given by
LrV tt2π=
and the change in its volume due to shut in is given by
LrrV ttt Δ=Δ π2 . (B17)
Here Δrt denotes the change in the radius of the tubing due to change in the pressure in the tubing and the
annulus, and it can be calculated from Eq. (B13a). This gives
( )annttt ppmr Δ−Δ=Δ (B18)
* All other effects would have already been considered while calculating the APB when the well is flowing.

I:84
where
⎟⎟⎠
⎞⎜⎜⎝
⎛−= ν
t
t
t
tt E
rEr
m,
Et is the modulus of elasticity of the tubing, and Δpt denotes the change in tubing pressure from the flowing
to the shut-in condition, and Δpann is the corresponding change in primary annulus pressure. The term due to thermal
expansion is zero since the wellhead tubing temperature does not change appreciably immediately after shut in.
Assuming that casing diameter change is negligible, a reasonable assumption since the change in temperature is
negligible, we note that the change in the volume of the primary annulus
tann VV Δ−=Δ (B19)
Thus from Eqs. (B3), (B17) and (B19), we get
( )ann
anntannt
ann
annannann V
ppLBmrVVBp Δ−Δ
=Δ
−=Δπ2
Noting that the volume of the primary annulus is given by
)( 22tciann rrV −= π ,
we obtain,
t
ann
tann p
BfE
p Δ+
=Δ1
1
where
12
121
−
⎟⎠
⎞⎜⎝
⎛ −⎥⎥⎦
⎤
⎢⎢⎣
⎡−⎟⎟
⎠
⎞⎜⎜⎝
⎛= ν
tr
rr
f t
t
c
(B20)
Consider the case of an annulus formed by 4.5 in., 21.6 ppf tubing and 7 in., 23 ppf casing. Assume that the
annulus is filled with a fluid of bulk modulus 526,000 psi and that the modulus of elasticity of steel is 30,000, 000
psi. Substituting these values in the above expression we obtain f = 0.14 and Et/Bann =57.03. Thus,
11.0
98.711
=+
=ΔΔ
ann
t
pp
.
If the difference between the wellhead flowing and shut in pressures is 1, 000 psi a pressure increase less
than or equal to 111 psi can be expected in the annulus. However, this pressure will decay as the wellbore cools.
This pressure spike may be important if annuli are operating close to their limiting pressures.

I:85
B.5) Bleeding a heated annulus
This development in this section is very similar to the bleed off time calculations described in Appendix C
with some variations due to the difference in the PVT behavior of liquids. Let p(t) and p(t+Δt) denote the pressure in
the heated annulus at times t and t+Δt. These pressures are then related to the change in pressure Δp as
( ) ( )tpttpp −Δ+=Δ− (B21)
The change in pressure is related to the change in volume (in this case the bleed fluid), Dv of the
incompressible fluid, as
aT V
VBp Δ=Δ
(B22)
where BT is the isothermal bulk modulus of the fluid and Va is the volume of the annulus. The bleed volume can be
described as Bernoulli type efflux (see Appendix C for the details) so that the volume flow rate Q, of the liquid
through the bleed nozzle is given by
( )[ ]ρ
atmn
ptpAQ
−=
2
(B23)
where patm is the atmospheric pressure and ρ is the density of the fluid. Therefore, the volume efflux in a time
interval Δt is given by
tQV Δ=Δ (B24)
Substituting Eqs. (B23) and (B24) into Eq. (B22) and then into Eq. (B21) we obtain, the following
differential equation for the pressure in the annulus during bleed off:
1
2−−=
atmn
atm
a
nt
ppA
pV
ABdtdp
ρ (B25)
The time required to bleed the annular pressure to atmospheric pressure from an initial pressure pi, is
therefore given by
( ) ∫=
−−=
1
11
atm
ippp
atmp
pdG
pt
(B26)
where
atmppp =
and
ρatm
a
nT pV
ABG
2=
. (B27)
Integration of Eq. (B26) yields

I:86
( )
⎥⎥⎦
⎤
⎢⎢⎣
⎡−= 12
atm
iatmatm p
pG
ppt
(B28)
Finally, this enables the calculation of the volume required to relieve the thermally induced annular
pressure. The volume of the bleed fluid is
( )
∫=
=
=atmptt
tbleed QdtV
0 (B29).
Substituting Eqs. (B28) and (B23) into the above equation and subsequent integration leads to
( )[ ]A
atmnTbleed V
ptABVρ2
22
−= (B30)
Note that the bleed volume has a negative sign since we are calculating the change in the volume of the
fluid in the annulus which is decreasing as the fluid is bled off.
This expression enables the calculation of bleed off times for a fluid and the associated bleed volumes.
Once again, we note that this is a simple model that does not account for effects such as gravity, temperature and
losses at the nozzle. This calculation however provides an order of magnitude estimate of the times involved, since
gas bleed off times are significantly larger than fluid bleed off times.

I:87
Appendix C: Estimating Annular Bleed Time
Estimating the bleed time required to reduce the pressure in an annulus is a special case of the problems
that involve pressure driven fluid migration from one volume to another via a nozzle or orifice. The case of a liquid
migrating from one liquid filled space to another is usually treated in most undergraduate textbooks on fluid
mechanics and involves the application of the unsteady Bernoulli equation for incompressible flow. The case of a
gas bleeding from a high pressure to a low pressure is discussed in this note. The more complicated problem of a gas
migrating into a liquid filled space requires solution for the complete understanding of the SCP problems. This is
indicated as a subject for further work.
The following describes a method to estimate the time taken to bleed a closed volume containing gas. Let
Va represent the volume of the annulus. Let the gas be at an initial pressure pi, and let p(t) denote the pressure of the
gas in the annulus at any time t after the bleed off valve is opened. We wish to determine the time taken for the gas
to vent to atmospheric pressure via a bleed valve whose flow area is denoted by A. We assume that the bleed off
takes place at constant temperature. If T is its temperature, assuming that the gas is perfect, we can write
( ) ( )RTttp ρ= (C1)
where ρ(t) denotes the gas density in the annulus during bleed off. R denotes the gas constant for the gas and is
given by
gasMR Λ
=
where Λ denotes the universal gas constant (49,720 ft2/s2/oR) and Mgas denotes its molecular weight. Multiplying
both sides of the above equation by the volume of the annulus, we get
( ) ( )( )RTtm
RTVttpV
a
aa
== )(ρ
where ma(t) denotes the mass of the gas in the annulus at time t. Differentiating both sides with respect to time, we
get
( )dt
dmVRT
dttdp a
a
= (C2)
The term on the RHS of the above equation is the instantaneous mass of gas in the annulus and depends on
the influx and efflux of mass into the volume. Conservation of mass requires that
outin
a mmdt
dm−=
(C3)
where inm and outm denote the mass flow rate of gas into and out of the annulus respectively. The mass flow rate out
of the annulus is given by

I:88
( ) ( ) ( )tvtAtmout ρ= (C4)
where A is the flow area of the nozzle and v(t) is the instantaneous velocity through the nozzle. The velocity v(t) is
obtained by applying Bernoulli’s equation for isentropic isothermal flow from a pressure p(t) to atmospheric
pressure, patm. Neglecting gravitational effects, the velocity of efflux through the nozzle is given by
( ) ( )
ρatmpp
tv−
=2
(C5).
Substituting the expression for velocity in Eq. (C4) and then in Eq. (C2), and simplifying, we get
( )atm
ain
a
pppV
RTAmVRT
dtdp
−−=2
. (C6)
It is convenient to nondimensionalize the above equation by introducing dimensionless pressure and time
as defined below respectively:
atmppp =
(C7)
( )RTAVt
ttt
ao 2==
. (C8)
Introducing these dimensionless quantities into Eq. (C5), we get
( )1−−= ppG
tdpd
(C9)
where the dimensionless mass influx is given by
atm
in
ApmRTG 5.0=
(C10)
Therefore, the time taken to bleed off from an initial pressure pi to atmospheric pressure is given by
( )∫
=−−
==1
1atm
ip
ppo ppGpd
ttt
. (C11)
The above expression can be integrated to yield a closed from expression. For the moment, however, we set
the dimensionless mass influx term (G) equal to zero to obtain the following expression for bleed-off from a closed
annulus without influx.
⎥⎥⎦
⎤
⎢⎢⎣
⎡−+== 1ln
atm
i
atm
i
o pp
pp
ttt
(C11)
Figure 21 shows the dimensionless bleed off time curve. The figure shows the bleed off time for an annulus
700 ft long, formed by 4.5 in. OD tubing and a 7 in., 23 ppf casing. The gas at 3000 psi initial pressure and a
temperature of 200oF, takes 2.1 hours to bleed through a ¼ in. diameter nozzle.

I:89
The special case of bleeding the annulus in the presence of a tubing leak (as described in section 5.5) can be
estimated by assuming that the influx into the annulus is of the Bernoulli type. Assuming that the pressure in the
tubing is denoted by pt, by arguments similar to those used for Eq. (C4), we obtain,
( )( ) ( )⎩
⎨⎧
>−<
=tppppA
tppdt
dmttl
tin
,2,0
ρ (C12)
Substituting Eq. (C12) in Eq. (C3), and by using the expression for the mass efflux from the nozzle
calculated previously, we obtain,
( )
dtVRT
pppAdt
dmdp
aatmn
in
2=
−−⎟⎠⎞
⎜⎝⎛
(C13)
Since we are interested in the effect of the leak influx, substituting the expression for the mass flow rate for
tubing pressures greater than the annulus pressures, we obtain,
( ) ( )dt
VRT
pppApppAdp
aatmntl
2=
−−− (C14)
By denoting the ratio of the leak path area Al to the nozzle area An by β, we get,
( ) ( )12 −−−=
ppppppd
RTAVdt
tn
a
β (C15)
Integration of both sides of the equation yields the time required to bleed off from an initial annulus
pressure pi to a final pressure pf, as described by Eq. (3) in section 5.5.

I:90
0
1
2
3
4
5
6
0 10 20 30 40 50 60 70 80 90 100
Dimensionless pressure
Dim
ensi
onle
ss b
leed
off
time
Figure 21 Dimensionless bleed off time for zero mass influx

I:91
Appendix D: Conclusions of the LSU Study
Operator experience on the OCS has shown that Sustained Casing Pressure (SCP) problems can lead to
blowouts of sufficient flow rate to jeopardize a production platform. However, there has been only minor pollution
and no known injuries or fatalities due to problems related to SCP. This study has indicated that further substantial
reductions in the regulatory efforts to manage the SCP problem on the OCS are possible without significantly
increasing the risk of injury to offshore personnel or the risk of pollution.
Industry experience with problems resulting from sustained casing pressure has shown that the most serious
problems have resulted from tubing leaks. When the resulting pressure on the production casing causes a failure of
the production casing, the outcome can be catastrophic. The outer casing strings are generally weaker than the
production casing and will also fail, resulting in an underground blowout. Flow rates through the tubing leak can
quickly escalate if any produced sand is present in the flow stream. Blowouts of sufficient flow rate to jeopardize the
production platform are possible.
About 50 % of wells with sustained casing pressure have pressure on the production casing.
The cause of pressure on production casing is generally easier to diagnose than pressure on one of the outer
casing strings.
Pressure on production casing is generally easier to correct than pressure on the outer strings.
The magnitude of the leak rate is as important as the magnitude of the pressure when determining the
potential hazard posed by sustained casing pressure.
Gas flow or water flow through unset cement in a major cause of sustained casing pressure in the outer
casing strings, outside of the production casing.
Channeling of formation fluids through unset cement from high pressure zones to low pressure zones
becomes more likely when the casing setting depth is extended by drilling ahead with mud densities approaching the
equivalent density for formation fracture in the upper part of the open borehole.
Portland cement is a brittle material and susceptible to cracking when exposed to thermally induced or
pressure induced tensile loads. Experimental test results indicated that all cement systems tested exhibited one or
more failure modes.
About 10 % of the casing strings exhibiting sustained casing pressure are intermediate casing strings.
About 30 % of the casing strings exhibiting sustained casing pressure are surface casing strings.
About 10 % of the casing strings exhibiting sustained casing pressure are conductor casing strings.
Only about one-third of the casing strings exhibiting sustained casing pressure are in wells that are active
and producing.
None of the remedial procedures to stop flow through cement outside of casing have been shown to be
effective.
About 90 % of sustained casing pressures observed are less than 1000 psi in magnitude.

I:92
More than 90% of all sustained casing pressures observed are less than 30 % of the minimum internal yield
pressure (burst pressure) of the casing involved.
The regulatory burden associated with managing the sustained casing pressure problem on the OCS was
significantly reduced by a series of LTL’s issued since 1991.
Further substantial reductions in the regulatory efforts to manage the sustained casing pressure (SCP)
problem on the outer continental shelf (OCS) are possible without significantly increasing the risk of injury to
offshore personnel or the risk of pollution.

I:93
Appendix E: An Example Tubing Running Procedure
The following is excerpted from Allan and Roberts, (1989).
Adequate thread cleaning to assure removal of all sand, dirt and dried thread dope is the key to proper
connection make-up and pressure-tight strings. The following procedure describes a field-proven technique for
proper thread cleaning and running practices for high strength tubing with the couplings removed.
Remove the thread protectors.
1. Clean the threads with kerosene and a wire brush; satisfactory cleaning requires complete removal of all dope, dirt, sand and other foreign material to 100 percent bare, shiny steel. The use of kerosene in a compressed air spray gun operating off the rig air system or from a portable unit is also satisfactory method and will accelerate job completion. If steam is available, steam cleaning is an excellent method.
2. Dry the threads with clean rags or compressed air.
3. Re-install clean thread protectors on the dry pin ends.
4. Apply thread compound to the male threads at the box end of the tube.
5. Install and make-up tubing couplings manually with about 300 foot-pounds of torque using special friction-type tongs to eliminate notching. (Installing the couplings before picking up the tubing minimizes the possibility of dropping the string, in the event slippage occurs between the pipe and the elevators as the joint is lowered in the derrick.)
6. Wash all dirt off the ramp and catwalk.
7. Roll one joint of pipe at a time from the upper tiers onto wooden sills placed across the catwalk. Roll pipe slowly and maintain control at all times to prevent colliding of joints.
8. Steel thread protectors should remain on the pin ends of the pipe while picking up pipe from the catwalk.
9. While picking up each joint from the catwalk with a plaited pickup cable and air hoist or cathead, use a snub rope attached to the pin end to enable one man to restrain lateral motion of the joint and minimize contact between the pipe and ramp. Minimizing contact between the pipe and ramp by snubbing should permit the use of clean plastic bucket over the box end as a dirt deflector. A rope hold-back should also be used at the “V” door to catch the lower end of the joint as it swings on to the derrick floor.
10. With the box end of the joint resting on the derrick floor, remove the plastic bucket and use dry compressed air or clean, dry rags to remove sand or other foreign material from the dry box threads.
11. After the traveling block pulls the joint up to a vertical position using a plaited pickup cable, remove the pin-end thread protector. Some new pipe has loose mill scale inside which should be allowed to fall out prior to stabbing to minimize contamination of clean threads. Use dry compressed air or clean, dry rags to remove mill scale or other foreign material which may accumulate on the dry pin-end threads while picking up the joint. Apply a light coat of thread compound to clean pin-end threads and make up the joint.

I:94
Appendix F: Attachments 1, 2, 3 & 4
Attachment 1 SPE 23136 The Occurrence of Annulus Pressures in the North West Hutton Field: Problems and Solutions Attachment 2 Field Trial Results of Annular Pressure Behavior in a High-Pressure/High-Temperature Well Attachment 3 SPE 21727 Methods of Detecting and Locating Tubing and Packer Leaks in the Western Operating Area of the Prudhoe Bay Field Attachment 4 Oil & Gas Journal Designing and Running Pipe

SECTION II: TUBING AND CASING CONNECTION SEALING
TECHNOLOGY

II:1
1) Tubing and Casing Sealing Technology
The drilling and completion of an oil or gas well requires the use of several sizes of pipe. During the
drilling of a well, pipe is used to stabilize the soil through which the well is being drilled and to establish the well.
This pipe is referred to as drilling casing and typically can have pipe diameters from 30” to 9-5/8”. As the well is
drilled deeper, additional pipe, referred to as production casing, is installed inside the first pipe and is used to protect
the well in the event there is a leak in the production tubing. Production casing pipe is typically between 9-5/8” to
5-1/2”. The last string of pipe installed in the well is the production tubing and is the pipeline through which the
well is produced. This pipe size is typically between 5-1/2” and 2-3/8”.
All of these pipe sizes are run into the well in lengths of 16 feet to 48 feet. These joints of pipe are joined
together with threads that are machined onto the ends of the pipe. Two thread connection designs are used. The
most common connection includes a coupling that contains female threads in both ends. The two ends of the pipe
are finished with male threads and they screw into the coupling ends. The other connection design has a male thread
on one end and a female thread on the other. The pipe is run into the well by simply screwing the male end into the
female end.
All tubing and casing connections include threads to structurally hold the pipe string together. All
connections also have sealing mechanisms that contain the internal fluid pressure and the external fluid pressure.
For tubing, the internal fluid is the oil or gas being produced by the well and the external fluid can be drilling mud,
treated fresh water or brine. For casing, the internal and external fluid is typically drilling mud, treated fresh water
or brine, or cement if the casing has been cemented into the hole. The threaded connections must be able to provide
a pressure barrier between the inside fluid and outside fluid. In some well conditions the inside pressure is greater
than the external pressure and in other well conditions the external can be greater.
There are three types of sealing mechanisms used in tubing and casing connections-
• Thread seal – typically used in applications below 275°F and pressures up to approximately 4,000 psi
• Elastomer seal – same applications as the thread seal
• Metal-to-metal seal – typically used for higher temperature and pressure, above approximately 275°F and 4,000 psi
1.1) Thread Seal
The most commonly used connection seal mechanism is the threads themselves. Over the years, the
petroleum industry has standardized on two thread sealing connections, 8 Round thread and Buttress thread. Both
are coupled designs and are included in the American Petroleum Institute standards and specifications. The 8 Round
thread is a tapered thread with 8 threads per inch and a thread height of 0.071”. Thread engagement occurs on the
two flanks, which are tightly maintained by connection assembly with a power tong that is used to screw the two
pieces tightly together, or “power tight”, to a desired thread interference. The 8 Round thread shape has rounded
roots and crests that when engaged have a small clearance that varies between 0.000” and 0.006”. The thread is
shown in Figure 1. A lubricant is applied to the threads, referred to as the thread compound, and is required to

II:2
perform several functions. The compound must (1) serve as a lubricant with a consistent friction factor so that
makeup to a specified torque range can be achieved; (2) provide resistance to galling to prevent tearing of the metal
thread flanks and (3) plug the root to crest clearance in order to maintain sealing integrity.
API recently included a Supplementary Requirement, SR-22, that improves the sealability of the 8 Round
long thread connection (LT&C). This improvement is referred to as “Enhanced Leak Resistance LTC” and while
pressure ratings are not given, SR-22 generally included internal pressure equal to the smaller of the API Minimum
Internal Yield Pressure or 10,000 psi, and tension loads up to 62.5% of the API connection jumpout strength, with
sealing performance to be verified by the user. The SR places many additional requirements on the 8 Round
connection, including tighter thread taper tolerances, tin plating, specific application of thread compound, increased
number of power tight turns and other requirements.
The API Buttress connection is also a tapered thread design with 5 threads per inch and a 0.062” thread
height. The roots and crests are parallel to each other and, similar to the 8 Round connection, are tightly engaged
power tight to a desired thread interference. The buttress thread shape and dimensions result in a stab flank
clearance of 0.000” to 0.007” and is shown in Figure 2. Similar to the 8 Round connection, a thread compound must
be used that provides the same three characteristics, only with the Buttress thread the compound must plug the
relatively large stab flank clearance and possibly a small root to crest clearance, depending upon thread height
tolerances. Therefore, sealability of both the 8 Round connection and the Buttress connection are highly dependent
upon the thread compound.
API is currently reviewing the possibility of improving the sealability of the Buttress connection. A new
workgroup has been formed and is evaluating possible improvements that may result in a SR for Buttress improved
leak resistance.
1.2) Elastomer Seal
Some connections, including API 8 Round and Buttress, include an optional elastomer seal. This is a
secondary seal that is located in a groove machined into the coupling threads. The seal consists of a relatively thin
ring that is tightly contained in the threads and provides a separate barrier between internal and external fluid
communication. The API seal ring is made from virgin Polytetrafluoroethylene (PTFE) (TeflonTM) and is 25%
fiberglass filled for added strength. Figure 3 shows the API 8 Round and Buttress connections with the optional seal
ring.
1.3) Metal to Metal Seal
The most effective pressure seal is a metal-to-metal, MTM, seal. For threaded connections, most MTM
seals are located on the end on the male member, or pin end. As the connection is screwed together, the threads
engage first, followed with the meal to metal seal and typically final makeup is provided with a torque shoulder that
is usually located at the end of the pin, end of the box (female member) or in the threads. MTM seals usually have a
greater radial interference than thread interference. Seal width can be relatively long, about ½”, or narrow, about
1/32”. Longer seals may require the thread compound to fill in the small grooves machined into the pin surface.
II:3
Narrow seals do not rely on thread compound for pressure integrity, but do need the compound for galling
resistance. Properly designed MTM seals provide internal pressure sealing equal to the burst pressure of the pipe
body at tension loads up to the yield load of the pipe body and in some cases to ultimate failure of the pipe.
MTM seals are used on “premium“ connections which are defined as proprietary (non API) connection
designs. Figure 4 shows the overall geometry of a typical premium connection and metal seal. One exception to
premium connections being proprietary is the API Extreme-Line connection, which is described in API
specifications but is rarely used in the Gulf of Mexico.
1.4) Connection Thread Compound Sealing Performance Requirements
ISO 13678, titled “Petroleum and natural gas industries – Evaluation and testing of thread compounds for
use with casing, tubing, and line pipe”, addresses the performance requirements for threaded connection service.
Excerpts from this specification were provided by Mr. Herschel McDonald, a consultant in thread compounds and a
member of this workgroup, as follows:
Excerpts from ISO 13678
Thread compound sealing performance requirements
-adequate sealing properties for thread type seal connections and/or not inhibiting the sealing
properties of non-thread sealing connections (e.g. metal-to-metal seals, polytetraflouroethylene (PTFE)
seals etc.) depending upon service requirements;
Fluid sealing properties
A primary purpose of a thread compound, when used on thread sealing connections, is to provide
fluid sealing for thread clearances, such as the helical root-to-crest clearances in ISO/API 8-round threads
and the helical stab flank clearance in ISO/API buttress threads. Sealing is typically accomplished in a
thread compound with solid particles that agglomerate to plug the thread clearances to prevent the
contained fluid from passing through the connection.
Connection sealing also requires that positive contact pressure be maintained along the thread
interface in order to ensure the geometric integrity of the helical sealing passages. Contact pressure
requirements are established for connection fluid pressure integrity and are found in ISO 10400.
For specific service applications, the total thread compound connection system should be
evaluated for fluid sealing integrity on full-size connections. While it is important for a thread compound to
provide fluid sealing for thread clearances on ISO/API connections, it is also important that the thread
compounds do not inhibit the sealing integrity of proprietary connections that have metal to metal seals.
The solid particles that agglomerate may prohibit the designed mechanical seals (metal to metal) from
efficiently contacting, resulting in a leakage path. Sealing tests should therefore be conducted on the thread
compound/connection system, of which the thread compound is a part.
II:4
Additional comments
API modified thread compound and most of the proprietary environmental compounds that are currently
marketed, are intended for the lubrication and sealing of API connections, i.e. an open leak path formed by the
thread clearances in both 8-round and buttress connections. Typically the volume percent solids of these compounds
range from 20 - 30% and the maximum particle sizing of the solids can be as much as .025". A high percentage of
solids and relatively large particle sizes are necessary to effect a seal for these connections, especially at high service
temperatures and pressures. The buttress thread form presents a particularly difficult problem, not just because of
potentially large thread clearances that can be as much as .009" x .063" but because of the opening and closing of
the thread flank clearances during stabbing, power make-up and tension as the pipe is run. For these reasons, BTC
connections require high-solids, coarse-particle compounds for effective leak resistance.
Conversely, connections designed with a mechanical seal mechanism (premium connections) do not rely on
the compound for sealing integrity but rather for galling resistance during make-up and break-out, and for
lubrication to allow proper engagement of the connection members. The high-solids compounds required for sealing
of API connections can in fact inhibit and restrict the proper make-up of premium connections by effecting a seal in
the threaded area of the connection. The hydraulic pressure resistance due to the compound trapped in the threads
will prevent proper seal-face contact during initial make-up. During field service at high temperatures, pressures and
tension, the trapped compound will eventually be extruded and a leak path will develop. For mechanical seals, a
low-solids, small-particle compound should be utilized.
As stated above in the excerpts from ISO 13678, it is critical that the sealing performance be established for
the total compound/connection system that is defined in ISO 13678 as follows:
Thread compound/connection system: A system that consists of the various critical connection
components including the specific connection geometry, and the individual connection materials and coatings
combined with the thread compound.
It is critical that a thread compound is selected that has properties compatible with the geometry and the
designed sealing mechanism of the connection in question.
1.5) Connection Testing Procedures and Leak Rates
Over the past 15 or so years several tubing and casing connection testing procedures have been provided by
major oil companies and standardization groups. Some of these are summarized in Table 1, with selected pages
from each given in the indicated Appendix.

II:5
ATT. NO. CODE TITLE
ALLOWABLE LEAK RATE COMMENTS
MAJOR OIL COMPANY CASING TEST PROCEDURES 1 Britsh Petroleum -
Miller approx.1990
Production Tubular Testing Requirements for Miller Development
Any persistent leakage shall
constitute specimen failure
Detailed connection test procedure.
2 Statoil - 1991 Qualification Test Procedure for Premium Connection
Any persistent leakage shall
constitute specimen failure
Detailed connection test procedure.
3 Shell Europe - 1991
NAM TEO/3 Test Procedure for Tubing & Casing Connections
.001 acc/sec Detailed connection test procedure.
MAJOR OIL COMPANY CASING TEST PROCEDURES 4 Exxon Production
Research - 1992 Evaluation of Premium Threaded Connections Using Finite Element Analysis and Full-Scale Testing
No criteria Generic connection test procedure.
5 AGIP approx. 1993
Test Procedure for Connection Evaluation
Successful if no leakage of gas
occurs
Detailed connection test procedure.
6 ARCO China - 1993
Performance Test Program for 7" 29 lb/ft L80-13Cr NK3SB Premium Connection Production Tubulars
Leakage will constitute failure of
connections
Detailed connection test procedure.
7 Mobil Oil - 1997 Qualification of Coupled Premium Connections
.001 acc/sec Detailed connection test procedure.
CURRENT INDUSTRY STANDARDIZATION GROUPS 8 API RP 5C5 -
1991 Evaluation for Casing & Tubing
Connections (downhole) None listed Detailed connection test
procedure. 9 ISO DIS 13679 -
2000 Pet. & Nat. Gas Test Procedures for
Casing & Tubing Connections .001 acc/sec Detailed connection test
procedure.
Table 1 - : Connection Testing Procedures and Leak Rates
All of these procedures are concerned with the structural and sealing integrity of threaded tubing and casing
connections. With regard to a leak criteria or leak acceptance guideline, of the nine procedures listed above, two do
not give any leak criteria, four require “no leaks” and three list a maximum acceptable leakage limit of 0.001
atmosphere cc/second. The fact that only three procedures give allowable leak rates, and API is not included, shows
that there is no industry accepted leak rate. The anticipated acceptance of ISO DIS 13679 will give the first
petroleum industry tubular connection test procedure that provides an allowable leak rate. The internal pressures
included in these test procedures are related to the internal yield pressure of the pipe and can vary from about 7,500
psi to 20,000+ psi. While these procedures can apply to both oil and gas, in most cases gas is the required internal
test fluid. These procedures also include elevated temperatures to 350°F.

II:6
ISO DIS 13679 was written over a period of several years that included three to four meetings each year.
During one of these meetings, Mr. W. H. P. M. Heijnen, formerly with Royal Dutch Shell The Hague and currently
with BEB, a German petroleum operating company, presented information to the ISO workgroup that gave a
simplified example of casing annulus pressure build-up over time as a function of leak rate. This example is shown
in Figure 5 and shows various pressures in time for a 3000 meter long tubing string. The production casing is
assumed to be 7” and 7-5/8”. The plot shows that a leak rate of 0.001 standard cc/sec would result in negligible
increase in annulus pressure with time. A much larger leak rate of 1 standard cc/sec would produce a greater
pressure increase, which in one year could be 3,000 to 4,500 psi if left unattended. This information was
instrumental in ISO DIS 13679 specifying a maximum allowable leak rate of 0.001 cc/sec.
Additional information regarding leakage is given in the book “Industrial Sealing Technology” by H. Hugo
Buchter, with several pages of this book given in Attachment 10. Mr. Buchter states that “zero leakage …is
misleading because an accepted definition of the term is nonexistent. In general practice a zero leakage
specification is an indication to use polymeric seats or seals. Metal-to-metal seals generally fail to meet this
requirement. An exception is in gaskets for static conditions where metal is plastically deformed to obtain a leakage
of less than 10-8 atmospheric cm3/sec helium”. He later states that NASA’s definition of zero leakage is no more
than 1.4 x 10⁻³ standard cm3/sec of GN2 at 300 psig and ambient temperature. This definition is very consistent with
the new ISO DIS 13679 accepted leak rate of 1.0 x 10⁻³ standard cm3/sec of GN2 at test pressures much higher than
300 psig, typically 6,000 to 20,000 psig, and temperatures of 275°F to 350°F.
Mr. John Greenip of Hydril Company provided a summary of excerpts to the ARPTD steering committee
which is given in Attachment 11. It is dated February 8, 2000 and gives a very good quick overview of seal
technology.
A more in-depth discussion of thread seals, metal-to-metal seals and leak rates is given in the 1985 SPE
paper 14040, “Sealing Tubular Connections”, by C. A. Bollfrass, and is given in Attachment 12.
1.6) Testing of Tubular Connections During Running
Several methods are available for testing tubing and casing threaded connections when running the strings
of pipe into the well. One method provides an internal pressure test of the full connection by inserting an internal
assembly that seals on the pipe ID on both sides of the connection and then applying internal helium gas pressure to
the connection. A helium gas sniffer is used to detect a leak on the outside of the connection.
Another method utilizes a seal assembly that clamps over the tubular connection and seals on the pipe OD
and coupling OD of each connection. A version of the same test tool seals just above and below the joint in integral
joint connections. A small volume of external water or gas pressure is then applied to the connection and leakage is
determined by a decrease in the applied test pressure. This same method is also available for the mill end
connection for use in the pipe mill. Because of the small external areas that are exposed to the test pressures using
this tool, this test method apparently does not result in the types of radial distortions during testing that can result
from pressuring the entire connection and adjacent tubing/casing in the connection area.
II:7
A third method detects connection leakage using a device that clamps to the OD of a coupling. When
internal pressure is applied to the connection, the radial displacement of the coupling at the metal-to-metal seal is
compared to the radial displacement at the threads and a relative difference as determined by experience can detect a
connection leak or potential leak.
A fourth method applies to API 8 Round connections only and maintains sealability by monitoring torque
and turns to a specified range of makeup. Values of torque and turns past hand tight makeup are recommended for
various pipe sizes, weights and grades along with recommended thread compound.
A review of the results of the “Participant Survey” in the “Pressure Testing” section of Appendix A.4 of
Section I of this document reveals the following:
1. Testing of Production Casing:
• Operators participating in this study reported that they always test their completed casing
strings, subsequent to running and cementing.
• MMS requirements apparently call for testing of production casing strings to 70% of their
minimum internal yield pressure after running and cementing.
2. Testing of Production Tubing:
• Some of the operators participating in this study reportedly always test their tubing
strings after running.
• Some of the participating operators reported that they “sometimes” test tubing strings
after running.
3. Testing of Individual Connections While Running:
• Testing of individual tubing/casing connections while running did not appear to be a
common practice among the operators in this study.
• When the participating operators did test while running, they apparently tested primarily
using test tools that pressured the inside of the connections.
1.7) Corrective Action for SCP
“Corrective” actions that may be taken in response to SCP include the following:
1. After an appropriate risk analysis, do nothing.
2. Install a mechanical remedial seal across the leak in the tubing or casing.
3. Pull the tubing and replace the failed connection or down-hole tool.
4. Inject a weighted fluid into the annulus experiencing SCP.
5. Inject a down-hole chemical leak sealant.

II:8
One of the participants in this study supplied the following information concerning SCP corrective actions:
1. Mechanical remedial seals include:
• Tubing and casing straddle packers
• Tubing and casing “patches”
2. Mechanical remedial seals are available from a number of suppliers, including:
• Halliburton
• Schlumberger
• Owens Tools
• Mesquite Oil Tools
• PES
• HPI Tools
3. Manufacturers/suppliers of downhole chemical sealants were identified as:
• Furmanite
• Oil Center Research
• Dow TRV
• Utex Industries
• Seal-Tite International.
SES’s review of a recent (1998-1999) edition of the Composite Catalog revealed these additional sources of
straddle packers and casing/tubing patches:
1. Straddle Packers:
• Cardium Tool Services
• Double-E, Inc.
• Drillflex
• EVI Oil Tools
• McAllister Petroleum Services
• TAM International
2. Patches (Casing & Tubing):
• Cardium Tool Services
• Drillflex
• Gotco International
• Weatherford.

II:9
A short list of published articles dealing with leak remediation is included in Attachment 13 of this Section.
Information documented in the “SCP and Corrective Action” section of Appendix A.4 of Section I of this document
shows that the Operators participating in this study felt that successful techniques for repair of leaks included:
1. Tubing/casing packers and patches
2. Replacement of tubing strings.
Techniques with which the Operators in this study had had limited success included:
1. Injection of liquid sealants
2. Displacement of weighted fluids into the annulus experiencing SCP.

II-10
Figure 1: API 8 Round Tubing & Casing connection

II:11
Figure 2: API Casing Buttress Thread Connection

II:12
Figure 3: API Connections with Optional Seal Rings
AP
I BU
TT
RE
SS
CO
UP
LIN
G
PIN
PIN
AP
I 8 R
OU
ND
CO
UP
LIN
G
PIN
CL
OF
CO
NN
EC
TIO
N
CL
OF
CO
NN
EC
TIO
N
PIN
TE
FL
ON
SE
AL
RIN
G
TE
FL
ON
SE
AL
RIN
G
TM
TM

II:13
Figure 4: Typical Premium Tubing & Casing Connection

II:14
Figure 5: Effect of leakage rates of 1 cc/sec and 0.001 cc/sec on the rate of increase of annular pressure

II:15
Appendix A, Attachments 1 through 13
Attachment 1 Production Tubular Testing Requirements for Miller Development Attachment 2 STATOIL Technical Standard Qualification Test Procedure for Premium Connection Attachment 3 NAM TEO/3 Test Procedure for Tubing and Production Casing Connections Attachment 4 ADC/SPE 23904 Evaluation of Premium Threaded Connections Using Finite-Element Analysis and Full-Scale Testing Attachment 5 Agip S.p.A. TEPR 708307 S 206 Attachment 6 Arco International Oil and Gas Company (AIOGC) ARCO China, Yacheng Field Development Performance Test Program for 7” 29lb/ft L80-13Cr NK3SB Premium Connection Production Tubulars Attachment 7 Qualification of Coupled Premium Connections for Mobil Oil, Rev. 5.2, July 8, 1997 Attachment 8 API Recommended Practice 5C5, Second Edition, November 1996 Recommended Practice for Evaluation Procedures for Casing and Tubing Connections Attachment 9 ISO TC 67/SC 5 Petroleum and natural gas industries – Testing procedures for casing and tubing connections – Recommended practice

II:16
Attachment 10 Industrial Sealing Technology by H. Hugo Buchter Excerpts from Chapter 1: Gaskets and Devices for Static Sealing Attachment 11 Excerpts from Papers on Pressure Sealing Technology Compiled for ARPTD JIP Attachment 12 Journal of Petroleum Technology Sealing Tubular Connections by C. A. Bollfrass, SPE Attachment 13 Articles Dealing with SCP Remediation
1. SPE Paper No. 23136
“The Occurrence of Annulus Pressures in the North West Hutton Field: Problems and Solutions”
2. SPE Paper No. 24986
“Through Tubing Remedial Treatments Using a Novel Epoxy Resin System”
3. SPE Paper No. 55996
“Use of Pressure Activated Sealants to Cure Sources of Casing Pressure”
4. SPE Paper No. 59026
“Leak Sealant in Hydraulic Systems Minimizes Maintenance Costs in Offshore Wells”
5. OTC Paper No. 11029
“Sustained Casing Pressure in Offshore Producing Wells”

SECTION III: BASICS OF STRING DESIGN AND MORE ON
SEALING TECHNOLOGY

III:1
1) Introduction
The intent of this section is to provide a practical discussion of SCP that results from downhole equipment
malfunction and/or failures. The preparer of this section, Magnolia Global Energy (MGE), was asked to focus on
components of the production string, other than the connections, that can (and do) sometimes cause leakage into or
out of the primary annulus. This paper is a part of a composite document being prepared to address the causes,
remedies, and issues of sustained casing pressure.
Beyond the scope of our paper is the risk associated with SCP. Every operator will have unique approaches
to dealing with SCP and the assessment of risk. MGE recommends that further work be done to provide the
framework for a uniform approach to risk assessment and the decision making process. Analysis, such as decision
trees could be developed for the most common types of well construction equipment. Decisions on how to deal with
SCP and equipment malfunctions often result in the decision to operate and maintain acceptable limits of SCP or
well intervention to remove and replace or isolate the troubled equipment and leak sources.
This paper will describe the typical sources of SCP with regard to the more common well construction
equipment. The well construction basis of design for tubulars and equipment vary in approach and operator
protocol. Our experience is that most all GOM operators ascribe to the American Petroleum Institute’s (API)
product specifications as a “basis of design” in well construction. These include the more common specifications for
wellhead/tree, subsurface safety valve, and tubular products.
A more thorough examination of the API product specs is offered in the section “Basis of design”.
Product workmanship and materials, as well as wellsite operational techniques are all key variables to the
issue of SCP.

III:2
2) Scope, Objectives, Approach
This paper provides a discussion on the issues of SCP as a result of equipment malfunction and/or failure;
the end result being a leak path to the primary or secondary annuli.
2.1) Scope
Our discussion will be limited in scope to that equipment typically found in a Gulf of Mexico (GOM)
producing well. Both near surface and downhole equipment are addressed. The basis of design for equipment is
provided as found in both industry standards and the equipment manufacture’s proprietary methods. In particular we
have focused on the proprietary analytical methods to address internal/external pressure ratings for equipment
capacity determination.
Elastomer materials are found through out the design of well construction equipment. The basis of design
for equipment using elastomers as a pressure barrier is discussed further in the section ”Basis of Design”.
2.2) Objectives
The objective of this paper is to identify the potential sources of equipment leaks. By examining the basis
of design for this equipment, an appreciation is gained as to the importance of design verification and validation
prior to equipment installation.
2.3) Approach
We first met with principals of Stress Engineering Services to gain insight into the project objectives.
Drawing upon our experience and reviewing the literature became the basis of our approach, with a focus on the
analytical and design aspects of each equipment examined.

III:3
3) Annuli in the Well Construction Process
Oil and gas well construction involves design, materials, and operational aspects. Equipment and tubulars
typically make up close to thirty percent of the authorized field expenditure (AFE) in the construction process.
Equipment reliability is of paramount concern to the return on capital expended by the operator. Pressure integrity
of the primary annulus is a function of:
• tubing and connections
• tubing hanger, connections, seals
• tubing head; hanger seal area
• downhole tubing accessories
• production head; hanger seal area
• production casing hanger, connection, seals
• production casing and connections
• production liner, connections
• production liner hanger equipment, connections, and sealing accessories
• production packer, connections, and sealing accessories
A host of downhole equipment can be used in the well construction process depending on production
objectives. Several pieces of the equipment are illustrated in the accompanying pictorial.
By definition, an annulus is “the space between two concentric circles on a plane”. For oilfield purposes,
we will consider the annulus as the volume of space between tubulars sealed at the top and bottom. There are many
potential leak paths in the annulus. Pressure integrity in the annulus is dependent upon:
• equipment design and function
• human competency during equipment installation
• tubular design and function- during drilling, completion and production
• tubular connection make-up
• tubular’s running and handling
• primary cementing of annulus (where applicable)
Annulus mechanical integrity differs from pressure integrity. The physical loads imposed upon equipment
and tubulars must be evaluated in the well construction design process.
Thermal expansion and contraction of tubulars and equipment during the life of the well produce
pressure/loading variances, which can lead to abnormal pressures in the annuli. Often annular pressure buildup can
be relieved by bleeding off operations at the wellhead. When or if the pressure returns the well is characterized with
sustained casing pressure.

III:4
4) Basis of Design
In general, most oilfield equipment is designed by their manufacturers according to proprietary means. In a
few commodities, industry standards exist such as API (American Petroleum Institute) product specifications that
have been developed jointly among manufacturers and end-users. The use of these standards is optional by the
manufacturer. API product standards, such as API 6A (wellhead and trees), 17D (subsea wellheads), 14A
(subsurface safety valves), etc. have established safety (design) factors. Based on working stress design (WSD)
these product specifications have established working pressure ratings which are less than the “test” pressure
requirement; a safety factor such as 2.0:1.0 for wellhead /trees and 1.5:1.0 for subsurface safety valves.
It is well recognized among knowledgeable consumers that these safety factors are not based upon
minimum material conditions (MMC). MMC represents the worst case manufacturing physicals, such as, minimum
material strength and machined tolerances.
4.1) Connections
Equally important in consideration of the basis of design in oilfield equipment is the use of non-API
connections, so-called proprietary and premium connections (thread form design). A common connection in
downhole tools design is the API 8 and 10 rd EUE and buttress thread forms. Very often these same manufacturers
will have to resort to the use of other thread forms in order to meet geometry limitations, such as “stub acme: with
an elastomer 0-ring. The demonstrated performances of these non-API standard thread forms (e.g. proprietary) are
left to the manufacturer, with safety factors being proprietary in nature.
4.2) Quality
API product specifications generally advocate certain minimum quality controls to ensure the basis of
design has been demonstrated on production units; that is in the manufacturing cycle. The so-called non-
standardized (e.g. non-API) products will have varying degrees of quality controls among manufacturers. Quality
control is the “conformance to specifications". The specifications for design, materials, quality, etc., are usually
found in the “quality plan” (or manufacturing inspections plan) generated by the manufacturer.
In attempting to meet API product specifications, a manufacturer attaches the appropriate API “monogram”
(e.g. symbol of quality). The use of the monogram is entirely optional, and its use has been historically market
driven by the major E & P companies. All too often the end-user is told that the “use of the monogram” will cost
him more than if he were to accept the product without it. This is patently false. The prudent product manufacturer
adheres to accepted industry practices and standards with regard to the documentation (e.g. so called paper trail)
during process of manufacture. Thus, the applications of the “monogram”; the API licensing fee paid and quality
audit having been met; costs nothing more.

III:5
4.3) Verification of Design Basis
API product specifications have established demonstration criteria (e.g. tests) as verifiable means to
establish and record equipment performance ratings. These test criteria will vary according to the standard (product
specifications) in terms of basis of design verification.
Pertinent to the study of oilfield equipment and sustained casing pressure (SCP), and with attention to
wellhead components, the API 6A states, “casing hangers, tubing hangers, lock screws, and stems shall be designed
to satisfy the manufacturer’s documented performance characteristics and service conditions. (Ref. API 6A, 17th
Edition, Nov. 1999, Sec. 4.3.2). The manufacturer shall specify methods to be used in design, which are consistent
with accepted engineering practices”.
We will revisit the subject of “accepted engineering practices” later in this section. API 6A further
advocates the use of distortion energy theory method for design calculations for pressure containing equipment.
“Rules for the consideration of discontinuities and stress concentrates are beyond the scope of the paragraph:” (ibid,
Section 4.3.32) Upon examination of any oilfield equipment design, it is often discontinuity and/or stress
concentration that can be attributed to a product’s failure to meet its intended function. It is generally accepted that
the higher the state of stress the lower the reliability. Mobil E & P Services Inc, (MEPSI) conducted a pilot study
(1985-90) of equipment failures in the GOM over a five-year period. Failures were categorized by commodity and
either design, material/workmanship, and/or human error. Over thirty five percent of equipment failures were
attributable to design errors. It should also be pointed out that most of the recorded failures were in the non-API
equipment variety. A Shell International E & P (The Hague) study by W. Wilhem, as presented to the ISO TC67
stated similar findings with 30% failures attributable to design aspects of oilfield equipment. In fact, it was this
study and Shell’s presence in the promotion of ISO equipment standardization that led to the formation of a work
group (WG4) to address the development of accepted industry practices for design verification in the non-API
equipment categories. Design verification methods and their use vary greatly in our industry among the
manufacturing community.
Accepted alternatives to analytical design verification are empirical methods, i.e. physical testing.
Common to most testing criteria is the use of test specimens manufactured at “as built” tolerances. One can
appreciate that the inherent performance of any equipment is dependent upon its final geometric state and physical
properties. It is reasonable that an end-user could expect to consume goods at minimum, nominal, or maximum
manufacturing state. To test at minimum material conditions would be a costly and time consuming effort.
However, some manufacturers do precisely that in their testing programs. Others achieve similar results by
adjusting the test pressure conditions to compensate for “as built” tolerancing (e.g. API-RP-43, 6th Ed., Sec. III).
The API 6A specification for wellheads and christmas trees does not specify that test conditions be at any
specified state; minimum, nominal, or maximum, with generous safety factors (i.e. 2.0:1.0 and 1.5:1.0) specified.
This issue of non-standardized products with propriety design verification methods should be of concern to
the consumer attempting to characterize equipment performance.

III:6
Meeting the consumers intended well conditions may or may not be achievable in the products current
design. Often safety factors do not address combined loading conditions. API 6A states “the effects of external
loads on the assembly of components are not within the scope of this document” (ibid, Sept. 44.2.1c).
A good example of the relationship of combined pressure (load) and mechanical induced loading
(tension/compression) is illustrated in the graphical representation of a production packer (see the figure in the
appendix).
It is appreciated that external loading can affect the packer’s pressure rating. Much too often equipment
ratings are advertised without the consumers full knowledge of the true performance limitations. This has been
recognized in the new emerging International Standard for oilfield packer and plugs (ISO 14310) with a requirement
that a “performance envelope” (e.g. graph) be furnished to the end-user by the manufacturer. This represents an
industry first in standardization, as this data is to be included within the packaging of these products. The
performance envelope is a graphical representation of the test results as specified in the “validation level”. The
consumer can easily plot these loading conditions within or outside of the performance boundaries of the graph.
4.4) Elastomer Design
4.4.1) General Comments on Designing Elastomer Systems
Design of elastomeric sealing systems offers a unique technical opportunity. Polymer science is as
intriguing as it is confusing. As engineers, we constantly seek a mathematic model to predict performance. A
number of formulae have been used with questionable success. The state of the industry is that there exists no set of
performance prediction equations that can be used to accurately predict the performance of an elastomer system
operating under downhole tool conditions.
Unlike steel, engineers do not have analytic means to predict elastomer performance. This is true for simple
single element packers as well as complex multi-element packing systems found in today’s packers. Elastomers are
unique in their ability to simultaneously store and dissipate energy via characteristic large strain behavior.
Without digressing too far into the physics and chemistry of elastomers, the following discussion is needed
to understand why elastomers work and why they fail. The primary structure of any polymer is a long-chain
molecule. The typical elastomer has ”spaghetti” like structure with branch groups. Cross-linking (vulcanization) of
two adjacent structures produces the three-dimensional structure. There is a relation between cross-link density and
physical properties. Consider a random chain; fill the open spaces around the chain with numerous other random
chains, then cross-link the chains to form a matrix. When deformed, the matrix behaves much as a deck of cards
when one card slides. In a lightly strained mode, the deformed matrix has sufficient stored energy to return to its
original state.
An elastomer is defined (by ASTM D1566) as "a macromolecular material, which at room temperature, is
capable of recovering substantially in shape and size after removal of a deforming force."

III:7
ASTM D1566 defines rubber as "a material that is capable of recovering from large deformations quickly
and forcibly ... (and which), in its modified state, free of diluents, retracts within one minute to less than 1.5 times its
original length after being stretched at room temperature to twice its length and held for one minute before release."
Consequently, by these definitions, all rubbers are elastomers, but not all elastomers are rubbers. Further,
some plastics qualify as elastomers.
4.4.2) Vulcanized, or Thermoset, Elastomers
• Vulcanized rubber is the most common sealing materials used in the oil industry.
• Prior to vulcanization, the long chained molecules (polymers) making up the rubber are tangled together, but not linked.
• Vulcanization introduces cross-links between the polymer chains yielding structural integrity to the material.
4.4.3) Thermoplastics (or Plastics)
• Thermoplastics are formed by building very long chains of organic polymer. The longer the chains, the heavier and stiffer become the thermoplastic.
• Thermoplastic materials are generally fabricated into their final shape by heating until the material is liquid, and then injecting it into a mold.
4.4.4) Performance Prediction/Design
Classical engineering design and analysis technique allow the straightforward design of structural parts
manufactured from steel, iron, aluminum, alloys and plastics. With knowledge of the physical properties of the
material, a reasonable prediction of the performance can be determined when the part is subjected to tensile,
compressive, burst or collapse forces.
There does not presently exist a recognized, industry accepted, systematic approach to predicting the
performance of elastomeric seals, even at ambient conditions, and when the physical properties of the
elastomer are known. The process gets further complicated with the introduction of the environmental variables
encountered in the oil industry, such as elevated temperatures, reactive fluids, gases, hydrocarbons, corrosion
inhibitors, CO2, and H2S.
Because of these limitations, the best method to determine the suitability of an elastomeric seal is some
form of qualification testing in its proposed configuration at the rated temperature, pressure and environment.
A documented result of elastomeric testing, therefore, forms the basis of supplier confidence in the applicability of
an elastomeric material and configuration for a particular use.
API Bulletin 6J "API Bulletin on Testing of Oilfield Elastomers - A Tutorial” was first issued in February
1992 and is a useful reference on this topic as is the guidelines for testing elastomers in API 6A Appendix F.
4.4.5) Elastomer Hardness
In the oil industry, elastomer hardness is measured on the Shore A Durometer scale. By definition,
Durometer gauges are calibrated to read 100 Shore A when pressed against glass.

III:8
• Soft elastomers are generally considered to be 70D (Durometer) or lower.
• Hard elastomers are 90 Durometer and above.
4.4.6) Hardness Selection
As a rule, soft elastomers are used to achieve low pressure and low temperature sealing, with harder
elastomers being used as the temperature and pressure rise.
• At lower temperatures and pressures, the elastomer needs to provide its own sealing energy (i.e. it needs to be resilient), and consequently a softer elastomer is used.
• Softer elastomers (< 70D) have comparatively lower physical property ratings (shear strength and modulus), so they are better suited for low-pressure applications.
• As temperature is elevated, elastomers soften with accompanying reductions in their physical properties. Consequently, harder elastomers with higher physical property ratings (shear strength and modulus) are preferred for higher temperature applications.
• As differential pressure increases, higher hardness and physical properties are needed to maintain seal integrity. The higher differential pressure also provides seal energy to the material, so that it can affect a seal.
• The harder elements need more compression to achieve a seal, and consequently are difficult to use with retrievable packers at shallow depths.
• Frequently, in seal stacks and multi Durometer packer element systems, a softer Durometer element (70 Durometer) is used in the center, with harder (90 Durometer) elements on each side of the softer element.
• At higher temperatures and pressures, plastics, Teflon and metals will often be used as backup rings to the seals and o-rings. Metal backup devices are frequently used as packer element backup systems on permanent packers.
4.4.7) Effect of Temperature and Pressure on Seals
4.4.7.1) Temperature
As temperature increases, elastomer mechanical strength decreases.
The modulus of most rubber compounds decreases as much as 90% from ambient temperature to
temperature values of 250° F and higher.
As a result of these decreased properties, an elastomer is more susceptible at high temperature to:
• extrusion
• fluid/gas permeation
• blistering
• physical degradation
• abrasion or mechanical damage
At low temperatures, elastomers become stiff and brittle and may lose their sealing capability at their Glass
Transition Temperature (Tg ). Special elastomer formulations are, therefore, used for arctic conditions.
The following temperature classifications are generally recognized:
Standard: 0° F to 250° F

III:9
High Temperature: 250° F to 350° F
Very High Temperature: > 350° F
Arctic: -75° F to 180° F
Geothermal and steam injection equipment is rated to 650° F.
4.4.7.2) Pressure
The higher the pressure, the greater the likelihood of rubber extrusion taking place.
Extrusion potential also depends on the seal extrusion gap; elastomer type and strength (modulus); the
design of the seal and accompanying tool; and the presence of backup materials or devices.
Increased pressure also causes increased fluid and gas permeation.
Four pressure regimes are generally recognized:
Low Pressure < 2000 psi
Moderate Pressure 2000 - 5000 psi
High Pressure 5000 - 10000 psi
Very High Pressure > 10000 psi
Gas permeation will cause blistering and general physical degradation when the applied pressure is released
rapidly (especially with explosive decompression below 1000 PSI).
Very low differentials and varying differential directions also pose seal design and selection problems.
In defining the operating conditions for an elastomer, both the expected range of differential pressures and
the maximum absolute pressure should be specified.
4.4.8) Effect of Chemical Environment on Seals
The chemical environment effects may include:
• chemical attack
• physical change
• short term or long term swelling
• increase/decrease in hardness
• increase/decrease in physical properties
The effects of short and long-term exposure, as well as the specific application, need to be considered.
The rate of change of specific seal material properties may be significant.
Implications of seal alteration will often depend on the specific application. For example, a material
with long-term chemical stability but a rapid short-term swell could be detrimental in a seal bore configuration due
to possible physical interference during stab-in (the small cross-section of the seals would add to the swell problem).
Whereas, in packer applications, where there are large seal cross sections and larger gaps during run-in and setting,
short term swell would not be such a problem. Further, if the application is static, as in a permanent packer,swelling
is even less of a problem.
Of particular concern for elastomer selection are:

III:10
• Primary Hydrocarbon Type (Oil or Gas)
• Aromatic Oils
• Organic Solvents (Kerosene, Methanol, Trichloroethene, etc.)
• Corrosion Inhibitors, especially amines
• Hydrogen Sulfide (H2S) (> 5% at temperatures < 200°F)
• Carbon Dioxide (CO2) (> 5%)
• Steam and Geothermal Brines
• High Density Brines, especially those containing Zinc and/or Bromide
• Acids and their associated inhibitors
• Scale Inhibitors
• Hydraulic Control Fluids
• Diesel Oil, especially Arctic Diesel
4.4.9) Effect of Seal Movement and Service Life
4.4.9.1) Seal Movement
Intended or expected seal movement can affect material selection; consideration must be given to whether
the seal movement will be static, intermittent, dynamic, or entirely dynamic.
Static seals, such as packer elements on a permanent packer, are less affected by changes in physical
properties than seals that move. Most permanent packer elements used in hostile environments are mechanically
backed-up with continual energizing force, yielding little effect on sealing with changes in material physical
properties.
An example of intermittent seal movement could be an O-ring in a standard O-ring groove. Quite often,
these seals are subjected to pressure reversals or repeated pressure applications. These pressure reversals cause the
O-ring to move from one side of the groove to the other. In this situation, elastomeric materials that do not retain
resiliency and their original physical properties can eventually lose their sealing capability and start to leak.
An example of dynamic seals is the v-packing used on seal mandrels that are stabbed into polished bore
receptacles (PBR's) or permanent packers. If the seal mandrel is allowed to "float," the seals need to continually
provide their own initial sealing force. Of course, after initial sealing occurs, the hydraulic boost coming from the
pressure differential will enhance the sealing capability of the v-packing.
Compression set can also affect sealability, particularly in the case of cyclic loading. Both material
properties and the environment can affect compression set.
4.4.9.2) Service Life
The expected service life of an elastomeric seal is a prime elastomer selection consideration.
If the application is of short term, in the range of days or hours, the material selected does not necessarily
need to have as high a chemical resistance as that of a seal that must withstand an environment for longer periods of

III:11
time. A prime example is the use of Nitrile elastomers in low sour gas concentration applications at lower
temperatures.
4.4.9.3) Shelf Life and Storage Procedures
Some elastomers, such as Nitrile, are very susceptible to storage degradation and have a limited shelf life.
While others, such as some fluoroelastomers, may have a shelf life exceeding 20 years if properly stored.
Seal materials can be damaged prior to use by prolonged exposure to:
• UV radiation (e.g. sunlight)
• Ozone (e.g. produced by welding or high-voltage equipment)
• Excessive heat (> 100° F) in the store room
• Excessive cold (< 0°F) in the store room
Elastomers should be stored in proper packaging (e.g. a plastic bag or wrapping); in a cool warehouse if in
sub-tropical areas, or a heated warehouse in sub-arctic areas; and away from high voltage equipment.
III:12
4.4.10) Selection and Testing of Elastomers
4.4.10.1) Seal Material and Configuration Selection
Seal selection involves developing the best compromise in material properties and configuration with
consideration of the operating environment. The five criteria for seal material selection are:
• Temperature (handling; maximum and minimum operating)
• Pressure (maximum absolute; range of operating differentials)
• Chemical Environment
• Seal Movement
• Service Life
The information presented in the "Elastomeric Guidelines Section " is a general guideline only for the
listed environments and applications. The engineer approving equipment with elastomeric seals needs to consider
elastomer testing, engineering qualification, and quality control; and seek expert advice from an elastomer specialist.
4.4.10.2) Elastomer Testing, Engineering Qualification and Quality Control
Because of the limitations on theoretical design methods, some methodology needs to be followed to
determine the suitability and assure performance of an elastomeric seal for a given set of conditions. To date, the
best method to assure performance is some form of qualification testing of the elastomeric part in its
proposed configuration, exposed to the rated temperature, pressure, and environment.
Documented results of elastomeric testing should form the basis for supplier confidence in the applicability
of an elastomeric material and configuration for a particular use. Acceptable data can include environmental or life
prediction testing for the elastomeric material, along with performance testing at temperature and pressure.
An identifiable path must exist from manufacture of the qualified compound to the seal being used in a
Company application.
4.4.11) Standard Elastomers
4.4.11.1) Nitrile (Buna-N) Seals - Polybutadiene Acrylonitrile
Nitrile is the standard oil industry elastomer seal material for standard temperatures and little or no
H2S. Nitrile has a temperature limit of 250-275°F as an O-ring or v- packing, 275°F as a retrievable packer element
and 300-325°F in a permanent packer element. Nitrile should not be exposed to bromide completion fluids at
temperatures above 175°F.
Nitrile rubber is usually cured with sulfur, and consequently becomes harder, losing elasticity, resiliency,
and flexibility during exposure to H2S. This reaction is accelerated with higher temperatures and is time
dependent, with the Nitrile seal getting progressively harder with continued H2S exposure time. The eventual state
and hardness of a Nitrile seal exposed to H2S for a long period of time is often similar to that of glass. Nitrile,
therefore, will function acceptably as a static seal, such as permanent packer, in sour environments, but is not

III:13
acceptable in applications with movement or changing differential pressures. Nitrile retrievable packer elements will
tolerate small amounts of H2S (<5%) at temperatures below 200°F. A lesser degree of hardening can also be
expected with some amine inhibitors.
Hard Nitrile rubbers (>90 D) are reasonably resistant to CO2 impregnation. However, they cannot be used
in shallow well retrievable packers. With softer Nitriles, high levels of CO2 (>5%) cause blistering of seal materials
during retrieval. Nitrile seals are, consequently, not recommended for use in shallow CO2 injection wells.
Some Nitrile rubbers can exhibit severe swell when exposed to some highly aromatic oils, or during
prolonged exposure to high concentrations of organic solvents. Severe swelling can pose problems with moving
seals (such as in SSV's, sleeves, and slip joints), but is rarely a problem with packers. In these conditions, a
composite seal stack can often be used to isolate the nitrile from direct contact with the oil or solvent; alternatively
the seal area can be flushed after solvent treatments.
Swelling of Nitrile also occurs in bromide completion fluids at temperatures above 175°F.
4.4.11.2) Highly Saturated Nitrile (HSN) Seals
Highly saturated Nitrile, "HSN's," or hydrogenated Nitrile rubber, HNBR, have been presented to the oil
industry as an answer to the continued search for a hostile environment, or severe service rubber. These claims have
often been oversold. The published literature and the elastomer manufacturers' sales literature indicate with
laboratory tests that HSN, or HNBR; has performance advantages over Nitrile rubber. The performance advantages
stated are (35° to 80° F) higher temperature resistance; higher tensile properties; improved low temperature
performance; and higher resistance to CO2 and H2S. However, rubber processors and molders have difficulty
molding with HSN because of its sensitivity to formulation and process variations; and molded products do
not show the increased performance that had been expected under field use, or simulated field usage testing
conditions. Often, the HSN materials will not perform mechanically as well as common generic Nitrile.
When presented with the potential use of HSN or HNBR, it is recommended that the engineer examine
documented test data looking for verifiable references in the proposed configuration. Also, the parts must be molded
under strict quality control; a variation of mold temperature of 10 - 20°F can make the difference between a part that
will perform acceptably and one that could fail.
4.4.11.3) Viton and Fluorel Seals - Fluoroelastomers
Viton and Fluorel are the prime high temperature (<350°F) sour gas elastomers.
However, the performance rating of these Fluoroelastomers in dry gas and water is not as good as that in
oil. In gas service, an H2S limit of 5%-15% is often applied at temperatures in excess of 250°F, unless a special
formulation or a composite seal stack is used.
Fluoroelastomers are amine cured and consequently become harder with exposure to large quantities of
amine-based inhibitors. This is the main problem with their use in gas wells where CO2 corrosion is prevented with
inhibitors. The primary risk is with small o-rings and v-packing rather than packer elements. Without the presence of
inhibitors, their resistance to high pressure CO2 is good at higher hardness levels. However, they are not suitable for
use in CO2 injection schemes.

III:14
Properly formulated, Fluoroelastomers have excellent resistance to organic fluids.
4.4.12) Premium and Special Service Elastomers
4.4.12.1) Application and Limitations
Premium elastomers are primarily used in high pressure and sour gas wells, generally classified by
exploration companies as "hostile conditions."
With the exception of Kalrez and a more recent grade of Aflas, the principal limitation of these premium
elastomers has been sealing at temperatures below 100°F. This sealing problem is especially pronounced in low-
pressure applications where the seals are not energized with a significant pressure differential.
4.4.12.2) Aflas - Tetraflouroethylene-propylene copolymer
Aflas is used for high temperature (250°-400°F) sour service gas wells and high-pressure wells completed
in bromide type fluids.
Aflas is a half-fluorinated elastomer, and is sometimes designated a "fluoroelastomer". Aflas has a greater
heat and oil resistance than EPDM. Oil resistance is obtained from the polar tetraflouroethylene component.
To date, Aflas compounds have exhibited poor low temperature performance properties at 100°F and
below. The material becomes less resilient at low temperatures and will have a tendency to leak. This shortcoming is
particularly evident with low differential pressures. In applications where an Aflas seal needs to seal at both high
and low temperatures, such as a production well with the possibility of fracturing or dynamic kill with lower
temperature fluids, it is suggested that a representative seal be tested simulating the expected service conditions. To
get around this problem, the service company might use one stack of v-seals that include some Kalrez v-rings as a
contingency for possible low temperature transients.
In the early 1990's, there were some developments on a grade of Aflas with improved low temperature
properties. The engineer is encouraged to inquire whether the material being used is of the low temperature resistant
variety and to request verifiable evidence of the claimed performance.
4.4.12.3) Kalrez - Tetraflouroethylene-perfluorovinylmethylether (sometimes designated a "perfluoroelastomer")
Kalrez is used for very high temperature applications (550°F) and sour crude service.
Kalrez has the best overall heat and fluid resistance of any elastomer presently available. The fact that it is
difficult to mold in thick cross sections and is very costly limits its use to O-rings and v-rings in seal stacks.
4.4.12.4) Epichlorohydrin
Epichlorohydrin has low resilience and moderate tensile strength, but has good resistance to swelling from
oil, intermediate temperature resistance, and low permeability to gases, including CO2. At standard temperature
ranges, up to 250°F, and low levels of H2S, it is the elastomer of choice for low pressure, shallow CO2 injection
wells. Special testing is recommended in cases where amine inhibitors are being used.

III:15
4.4.12.5) EPDM - Ethylene Propylene Diene Monomer
EPDM has a broad chemical resistance, as well as being resistant to exposure to heat, oxidation, ozone and
bromide completion fluids but swells severely in crude oil and diesel. EPDM has very little interaction with
methane, even at high temperatures. Consequently, EPDM can be used in dry gas wells with little or no
condensate and in continuous steam injection wells with steam temperatures below 550 °F. It is also commonly
used as an insulator in ESP cables, especially in ESP wells completed with a packer.
4.4.13) Thermoplastics and Composite Seal Stacks
4.4.13.1) Ryton - Polypheynylene Sulfide
Ryton is a crystalline, high performance thermoplastic with very high heat resistance, heat stability and
chemical resistance. The amount of crystallinity can be controlled in the manufacturing process that in turn can
control the hardness of the material. Ryton has excellent chemical resistance over a wide range of temperatures, and
has no known solvent below 400°F. Ryton has excellent thermal stability at temperatures of 400°F to 450°F
depending upon the material grade. Various grades of Ryton are available with varying levels of glass
reinforcement, as well as mineral and carbon fiber filled grades.
A softer form of Ryton is used as a premium seal in vee-ring seal stacks; and harder grades of Ryton,
and glass reinforced Ryton, are used as backup rings.
4.4.13.2) PEEK - Polyetherertherketone
PEEK is a high temperature, crystalline thermoplastic with very high heat resistance, and resistance to
organic solvents, dynamic fatigue, and short-term heat aging. PEEK has a resistance to attack over a wide pH range
ranging from 60% sulfuric acid to 40% sodium hydroxide at elevated temperatures. PEEK has shown long term
stability of up to 50,000 hours at 475°F, and has shown good resistance to water environments at temperatures to
500°F. On a short-term basis, PEEK is suitable for service temperatures of up to 570°F. PEEK is available in the
non-reinforced state, 20 and 30% glass fiber reinforced, and 30% carbon fiber reinforced.
PEEK is most commonly used for backup rings for o-rings and in v-ring seal stacks. PEEK is
routinely used in highly aggressive hostile environments with high concentrations of H2S and CO2.
4.4.13.3) Teflon
Teflon is the primary sealing material for very high temperatures (T> 500°F). It is also used extensively as
a backup ring for softer elastomers.
For the higher temperature service and higher strength applications, Teflon is reinforced with glass fiber.
The amount of reinforcement commonly used will start at a minimum of 15% and may go up to 40% by weight of
glass fiber.
Teflon, with or without glass reinforcement, has very little resilience and has a tendency to creep (more so
without reinforcement); therefore, Teflon seals need very small extrusion gaps, and are often provided with metal
backup rings. Because of its lack of resilience, Teflon will have a greater tendency to leak due to small defects in the

III:16
mating sealing surface when used as a seal. Sometimes the leak-causing defects are difficult to detect by visual
examination. Teflon seals are generally replaced if pulled from the well (e.g. a retrievable steam packer is redressed
after each run).
4.4.13.4) Composite Seal Stacks
Seal assemblies for permanent packers and PBR's will often use a combination of the above elastomers and
plastics to achieve a wide range of operating conditions.
Temperature Limits (° F)
Oil Gas Steam
NTR Nitrile Teflon Ryton 250 175 N/A
VTR Viton Teflon Ryton 350 250 N/A
ATR Aflas Teflon Ryton 400 375 450
ATP Aflas Teflon PEEK 450 400 450
RTR Ryton Teflon Ryton 450 450 450
KTR Kalrez Teflon Ryton 450 375 550
KTP Kalrez Teflon PEEK 550 450 550
TMM Teflon Metal to Metal 650 650 650
KTM Kalrez Teflon Metal to Metal 550 500 650
4.4.14) Elastomer Failure Mechanisms
This section outlines some of the failure modes that can occur in seals, how they are caused and how they
can be corrected to prevent future failures.
4.4.14.1) Extrusion Damage
The pressure ranges, given in the extrusion diagram below, show allowable pressures for various degrees of
elastomer hardness. Increased temperature reduces hardness and these data refer to the hardness maintained at the
operating temperature.

III:17
In it’s housing before pressurizing, an unsupported seal sits slightly deformed between the gland and
sealing surface. On pressurizing (100 - 1500 PSI), the seal acts like an incompressible fluid, exerting a pressure on
the gland proportional to the system pressure and so forms a closure. At higher pressures (1500-3000psi), if the
system pressure exceeds the seal strength, then a small volume of material will be forced into the clearance gap and
may be cut off by the retracting low-pressure side of the O-ring trying to resist the tendency of the O-ring to extrude
into the clearance gap. Seal failure and leakage follows rapidly.
Extrusion is characterized by a "peeling" or "nibbling" of the O-ring surface and is the most common cause
of O-ring failure
This type of failure is exaggerated in dynamic applications where material is clamped in the clearance gap
and sheared off completely. However, it must be remembered that in static applications extrusion will occur at high
pressures and is accentuated when pressures fluctuate and the seal housing components stretch under load.
Using modulus values at 100 percent elongation may compare resistance to extrusion for differing
materials. Alternately, hardness may be used to select appropriate maximum pressure levels.
For pressures above 1500-3000 PSI in critical applications, back up rings should be used. T-seals and
V-seals always have back up rings associated with them and extrusion is not such a problem as with unsupported
O-rings.
Causes of Extrusion Failure:
• unnecessarily large clearances
• high pressure
• soft seal material
• physical or chemical changes which weaken/soften seal

III:18
• eccentricity. sharp edges on seal gland
• wrong size seal
Corrective Action:
• tighten tolerances
• use a back-up ring
• increase seal material hardness
• check medium compatibility
• prevent eccentricity
• strengthen machine parts to prevent "breathing”
• gland radii from 0.10 to 0.40 mm
• select T-seal or V-seal geometry with suitable back up
4.4.14.2) Compression Set Failure
Compression set, the partial or total loss of elastic memory of an elastomer, is a common failure mode. It is
characterized by a double sided flattening of a seal (radial or axial according to application) and can be clearly seen
after disassembly.
The problem is usually caused by selection of the wrong compound. The elasticity of a seal depends not
only on the formulation, but also on the working temperature, type and length of deformation and aging caused by a
medium e.g. air, steam, acid, petroleum etc.
Compression set damage can be described as the loss of cross-link sites between the molecular chains or as
the creation of new sites, brought about by temperature or chemical changes.
Compression set damage clearly visible at low temperatures is generally reversible and at higher
temperatures the elasticity may return to affect a seal again.
The causes of high temperature compression set and loss in sealing power are connected and can be
described as follows:
Causes of Compression Set Failure:
• seal compound has poor compression set
• wrong gland dimensions
• working temperature higher than expected
• higher deformation through tight gland area
Corrective Actions:
• select elastomer with low compression set
• select elastomer according to working conditions

III:19
• reduce system temperature at seal
• check compatibility of seal with environment
• use correct gland dimensions
4.4.14.3) Explosive Decompression Damage
Under high pressure, gases will diffuse into elastomers. On rapid decompression the absorbed gases expand
quickly causing high levels of internal stress, which may cause internal rupture and blistering to occur on the sealing
surface. A seal may also swell on decompression but with time may return to its original shape without leaving any
external evidence of decompression damage. This is potentially dangerous since it has been noted that serious
internal fissures can be present, but remain undetected, which will affect the sealing performance.
This problem may be solved or at least reduced in the following ways:
• lengthen the time for decompression
• reduce working pressure at seal
• design for smaller seal cross-section
• select a seal material with higher strength, higher modulus and higher hardness
• use specially compounded grades having known resistance to explosive decompression
Blister damage has been reported for a wide range of elastomers under hydrocarbon duties, particularly
under gas alone but also in gas/oil mixtures. The presence of carbon dioxide and hydrogen sulphide are especially
prone to causing problems on rapid decompression (they are both easily liquefiable gases and have solubility limits
approaching those of the elastomer seal materials).
4.4.14.4) Wear Failure
Wear is probably the most understandable form of seal failure in dynamic seals. In this type of failure,
which is typified by a flattening on one side of the seal only, it is important to note that friction is proportional to
deformation, and that applied pressure and wear are proportional to friction and further, that the temperature
increase of the seal is proportional to friction.
The seal parameters must be considered along with the medium to achieve an optimum compromise. In a
static application, damage through wear is caused by pulsating pressure, which induces the seal to abrade on
relatively rough surfaces or edges of the gland.
Causes of Wear Failure:
• incorrect surface finish
• poor lubrication
• high temperature
• too high a deformation
• impurities in system fluid

III:20
• high or pulsating pressure
Corrective Actions:
• correct surface finish
• use a hard coated surface
• select an improved machining process
• change system fluid to one with better lubricity
• select a compound with higher wear resistance e.g. PTFE
• select a material with internal lubrication or design lubrication pockets
• clean system and filter fluid
4.4.14.5) Chemical Degradation
Chemical degradation depends on a number of factors, which include temperature, concentration, and
duration of exposure. Mechanical properties of a seal material can be seriously changed by a chemical reaction. The
timescale for the change is ultimately a function of the severity of service conditions and may be slowly progressive
to catastrophically fast.
Two different processes can occur when a seal is exposed to chemical environment:
1. Bond Scission - results in chemical bonds being broken in the elastomer causing softening, weakness and a gummy seal material.
2. Cross linking - results in bond formation causing a harder, more brittle, often cracked or crazed seal. The elastic properties are lost often beyond a point where the seal ceases to function. Leak paths through a cracked seal can lead to failure.
The effects of chemicals may lead to competing reactions occurring simultaneously and a simple swelling
reaction may eventually turn into one of contraction where absorption is overtaken by the dissolution of particular
components.
The effect of increased temperature will be to speed up the reaction rates, but more than this the mechanical
properties of an elastomer are normally reduced with increasing temperature so it is important to select materials
with both sufficiently high chemical and thermal resistance.
4.4.14.6) Assembly Failure
Even if all the above hints and rules are observed, failure can still occur due to poor workmanship practices
adopted on assembly of the seal into its housing. A seal is a precision product and should be treated with respect.
Careful assembly will repay the user in trouble free operation. The alternative is an expensive and possibly
dangerous failure.
Causes of Assembly Failures:
• using undersized seal
• twisting, cutting or shearing of seal

III:21
• assembly without the correct tool
• assembly without lubrication (care - compatibility)
• assembly in dirty conditions
Corrective Action:
• breaking all sharp edges
• leading edge chamfer of between 15 to 20 degrees
• cleanliness
• check seal size before assembly
• assembly as a stack of seals where possible
4.4.15) Practical Guidelines with Elastomers (Do's &, Don'ts, Rules of Thumb)
1. If you have a problem, define service history and material and ask for help (Company engineering group or the Supplier).
2. The effect of a chemical reaction doubles for every 20°F temp rise so watch out for high temps. The lifetime roughly doubles for every 20°F drop.
3. Do make sure that the upper temp is within the capability of the seal material.
4. The seal material must be compatible with the fluid environments or the design afford the best shield to the seal to protect the elastomer from chemical exposure.
5. Don't use Zinc Bromide (ZnBr) brine with Nitriles. It causes severe hardening.
6. Nitrile packers may be less affected in amines than other types of seal geometry simply because of the large bulky nature of packer elements.
7. Methanol can affect Vitons, use Aflas or nitrile if possible.
8. Don't use EPDM where hydrocarbons are present.
9. For really aggressive hot, sour conditions - best bet is the expensive Kalrez (to 260°C) or Chemraz (20% cheaper better properties over -20° to 230°C).
10. Pressure level dictates mechanical properties required.
11. Critical Pressure for blistering is Pb ~ 5E/6 where E ~ Youngs Modulus (at service temperature).
12. Critical Pressure for Rupture is Pr = 4(Lb*Sb)/3 where Lb = extension ratio at break (length of stretched material per unit initial length), Sb ~ stress at break (at service temperature).
13. Think whether there is likely to be gas dissolved into the seal, which may be subjected to rapid decompression; there are special grades with improved decompression resistance.
14. Seal stacks form good solutions to wide ranging service. They allow use of varying hardness or differing materials in the stack and the outer rings may be sacrificial for the sake of the main inner seal.
15. Do not pull seal stacks from a seal bore under pressure, the last seal will suffer decompression damage. If the seal is then reinserted, the damaged seals may roll or break off causing yet further damage to the other seals following into the bore.

III:22
16. Ryton is relatively brittle compared with PEEK or reinforced Teflon. Fracture debris could cause tearing in the elastomer seal, especially in the less mechanical strong Kalrez & Chemraz perfluoroelastomers. Use PEEK or Teflon in preference to Ryton.
17. Cyclic temperatures could cause loss of sealing by compression set especially at lower temperatures near to the Glass Transition temperature. Aflas is prone to this.
18. Increase in molecular weight and cross-link density improves the tensile strength, elongation, modulus and compression set. Hardness can be improved by increasing cross-link density and/or by using certain fillers, thus specifying hardness alone will not necessarily give good extrusion resistance at elevated temperature. Tensile modulus should also be included in the specification.
19. C02 and H2S often occur together. C02 has no chemical effect on elastomers but is more soluble in fluoroelastomers than in nitrites, it may also be easily compressed and can give rise to decompression damage in seals. H2S can affect elastomers chemically by acting as a curing agent which causes embrittlement. It also is easily compressible and may lead to decompression damage.
20. Seal swell in highly aromatic asphaltene dissolving solvents may cause sealing problems in Aflas and Vitons.
4.5) Performance Verification Test Procedure:
4.5.1) General Comments
As consultants, we have the opportunity to witness a wide variety of tests and test methods. We have also
witnessed the ruin of many a test for lack of proper planning and record keeping. The intent of this discussion is to
outline the elements of what would be considered an ideal test. Much of the procedural information comes from API
6A Appendix F Testing for Wellheads and Trees.
While conducting a test in this manner may seem overly concerned with minutia, the result is well worth
the effort. The intent is to assure the client gets the most value for his test dollar, and results reported in a way that
would pass scrutiny from the most demanding customer or regulatory body.
At the beginning of every test program, there is a product and an application for which the product is to be
qualified. Based on this information, test objectives should be clearly and concisely stated, as well as their relation to
operating or rated conditions. If there are specific API or regulatory requirements, those should be identified. If the
specimen and fixture, or components such as casing, require full traceability, that requirement should be stated.
Another often-overlooked objective is the requirement for instrumentation and accuracy. To achieve the objective,
certain data must be measured and recorded. Parameters to be measured, their range, and accuracy should be clearly
stated.
Criteria should be established for acceptance or rejection (pass or fail) of the specimen. Recorded values
rarely result in perfectly flat pressure traces to indicate no leakage. For objective results, criteria should be capable
of being measured; for subjective results, the method of documentation (such as photograph) should be stated.
In many cases, it is not practical to manufacture test specimens to actual production conditions. Long seal
bores and long strings of tubing or casing are often not practical when designing test fixtures. Specimens should
contain all critical components of the production piece and be compatible with the test fixture. Fixture design should
allow application of test parameters, such as heat, pressure and load, in the same manner as production operations.

III:23
Special consideration should be given to evaluation of fixture-induced loads in the specimen. Closed end containers
introduce high axial loads that may not represent actual operating conditions. All loads, induced and applied must be
taken into consideration at this point.
Once we have the specimen and fixture defined, a comprehensive test procedure should be written. This
document will include a step-by-step list of exactly what operations are to be performed and in what order. An
example of an inadequate step would be “Pressure down tubing to set the packer”. More accurately stated, the
procedure would state, “While allowing tubing to move in the axial direction, and with upper and lower annulus
ports open, increase tubing pressure to X PSI and hold five minutes; increase tubing pressure to Y PSI to shear ball
seat. If ball seat does not shear, increase to Z PSI, release pressure, and rotate out taking right hand torque. Expect
three shear events at D, E, and F PSI.” Stated in this manner, packer setting procedure is clearly and concisely
defined. Quality is defined as conformance to specification. In the case of performing a product test, the
specification is the procedure.
Once the procedure is defined, design of the test specimen and fixture should be reviewed to assure all test
steps could be performed (are sufficient ports available in the fixture, does the fixture allow for axial movement of
the tubing). Instrumentation should be reviewed to assure proper ports or connections are provided and that the
acceptance or rejection criteria are properly instrumented. Instruments are assigned (by serial number) and an
instrumentation plan recorded for traceability.
At this point, we are ready to manufacture the test specimen and fixture. During this process, care should be
taken to characterize each component under test. Ideal conditions would find test components manufactured of
material at the minimum physical property and dimension. If minimum material and physical property conditions
cannot be met, testing should be done to equivalent stress levels as defined in API 6A. To adequately characterize
the specimen, material certification and physical dimension (compared to print dimension) should be recorded and
included with the test report. From evaluating existing product tests, the most common fault is incomplete
characterization of the product being tested. If you don’t know what you tested, the entire test can be considered
invalid. Test fixtures are often exempt for this requirement, however casing should always be identified.
When both specimen and fixture manufacturing is complete, all should be shipped to arrive at the test
facility at least one week prior to the onset of testing. This allows for review of documentation and assured adequate
time to address “fit” problems. It also allows the test company time to have everything ready to test on the
designated test day.
Rigging the test occurs from one day to one week prior to testing. Heat systems are rigged, connections are
located, cleaned and dressed, and select test facility equipment prepared for operation. Heat systems are often
brought to temperature (without the specimen), pumps primed, hoses flushed, and instruments checked out prior to
test day.
On test day, the procedure is performed as written. Should the test not proceed as planned (stated in the
procedure), each operation must be documented and time stamped. It is imperative to record observations (seen or
heard) and decisions as they occur. Should there be an occurrence that prematurely ends the test, acceptance or

III:24
rejection criteria establish whether the test is valid; for example a performance test to 10,000-PSI (acceptance
criteria) passes while a subsequent pressure test to 12,000-PSI results in a leak.
4.5.2) Test Reports
Upon completion of the procedure, raw data from the manufacturing, quality and test are gathered into a
written report. While good test reports contain a wide variety of data and are written in a variety of formats, there are
basic ingredients that must be present. In the most comprehensive test, additional data should be present. While this
list may seem like a repeat of requirements previously covered, this list includes the method by which they should
be documented.
4.5.2.1) Purpose of the test
What specific requirement will completing this test satisfy, state clearly and concisely.
4.5.2.2) What was tested
The test specimen should be accurately and completely identified, to the point that no other product could
be confused with this particular product. Again, failure to meet this requirement is the primary reason existing tests
are not accepted.
4.5.2.3) Test procedure
What was done, step-by-step, using the test specimen to achieve the objective. This would include test
conditions of temperature, pressure, load, fluid, flow rate, etc.. Steps should be specific as to what was done and in
what order; for example, if pressure and load were to be increased, which was increased first and which was
decreased first? In conjunction, a test report would list the actual steps performed as opposed to those of the
procedure (they may or may not be identical).
4.5.2.4) Test fixture and equipment used to perform the test
In order to evaluate test results, we have to know something about the equipment used to perform the test.
A comprehensive list of equipment and instrumentation used to perform the test steps listed above should be
included. The test fixture may have consisted of a joint of casing, however a much larger assembly of test equipment
was required to perform the entire test. There may have been a heating system that applied heat in a specific manner.
Method of heating and method of temperature measurement and control should be included. Application of load and
pressure can be handled in much the same manner, considering how loads were applied and at what rate.
Instrumentation used in data gathering should be identified. Certain instruments were used in obtaining test results.
It is important to identify what kind of instruments were used in data gathering. It is preferred to present data in
“hard copy” format in the form of strip chart recordings. Personal observation of quantitative data is not
recommended. The charting instrument should be identified.

III:25
4.5.2.5) Acceptance or rejection criteria
Statement of qualitative or quantitative criteria used to determine if the test was a success or failure. When
qualitative criteria are specified, visual documentation, such as photo or video, must be supplied as evidence.
4.5.2.6) Test data (objective)
Usually found in the form of strip charts or tabular data from a computer based data acquisition system.
Data should be presented in a manner that clearly verifies compliance to the test procedure. All anomalies (such as a
pump that lost prime, or a line failure) should be recorded and noted. All occurrences, whether part of the procedure
or not, are part of the test.
4.5.2.7) Test data (subjective)
Photographs best convey subjective results. Whether an elastomer or a slip is damaged is a subjective
judgment and can only be documented by visual means. Photographs are preferable to video as they are a more
permanent means of documentation, and personal observations are subjective in themselves.
4.5.2.8) Supporting data
This category is optional and contains data about the test facility, test specimen, and/or test fixture. Material
certification and quality inspection data would be included.
Following completion of the test, specimens should be labeled and stored to preclude disruption of test
evidence. Both the specimen and the report should be readily available and easily retrievable.
As stated at the beginning of this article, this is an ideal test. Should the test be conducted in this manner,
results should satisfy any customer or regulatory body. There are instances when the customer or the testing party
does not require this level of documentation.
4.6) Engineering Design Practices:
4.6.1) General Comments on Stress in Pressure Vessels
The main purpose of a pressure vessel is to contain fluid under conditions of pressure, temperature, and
applied load. In doing so, they are subjected to the action of steady and dynamic support loads, tubing reactions,
thermal shocks, and a host of other outside influences. To accurately predict performance, an overall knowledge of
the stresses imposed by these conditions on various component shapes is required.
Two basic configurations of a cylindrical component are considered. When components have walls that are
“thin” in relation to other dimensions (particularly diameter), the wall offers little resistance to bending
perpendicular to its surface. The wall is considered a “membrane” and features essentially no stress gradient through
the wall. When the wall is “thick” in relation to other dimensions, the variation in stress between the inner and outer
surface becomes appreciable. Even though wall thickness may seem small in relation to diameter, downhole tools
almost always fall into the latter category.
III:26
In the case of a cylindrical vessel under internal pressure, both radial and tangential stresses are maximum
at the inner surface. Radial stress is always compressive and equal to the applied or induced pressure, and tangential
stress is always tensile. Tangential stress is always numerically greater than internal pressure at the inner fiber.
Tangential stress at the outer fiber is less than that at the inner fiber by the amount of applied or induced internal
pressure. Shear stress is maximum at the inner fiber and correlates well with the actual rupture of thick cylinders.
In the case of a cylindrical vessel under external pressure, both radial and tangential stresses are
compressive at the inner fiber with tangential stress numerically greater. Maximum tangential stress occurs at the
inside fiber while maximum radial stress is present at the outer fiber.
4.6.2) Collapse
4.6.2.1) Mechanism of Collapse
Collapse pressure prediction is the most difficult and least understood calculation for tubulars. Collapse
tends to be an instability failure, meaning that the onset of collapse and complete failure in collapse often occur at
almost the same load. Collapse failure prediction is not unlike buckling failure prediction in this sense.
Collapse of tubulars results from either tangential stress exceeding material strength (referred to as yield-
strength collapse) or geometric instability (elastic collapse). Different equations govern the calculation of collapse
for different mechanisms. Yield strength collapse applies when the D/t (outside diameter divided by wall thickness)
ratio is small (small diameter, thick walled tubes). Elastic collapse applies for higher D/t ratio (larger diameter, thin
walled tubes). There are additional geometric constraints that govern the analysis of tubulars in collapse.
Almost all (unless specified otherwise) formulae for collapse pressure prediction assume an infinitely long
tube. In engineering terms, this means the section under analysis is long enough such that anything “happening” at
either end of that section does not materially contribute to change the section’s propensity to collapse. In the case of
some equipment used in completions, this criterion has not been met. A basic criterion for a short section is length
less than seven times outside diameter. Short sections are more resistant to collapse than long sections.
Classic collapse theory (the basis for classic formulae) assumes no radial support about the collapsing
section. In order to collapse, the cross section of the tube collapses inward, significantly decreasing the inside
diameter at the collapsed section. Perpendicular to the decrease in diameter, there is an increase in outside diameter.
Any support about the inside or outside of the tube tends to increase collapse resistance (prevent the section from
collapsing). In the case of most completion equipment, there is radial support outside the component (casing) and
possibly inside the component (seal assembly) when performing the collapse analysis.
To complicate the analysis, most equipment features a short-section analysis at the bottom of the section
under scrutiny followed by a composite section. The mechanism for this specific collapse is complex and is not
described in classic theory.
Most classic collapse theory defines the condition of two-lobe collapse, resulting in the familiar “smiling
face” cross-section of the collapsed section. When some means of support is provided, results may show multiple-
lobe collapse. If a TBR collapses about a seal nipple, and the nipple does not collapse, we may see this phenomenon.

III:27
4.6.2.2) Collapse Pressure Calculation
The assumption that a completion equipment manufacturer uses an improper or incorrect formula for
collapse pressure prediction implies there is a proper and correct formula. There are a number of collapse prediction
formulae circulating the engineering community. What’s confusing for the engineer is the variance in predicted
collapse pressure using these formulae.
The following is a brief discussion of collapse pressure prediction as presented by the API (American
Petroleum Institute), SPE (Society of Petroleum Engineers), and a consortium of industry specialists.
4.6.2.3) API Bulletin 5C3 Collapse Formulae
Most widely used collapse prediction formulae can be found in the API Bulletin 5C3 Bulletin on
Performance and Calculations for Casing, Tubing, Drill Pipe and Line Pipe Properties (5th Ed.). The key phrase
in the bulletin title is “Casing, Tubing, Drill Pipe and Line Pipe” and the admonition on the introduction page that
the document is intended to supplement rather than replace individual engineering judgment. There is also a phrase
found in the foreword (p.3 c.) that states “API bulletins are published to provide information for which there is a
broad industry need but which does not constitute either Specifications or Recommended Practices”. Four distinct
minimum collapse pressures are calculated as follows:
1. Yield Strength Collapse: not a true collapse, but rather that value of external pressure that results in yield stress at the inside wall of the tube. Derived from theoretical analysis. Experimental results indicated this formula to be somewhat conservative, however it was thought unsafe to use a pressure exceeding the value that would cause yield at the inner wall. Basis for this formula is the Lame formula.
2. Plastic Collapse: Derived empirically from 2488 collapse tests on K55, N80, and P110. Formulae developed from the modified elastic collapse formulae.
3. Transition Collapse: Determined on an arbitrary basis. Formulae developed from the modified elastic collapse formulae. Curves for plastic and elastic collapse pressure (plotted against D/t) do not intersect until pressure falls below the minimum elastic collapse value. Transition collapse was developed to overcome this anomaly.
4. Elastic Collapse: Derived from theoretical analysis by W.O. Clinedinst for the API.
API 5C3 collapse pressure is determined by choosing the appropriate formula based on D/t for the tubular
under analysis.
API 5C3 has been the standard of the industry for calculating collapse pressure. If your equipment operates
at pressure at or less than the calculated API 5C3 collapse pressure, it’s extremely unlikely your product will ever
collapse. Calculations using the 5C3 formulae are shown (see appendix) to be quite conservative when compared to
other methods. API 5C3 identifies performance “modifiers” that effect calculated collapse pressure. The addition of
compressive load increases collapse resistance as defined in equation 1.1.5.1. There is also a modifier for the
presence of internal along with external pressure as defined by equation 1.1.6.1.
4.6.2.4) Other Collapse Design Methods
In 1993, an SPE paper, An Improved Design Equation for Tubular Collapse, was presented by Issa
(Exxon) and Crawford (Stanford Univ.) with an improved method of evaluating tubular collapse. A collapsing
III:28
tubular is a system governed by a large number of highly non-linear equations resulting from large displacements
and material non-linearity. The basis for their formulae is a large number of non-linear finite element analyses using
different geometric tolerances and mechanical properties. Full scale testing was conducted to verify results of the
FEA, both for magnitude and tubular shape. Testing verified FEA within 6%, a value judged to be acceptable due to
assumptions made concerning material properties.
In May 1998, Shell hosted an SPE Applied Technology Workshop at their facility in The Woodlands on the
subject of Risk Based Design of Casing and Tubing. Risk based design assumes there is a statistical distribution of
known loads and a similar distribution of load capacity. These distributions can be noted by two “bell curves” with
probability density on the y-axis and load on the x-axis. The two curves intersect to form an area defined as
probability of failure. The concept of “risk based” design assumes an acceptable level of probability of failure.
At this workshop, it was recognized that the API 5C3 formulae are in need of examination and update.
There were a number of technical papers presented on the subject of collapse listed below:
• On the Development of Reliability-based Design Rules for Casing Collapse
• Determination of Casing and Tubing Burst and Collapse Design factors to Achieve Target Level of Risk, Including Influence of Mill Source
• A Reliability Approach to the Design of OCTG Tubulars Against Collapse
• Collapse Behavior of Casings: Measurement Techniques, Numerical Analysis and Full Scale Testing
The papers listed above provide a qualitative as well as quantitative approach to the subject of collapse.
Remember that the topic of the group was risk-based design of tubulars. Formulae presented in these papers have
not been “generally accepted” by the engineering community. Diversity of approach and result is presented to show
that there is no single correct equation for the prediction of collapse pressure in a simple joint of casing. Remember
that these papers attempt to define collapse for a mill-finish joint of casing and not a short, supported, machined
piece.
4.6.3) Burst
4.6.3.1) Mechanism of Internal Pressure Failure
There have been a multitude of formulae used or proposed for establishing internal pressure performance.
These have ranged from entirely empirical to completely theoretical based on theories of plasticity and true strain
behavior of the material.
When maximum stresses exceed yield strength of the material, it is assumed that failure either occurs or is
eminent. There are a number of failure theories that describe this condition.
The most elementary theory is the Maximum Stress theory. Failure is predicted when the maximum (or
minimum) principal stress exceeds yield strength of the material. Represented graphically, this theory of failure
would be a square box with x and y limits at the yield strength of the material.
The Maximum Shear Stress or Tresca theory postulates that yield in a component subject to combined
stress will occur when maximum shear stress becomes equal to the maximum shear stress at yield point in a simple
tension test. This theory illustrates the fact that components subject to tension will support less external pressure and

III:29
components in compression will support less internal pressure. Represented graphically, the square box would have
two corners truncated to illustrate the previous statement.
The Distortion Energy or Von-Mises theory is based on observations that materials do not become inelastic
under a triaxial state of stress produced by high hydrostatic pressure. Represented graphically, the truncated box
expands slightly to form an ellipse with its major axis at the corners of the box not truncated in the Tresca theory.
The graph below illustrates the Tresca theory.
4.6.3.2) “Burst” Pressure Calculation
Performance of a tubular shape under internal pressure is commonly referred to as “burst” rating.
Calculations to represent the “burst” rating are most often represented to be the Lame formula. This is a very
common and very incorrect nomenclature. Following convention used in API 5C3, the proper title would be
“Internal Yield Pressure” rating.
API 5C3 uses a modified form of the Lame equation in that a safety factor of 12-½% is applied to account
for variations in wall thickness and in manufacture. When used with manufactured goods having a machined inside
and outside diameter with tolerances common to machining operations, the 12-½% safety factor would not be
appropriate.
Calculation of internal yield pressure in downhole equipment is effected by the presence of end conditions.
Often a plugged bore, such as a packer with plugged tailpipe or a service tool experiencing plugged workstring adds
the end effect of a closed chamber. This condition favors capped-end conditions. Capped end conditions change the
-30000
-20000
-10000
0
10000
20000
30000
40000
-400,000 -300,000 -200,000 -100,000 0 100,000 200,000 300,000 400,000
Internal Yield29,502
Tension356,202
Collapse25,546
Compression356,202

III:30
state of stress from the simple “maximum stress” calculation to a combined stress calculations similar to the Tresca
or Von-Mises theories.
Capturing the state of stress for combined load is best done by generating an operating envelope described
in the “theories of failure” section above.
From the SPE Applied Technology Workshop held in May 1998, there are a number of papers that advance
certain theories of failure prediction for tubular goods under internal pressure:
• The Development of Risk-Based Burst Design for Well Casing and Tubing
• Burst Pressure Prediction of Thin Walled, Ductile Tubulars Subjected to Axial Load
• Analytical Burst Strength Prediction of OCTG With and Without Defects
4.6.4) Specifications
To clarify the state of the industry, there is no industry standard specification (API or otherwise) for
downhole completion equipment (other than safety valves). There is also no industry standard for the performance
prediction (equation or test) of these products.
Major E&P companies understand that completion equipment and accessories are “un-regulated” products.
Users must specify what the equipment is expected to do and under what conditions it is expected to perform. It is
incumbent on the user to carefully evaluate every piece of equipment that passes through the rotary.
There has been some question as to the implication of specifying “grade” and “size” as part of the
completion equipment specification, such as use of the “P-110” specification as set forth by API. Specification 5CT
Specification for Casing and Tubing, identifies the requirements for P-110 material, none of which include pressure
or load rating for products other than casing or tubing. The designation P-110 covers material and process of
manufacture for casing or tubing. When the designation P-110 is used in completion equipment and accessories, it
implies the material used has performance properties identical to P-110 material used in casing or tubing. Equipment
manufacturer’s specification of P-110 accompanied by a size and weight, does not imply that the completion
equipment has the same performance properties of casing in that size and weight. Such a specification implies that
furnished completion equipment is compatible in size and material of manufacture with specified casing or tubing.
4.6.5) Equipment Rating
If there exists all this divergent technology on the calculation of rated pressure, what’s an equipment
manufacturer to do about rating his product? General and accepted practice for critical well application is
performance verification testing.
Equipment manufacturers likely have test data that supports use of a particular formula under specific
conditions identified in their Engineering Manual for their product line. This is a very specific (geometric)
application and applies only to a specific product or combination of products.
So, what good are all these calculations? They allow us to estimate the pressure at which collapse will
occur. We use that engineering judgment referred to in the cover of API 5C3 to decide which equations most likely

III:31
apply and what margin of error should be used. We can predict the magnitude of external pressure that can be
exerted without risk of burst or collapse with a healthy safety margin, then we test to refine.
4.6.6) How can pressure failure problems be prevented?
1. The first rule in running downhole tools is to characterize all equipment in the string. This means that performance properties of all equipment that’s run in the well is known and understood by the operator. For the drill string, this is usually done on the rig or in the completion plan. For the production string, this is done well ahead of actually drilling the well.
2. During the planning phase, and almost always prior to the funding phase, there is a completion schematic of the proposed wellbore. This schematic pictorially and verbally describes all components required for a “trouble-free” completion and contingency completions. The amount of contingency work is directly proportional to the perceived risk in completing the well trouble-free.
3. From this completion schematic, an equipment list is drawn along with operational and performance criteria. We now have the foundation for an equipment specification. From this specification, completion equipment manufacturers are considered and evaluated for technical merit, cost, and service quality. Specific pieces of equipment are qualified (technically) and selected for quotation. Vendors are ranked and a supplier chosen. The equipment is ordered well in advance of delivery to assure the proper weight, grade, and size are used. The supplier and operator mutually draft an operations plan that defines how the equipment will be run and operated.
4. Now, does all this prevent completion equipment from failing? Certainly not. What it does is assure the equipment is the best possible for the job (technically) and that all parties understand the performance limits.
5. Dynamic conditions such as those resulting from surging the formation are brutal on downhole tubulars. Actual forces are unknown and, for the most part unpredictable. Dynamic loads can be considerably higher than the static loads we use in formulae. We identify this operation in the completion plan under contingency operations. If the well doesn’t come in by swabbing or jetting the fluid level down, the contingency plan may be to pump into the formation and surge fluid back. The next question would be the pressure limit on tubing prior to surging, and that limit would be an operational parameter of the downhole tools.
4.6.7) Example Calculations
Following is a sample calculation sheet used to compare and contrast different theories of performance
prediction. Engineering judgment is used to determine which calculation best represents the actual operating
conditions.

III:32
HYDE ENGINEERINGBurst / Collapse .. Tension / Compression / Torsion Analysis
Identification: Example Product Load Case defined below
Input Data :OD 12.000 min ID 10.975 max E 2.9 107. mu 0.29Design Load: Fd 250000 lbs (tension is positive) Yield Strength: Sy 120000 psiLoad = Compressive specified by customer Length: L 10.00 inchesOperating Pressure: Internal: Pin 5000 psi Length of component not supported.
External: Pout 4500 psi
Basic CalculationsCross Sectional Area: Ax Ax π OD2 ID2.
4Ax 18.496= sq. inches
Polar Moment of Inertia: J J πOD4 ID4
32. J 611.398= inches4
Inner radius: a ID2
Outer radius: b OD2
Tension/Compression Load Rating CalculationsF Ax Sy. F 2219476= pounds
Torsion Rating Calculations
Tq Sy JOD 12.
. Tq 509498= ft-lbs
Safety Factor CalculationsTensionCompressionSFt F
FdSFta SFt2 SFta 8.88=
Burst & Collapse Calculations Equivalent Collapse Yield StrengthUnder Axial Stress (API 5C3 1.1.5.1)Minimum Wall: t OD ID
2t 1= inches
D/t:Dt OD
tDt 23.41= Syc 1 0.75 Fd
Ax Sy.
2.
0.5
0.5 FdAx Sy.
. Sy.
Syc 112669= psiInternal Pressure Calculations:
Internal Yield (API 5C3): Based on the Barlow equation
Py 0.875 Sy. 2 tOD
.. SFpy PyPin
Pym Py0.875
SFpym PymPin
Py 8969= psi for tubulars subject to wall thickness variations
Pym 10250= psi for tubulars where minimum wall is used
SFpy 1.79= SFpym 2.05=Capped End Yield:
Pcey 4 Sy.
3
tOD
. 1 tOD
.SFpcey Pcey
PinPcey 11330= psi
SFpcey 2.27=Capped End Burst:
Pceb 2 Sy.
3ln 1
1 2 t.
OD
.Pceb 12372= psi
SFpceb PcebPin SFpceb 2.47=
Open End Internal Yield:
Poey 2 Sy. tOD
. 1 tOD
. SFpoey PoeyPin
Poey 9812= psiSFpoey 1.96= Calculation...

III:33
API 5C3 Collapse Calculations:Intermediate Calculations :
A 2.8762 0.10679 10 5. Syc. 0.21301 10 10. Syc 2. 0.53132 10 16. Syc 3.
B 0.026233 0.50609 10 6. Syc.
C 465.93 0.030867 Syc. 0.10483 10 7. Syc 2. 0.36989 10 13. Syc 3.
K3 B
A.
2 BA
F 46.95 106. K3.
Sy K BA
. 1 K( )2.G F B.
A
A 3= B 0= C 2932=
K 0= F 2= G 0=
Yield Point Collapse:Not a true collapse, but rather that value of external pressure that results un tubular yield stress at theinside wall of the tube. Derived from theoretical analysis, experimental results indicate this formula to besomewhat conservative. Basis for this formula is Lame.
Dt 23=Pyp 2 Syc.
ODt
1
ODt
2.
DypA 2( )2 8 B C
Syc. A 2( )
2 B CSyc
.Dyp 12=
Pyp 9213= psi
Plastic Collapse:
Derived empirically from 2488 collapse tests on K55, N80, and P110. Formula developed from the modified elastic collapse formula.
Dp Syc A FC Syc B G( ).( )
. Pcp Syc AOD
t
B. C Dt 23=
Dp 21=
Pcp 3043= psiTransition Collapse:
Arbitrarily determined, developed from elastic collapse formula. Curves for elastic and plastic collapsepressure do not intersect until pressure falls below minimum elastic collapse. Transition collapse was developed to overcome this anomaly.
Dt 23=Dtr2 B
A3 B.
A
Ptr Syc FOD
t
G.Dtr 26=
Ptr 3644= psi
Elastic Collapse :
Derived from theoretical work by W.O. Clinedinst for the API.
Pec 46.95 106.
ODt
ODt
12
.Pec 3991= psiUsing API 5C3 Collapse Formulae :
If (D/t) < Dyp then use Pyp, Yield Strength CollapseIf (D/t) < Dp then use Pp, Plastic CollapseIf (D/t) < Dtr then use Ptr, Transition CollapseOtherwise use Elastic Collapse Calculation...

III:34
Collapse of Tubulars (SPE 26317)SPE paper #26317 presented in 1993 by Issa (Exxon) and Crawford (Stanford U.) features an improved method of calculating tubular collapse. The basis for their formula is a large number of non-linear finite element analyses using differing geometric tolerances and mechanical properties. Full scale testing was done to verify results of the FEA, both for magnitude and tubular shape. Testing verified analysis within 6%, a value judged to be acceptable based on assumptions.
Elastic Collapse Pressure
Pe 2 E
1 mu2. 1
Dt Dt 1( )2..
Pe 5383= PSI
Elastic-Plastic Collapse Pressure
Pec Syc Dt 1
Dt2. 7.0333
1 0.1295 12.3298 SycE
. Dt.
.
Pec 6286= PSI
Tubular Collapse for Near Perfect Tubulars : (often the case with machined parts)
Po Pe Pec2
Pe Pec( )2
2Po 5383= PSI
ASME Design Criteria for Collapse:Reference: The New Type Code Chart for the Design of Vessels Under External Pressure;ASME Pressure Vessel and Piping Design, Collected Papers; E.O. Bergman; 1960... and ... Theory and Design of Pressure Vessels, 2nd Ed.; John F. Harvey; Van Nostrand, Reinhold; 1991; p.604
Long Cylinders:Cylinders are considered long if length is greater than lc as given by the equation below. This equation is considered valid provided the corresponding compressive stress does not exceed the proportional limit (yield strength).
lc 1.11 OD. ODt
. lc 64= and L 10= inches
PcASME 2 E.
1 mu2
tOD
3.
PcASME 4933= PSI
σcASME E
1 mu2
tOD
2. σcASME 57753= If σc>SY, then use short cyl. formula;
Intermediate Cylinders:For two lobe failure mode with L~lc:
Pc1ASME2.6 E. t
OD
2.5.
LOD
0.45 tOD
.Pc1ASME 38391= PSI
Short Cylinders:Failure is by plastic yielding at the yield strength of the material; characteristic of thick walled cylinders in which the influence of length is negligible.
Pc2ASME 2 Sy. tOD
. Pc2ASME 10250= PSI

III:35
Page 4 of 6 Lame Formulae for Stress in Thick Walled Vessels:
In thick walled vessels, stress varies widely from inside to outside wall, and ordinary membrane forumaeare not satisfactory for indication of state of stress.
For Internal Pressure Only Conditions:
Under this loading condition, tangential stress is always numerically greater than radial stress, and is at its maximum at the inner fibers. Maximum stress under given operating conditions is presented below:
σti Pin a2 b2.
b2 a2σti 56148= psi tensile stress
SFσti Syσti SFσti 2.14=
Deformation of the cylinder under internal pressure:
Under certain conditions, as in a packer mandrel, PBR, or seal mandrel, deformation of the inner and outer wall under applied pressure effects performance.
Inner fiber:
δii Pin a.
Ea2 b2
b2 a2mu. δii 0.0109= inches radial
Outer fiber:
δoi 2 Pin. a2. b.
E b2 a2.δoi 0.0106= inches radial
For External Pressure Only Conditions:
Under this loading condition, tangential and radial stress are both compressive, with tangential alwaysnumerically greater. maximum stress occurs at the inner fiber. Maximum radial stress occurs at the outer fiber and is equal to the applied external pressure. Maximum stress under given operating conditions is shown below:
σto 2 Pout. b2
b2 a2.
σto 55033= psi compressive stressSFσto Sy
σto SFσto 2.18=
prediction of collapse pressure using the Lame formula would be as follows:
Plame b2 a2
2 b2.Syc. Plame 9213= psi external pressure
Deformation of the cylinder under external pressure:
Under certain conditions, as in a packer mandrel, PBR, or seal mandrel, deformation of the inner and outer wall under applied pressure effects performance.
Inner fiber:
δio 2 Pout. a. b2.
E b2 a2.δio 0.0104= inches radial
Outer fiber:
δoo Pout b.
Ea2 b2
b2 a2mu. δoo 0.0102= inches radial

III:36
Page 5 of 6 Roark & Young Collapse Formulae:
For thin walled vessels:Reference: Southwell, R.V.; On the Collapse of Tubes by External Pressure; Philos. Mag.; vol 29; p.67, 1915Saunders, H.E. and Windenburg, D.F.; Strength of Thin Cylindrical Shells Under External Pressure; Trans. ASME vol 53, p.207, 1931Jasper T.M. and Sullivan, J.W.W.; The Collapsing Strength of Steel Tubes; Trans. ASME vol.53, p.219, 1931
PcR 2 tOD
. Sy
1 4 SyE
. OD2 t.
2.
. PcR 3136= psi
Tamano Equations for ultimate collapse strength :
For reference only; applicability remains under study .Elastic Collapse:
Pe 2 E.( )
1 mu2
1
ODt
ODt
12
.
. Pe 5383= psi
Yield Collpase:
Py 2 Sy. ODt
1. tOD
2. 1 1.47
ODt
1
.Py 10456= psi
Sir William Fairbairn's Formula for Short Tubes with External Pressure: βL
ODReference: Machine Design Data Handbook; p-7.12; McGraw Hill; 1994
Lm L 25.4. ODm OD 25.4. (metric conversion for use with formula as stated in text)
tm t 25.4. To be valid, β < 6 : β 0.8=Pcwf 9657600 tm2.19
Lm ODm..
Pcwf 34422= psi
Harvey - Theory and Design of Pressure Vessels 2nd Ed :For reference only; applicability remains under study.Two Lobe Short Section (eq. 8.2.2):Refernce: Seely and Smith; Advanced Mechanics of Materials; Wiley & Sons; 1960
Assumes thin walled vessel (i.e. stress at ID = stress at OD)
P822 83
E. tOD
3. P822 6024= PSI
Elastic Collapse of Long Cylinders or Tubes (eq. 8.2.37 and 8.2.38):Equation is considered valid unless compressive stress exceeds yield strength:
P8237 2 E.( )
1 mu2
tOD
3.
P8237 4933= psi
Compressive Stress:
σ8238 E
1 mu2
tOD
2.
σ8238 57753= psi
and Sy 120000= psi

III:37
Collapse of Thick Walled Cylinders Under External Pressure (Tresca & VonMises):For reference only:
Conditions of the Fully Plastic Wall:Equations for the average stress through the cylinder wall are:
Tangential (8.4.1):
σ841 Pout OD.( )2 t.
σ841 52683=
Radial (8.4.2):
σ842 Pout2
σ842 2250=
Longitudinal (8.4.3):
σ843Pout OD
2
2.
OD2
2 ID2
2σ843 27517=
Full yielding occurs when the pressure is sufficient to increase effective stress to material yield strength.
Tresca failure theory (8.4.4):σTresca σ842 σ841
σTresca 50433=VonMises failure theory (8.4.5):
σVM σ842 σ841( )2σ842 σ843( )2
σ841 σ843( )2
2 σVM 43676=
and Sy 120000= psi
Tests of thick walled cylinders show much lower results than predicted by these theories. When the highest triaxial stress is used, good agreement with experimental results is obtained.

III:38
5) Wellheads
5.1) Product Description
The ‘wellhead’ is oilfield terminology for the upper end of a structural pressure vessel that is used to drill
and case the wellbore. All casing strings are suspended from the wellhead. The wellhead is comprised of a series of
‘housings or spools “, which allow the casing string (s) to ‘hung-off’, “sealed”, and “suspended”. Wellheads are
categorized as either ‘surface’ or ‘subsea’. This paper will address the surface platform type wellhead (see attached
illustration).
A typical wellhead is described from bottom upward, as follows:
a) ‘A Section’ Casing Head Housing: 20” Assy Housing, f/ 18-5/8” Casing
b) ‘B Section’ Casing Spool Assembly: f/ 13-5/8”, 9-5/8”, and 7” Casing
c) ‘C Section’ Tubing Spool Assembly: f/ 2-7/8” tubing and tubing hanger
d) A typical tree is described as: ‘D Section’ Christmas Tree stacked gate valves
5.2) Functional Requirements
The functional requirements of the wellhead are as follows:
a) Hang, seal, and suspend casing (s); per drilling program
b) Provide surface well control:
1. Contain drilling / reservoir fluid pressures with the wellhead at the surface
2. Injection capability; for killing the well; casing (s) annuli’s
3. Flowing the well during the DST (well test).
4. Maintain pressure integrity of casing strings via casing hangers / pack-off’s
c) Facilitate ‘bleeding-off’ wellbore pressure; casing (s) annuli
d.) Adaptable to the surface BOP (blow out preventor)
5.3) Technical Requirements
Typical technical requirements of the wellhead are:
a) Meets the operator’s purchase order specification for Wellhead and Production Tree.
b) Design per API 6A 17th edition; Monogram Typically Required.
c) Typical Test per API 6A 17th Ed.
‘A Section’ = PSL3
‘B Section’ = PSL3
‘C Section’ = PSL3G
‘D Section’ = PSL3G
d) Typical Temperature rated per API 6A 17th Ed.

III:39
‘A Section’ = P, U
‘B Section’ = P, U
‘C Section’ = P, U
‘D Section’ = P, U
e) Typical Material Class per API 6A 17th Ed.
‘A Section’ = DD, EE
‘B Section’ = DD
‘C Section’ = DD, EE
‘D Section’ = DD, EE
f) Quality Plan:
Unique to Project
Supplier designator: Quality Plan Number
Factory Acceptance Test required; third party witness
Meets ‘NACE MR-01-75’,”Sulfide Stress Cracking Resistant Metallic Material for Oilfield Equipment”
5.4) Supplier Equipment Ratings
Typical manufacturer’s rating: Standard API 6A 17th Edition “Standard for Wellhead and Trees”.
a) Casing Head and Spool Housing: 5,000 psi working pressure
b) Tubing Spool: 5,000 psi working pressure
c) Tree: 5,000 psi working pressure
5.5) Ratings Validation
The wellhead manufacturer should have verified the equipment ratings by both analytical and empirical
means in accordance to API 6A “ Standard for Welleads and Tress” 17th Edition. A design file is established to
document the equipment design, manufacture, test, and performance verification
5.6) Performance Demonstration
The wellhead manufacturer should have demonstrated the compliance of their equipment via demonstrated
performance tests to API 6A 17th Edition, per product specification level (PSL level specified by the operator). Test
results are on file.
5.7) Wellhead and Accessories Leak Path
The wellhead is further described as consisting of pressure containing/load bearing components used to
suspend casing and tubing. These components are casing head housings/spools, tubing head spool, crossover spools,

III:40
etc. (API 6A, 17th Edition) There are two principle types of wellheads; the standard or compact. Compact
wellheads are differentiated by their functions of suspending casing loads. The standard version is illustrated in the
appendix. Note how the load paths are transferred into the wellhead.
In either version, isolation of individual casing strings is provided by either elastomers or metal-to-metal
(MTM) seals. Pressure containment is also provided by ring gaskets and bolted flanges or by proprietary connectors
and seals. The tubing is likewise suspended at the wellhead by a tubing hanger. Tubing pressure is isolated at the
tubing hanger forcing produced fluids into the surface production tree.
5.7.1) Drilling
Drilling operations are simply described as providing a “bore hole” to place casing tubulars to be
suspended at the wellhead. As the progression of placing the various sizes of the tubular (casing) into the well,
cementing the casing annuli is routinely done to isolate formation pressures and fluids. A blow out preventor (BOP)
provides the surface well control needed during drilling of the boreholes. As the casing strings are placed and
landed at the wellhead, two types of suspension means are typically explored; slip or “wrap around” hangers or
mandrel type hangers.
Both the slip type or mandrel casing hanger employ various sealing technologies. The mandrel type casing
hanger typically uses metal-to-metal (MTM) sealing technology of proprietary design by the wellhead manufacturer.
In contrast, the elastomer seals are usually an “off-the-shelf” design by various seal manufacturers. The wellhead
manufacturer consults the seal supplier for design data to construct the sealing components. The use of elastomer
seals during casing operating requires the determinations (measurements) of exact dimensions (outside diameter), in
order to achieve sealing integrity. Wellhead operations personnel make these determinations on site and select from
an array of various sizes of elastomers. A more in depth discussion of elastomer sealing technology in offered in
this report.
MTM seals have recessed or non-recessed polished bore receptacles in the casing head housing. Non-
recessed bores are susceptible to damage. Setting tools are used to energize the MTM into the polished bore. These
tools are either mechanical torque set or hydraulic set. A pre-determined compression of the MTM seals is
necessary during installation.
5.7.2) Production
With all casing strings in place, the tubing is run, suspended and sealed. Produced fluids are restricted to
the tubing string (flow conduit) from downhole to the surface tree. Since the tubing is replaceable by nature, the
dynamics of pressure, loads, and temperature play a significant role in sealing integrity. Various means and
materials achieve a seal between the tubing and production casing. At the surface, the casing tubing annulus is
usually sealed by either elastomers or MTM sealing technology. Whereas downhole casing/tubing annulus sealing
is achieved with a packer (see discussion on packers in this report).

III:41
6) Liner Hangers
6.1) Description
Liner hangers are used to suspend liners inside of larger ID casing. Liners can be used as drilling liner, or a
production liner. Hangers can be set either mechanically or hydraulically. Liner hangers employ the use of slips to
suspend or hang the liner. A liner hanger’s slips are usually longer and have a “shallower” angle than a production
packer slip. This feature allows for more contact area between the slip and the production casing so as to reduce
stress and allow a higher load capacity. When used by themselves, liner hangers are not always designed as a
pressure vessel, as some designs do not have a solid body. The pressure seal is obtained by the cement sheath in the
casing/liner overlap.
Frequently a liner top packer is utilized to prevent pressure communication with the liner/casing annulus in
the event of an uncemented or poorly cemented liner. A liner top packer can also be used instead of a production
packer in a monobore type completion. Liner top packers may be run integral to the liner hanger, or when equipped
with a seal assembly them can be run on an additional trip. This “second trip” packer’s seal assembly then seals
into an extension sleeve above the hanger, or a PBR below the hanger.
Liners can be used for several reasons such as
1. Cover a lost circulation or weaker upper zone
2. Repair corroded production casing
3. Reduce cost over a full string of casing
4. Case off a normal pressured zone prior to drilling into a depleted reservoir
5. Provide a PBR completion
6. Allow test of deeper interval prior to plugging back to primary pay interval
6.2) Design Basis
Service Company manufacturer’s proprietary or internal design.
6.3) Potential Leak Paths
1. In the liner / casing annulus
2. Liner hanger thread connection
3. Past the elastomer in a hydraulic set hanger
4. Liner Top packer Seal (if used)
5. Liner top packer and hanger connection (if integral)
6. Liner top packer seal assembly (if “second trip”)
6.4) Leak Prevention
1. Properly validated design

III:42
2. Adequate manufacturing QC
3. Good cement job
4. Proper installation procedure
5. Sufficient liner/casing overlap
6.5) Remediation Options 1. Continue to use as is after assessing risk
2. Attempt to cement squeeze liner top
3. If hanger is so equipped install a liner top packer
4. Install a production packer above leaking liner top

III:43
7) Stage Cementing Tools
7.1) Description
Stage Cement Tools (SCT) or “DV” tools (differential fill) are used to divert the flow of cement during
primary cementing of casing strings. SCT are used where “full sting” cementing is undesirable. The SCT is placed
in the casing string during casing makeup and conveyed downhole to the pre-determined location.
A SCT is best described as a sliding sleeve. The sleeve is opened to direct the flow of cement into the
annuli. Once a predetermined volume of cement is pumped the sleeve can be closed. Long-term pressure integrity
of the SCT is based on the longevity of the SCT’s elastomer seals that effectively seal the sliding sleeve. SCT’s are
not normally used in the production casing string as elastomer degradation and loss of pressure integrity would be
intolerable.
SCT’s are normally found in use in intermediate casing strings, and are considered a potential leak source
of annuli pressure should the cement sheath fail (micro annuli).

III:44
8) Sub Surface Safety Systems
8.1) Description
The subsurface safety valve is the main component of the downhole safety system. However there are
other components of the system, which should be discussed. The usual components of a subsurface safety system
are:
1. Control System (SCSSV only)
2. Communication System (SCSSV only)
3. Subsurface Safety Valve
The focus of this topic discussion will be on downhole safety systems as it pertains to sustained casing
pressure. Therefore only the communication system and subsurface safety valve will be discussed in this section.
8.1.1) Communication System
The communication system provides the means of transmitting energy, usually hydraulic pressure, via a
control line from surface down to the subsurface safety valve, if required, to keep the valve open.
8.1.2) Subsurface Safety Valve
The subsurface safety valve is the heart of the subsurface safety system. In the event of a catastrophe on
the surface, the subsurface valve can shut the well in below the surface. This relieves the surface equipment from
the pressure load in case of a fire or when an impact renders the wellhead equipment incapable of holding pressure.
Surface safety equipment should react to routine alarm conditions, while the subsurface valve should react to
catastrophes.
8.1.2.1) Types of Subsurface Safety Valves
There are generally three criteria used to define the types of subsurface safety valves. These are:
1. Type of Control
2. Type of Closure
3. Retrievability.
8.1.2.2) Subsurface Control
There are two main types of control of subsurface safety valves: direct and remote. These are often
referred to as Subsurface Controlled Subsurface Safety Valve (SSCSVS) and Surface Controlled Subsurface Safety
Valves (SCSSVs).
Direct (subsurface) controlled safety valves, also called "storm chokes", sense downhole conditions.
Whenever the conditions at the valve depth exceed a preset parameter, the valve closes. The parameter usually
measured is either flow rate or ambient pressure, either of which is affected by the failure of the wellhead or surface
equipment. Those SSCSVs closed by flow rate detect failure by measuring increased pressure differences across the

III:45
valve due to increases in flow rate. Usually a choke bean creates restriction in the flow stream. The valve shuts
when a pressure drop across the valve exceeds a preset valve. This valve is called a "differential pressure" valve, or
a velocity valve. Another type of SSCSV is the ambient pressure valve. This type of SSCSV utilizes the production
pressure in the tubing at the valve to determine when closure should occur. It has a charged chamber containing gas
at a preset pressure. When tubing pressure at the valve depth drops below this charged pressure, the valve closes.
8.1.2.3) Surface Control
Remote control subsurface safety valves are relatively insensitive to changes in operating conditions. They
rely on the loss of operating energy to cause them to "fail" in the closed (or "safe") position. This loss of operating
energy can be created by the surface control system or by physical breakage of the communication system (i.e., loss
of a Christmas tree).
An SCSSV is opened when energy (usually pressurized hydraulic fluid) is applied to the topside of a piston
area. The backside of the piston area is usually exposed to tubing pressure. When the control line pressure (applied
plus hydrostatic) is great enough to overcome tubing pressure the SCSSV will open.
8.1.2.3.1) Valve Operation
The opening and closing mechanism of this valve is dependent on several forces produced by either the
hydraulic pressure or production pressure in the tubing string. There are two operating pressures acting on these
valves. Production pressure (Pl) at the valve and hydraulic control line pressure (P2). P2 is created both by the
hydrostatic head of the control fluid in the line and pressure generated by the control system.
8.1.2.3.2) SCSSV-Special Features
Many Surface Controlled Subsurface Safety Valves can have special features which may be advantageous
in certain installations. Among these are deep service valves, self-equalizing valves, temporary and permanent
abandon, wireline valve backup, flapper protection, and special service (corrosion) valves. Most of these features do
not have an effect on whether or not the equipment may be the cause of sustained casing pressure.
8.1.3) Permanent Abandonment
Most tubing retrievable safety valves have a permanent lock open feature, which allows it to be
permanently locked open using a "permanent lock open tool." This feature keeps the safety valve in the open
position without hydraulic control pressure. It is used when the tubing is pulled, permitting pulling a dry string. The
permanent lock open feature is also used in the event of safety valve malfunction. When the safety valve has been
permanently locked open, it may accept a separation sleeve or a wireline insert valve.
8.1.4) Types of Closure
Subsurface safety valves are closed by one of three major types of closing mechanisms:

III:46
1. The first subsurface safety valves were Poppet Valves. Poppet Valves close off flow by a valve member moving in the same direction as the flow, which produces a seal with a seat. This closing mechanism is currently used primarily in direct controlled safety valves (SSCSVs).
2. The Flapper Valve is a modified poppet valve that is hinged on one side. When the valve is open, flow is relatively unrestricted. Most flapper valves are equipped with a flow tube which opens the flapper. A torsion spring acting on the flapper forces the flapper to swing upward and engage the valve seat. Once the flapper valve has engaged the valve seat, increased pressure below the flapper valve increases the sealing forces between the flapper and seat.
3. The third type of subsurface safety valve closing mechanism is the Ball. Ball Valves have the protected seal and the smooth straight conduit features of the Flapper Valve. The ball is actuated by a cam and the linkage to the flow tube.
8.1.5) Retrievability
The third way to describe downhole safety valves is by their retrievability, that is, how they are retrieved
and brought to the surface for repair or replacement. Subsurface controlled subsurface safety valves are wireline
retrievable. Surface controlled subsurface safety valves can be either wireline retrievable or tubing retrievable.
"Wireline Retrievable" safety valves are run and pulled on wireline (slickline). They are attached to
"locking mandrels" which lock them into a "landing nipple" in the tubing string. Landing nipples are short pieces of
tubing with special profiles cut internally, which match the profiles of the locking mandrel keys. When installing a
subsurface safety valve which utilizes nipples and lock mandrels, the pressure limitations of each component must
be considered. Wireline Retrievable valves are selected because of the ease with which they can be retrieved. Their
major disadvantages are their restricted flow area and that they must be pulled in order to perform certain wireline
operations below the valve.
Tubing retrievable safety valves have a much larger flow area, which reduces the restriction of flow
through the tubing. These larger valves also permit wireline equipment to be run through them without disturbing
the safety valve. Tubing Retrievable valves are run as an integral part of the tubing string. If a valve failure occurs
(failure to open, failure to close, or failure to seal) the tubing must be pulled to replace the valve. Another option
would be to install a direct-controlled valve in the well, or to install a secondary wireline retrievable safety valve
into a profile which most tubing retrievable valves possess.
8.1.6) Wireline
In the event of a tubing retrievable safety valve malfunction, a wireline retrievable insert valve can be run
into the nipple profile in the I.D. (of most tubing retrievable safety valves) after it has been permanently locked
open.
The packing of the wireline retrievable insert safety valve straddles the tubing retrievable SCSSV from top
to bottom. It uses the same control line which previously operated the tubing retrievable SCSSV. Therefore, if a
tubing retrievable safety valve malfunctions, an insert safety valve can be run inside it. This feature can prevent
costly workovers.

III:47
A separation sleeve may be used while troubleshooting. It may be installed in a permanently locked open
safety valve to test the integrity of the control line. The packing on the separation sleeve straddles the safety valve
from top to bottom. It is installed and retrieved by wireline.
8.2) Functional Requirements
8.2.1) Tubing Retrievable
1. Connect to tubing string
2. Withstand internal pressure
3. Withstand collapse pressure
4. Subject to temperature cycling
5. Stop well flow when closed
6. Failsafe close
7. Subjected to various fluids and gases
8. Subjected to tension and compression loads
9. Ability to reopen valve
8.2.2) Wireline Retrievable
1. Installed and retrieved by wireline
2. Lands and seals in profile nipples
3. Contain internal pressure
4. Stop well production when closed
5. Failsafe close
6. Subjected to various fluids
7. Ability to reopen valve
8.2.3) Desirable Characteristics of Subsurface Safety Valves
In order for a subsurface safety valve to operate properly and in a reliable fashion, its design should include
the following features:
1. It should include sensors that measure abnormal conditions as quickly and directly as possible. When possible, the system should detect an abnormally before a catastrophic failure occurs.
2. It should be highly reliable.
3. It should be simple. Only when it is an operational necessity should components be added to the system. Reliability worsens rapidly as the number of components increases.
4. It should be durable. This is particularly true of surface equipment since it represents the final barrier to a complete catastrophe; it is also true for subsurface safety valves.
5. It must be designed to give years of service in the expected downhole environment (pressure, temperature, loading, corrosion, erosion, etc.).
III:48
8.3) Design Basis
Industry standards used are API 14A / ISO 10432.
8.4) Potential Leak Paths
8.4.1) Material failure
For purposes of this document only the failures that could cause sustained casing pressure will be
discussed. There are numerous components that could fail. While this would cause valve failure, it would not
necessarily be a cause of sustained casing pressure. This type of failure would occur due to induced stress exceeding
the allowable yield stress of the metallic components. Failure could be brought on by poor design, erosion,
corrosion, material and/or manufacturing lacking proper QC, installation damage, or changes in operational
conditions that exceed original design criteria. This would generally be a catastrophic failure.
8.4.2) Connection leakage.
Due to the nature of subsurface safety systems there are numerous connections with leak potential.
1. Control line connections/bushings from the tubing hanger to the SCSSV
2. Tubing joint connections where the SCSSV connects to the tubing string
3. SCSSV body joint connections: Due to the requirements for assembly an SCSSV usually contains two or more body joint connections. These are usually manufacturer proprietary.
Depending on the design, the sealing mechanism of these connections can be proprietary metal to metal,
elastomer, interference, or a combination.
8.5) Leak Prevention
As previously discussed much can be done early in the design stages to reduce the potential for problems.
These actions include proper material selection to withstand the environmental requirements, proper design and
review, and proper validation testing. Validation testing is especially critical for elastomers and determining the
combined load capabilities of the body joint connection.
8.6) Remediation Options
After determining through diagnostic means that the cause of casing pressure is due to a pressure integrity
failure of the subsurface safety system, there are some options.
1. Continue to use as is, after risk assessment.
2. Sealant could be pumped in an attempt to plug a control line leak. The only control line leakage we are concerned with here is in the control line itself or the connections/bushings. Any leakage through the operating system of the SCSSV (i.e. past the piston) generally will leak internally into the flow stream and not to the annulus.

III:49
3. SCSSV Body joints, might be isolated out by locking the valve open and installing a wireline retrievable valve if the TRSCSSV is so equipped to receive one.
4. Pull the equipment and repair or replace.

III:50
9) Expansion Joint
9.1) Description
An expansion joint is used to compensate for tubing movement caused primarily by changes in
temperature. It is run on the tubing string and can be splined to transmit torque or can rotate unless in the full open
or closed position. The sealing of moving parts is by elastomer seals.
9.2) Design Basis
Manufacturer’s proprietary basis of design.
9.3) Potential Leak Paths
1. Body Failure
2. Tubing End connections
3. Internal Body connections
4. Seal Failure
9.4) Leak Prevention
1. A properly validated design
2. Attempt to reduced the frequency of seal movement
9.5) Remediation Options
1. Continue to use as is, after risk assessment.
2. Attempt to re-space and reduce tubing movement thereby exposing the seals to different seal surface.
3. Pull tubing to repair or replace.

III:51
10) Seating Nipples
10.1) Description
There are three types of seating nipples used as an integral part of the tubing string.
1. pump seating nipples
2. selective landing nipples
3. nonselective or No-Go landing nipples
Seating nipples, which are used to accommodate a pump, plug, hanger, or flow control device, consist of a
polished bore with an internal diameter marginally less than the tubing drift diameter. Usually a lock profile is also
required, especially for landing nipples.
Seating nipples and the devices that are set inside them can be used for the following purposes:
1. to facilitate pressure testing of the bottomhole assembly and tubing couplings, and the setting of hydraulic packers
2. to land and seal off a bottomhole pump (pump seating nipple)
3. to isolate the tubing if it is to be run dry for high drawdown perforating
4. to land wireline retrievable flow controls, such as plugs, tubing safety valves, bottom hole chokes, and regulators
5. to plug the well if the tree must be removed
6. to land bottomhole pressure bombs
7. to pack-off across blast joints
8. to install a standing valve for intermittent gas lift
9. to plug the tailpipe below packer in order to pull the tubing without killing the well
10. to temporarily plug the well while the rig is moved on or off the well
10.1.1) Selective Landing Nipples
Selective Landing Nipples are nipples with a common internal diameter. In some, the lock profile is varied
for easy identification. Others are accessed by tripping the lock mechanism at the selected depth. Selective nipples
are used when more than one nipple is required within a single string of tubing, and the designer wishes to maintain
maximum through bore.
10.1.2) No-Go Landing Nipples
No-Go Landing Nipples are designed with an ID that is slightly restricted to provide a positive shoulder to
locate a locking mandrel. At least one No-Go nipple is usually located at the bottom of the tubing string or tailpipe
to prevent loss of swabbing or other wireline tools into the sump.

III:52
10.2) Design Basis
Service company manufacturer’s proprietary design.
10.3) Potential Leak Paths
1. Body Failure
2. Tubing Connection leak
10.4) Leak Prevention
1. Proper design validation
2. Proper installation procedure
10.5) Remediation Options
1. Continue to use as is after risk assessment.
2. Pull tubing and replace
III:53
11) Flow Couplings
11.1) Description
Flow couplings are special joints having tubing ID and collar or coupling OD dimensions. They are
usually manufactured from special heat-treated steel.
Since most flow controls restrict the ID, the tubing above and below the controls can be protected against
internal erosion by use of a flow coupling. Flow couplings should be run immediately above and below any landing
nipple which maybe used to install a downhole choke, or retrievable SCSSV or SSCSSV. In high rate or corrosive
gas wells, flow couplings should be used above and below all upsets or profile changes to reduce erosion, especially
if the turbulent fluid contains abrasive particles.
The length of the flow couplings vary. The length depends on several factors, depending on flow rate, fluid
composition, and or individual company policy.
11.2) Design Basis
Service company manufacturer’s proprietary design
11.3) Potential Leak Paths
1. Body failure
2. Tubing connection leak
11.4) Leak Prevention
1. Properly validated design
2. Proper installation procedures
11.5) Remediation Options
1. Continue to use as is after risk assessment
2. Pull tubing and repair or replace

III:54
12) Side Pocket Mandrels
12.1) Description Side pocket mandrels (SPM) are a special eccentric nipple that can accommodate a valve parallel to the
tubing to control access to the annulus. They can be used to install wireline retrievable gas-lift valves, circulation
devices, flow control valves, and injection valves. The location of the side pocket mandrels for gas-lift valves will be
determined by the lift gas pressure available, kickoff requirements and the density of the fluid to be lifted. If high
density brines and kill fluids are to be kicked out with gas, a closer spacing is needed than on dead oil wells that will
be swabbed-in and only have to kick-off from the free-standing liquid level.
It is sometimes desirable to have an SPM located just above the top packer in high pressure gas well
completions for installation of a shear-open kill valve and/or injection valve. These are used to facilitate a
controlled circulation kill in the event the upper tubing becomes obstructed. They are also used as a connection
point for corrosion-inhibitor lines. Some operators use side pocket mandrels to install a pressure and temperature
sensor that can transmit data to the surface via a cable attached to the outside of the tubing.
Some engineers prefer to use a side pocket mandrel instead of a sliding sleeve above the top packer. The
elastomer seals on a side pocket circulation valve are easily retrieved and redressed using wireline, while repair of
those in a sliding sleeve requires a workover. However, most side pocket circulation valves have a limited
throughput capacity. Using a side pocket mandrel without using a seat protector runs a risk of cutting out the valve
seat in the mandrel, which would inevitably require a workover to replace the mandrel.
Conventional Gas lift Valves: Conventional gas lift valves are not discussed here as there will always be
pressure on the casing during gas lift.
12.2) Design Basis
Service company manufacturers proprietary design
12.3) Potential Leak Path
1. Body failure
2. Tubing connections
3. Seals on flow control device
4. Through the side pocket device (i.e. valve)
12.4) Leak Prevention
1. Properly validated design
2. Proper manufacturing QC
3. Proper installation procedures
4. Avoid excessive circulation rate through an empty side pocket

III:55
12.5) Remediation Options
1. Use as is after assessing the risks
2. Pull and repair or replace valve or flow control device
3. Pull tubing and repair or replace mandrel
III:56
13) Sliding Sleeve
13.1) Description
Also referred to as sliding side doors or circulating sleeves, these tubing components are used to obtain
access from the tubing to the tubing/casing annulus either for fluid circulation or to permit a previously isolated zone
to be produced. They are opened and closed with a wireline tool that has a locating key that engages the profile in
the sleeve.
These devices are typically placed above each packer in the well. Obviously, they are an essential
requirement of mufti-zone completions scheduled for selective production. Many producers run sliding sleeves in
each string of a multi-string completion to increase production flexibility.
A sleeve is sometimes run above the upper packer and can be useful for the following operations:
1. kick-off by displacing the tubing contents with a low-density fluid and avoiding use of coiled tubing or circulation of low-density fluids before the packer is set
2. minimizing the cost of well killing prior to a tubing pulling job or workover
3. circulating out completion fluid with a packer fluid (e.g. from mud to brine or from water to inhibited brine) or changing packer fluid types (e.g. spotting corrosion inhibitor or thermal insulating fluid)
4. testing of subsurface safety valve (SSSV)
5. spotting treatment fluids
13.2) Design Basis
Service company manufacturer’s proprietary design basis
13.3) Potential Leak Paths
1. Body Failure
2. Tubing Connections
3. Body Joint Connections
4. Sealing failure at the elastomer sleeve seal
13.4) Leak Prevention
1. Properly validated design
2. Proper manufacturing QC
3. Proper installation procedure
4. Reduce frequency of operation
5. Use of molded/bonded seals
6. Reduce differential across seal when opening

III:57
13.5) Remediation Options
1. Continue to use as is after risk assessment
2. Open and close to attempt to reestablish pressure containment of seal
3. If sliding sleeve is equipped with profile and polished bore: run isolation sleeve
4. Pull tubing to repair or replace

III:58
14) On Off Tool
14.1) Description
An on/off tool is usually a short compact, overshot type tubing disconnector, with a jay that automatically
engages and releases with rotation. The On-Off Seal Unit is used with double-grip retrievable packers, or with latch
type seal assemblies.
When mounted above a double grip retrievable type packer, this tool provides a means of disconnecting the
tubing string without unseating the packer. The overshot portion connected to the tubing usually contains the
elastomer seals. These seals can be pulled with the tubing and inspected without removing the packer or seal
assembly.
The mandrel OD has a sealing finish and a wireline profile is sometimes machined into the mandrel to
allow the ability of blanking off the zone below the packer with a wireline retrievable plug.
14.2) Functional Requirements
1. Provide pressure containment (internal/external)
2. Withstand tension and compression loads
3. Ability to transmit torque through the tool
4. Wireline profile for plugging
5. Able to engage and disengage multiple times
6. Connect to tubing and packer or latch type seal assembly
7. Capable of withstanding well fluids and operating temperatures
14.3) Design Basis
Service company manufacturer’s design criteria
14.4) Potential Leak Paths
1. Body failure
2. Tubing/Packer connection leak
3. Leak past elastomer seals
14.5) Leak Prevention
1. Eliminate or minimize tubing movement that would cause seal wear
2. Proper selection of materials (metallic and elastomers)
3. Properly validated design
14.6) Remediation Options
1. Continue to use as is after risk assessment

III:59
2. Set plug in wireline profile if well is to be temporarily abandoned
3. Pull tubing and overshot and replace the seals
4. Pull Packer or seal assembly to repair or replace

III:60
15) Safety Joint
15.1) Description
A Tubing Safety joint is commonly used above packers when some type of emergency tubing string
separation is required because of the likelihood of a stuck packer or seal assembly. Safety joints are usually operated
by either rotation or straight pull shear release. Rotation type safety joints are usually best when large tension loads
are expected.
15.2) Design Basis
Service company manufacturer’s proprietary design basis
15.3) Potential Leak Path
1. Body Failure
2. Tubing/Packer connections
3. Safety Joint connections
15.4) Leak Prevention
1. Properly validated design
2. Proper manufacturing QC
3. Proper installation procedures
15.5) Remediation Options
1. Continue to use as is after risk assessment
2. Pull and repair or replace

III:61
16) Packers
16.1) Description
Packers are used in wells to provide a pressure tight barrier. The barrier may be intended to separate a
tubing space from an annular space or to divide a well into compartments above and below the packer.
The strategic uses of packers include the following:
1. Protection as it allows use of kill and / or inhibited fluid in the annulus. It allows diversion of corrosive fluids into the tubing.
2. Isolation Between Zones in multi-zone completions
3. Gas Lift to confine gas to the annulus so that gas can be injected into the tubing in a controlled amount
4. Control of Slugging by diverting all produced fluids into the tubing which prevents gas and liquids from building up in the annulus and periodically kicking liquid slugs up the tubing
5. Pressure Containment by diverting high-pressure well fluids into the tubing reducing the risk of casing failure
Packers can be categorized in several ways.
1. Setting method:
a. Mechanically Controlled Tools. Tools are set and released mechanically by manipulation of the drill string or tubing
b. Hydraulic Controlled Tools intended for hydraulic manipulation can be designed to function off surface induced pressure in the drill pipe/tubing pressure or exposed to the well's hydrostatic pressure
c. Wireline Controlled Tools
1. Electric Conductor Line using a pressure setting assembly
2. Slickline - This is a nonconductor line; in other words. no electrical current is passed through the wireline. A set of downhole jars and weight bars are used to develop the setting/unsetting force.
3. Sandline - This type of line is the strongest type wireline commonly used in the field. It is employed when the well is not under significant pressure.
2. Retrievability:
a. Permanents which are sometimes called drillable or seal bore packers: The typical packer in the group is permanently installed in a well until it is drilled/milled out. This group includes some packers that are retrievable but their construction is similar to permanents.
b. Retrievables: The typical packer in this class is run and retrieved on tubing. Some types of this group have opposing lockable slips and can be run with on off tools that allow the tubing to detach from the packer after it is set.

III:62
16.2) Permanent Packers
16.2.1) Description
The term permanent refers to the packer's attachment to the casing wall by opposite acting slips. Permanent
packers are called permanent because they cannot be retrieved on the production string. The most commonly used
permanent packers are designed to be drilled out or milled out rather than recovered.
A few permanent packers are actually made to be retrievable. They may have either a shear release or they
may have an unlocking mechanism. Many of the retrievable permanents can only be retrieved with a special service
tool that must be run in after the production string is recovered.
Permanent packers have obtained a reputation for dependability in hostile environments due to their simple
design, construction and operation.
The principal features of a permanent packer are the central rubber packing element, the seal bore and the
external opposing slips.
16.2.2) Setting Methods for Permanent Production Packers
16.2.2.1) Wireline set
A wireline set permanent production packer (with or without an expendable plug) is run to the desired
setting depth and set with the appropriate size wireline pressure setting assembly (PSA) and adapter kit.
Once the packer is set and the pressure setting assembly is retrieved, the tubing, seal assemblies, and
production tube are lowered into the well.
An electrical impulse triggers an explosion within the pressure setting tools piston chamber to set the
packer. Ensuring the proper oil level in the setting tool as well as the correct power charge will help ensure that the
packer is set properly by applying the correct force and time to set. Too little oil in the setting tool will cause a lack
of driving force and too quick a power charge burn will result in an improperly set packer.
16.2.2.2) Mechanical Setting Tool
Mechanical set permanent production packers have drag springs that allow torque to be transmitted to the
packer for setting. Rotation of the tubing string will release the upper slips of the packer. An upward pull is then
initiated at the tool to set the lower slips and compress the sealing elements. Once the packer has been set the setting
assembly is retrieved from the well and replaced by a locator seal assembly and the well is placed on production.
16.2.2.3) Hydraulic Setting Tool
A hydraulic setting tool is available for setting permanent packers on drill pipe or tubing. It is similar to the
mechanical setting tool in that the tool is used only for setting the permanent packer, and must be retrieved after the
packer is set. The hydraulic setting tool must be released from the packer and tripped out of the well. The final
tubing string with a seal assembly on bottom would be run in and landed to complete the hook up.

III:63
The setting procedure starts with making up the packer on the setting tool. The packer is run down to
setting depth. A ball is dropped from surface, which lands in a seat in the setting tool. Applying tubing pressure
causes the upper slips to set. Pulling tension can then set the lower slips. The set of the packer should be checked
by slacking off weight and pulling weight. The packer manufacturer should recommend the amount of weight to
pull and set down to ensure that the rubber elements are fully set and that this will hold their rated pressure
differential. The setting tool can then be released from the packer.
The hydraulic and mechanical setting tools are also useful when there are severe doglegs in a well which
would cause a packer run on wireline setting assembly to hang up.
16.2.2.4) Self Setting Permanent Packers
Special one trip hydraulically set permanent packers are used in many deviated wells. This "hydro-set"
packer has a packer setting mechanism attached to the bottom of the packer body. The seal assembly is pinned or
latched to the packer so that all components: tailpipe, packer, seal assembly, and final string can be run together.
Once the tool is "on depth" a ball is dropped into the production tubing allowing it to fall into a seat in the
packer. After pressure is applied to set the packer, a further elevation in tubing pressures will shear the ball seat
loose, allowing it to fail to bottom.
16.2.3) Seal Assemblies
The second half of a permanent packer is the seal assembly that lands in the bore of the packer. The seat
assembly may have a latching device or it may be run without a latch so that the seal assembly can move within the
packer in response to tubing stress and movement. Seal assemblies typically have chevron type packing rings.
The seal assembly can be landed in three modes as discussed
16.2.3.1) Unlimited or Free Motion
The tubing movement is accommodated by sufficient seal bore extensions under the packer, by a PBR
(Packer Bore Receptacle), or an Overshot Seal Assembly above the packer. The seal assembly is stabbed into the
seal bore without latching or locking. Free vertical travel is possible.
16.2.3.2) Limited Motion
To aid the space out of seal assemblies, a Location Shoulder is often used so that the seal assembly will
bottom-out on the packer or receptacle. This provides the option of landing the tubing such that the seals will not
move downward during normal production operations, but are free to move up if the well is cooled.
16.2.3.3) Latched or Fixed
The tubing is latched or fixed on the packer allowing no movement
16.2.4) Design Basis ISO 14310 and manufacturer’s proprietary design

III:64
16.2.5) Potential Leak Paths 1. Packing Element System leak can be caused by:
a. Elastomer extrusion
b. Thermal/Chemical effects on the packer elastomer element
c. Damage upon installation
d. Failure of the packer element back ups
e. Packer body loc ring failure
All of which can cause the packer element to lose pressure sealing capability
2. Body to seal bore extension connection leak can be caused by differential pressure below the packer-to-packer ID. Since the pin connection is generally a thinner cross section. Excessive differential can cause pin deflection and loss of pressure integrity from the production casing annulus, especially if seal assembly is located in seal bore extension below this pin.
2. Left Hand Square Thread failure only occurs when tubing is anchored as tensile load is taken through a thread relief and internal pressure results in swelling. Failure causes loss of seal integrity and is catastrophic.
3. Seal assembly seal leak can be caused by damaged seals during installation, seal bore damage, seal movement out of the seal bore, wear on seals due to excessive seal movement, adverse reaction to well fluids/temperature/or excessive pressure.
3. Seal Assembly mandrel connections (if any): Generally referring to a failure of mandrel connection. Usually caused by loss of pressure integrity, due to combined loading effect and design of connection.
4. Tubing to seal assembly connection: could be caused by improper makeup, damage, or improper type connection for the combined loads of tension, compression, burst, collapse encountered.
16.2.6) Leak Prevention
1. Properly validated design
2. Proper manufacturing QC
3. Proper installation procedure
4. Design for no seal movement, if possible
16.2.7) Remediation Options
1. Continue to use is, after risk assessment
2. Check space out to ensure seal assembly fully landed
3. Pull seal assembly and repair/ replace seal assembly
4. Run another production packer above packer in question
5. Drill/Mill out packer and replace
III:65
16.3) Retrievable Packers
16.31) Description
Packers of the retrievable design usually include a manual or automatic jay ("J") and/or a hi/lo cam.
Basically these mechanisms allow the tool to be run into the wellbore in a "safety position" Retrievable packers
may also have a rotation or hydraulic setting mechanism. With a mechanical set retrievable, upon reaching the intended setting depth, a manipulation of the work
string will un-jay the tool and allow weight or tension to pack off the rubber sealing elements.
The main components of a retrievable packer are
1. Slips or holding devices: Which are either mechanically operated (Slips) or hydraulically operated (holddown buttons). Slips and hold downs keep the tool in place and maintain compression loads on the packing element.
2. Packing element made from various elastomer compounds and when compressed seals against the casing wall.
3. Gauge rings on either side of the packing element. They are the largest OD of the retrievable packer also act as an extrusion barrier when the packing element is compressed. In permanent packers, back up rings or shoes that expand to the casing ID are used instead of gauge rings.
4. Mandrel is the basic strength member of the packer. It provides the flow path through the packer. The strength of the mandrel and the elastomer rating determine the pressure rating of the packer.
5. Bypass valve or unloaders are often found on retrievable packers. They allow communication of pressure around the packing elements. This helps prevent swabbing off the elements while running and also helps to equalize pressure when unsetting the packer.
16.3.2) Design Basis
ISO 14310 and service company manufacturer’s proprietary design.
16.3.3) Potential Leak Paths
1. Packing element failure. Can be caused by:
a. Damage or abrasion to the elements either during installation or while in operation
b. Improper gauge ring size (i.e. extrusion gap)
c. Insufficient force applied to pack off against the casing
d. Thermal or chemical reaction from the environment
2. Mandrel Failure. Mandrel failure could be caused by erosion, corrosion or induced stresses exceeding the yield stress.
3. Mandrel connection failure or
4. End connection failure. Leakage through the threaded connection for a number of potential reasons. End connections are typically EUE type connections of limited pressure ratings while the mandrel connection is usually a proprietary thread that incorporates an elastomer o-ring for sealing.

III:66
5. Bypass failure. Bypass leakage could be caused by damage to either the elastomer or metal lip. Leakage could occur because of damage caused by opening under higher than recommended differential pressure. Elastomer could be damaged by thermal or chemical reactions.
16.3.4) Leak Prevention
1. Proper installation procedure
2. Utilize proper class of retrievable packer for the application
3. Properly validated design
4. Proper manufacturing QC
16.3.5) Remediation Options
1. Continue to use as is after risk assessment
2. Attempt to reset or reposition packer
3. Pull tubing and repair or replace packer

III:67
17) Polished Bore Receptacles
17.1) Description
The Polished Bore Receptacle (PBR) was introduced to the industry as an alternative to the packer type
completion. Its main attribute is an integral sealing mechanism between the tubing and the casing string requiring no
secondary tools or setting. PBR’s can be installed (a) directly in the casing string, (b) as a part of the liner hanger, or
(c) on top of a production packer.
The PBR is simply a section of heavy wall pipe with a honed inner surface into which a seal assembly is
run.
As with a permanent packer seal assembly, the tubing can be anchored, have limited motion, or be free to
lengthen and contract in response to pressure and temperature change.
Where PBR's are installed as part of the casing or liner, they provide the greatest possible through bore
across the tubing to casing pack-off. Therefore, they are common on deep high pressure wells completed with small
liners and on very high rate wells.
PBR Type Seal Receptacles are sometimes used on top of packers in place of an overshot seal receptacle or
seal bore extension. Redundant seals are less exposed to the produced fluid in this configuration, but more liable to
damage during installation than with an overshot arrangement.
17.2) Design Basis
Service company manufacturer’s proprietary design basis
17.3) Potential Leak Paths
1. Body failure
2. Lower PBR connection leak (for liner top or packer installations only)
3. PBR connection leak (for long PBRs)
4. Past the elastomer seals of a seal assembly
17.4) Leak Prevention
1. Properly Validated Design
2. Properly qualified connections
3. Elastomer seals on Seal assembly validated
4. Proper manufacturing QC
5. Proper installation procedure
17.5) Remediation Options
1. Continue to use as is after risk assessment

III:68
2. Respace to ensure full seal engagement
3. Pull and replace seal assembly
4. Install (stack) a packer if PBR is on a liner hanger or production packer PBR
5. Install a production packer if PBR is installed in the casing

III:69
18) Conclusions
As referenced throughout the previous discussion, the elimination of sustained casing pressure due to
improper design or equipment application is best handled early in the well construction process. Many problems
could be eliminated before the equipment is installed by proper design verification, equipment validation, and
manufacturing quality controls.
Once the equipment is installed there are a limited number of options available to eliminate the sustained
casing pressure problem. Generally the two options are:
1. Isolate across the leak if possible, such as installing an isolation sleeve in a leaking sliding sleeve, or installing a wireline retrievable safety valve inside a tubing retrievable valve with a leaking body joint connection.
2. Remove and repair or replace the component.
Both of these require well intervention to repair subsurface equipment.
A third option previously discussed would not eliminate the casing pressure, but the option is to continue to
operate after performing a risk assessment.

III:70
19) Recommendations
Further study in the form of a separate project is needed to determine the risk of sustained casing pressure
occurrence and also the risk danger to the environment. The risk would be determined by developing quantitative
risk analysis, HAZOP’s. Additional “tools” should be developed such as “fish bone” diagrams of failure modes and
decision trees for the most common types of equipment. This would aid by developing steps for corrective action to
reduce possibility of SCP in future installations and how to deal with it when it occurs.

III:71
20) References
20.1) Elastomers
1. Composite Seal Solves Downhole Well Nightmare; Yeaple & Hertz; Design News; 7/20/87
2. Designing with Elastomers; D.L. Hertz; March, 1983
3. Engineering Design with Rubber; P.B. Lindley; MRPRA
4. Handbook of Engineering Design with Rubber; Beerbower; (preliminary manuscript) 1978
5. Handbook of Fluid Sealing; Brink, Czernik, & Horve; McGraw-Hill; 1993
6. Handbook of Plastics, Elastomers, and Composites, 2nd Ed.; C.A. Harper; McGraw-Hill, 1992
7. Let’s Make Some Sense on the Aging of Rubber; D.L. Hertz; April, 1993
8. Mechanics of Elastomers at High Temperatures; D.L. Hertz; December, 1979
9. Mobil Completions Handbook; Vol. 1
10. Natural Rubber in Engineering; Lindley & Leaver; Malaysian Rubber Producers Research Association
11. O-Rings for Low-Pressure Service; D.L. Hertz; Machine Design; March, 1979
12. Preparation of Elastomer O-Ring Specifications; Parkers Seals; ERG Fall Meeting, 1993
13. Principles of Polymer Engineering, McCrum, Buckley, & Bucknall; Oxford University Press; 1992
14. Rubber Products Manufacturing Technology; Bhowmick, Hall, & Benary; Marcel Dekker; 1994
15. Rubber Under Strain; D.L. Hertz; Elastomers; December, 1991
16. Sealing High Pressure Under Sour Conditions; D.L. Hertz; ASME 84-Pet-7
17. Seals and Sealing Handbook, R.H. Warring; Gulf Publishing, 1981
18. Vanderbilt Rubber Handbook 13th Ed.; R.F Ohm; R.T. Vanderbilt Company; 1990
20.2) Engineering Design Practices
20.2.1) API Publications
19. Bulletin on Performance and Calculations for Casing, Tubing, Drill Pipe and Line Pipe Properties (5th Ed.)
20. Specification for Casing and Tubing
20.2.2) Risk Based Design of Well Casing and Tubing (SPE Seminar)
5. A Reliability Approach to the Design of OCTG Tubulars Against Collapse
6. Analytical Burst Strength Prediction of OCTG With and Without Defects
7. Burst Pressure Prediction of Thin Walled, Ductile Tubulars Subjected to Axial Load
8. Collapse Behavior of Casings: Measurement Techniques, Numerical Analysis and Full Scale Testing
III:72
21. Determination of Casing and Tubing Burst and Collapse Design factors to Achieve Target Level of Risk, Including Influence of Mill Source
22. On the Development of Reliability-based Design Rules for Casing Collapse
23. The Development of Risk-Based Burst Design for Well Casing and Tubing
20.3) Misc. Papers and Publications
24. Advanced Mechanics of Materials; Seely & Smith; Wiley & Sons; 1960
25. An Improved Design Equation for Tubular Collapse
26. Collapse Resistance of Pipe; W.O. Clinedinst (PhD dissertation)
27. Machine Design Data Handbook; McGraw-Hill; 1994
28. On the Collapse of Tubes by External Pressure; R.V. Southwell; Philos. Mag.; Vol. 29; 1915
29. Strength of Thin Cylindrical Shells Under External Pressure; Trans. ASME Vol. 53; 1931
30. The ASME Code Simplified; Pressure Vessels; 7th Ed.; Chuse & Carson; McGraw-Hill; 1993
31. The Collapse Strength of Steel Tubes; Trans. ASME Vol. 53; 1931
32. The New Type Code Chart for the Design of Vessels Under External Pressure; ASME Pressure Vessel & Piping Design; Collected papers of E.O. Bergman; 1960
33. Theory and Design of Pressure Vessels, 2nd Ed.; J.F. Harvey; Van Nostrand, Reinhold; 1991
34. Mobil Well Completion Handbook
35. Mobil Well Equipment Design Manual
36. Arun Indonesia: Bigbore Completion Tool Design; R. Sukup Mobil E&P Technology Company; OTC 7328
37. Bigbore Well Completions: A New Completion Technique for Arun Field: R.A.Sukup Mobil E&P Technology Company SPE 25384

III:73
Appendix A: Diagrams
A.1) Packer Performance Envelope

III:74
A.2) Wellhead schematic

III:75
A.3) Wellbore sketch with casing and wellhead

III:76
A.4) Wellbore diagram with downhole equipment

SECTION IV: CORROSION CONSIDERATIONS IN SCP

IV:1
1) Introduction
Despite efforts by Oil & Gas Operating Companies to design and install production tubing and casing
strings that will remain leak-free for the operational life of their wells, there are a number of time dependent
degradation mechanisms that may result in leakage into the production tubing-by-production casing annulus. The
most significant (or certainly the most publicized) of these degradation mechanisms appears to be corrosion and/or
environmentally induced cracking of the tubing and casing strings and their associated completion hardware.
The inner surface of the production tubing string is, of course, susceptible to the corrosive effects of the
produced well fluids. The most significant active corrosive species found in the primary production from Gulf of
Mexico (GOM) oil and/or gas wells appears to be the acid gases, carbon dioxide and hydrogen sulfide. When these
acid gases dissolve in the formation brine or condensed water that is usually produced from the well, low pH,
aqueous solutions result. These solutions, in turn, may produce corrosion and/or environmentally induced cracking
(sulfide stress cracking or chloride stress cracking) of the alloys used in the production tubing and production casing
strings.
There appears to be a growing body of recent evidence that traces of organic acids (sometimes present in
produced well fluids) may also play a significant role in lowering the pH, and thus increasing the corrosivity, of the
produced water or brine. Also, in gas lift wells and water injection wells (used for reservoir pressure maintenance),
oxygen can be accidentally introduced into the well tubing or into the tubing-by-production casing annulus. At
comparable concentrations, it is known that oxygen is much more corrosive than either CO2 or H2S to carbon and
low alloy steels. Experience has thus shown that even very small concentrations of oxygen in hot salt water can
result in very high corrosion and pitting rates in carbon and low alloy steels.
The exterior of the production casing string (below the outer, surface and/or intermediate strings) may also
be exposed to the action of corrosive formation fluids. The extent that the formation fluids attack the exterior of the
production casing will, of course, depend upon the quality and the height of the cement used to install the production
casing. In addition, the “exposed” exterior of the production casing string may suffer corrosion due to the action of
any “stray DC currents” that may “go to ground” over this section of casing.
The outer surface of the production tubing and the inner surface of the production casing may also suffer
corrosive attack by the “packer” or well completion fluids that are usually left in the annulus for well control
purposes. These completion fluids are commonly high salinity brines that may become very aggressive if they are
contaminated by small leaks of carbon dioxide or hydrogen sulfide (from the production stream) or by small
concentrations of dissolved oxygen (air).
1.1) CO2 Corrosion
As detailed below, the severity of corrosion due to carbon dioxide in “sweet” oil and gas wells depends
upon a number of environmental conditions. These include (but are not limited to): the partial pressure of carbon
dioxide in the produced gas, the well temperature, the composition of the produced water, the amount and
characteristics of any liquid hydrocarbons produced from the well, the velocity and flow regime of the production

IV:2
stream, the in-situ or down-hole pH of the produced water and the tendency for stable iron carbonate scale to form
on the corroded tubing surface.
Corrosion due to carbon dioxide can occur as general weight-loss corrosion, as pitting and as localized
corrosion in areas of turbulence and changes in flow direction. Pieces of equipment in the production tubing string
that contain changes or restrictions in the flow path are thus particularly susceptible to corrosion attack. For
example, accelerated attack has been observed in landing nipples, in elbows at the wellhead, and in the “J-areas” of
API connections.
Numerous models that purport to predict the rate of corrosion due to carbon dioxide have been described in
the literature. These models are based both on considerations of basic electrochemical and hydrodynamic effects
and upon expert systems developed from field observations. Several of the domestic model developers also offer
commercially available technical support to operators that may need to investigate the anticipated severity of
corrosion for specific applications.
In using the corrosion rates predicted by a model (for assessing the anticipated life of a tubing string or in
performing economic evaluations of alternative corrosion mitigation schemes), it is important to determine the
extent to which the model incorporates all the important aspects of the specific well under consideration. It should
also be remembered that the conditions in the well (e.g., total well pressure and thus partial pressure of carbon
dioxide, composition of the produced brine, concentration of hydrogen sulfide, flow rate and flow regime of the
produced well stream, etc.) may undergo substantial changes during the life of the well. The predicted corrosion
rates over the total anticipated range of operating conditions that may be experienced during the life of the well
should thus be investigated.
Before using a particular model, the user should also understand the basic philosophy used in developing
the model. It is our understanding that some of the models are intended to give conservative, worst case corrosion
predictions while other models reportedly use correlations with field data to produce more realistic, representative
predictions.
1.2) H2S, Sulfide Stress Cracking
Tubing and casing strings are typically “designed” for resistance to sulfide stress cracking (SSC) by
limiting the selection of materials for sour service to those that are essentially immune to SSC (regardless of
exposure time) at stress levels up to some useful percentage of their yield strengths. The concentrations of hydrogen
sulfide above which the production stream is considered “sour” (and which will thus probably cause SSC) are
defined in NACE Standard MR0175-2000, “Sulfide Stress Cracking Resistant Metallic Materials for Oilfield
Equipment”, Figures 1 and 2 [1]. Other important variables that, according to MR0175, have an effect upon the
tendency for alloys to exhibit SSC include:
1. Alloy hardness,
2. Alloy chemistry and heat treatment,
3. Water/brine pH,
4. Temperature,

IV:3
5. Time,
6. Total stress.
A careful reading of MR0175 indicates that other variables may also have an effect upon the tendency of an
alloy to exhibit SSC. These include:
1. Water/brine composition (salinity and buffering capacity),
2. Presence/absence of cold work in the alloy,
3. Presence/absence of elemental sulfur in the well environment,
4. The manufacturing process used to produce the alloy.
Alloys were originally added to MR0175 based upon their successful use in sour service in the field.
MR0175 has, however, since been accepted as a mandatory requirement by several regulatory bodies. New alloys
are thus presently added to MR0175 based upon the results of laboratory testing. The testing procedures given in
NACE Standard Test Method, TM0177, “Laboratory Testing of Metals for Resistance to Specific Forms of
Environmental Cracking in H2S Environments” [2], are typically used as the vehicle to add new materials to
MR0175.
Materials that have been found to be acceptable (from the standpoint of SSC) for specific equipment and
components used in oil & gas production are discussed in Sections 6 through 11 of MR0175. Section 10, in
particular, discusses tubulars and subsurface equipment for use in oil & gas production.
1.3) Other Damage/Degradation Mechanisms
In addition to CO2 corrosion and sulfide stress cracking, other time dependent damage mechanisms that
may lead to leakage into the “primary”, production tubing-by-production casing, annulus include the following:
1. Stress Corrosion Cracking (SCC or Chloride Stress Cracking) of austenitic stainless steels and similar alloys,
2. Erosion,
3. Galvanic corrosion effects caused (for example) by coupling more corrosion resistant alloy completion hardware (e.g., packers, etc.) to carbon steel tubulars,
4. Environmentally and/or stress induced degradation of elastomeric seals,
5. Wear/abrasion of “movable” seal areas due to accumulation of debris and/or corrosion products,
6. High or low cycle metal fatigue due to temperature and/or pressure cycles,
7. Gradual penetration of the thread dope used to seal API connections by the combined effects of temperature/pressure cycles and attack of the thread dope by high pressure gas,
8. Crevice corrosion in tubing or casing connections, seal areas, etc.,
9. Corrosion initiated by improperly executed acidizing operations,
10. Corrosion caused by contamination of the well by oxygen (accidental introduction of air into the well),
11. Corrosion in the well annulus due to the action of bacteria and/or algae (MIC),
12. Damage caused by running wire lines and/or coiled tubing in the well.

IV:4
These latter potential damage mechanisms are outside the scope of the present discussion but should, of
course, be considered during well design considerations.
1.4) CO2 Corrosion Models
A listing and review of several of the existing CO2 corrosion models has recently been published in the
European Federation of Corrosion (EFC) Publication Number 23, “CO2 Corrosion Control in Oil and Gas
Production”, [3]. Table 1 was taken from EFC Publication Number 23. The models listed in Table 1 include
proprietary (in-house) models, models that have been more or less fully documented in the literature and models that
have been privately developed but which are currently commercially available for use.
We have included detailed information describing models 5, 6 and 7 in Attachment A. The information
given in Attachment A was retrieved from the internet at the internet locations identified. Models 6 and 7 were
developed in the U.S. and are currently commercially available for either purchase or for performing individual
assessments of well environments of potential interest.
The early work of de Waard and coworkers that ultimately resulted in the “Shell” model (model 1 of Table
1) revealed many of the significant characteristics of CO2 corrosion of carbon and low alloy steels. For example, the
Shell “Nomogram for CO2 Corrosion” that allows easy estimation of the predicted corrosion rate at various
temperatures and CO2 partial pressures is given Figure 1. The combined effects of temperature and CO2 partial
pressure on the anticipated corrosion rates are shown in Figure 2. A listing of factors (see Table 1) that are known to
affect the rate of CO2 corrosion of carbon and alloy steel tubulars include the following:
1. CO2 partial pressure,
2. Temperature,
3. Water/brine pH,
4. Flow rate of produced fluids and gas,
5. Flow regime of produced fluids and gas,
6. Tendency for protective scales to form on tubing surfaces,
7. The tendency for the steel surface to be oil or water wet,
8. The Ca and HCO3 contents of the produced water,
9. The H2S content of the produced gas,
10. The presence of organic acids in the produced water.
In using any of the predictive models listed in Table 1, the user should, of course, review the details of the
model (with its developer) so that he or she understands the assumptions and limitations built into the model. The
user should also investigate if the model is designed to estimate a “worst case” (highest) corrosion rate or if it is
designed to predict average corrosion rates.
In addition to the parameters listed immediately above (and in Table1), the ability of each model to include
the effects of the following well parameters should also be investigated. If these additional well parameters are not
included in the analyses, methods to quantify and include their effects should be considered.

IV:5
1. Local hole angle and its effect upon flow regime,
2. The effects of local turbulence (due to changes in flow cross section or direction),
3. Erosion,
4. The tendency for pitting and/or crevice corrosion to occur in the well environment,
5. The anticipated effectiveness of the corrosion inhibitors and inhibition programs that may be used in the well,
6. The anticipated effectiveness of internal plastic coatings (if they are to be used in the well).
7. The volume and nature of oil produced by the well (e.g., does the oil have a tendency to deposit paraffin?).
It should also be recognized that the well conditions will probably vary considerably over the life of a well.
For example, the total well pressure and thus the partial pressure of CO2 will probably change significantly. The
relative volumes of water, oil and gas will probably also change. The composition of any produced water
(representing the mixture of formation brine and condensed water) could change significantly during the life of the
well. It is also not unusual for the H2S content of the reservoir, and thus the produced well fluids, to increase during
the life of the reservoir. Finally, if wells are converted to gas lift, gas injection or water injection wells at some time
during their life, the accidental inclusion of oxygen (air) into the annulus and/or tubing of the well may result in
significant increases in the corrosion rates in the well. In using predictive corrosion rate models, the anticipated well
conditions at various times in the life of the well must thus be taken into consideration.
Finally, the user should determine, if possible, the accuracy with which each model has been able to predict
observed field corrosion rates. Ideally, the user will have field corrosion data for reservoirs similar to the one being
investigated for this comparison.
1.5) Sulfide Stress Cracking
As discussed above, tubing and casing strings are typically designed for SSC resistance by selecting
materials for their construction that are basically immune to H2S cracking. Guidelines for selection of candidate
materials for sour service are presented in NACE Standard MR0175-2000. Many of the materials that were
originally included in MR0175 were included based upon successful field service. For new candidate materials that
users and/or manufacturers may want to add to the Standard, however, the testing procedures described in NACE
Standard TM0177 are typically used.
An extensive list of the material and environmental variables that may play a role in sulfide stress cracking
was given above. One of the most important variables identified earlier was the total stress (active plus residual)
that the component may experience while in service. Unfortunately, a careful examination of MR0175 reveals that
there are only limited guidelines in that document concerning the stress levels at which an “acceptable” material
may be successfully used. In addition, although the stress levels used for testing per TM0177 must be determined
and reported for an acceptable test, there are also no recommendations in TM0177 as to the stress levels that should
be considered for use in qualification testing programs.
Discussions with current MR0175 committee members revealed that the stress levels at which candidate
materials are presently usually tested (per NACE TM0177) and approved for use (per NACE MR0175) are 80% to

IV:6
100% of their minimum specified yield strengths. It is our understanding, however, that a material that may have
been tested at lower stress levels might be accepted for use in a specific, low stress application, if the voting
MR0175 committee members felt that the stresses in service would always be low enough to result in an acceptable
level of safety. Again, unfortunately, this level of subtlety in the material selection and approval process is not
obvious from simply reading the two applicable NACE documents.
In comparison, the document EFC Publication Number 16 “Guidelines on Materials Requirements for
Carbon and Low Alloy Steels for H2S-Containing Environments in Oil and Gas Production” [26], lists suggested
acceptance stress levels of 90% or more of the actual yield stress for use in SSC testing of tubing, casing, welded
piping and pressure vessels. For SSC testing of materials for use in “low-pressure containing equipment” and
“heavy section/complex shape components”, the EFC document suggests that an acceptance stress level equal to or
greater than the actual service stress be used during SSC acceptance testing.
A review of API 5CT, “Specification for Casing and Tubing” [27], on the other hand, shows that the API
Grades C90 and T95 must be successfully tested to only 80% of the specified minimum yield strength for these
grades using the procedures of NACE TM0177 in order to meet the requirements of API 5CT for SSC resistance.
Despite its lack of specific guidelines on minimum recommended test stresses for many materials, MR0175
does offer many specific recommendations concerning the material and environmental conditions required for
resistance to SSC. For example, the maximum acceptable hardness levels (and thus, by inference, the maximum
strengths) of a large number of materials are given in the specification. There are also admonitions that specific heat
treatments must be performed on some alloys. There are specific limitations on the chemical composition and
metallurgical microstructure of several alloys. There are also requirements that specific manufacturing processes
must be used in the production of various alloys.
Several sections of MR0175 deal specifically with materials for use in tubulars and down hole equipment.
Section 10.2, for example, covers materials for use in tubulars and tubular components. Section 10.3, on the other
hand, covers materials for use in other subsurface equipment (e.g., gas lift equipment and packers). Table 5 of the
specification lists “Acceptable API and ASTM Specifications for Tubular Goods” while Table 6 lists “Acceptable
Materials for Subsurface Equipment”.
1.6) Corrosion and Cracking in Environments Containing Both H2S and CO2
For service environments that contain appreciable levels of both H2S and CO2, test environments defined in
NACE MR0175 can be used to generate data concerning resistance to corrosion as well as environmental cracking.
For example, Table 1 of MR0175 lists test environments containing partial pressures of H2S and CO2 of up to 508
psi at temperatures of up to 4100 F.
For production environments containing more than 20 to 30 psi CO2 and more than 1 to 2 psi H2S, it is
common for high alloy materials to be considered for use in the production tubing and casing strings. A listing of
corrosion resistant materials that have been used in oil and gas production environments is presented in the NACE
Publication 1F192, “Use of Corrosion-Resistant Alloys in Oilfield Environments” [28]. Included in Publication
1F192 (in Sections 5, 6 and 7) are a list of environments in which various alloys have been successfully used. For

IV:7
example, as discussed in Sections 6.3.1.2 and 6.3.1.3, there appears to be a growing consensus that 9Cr-1Mo and 13
Cr materials (when properly heat treated) can be used for tubulars in handling environments containing H2S partial
pressures as high as 0.5 to 1.5 psi.
Another NACE publication, 1F196, “Survey of CRA Tubular Usage” [29], presents a survey and history of
the use of high alloy materials for oil and gas production tubing and casing. The data presented in 1F196 represents
information from both U.S. domestic as well as international operations. Information presented below in Table 2
compares the footage of various alloy tubulars that have been used in world-wide operations with the footage that
has been used in Gulf of Mexico (GOM) operations. It is interesting to note that while GOM operations accounted
for only approximately 14% of total world-wide CRA tubular footage (at the time of the survey), the use of the more
highly alloyed tubulars (Alloy 28 through C276 in Table 2) in GOM operations accounted for approximately 57% of
the world-wide use of these higher alloy materials. These data appear to indicate that either domestic U.S. well
designers are more conservative (specify higher alloy materials) than engineers that design international wells or that
GOM operations include production environments that are significantly more aggressive than those encountered in
international operations.
Recommendations for test procedures to be used in evaluating the corrosion and environmental cracking
resistance of candidate corrosion resistant alloys can also be found in EFC (European Federation of Corrosion)
Publication Number 17, “Corrosion Resistant Alloys for Oil and Gas Production: General Requirements and Test
Methods for H2S Service” [30]. As in NACE TM0177, EFC Publication Number 17 discusses specimens that
consist of smooth uniaxial tensile samples, 4-point bent beam samples, and C-ring samples. EFC Publication
Number 17, however, also discusses the use and interpretation of slow strain testing in evaluating the resistance of
alloys to sulfide stress cracking. In addition, EFC Publication Number 17 discusses test methods to be used for
evaluating the resistance of alloys to environments that contain both H2S and elemental sulfur. Laboratory data and
field experience have both shown that the presence of elemental sulfur may result in very aggressive corrosion of
alloys used for production tubing and casing.
Information of the type presented in the NACE publications MR0175, 1F192 and 1F196 has been used by
the manufacturers and suppliers of alloy tubulars (along with what appears to be the results of their own extensive,
in-house testing programs) in developing simple guidelines for the use of various alloys in down-hole environments.
The alloy selection guides from several manufacturers of CRA tubulars are presented in Attachment B. The
selection guides that cover the full range of environmental conditions typically use a threshold CO2 concentration (in
the range of ~3 to 30 psi partial pressure in the gas) to switch from carbon and low alloy steels to higher alloys. The
higher alloys then initially considered generally consist of 13 Cr and or one of the duplex stainless steels (e.g., 2205
or 2507). At even higher temperatures and higher H2S partial pressures, austenitic Fe-Cr-Ni alloys (e.g., Alloy 28
and Alloy 825) and other high alloy, proprietary alloys are typically recommended.
It is our understanding that the test data used to generate the selection guides presented in Attachment B
include possible effects due to sulfide stress cracking (SCC), chloride stress cracking (SCC), general weight loss
corrosion as well as pitting and crevice corrosion. It is recommended that detailed discussions with the
manufacturers be conducted prior to selection and use of a material based upon one of the guides. If the anticipated

IV:8
use environment is significantly different than the range of environments used to generate the selection guides, it
may be necessary to perform high temperature, high pressure autoclave and/or flow loop testing to investigate the
suitability of any of the various candidate alloys.
A commercially available, computer based “Expert System” is available that, according to its developer,
allows the user to “select applicable materials (CRAs) for all types of oil and gas production and non-production
environments”. The expert system is apparently based on data of the type discussed above, as well as laboratory
data generated by the developer of the system itself. It is our understanding that the expert system, which uses a PC
based Windows environment, can either be purchased or may be used by its developer to supply analyses on a case-
by-case basis. Information concerning the expert system (called “Socrates” by its developer) is included below in
Attachment C.

IV:9
2) Corrosion Prevention
Methods that have commonly been used to successfully combat corrosion (and cracking) of production
casing, tubing and completion hardware include:
• Selection and Use of High Alloy Tubulars (as discussed above),
• Use of Corrosion Inhibitors,
• Use of Internal Plastic Coatings.
The use of production operation changes (such as reduction of the production rate of high temperature, high
pressure gas wells) that might also reduce the corrosion and erosion rates in the well are outside the scope of this
presentation.
2.1) Corrosion Inhibitors
Discussions of corrosion inhibitors and their use in production applications are available in several sources
[31,32,33]. The inhibitors typically used for down-hole applications consist of high molecular weight, polar,
organic molecules. The active portion of the inhibitor molecule generally consists of or contains a monoamine, a
diamine or an amide. The inhibitor apparently functions when the active end of the inhibitor molecule forms a weak
“bond” to the metal surface. The organic end of the inhibitor molecule then forms an oily, water repellant film over
the protected surface.
The amount of inhibitor attached to the surface (and thus the level of corrosion protection) apparently
depends primarily upon the concentration of inhibitor in the produced fluids as well as the temperature. There are
also temperature limits above which the inhibitors change composition and thus lose most of their effectiveness.
Comparative testing of various candidate inhibitors in test environments similar to those anticipated in the field
should be considered prior to initiating an inhibition program. Consideration should also be given to closely
monitoring the on-going performance of inhibitors after the start of production operations.
Methods of inhibitor application include both continuous and intermittent (or batch) treatments. The
method of application usually depends upon the well configuration.
In continuous inhibitor injection, a chemical displacement pump at the surface may be used, in conjunction
with small diameter concentric or non-concentric tubing strings, to pump inhibitor to the bottom of the well on a
more-or-less continuous basis. The use of a concentric string may not require that the well be completed with a
packer between the production tubing and the production casing. A non-concentric inhibitor injection string, on the
other hand, can be used to introduce the inhibitor below a packer or through a side pocket mandrel.
Intermittent or batch inhibitor treatments can be done in wells that have been completed with or without a
bottom-hole packer. For wells completed without a packer, a common treatment procedure consists of injecting a
“batch” of inhibitor into the production tubing-by-production casing annulus and then by-passing production from
the well into the annulus. The inhibitor batch may be simply displaced into the bottom of the tubing from the

IV:10
annulus and then produced with the well fluids/gas after one pass through the tubing. Alternatively, the produced
inhibitor batch may subsequently be circulated back into the annulus (for re-circulation again at a later date).
For wells with a packer, the “tubing displacement” technique is often used. In this method, an
appropriately diluted batch of inhibitor is displaced to the bottom of the tubing string. After what is judged an
appropriate shut-in period, the well is put back into normal operation, thus coating the inner surface of the
production tubing with inhibitor as the inhibitor is produced from the well.
For areas where experience has shown that the inhibitor will not “damage” (significantly reduce the
production capacity of) the producing formation, an inhibitor “squeeze” technique might be considered in wells that
are completed with a packer. In this method, the inhibitor “batch” is displaced to the bottom of the well and is then
displaced or “squeezed” into the surrounding producing formation. The inhibitor is thus adsorbed onto the internal
surfaces of the formation and is slowly produced back up the production tubing when the well is put back into
normal operation.
In wells with a packer, a down-hole injector valve can also be used to periodically or continuously inject
inhibitor solution into the production tubing. In this method, the annulus is typically kept full of inhibitor solution.
The inhibitor treatment then consists of displacing inhibitor into the tubing by injecting additional inhibitor into the
annulus at the surface.
Despite the application technique employed, it is recommended that candidate corrosion inhibitors be
subjected to comparative testing prior to final selection for use in a well. This testing might simply consist of static
exposures of steel coupons to simulated produced brines to which inhibitors have been added. Slightly more
sophisticated testing might include “wheel” testing in which coupons are mounted on a wheel that is rotated such
that the coupons spend part of their exposure submerged in the brine and part of their exposure in the gas phase of
the simulated production environment. Finally, a re-circulating flow loop (in which the anticipated down-hole flow
conditions of the well are duplicated as closely as possible) could be used to give even more realistic predictions of
inhibitor performance.
2.2) Plastic Coatings
Discussions of plastic coatings for use in production tubing are available [32,33]. These sources indicate
that the coating systems normally used to internally coat production tubing consist of either phenolics or fusion
bonded epoxies. Information concerning plastic coating systems from two of the major suppliers of these systems is
given in Attachment D. A review of the information in Attachment D reveals that the upper temperature limit of the
coating systems ranges from approximately 2000F to approximately 4000F, depending upon the coating. The
information also indicates, however, that the coating systems may exhibit substantially lower temperature limits
when exposed to significant concentrations of H2S.
Adequate care must be exercised by the coating manufacturers during the application of internal plastic
coatings. In particular, the inner surface of the tubing is usually given an initial cleaning by acid pickling and water
washing. After the initial cleaning, the inner surface is then sandblasted in order to remove any surface oxidation or
remaining solids. The coating should then be applied as soon as possible following the cleaning, before a fresh layer

IV:11
of rust can form on the cleaned surface. The coatings are then checked for pin-holes (or “holidays”) using an
electrical detector that is sensitive to high conductivity paths through the coating.
A NACE document, Standard RP0191, Standard Recommended Practice, “The Application of Internal
Plastic Coatings for Oilfield Tubular Goods and Accessories” [34], discusses, in detail, the points mentioned above.
Finally, it should be realized that internal coating systems are susceptible to mechanical damage due to
flexing and/or mechanical impacts of the pipe during transportation and running of the tubing. The coatings near the
ends of the pipe are particularly susceptible to handling and “stabbing” damage while the pipe is being run in the
well.

IV:12
3) Corrosion Monitoring
What appears to be a more or less complete compilation of the possible techniques for monitoring
corrosion in general industrial applications has recently been published by NACE in the NACE Publication 3T199,
“Techniques for Monitoring Corrosion and Related Parameters in Field Applications”, [35]. In Publication 3T199,
the monitoring techniques are divided into the following categories:
• Direct methods
Intrusive & Non-intrusive,
• Indirect techniques
On-line & Off-line.
Direct, intrusive monitoring methods include (for example): coupons, and electrical probes that are inserted
through the wall (pressure boundary) of the equipment. Direct, non-intrusive methods, on the other hand, include
measurement techniques that can be performed without penetrating the wall of the equipment. These techniques
include: ultrasonics, magnetic flux leakage, eddy current techniques, radiography and acoustic emission.
Indirect, on-line techniques consist of measurements of some characteristic of the active corrosion
environment. These include (for example): pH, solution conductivity, and dissolved oxygen content of the brine, as
well as flow velocity, pressure and temperature of the produced fluids/gas. Indirect, off-line methods consist
primarily of measurements of the corrosion environment that are made on samples that have been removed from the
system under investigation. These indirect, off-line measurements include measurements of: alkalinity, metal ion
concentrations (e.g., iron and manganese), dissolved solids, dissolved gases and residual inhibitor concentrations in
the produced water/brine.
Our review of the literature revealed that the techniques that are most commonly used to successfully
monitor on-going, active corrosion of down-hole tubulars include: measurements of iron and manganese contents in
the produced brines and measurements of residual inhibitor concentrations. Unfortunately, the areas of primary
interest in the tubing strings may be remote from the surface and significant changes in the corrosion environment
may thus occur as the production stream is brought to the surface. The direct, intrusive techniques and the
remainder of the indirect techniques (other than the measurements of iron and manganese and residual inhibitor
concentrations) have thus not proven to be very useful in tracking down-hole corrosion rates. Also, while dissolved
iron and manganese concentrations and residual inhibitor concentrations can apparently be successfully correlated
with over-all average corrosion rates in production tubing strings, these measurements cannot predict where the
corrosion is taking place and whether or not it may be concentrated over some relatively small portion of the total
well depth.
NACE publications describing the use of coupons [36], hydrogen probes [37], and galvanic probes [38] for
monitoring corrosion in oil and gas operations are available. There is also an NACE publication [39] that describes
the use of “iron counts” (dissolved iron concentrations in the produced water) for monitoring down-hole corrosion
processes.

IV:13
Fortunately, down-hole casing and tubing logging tools have been developed that use most of the
measurement techniques described above as the “direct, non-intrusive techniques”. Although the individual
measurement techniques used in these tools may be described as “non-intrusive”, for the well taken as a whole, the
tools actually are intrusive since the well flow must be shut-in in order to allow the introduction of the logging tools
into the top of the well.
Another NACE document is available [40] that describes the logging tools that have been developed for
evaluating down-hole corrosion in casing and tubing strings. The down-hole casing and tubing logging tools
described in the NACE document include the following:
• Multi-finger, mechanical calipers,
• Ultrasonic tools,
• Electromagnetic tools
DC flux leakage tools
AC tools.
The NACE document also includes discussions of casing potential profile tools, temperature measuring
tools and optical (TV camera) inspections. The measurements of these latter tools, however, do not depend upon the
remaining wall thickness of the casing or tubing and their results are thus only indirect or qualitative indicators of
the condition of the tubulars at the time of the inspection.
3.1) Mechanical Calipers
Mechanical calipers detect the internal radius at a number of circumferential locations in the tubular being
inspected. The “single-stylus” type mechanical caliper records data only from the feeler that is detecting the
maximum internal radius at any depth. In the “maximum-minimum” monitoring tool, the outputs of the two feelers
that are sensing the maximum and minimum internal radius of the tubular at any depth are recorded. The “complete
monitoring” mechanical caliper tools, on the other hand, record the internal radii from all of the feelers of these
tools.
One of the “complete monitoring” mechanical caliper tools (available from Schlumberger) is run on wire
line and the results from each of the feelers are sent back to the surface and are recorded as the tool is run. The only
other “complete monitoring” tool (that we are aware of) is available from the Kinley Corporation. The Kinley tool
is completely mechanical and records the information from each feeler on a down-hole chart drum. The Kinley tool
thus contains no electronics and is reportedly capable of operating at temperatures above 5000 F and in very
aggressive (high H2S) environments.
3.2) Ultrasonic Tools
The ultrasonic tools use pulsed, normal wave ultrasonic transducers to measure the internal diameter and
wall thickness of the tubular being examined. There are two types of ultrasonic tool available. The single
transducer type tool uses a single transducer to send and receive the ultrasonic signal. In this type of tool, either the
transducer itself rotates or there may be a rotating “prism” that directs the sonic pulse to and from the inner tubular

IV:14
surface from a stationary transducer. The multiple transducer type ultrasonic tools, on the other hand, typically use
eight stationary, radially focused transducers to send and receive the ultrasonic pulses.
3.3) Electromagnetic Tools
The DC flux leakage tools use an electromagnet to establish a high DC magnetic field parallel to the axis of
the tubular being examined. As the tool is pulled upward through the tubular, sensitive “pad mounted” search coils
(or solid state detectors) sense the “flux leakage” generated by both internal and external corrosion pitting and
surface roughness of the pipe. The pads of the tool also contain coils that use high frequency AC signals to generate
eddy currents on the adjacent internal surface of the tubular. Signals from these eddy current coils can thus be used
to determine if a matching flux leakage indication has come from an internal or an external imperfection.
Information collected from prior calibration of the tool (using simulated corrosion defects) is then used to estimate
the depth and areal extent of corrosion damage.
The AC electromagnetic tools include: 1) a high frequency “electromagnetic caliper” that measures the
average internal circumference (and thus the average internal diameter) of the tubular being examined and 2) a low
frequency “far-field eddy current” tool that senses the average wall thickness of the tubular. The electromagnetic
caliper uses relatively high frequency signals to determine the average internal circumference over a one to two inch
long axial section of the tubular being examined. The “far-field eddy current” tool, on the other hand, uses the phase
shift and attenuation of low frequency signals induced in the pipe wall between a set of transmitter and receiver coils
to estimate the average wall thickness of the pipe between the coils.
Of the corrosion monitoring tools discussed above, the DC flux leakage tools appear to be the most
sensitive to small, isolated corrosion pits and surface “roughening” due to corrosion. The results of the flux leakage
tools do not, however, appear to be as accurate as those of the other tools.
For measuring the effects of internal corrosion, the multi-finger mechanical calipers are clearly the most
reliable and most accurate of the tools presented above. The mechanical calipers do not, however, give any
information concerning wall losses that may have occurred on the outside surface of the pipe.
Because they only respond to the average values of the inner diameter or average wall thickness of the
tubulars, the AC electromagnetic tools, while apparently reasonably accurate (on a percentage basis) for very large
defects, are almost totally insensitive to small, isolated defects.
The ultrasonic tools, while inherently very accurate, may be susceptible to significant loss of signal when
the inner and/or outer surfaces of the pipe are “rough” or are not oriented perpendicular to the sound beam. In
addition, with the ultrasonic tools, the tubing or casing under examination must be fluid filled in order for the tools
to function.
When tubing (and/or casing) can be retrieved from the well, it can be inspected on the surface with
inspection systems having expanded and improved inspection capabilities. These surface inspection systems have
typically included DC flux leakage devices capable of detecting both circumferential and longitudinal imperfections
and gamma ray inspection devices capable of determining remaining wall thickness.

IV:15
More recent surface inspection systems have included ultrasonic inspection devices with multiple heads,
each containing multiple transducers. Depending upon the surface roughness of the tubing or casing, these
ultrasonic inspection tools (e.g., Tuboscope-Vetco’s “Truscope” inspection system) should do an acceptable job of
finding both crack-like defects and in measuring remaining wall thickness.

IV:16
4) Economic Considerations
Several sources of information dealing specifically with the economic aspects of corrosion are available
[32,41,42]. The NACE document, Publication 3C194 [41], for example, is a very good source of information on the
subject. Although several methods of economic analysis are presented in Publication 3C194, the present worth
(PW) or net present value (NPV) method is recommended, since the PW method is both relatively easy to apply and
is apparently the method normally used in most evaluations of engineering economy.
Generalized equations for performing PW evaluations are presented in Publication 3C194, along with a
number of worked examples. The equations in Publication 3C194 allow the inclusion of the following
considerations in the PW analysis of corrosion related items:
• Calculation of the present values of capital expenditures as well as all expense items that may be incurred during the life of the project,
• The effects of equipment depreciation,
• The effects of federal and state income taxes,
• Effects of the salvage value of equipment at the end of the project.
In order to perform meaningful comparative PW evaluations of several alternatives, the analyst must have
reasonably accurate information concerning the capital, expense and operating costs associated with each
alternative. Accurate information for the anticipated service life of the equipment (tubing, casing and down-hole
completion equipment) in each alternative must also be available or must be estimated. For tubulars and other
down-hole equipment, information concerning the anticipated service life must therefore be available or must be
estimated using one or more of the methods given above. The effects of internal plastic coatings and corrosion
inhibitors can also be included in the PW evaluations if reliable information concerning the effects of these
corrosion “prevention/reduction” methods on the expected useful life of the equipment is available.
As discussed above, it should be remembered that the corrosivity of the produced gas and fluids from a
well may change significantly during the life of the well. The location(s) of the maximum corrosion rates within the
well may also change significantly during the life of the well. These observations should, of course, be considered
during life predictions and PW evaluations of alternative completion schemes.
A listing of the abstracts of a number of published articles dealing with “case studies” of field corrosion
assessments and economic evaluations of alternative completion schemes is given in Attachment E.

IV:17
5) Conclusions
The rate of general corrosion of carbon and low alloy steels by CO2 has been shown to be a complex
function of many well parameters. The most important of these probably include the following:
• CO2 partial pressure,
• Temperature,
• Down-hole (in-situ) water/brine pH,
• Flow rate and flow regime of the produced fluids and gas.
A number of “models” have been developed for predicting the corrosion rates of carbon and low alloy
steels due to CO2. In order to effectively utilize the results of these models, the user should have an understanding
of the basic assumptions employed in developing each model as well as well as a knowledge of which well
parameters have been included in each model.
At exposure temperatures of less than approximately 2250 F, carbon and low alloy steels used in API
tubulars may be susceptible to sulfide stress cracking (see Table 5 of NACE MR0175). As in the case of CO2
corrosion, there are numerous well (and material) parameters that may have a significant influence on the SSC
resistance of the steels. The most important of these apparently include the following:
• H2S partial pressure,
• Temperature,
• Exposure time,
• Hardness (or strength) of the alloy,
• Stress level,
• Water/brine pH.
Information given in several NACE documents [1,2] can be used to minimize the probability of SSC of any
carbon or low alloy steel components that are considered for use in a well.
When significant concentrations of both CO2 and H2S are present in the produced gas from high
temperature, high pressure wells, high alloy tubulars are often considered for use in the wells. Alloy selection
guides (see Attachment B), as supplied by various manufacturers of casing and tubing, are convenient sources of
information for selecting candidate corrosion resistant alloys (CRA’s) for tubing and casing. Several NACE
documents [28,29] also contain applicable information concerning the use of CRA’s for down-hole tubulars.
Our review of the corrosion literature indicated that measurements of iron concentrations and residual
inhibitor concentrations in the produced water/brine from oil and/or gas wells are apparently the currently preferred
methods for “on-line” monitoring of the active corrosion processes in the wells. Unfortunately, these techniques
cannot yield any information concerning the location(s) and distribution of the corrosion that is detected.
When production from a well can be “shut-in”, down-hole logging tools are available for monitoring the
condition of the tubulars in the well. Our experience indicates that the DC flux leakage type tools are the most
sensitive of the available tools for detecting small, isolated corrosion pits and the initial stages of general surface

IV:18
roughening due to corrosion. The size of the DC flux leakage tools generally limits their use to pipe that is
approximately 3-1/2 inches (and larger) in diameter. In cases where internal corrosion of the production tubing is of
sole or primary interest, one of the multi-finger mechanical calipers is clearly the preferred logging tool for
quantifying the extent of the problem. The fully mechanical tool (supplied by the Kinley Corporation) can
reportedly operate at higher temperatures and in more aggressive environments than competitive, electromechanical
tools.
When several technically feasible solutions are available to a corrosion problem, an economic evaluation of
the alternatives should be considered. Information on performing present worth (PW) evaluations of such
alternative solutions to corrosion problems is available in the literature. In performing these PW evaluations, the
analyst needs accurate estimates of the anticipated life of the equipment to be used in the well. In addition, accurate
data for the anticipated capital expenditures and operating costs for the well must be available. A listing of the
abstracts of a number of “case studies” of field corrosion assessments has been included as an attachment to this
report.
Finally, a “General Information” section has been added to the Bibliography, in which a number of papers
that contain useful information are referenced by groupings.

IV:19
TABLES
Table 1: Models
PARAMETER 1 2 3 4 5-NORSOK 6-USL 7-PREDICT
CO2 PAR. PRESS. • • • • • • •
TEMP • • • • • • •
PH • • • • • • •
FLOW RATE • • • • • • •
FLOW REGIME • □ • • • • •
FeCO3 SCALE • □ • • • •
TOT. PRESS. • □ • • • • •
STEEL COMP. • □ • • - - -
WATER WETTING □ □ • - - • •
Ca/HCO3 - • - - - - •
H2S - • • - - • •
ORGANIC ACIDS - • - - - • •
FIELD DATA - • • - - • •
REFERENCES 4,5,6,7 8 9 10 11 12-24 25
• =
□ = - =
Considered directly Considered indirectly, effect assumed small Not considered

IV:20
Table 2: Use of CRA (THOUSANDS OF METERS)
CASING TUBING ALLOY WORLD GOM WORLD GOM 9cr 63.6 0 191.6 0
13cr 38.1 0 2,525.2 202.9
22cr 0 0 371.5 78.7
Alloy 28 0 0 10.7 10.7
825 0 0 68.4 40.1
2550 1.6 1.6 174.9 61.4
G3 0.9 0 10.5 6.1
G50 0 0 38.4 38.4
C276 9.7 3.1 68.8 59.1

IV:21
FIGURES
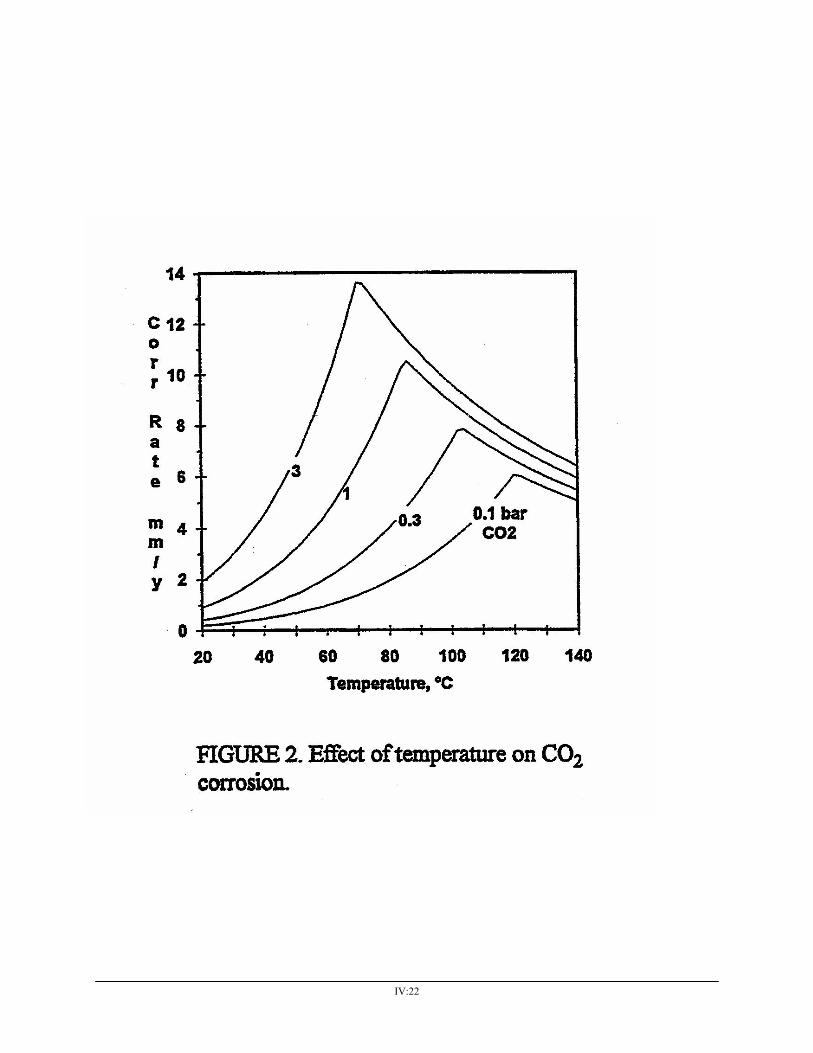
IV:22
IV:23
BIBLIOGRAPHY
References
1. NACE Standard MR0175-2000, “Sulfide Stress Cracking Resistant Metallic Materials for Oilfield Equipment”, 2000.
2. NACE Standard Test Method, TM0177, “Laboratory Testing of Metals for Resistance to Specific Forms of Environmental Cracking in H2S Environments”, 1996.
3. European Federation of Corrosion (EFC) Publication Number 23, “CO2 Corrosion Control in Oil and Gas Production”, 1997.
4. C. de Waard and D.E. Milliams, “Carbonic Acid Corrosion of Steel”, Corrosion, vol. 31, 1975.
5. C. de Waard, U. Lotz and D.E. Milliams, “Predictive Model For CO2 Corrosion Engineering in Wet Natural Gas Pipelines”, Corrosion, vol. 47, 1991.
6. C. de Waard and U. Lotz, “Prediction of CO2 Corrosion of Carbon Steel”, Corrosion ’93, Paper 69, 1993.
7. C. de Waard, U. Lotz and A. Dugstad, “Influence of Liquid Flow Velocity on CO2 Corrosion”, Corrosion ’95, 1995.
8. J.L Crolet and M.R. Bonis, “Prediction of the Risks of CO2 Corrosion in Oil and Gas Wells”, SPE Production Engineering, vol. 6, 1991.
9. Y. M. Gunaltun, “Combining Research and Field Data for Corrosion Rate Prediction”, Corrosion ’96, Paper 27, 1996.
10. S. Nesic, J. Postlewaite and S. Olsen, “An Electrochemical Model for Prediction of Corrosion of Mild Steel in Aqueous Carbon Dioxide Solutions”, Corrosion, vol. 52, 1996.
11. NORSOK Standard, M-DP-001, pub. Norsk Teknoligistandardisering.
12. C.D. Adams, J.D. Garber and R.K. Singh, “Computer Modeling to Predict Corrosion Rates in Gas Condensate wells containing CO2”, Corrosion ’96, Paper 31, 1996.
13. R.S.; Fang, C.S.; Garber, J.D.; Singh, R.K., “Predicting tubing life in annular-flow gas condensate wells containing carbon dioxide”, Corrosion (Houston) v 52 n 10 Oct 1996. p 801-806
14. Garber, J D ; Sangita, K A, “Factors affecting iron carbonate scale in gas condensate wells containing CO sub 2” . NACE, P.O. Box 218340, Houston, TX, USA, Corrosion 98.
15. Garber, J D ; Walters, F H ; Singh, C ; Alapati, R R ; Adams, C D, “Down Hole Parameters to Predict Mist Flow and Tubing Life in Gas Condensate Wells”, NACE International, P.O. Box 218340, Houston, Texas, USA, 1994.
16. Adams, CD; Garber, JD; et al, “Methods of Prediction of Tubing Life for Gas Condensate Wells Containing Carbon Dioxide”, OTC 91, 23rd Annual Offshore Technology Conf; 6-9 May, 1991; Houston, Tx, USA.
17. Garber, J. D.; Varanasi, N. R. S., “Modeling Non-Annular Flow In Gas Condensate Wells”, Corrosion 97-Annual conference, NACE, 1997.

IV:24
18. Harris, G.; Adams, C. D.; Garber, J. D., “Use of a Corrosion Prediction Program as an Engineering Tool”, Corrosion 97-Annual conference, NACE International, 1997.
19. Garber, J. D.; Singh, R.; Rama, A.; Adams, C. D., “An Examination of Various Parameters which Produce Erosional Conditions in Gas Condensate Wells”, Corrosion 95-International annual conference, NACE, 1995.
20. Adams, C. D.; Garber, J. D.; Singh, “Verification of Computer Modeled Tubing Life Predictions by Field Data” Corrosion 93-Conference, NACE, 1993.
21. Adams, C. D.; Garber, J. D.; Hill, A. G., “Expert System for Predicting Tubing Life in Gas Condensate Wells”, CONFERENCE, 1992, NACE, 1992
22. Fang, C.S.; Garber, J.D.; Perkins, R.; Reinhardt, J.R., “Computer model of a gas condensate well containing carbon dioxide”, Corrosion '89, New Orleans, LA (USA), NACE, 1989.
23. J. D. Garber, V. Polaki, C. D. Adams, and N. R. S. Varanasi, “Modeling Corrosion Rates in Non-Annular Gas Condensate Wells Containing CO2,” Corrosion/98, Paper 53, San Diego, California, March 22-27, 1998, NACE International, Houston, Texas.
24. F. Farshad, J. D. Garber, B. Polaki, “A Comprehensive Model for Predicting Corrosion Rates in Gas Wells Containing CO2,” SPE Gas Technology Symposium, Paper 40003, Calgary, Alberta, Canada, March 15-18 1998, Society of Petroleum Engineers Inc., Richardson, Texas.
25. ‘Predict’, “The Ultimate Software Solution for Corrosion Prediction”, Intercorr International-Integriti Solutions, Inc.
26. EFC Publication Number 16 “Guidelines on Materials Requirements for Carbon and Low Alloy Steels for H2S-Containing Environments in Oil and Gas Production”, 1995.
27. API 5CT, “Specification for Casing and Tubing”, Fifth Edition, 1995.
28. NACE Publication 1F192, “Use of Corrosion-Resistant Alloys in Oilfield Environments”, 1993 Revision.
29. NACE Publication 1F196, “Survey of CRA Tubular Usage”, 1996.
30. EFC (European Federation of Corrosion) Publication Number 17, “Corrosion Resistant Alloys for Oil and Gas Production: General Requirements and Test Methods for H2S Service”, 1996.
31. “Corrosion Inhibitors”, Published by NACE, 1973.
32. NACE TPC Publication 5, “Corrosion Control in Petroleum Production”, 1979.
33. “Corrosion and Water Technology”, L.W. Jones, OGCI Publications, 1988.
34. NACE Standard RP0191, Standard Recommended Practice, “The Application of Internal Plastic Coatings for Oilfield Tubular Goods and Accessories”, 1996.
35. NACE Publication 3T199, “Techniques for Monitoring Corrosion and Related Parameters in Field Applications”, 1999.
36. NACE Standard RP0775, “Preparation, Installation, Analysis, and Interpretation of Corrosion Coupons in Oilfield Operations”, 1999.
37. NACE Publication 1C184, “Monitoring Internal Corrosion in Oil and Gas Production Operations with Hydrogen Probes”, 1995.
38. NACE Publication 1C187, “Use of Galvanic Probe Corrosion Monitors in Oil and Gas Drilling and Production Operations”, 1995.

IV:25
39. NACE Standard RP0192, “Monitoring Corrosion in Oil and Gas Production with Iron Counts”, 1998.
40. NACE Publication 1C190, “Instruments for In-Place Evaluation of Internal and External Corrosion in Casing and Tubing”, 1990.
41. NACE Publication 3C194, “Economics of Corrosion”, 1994.
42. ASM International, Metals Handbook, Ninth Edition, Volume 13, “Corrosion”, 1987.
General Information Bibliography
Prediction of Corrosion:
43. L. H. Gatzky and R. H. Hausler “A Novel Correlation of Tubing Corrosion Rates and Gas Production Rates “, Advances in CO2 Corrosion, Vol. 1, page 87, NACE International, Houston, Texas, 1984.
44. J.P, Frick, “Corrosion in Packer and Completion Fluids”, Corrosion/87, Paper 300, 1987, NACE International, Houston, Texas.
45. R. C. John, K. G. Jordan, S. D. Kapusta, A. L. Young, W. T. Thompson, “SweetCor: An Information System for the Analysis of Corrosion of Steels by Water and Carbon Dioxide,” Corrosion/98, Paper 20, San Diego, California, March 22-27, 1998, NACE International, Houston, Texas.
46. M. Cabrini, P. Pietro, L. Lazzari, and G. Hoxha, “Prediction of CO2 Corrosion in Oil and Gas Wells: Analysis of Some Case Histories,” Corrosion/98, Paper 24, San Diego, California, March 22-27, 1998, NACE International, Houston, Texas.
47. R. Nyborg, and A. Dugstad, “Mesa Corrosion Attack in Carbon Steel and 0.5% Chromium Steel,” Corrosion/98, Paper 29, San Diego, California, March 22-27, 1998, NACE International, Houston, Texas.
48. S. Srinivasan, and S. Tebbal, “Critical Factors in Predicting CO2/H2S Corrosion in Multiphase Systems,” Corrosion/98, Paper 38, San Diego, California, March 22-27, 1998, NACE International, Houston, Texas.
49. E. Dayalan, F.D. de Morales, J. R. Shadley, E. F. Rybicki, and S. A. Shirazi, CO2 Corrosion Prediction in Pipe Flow Under FeCO3 Scale-Forming Conditions,” Corrosion/98, Paper 51, San Diego, California, March 22-27, 1998, NACE International, Houston, Texas.
50. J. E. Oddo, and M. B. Tomson, “The Prediction of Scale and CO2 Corrosion in Oil Field Systems,” Corrosion/99, Paper 41, San Antonio, Texas, April 25-30, 1999, NACE International, Houston, Texas.
51. W. P. Jepson, R. Zhang, M. Gopal and S. Stitzel, “Model For Sweet Corrosion in Horizontal Multiphase Slug Flow,” Corrosion/97, Paper 601, New Orleans, Louisiana, March 9-14, 1997, NACE International, Houston, Texas.
52. P. Fassina, D. Condanni, L. Lazzari, and R. Galvagni, “Corrosion Related Risk Evaluation for Well Tubing and Pipelines,” Corrosion/97, Paper 23, New Orleans, Louisiana, March 9-14, 1997, NACE International, Houston, Texas.
53. S. Sakamoto, K. Maruyama, T. Hara, H. Asahi, and H. Kaneta, “A Software Program for Corrosion Related Material Selection for Downhole Tubing,” Corrosion/98, Paper 97, San Diego, California, March 22-27, 1998, NACE International, Houston, Texas.
54. A. Kopliku, and D. L. Condanni, “Expert System for Corrosion Evaluation and Material Selection in Oil and Gas Wells,” European Petroleum Computer Conference, Paper 27553, Aberdeen, U.K., March 15-17, 1994, Society of Petroleum Engineers Inc., Richardson, Texas.

IV:26
CO2 Corrosion
55. A. Valdes, R. Case, M. Ramirez, and A. Ruiz, “The Effect of Small Amounts of H2S on CO2 Corrosion of a Carbon Steel,” Corrosion/98, Paper 22, San Diego, California, March 22-27, 1998, NACE International, Houston, Texas.
56. R. Nyborg, “Initiation and Growth of Mesa Corrosion Attack During CO2 Corrosion of Carbon Steel,” Corrosion/98, Paper 48, San Diego, California, March 22-27, 1998, NACE International, Houston, Texas.
57. J. L. Crolet, N. Thevenot, and A. Dugstad, “Role of Free Acetic Acid on the CO2 Corrosion of Steels,” Corrosion/99, Paper 24, San Antonio, Texas, April 25-30, 1999, NACE International, Houston, Texas.
Sulfide Stress Cracking
58. M. B. Kermani, D. Harrop, M. L. R. Truchon and J. L. Crolet, “Experimental Limits of Sour Service for Tubular Steels”, CORROSION/91. Paper 21, 1991, NACE International, Houston, Texas.
Erosion
59. K. G. Jordan, “Erosion in Multiphase Production of Oil & Gas,” Corrosion/98, Paper 58, San Diego, California, March 22-27, 1998, NACE International, Houston, Texas.
60. S. McLaury, E. F. Rybicki, S. A. Shirazi, and J. R. Shadley, “How Operating and Environmental Conditions Affect Erosion,” Corrosion/99, Paper 34, San Antonio, Texas, April 25-30, 1999, NACE International, Houston, Texas.
61. API RP 14E, “Recommended Practice for Design and Installation of Offshore Production Platform Piping Systems”, 5’th Edition, 1991.
Corrosion Resistant Alloys
62. Kermani, P. Cooling, and J. W. Martin, and P. I. Nice, “The Application Limits of Alloyed 13%Cr Tubular Steels for Downhole Duties,” Corrosion/98, Paper 94, San Diego, California, March 22-27, 1998, NACE International, Houston, Texas.
63. M. S. Cayard, and R. D. Kane, “Serviceability of 13Cr Tubulars in Oil and Gas Production Environments,” Corrosion/98, Paper 112, San Diego, California, March 22-27, 1998, NACE International, Houston, Texas.
64. L. Scoppio, and M. Barteri, and C. Leali, “Sulphide Stress Cracking Resistance of SuperDuplex Stainless Steels in Oil and Gas Field Simulated Environments,” Corrosion/98, Paper 95, San Diego, California, March 22-27, 1998, NACE International, Houston, Texas.
65. R. D. Kane and D. Abayarathna, “Definition of Safe Service Use Limits for Use of Stainless Alloys in Petroleum Production,” Corrosion/97, Paper 34, New Orleans, Louisiana, March 9-14, 1997, NACE International, Houston, Texas.
66. S. Huizinga and W. E. Liek, “Limitations for the Application of 13Cr Steel in Oil and Gas Production Environments,” Corrosion/97, Paper 39, New Orleans, Louisiana, March 9-14, 1997, NACE International, Houston, Texas.
67. R. D. Kane, J. A. Ponciano; A. L. L. T Small, and C. J. B. M Joia, “Rapid Screening of Stainless Steels For Environmentally Assisted Cracking in H2S/CO2/Cl Environments Using the Slow Strain Rate Test,” Corrosion/97, Paper 48, New Orleans, Louisiana, March 9-14, 1997, NACE International, Houston, Texas.
68. S.F. Biagiotti, Jr. and J.S. Reichman, “Justifying the Use of 13Cr Steels for Corrosive CO2 Operations”, Corrosion/95, Paper 81, 1995, NACE International, Houston, Texas.

IV:27
Coatings
69. R. E. Lewis, and D. K. Barbin, “Selecting Internal Coatings for Sweet Oil Well Tubing Service,” Corrosion/99, Paper 15, San Antonio, Texas, April 25-30, 1999, NACE International, Houston, Texas.
Literature Reviews
70. R. S. Treseder and R. N. Tuttle, “Corrosion Control in Oil and Gas Production”, NACE, 1998.
71. R. N. Tuttle and R. D. Kane, “H2S Corrosion in Oil and Gas Production – A Compilation of Classic Papers”, NACE, 1981.
72. J. Kolts and S. W. Ciaraldi, “Corrosion Resistant Alloys for Oil and Gas Production, Volumes I & II”, NACE, 1996.
73. “H2S and CO2 Corrosion Experience in Oil and Gas Production – Classic Papers”, NACE, 1999.
74. “H2S and CO2 Corrosion Experience in Oil and Gas Production: Latest Research – Papers Presented Since 1997”, NACE, 1999.
75. “Testing and Application of Corrosion Monitoring and Fitness for Purpose Assessment”, NACE, 1999.
76. “Corrosion Testing and Modeling in Oil and Gas Production – Classic Papers”, NACE, 1999.
77. “Corrosion Testing and Modeling in Oil and Gas Production – Latest Research: Papers Published Since 1997”, NACE, 1999.

IV:28
Attachment A: Internet Information for CO2 Corrosion Models

IV:29
Model #5
NORSOK Model
The NORSOK model, “CO2 Corrosion Rate Calculation Model”, M506, is described at the internet website:
http://www.nts.no/norsok/m/m50601/m50601.htm.
The first two pages of information from this website are attached immediately below.
Information concerning the NORSOK standard, “Material Selection”, M001, (that is referred to in the corrosion rate model) is presented at the website:
http://www.nts.no.norsok/m/m00102/m00102.htm.

IV:30

IV:31

IV:32
Model #6
USL Model
A brief description of the USL model that has been developed for predicting corrosion in gas condensate wells is presented below. This information was downloaded from the website:
http://engr.louisiana.edu/crc/model/model.htm.
Detailed descriptions of the USL corrosion model for gas condensate wells are available in the literature[12 through 24].
The Corrosion Research Center at USL currently has another joint industry program underway that is aimed at developing a comparable corrosion prediction model for oil wells. Information concerning this JIP can be found at:
http://engr.louisiana.edu/crc/research/oil-pro.htm.

IV:33

IV:34

IV:35
Model #7
‘Predict’ Model
The “Predict” corrosion model was developed by Intercorr International, of Houston, Texas. The information for the model presented immediately below was retrieved from the Intercorr website: http://www.intercorr.com/software/predict.htm. Additional information concerning the model is available at the websites: http://www.intercorr.com/software/predintrfc.htm, http://www.intercorr.com/software/predsysdesc.htm, http://www.intercorr.com/software/preddataconv.htm, http://www.intercorr.com/software/predcstanal.htm, http://www.intercorr.com/software/predflowmdl.htm, http://www.intercorr.com/software/pred_up.htm.

IV:36

IV:37
Attachment B: CRA Selection Guides

IV:38
Kawasaki Guidelines

IV:39
Sumitomo Guidelines

IV:40

IV:41

IV:42
DMV Guidelines

IV:43

IV:44
Cabval Guidelines

IV:45

IV:46
Attachment C: Internet Information on “Socrates” Expert System

IV:47
“Socrates” Expert System
The “Socrates” expert system was developed by Intercorr International, of Houston, Texas. The
information describing the system that is attached immediately below was retrieved from the Intercorr website at:
http://www.intercorr.com/software/soc.htm
Additional information concerning the system is available at the Intercorr websites:
http://www.intercorr.com/software/socintrfc.htm http://www.intercorr.com/software/socsysdec.htm
http://www.intercorr.com/software/socenveval.htm
http://www.intercorr.com/software/socstanal.htm http://www.intercorr.com/software/socstleval.htm
http://www.intercorr.com/software/socdbhlp.htm http://www.intercorr.com/software/soc_up.htm
http://www.intercorr.com/software/socapndx1.htm
http://www.intercorr.com/software/socapndx2.htm http://www.intercorr.com/software/socapndx3.htm
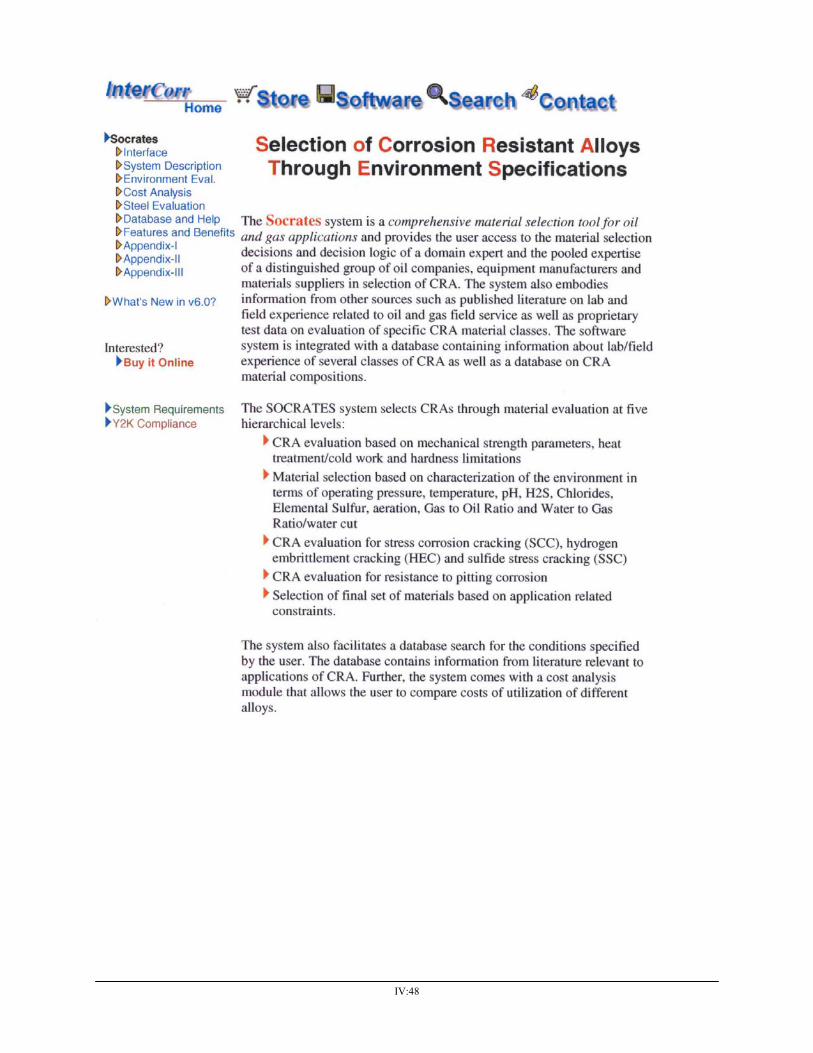
IV:48

IV:49
Attachment D: Coating Information

IV:50

IV:51

IV:52

IV:53
Attachment E: Abstracts of Economic “Case Studies”

IV:54
Control of corrosion in oil and gas production tubing Author: Smith, L. Source: British Corrosion Journal v 34 n 4 1999. p 247-253 Controlling corrosion in production tubing is essential for maintaining production and for preventing loss of well control. Materials for use downhole have to meet criteria for corrosion resistance and also mechanical requirements. The potential corrosion rate can be estimated and the risks of sulfide stress corrosion cracking assessed on the basis of the anticipated environmental conditions and flow regime. Material options for tubing can then be considered on the basis of published corrosion test data and also field experience. Candidate materials may be tested under the precise field conditions expected in order to ensure that over-conservative choices are not made. Corrosion inhibitors, coated carbon steel, and fiber reinforced plastic tubing have temperature, flow regime, and mechanical limitations. Specific corrosion resistant alloys (CRAs) have environmental limitations with respect to temperature, hydrogen sulfide, and chloride content. Details of field experience with all of these material options are given. There exists a large amount of experience with CRAs for downhole applications. Correctly selected CRAs have a good track record of service, even for hostile, H//2S containing conditions. There are a few limited examples of CRA clad tubing. This product may be one that needs re-evaluation as it offers potential for economic use of costly but effective CRAs. (Author abstract) 33 Refs. Requirements for corrosion-resistant alloy (CRA) production tubing Author: Petersen, C.W.; Bluem, M.F. Source: SPE Reprint Series n 46 1997. p 156-165 The incentive to use corrosion-resistant alloy (CRA) production tubing has grown as bottomhole temperatures have steadily increased above 325 degree F, as corrosion control costs have grown, and as many operations have sprung up in remote sites with limited accessibility. This paper discusses procedures to ensure acceptable manufacture of such tubing and also presents some operational experiences with these alloys. (Author abstract) 1 Refs. TECHNICAL AND ECONOMIC ASPECTS OF STAINLESS STEELS IN CORROSIVE DOWNHOLE ENVIRONMENTS Author: Karlsson, S. Conference Title: Stainless Steels '84. Conference Location: Goteborg, Swed. Conference Date: 19840903 Source: Published by Inst of Metals (Book n 320), London, Engl. p 438-445 Publication Year: 1985 An economic study demonstrates that the use of stainless production tubing in oil and gas winning is profitable compared with conventional corrosion control methods for shallower and less aggressive wells than earlier anticipated. The study involves methods of selecting an appropriate grade of stainless steel and methods of estimating the conventional corrosion control costs. The economic model is based on the discounted cash flow method and takes into account varying economic conditions and tax regulations for different countries. 3 refs. Experiences with 13Cr for mitigating CO sub 2 corrosion in the oilfield, case histories: the Gulf of Mexico and inland gas wells. Baudoin, D A ; Barbin, D K ; Skogsberg, J Publ: National Association of Corrosion Engineers, P.O. Box 218340, Houston, TX 77084, USA, 1996 Corrosion-Resistant Alloys in Oil and Gas Production. Vol. I 26-38, 1996 Material selection for downhole completions in the oilfield is one that is critical to the economic success of a project on a long-term basis. In the past, the selection of downhole tubulars has been routine and basic, with most operators selecting carbon steel as standard procedure. Today, a paradigm shift from the use of traditional C steel to 13%Cr is taking place as tools of economics, corrosion engineering, and field data are utilized. Factors to be considered in the decision making process in selecting materials for sweet corrosive environments include: field data (current and historical), corrosion engineering, and economics. This paper takes an objective look at the field experiences,

IV:55
conditions, and economics involved in making a materials selection. Of all elements considered, economics is the main driving force. The paper focuses on four case histories from the Gulf of Mexico and inland Louisiana with various temperatures, pressures, chloride content, CO sub 2 content, and production rates. These case histories, along with proven long term experience will help set the stage for further usage of 13Cr. 6 ref. Use of Economic Analysis to Select the Most Cost Effective Method of Downhole Corrosion Control. Tischuk, J L; Huber, D S Conference: UK Corrosion 1984--Proceedings of the Conference. Vol 1 Economic analysis is a powerful tool for choosing among alternative methods of corrosion control. The factors which are considered include the time value of money, project life, risks of failure and consequential costs of failure in addition to initial capital outlay and estimated operating costs. Although the probability analysis is subjective rather than mathematically rigorous, it is based on field experience and gives good results. One of the strengths of this method is that relatively large changes in the failure scenarios and probabilities of failure result in very small changes in discounted risk costs. As long as the probabilities are reasonable the relative ranking of the alternatives will not be changed if the probabilities are altered. In the case of Esmond Field Development, this work showed that 13Cr stainless steel production tubing was the most cost effective solution to donwhole sweet corrosion. For other projects with different costs and other criteria, other solutions may be most cost effective. 10 ref.--AA CORROSION MANAGEMENT IN THE ARUN FIELD RIEKELS L M; SEETHARAM R V; KRISHNAMURTHY R M; KROEN C F; PACHECO J L; HAUSLER R H; SEMERAD V A W; KACZOROWSKI N 51ST ANNU NACE INT CORROSION CONF (CORROSION 96) (DENVER, 3/24-29/96) PAPER NO 24 1996 (16 PP; 19 REFS) The Arun field, located on the northern coast of the Aceh province in N. Sumatra, Indon., is a gas condensate reservoir that was discovered in 1971 and has been in production since 1977. The reservoir is a compositionally dynamic system where retrograde condensation, condensate revaporization, water vaporization, mixing of lean injection gas, gas dehydration, and booster compression impact reservoir performance. In order to manage corrosion and its potential impact on gas deliverability, it was necessary to assess the probability that unacceptable down-hole corrosion would occur as the Arun field was depleted. The changes in the well-bore environment over time which could influence corrosion kinetics had to be identified. A risk model has been developed to identify the probability that unacceptable down-hole corrosion would occur as the Arun field was depleted. Using the life expectancy estimates for the carbon steel tubing strings from this model, optimized mitigation strategies could be developed to provide cost-effective alternatives for the management of corrosion. 13CR TUBULARS SOLVE CORROSION PROBLEMS IN THE TUSCALOOSA TREND COMBES J D; KERR J G; KLEIN L J PETROL ENG INT V 55, NO 3, PP 50, 52, 56, 58, 60, 64, 66, 68, 70, MARCH 1983 Down-hole corrosion problems in the Tuscaloosa Trend can complicate completion and production practices for the operator. Obviously, the ability to control these corrosion problems can cost the producer considerable time and money. Since becoming one of the first operators in the Tuscaloosa, Chevron has made substantial progress in fighting this tough, corrosive environment, and now, with the help of 13Cr tubulars, appears to be winning the battle. In 1974, Chevron spudded the Alma 1 well, which turned out to be the discovery well for the False River field in the Tuscaloosa Trend which runs across S. Louisiana. The well was completed in 1975. Chevron's Tuscaloosa Trend well completion design is described. A parallel string completion was employed for maximum safety with the kill string available if required. The annulus was packed off and filled with weighted mud above 20,000 ft so that the casing was not exposed to the reservoir fluids, except below the packer. Wellheads and tubing hangers were made of Type 410 stainless steel. (28 refs.) WELL DESIGN AND EQUIPMENT INSTALLATION FOR MOBILE BAY COMPLETIONS GORDON J R; JOHNSON D V; HERMAN S R; DARBY J B 26TH ANNU SPE ET AL OFFSHORE TECHNOL CONF (HOUSTON, 5/2-5/94) PROC V 4, PP 533-542, 1994 (OTC-7571); 4 REFS

IV:56
Production of sour gas from deep (21,000-ft) reservoirs extended off shore in recent years and has challenged operators to assure equipment integrity and reliability. The high investment in wells and facilities, as well as the high cost of remedial well-bore activities, make quality of initial installations a high priority. Key design and installation topics for a recent 11-well development in the Mobile Bay area are described. Over 50 staff-years of research and development effort were expended in establishing suitability of equipment and procedures for the development. The well design is for extremely corrosive and erosive well conditions (acid gases, 420(deg)F bottom-hole temperature, and 50-Mcfd flow rates). The final well design featured a full CRA flow path and a single mechanical device, the subsurface safety valve (SSSV). The SSSV was a shallow restriction in the well bore (2.56 in. ID) which posed no real operational constraint. Floating seals inside a polished bore receptacle (PBR) eliminated packers and latches and the attendant risk and difficulty of removal during workover operations. The CRA (corrosion resistant alloy) flow path eliminated the need for down-hole chemical injection hardware. DOWNHOLE MATERIAL SELECTION FOR CLYDE PRODUCTION WELLS: THEORY AND PRACTICE BLACKBURN N A SPE EUROPE PROD OPER CONF (ABERDEEN, UK, 3/15-17/94) PROC PP 105-114, 1994 (SPE-27604; 15 REFS) The Clyde oil field lies within North Sea block 30/17b. First oil was produced from the field in March 1987. Wells drilled during field appraisal indicated a potentially highly corrosive down-hole environment. Although high chromium content (Duplex) steels appeared to be the technically preferred completion material, a decision was made to use carbon steel tubulars. Historical data have shown that carbon steel gives acceptable performance in the majority of production wells. Failures have occurred, but these have been highly specific and related to high fluid velocities and increasing watercuts. A mixed string completion employing carbon steel, 13 Cr and plastic-coated tubing has been successful in controlling down-hole corrosion in these few problem wells. The down-hole corrosion control strategy used on the field and how carbon steel may be used successfully in a severe down-hole environment are shown.

SECTION V: REVIEW OF ARPTD DATABASE
V:1
1) The ARPTD Database
As the initial portion of the current joint industry project (JIP), Stress Engineering Services developed a
computer-based data acquisition and manipulation system. The system was developed at the request of, and under
the direction of, the steering committee of the JIP.
The menu-driven data entry system was structured so as to be accessible by way of the Internet. Each
member of the JIP was subsequently given an individual password for the system that allowed data entry into the
system. The individual passwords also guaranteed security concerning any data that was entered under that
password by the participants.
Information concerning the initial well installation configuration and operating conditions is required for
each well entry in the system.. The user of the system can then enter information concerning sustained casing
pressure (SCP) events as well as data concerning well workovers and/or recompletions. After the initial well data
entry is completed and submitted, the system also allows the user to review and/or edit the data for the well.
The data entry and management system can be accessed on the Internet at http://www.arptd.org. After
entering this location in the Internet browser, a small menu screen appears that asks for the users Network user name
and password. The information to be entered on this screen is:
• Network user name : arptd
• Network user password: du9chmn
When the above entries are made, the initial screen of the ARPTD database manager will appear. The
general appearance and utility of the data input system is illustrated by the menus shown in Attachment A.
Figure 1 of Attachment A is the initial screen of the data management system. As can be seen, the
Company identification and company specific password must be entered at this point. Each participant can be
identified by way of the “Company” scroll-down bar. When using the system to enter data into their specific part of
the data base, each participant is required to use their individual password. The default “Company” entry (intended
to be used when doing initial exploration and testing of the system) is “General”. The current password for the
“General” company I.D. is:
• “ob1knb”.
Figures 2 through 8 of Attachment A show the menus that appear as the data of an existing well is
reviewed. For the screens shown in the attachment, well # 24 (as identified by the data management system) was
used in the review.
The screens shown in Figures 3 through 8 are the result of activating the “Review Well Data” option on the
main “Data Management Center” screen, as shown in Figure 2. If the operator had chosen, instead, to use the “Add
a Well” or the “Edit/Update Well Data” options on the main “Data Management Center” screen, either of two
separate series of similar screens would have been activated. These additional screens are similar in appearance to
those shown in Figures 3 through 8. The additional screens, on the other hand, prompt the user to either enter data

V:2
for a new well to be added to the database, or to edit data previously added for an existing well already in the
database (such as well # 24).
The selection of “Review Initial Completion” on the screen shown in Figure 4 results in the appearance of
the information shown in Figure 5. Note that the information displayed on this screen is Initial Completion
Information. The information shown in Figure 6 is accessed from the Initial Information screen (Figure 5) by hitting
the “Review String” button. After reviewing the initial tubing string in Figure 6, the operator returns to the screen in
Figure 5 by hitting the Return button on the screen in Figure 6. After reviewing all of the information shown in
Figure 5, hitting the Return button at the bottom of the screen returns the operator to the screen shown in Figure 4.
The information shown in Figures 7 and 8 of Attachment A is accessed from the screen shown in Figure 4
by engaging the “Review an SCP Record” or “Review a Workover Record” entries on Figure 4. In the well used in
this example, the operator had not entered any information for the “modified” tubing string present in the well
following the “workover” activity. It might, therefore, be concluded that essentially the same production string was
re-run in the well during the workover, following the SCP event. As can be seen in Figures 5 through 8 of
Attachment A, an extensive amount of information concerning the details of the well at the various stages of its life
are requested by the database manager.
Unfortunately, only a limited amount of data was collected through the data base manager. Our review of
the resulting ARPTD data base revealed the following:
1. Number of well files that contained what appeared to be valid data that could be accessed by the web-site data manager:
a. “Valid wells” = 73
2. Initial shut-in tubing pressures of “valid” wells:
a. Range of pressures = 460 psi to 13380 psi
b. Avg. pressure = 2760 psi
3. Static bottom hole temperatures of wells:
a. Range of temperatures = 940F to 2500F
b. Avg. temperature = 1750F
4. Number of wells identified as containing CO2:
a. No. of wells = 17
5. Number of wells identified as containing H2S:
a. No. of wells = 0
6. Alloy of production tubing:
a. 13 Chrome = 7 wells, 8 strings
b. Carbon steel = 66 wells
7. Connections used on production sting:
a. 8 Round = 20 wells
b. 8 Round with seal ring = 10 wells
c. Hydril = 24 wells

V:3
d. Kawasaki = 6 wells
e. AB = 4 wells
f. Benoit = 4 wells
g. Vam = 2 wells
h. Other = 3 wells
8. “Age” of well between SCP event and initial completion or most recent workover or recompletion:
a. Avg. age of all 73 wells = 139 mo.
b. No. of wells that failed in 24 mo. or less = 20
c. Avg. age of wells that survived more than 24 mo. = 187 mo.
9. Number of wells in which “Root Cause of Failure” was identified:
a. Total wells identified = 9
b. Failure due to corrosion = 5
c. Failure due to “component failure” = 3
d. “Not known” = 1
The quantitative information concerning the “age” of the primary annulus at the time of an SCP event is
presented in Figure 1 of Attachment B. The information reported for the static bottom hole temperatures of the
wells and the information for the initial shut-in pressures of the wells are given in Figures 2 and 3 of Attachment B.
These plots illustrate the type of information that might have been available for further evaluation if more
information had been entered into the database.

V:4
Attachment A: Information Showing the General Structure and Appearance of the Data Base Manager
Figure 1

V:5
Figure 2
Figure 3

V:6
Figure 4

V:7
Figure 5

V:8
Figure 6
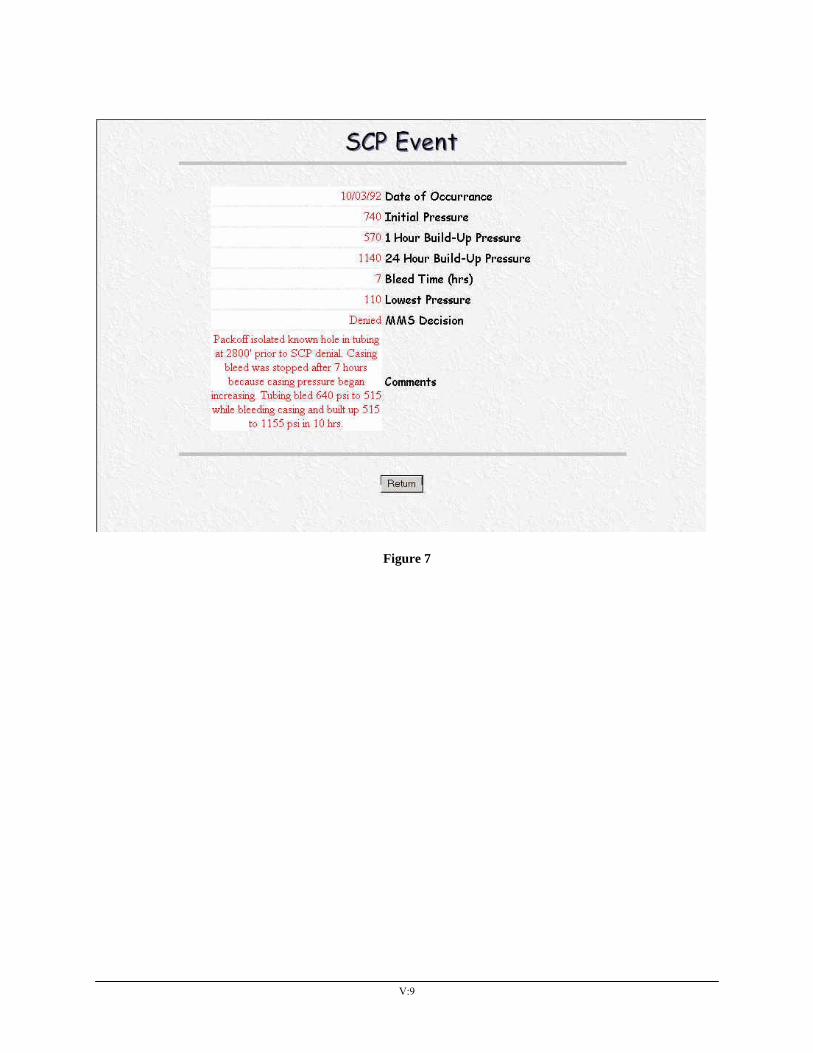
V:9
Figure 7

V:10
Figure 8

V:11
Attachment B: Frequency Plots of Well “Age”, Static Bottom Hole Temperature and Initial Shut-In Pressure
Figure 1: Age of Well Between SCP and Completion, Recompletion or Workover (in years)

V:12
Figure 2: Static Bottom Hole Temperature

V:13
Figure 3: Initial Shut-In Pressure