Embed Size (px)
Citation preview

Best practices for multi-asset class investing

Agenda
• CI’s total return equation
• Multi-manager, multi-asset class – the choice is yours
• Matching clients needs with CI solutions

CI Investment ConsultingWhat do we manage ?
CASTLEROCKPORTFOLIOS
$15 billion AUM

What led to the famous “lost decade” ?
From 1991 to 2000:
DEX Universe Bond Index return 10.4% (10.8% yield to 5.8%)
S&P/TSX Composite Index return 13.1% (12.5X P/E to 17.8X)
S&P 500 Index C$ return 20.5% (15.3X P/E to 24.3X)
From 2001 to 2010:
DEX Universe Bond Index return 6.3% (5.8% yield to 3.1%)
S&P/TSX Composite Index return 6.6% (17.8X P/E to 14.9X)
S&P 500 Index C$ return -2.6% (24.3X P/E to 14.9X)
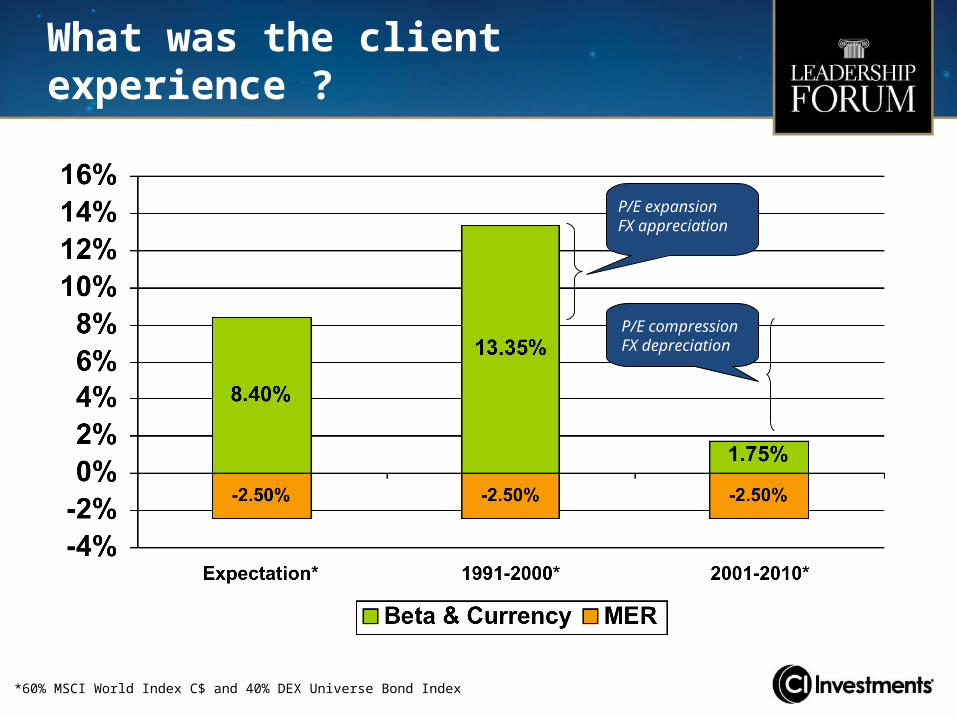
What was the client experience ?
*60% MSCI World Index C$ and 40% DEX Universe Bond Index
P/E expansion FX appreciation
P/E compressionFX depreciation

CI’s total return equation
Total return = Asset mix + Alpha + Market beta + Currency - Tax
Optimize
Maximize Manage
Manage/reduce Minimize

CI’s solutions – multi-level expertise
1. Asset mix
2. Alpha generation (stock and sector selection)

CI’s solutions – multi-level expertise
3. Risk management
4. Tax management
Beta management, sector monitoring and rebalancing
Currency managementOn-going monitoring and due diligence

CI’s solutions – our value proposition
Your own Our target fund-of-funds (in basis points)
Asset mix +/- ? +50
Alpha +60 +150
Beta management, sector +0 +50 monitoring & rebalancing
Currency management +0 +50
Corporate class / T-class +0 +100
Overall +60 +400

Managed solutions:
Guided portfolios:
Individual strategies from:
Use multi-manager, multi-asset class for maximum risk-adjusted returns

Managed solutions – our best kept secret
• Award-winning fund of funds• 7 portfolios, 7 managers, 9-20
underlying funds• Indirect currency hedging via
underlying managers• Indirect tax advantages via
underlying corporate class• Enhanced reporting
• Fully managed portfolios; or customized allocations
• 9 portfolios, 8 managers, 4 funds
• Pure geographic allocations• Direct currency overlay
program• Direct tax advantages via
CI Corporate Class• T-Class options• Enhanced reporting
CI Portfolio Series CI Portfolio Select Series

CI Private Investment Management (PIM)Guided portfolios – more support for the D-I-Y advisor
• Nine professionally constructed risk-optimized portfolios.
• Questionnaire designed to establish objectives and constraints.
• Recommended fund allocations,
or
• Fully customizable.– List of recommended substitutes– Choose from any available fund within asset class.
• Personalized Investment Policy Statement

Multi-asset classSignature High Income
Signature Diversified Yield
Signature Income & Growth
Signature Global Income & Growth
Signature Global Advisors

Cambridge Advisors
Multi-asset class: Cambridge Income, Cambridge Canadian Asset Allocation
Brandon SnowPrincipal
Portfolio Manager
Alan RadloChief Investment Officer
Portfolio Manager
Robert SwansonPrincipal
Portfolio Manager
Emi WintererAnalyst
Stephen GroffAnalyst
Greg DeanAnalyst

Matching client needs with leading CI solutions
Accumulator Income Seeker
Multi-team,multi-manager
Portfolio Series
Portfolio Select Series
PIM Guided Portfolios
Select Income Advantage Managed (“SIA”)
PS Income
Single team,multi-manager
Signature Income & Growth Fund
Cambridge Canadian Asset Allocation Fund
Signature Diversified Yield Fund (“SDY”)
Cambridge Income Fund

Expected return
Exp
ecte
d vo
latil
ity
Select Income Advantage
Cambridge Income
Cambridge Cdn Asset Allocation
Signature Diversified Yield
TSX
Signature Income & Growth
* Based on March 31/12 asset allocations – see following slides for more details
Moving out the curve*

Income seeker allocations
Source: CI Investments, March 31 2012
Select Income Advantage

Income seeker allocations
Source: CI Investments, March 31 2012
Cambridge Income Signature Diversified Yield

Accumulator allocations
Source: CI Investments, March 31 2012
Cambridge Canadian Asset Allocation Signature Income & Growth

Thank you
Commissions, trailing commissions, management fees and expenses all may be associated with mutual fund investments. Please read the prospectus before investing. Unless otherwise indicated and except for returns for periods less than one year, the indicated rates of return are the historical annual compounded total returns including changes in security value. All performance data assume reinvestment of all distributions or dividends and do not take into account sales, redemption, distribution or optional charges or income taxes payable by any securityholder that would have reduced returns. Mutual funds are not guaranteed, their values change frequently and past performance may not be repeated.
®CI Investments and the CI Investments design are registered trademarks of CI Investments Inc.


![[XLS] · Web viewDickey Quanton McAlpin Jant Lusk Mohurley Patrick Roger Kerr Brice Ffergus Park Mich Deal Neal Harper Ellagh Millar Robin Elias Pinkerton Henry Gellen Hanly Thomas](https://img.pdfslide.us/doc/110x75/5b3339c77f8b9a81728d250b/xls-web-viewdickey-quanton-mcalpin-jant-lusk-mohurley-patrick-roger-kerr-brice.jpg)