Embed Size (px)
Citation preview
HIGHWAY PERFORMANCE MONITORING SYSTEM TRAFFIC DATA FOR HIGH VOLUME ROUTES:
BEST PRACTICES AND GUIDELINES FINAL REPORT to Office of Highway Policy Information Federal Highway Administration U.S. Department of Transportation Washington, D.C. September 8, 2004
505 King Avenue Columbus, Ohio 43201
WORK ORDER NUMBER BAT-03-004
HIGHWAY PERFORMANCE MONITORING
SYSTEM TRAFFIC DATA FOR HIGH-VOLUME ROUTES: BEST PRACTICES AND GUIDELINES
FINAL REPORT
Prepared for
Office of Highway Policy Information
Federal Highway Administration U.S. Department of Transportation
Washington, D.C.
Principal Authors
Dr. Edward Fekpe, PEng. Mr. Deepak Gopalakrishna
Dr. Dan Middleton (TTI)
September 8, 2004

Disclaimer
This report is a work prepared for the United States Government by Battelle. In no event shall either the United States Government or Battelle have any responsibility or liability for any consequences of any use, misuse, inability to use, or reliance on the information contained herein, nor does either warrant or otherwise represent in any way the accuracy, adequacy,
efficacy, or applicability of the contents hereof. The United States Government does not endorse products or manufacturers. Trade or manufacturers’ names appear herein only because they are
considered essential to the purpose of the document.
HPMS AADT Reporting for High Volume Routes i June 3, 2004
Acknowledgments
The authors gratefully acknowledge the support and guidance of Mr. Fred Orloski of the Office of Highway Policy Information, Federal Highway Administration throughout this project. The authors would also like to thank Mr. Harshad Desai and Mr. Jeff Patten of the Office of Highway Policy Information , Federal Highway Administration for their review comments on the draft report. The authors also acknowledge the participation and assistance of the following representatives of the state Departments of Transportation for participating and providing valuable inputs during the interviews. Joe Avis California Department of Transportation (Caltrans) Brian Domsic California Department of Transportation (Caltrans) Harshad Desai** Florida Department of Transportation Nabeel Akhtar Florida Department of Transportation (FDOT) David Adams Georgia Department of Transportation (GDOT) Rob Robinson Illinois Department of Transportation (IDOT) Mike Baxter Maryland State Highway Administration (MDSHA) Philip Hughes Massachusetts Highway Department (MHD) Mike Walimaki Michigan Department of Transportation (MDOT) Louis Whiteley New Jersey DOT (NJDOT) Todd Westhuis New York State Department of Transportation (NYSDOT) David Gardner Ohio Department of Transportation (ODOT) Tony Manch Ohio Department of Transportation (ODOT) Jim Neidigh Texas Department of Transportation (TxDOT) Tom Schinkel Virginia Department of Transportation (VDOT) John Rosen Washington DOT (WsDOT) ** Now with FHWA The project team members are:
Dr. Edward Fekpe, Principal Investigator, (Battelle) Mr. Deepak Gopalakrishna (Battelle) Dr. Dan Middleton (Texas Transportation Institute) Mr. Shawn Turner (Texas Transportation Institute)
HPMS AADT Reporting for High Volume Routes ii June 3, 2004
Table of Contents Page
ACKNOWLEDGMENTS ............................................................................................................. i LIST OF ACRONYMS ................................................................................................................ v EXECUTIVE SUMMARY ......................................................................................................... vi
Introduction ........................................................................................................................ vi Information Sources ........................................................................................................... vi Summary of Interview Results........................................................................................... vi Best or Common Practices ................................................................................................ vii Guidelines for Data Collection for High-Volume Routes ................................................. ix Concluding Remarks .......................................................................................................... xi
1.0 Introduction ....................................................................................................................... 2
1.1 Background ............................................................................................................. 2 1.2 Project Objectives ................................................................................................... 2 1.3 Organization of Report ........................................................................................... 3
2.0 Traffic Monitoring on High-volume Roads .................................................................... 4
2.1 Information Gathering ............................................................................................ 4 2.1.1 Literature Review........................................................................................ 4 2.1.2 Interviews with State DOTs ........................................................................ 5
2.2 Traffic Monitoring State-of-the-Practice ................................................................ 6 2.2.1 HPMS Data Collection ............................................................................... 6 2.2.2 High-volume Routes ................................................................................... 7 2.2.3 Summary of Interview Findings ................................................................. 8
2.3 Issues Associated with Data Collection on High-volume Routes .......................... 9 2.3.1 Safety of Traffic Personnel ......................................................................... 9 2.3.2 Stop-and-Go Traffic .................................................................................. 10 2.3.3 Congestion ................................................................................................ 10 2.3.4 Equipment Failures ................................................................................... 10 2.3.5 Construction Impacts ................................................................................ 10 2.3.6 Incident Impacts ........................................................................................ 10 2.3.7 Data Quality and Assurance ...................................................................... 11 2.3.8 Institutional Issues .................................................................................... 11
3.0 Best or Most Common Practices used by States .......................................................... 12
3.1 Introduction ........................................................................................................... 12 3.2 Best or Most Common Practices........................................................................... 14
HPMS AADT Reporting for High Volume Routes iii June 3, 2004
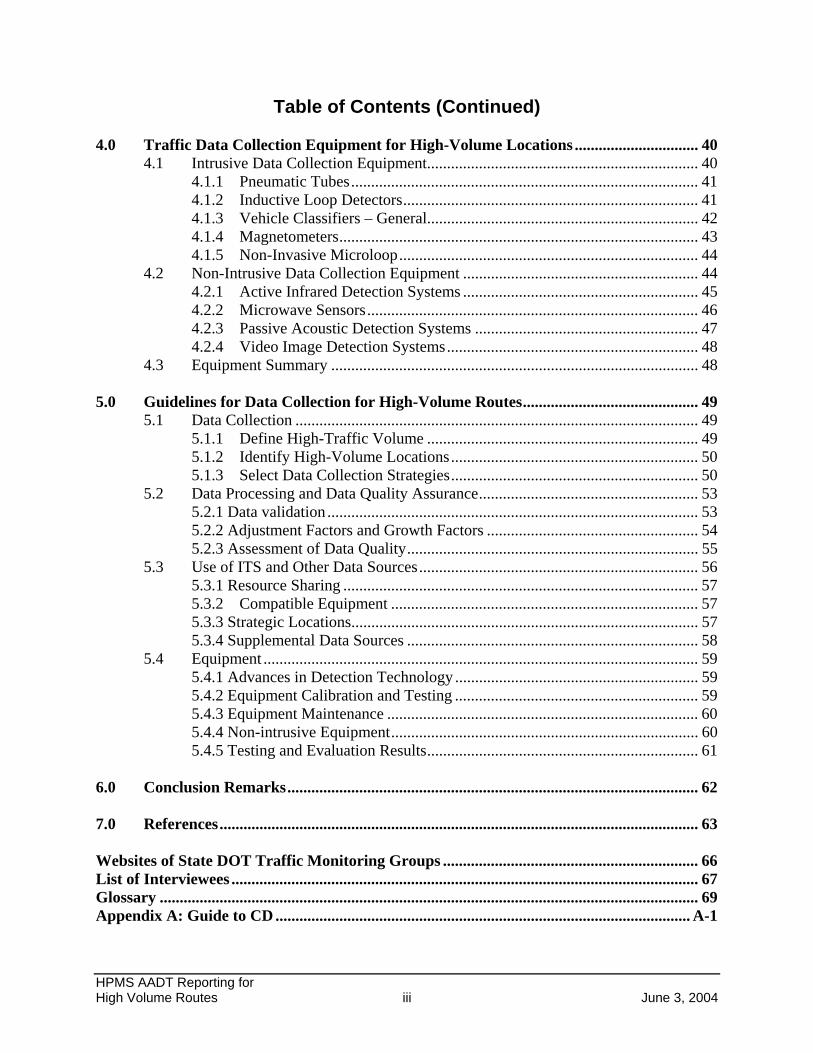
Table of Contents (Continued) 4.0 Traffic Data Collection Equipment for High-Volume Locations ............................... 40
4.1 Intrusive Data Collection Equipment.................................................................... 40 4.1.1 Pneumatic Tubes ....................................................................................... 41 4.1.2 Inductive Loop Detectors .......................................................................... 41 4.1.3 Vehicle Classifiers – General.................................................................... 42 4.1.4 Magnetometers .......................................................................................... 43 4.1.5 Non-Invasive Microloop ........................................................................... 44
4.2 Non-Intrusive Data Collection Equipment ........................................................... 44 4.2.1 Active Infrared Detection Systems ........................................................... 45 4.2.2 Microwave Sensors ................................................................................... 46 4.2.3 Passive Acoustic Detection Systems ........................................................ 47 4.2.4 Video Image Detection Systems ............................................................... 48
4.3 Equipment Summary ............................................................................................ 48 5.0 Guidelines for Data Collection for High-Volume Routes ............................................ 49
5.1 Data Collection ..................................................................................................... 49 5.1.1 Define High-Traffic Volume .................................................................... 49 5.1.2 Identify High-Volume Locations .............................................................. 50 5.1.3 Select Data Collection Strategies .............................................................. 50
5.2 Data Processing and Data Quality Assurance ....................................................... 53 5.2.1 Data validation ............................................................................................. 53 5.2.2 Adjustment Factors and Growth Factors ..................................................... 54 5.2.3 Assessment of Data Quality ......................................................................... 55
5.3 Use of ITS and Other Data Sources ...................................................................... 56 5.3.1 Resource Sharing ......................................................................................... 57 5.3.2 Compatible Equipment ............................................................................. 57 5.3.3 Strategic Locations ....................................................................................... 57 5.3.4 Supplemental Data Sources ......................................................................... 58
5.4 Equipment ............................................................................................................. 59 5.4.1 Advances in Detection Technology ............................................................. 59 5.4.2 Equipment Calibration and Testing ............................................................. 59 5.4.3 Equipment Maintenance .............................................................................. 60 5.4.4 Non-intrusive Equipment ............................................................................. 60 5.4.5 Testing and Evaluation Results .................................................................... 61
6.0 Conclusion Remarks ....................................................................................................... 62 7.0 References ........................................................................................................................ 63 Websites of State DOT Traffic Monitoring Groups ................................................................ 66 List of Interviewees ..................................................................................................................... 67 Glossary ....................................................................................................................................... 69 Appendix A: Guide to CD ........................................................................................................ A-1
HPMS AADT Reporting for High Volume Routes iv June 3, 2004
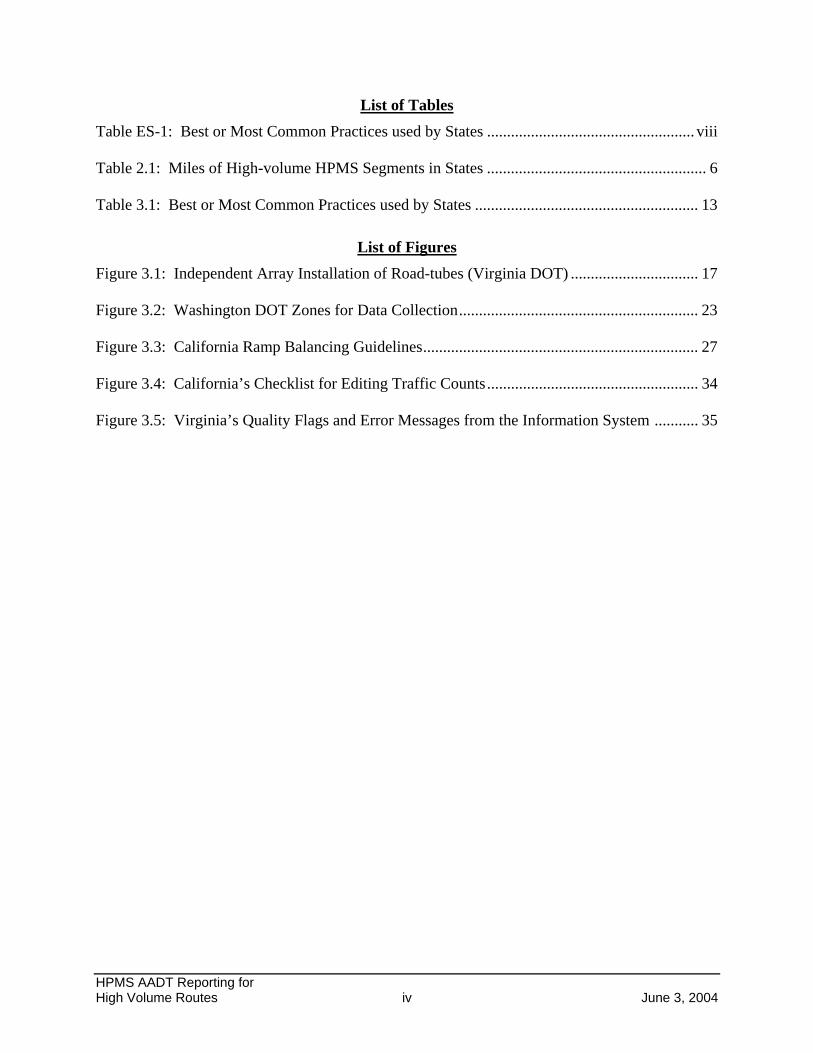
List of Tables
Table ES-1: Best or Most Common Practices used by States .................................................... viii Table 2.1: Miles of High-volume HPMS Segments in States ....................................................... 6 Table 3.1: Best or Most Common Practices used by States ........................................................ 13
List of Figures
Figure 3.1: Independent Array Installation of Road-tubes (Virginia DOT) ................................ 17 Figure 3.2: Washington DOT Zones for Data Collection ............................................................ 23 Figure 3.3: California Ramp Balancing Guidelines ..................................................................... 27 Figure 3.4: California’s Checklist for Editing Traffic Counts ..................................................... 34 Figure 3.5: Virginia’s Quality Flags and Error Messages from the Information System ........... 35
HPMS AADT Reporting for High Volume Routes v June 3, 2004
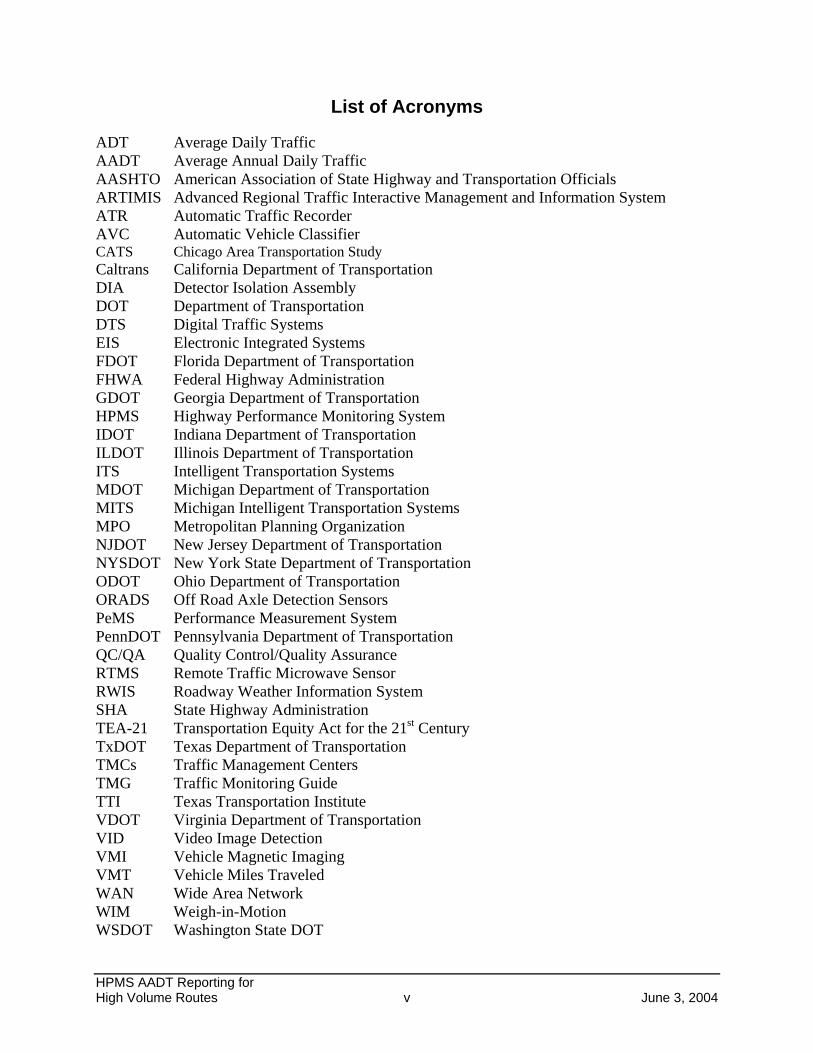
List of Acronyms
ADT Average Daily Traffic AADT Average Annual Daily Traffic AASHTO American Association of State Highway and Transportation Officials ARTIMIS Advanced Regional Traffic Interactive Management and Information System ATR Automatic Traffic Recorder AVC Automatic Vehicle Classifier CATS Chicago Area Transportation Study Caltrans California Department of Transportation DIA Detector Isolation Assembly DOT Department of Transportation DTS Digital Traffic Systems EIS Electronic Integrated Systems FDOT Florida Department of Transportation FHWA Federal Highway Administration GDOT Georgia Department of Transportation HPMS Highway Performance Monitoring System IDOT Indiana Department of Transportation ILDOT Illinois Department of Transportation ITS Intelligent Transportation Systems MDOT Michigan Department of Transportation MITS Michigan Intelligent Transportation Systems MPO Metropolitan Planning Organization NJDOT New Jersey Department of Transportation NYSDOT New York State Department of Transportation ODOT Ohio Department of Transportation ORADS Off Road Axle Detection Sensors PeMS Performance Measurement System PennDOT Pennsylvania Department of Transportation QC/QA Quality Control/Quality Assurance RTMS Remote Traffic Microwave Sensor RWIS Roadway Weather Information System SHA State Highway Administration TEA-21 Transportation Equity Act for the 21st Century TxDOT Texas Department of Transportation TMCs Traffic Management Centers TMG Traffic Monitoring Guide TTI Texas Transportation Institute VDOT Virginia Department of Transportation VID Video Image Detection VMI Vehicle Magnetic Imaging VMT Vehicle Miles Traveled WAN Wide Area Network WIM Weigh-in-Motion WSDOT Washington State DOT
HPMS AADT Reporting for High Volume Routes vi September 3, 2004
Executive Summary
Introduction
The primary purpose of the Highway Performance Monitoring System (HPMS) is to serve data and information needs to reflect the condition and operating characteristics of the nation’s highways. HPMS data support the analyses needed for the biennial condition and performance reports to Congress. One of the required data elements for the HPMS program is vehicle-miles traveled (VMT). VMT is derived from average annual daily traffic (AADT), so an accurate measure of AADT is essential. Traffic data collected on the highest volume routes have the most significant impact since these data represent a large share of total statewide and national travel. These routes are also often the most difficult locations to monitor. State and public agencies use various strategies to develop effective counting programs at these locations. The objective of this project is to investigate and document information that can be shared with states on various procedures being used to estimate and report traffic data on high-volume routes. This study focuses on the accurate collection of traffic data on high-volume routes, as well as the processes that accompany the collection of these data. The study develops best practices and guidelines for improving the quality of AADT estimates on these high-volume routes.
Information Sources
The information for developing this report was gathered through review of published literature and telephone interviews with representatives of state Departments of Transportation (DOTs). Representatives of the top 13 states with the highest mileage of highways with high traffic-volumes were interviewed. The states are: California, Texas, Florida, Georgia, Illinois, Massachusetts, Maryland, Michigan, Ohio, New York, New Jersey, Virginia, and Washington.
Summary of Interview and Literature Review Results
The following are summaries of the major findings from the interviews and literature review. Data Collection and Processing Approaches
A high-volume route is usually not defined solely in terms of traffic volume but rather in terms of the difficulty in installing data-collecting equipment.
State DOT staff and contractors collect traffic data on the major highways. There is no universal method for calculating adjustment factors. Most of the methods
used by states are based on Traffic Management Guide (TMG) Traffic counts are reviewed using either in-house or off-the-shelf software packages
applying various traffic editing rules and traffic checks. A few states are using Intelligent Transportation Systems (ITS) data for sections of their
highway systems HPMS reporting including Illinois, Michigan, and Florida
HPMS AADT Reporting for High Volume Routes vii September 3, 2004
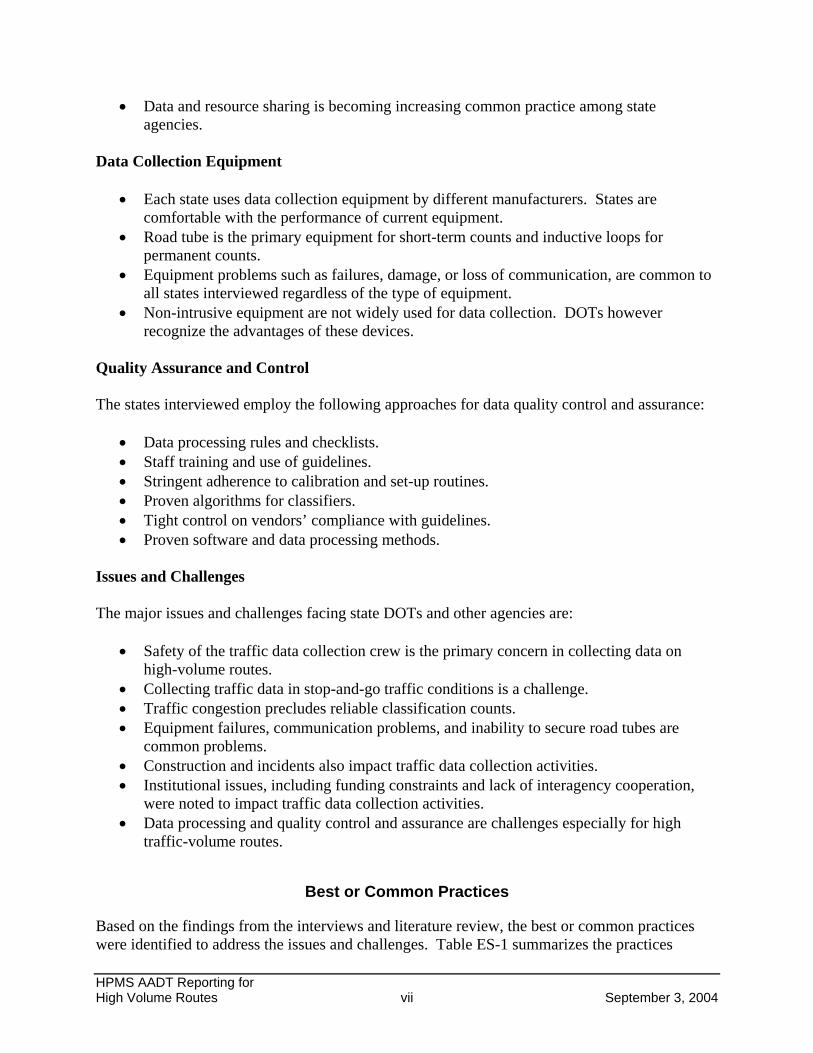
Data and resource sharing is becoming increasing common practice among state agencies.
Data Collection Equipment
Each state uses data collection equipment by different manufacturers. States are comfortable with the performance of current equipment.
Road tube is the primary equipment for short-term counts and inductive loops for permanent counts.
Equipment problems such as failures, damage, or loss of communication, are common to all states interviewed regardless of the type of equipment.
Non-intrusive equipment are not widely used for data collection. DOTs however recognize the advantages of these devices.
Quality Assurance and Control The states interviewed employ the following approaches for data quality control and assurance:
Data processing rules and checklists. Staff training and use of guidelines. Stringent adherence to calibration and set-up routines. Proven algorithms for classifiers. Tight control on vendors’ compliance with guidelines. Proven software and data processing methods.
Issues and Challenges The major issues and challenges facing state DOTs and other agencies are:
Safety of the traffic data collection crew is the primary concern in collecting data on high-volume routes.
Collecting traffic data in stop-and-go traffic conditions is a challenge. Traffic congestion precludes reliable classification counts. Equipment failures, communication problems, and inability to secure road tubes are
common problems. Construction and incidents also impact traffic data collection activities. Institutional issues, including funding constraints and lack of interagency cooperation,
were noted to impact traffic data collection activities. Data processing and quality control and assurance are challenges especially for high
traffic-volume routes.
Best or Common Practices
Based on the findings from the interviews and literature review, the best or common practices were identified to address the issues and challenges. Table ES-1 summarizes the practices
HPMS AADT Reporting for High Volume Routes viii September 3, 2004
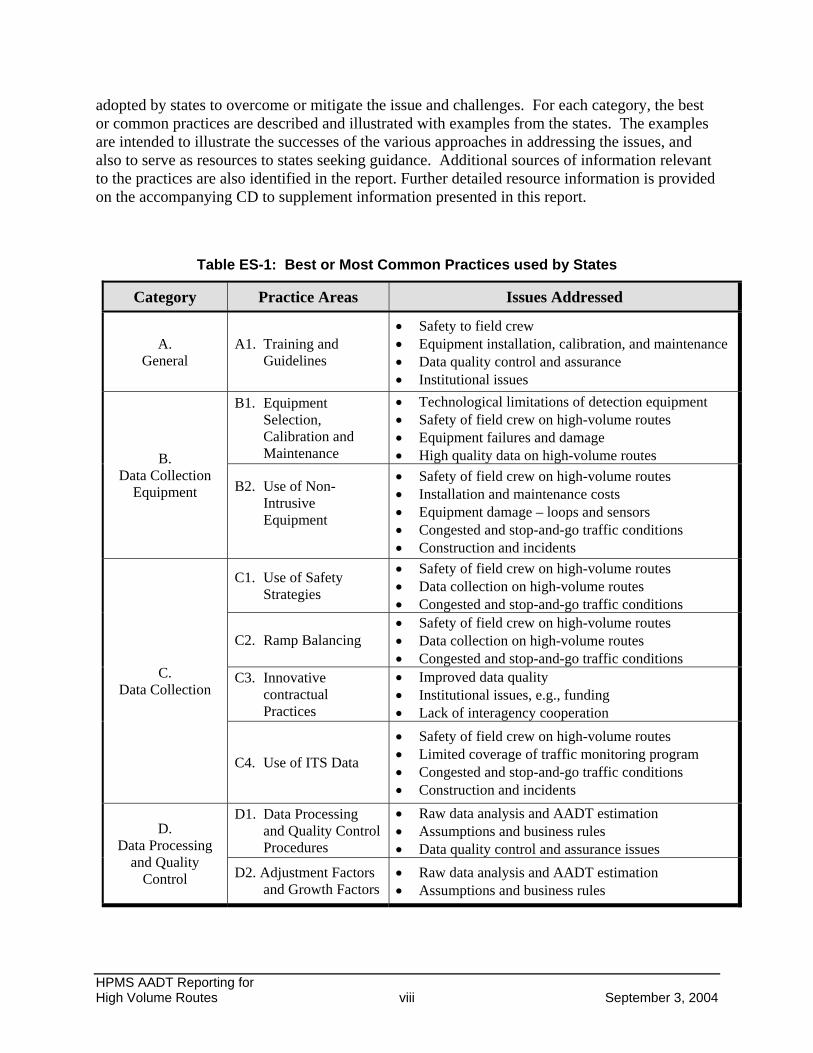
adopted by states to overcome or mitigate the issue and challenges. For each category, the best or common practices are described and illustrated with examples from the states. The examples are intended to illustrate the successes of the various approaches in addressing the issues, and also to serve as resources to states seeking guidance. Additional sources of information relevant to the practices are also identified in the report. Further detailed resource information is provided on the accompanying CD to supplement information presented in this report.
Table ES-1: Best or Most Common Practices used by States
Category Practice Areas Issues Addressed
A. General
A1. Training and Guidelines
Safety to field crew Equipment installation, calibration, and maintenance Data quality control and assurance Institutional issues
B. Data Collection
Equipment
B1. Equipment Selection, Calibration and Maintenance
Technological limitations of detection equipment Safety of field crew on high-volume routes Equipment failures and damage High quality data on high-volume routes
B2. Use of Non-Intrusive Equipment
Safety of field crew on high-volume routes Installation and maintenance costs Equipment damage – loops and sensors Congested and stop-and-go traffic conditions Construction and incidents
C. Data Collection
C1. Use of Safety Strategies
Safety of field crew on high-volume routes Data collection on high-volume routes Congested and stop-and-go traffic conditions
C2. Ramp Balancing Safety of field crew on high-volume routes Data collection on high-volume routes Congested and stop-and-go traffic conditions
C3. Innovative contractual Practices
Improved data quality Institutional issues, e.g., funding Lack of interagency cooperation
C4. Use of ITS Data
Safety of field crew on high-volume routes Limited coverage of traffic monitoring program Congested and stop-and-go traffic conditions Construction and incidents
D. Data Processing
and Quality Control
D1. Data Processing and Quality Control Procedures
Raw data analysis and AADT estimation Assumptions and business rules Data quality control and assurance issues
D2. Adjustment Factors and Growth Factors
Raw data analysis and AADT estimation Assumptions and business rules
HPMS AADT Reporting for High Volume Routes ix September 3, 2004
Guidelines for Data Collection for High-Volume Routes
For traffic data gathering and processing, each state DOT follows a set of procedures, chooses, and uses equipment that best meets their specific needs. The guidelines are intended as a guide or reference source based on states’ experiences and lessons learned to help states seeking direction or guidance on addressing common or specific issues relating to traffic data collection and processing for high-volume routes.
Data Collection
The following steps are considered useful for traffic monitoring on high-volume routes.
1. Define high-traffic volume – It is important to define a high-traffic volume route in terms of traffic volume. It is recommended that 50,000 AADT be used as the threshold.
2. Identify high-volume locations – The next step is to identify routes carrying high traffic
volume. This is important in selecting and planning installation of data collection equipment.
3. Select data collection strategies – Several strategies for collecting traffic data on high-
volume routes have been identified. These strategies are being practiced in some states and are designed to address the issues and challenges associated data collection on high-volume routes. These include:
Provide training including safety guidelines for all field personnel. Coordinate equipment installation (e.g., inductive loops) with pavement
construction and maintenance activities. Use ramp-balancing techniques. Use technologies for better classification and lane-by-lane detection of vehicles. Develop data and resource sharing agreements among local agencies that
coordinate traffic collection activities. Use contractors for data collection.
Data Processing and Data Quality Assurance
The following are recommended elements in data processing and quality assurance of AADT data. These are intended to guide states in validating and evaluating the quality of data from different sources and for different applications. Methods of calculating adjustment and growth factors are also included.
1. Data validation – Data processing to verify validity and completeness is carried out using either in-house software packages or legacy mainframe programs.
2. Adjustment factors and growth factors – Adjustment factors based on TMG
recommendations are needed to convert short-term volume counts to AADTs. Several
HPMS AADT Reporting for High Volume Routes x September 3, 2004
approaches have been identified to guide the states in selecting those that best meet their needs.
3. Assessment of data quality – The recently developed framework1 for assessing traffic data
quality is recommended for use in assessing the quality of data from different sources and for different applications. The framework presents a comprehensive methodology for evaluating the quality of traffic data using a set of quality measures.
Use of ITS and Other Data Sources
ITS data offer a valuable source of traffic data especially to the HPMS program. Some state DOTs rely on ITS-generated data to report AADT for HPMS for parts of their program, other states have concerns about the quality and reliability of such data. Potential approaches to encourage the use of ITS data for traffic monitoring applications include: 1. Resource sharing – Merge ITS field infrastructure (like inductive loops and sensors) with
traditional traffic counting devices to allow the use of the traffic counters/ classifiers alongside ITS devices. It is recommended that a program be developed that combines ITS and traditional traffic monitoring.
2. Compatible equipment – Investigate the use of compatible equipment or sensor-sharing arrangements where the signals from in-road sensors are split into two devices. The intent would be to use ITS sensors for traditional data gathering without impacting ITS operations.
3. Strategic locations – The need to select strategic locations for ITS sensors is critical to traffic
monitoring. Identifying and locating ITS sensors strategically would also allow the sensors to be maintained jointly by the traffic monitoring group and ITS groups.
4. Supplemental data source - Increase use of data from ITS data archives could supplement
HPMS and traffic monitoring programs. States are encouraged to develop ITS data archives based on experiences in other states.
Equipment
Selection of data collection equipment is determined by individual state experiences, needs, and conditions. The following are expected to guide the selection of equipment and technologies.
Advances in detection technology – Improvements in loop installations and vehicle counters have reduced greatly the problems with inductive loops. Advanced vehicle counters with loop signatures-based detection and classification promise to build upon the improvements.
1 Traffic Data Quality Measurement, Battelle for FHWA, Office of Highway Policy Information, 2004
HPMS AADT Reporting for High Volume Routes xi September 3, 2004
Equipment calibration and testing – Accuracy testing of equipment is often done at the time of procurement rather than during regular operations. In order to test equipment installed in the field for accuracy, it is necessary to develop quick and easy methods for field personnel, including such methods as visual displays on counters or manual counts prior to setting up short-term counts.
Equipment maintenance – The use of maintenance contracts for rapid restoration of
Automatic Traffic Recorders (ATRs) is a strategy being used or considered by some states interviewed. Tasks for such contracts include performing regular maintenance of equipment, on-call duties, and installation of new sites.
Non-intrusive equipment – Out of 13 states interviewed, 10 indicated they either use or are testing non-intrusive detection equipment. States need to develop specifications or criteria that non-intrusive detectors must satisfy to help in their selection. These specifications or criteria should include installation and calibration guidelines, functionality requirements (e.g., volume accuracy, classification accuracy), testing procedures, and equipment specifications, including power supply issues, weather-related issues.
Testing and evaluation results – Sharing information about the capabilities or experiences with new and improved technologies and vendors is considered important to state DOTs. A clearinghouse of vehicle-detector information would be useful to state DOTs in comparing and selecting detection equipment. The Vehicle Detection Clearinghouse (VDC), a multi-state, managed by the Southwest Technology Development Institute (SWTDI) at New Mexico State University (NMSU) (www.nmsu.edu/~traffic) is a valuable resource for information on technology, evaluation, testing results, and level of use by states.
Concluding Remarks
The practices and guidelines presented in this report are intended as a reference for states to improve the quality of traffic data collection and processing on high-volume routes especially. The guidelines are not intended as uniform standards that all states must follow, and they are not intended to replace existing successful practices. The following are general conclusions from this examination of current data collection and processing practices.
A high-volume route is usually not defined solely in terms of traffic volume, but rather in terms of the difficulty in installing data-collecting equipment. It is recommended that a threshold of 50,000 AADT be used in defining high-volume routes.
Safety to data collection crew was identified as a major deterrent to data concern on high-volume routes. As such, many states view training and guidelines on safety are crucial to improving data collection on high-volume routes. States have adopted several practices to improve data collection, processing, and reporting for high traffic-volume routes.
HPMS AADT Reporting for High Volume Routes xii September 3, 2004
These practices are designed to address the challenges and issues associated with high-volume routes.
Equipment problems are common to all states interviewed, regardless of the type of
equipment. Non-intrusive equipment is increasingly being used or considered for data collection by several states. States need to develop specification and criteria to guide the selection and testing of such equipment.
The potential for using ITS data for HPMS has been recognized by many states.
Increasingly, stated are tending to ITS-generated data for HPMS reporting. Several states like Florida, Ohio, Michigan, and Illinois have successfully used ITS data for HPMS reporting. Other states are experimenting with using ITS data sources for HPMS reporting.
Descriptions of intrusive and non-intrusive data collection equipment are provided to
identify the limitations, advantages, and evaluation results and provide a guide to technology selection.
HPMS AADT for High Volume Routes – Final Report 2 September 3, 2004
1.0 Introduction
1.1 Background
The Federal Highway Administration (FHWA) is responsible for assuring that adequate highway transportation information is available to support its own functions and those of the Administration and Congress. The primary purpose of the Highway Performance Monitoring System (HPMS) is to serve these data and information needs to reflect the condition and operating characteristics of the nation’s highways. The HPMS program is a cooperative effort involving state highway agencies, local governments, and metropolitan planning organizations (MPOs) working in partnership to collect, assemble, and report the needed data and information. FHWA maintains data submittal software and analytical models and techniques that can utilize the HPMS data to conduct the necessary planning and programming. The data needed by the FHWA include highway length, lane-miles, and travel data to support the apportionment of Federal-aid highway funds under the Transportation Equity Act for the 21st Century (TEA-21). HPMS data also support the analyses needed for the biennial condition and performance reports to Congress and are the source for much information used in a variety of publications and media. One of the required data elements for the HPMS program is vehicle-miles traveled (VMT). VMT is derived from average annual daily traffic (AADT), so an accurate measure of AADT is essential. To report VMT for the HPMS, a jurisdiction must be able to count and classify vehicles accurately, use the count data to estimate AADT, and it must have a reasonably accurate total of its centerline-miles of highways. Traffic data collected on the highest volume routes have the most significant impact since these data represent a large share of total statewide and national travel. These routes are also often the most difficult locations to monitor. State and public agencies use various strategies to develop effective counting programs at these locations. There are several possible sources of traffic data for high-volume routes that are not being fully utilized. Data collected by other agencies for other purposes, although supported by FHWA programs, are not always used for a variety of reasons, including accuracy, reliability, reference to HPMS section locations, and data management. However, states are using successful procedures that are not widely shared or even shared internally with appropriate state HPMS and traffic monitoring staffs. As a result, the best methods available to estimate AADTs and alternatives for improving data quality for HPMS are not being fully utilized.
1.2 Project Objectives
The primary objective of this project is to investigate and document information that can be shared with states on various procedures being used to estimate and report traffic data on high-volume routes. This information will help improve HPMS traffic monitoring programs in urban areas. This study focuses on the accurate collection of traffic data on high-volume routes, as

HPMS AADT for High Volume Routes – Final Report 3 September 3, 2004
well as the processes that accompany the collection of these data. The study will yield a report of best practices and guidelines for improving the quality of AADT estimates on these high-volume routes.
1.3 Organization of Report
The remainder of the report is organized as follows:
Chapter 2 presents the research approach and discusses the major findings from the literature review and interviews. These include issues and challenges associated with traffic data collection on high-volume routes
Chapter 3 presents the best or most common practices used by states to collect and process traffic data on high-volume routes. The practices were identified through a combination of literature reviews and interviews.
Chapter 4 presents the range of equipment used for data collection with a focus on advances in technologies and applicability for high-volume routes.
Chapter 5 presents the guidelines for data collection for high-volume routes. These guidelines are based on the practices and equipment discussed in Chapters 3 and 4. The guidelines are illustrated with examples with additional supporting documentation on a CD accompanying this report.
Chapter 6 presents the concluding remarks. To maintain a manageable document size, additional documentation about practices are also provided on an accompanying CD. These include detailed documentation on traffic monitoring guidelines, contractor specifications, data quality guidelines, equipment evaluations, and performance specifications. A user guide to the CD is provided as an appendix to the document. Sections with references to documents on the CD include hyperlinks in the main text of the report to the corresponding documents.
HPMS AADT for High Volume Routes – Final Report 4 September 3, 2004
2.0 Traffic Monitoring on High-volume Roads
This chapter presents the research approach used in this study and highlights the main findings.
2.1 Information Gathering
The information for developing this report was gathered through review of published literature and telephone interviews with representatives of state Departments of Transportation (DOTs). This section summarizes the findings from the literature review and interviews.
2.1.1 Literature Review
Documents, conference proceedings and articles published in recent years dealing with HPMS, traffic data collection procedures and traffic monitoring equipment systems were reviewed. A complete listing of references is provided at the end of this document. The literature review focused on AADT monitoring on high-volume roads. Several states with significant mileage of roadways with high AADT volumes were identified. The review did not identify any state practices that are specific to high traffic-volume locations. State DOTs use a variety of programs directed at improving their traffic monitoring programs especially in urban locations, ranging from the use of Intelligent Transportation System (ITS) sensors to better training of agency personnel to collect data on urban/multi-lane facilities. State DOTs are also investigating new technology and equipment for use in urban areas. The most common equipment used by states are inductive loop and piezoelectric sensors for permanent counts and pneumatic tubes for short-term counts. Non-intrusive devices are not commonly used due to concerns with vehicle classification. The Urban Transportation Monitor2 conducted a recent survey of traffic engineers in the U.S. and Canada to obtain information about traffic counting issues. The survey was sent out to 700 transportation professionals at public agencies via email. The following are some of the relevant findings based on responses received from 124 cities (i.e., 18 percent response rate): Equipment
The equipment mostly used for traffic data collection at permanent count stations is inductive loops while pneumatic road-tubes are mostly used for short term counts. Factors dictating the selection of permanent count locations include (high) traffic volumes and functional highway classification. Both permanent and short term count stations are used primarily for traffic volume data collection. Speed and classification data are secondary. The survey also revealed that consultants are extensively used in traffic data collection. The respondents also listed some desirable improvements with counter equipment to include ability to import count data into software applications such as MS Excel, Access; increased durability, reliability, and accuracy.
2 The Urban Transportation Monitor. Vol. 18, No. 7, April 16, 2004.
HPMS AADT for High Volume Routes – Final Report 5 September 3, 2004
Quality Control
The survey noted that data quality control (QC) was primarily done by the agency staff. Majority of the QC software used are provided by equipment manufacturers. Few agencies use in-house or third party software for quality control. About 36 percent respondents did not use any QC software. Several areas of improvements in the processing of traffic data were identified e.g.:
Software compatibility across manufacturers will increase reporting flexibility and integration of databases/geographic information system (GIS) for data management
Need to update software to take into account errors in using rubber hoses Software needs to dynamically show the QC person the actual count data in a graphical
format (volumes) and allow user to discard individual days of data one day at a time Integrate with GIS and have a standard output format
The survey results show that the present average error level reported by the respondents is closer to 5 percent. Most of the respondents (74 percent) indicated that their counts were accurate to about 95 percent (or 5 percent inaccuracies). In fact, 96 percent of the respondents indicated that the error in counts is less than 10 percent. Interagency Agreements
With regards to data sharing, the survey indicated that 79 percent of the responding agencies do not have any inter-local agreements that coordinate traffic collection activities. It was observed that the lack of coordination among agencies can lead to duplication of effort and an inability to share resources toward making traffic counting in a metropolitan area more efficient.
2.1.2 Interviews with State DOTs
The main source of information for developing the best or common practices is interviews with traffic monitoring program managers and personnel from selected state DOTs. To determine the states to contact for information, those with the highest mileage of highways with high traffic-volumes were identified using HPMS 2001 data and National Highway Planning Network (NHPN) databases. Typically, high-volume routes have volumes in excess of 50,000 AADT. However, given that the definition of high traffic volume varies from agency to agency and from state to state, three threshold values were used: 50,000, 75,000 and 100,000 AADT (Table 2.1). The top 13 states with high traffic volumes were selected: California, Texas, Florida, Georgia, Illinois, Massachusetts, Maryland, Michigan, Ohio, New York, New Jersey, Virginia, and Washington. An interview guide was developed to facilitate the data collection process. Prior to the actual interviews, the guide was distributed to the state representatives. The interview guide was structured to capture information on various aspects relating to
(i) Traffic data collection approaches to high-volume routes (ii) Data processing methods and practices (iii) Data quality assurance practices and
HPMS AADT for High Volume Routes – Final Report 6 September 3, 2004
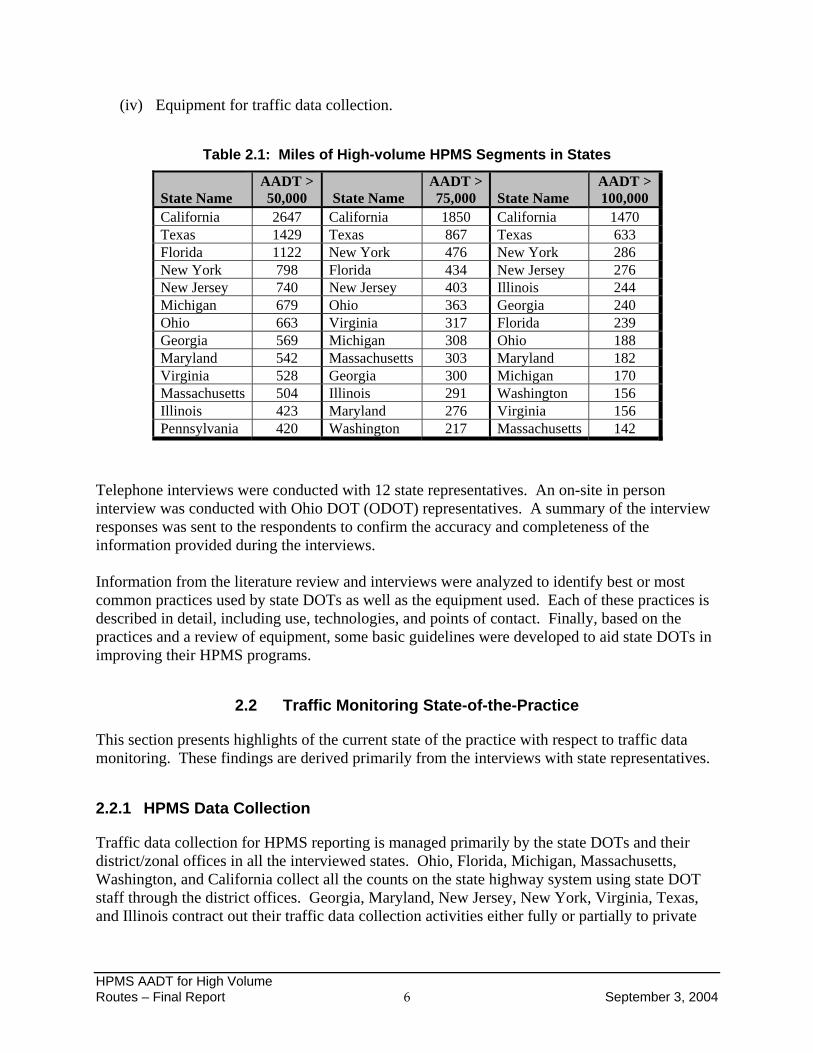
(iv) Equipment for traffic data collection.
Table 2.1: Miles of High-volume HPMS Segments in States
State Name
AADT > 50,000 State Name
AADT >75,000
State Name
AADT > 100,000
California 2647 California 1850 California 1470 Texas 1429 Texas 867 Texas 633 Florida 1122 New York 476 New York 286 New York 798 Florida 434 New Jersey 276 New Jersey 740 New Jersey 403 Illinois 244 Michigan 679 Ohio 363 Georgia 240 Ohio 663 Virginia 317 Florida 239 Georgia 569 Michigan 308 Ohio 188 Maryland 542 Massachusetts 303 Maryland 182 Virginia 528 Georgia 300 Michigan 170 Massachusetts 504 Illinois 291 Washington 156 Illinois 423 Maryland 276 Virginia 156 Pennsylvania 420 Washington 217 Massachusetts 142
Telephone interviews were conducted with 12 state representatives. An on-site in person interview was conducted with Ohio DOT (ODOT) representatives. A summary of the interview responses was sent to the respondents to confirm the accuracy and completeness of the information provided during the interviews. Information from the literature review and interviews were analyzed to identify best or most common practices used by state DOTs as well as the equipment used. Each of these practices is described in detail, including use, technologies, and points of contact. Finally, based on the practices and a review of equipment, some basic guidelines were developed to aid state DOTs in improving their HPMS programs.
2.2 Traffic Monitoring State-of-the-Practice
This section presents highlights of the current state of the practice with respect to traffic data monitoring. These findings are derived primarily from the interviews with state representatives.
2.2.1 HPMS Data Collection
Traffic data collection for HPMS reporting is managed primarily by the state DOTs and their district/zonal offices in all the interviewed states. Ohio, Florida, Michigan, Massachusetts, Washington, and California collect all the counts on the state highway system using state DOT staff through the district offices. Georgia, Maryland, New Jersey, New York, Virginia, Texas, and Illinois contract out their traffic data collection activities either fully or partially to private
HPMS AADT for High Volume Routes – Final Report 7 September 3, 2004
agencies. In all states, city, MPOs and local agencies are involved in data collection for minor roads to varying extents. Continuous counts are used by state DOTs for HPMS reporting where possible. Automatic Traffic Recorders (ATRs) are used for continuous counts that are 24-hour counts for every day of the year. ATRs are permanently installed on or near the roadway. Continuous counts provide volume and classification data as well as data needed to calculate daily, monthly, and seasonal variations in traffic to develop adjustment factors to apply to short-term counts. Continuous counts are carried out by State DOT personnel in all states except Virginia, where contractors are responsible for the equipment and data collection. Short counts comprise the bulk of the data collection program for HPMS. Short-count durations range from 24 hours, 48 hours (recommended by the Traffic Monitoring Guide [TMG]) to a full week (California). HPMS counting cycles range, depending on functional class, from annually (e.g., Texas) to once every three years. Short-counts are often a mixture of volume only, and volume and classification counts. Each state has its own methods of calculating adjustment factors with the data from ATRs and classification stations based on TMG guidelines for converting short-term volumes into AADTs. California, Florida, and Washington have detailed documentation on the calculation of adjustment factors. Most of the states interviewed use contractors to some extent to collect short-count data. Data collected from continuous and short-term counts are processed in central offices of most state DOTs, although in some states, the district offices also do some preliminary data quality checks. Typically, state DOTs download and review daily volume counts (ADTs) for accuracy, completeness and validity. Review of traffic counts is often automated using either in-house or off-the-shelf software packages applying various traffic editing rules and traffic checks.
2.2.2 High-volume Routes
The primary objective of this project is to identify the best or common practices used by state DOTs and other agencies for collecting, processing and reporting traffic data on routes carrying high volumes. The definition of high-volume traffic routes varies from agency to agency. In fact, there is little evidence in the literature to indicate that state DOTs identify the segments for special emphasis for AADT monitoring based only on traffic volumes. An arbitrary definition of 20,000 AADT was used by FHWA in the Highway Information Quarterly Newsletter (www.fhwa.dot.gov/ohim/hiqsep01.htm). Other definitions include those used by the New York State DOT (NYSDOT) Pavements Group (High-Volume > 80,000 AADT). Interviews with state DOTs did not provide specific definitions for high-volume routes. Several factors influence state DOT concerns with traffic-volume monitoring in urban areas not only the volume of traffic on the roadway. A high-volume route is usually not defined solely in terms of traffic volume but rather in terms of the difficulty in installing data-collecting equipment. In general, roadway geometry, safety of data collection personnel, congestion, and multilane facilities were identified as factors used in identifying locations where data collection, especially short-term counts, is a problem. These locations invariably carry high traffic volumes.
HPMS AADT for High Volume Routes – Final Report 8 September 3, 2004
2.2.3 Summary of Interview Findings
This section summarizes the major findings relating to the state-of-the-practice in traffic monitoring reported by state DOTs. Data Collection and Processing Approaches
State DOT staff and contractors collect traffic data on the major highways. Short counts are the main source of data for HPMS reporting. Short counts range from 24 hours to the TMG-recommended 48 hours. HPMS counting cycles vary by state and functional highway class and typically range
from annually to once every three years. There is no universal method for calculating adjustment factors (e.g., California has its
own method for calculating adjustment factors). However, most of the methods used by states are based on TMG guidelines and use ATRs to calculate factors. Typically, ATRs are grouped into factor groups and functional classes. Adjustment factors are usually updated annually.
There is no universal traffic data processing software. In-house software or mainframe programs are used. A few states are trying to develop a comprehensive software solution to meet their data input, processing, storage and query needs.
Data processing (editing) rules are based on American Association of State Highway Transportation Officials (AASHTO) and TMG guidelines
Several states are experimenting with ITS for HPMS reporting. The use of ITS data in was recognized as potentially a very valuable resource although some quality concerns still remain. A few states including Florida, Illinois, Ohio, Michigan, and Washington use ITS data for sections of their highway systems for HPMS.
Data and resource sharing is becoming increasing common practice among state agencies. The use of counties and MPOs to provide traffic data to DOTs is used in New Jersey, New York, Florida and is being considered in California. The main advantage is the saving in resources and increased count coverage.
Data Collection Equipment
Each state uses data collection equipment by different manufacturers. States are comfortable with the performance of current equipment. Road tube is the primary equipment for short-term counts and inductive loops for
permanent counts. Equipment is periodically checked and re-set or recalibrated if necessary. The frequency
of tests, usually prompted by anomalies in data, varies by state. States conduct extensive calibration of equipment. Equipment problems such as failures, damage, or loss of communication, are common to
all states interviewed regardless of the type of equipment. The use of non-intrusive equipment was primarily for volume data. These devices are not widely used for data collection due to lack of knowledge on the capabilities and limitations. High-cost was also identified as a deterrent. DOTs however recognize the advantages of these devices. Some states have either tested or use limited non-intrusive technology.

HPMS AADT for High Volume Routes – Final Report 9 September 3, 2004
Quality Assurance and Control
The states interviewed employ the following approaches for data quality control and assurance:
Data processing rules and checklists are according to TMG Detailed data assessment procedures for continuous count data Staff training and use of guidelines Stringent adherence to calibration and set-up routines Proven algorithms for classifiers Tight control on vendors’ compliance with guidelines Proven software and data processing methods.
Issues and Challenges
The findings were analyzed to identify major issues facing state DOTs and other agencies in collecting data on high-volume routes. The major issues and challenges are listed below and discussed in detail in the following sections:
Safety of the traffic data collection crew was identified as the primary concern in installing equipment on high-volume routes. This applies to all types of data collection equipment.
Collecting traffic data in stop-and-go traffic conditions was identified as a major challenge. This includes technological limitations of sensors under those traffic conditions.
Traffic congestion precludes reliable classification counts. Equipment failures (e.g., sensor), communication problems, and inability to secure road
tubes throughout the duration of the counts was also identified as an issue associated with collecting traffic data on high-volume routes.
Construction affects traffic counts. Incidents also impact traffic data collection activities. Institutional issues, including funding constraints and lack of interagency cooperation,
were noted to impact traffic data collection activities. Data processing and quality control and assurance are challenges especially for high
traffic-volume routes.
2.3 Issues Associated with Data Collection on High-volume Routes
This section discusses the issues and challenges associated with data collection on high-volume routes in detail. In order to improve the quality of data for high-volume routes, these issues need to be addressed.
2.3.1 Safety of Traffic Personnel
Safety of the traffic data collection crew was indicated by all the states interviewed as the primary concern in conducting short-term counts. Ohio, Massachusetts, Washington, Texas,
HPMS AADT for High Volume Routes – Final Report 10 September 3, 2004
Illinois, and New Jersey mentioned safety as the primary concern in collecting data on high-volume routes. Massachusetts indicated that the major distinction between regular routes and high-volume routes relates to the safety procedures that need to be employed to protect staff and the traveling public.
2.3.2 Stop-and-Go Traffic
Traffic data collection in stop-and-go traffic conditions was identified as a major challenge. Stop-and-go traffic often results in volume and classification errors due to equipment limitations. Detectors that work on vehicle presence detection fail under these situations, resulting in erroneous data.
2.3.3 Congestion
Similar to stop-and-go traffic, heavy congestion or high-volume traffic precludes reliable classification. For example, in congested traffic, the class tables provided by the vendors frequently fail to determine whether four counted axles represent two cars or one truck. It is also difficult and unsafe to install and remove data collection equipment under such traffic conditions.
2.3.4 Equipment Failures
Equipment failures (e.g., sensors), communication problems, and inability to secure road-tubes properly throughout the duration of counts are factors that affect the quality of data collected on high-volume routes. Some equipment failures are caused by external factors such as vandalism, utility operations, pavement repair and maintenance, pavement surface striping, and pavement deterioration.
2.3.5 Construction Impacts
Construction was identified as an impediment in data collection, but most states interviewed consider anticipated construction activities when planning their counting programs. However, the effect of construction on alternative routes is a concern, as it can result in abnormal data during a particular year on a given route. For example, construction on a major highway might result in increased traffic on nearby or alternate county and local roads. Unless clearly specified, the final user of the data has no way of knowing the underlying reasons for abnormality in the data.
2.3.6 Incident Impacts
Incidents are often more troublesome from a traffic data collection standpoint for the obvious reason that they are unforeseen. An incident on a section with ATRs can result in significant data losses.

HPMS AADT for High Volume Routes – Final Report 11 September 3, 2004
2.3.7 Data Quality and Assurance
Data quality and assurance were identified as important issues. The ability to process and assess the quality of data from different data collection equipment efficiently was noted as a challenge especially for high-volume routes. While states do not have a separate process for high-volume routes, they expect their processes to be robust enough to verify the validity of data for such traffic conditions.
2.3.8 Institutional Issues
The institutional issues were based on information from the literature review. The Volpe National Transportation Systems Center (VNTSC) conducted a survey of traffic monitoring in urban areas for FHWA (Volpe, 1997). The study noted that funding and staffing cutbacks have hurt data collection efforts in the recent past, and continue to pose a threat in the future. It also concluded that successful coordinated data collection programs were based on a spirit of cooperation and professionalism among all involved parties within a region. While current programs generally provide the data that is needed, data quality and accessibility are major concerns. The best or common practices were identified to address these issues and challenges based on the findings, issues, and challenges described above. The next chapter presents detailed descriptions of the practices with examples.

HPMS AADT for High Volume Routes – Final Report 12 September 3, 2004
3.0 Best or Most Common Practices used by States
3.1 Introduction
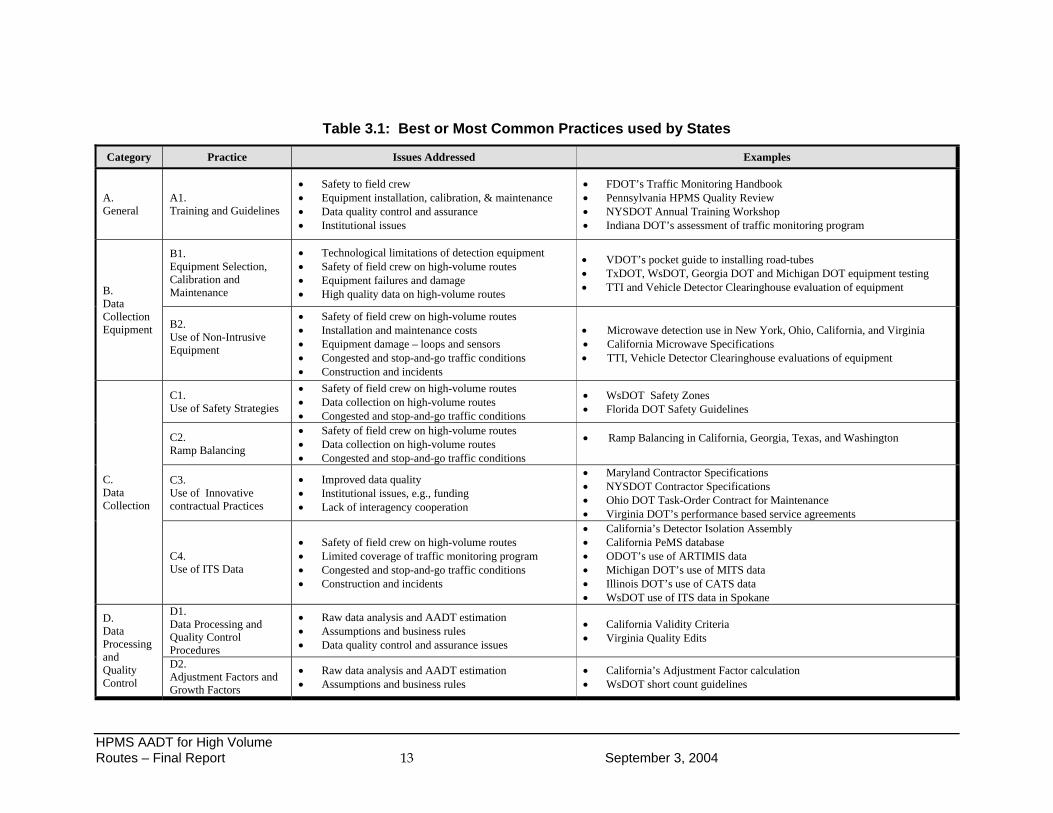
The purpose of this chapter is to describe the various practices that address the issues and challenges associated with data collection, processing, and reporting for high traffic-volume routes. Table 3.1 aligns the issues to the practices adopted by states to overcome or mitigate them. The practices are grouped into four major categories: (A) general (the issues apply to all categories), (B) data collection equipment, (C) data collection, and (D) data processing, quality control, and quality assurance. The descriptions are based on the information gathered through the interviews of sample states and supplemented by information from the published literature. The practice areas are illustrated with examples of use by states. Additional sources of information relevant to the practices are also identified. Furthermore, additional documentation for each practice area is included on an accompanying CD. Where possible, hyperlinks to these documents are provided. The documents on the CD include traffic monitoring guidelines, HPMS field guides, contractor specifications, training materials, equipment evaluations and specifications, and data quality assessments.
HPMS AADT for High Volume Routes – Final Report 13 September 3, 2004
Table 3.1: Best or Most Common Practices used by States
Category Practice Issues Addressed Examples
A. General
A1. Training and Guidelines
Safety to field crew Equipment installation, calibration, & maintenance Data quality control and assurance Institutional issues
FDOT’s Traffic Monitoring Handbook Pennsylvania HPMS Quality Review NYSDOT Annual Training Workshop Indiana DOT’s assessment of traffic monitoring program
B. Data Collection Equipment
B1. Equipment Selection, Calibration and Maintenance
Technological limitations of detection equipment Safety of field crew on high-volume routes Equipment failures and damage High quality data on high-volume routes
VDOT’s pocket guide to installing road-tubes TxDOT, WsDOT, Georgia DOT and Michigan DOT equipment testing TTI and Vehicle Detector Clearinghouse evaluation of equipment
B2. Use of Non-Intrusive Equipment
Safety of field crew on high-volume routes Installation and maintenance costs Equipment damage – loops and sensors Congested and stop-and-go traffic conditions Construction and incidents
Microwave detection use in New York, Ohio, California, and Virginia California Microwave Specifications TTI, Vehicle Detector Clearinghouse evaluations of equipment
C. Data Collection
C1. Use of Safety Strategies
Safety of field crew on high-volume routes Data collection on high-volume routes Congested and stop-and-go traffic conditions
WsDOT Safety Zones Florida DOT Safety Guidelines
C2. Ramp Balancing
Safety of field crew on high-volume routes Data collection on high-volume routes Congested and stop-and-go traffic conditions
Ramp Balancing in California, Georgia, Texas, and Washington
C3. Use of Innovative contractual Practices
Improved data quality Institutional issues, e.g., funding Lack of interagency cooperation
Maryland Contractor Specifications NYSDOT Contractor Specifications Ohio DOT Task-Order Contract for Maintenance Virginia DOT’s performance based service agreements
C4. Use of ITS Data
Safety of field crew on high-volume routes Limited coverage of traffic monitoring program Congested and stop-and-go traffic conditions Construction and incidents
California’s Detector Isolation Assembly California PeMS database ODOT’s use of ARTIMIS data Michigan DOT’s use of MITS data Illinois DOT’s use of CATS data WsDOT use of ITS data in Spokane
D. Data Processing and Quality Control
D1. Data Processing and Quality Control Procedures
Raw data analysis and AADT estimation Assumptions and business rules Data quality control and assurance issues
California Validity Criteria Virginia Quality Edits
D2. Adjustment Factors and Growth Factors
Raw data analysis and AADT estimation Assumptions and business rules
California’s Adjustment Factor calculation WsDOT short count guidelines
HPMS AADT for High Volume Routes – Final Report 14 September 3, 2004
3.2 Best or Most Common Practices
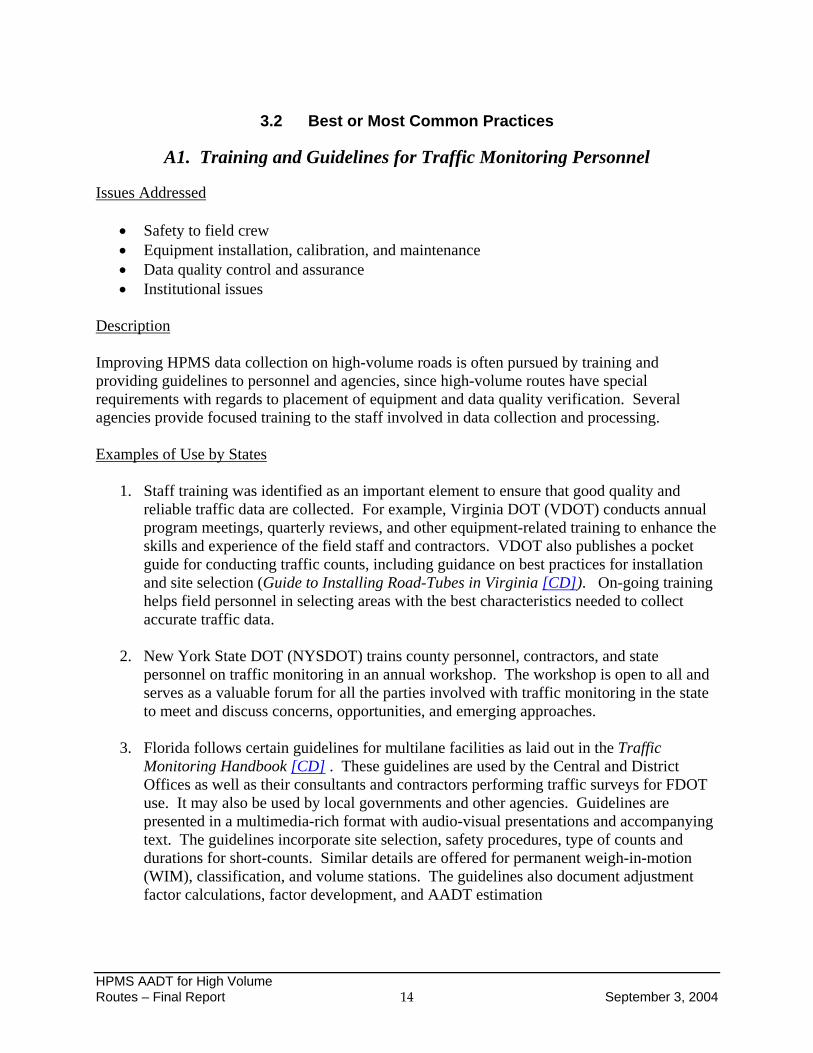
A1. Training and Guidelines for Traffic Monitoring Personnel
Issues Addressed
Safety to field crew Equipment installation, calibration, and maintenance Data quality control and assurance Institutional issues
Description Improving HPMS data collection on high-volume roads is often pursued by training and providing guidelines to personnel and agencies, since high-volume routes have special requirements with regards to placement of equipment and data quality verification. Several agencies provide focused training to the staff involved in data collection and processing. Examples of Use by States
1. Staff training was identified as an important element to ensure that good quality and reliable traffic data are collected. For example, Virginia DOT (VDOT) conducts annual program meetings, quarterly reviews, and other equipment-related training to enhance the skills and experience of the field staff and contractors. VDOT also publishes a pocket guide for conducting traffic counts, including guidance on best practices for installation and site selection (Guide to Installing Road-Tubes in Virginia [CD]). On-going training helps field personnel in selecting areas with the best characteristics needed to collect accurate traffic data.
2. New York State DOT (NYSDOT) trains county personnel, contractors, and state
personnel on traffic monitoring in an annual workshop. The workshop is open to all and serves as a valuable forum for all the parties involved with traffic monitoring in the state to meet and discuss concerns, opportunities, and emerging approaches.
3. Florida follows certain guidelines for multilane facilities as laid out in the Traffic
Monitoring Handbook [CD] . These guidelines are used by the Central and District Offices as well as their consultants and contractors performing traffic surveys for FDOT use. It may also be used by local governments and other agencies. Guidelines are presented in a multimedia-rich format with audio-visual presentations and accompanying text. The guidelines incorporate site selection, safety procedures, type of counts and durations for short-counts. Similar details are offered for permanent weigh-in-motion (WIM), classification, and volume stations. The guidelines also document adjustment factor calculations, factor development, and AADT estimation
HPMS AADT for High Volume Routes – Final Report 15 September 3, 2004
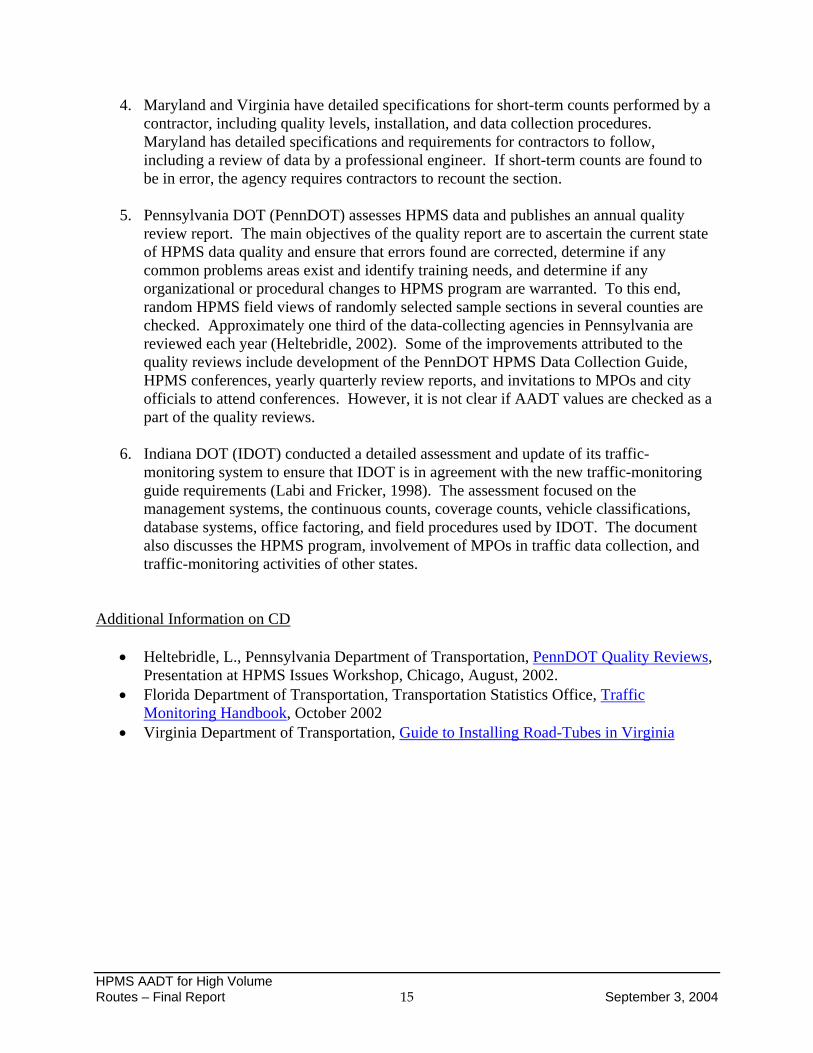
4. Maryland and Virginia have detailed specifications for short-term counts performed by a contractor, including quality levels, installation, and data collection procedures. Maryland has detailed specifications and requirements for contractors to follow, including a review of data by a professional engineer. If short-term counts are found to be in error, the agency requires contractors to recount the section.
5. Pennsylvania DOT (PennDOT) assesses HPMS data and publishes an annual quality
review report. The main objectives of the quality report are to ascertain the current state of HPMS data quality and ensure that errors found are corrected, determine if any common problems areas exist and identify training needs, and determine if any organizational or procedural changes to HPMS program are warranted. To this end, random HPMS field views of randomly selected sample sections in several counties are checked. Approximately one third of the data-collecting agencies in Pennsylvania are reviewed each year (Heltebridle, 2002). Some of the improvements attributed to the quality reviews include development of the PennDOT HPMS Data Collection Guide, HPMS conferences, yearly quarterly review reports, and invitations to MPOs and city officials to attend conferences. However, it is not clear if AADT values are checked as a part of the quality reviews.
6. Indiana DOT (IDOT) conducted a detailed assessment and update of its traffic-
monitoring system to ensure that IDOT is in agreement with the new traffic-monitoring guide requirements (Labi and Fricker, 1998). The assessment focused on the management systems, the continuous counts, coverage counts, vehicle classifications, database systems, office factoring, and field procedures used by IDOT. The document also discusses the HPMS program, involvement of MPOs in traffic data collection, and traffic-monitoring activities of other states.
Additional Information on CD
Heltebridle, L., Pennsylvania Department of Transportation, PennDOT Quality Reviews, Presentation at HPMS Issues Workshop, Chicago, August, 2002.
Florida Department of Transportation, Transportation Statistics Office, Traffic Monitoring Handbook, October 2002
Virginia Department of Transportation, Guide to Installing Road-Tubes in Virginia
HPMS AADT for High Volume Routes – Final Report 16 September 3, 2004
B1. Equipment Selection, Calibration, and Maintenance
Issues Addressed
Technological limitations of vehicle detection equipment Safety of field crew on high-volume routes Equipment failures and damage High quality data on high-volume routes
Description Agencies are trying to maximize performance of existing technologies such as axle and volume traffic counters using road tubes or inductive loops. Improving performance of these detectors is primarily achieved through a combination of installation, calibration, and maintenance practices as well as through technical improvements. Examples of Use in States Accuracy of Counters
The accuracy of counters declines in high-volume conditions, especially using pneumatic road tubes. The accuracy of classifiers also declines in congested or especially in stop-and-go conditions. The following are potential solutions to the problem and illustrated by examples.
1. Make sure local practice complies with standards for installing pneumatic tubes for roadway traffic counters and classifiers (See ASTM E1957, “Standard Practice for Using Pneumatic Tubing for Roadway Traffic Counters and Classifiers”).
2. Tests conducted by Texas Transportation Institute (TTI) on Peek ADR-6000
demonstrated that it can accurately classify vehicles in stop-and-go conditions and even when vehicles change lanes over the detectors.
3. Washington state DOT (WSDOT) conducts coverage counts by pneumatic road tubes
using Peek ADR-1000 equipment. The software includes tailgate logic to improve classification accuracy in cases where vehicles are close together and might otherwise be classified as a single vehicle (truck) instead of two cars.
4. Florida DOT (FDOT) discourages the use of pneumatic road tubes and recommends
installation of permanent sensors as part of construction projects on multilane facilities.
5. California DOT (Caltrans) has a battery of quality checks for equipment and data. It also recommends hiring quality staff to ensure high-quality data.
6. VDOT uses tight classification tables and requires vendors to use the same. Field
personnel are experts with the equipment.
HPMS AADT for High Volume Routes – Final Report 17 September 3, 2004
7. Illinois DOT (ILDOT) had great success with Hi-Star Numetric sensors in collecting traffic volume and classification data on highways carrying traffic less than 75,000 AADT. These sensors are easy to install and are excellent for volume data and fairly good for vehicle classification.
Maintenance, Calibration, and Testing
Pneumatic tubes are a stable technology and are the mainstay of short-term equipment in many states. States interviewed are comfortable in using this technology, while recognizing its limitations. In order to increase the efficiency of road tubes, states require staff and contractors to select appropriate locations to minimize some common problems (e.g., stop-and-go traffic, parking on road tubes, pavement surface deterioration), secure the tubes to the roadway, and check the settings on the counter. The use of high-quality surge suppressors and adequate equipment ground on-site minimizes the risk of damage to pneumatic road tubes due to lightening. Also, the use of gas-discharge tubes for primary protection of phone lines. In order to reduce the risk of premature loop failure due to pavement rutting or other pavement factors, avoid the use of inductive loops in thin pavements (less than 4 inches thick) or in pavements that need rehabilitation. Their installation in such pavements will often induce even more problems. Improve pavement maintenance and use deeper saw cuts to allow milling as needed. The use of high quality loop detector wire with a thick PE or PVC tube such as IMSA Spec 51-5 and twist loop lead-in wire at least 6 turns per foot to reduce cross talk is recommended. 1. VDOT provides a Pocket Guide (“Guide to Installing Road-Tubes in Virginia”) [CD] to
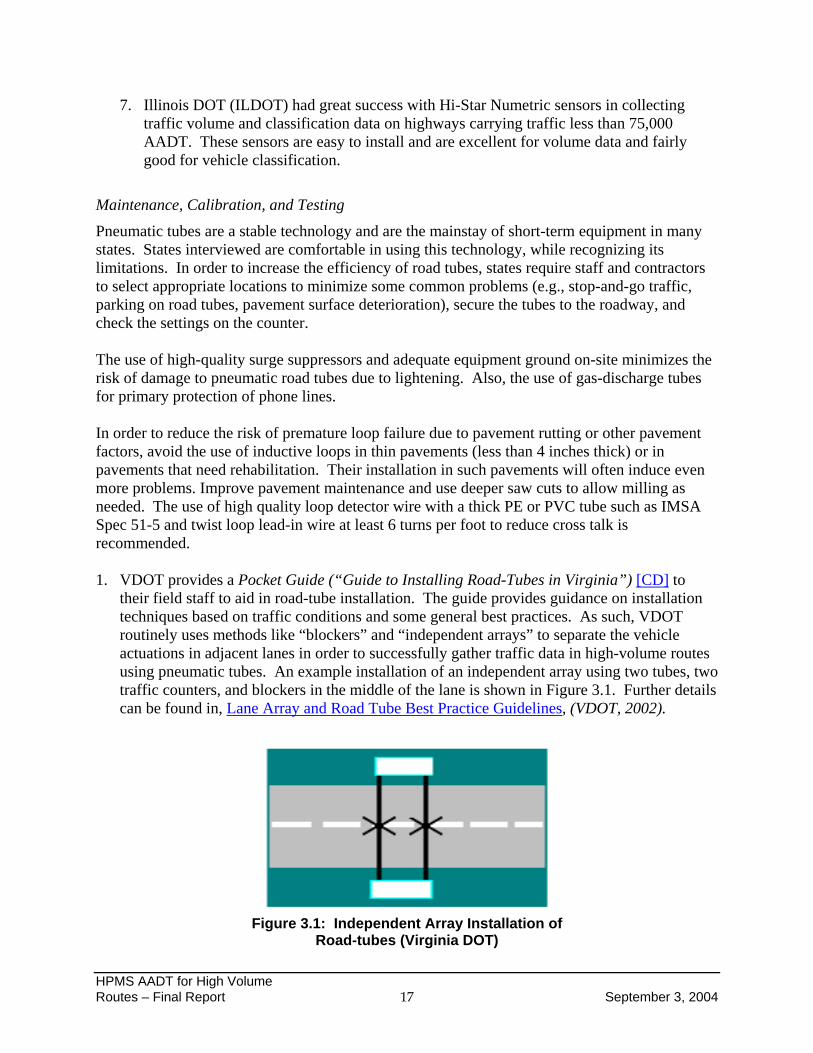
their field staff to aid in road-tube installation. The guide provides guidance on installation techniques based on traffic conditions and some general best practices. As such, VDOT routinely uses methods like “blockers” and “independent arrays” to separate the vehicle actuations in adjacent lanes in order to successfully gather traffic data in high-volume routes using pneumatic tubes. An example installation of an independent array using two tubes, two traffic counters, and blockers in the middle of the lane is shown in Figure 3.1. Further details can be found in, Lane Array and Road Tube Best Practice Guidelines, (VDOT, 2002).
Figure 3.1: Independent Array Installation of Road-tubes (Virginia DOT)
HPMS AADT for High Volume Routes – Final Report 18 September 3, 2004
2. In Ohio, data collection crews are instructed to review data prior to submitting to central office for processing. The crew is instructed to check for high volume, multiple hours of zeros, and to reset the counters if necessary. The existing count contract includes a reset clause. When Ohio DOT (ODOT) determines that there is an error with the count, the contractor is required to make a reset. If reset is within a given range of the original count, ODOT pays the contractor for the two counts. If a difference in the count is significant, ODOT pays for one count. All new equipment is tested for accuracy and calibrated before installation. ODOT is currently initiating a research project to create a piezo-weigh-in-motion (WIM) bench tester.
3. Texas DOT (TxDOT) tests axle counters annually using a test highway section and
ground truth measurements, including manual and video counts that are then corroborated with axle counters. In Washington, tube counters are set and validated prior to every count. A manual count (100 axles or 5 minutes of traffic, whichever comes first) is performed and compared to the data from the traffic counters. Similarly, each of the continuous count sites is validated once a year by a manual traffic count (three hours in duration).
4. Michigan DOT (MDOT) tests short-count equipment set-up for accuracy prior to data
collection. ATR data are downloaded daily and reviewed in week-long chunks. Any abnormalities in the data are identified by the reviewer, and the maintenance staff is sent to check the device. In addition, ATRs are also polled daily to test for communication problems. MDOT tries to schedule counts either before or after construction when possible during the traffic-counting season (Mid-April to Mid November).
5. Caltrans inspects ATRs only if unable to poll the ATR or if the data are erroneous.
However, extreme care is taken in installation and calibration. Extensive calibration is performed before accepting any new equipment.
In Virginia, trained operators check equipment for accuracy during the initial setup operation in all cases. All equipment currently in use has a visual display with real-time results. Each new count setup requires an evaluation of performance before continuing on to the next count. Road-tubes are checked before each setup and replaced as needed. Advanced loop logic functions provide information when piezo-sensors begin to fail so that preventive maintenance can be planned. Equipment performance is continuously reviewed, and hardware and firmware upgrades are added as needed. In-house software is used to examine all data collected to determine the performance of equipment and sensors. New rules and parameters are added to the review process as needed. Any performance issues are addressed by making calibration changes to the detectors setup. Any changes in performance are addressed immediately. Locations with extreme stop-and-go traffic are avoided.
6. Georgia DOT (GDOT) randomly tests ATRs for accuracy using video logs that are then compared to the collected data. GDOT has a tolerance level of 5 percent variance from the ground truth and only equipment that meets this threshold is used. Adjustment factors for AADTs can be estimated better if ATRs are accurate and installed properly.
HPMS AADT for High Volume Routes – Final Report 19 September 3, 2004
For short-term counts, historical trend analysis is used with a tolerance level. GDOT also requires crews to report on conditions in the field, including changes from the previous count cycle.
7. New Jersey regularly recalibrates WIM sensors. Regular crack sealing is done at
piezoelectric axle sensors. Most service involves the communication link, such as resetting or reprogramming modems, replacing surge suppressors, or cleaning the cabinet interior. Occasionally, unexplained problems require replacing circuit boards or the equipment (e.g., communication boards, loop detector boards, or other ancillary boards).
8. Massachusetts reported that equipment is checked on an ongoing basis, performing testing throughout the year. The DOT emphasizes operational instructions to field staff on a continuous basis. Staff are required to wait after equipment is installed to ensure it is working before leaving the site, and to check if it is still working accurately before shutting it off and picking it up at the conclusion of the count.
Technology Improvements
1. Maryland uses two road-tube-based products from Progressive Engineering Technologies (i.e., PET Switch, RoadRamp) for traffic monitoring on high-volume roads. The PET Switch System uses an intelligent road tube that is configured to distinguish between lanes and allows the collection of speed, axle classification, and volume data simultaneously in up to four lanes. RoadRamp, a portable axle-sensing system with a separate axle sensor in each lane, guarantees more accurate lane classification and reliable traffic counts on busy, multi-lane sites.
2. VDOT has specified that all traffic-counting equipment include a visual display
component that enables the field personnel to check visually if the equipment is set-up, calibrated, and working correctly. VDOT also works closely with vendors to develop a tight classification table and requires vendors to use this table for their classification algorithms. Any vehicle that registers as an unclassifiable (Class 15) will be reported back to the center and reviewed. VDOT also works with the vendors (e.g., PEEK) to develop a tailgating logic especially for high-volume roads with close headways to better classify vehicles (e.g., determining whether four counted axles represent two cars or one truck). VDOT uses in-house software to cross check set-up parameters in counters to ensure that manufacturers correctly code in the required information.
3. NYSDOT has specifications describing the requirements for portable microprocessor-
based ATR to be furnished to NYSDOT, and other governmental units within New York State for use with loop-piezo-based sensors. Technical requirements include construction, materials, hardware, software, environment, vehicle detection, and operations.
One of the breakthroughs, which enhance vehicle detector output by utilizing inductive loop signatures, is now available in the Peek ADR-6000. The software enhancement techniques involve several algorithms designed for use in roadside vehicle detection equipment and which may apply to vehicle classification, toll applications, and incident detection. Recent tests by the TTI indicated that the Peek ADR-6000 was very accurate as a classifier, counter, and speed
HPMS AADT for High Volume Routes – Final Report 20 September 3, 2004
detection device and as a generator of simultaneous contact closure output. However, its recent introduction into the U.S. market and being adapted from a toll application are factors in its need for further refinement. The classification result for a dataset of 1,923 vehicles indicated only 21 errors and resulted in a classification accuracy of 99 percent (ignoring Class 2 and 3 discrepancies). This data sample occurred during a peak period and included some stop-and-go traffic. For count accuracy, the Peek in this same dataset only missed one vehicle (it accurately accounts for vehicles changing lanes) (Middleton and Parker, 2002). Additional Information on CD
NYSDOT, Highway Data Services Bureau, Loop/Piezo Automatic Traffic Recorder Specification, September 2001.
Virginia DOT, Lane Array and Road Tube Best Practice Guidelines, December 2002 FHWA, Traffic Detector Handbook- Chapter 6 Draft – Sensor Maintenance Florida Department of Transportation, Standardization of Count and Classification
equipment set-up and configuration process, prepared by PB Farradyne, 1995 New Jersey Department of Transportation , Traffic Monitoring Standards, January 2000 Ohio Department of Transportation, Service, Acceptance and Warranty Requirements
B2. Use of Non-Intrusive Equipment
Issues Addressed
Safety of field crew on high-volume routes Installation and maintenance costs Equipment damage – loops and sensors Congested and stop-and-go traffic conditions Construction and incidents
Description Non-intrusive sensors require less exposure of workers to traffic hazards and are sufficiently accurate for traffic volume monitoring applications except in very congested and stop and go conditions. The use of non-intrusive data collection equipment for traffic data collection has been investigated by various states primarily to realize two major advantages: relative ease of installation and improved safety of traffic personnel. Non-intrusive traffic detection technologies include infrared-, microwave-, laser-, acoustic-, and video-based sensors. Examples of Use by States While some of the states are experimenting and testing some types of non-intrusive equipment, other states are now beginning to review that option. The following sections summarize state practices and experiences with non-intrusive equipment.
HPMS AADT for High Volume Routes – Final Report 21 September 3, 2004
1. ODOT uses Electronic Integrated Systems (EIS) Remote Traffic Microwave Sensor RTMS (http://www.rtms-by-eis.com) units in five locations to collect traffic volume data. ODOT has also tested video (Autoscope) and acoustic sensors. ODOT observes that the main disadvantages are that set-up is difficult and that RTMS only reports two vehicle classifications: long vehicles (trucks) and all others.
2. VDOT is actively researching several non-intrusive technology devices. To date, only
the RTMS sidefire radar has been approved for use. It can be used as a portable detector and has the required accuracy. VDOT has reviewed other non-intrusive products but none has met their current needs.
3. Caltrans tested RTMS extensively but did not obtain favorable results, citing long set-up
times and occlusion problems. Caltrans recognizes that these technologies have improved since and has developed guidelines/requirements for non-intrusive detectors. The draft guidelines are intended to help California personnel to make an educated estimate of whether microwave sensors can fulfill their requirements. The document contains checklists of requirements that must be met, test results of various microwave models, technology descriptions, and installation overviews.
The Detector Evaluation and Testing Team (DETT) of the California Department of Transportation has recently tested two non-intrusive detectors, RTMS and Wavetronix SmartSensor. Results indicate that overall count accuracy was almost always within 95 percent of true counts and within 98 percent on some lanes. Speeds were also within 95 percent. One difference between the Wavetronix and the RTMS X3 detectors was the difficulty of setup and calibration. The Wavetronix only required 15 to 20 minutes total to set up, whereas the factory representative took about one hour per lane for the RTMS (Middleton et al., 2004).
4. ILDOT is a strong proponent of length-based classification and has worked with FHWA
to report length-based classification for HPMS. The use of length-based classifications encourages the use of non-intrusive detectors. Often the inability of such devices to classify vehicles into 13 vehicle categories is mentioned as a major impediment to their increased use. ILDOT tested various non-intrusive equipment including microwave and acoustic sensors.
5. NYSDOT tested 3M Microloops for bridge deck applications. NYSDOT also tested
SAS-1 acoustic sensors for their low-power requirements and low cost advantages. The main advantage stated by New York is the safety of traffic personnel.
The Traffic Monitoring Unit of the NYSDOT has successfully developed a permanent acoustic traffic monitoring site. This site was developed in-house to support non-intrusive sensor technology with applications in data collection and ITS activities. Further details are presented in Chapter 4 of this report. In addition to using the acoustic sensors as permanent stations, NYSDOT also has four mobile platforms equipped with the sensor for portable counts including coverage counts,
HPMS AADT for High Volume Routes – Final Report 22 September 3, 2004
special counts, and some ITS design applications. Each is used to collect volume data on high-speed, high-volume, multi-lane facilities where typical collection methods cannot be used due to safety concerns or equipment limitations.
6. New Jersey DOT (NJDOT) indicated the following non-intrusive equipment use and research:
A Peek-Vision pole-mounted video data collection was installed. Institutional
considerations required the mounting to be roadside rather than in the median. Pole height was limited by available service equipment. Communication was via land line rather than the fiber-optic network originally planned. Staff constraints precluded sufficient evaluation or implementation.
A 3M Microloop system was installed and operated satisfactorily. The Detector/ Recorder system could not be set to record data on the hour; it was always plus or minus several minutes although 60-minute intervals could be recorded. Initially, there seemed to be interference from nearby power lines. The manufacturer adjusted the system’s frequency to alleviate the problem. Staff constraints precluded follow-up with the manufacturer to rectify the recording time or further implementation.
Although RTMS sensors have been installed as part of ITS incident management
initiatives, NJDOT does not use count data from these sensors yet.
The New Jersey Highway Authority tested an acoustic detector. NJDOT was never advised of the results.
Sources of further information The Vehicle Detection Clearinghouse, a multi-state, pooled-fund project managed by the Southwest Technology Development Institute (SWTDI) at New Mexico State University (NMSU) and sponsored in cooperation with the U.S. DOT FHWA, is a valuable resource for o documentation about technology, evaluation and testing results, and details on use of technologies by states. On the Internet, the clearinghouse is located at www.nmsu.edu/~traffic. FHWA sponsored Field Test of Monitoring of Urban Vehicle Operations Using Non-Intrusive Technologies (FHWA-PL-97-018). The final report of the evaluation is available in html format at http://www.dot.state.mn.us/guidestar/nitfinal/about.htm Additional Information on CD
California Department of Transportation, Traffic Operations, Microwave Vehicle
Detection Systems (MVDS) Guidelines, DRAFT, 2003 U.S. DOT, Federal Highway Administration, A Summary of Vehicle Detection and
Surveillance Technologies used in Intelligent Transportation Systems, produced by the Vehicle Detector Clearinghouse (VDC) for FHWA ITS Joint Program Office, Fall 2000
Peter Martin et al, Detector Technology Evaluation, November 2003
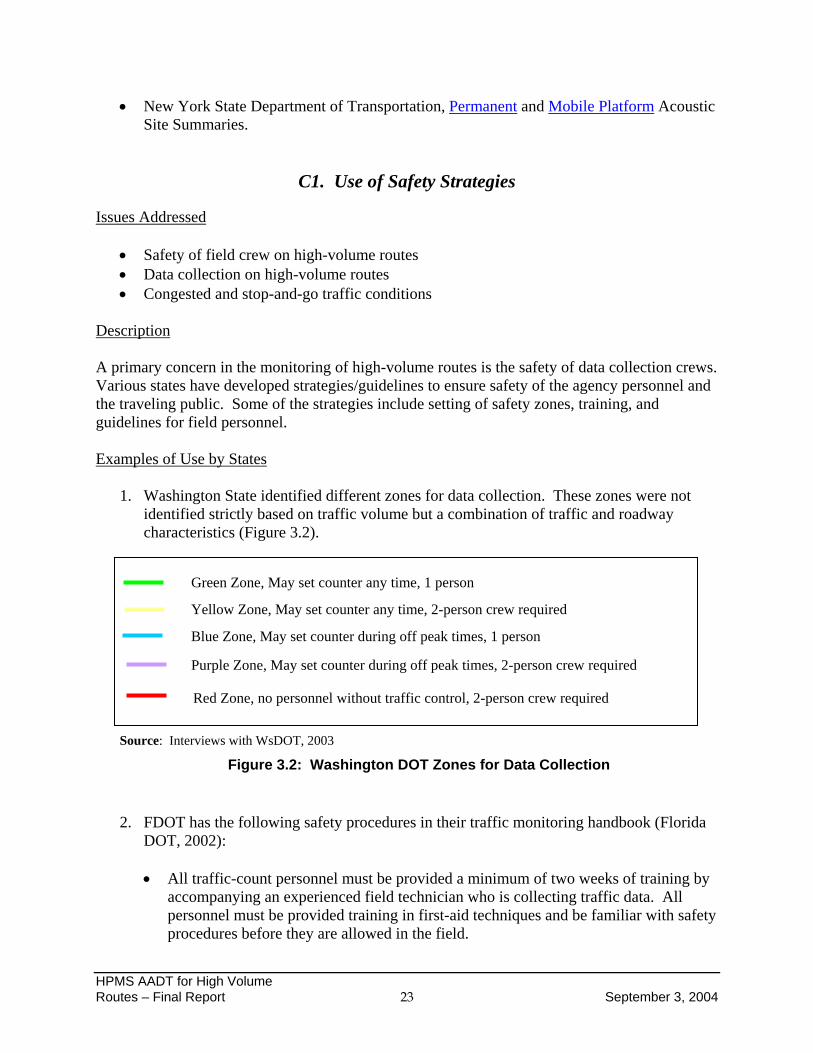
HPMS AADT for High Volume Routes – Final Report 23 September 3, 2004
New York State Department of Transportation, Permanent and Mobile Platform Acoustic Site Summaries.
C1. Use of Safety Strategies
Issues Addressed
Safety of field crew on high-volume routes Data collection on high-volume routes Congested and stop-and-go traffic conditions
Description A primary concern in the monitoring of high-volume routes is the safety of data collection crews. Various states have developed strategies/guidelines to ensure safety of the agency personnel and the traveling public. Some of the strategies include setting of safety zones, training, and guidelines for field personnel. Examples of Use by States
1. Washington State identified different zones for data collection. These zones were not identified strictly based on traffic volume but a combination of traffic and roadway characteristics (Figure 3.2).
Source: Interviews with WsDOT, 2003
Figure 3.2: Washington DOT Zones for Data Collection
2. FDOT has the following safety procedures in their traffic monitoring handbook (Florida DOT, 2002):
All traffic-count personnel must be provided a minimum of two weeks of training by
accompanying an experienced field technician who is collecting traffic data. All personnel must be provided training in first-aid techniques and be familiar with safety procedures before they are allowed in the field.
Green Zone, May set counter any time, 1 person
Blue Zone, May set counter during off peak times, 1 person
Red Zone, no personnel without traffic control, 2-person crew required
Purple Zone, May set counter during off peak times, 2-person crew required
Yellow Zone, May set counter any time, 2-person crew required
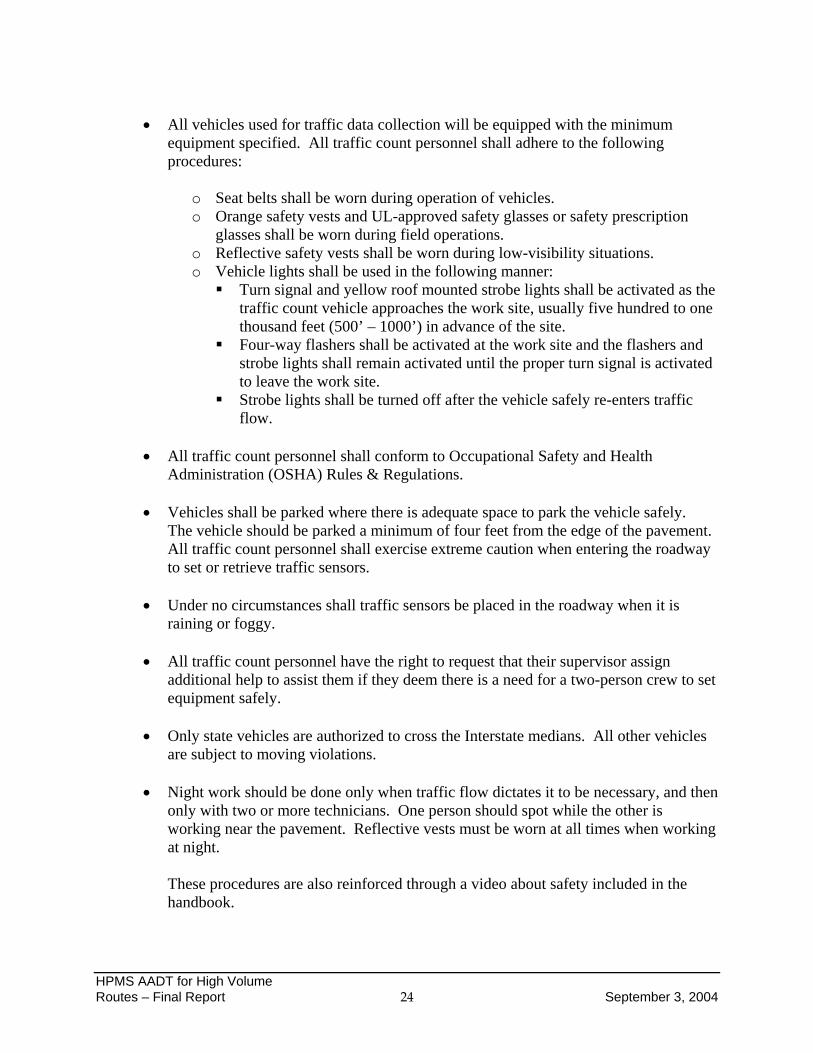
HPMS AADT for High Volume Routes – Final Report 24 September 3, 2004
All vehicles used for traffic data collection will be equipped with the minimum
equipment specified. All traffic count personnel shall adhere to the following procedures:
o Seat belts shall be worn during operation of vehicles. o Orange safety vests and UL-approved safety glasses or safety prescription
glasses shall be worn during field operations. o Reflective safety vests shall be worn during low-visibility situations. o Vehicle lights shall be used in the following manner: Turn signal and yellow roof mounted strobe lights shall be activated as the
traffic count vehicle approaches the work site, usually five hundred to one thousand feet (500’ – 1000’) in advance of the site.
Four-way flashers shall be activated at the work site and the flashers and strobe lights shall remain activated until the proper turn signal is activated to leave the work site.
Strobe lights shall be turned off after the vehicle safely re-enters traffic flow.
All traffic count personnel shall conform to Occupational Safety and Health
Administration (OSHA) Rules & Regulations. Vehicles shall be parked where there is adequate space to park the vehicle safely.
The vehicle should be parked a minimum of four feet from the edge of the pavement. All traffic count personnel shall exercise extreme caution when entering the roadway to set or retrieve traffic sensors.
Under no circumstances shall traffic sensors be placed in the roadway when it is
raining or foggy. All traffic count personnel have the right to request that their supervisor assign
additional help to assist them if they deem there is a need for a two-person crew to set equipment safely.
Only state vehicles are authorized to cross the Interstate medians. All other vehicles
are subject to moving violations. Night work should be done only when traffic flow dictates it to be necessary, and then
only with two or more technicians. One person should spot while the other is working near the pavement. Reflective vests must be worn at all times when working at night.
These procedures are also reinforced through a video about safety included in the handbook.
HPMS AADT for High Volume Routes – Final Report 25 September 3, 2004
3. New Jersey emphasizes installation safety on high-volume roads. The necessity of obtaining vehicle-type classification data by visual/manual methods rather than automatic vehicle classification (AVC) technology also requires special emphasis on safety for high-volume roads. Special consideration is usually given to volumes over 15,000 per lane per day. Typically classification using AVCs is not undertaken where more than one lane cannot be monitored by one machine. Also, if the state or the contractor determines that lane closures are needed to safely install and remove traffic monitoring sensors, the contractor is required to submit a “request for police assistance” to the appropriate state police coordinator and procure the services of a New Jersey DOT-approved Maintenance and Protection of Traffic contractor.
4. According to ILDOT, data collection staff cannot safely install data collection equipment
on high-volume roads (AADT greater than 70,000). Road segments with traffic volumes greater than 100,000 AADT are in the Chicago area. In these areas traffic data are collected with loops and at toll way facilities by the toll way authorities and Chicago Area Transportation Study (CATS). When it is determined that a road carries sufficiently high traffic volume to preclude the safe installation of data collection equipment, manual count is used. However, manual counts are not a recommended practice because it noted to be expensive and could potentially suffer from accuracy and reliability problems. Similarly, Texas and New Jersey also perform manual classification counts where it is not possible to install traffic data collection equipment either because of safety considerations or because of equipment limitations.
5. Massachusetts employs safety procedures to protect DOT staff and the general public.
Installation of inductive loops on high-volume routes are coordinated with pavement construction and maintenance programs.
Additional Information on CD
Washington Department of Transportation, Safety Zones for Traffic Monitoring, Regions: Eastern, North Central, North Western, South Central, South Western, Olympia
Florida Department of Transportation, Transportation Statistics Office, Traffic Monitoring Handbook, October 2002.
Florida Department of Transportation, Safety Video for Field Personnel, included in Traffic Monitoring Handbook, October 2002.
C2. Ramp Balancing
Issues Addressed
Safety of field crew on high-volume routes Data collection on high-volume routes Congested and stop-and-go traffic conditions
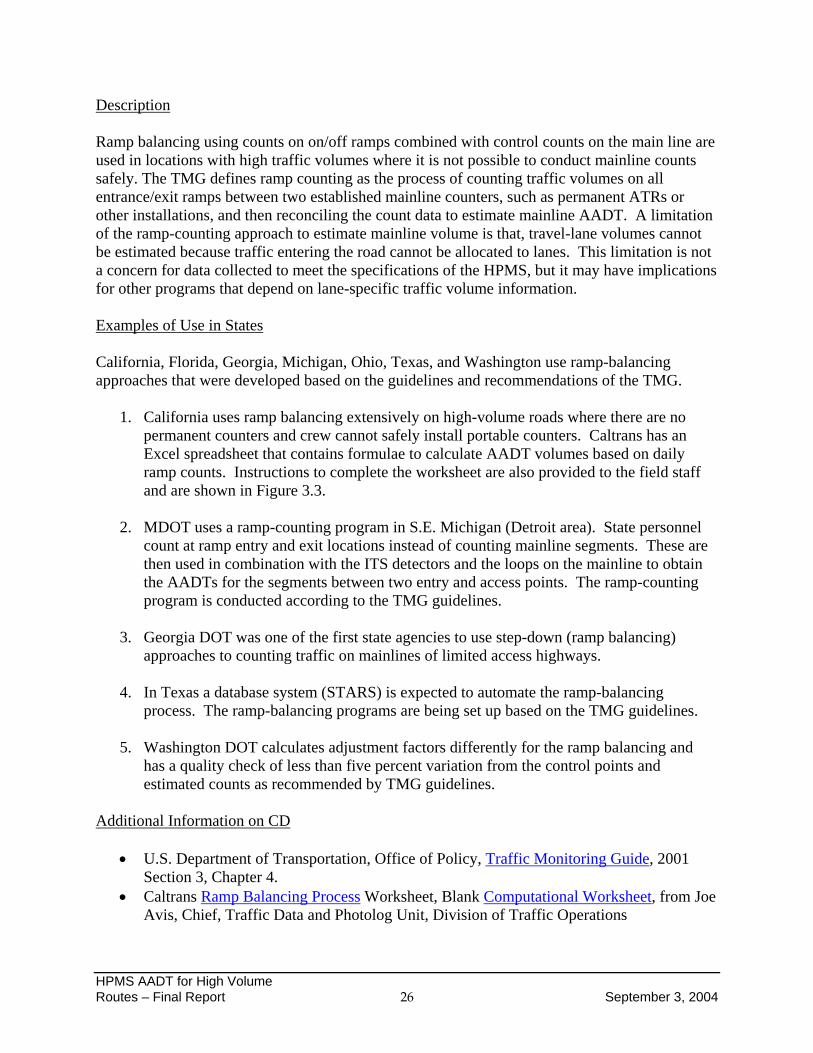
HPMS AADT for High Volume Routes – Final Report 26 September 3, 2004
Description Ramp balancing using counts on on/off ramps combined with control counts on the main line are used in locations with high traffic volumes where it is not possible to conduct mainline counts safely. The TMG defines ramp counting as the process of counting traffic volumes on all entrance/exit ramps between two established mainline counters, such as permanent ATRs or other installations, and then reconciling the count data to estimate mainline AADT. A limitation of the ramp-counting approach to estimate mainline volume is that, travel-lane volumes cannot be estimated because traffic entering the road cannot be allocated to lanes. This limitation is not a concern for data collected to meet the specifications of the HPMS, but it may have implications for other programs that depend on lane-specific traffic volume information.
Examples of Use in States California, Florida, Georgia, Michigan, Ohio, Texas, and Washington use ramp-balancing approaches that were developed based on the guidelines and recommendations of the TMG.
1. California uses ramp balancing extensively on high-volume roads where there are no permanent counters and crew cannot safely install portable counters. Caltrans has an Excel spreadsheet that contains formulae to calculate AADT volumes based on daily ramp counts. Instructions to complete the worksheet are also provided to the field staff and are shown in Figure 3.3.
2. MDOT uses a ramp-counting program in S.E. Michigan (Detroit area). State personnel
count at ramp entry and exit locations instead of counting mainline segments. These are then used in combination with the ITS detectors and the loops on the mainline to obtain the AADTs for the segments between two entry and access points. The ramp-counting program is conducted according to the TMG guidelines.
3. Georgia DOT was one of the first state agencies to use step-down (ramp balancing)
approaches to counting traffic on mainlines of limited access highways.
4. In Texas a database system (STARS) is expected to automate the ramp-balancing process. The ramp-balancing programs are being set up based on the TMG guidelines.
5. Washington DOT calculates adjustment factors differently for the ramp balancing and
has a quality check of less than five percent variation from the control points and estimated counts as recommended by TMG guidelines.
Additional Information on CD
U.S. Department of Transportation, Office of Policy, Traffic Monitoring Guide, 2001 Section 3, Chapter 4.
Caltrans Ramp Balancing Process Worksheet, Blank Computational Worksheet, from Joe Avis, Chief, Traffic Data and Photolog Unit, Division of Traffic Operations
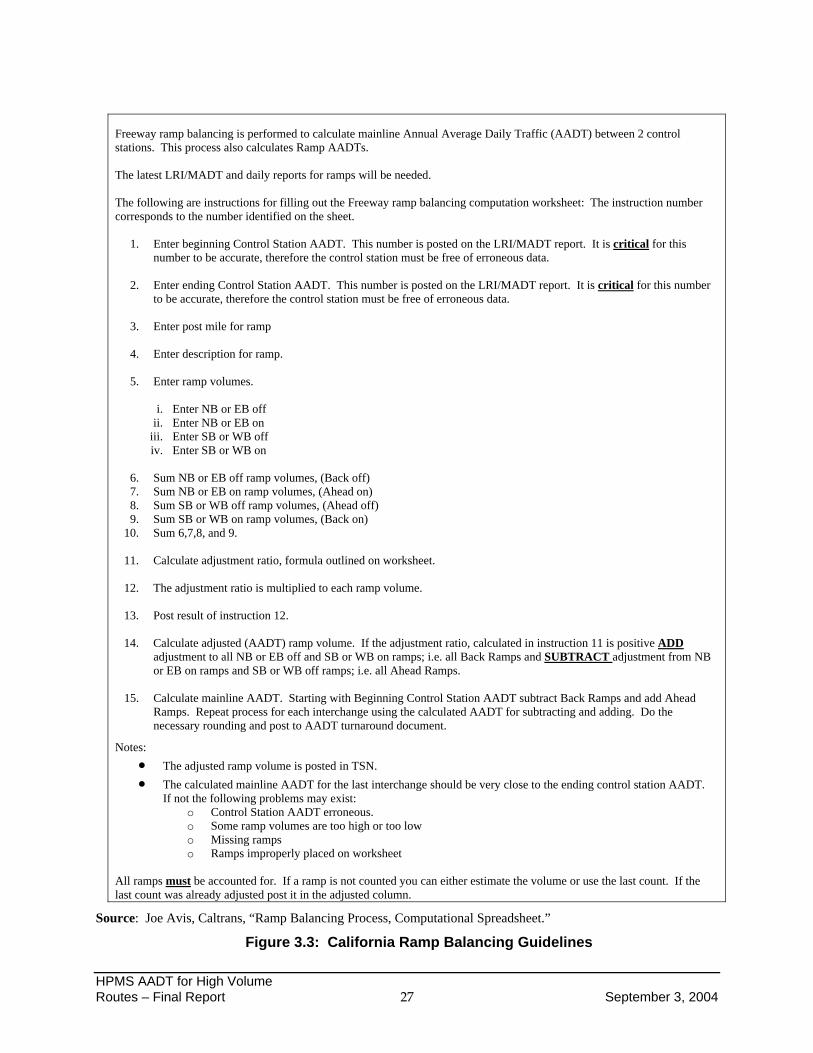
HPMS AADT for High Volume Routes – Final Report 27 September 3, 2004
Freeway ramp balancing is performed to calculate mainline Annual Average Daily Traffic (AADT) between 2 control stations. This process also calculates Ramp AADTs. The latest LRI/MADT and daily reports for ramps will be needed. The following are instructions for filling out the Freeway ramp balancing computation worksheet: The instruction number corresponds to the number identified on the sheet.
1. Enter beginning Control Station AADT. This number is posted on the LRI/MADT report. It is critical for this number to be accurate, therefore the control station must be free of erroneous data.
2. Enter ending Control Station AADT. This number is posted on the LRI/MADT report. It is critical for this number
to be accurate, therefore the control station must be free of erroneous data.
3. Enter post mile for ramp
4. Enter description for ramp.
5. Enter ramp volumes.
i. Enter NB or EB off ii. Enter NB or EB on
iii. Enter SB or WB off iv. Enter SB or WB on
6. Sum NB or EB off ramp volumes, (Back off) 7. Sum NB or EB on ramp volumes, (Ahead on) 8. Sum SB or WB off ramp volumes, (Ahead off) 9. Sum SB or WB on ramp volumes, (Back on)
10. Sum 6,7,8, and 9.
11. Calculate adjustment ratio, formula outlined on worksheet.
12. The adjustment ratio is multiplied to each ramp volume.
13. Post result of instruction 12.
14. Calculate adjusted (AADT) ramp volume. If the adjustment ratio, calculated in instruction 11 is positive ADD adjustment to all NB or EB off and SB or WB on ramps; i.e. all Back Ramps and SUBTRACT adjustment from NB or EB on ramps and SB or WB off ramps; i.e. all Ahead Ramps.
15. Calculate mainline AADT. Starting with Beginning Control Station AADT subtract Back Ramps and add Ahead
Ramps. Repeat process for each interchange using the calculated AADT for subtracting and adding. Do the necessary rounding and post to AADT turnaround document.
Notes:
The adjusted ramp volume is posted in TSN.
The calculated mainline AADT for the last interchange should be very close to the ending control station AADT. If not the following problems may exist:
o Control Station AADT erroneous. o Some ramp volumes are too high or too low o Missing ramps o Ramps improperly placed on worksheet
All ramps must be accounted for. If a ramp is not counted you can either estimate the volume or use the last count. If the last count was already adjusted post it in the adjusted column.
Source: Joe Avis, Caltrans, “Ramp Balancing Process, Computational Spreadsheet.”
Figure 3.3: California Ramp Balancing Guidelines
HPMS AADT for High Volume Routes – Final Report 28 September 3, 2004
C3. Use of Innovative Contracting Practices
Issues Addressed
Improved data quality Institutional issues (e.g., lack of funding and availability of personnel) Lack of interagency cooperation and data sharing
Description A noticeable trend in traffic monitoring is contracting data collection activities to private contractors or other agencies. Under such arrangements, private contractors are responsible for data collection activities, with the DOT playing a supervisory role. Performance criteria is increasingly becoming popular with state DOTs as a means of ensuring data quality from the contractors.
There also has been an increased interest in using county and local personnel in traffic-counting programs by providing county and local agencies equipment and training to collect and report data to the state DOTs. Examples of Use in States Maintenance and Performance Contracts
1. Maryland State Highway Administration (MDSHA) contracts traffic data collection. SHA provides the specifications and data collection templates for the contractors on their websites.
2. VDOT’s Mobility Management Section (traditional data collection) leases its traffic
counters and modems from Digital Traffic Systems (DTS). However, VDOT owns the sensors such as inductive loops and piezoelectric sensors. Since 1996, VDOT has contracted the data collection activity and leased data collection equipment. The current maintenance agreement with DTS is carefully written to assign responsibilities and minimize “finger pointing.” There are cases where difficulties might otherwise arise, such as with traffic counters that did not work due to faulty piezoelectric sensors. A state inspector checks the equipment once a year, but if there are substantial errors in the data, the contractor has to re-collect the data (Fekpe et al. 2003).
VDOT has established performance-based lease criteria for payment of data collection services. Contractor compensation is based on the amount of acceptable data being submitted by the contractor. Furthermore, VDOT requires a certain quantity of acceptable data from each site to be able to use that site for traffic factor creation. The list below summarizes some key elements of the agreement:3
3 Interview with Tom Schinkel, Virginia Department of Transportation for FHWA’s Traffic Data Quality Workshop project, October 1, 2002.
HPMS AADT for High Volume Routes – Final Report 29 September 3, 2004
There will be full payment for all Automatic Traffic Recorders (ATRs) and modems at sites with 25 or more days of useable classification and volume data (for factor creation) during a calendar month.
There will be 75 percent payment for 15 or more days and lesser payment for fewer days of acceptable data except that monthly payment will not be made for sites that have fewer than 15 days of volume data only available during a calendar month.
For service calls for maintenance purposes, the contractor will not be reimbursed a separate charge (pay item) for the service calls related to ATR/modem equipment problems, telephone line problems, or failed sensors, as costs associated with the service calls are included in the price of the monthly lease charge.
The contractor is given seven calendar days to investigate, make site visits, make repairs and respond back to VDOT after notification/receipt of a service call.
3. ODOT’s Office of Technical Services, Traffic Monitoring Section, is considering the use
of task-order maintenance contracts. In the past, ODOT has used small personnel service contracts to maintain pavement sensors. Now, ODOT is in the process of executing a task-order-type contract for maintenance to have contractors on board for anticipated and unanticipated maintenance requirements of the traditional data collection equipment statewide. The contract is expected to begin in the near future and will cover a time period of two years. ODOT is issuing a task-order-type maintenance contract to repair equipment including loops, piezo-sensors, and WIM sites. Other states also have expressed interest in task-order-based maintenance contracts including Texas, Florida, and Maryland (Fekpe et al. 2003).
4. NYSDOT expressed satisfaction with the performance-based maintenance contracts that
are used in the state. NYSDOT uses three contractors for the state of New York whose contracts are renewed annually. Tasks include performing regular maintenance of equipment, on-call duties, and installation of new sites. The scope of work includes on-time requirements, turnaround times, and site inspection / preventive maintenance and repair visits consisting of4:
Repair of sensor epoxy Repair of sensor lead-in epoxy Battery condition check Power system condition check Communication system condition and operation check Surge protection equipment condition check Clean cabinet and solar panel Repair conduit-sealing material Manual traffic count to verify ATR performance and data collection accuracy in
all lanes
4 NYSDOT, Zone 3 Contractor Specifications, June 2003.
HPMS AADT for High Volume Routes – Final Report 30 September 3, 2004
Use of Counties to Collect Data (Resource Sharing)
1. California is considering partnering with MPOs for data collection activities. The partnership would entail MPOs conducting traffic counts with their contractors and providing the data to Caltrans.
2. NYSDOT has a formal practice to obtain data from counties. Counties are loaned
equipment by NYSDOT and required to provide 10 counts per counter to the state DOT annually as part of the program. Joining the program is voluntary for the counties. NYSDOT provides training to county personnel in the use of traffic counters, and the reporting and processing systems. The county personnel are also invited to the regional traffic monitoring workshops organized by NYSDOT. It was also noted the Pennsylvania also has used county agencies extensively for data collection. Similarly, the Delaware Valley Regional Planning Commission, the MPO for the Philadelphia region, collects traffic data in four New Jersey counties for NJDOT.
Additional Information on CD
Maryland State Highway Administration, Specification for Consulting Services for the collection of Manual Traffic and Portable Machine Counts and On-Site Traffic Engineering and Highway Engineering Assistance, 09/2004.
New York State Department of Transportation, Highway Data Services Bureau, Zone 3 contractor specifications, June 15 2003.
C4. Use of ITS Data for Traffic Data Monitoring
Issues Addressed
Safety of field crew on high-volume routes Limited coverage of traffic monitoring program Congested and stop-and-go traffic conditions Construction and incidents
Description The use of ITS data for traffic operation applications has the advantages of non-intrusion, continuous counts, and wider coverage. It also minimizes safety concerns associated with data collection on high-volume routes. Traffic data from ITS sources is of great interest to traffic monitoring programs and HPMS in particular. As stated earlier, the bulk of HPMS volume data is from short counts of 24 to 48 hours in duration. ITS sensors, while still not capable of serving as permanent counters, can efficiently provide at least a day’s or two worth of data.
HPMS AADT for High Volume Routes – Final Report 31 September 3, 2004
Examples of Use in States FHWA conducted a survey to assess the use of ITS detectors for HPMS data reporting (Gillmann, 2002). Some of the findings from the 43 respondents were:
In all, 70 percent of the States have ITS traffic detectors available and almost one-half of these States are currently using some of them for HPMS reporting purposes.
One-third of these States are using some ITS traffic detectors to supply HPMS traffic data. Several noted that the number of ITS detectors available was currently limited but was expected to increase in the future.
Other answers were that the data quality was poor or that it is still under consideration. Thirty percent of these States currently have no ITS traffic detectors. Several said they were willing to use them or expected to have them in the future.
On the question of whether ITS data can be used for AADT reporting, most states responded with a “qualified” yes except New Jersey, which said no. The three main concerns with the use of ITS-generated data are (i) validation of data, (ii) requirements of 24-hour continuous hourly data on all lanes, and (iii) vehicle classification data. Some of the major initiatives and successes with the use ITS data by state DOTs are described below:
1. Caltrans is in the process of developing sensor-sharing technology to use the existing infrastructure of loops, cabinets and power supplies to collect planning data. Caltrans developed a “detector isolation assembly (DIA)” device that could provide total isolation between the traffic recording and the traffic control functions. The DIA device is housed in the same cabinet as the traffic controller and senses the electronic switch closure produced by the detector and passes the signal to the traffic recorder. This technology offers great potential for using existing infrastructure to obtain planning data and is of immediate use at high-volume locations with traffic controllers and ITS detectors (Triplett & Avis, 2002). California does not use ITS data yet for HPMS reporting. However, the state DOT counting program has about 219 locations where detector infrastructure on signals and ramps are shared. Ohio DOT, working on the same principle of detector sharing, uses loops currently not used for operational analysis by the ITS groups for its traffic data collection.
2. Caltrans has a Performance Measurement System (PeMS) for the inductive loops in
California. PeMS obtains 30-second loop detector data in real time from each Caltrans District Transportation Management Center (TMC). The data are transferred through the Caltrans wide area network (WAN) to which all districts are connected. Users can access PeMS over the Internet through a Web browser. The PeMS software architecture is modular and open. It uses commercial-off-the-shelf products for communication and computation. Caltrans is working with the PeMS project team to enable transfer/sharing of data between the PeMS databases and the state highway counting program. The PeMS project team will aim to provide loop detector data aggregated at one-hour intervals in TMG format. The use of PeMS data will provide the state highway traffic-counting
HPMS AADT for High Volume Routes – Final Report 32 September 3, 2004
program with a wealth of detectors that can function either as permanent detectors or control points. Data sharing and use of PeMS data are currently being considered, and it is expected that the full potential of PeMS to state highway traffic monitoring will be realized in a few years.
3. ODOT uses ITS data from ARTIMIS that provides the data in TMG format to ODOT.
ODOT also gets information from certain unused loops installed by Columbus TMC by obtaining loop outputs for a period of time using a contact closure card. ODOT installed 44 new Roadway Weather Information Systems (RWIS) that will collect traffic data in TMG format and provide real-time weather information.
4. ITS data from Detroit freeways are extensively used for AADT reporting in Michigan.
Michigan ITS (MITS) is responsible for collecting and summarizing traffic data into hourly intervals. The data are provided to MDOT once a month. MITS is responsible for the quality checks on the raw data. This is a relationship that has grown and been in place for the past 12 years. The ITS data also provide more control points to the ramp counting program.
5. FDOT has conducted research to utilize archived ITS data for HPMS and transportation
planning purposes. The project is completed in District 5 (I-4 in the Orlando area). FDOT has developed a software system to mine ITS data from the I-4 region in Orlando. The software is used to convert the data obtained from TMC to a format usable by the quality control software (Survey Processing Software). The plan is to expand it to other TMCs. Coordination between various agencies is essential for this to succeed. FDOT indicated that as a first step, data from ITS sources have to be available in an archive. There should be an emphasis to collect data from all lanes of traffic. Metadata, including the use of active/inactive/malfunctioning tags, sample sizes, and editing procedures used, are very helpful in making ITS data more useful to planning and traditional traffic monitoring groups.
6. Illinois uses data from toll way authorities and CATS in the Chicago area collected using
a combination of loops, toll plazas etc to collect data on these high-volume roads. IDOT would like to have 365 days of hourly data from ITS data which would be beneficial. This then can be then used for k-factor calculation. This would require current ITS sensors to aggregate and store large amounts of data
7. TxDOT is exploring the use of ITS data from their loops in Houston (TranStar) and
Dallas. Various options, formats, and institutional arrangements are being considered. TxDOT does not want data from all detectors from the ITS groups but strategic locations would be very valuable.
8. WSDOT uses ITS data in the Northwest (Seattle) region and plans to use data from new detectors for a TMC in Spokane.

HPMS AADT for High Volume Routes – Final Report 33 September 3, 2004
9. VDOT does not currently use ITS data sources but are progressing toward use for HPMS reporting. The ITS TMCs are beginning to report the data to a central archive (Smartravel Lab) and ongoing research is directed at using the data for various purposes.
Sources of further information:
Triplett, R. and Avis, J. Sensor Sharing Among Applications. 2002 NATMEC, Orlando, Florida. Available from NATMEC 2002 Proceedings CD
Additional Information on CD
Gillmann, R., Status of ITS Data for HPMS, Memo for FHWA, 2002 Choe, T., Skabordonis, A., Variya, P., Freeway Performance Measurement System
(PeMS): An operational analysis tool, for presentation and publication in the 81st TRB Annual Meeting, 2002
D1. Data Processing and Quality Control Procedures
Issues Addressed
Raw data analysis and AADT estimation Assumptions and business rules Data quality control and assurance issues
Description Data processing to assess accuracy, completeness, and validity of traffic data from continuous count stations is carried out using either in-house software packages or legacy mainframe programs. Typically, a software package is used to flag potentially erroneous data for further review. Similarly, data from short-term counts are processed with in-house software packages or one supplied with the equipment. Data validity and completeness are checked using a combination of business rules and criteria. Examples of Use by States
Processing Software Validity Rules
1. All states interviewed use software to flag potentially erroneous data for further review by DOT personnel who have extensive local knowledge and experience. Most of the states DOTs interviewed do not use data processing software to process short-term count data except in cases where vendor-provided software is used to download data from the device. Some states have in-house software packages to process short-count data (e.g., Florida uses a software product called “Survey Processing Software”; Washington State uses an in-house program; New Jersey uses TRADAS, a commercially available system and legacy mainframe software that was developed in-house).
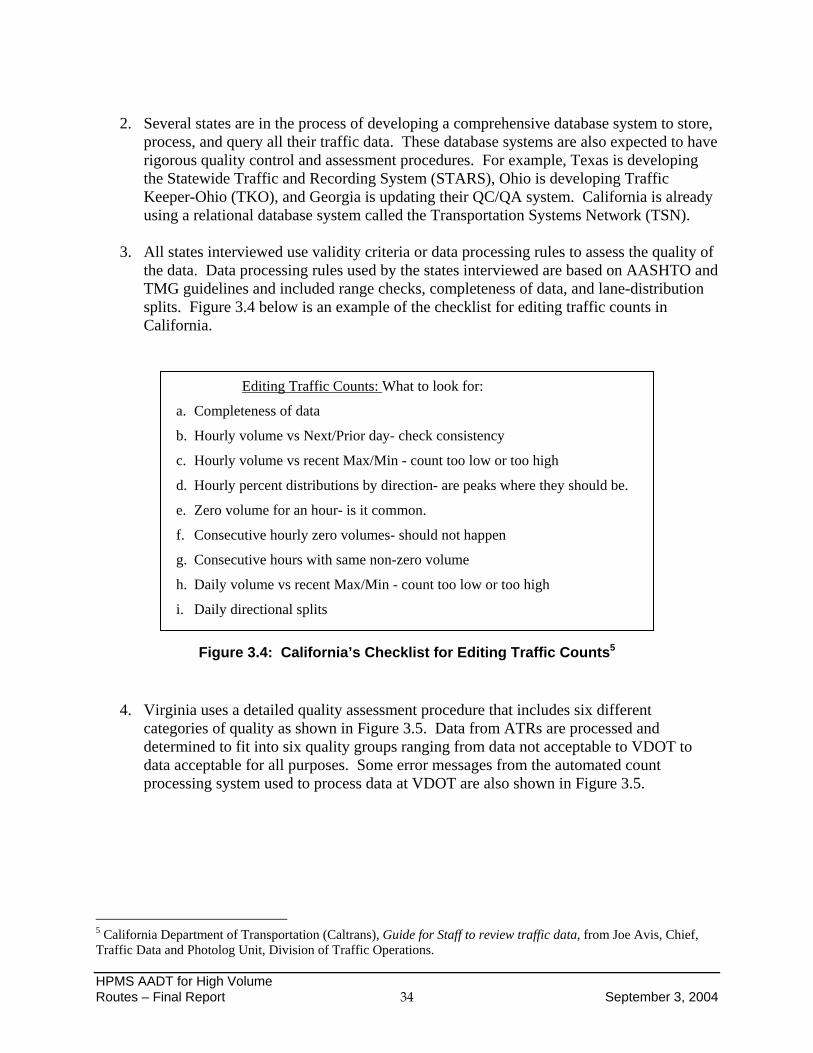
HPMS AADT for High Volume Routes – Final Report 34 September 3, 2004
Editing Traffic Counts: What to look for:
a. Completeness of data
b. Hourly volume vs Next/Prior day- check consistency
c. Hourly volume vs recent Max/Min - count too low or too high
d. Hourly percent distributions by direction- are peaks where they should be.
e. Zero volume for an hour- is it common.
f. Consecutive hourly zero volumes- should not happen
g. Consecutive hours with same non-zero volume
h. Daily volume vs recent Max/Min - count too low or too high
i. Daily directional splits
2. Several states are in the process of developing a comprehensive database system to store,
process, and query all their traffic data. These database systems are also expected to have rigorous quality control and assessment procedures. For example, Texas is developing the Statewide Traffic and Recording System (STARS), Ohio is developing Traffic Keeper-Ohio (TKO), and Georgia is updating their QC/QA system. California is already using a relational database system called the Transportation Systems Network (TSN).
3. All states interviewed use validity criteria or data processing rules to assess the quality of
the data. Data processing rules used by the states interviewed are based on AASHTO and TMG guidelines and included range checks, completeness of data, and lane-distribution splits. Figure 3.4 below is an example of the checklist for editing traffic counts in California.
Figure 3.4: California’s Checklist for Editing Traffic Counts5
4. Virginia uses a detailed quality assessment procedure that includes six different categories of quality as shown in Figure 3.5. Data from ATRs are processed and determined to fit into six quality groups ranging from data not acceptable to VDOT to data acceptable for all purposes. Some error messages from the automated count processing system used to process data at VDOT are also shown in Figure 3.5.
5 California Department of Transportation (Caltrans), Guide for Staff to review traffic data, from Joe Avis, Chief, Traffic Data and Photolog Unit, Division of Traffic Operations.
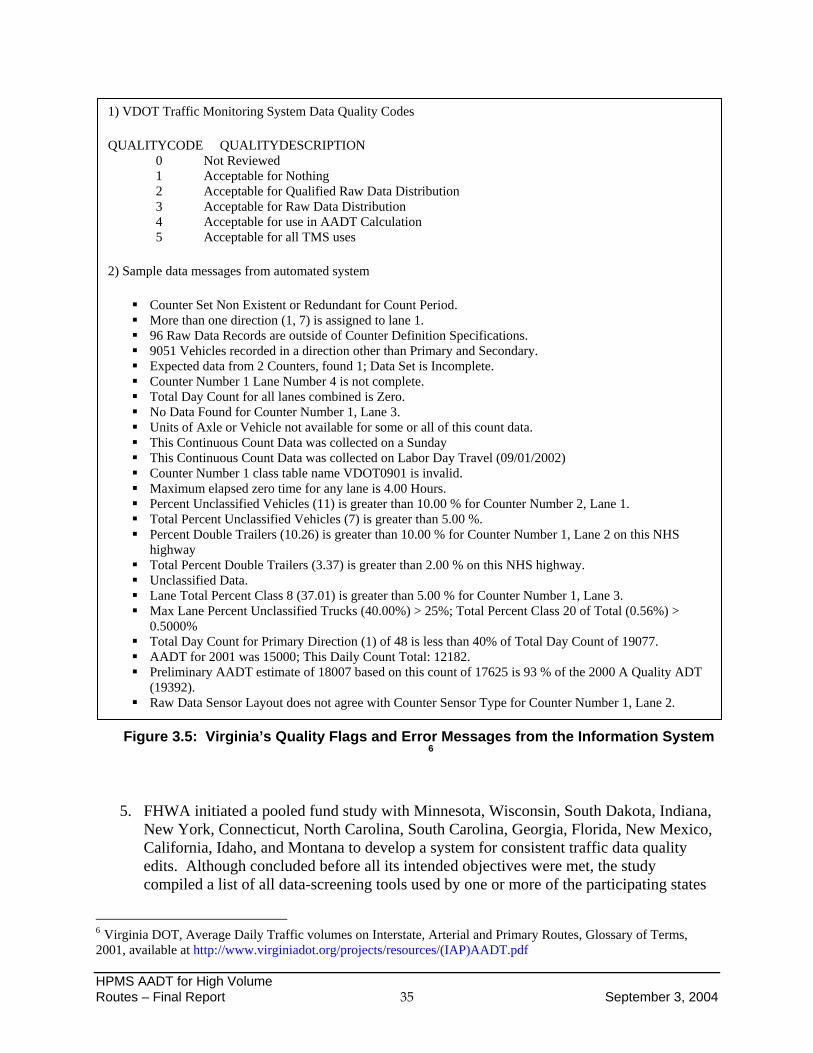
HPMS AADT for High Volume Routes – Final Report 35 September 3, 2004
Figure 3.5: Virginia’s Quality Flags and Error Messages from the Information System 6
5. FHWA initiated a pooled fund study with Minnesota, Wisconsin, South Dakota, Indiana, New York, Connecticut, North Carolina, South Carolina, Georgia, Florida, New Mexico, California, Idaho, and Montana to develop a system for consistent traffic data quality edits. Although concluded before all its intended objectives were met, the study compiled a list of all data-screening tools used by one or more of the participating states
6 Virginia DOT, Average Daily Traffic volumes on Interstate, Arterial and Primary Routes, Glossary of Terms, 2001, available at http://www.virginiadot.org/projects/resources/(IAP)AADT.pdf
1) VDOT Traffic Monitoring System Data Quality Codes
QUALITYCODE QUALITYDESCRIPTION 0 Not Reviewed 1 Acceptable for Nothing 2 Acceptable for Qualified Raw Data Distribution 3 Acceptable for Raw Data Distribution 4 Acceptable for use in AADT Calculation 5 Acceptable for all TMS uses
2) Sample data messages from automated system
Counter Set Non Existent or Redundant for Count Period. More than one direction (1, 7) is assigned to lane 1. 96 Raw Data Records are outside of Counter Definition Specifications. 9051 Vehicles recorded in a direction other than Primary and Secondary. Expected data from 2 Counters, found 1; Data Set is Incomplete. Counter Number 1 Lane Number 4 is not complete. Total Day Count for all lanes combined is Zero. No Data Found for Counter Number 1, Lane 3. Units of Axle or Vehicle not available for some or all of this count data. This Continuous Count Data was collected on a Sunday This Continuous Count Data was collected on Labor Day Travel (09/01/2002) Counter Number 1 class table name VDOT0901 is invalid. Maximum elapsed zero time for any lane is 4.00 Hours. Percent Unclassified Vehicles (11) is greater than 10.00 % for Counter Number 2, Lane 1. Total Percent Unclassified Vehicles (7) is greater than 5.00 %. Percent Double Trailers (10.26) is greater than 10.00 % for Counter Number 1, Lane 2 on this NHS
highway Total Percent Double Trailers (3.37) is greater than 2.00 % on this NHS highway. Unclassified Data. Lane Total Percent Class 8 (37.01) is greater than 5.00 % for Counter Number 1, Lane 3. Max Lane Percent Unclassified Trucks (40.00%) > 25%; Total Percent Class 20 of Total (0.56%) >
0.5000% Total Day Count for Primary Direction (1) of 48 is less than 40% of Total Day Count of 19077. AADT for 2001 was 15000; This Daily Count Total: 12182. Preliminary AADT estimate of 18007 based on this count of 17625 is 93 % of the 2000 A Quality ADT
(19392). Raw Data Sensor Layout does not agree with Counter Sensor Type for Counter Number 1, Lane 2.
HPMS AADT for High Volume Routes – Final Report 36 September 3, 2004
as they are applied to short or continuous volume, vehicle classification, and/or WIM data for the selected data products. The report included a set of logically consistent, state-of-the-practice rules for traffic-data screening derived from five, multiple-day knowledge-engineering sessions attended by more than 60 traffic-data screening experts. The report also included traffic-data screening algorithms, definitions, and pseudo-code statements to support the development of rule-based testing software (MnDOT, 1997).
Sources of further information
Triplett, R. and Avis, J. Sensor Sharing Among Applications. NATMEC, Orlando, Florida, 2002. Available from NATMEC Proceedings CD
Additional Information on CD
Fekpe et al., Traffic Data Quality Workshop and Action Plan, Report to FHWA, 2003 Ohio Department of Transportation, Traffic Keeper-Ohio (TKO) Traffic Edit Guidelines,
Service, Acceptance and Warranty Requirements New York State Department of Transportation, Highway Data Services Bureau, Traffic
Count Editor: User Manual and System Documentation, February 2003 Florida Department of Transportation, Survey Processing Software (SPS) User Manual,
June 2001.
D2. Adjustment Factors and Growth Factors Calculation
Issues Addressed
Raw data analysis and AADT estimation Assumptions and business rules Data quality control and assurance issues
Description Adjustment factors are used to convert short-term volume counts to AADT. These factors include seasonal factors which account for daily, monthly, weekly variations in data; axle correction factors use when axles instead of vehicles are counted; and growth factors when counts are not available. Most states interviewed indicated that estimating these adjustment factors are based on the recommendations of the TMG. Some states have detailed documentation of the methods used to calculate these factors. It was observed what while adjustment factors were calculated based on factor groups, these groups were mostly determined by functional classifications rather than by traffic volumes. There is no difference in the procedures for calculating the adjustment factors based on traffic volumes.
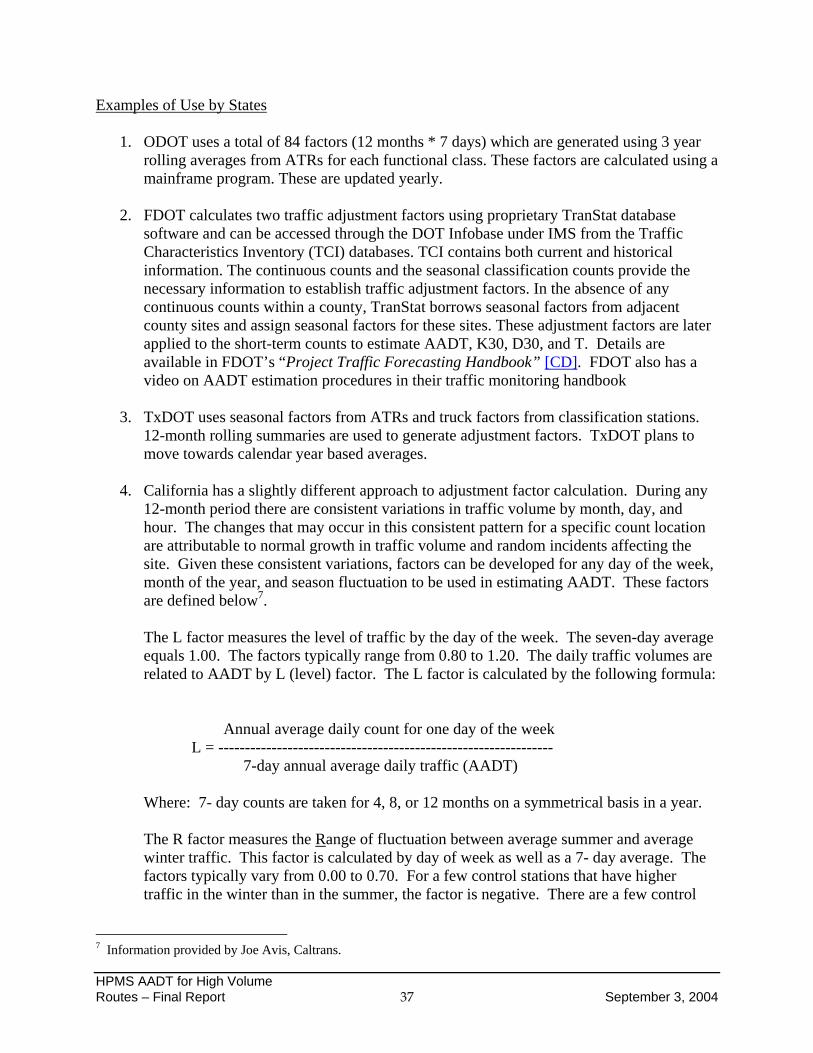
HPMS AADT for High Volume Routes – Final Report 37 September 3, 2004
Examples of Use by States
1. ODOT uses a total of 84 factors (12 months * 7 days) which are generated using 3 year rolling averages from ATRs for each functional class. These factors are calculated using a mainframe program. These are updated yearly.
2. FDOT calculates two traffic adjustment factors using proprietary TranStat database
software and can be accessed through the DOT Infobase under IMS from the Traffic Characteristics Inventory (TCI) databases. TCI contains both current and historical information. The continuous counts and the seasonal classification counts provide the necessary information to establish traffic adjustment factors. In the absence of any continuous counts within a county, TranStat borrows seasonal factors from adjacent county sites and assign seasonal factors for these sites. These adjustment factors are later applied to the short-term counts to estimate AADT, K30, D30, and T. Details are available in FDOT’s “Project Traffic Forecasting Handbook” [CD]. FDOT also has a video on AADT estimation procedures in their traffic monitoring handbook
3. TxDOT uses seasonal factors from ATRs and truck factors from classification stations.
12-month rolling summaries are used to generate adjustment factors. TxDOT plans to move towards calendar year based averages.
4. California has a slightly different approach to adjustment factor calculation. During any
12-month period there are consistent variations in traffic volume by month, day, and hour. The changes that may occur in this consistent pattern for a specific count location are attributable to normal growth in traffic volume and random incidents affecting the site. Given these consistent variations, factors can be developed for any day of the week, month of the year, and season fluctuation to be used in estimating AADT. These factors are defined below7.
The L factor measures the level of traffic by the day of the week. The seven-day average equals 1.00. The factors typically range from 0.80 to 1.20. The daily traffic volumes are related to AADT by L (level) factor. The L factor is calculated by the following formula: Annual average daily count for one day of the week L = --------------------------------------------------------------- 7-day annual average daily traffic (AADT) Where: 7- day counts are taken for 4, 8, or 12 months on a symmetrical basis in a year. The R factor measures the Range of fluctuation between average summer and average winter traffic. This factor is calculated by day of week as well as a 7- day average. The factors typically vary from 0.00 to 0.70. For a few control stations that have higher traffic in the winter than in the summer, the factor is negative. There are a few control
7 Information provided by Joe Avis, Caltrans.
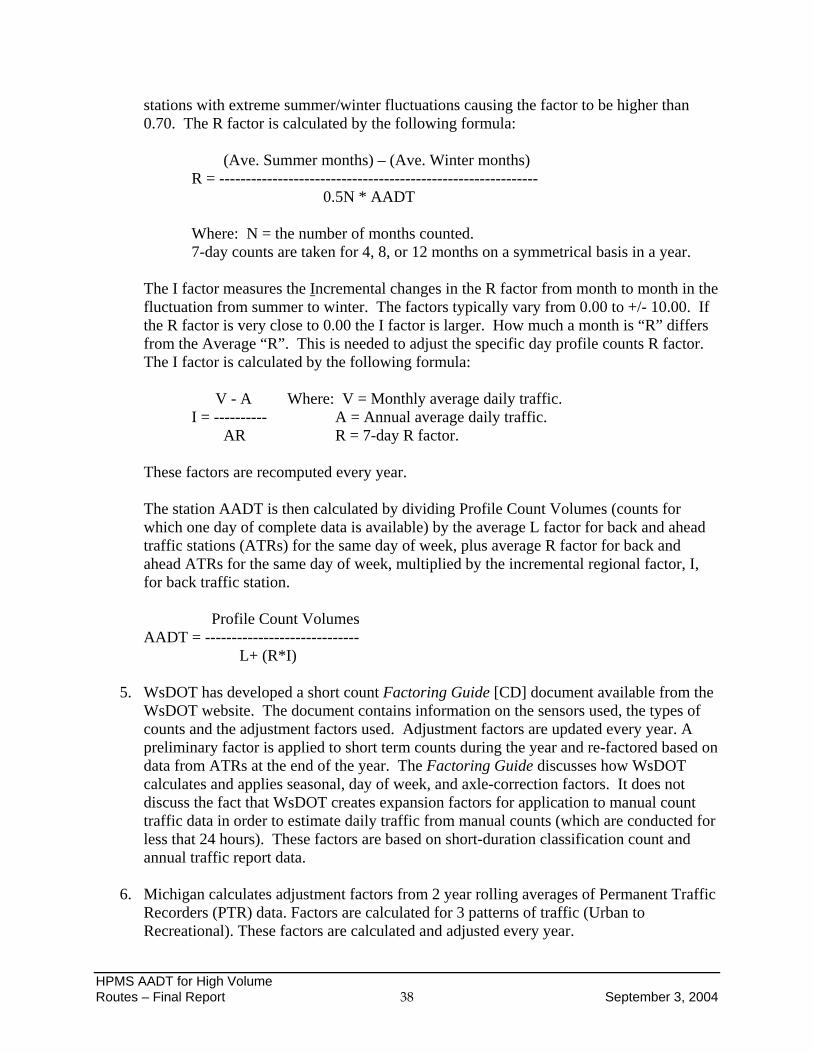
HPMS AADT for High Volume Routes – Final Report 38 September 3, 2004
stations with extreme summer/winter fluctuations causing the factor to be higher than 0.70. The R factor is calculated by the following formula: (Ave. Summer months) – (Ave. Winter months) R = ------------------------------------------------------------ 0.5N * AADT Where: N = the number of months counted. 7-day counts are taken for 4, 8, or 12 months on a symmetrical basis in a year. The I factor measures the Incremental changes in the R factor from month to month in the fluctuation from summer to winter. The factors typically vary from 0.00 to +/- 10.00. If the R factor is very close to 0.00 the I factor is larger. How much a month is “R” differs from the Average “R”. This is needed to adjust the specific day profile counts R factor. The I factor is calculated by the following formula: V - A Where: V = Monthly average daily traffic. I = ---------- A = Annual average daily traffic. AR R = 7-day R factor. These factors are recomputed every year. The station AADT is then calculated by dividing Profile Count Volumes (counts for which one day of complete data is available) by the average L factor for back and ahead traffic stations (ATRs) for the same day of week, plus average R factor for back and ahead ATRs for the same day of week, multiplied by the incremental regional factor, I, for back traffic station.
Profile Count Volumes AADT = ----------------------------- L+ (R*I)
5. WsDOT has developed a short count Factoring Guide [CD] document available from the
WsDOT website. The document contains information on the sensors used, the types of counts and the adjustment factors used. Adjustment factors are updated every year. A preliminary factor is applied to short term counts during the year and re-factored based on data from ATRs at the end of the year. The Factoring Guide discusses how WsDOT calculates and applies seasonal, day of week, and axle-correction factors. It does not discuss the fact that WsDOT creates expansion factors for application to manual count traffic data in order to estimate daily traffic from manual counts (which are conducted for less that 24 hours). These factors are based on short-duration classification count and annual traffic report data.
6. Michigan calculates adjustment factors from 2 year rolling averages of Permanent Traffic
Recorders (PTR) data. Factors are calculated for 3 patterns of traffic (Urban to Recreational). These factors are calculated and adjusted every year.
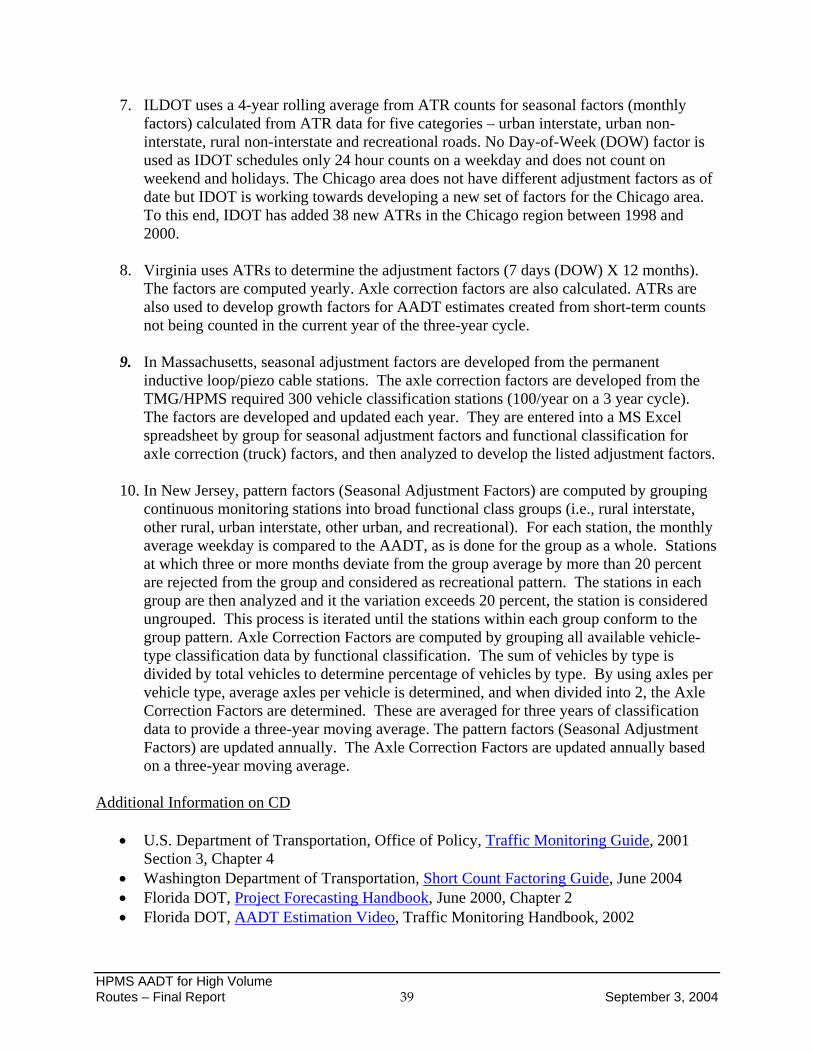
HPMS AADT for High Volume Routes – Final Report 39 September 3, 2004
7. ILDOT uses a 4-year rolling average from ATR counts for seasonal factors (monthly factors) calculated from ATR data for five categories – urban interstate, urban non-interstate, rural non-interstate and recreational roads. No Day-of-Week (DOW) factor is used as IDOT schedules only 24 hour counts on a weekday and does not count on weekend and holidays. The Chicago area does not have different adjustment factors as of date but IDOT is working towards developing a new set of factors for the Chicago area. To this end, IDOT has added 38 new ATRs in the Chicago region between 1998 and 2000.
8. Virginia uses ATRs to determine the adjustment factors (7 days (DOW) X 12 months).
The factors are computed yearly. Axle correction factors are also calculated. ATRs are also used to develop growth factors for AADT estimates created from short-term counts not being counted in the current year of the three-year cycle.
9. In Massachusetts, seasonal adjustment factors are developed from the permanent
inductive loop/piezo cable stations. The axle correction factors are developed from the TMG/HPMS required 300 vehicle classification stations (100/year on a 3 year cycle). The factors are developed and updated each year. They are entered into a MS Excel spreadsheet by group for seasonal adjustment factors and functional classification for axle correction (truck) factors, and then analyzed to develop the listed adjustment factors.
10. In New Jersey, pattern factors (Seasonal Adjustment Factors) are computed by grouping
continuous monitoring stations into broad functional class groups (i.e., rural interstate, other rural, urban interstate, other urban, and recreational). For each station, the monthly average weekday is compared to the AADT, as is done for the group as a whole. Stations at which three or more months deviate from the group average by more than 20 percent are rejected from the group and considered as recreational pattern. The stations in each group are then analyzed and it the variation exceeds 20 percent, the station is considered ungrouped. This process is iterated until the stations within each group conform to the group pattern. Axle Correction Factors are computed by grouping all available vehicle-type classification data by functional classification. The sum of vehicles by type is divided by total vehicles to determine percentage of vehicles by type. By using axles per vehicle type, average axles per vehicle is determined, and when divided into 2, the Axle Correction Factors are determined. These are averaged for three years of classification data to provide a three-year moving average. The pattern factors (Seasonal Adjustment Factors) are updated annually. The Axle Correction Factors are updated annually based on a three-year moving average.
Additional Information on CD
U.S. Department of Transportation, Office of Policy, Traffic Monitoring Guide, 2001
Section 3, Chapter 4 Washington Department of Transportation, Short Count Factoring Guide, June 2004 Florida DOT, Project Forecasting Handbook, June 2000, Chapter 2 Florida DOT, AADT Estimation Video, Traffic Monitoring Handbook, 2002
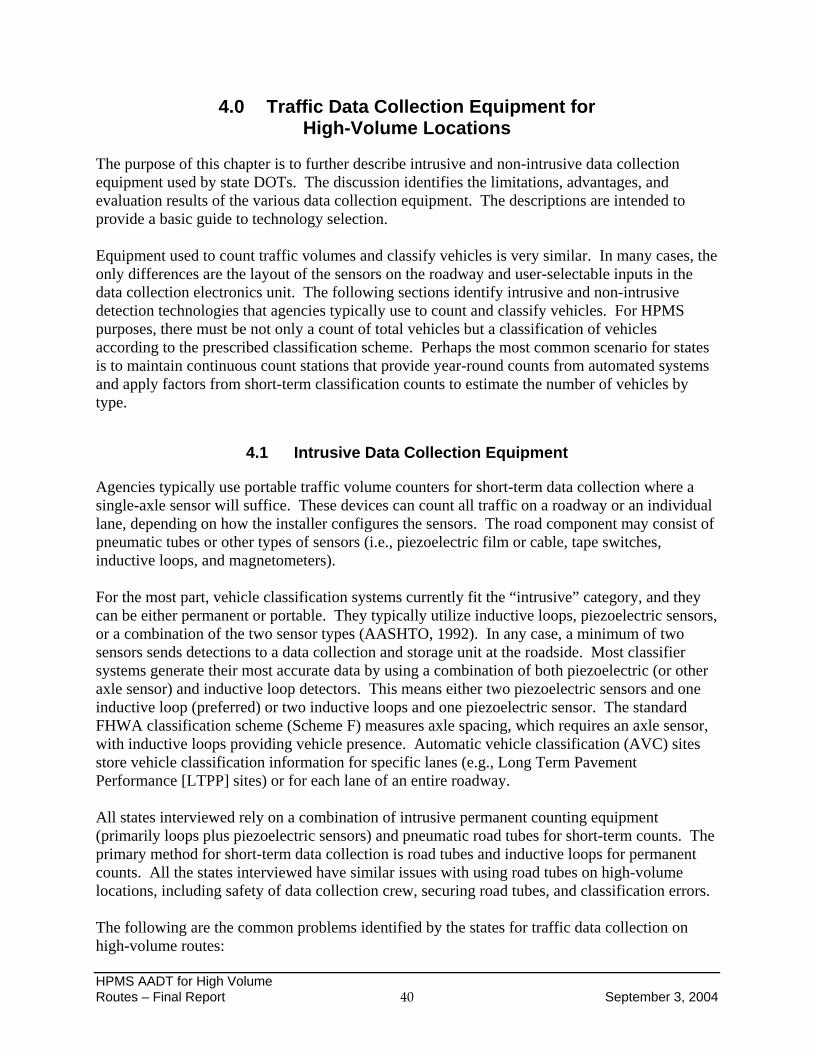
HPMS AADT for High Volume Routes – Final Report 40 September 3, 2004
4.0 Traffic Data Collection Equipment for High-Volume Locations
The purpose of this chapter is to further describe intrusive and non-intrusive data collection equipment used by state DOTs. The discussion identifies the limitations, advantages, and evaluation results of the various data collection equipment. The descriptions are intended to provide a basic guide to technology selection. Equipment used to count traffic volumes and classify vehicles is very similar. In many cases, the only differences are the layout of the sensors on the roadway and user-selectable inputs in the data collection electronics unit. The following sections identify intrusive and non-intrusive detection technologies that agencies typically use to count and classify vehicles. For HPMS purposes, there must be not only a count of total vehicles but a classification of vehicles according to the prescribed classification scheme. Perhaps the most common scenario for states is to maintain continuous count stations that provide year-round counts from automated systems and apply factors from short-term classification counts to estimate the number of vehicles by type.
4.1 Intrusive Data Collection Equipment
Agencies typically use portable traffic volume counters for short-term data collection where a single-axle sensor will suffice. These devices can count all traffic on a roadway or an individual lane, depending on how the installer configures the sensors. The road component may consist of pneumatic tubes or other types of sensors (i.e., piezoelectric film or cable, tape switches, inductive loops, and magnetometers). For the most part, vehicle classification systems currently fit the “intrusive” category, and they can be either permanent or portable. They typically utilize inductive loops, piezoelectric sensors, or a combination of the two sensor types (AASHTO, 1992). In any case, a minimum of two sensors sends detections to a data collection and storage unit at the roadside. Most classifier systems generate their most accurate data by using a combination of both piezoelectric (or other axle sensor) and inductive loop detectors. This means either two piezoelectric sensors and one inductive loop (preferred) or two inductive loops and one piezoelectric sensor. The standard FHWA classification scheme (Scheme F) measures axle spacing, which requires an axle sensor, with inductive loops providing vehicle presence. Automatic vehicle classification (AVC) sites store vehicle classification information for specific lanes (e.g., Long Term Pavement Performance [LTPP] sites) or for each lane of an entire roadway. All states interviewed rely on a combination of intrusive permanent counting equipment (primarily loops plus piezoelectric sensors) and pneumatic road tubes for short-term counts. The primary method for short-term data collection is road tubes and inductive loops for permanent counts. All the states interviewed have similar issues with using road tubes on high-volume locations, including safety of data collection crew, securing road tubes, and classification errors. The following are the common problems identified by the states for traffic data collection on high-volume routes:

HPMS AADT for High Volume Routes – Final Report 41 September 3, 2004
Safety concerns with installing traffic collection equipment Sensor problems due to rutting and pavement deterioration Equipment failures (e.g., piezos and loops) Damage to or loss of road tubes (e.g., tubes getting shredded, not staying on the ground,
damaged by street cleaning operations, lost due to vandalism) Communication problems with the traffic counters, including failures, cross-talk,
chattering among loops Congested stop-and-go traffic adds to the difficulty of collecting accurate vehicle
classification data. Also, misclassification due to congested traffic in axle-counting programs
Construction, while offering an opportunity to install new counters, can cause severe disruptions along the corridor in the count program, especially due to route diversions resulting in atypical data at some sites.
4.1.1 Pneumatic Tubes
Pneumatic tubes are hollow rubber tubes stretched across the portion of the roadway for collecting vehicle count and/or speed data. One end of the tube connects to a traffic counter/ classifier with the other end plugged to prevent air leakage as a vehicle crosses the tube. As a vehicle passes over the tube, its tires compress the tube, actuating an air pressure transducer on the classifier. This means that pneumatic tubes operate in pulse mode only. Although there are several problems associated with them, these tubes are the most common device used by states for short-term counts. Tubes are relatively inexpensive, and installation is quick and easy. These tubes, typically 0.5 inch in diameter, are relatively accurate for light traffic flows, but they damage easily. The safety of traffic personnel installing road-tubes in high-volume roads is also a concern.
4.1.2 Inductive Loop Detectors
The inductive loop consists of one or more turns of insulated loop wire installed in a shallow slot that is sawed in the pavement, a lead-in cable, and a detector electronic unit. Electrical induction consists of a detector unit that passes a current through the stranded loop wire, thereby creating an electromagnetic field around the wire. Moving a conductive metal object, such as a vehicle, through this field disturbs the electromagnetic field, producing a change in energy level. As the vehicle enters the electromagnetic field of the loop, it causes a decrease in the inductance of the loop and an increase in the oscillation frequency. The inductive loop detector, which was introduced in the 1960s, continues today as the most commonly used form of detector, even though its weaknesses are widely recognized. Proper installation of the loop in the road surface is important to ensure the reliability of the system. Some pavement surfaces, such as bridge decks, preclude the saw cutting necessary to install permanent inductive loop detectors. A primary disadvantage of inductive loop detectors is the expense of relocating or repairing loops after installation. This procedure requires extensive
HPMS AADT for High Volume Routes – Final Report 42 September 3, 2004
traffic control and results in congestion and motorist delay (Tyburski, 1989). Detector “cross-talk” and increased pavement stress are two additional disadvantages of inductive loop detector systems. There are also several adverse conditions that affect the operation of inductive loops, including high voltage power lines under the pavement, a pavement subsurface with a high iron content, and unstable pavement conditions. Underground wires, conduit, and pull boxes are susceptible to being damaged by utility work. Modern detection electronics can overcome the first two conditions, but changing or unstable pavement conditions result in increased inductive loop maintenance costs (TTI, 1992). One advantage of inductive loop systems over some of the non-intrusive alternatives is their ability to maintain accuracy in all weather and lighting conditions (ITE, 1991). Opinions differ on the reliability of inductive loop systems. Some agencies believe that inductive loop technology is the best available, while others have experienced high failure rates (TTI, 1992). Studies on inductive loops revealed that several installation processes needed revision to improve the inductive loop detectors’ reliability. Improper saw-cutting techniques, loop-wire splicing, and inadequate loop-sealant bonding resulted in loop wire breakage (Labell and May, 1990). Given the widespread use of inductive loops throughout the United States, it is logical to fully utilize their capabilities and even to further enhance these capabilities. Inductive loops detect “presence” of vehicles. In its typical use, the inductive loop is basically an on-off device, or a contact closure, indicating that a vehicle is either present or not. In conjunction with its companion electronics, a single loop can provide vehicle counts and occupancies, whereas dual loops (often referred to as “traps”) can provide speeds and vehicle classification (by length). However, other useful information is available from inductive loops by adding the appropriate hardware and software. These new concepts need to be considered because they add a new dimension to a state or local agency’s capabilities in traffic monitoring.
4.1.3 Vehicle Classifiers – General
The previous two sub-sections discussed traffic-detection equipment. Another component of traffic detection relates to the classifiers used to translate axle-presence detection to vehicle volumes and classes. There are many different classifiers in the market today that use the spacing between axle hits to determine classification based on previously determined class tables. The Georgia Tech Research Institute and Georgia DOT performed a series of field tests on several vehicle classification devices that are currently used in order to determine accuracy and adequacy of the equipment. The field test location was on IH-20 in the metropolitan Atlanta area, and the test included two 48-hour tests for detailed vehicle-by-vehicle analysis and one seven-day test for longer term accuracy statistics (Harvey and Champion, 1996). Published results were in a format that provided anonymity to participating companies and to specific equipment to avoid the appearance of competitiveness (Harvey and Champion, 1996). Documentation of results compared actual vehicle classification to system classification and the overall classification accuracy. The analysis of results found that the most common

HPMS AADT for High Volume Routes – Final Report 43 September 3, 2004
classification errors involved the differentiation of class 2 (Passenger Cars) and class 3 (Other Two-Axle, Four-Tire, Single Unit Vehicles) vehicles by test equipment. The results also found that the most accurately classified vehicles were large trucks, which comprise classes 8 through 12. The test team also found that there is a strong correlation between the accuracy of a classifier and the reliability of the axle sensor used to collect the data, and that axle-sensor error accounts for a large number of the overall classification errors. The increased accuracy regarding trucks is attributed to the distinct separation in the number and spacing of truck axles (Harvey and Champion, 1996). Virginia DOT uses the following equipment and strategies:
Continuous count locations use the Peek ADR 3000+ equipment with advanced piezo and loop boards. They also have advanced loop logic capabilities when used with the loop-piezo-loop sensor configuration.
Coverage counts are collected with road-tubes using the ADR 1000+ in addition to
tailgating logic algorithms. Classification tables are thoroughly reviewed and tested periodically.
Each lane is counted separately in all cases. Road-tube arrays are independent of other
lanes at the more challenging locations and shared arrays are used at low volume-low congestion traffic areas such as rural.
Virginia uses two-man crews for high-volume areas.
4.1.4 Magnetometers
A magnetometer typically consists of an intrusive sensor about the size and shape of a small can, a lead-in cable, and an amplifier. The cylinder portion of the magnetometer contains sensor coils that operate similarly to inductive loops. These coils are installed in a small circular hole in the center of each lane and communicate with the roadside by wires or radio link. Magnetometers function by detecting increased density of vertical flux lines of the earth’s magnetic field caused by the passage of a mass of ferrous metals, such as a motorized vehicle. They operate in either presence or pulse modes and are embedded in the pavement. Magnetometers require less cutting of the pavement than inductive loop sensors, are easier to install, and can be installed underneath bridge decks without damage to the deck. The disadvantages of magnetometers are similar to those of inductive loop detector systems, in that they sometimes double count trucks and are less likely to detect motorcycles due to the vehicle’s small detection zone (Labell and May, 1990). Illinois DOT has had great success in using Numetric Hi-Star sensors. These sensors use Vehicle Magnetic Imaging (VMI) technology and are capable of the volume, speed, and length classification of vehicles plus road surface temperature, wet/dry surface condition, and roadway occupancy. IDOT finds these sensors easy to install and found them to be excellent for traffic volume data for highways carrying less than 75,000 AADT. While high-volume routes exist in Illinois (especially in the Chicago area), IDOT does not use these sensors in such locations but
HPMS AADT for High Volume Routes – Final Report 44 September 3, 2004
gets the data from the Chicago Area Transportation Study (CATS). This equipment also performs well for length based classification which Illinois is a big proponent of.
4.1.5 Non-Invasive Microloop
The 3M system consisted of three components: Canoga Model 702 Non-Invasive microloop probes, Canoga C800 series vehicle detectors, and 3M ITS Link Suite application software. The microloop probes can monitor traffic from a three-inch non-metallic conduit 18 to 36 inches below the road surface or from underneath a bridge structure. Installers must use a magnetometer underneath bridges to determine proper placement of the probes; otherwise, optimum performance requires trial-and-error. Probes installed in a “lead” and “lag” configuration under pavements or bridges can monitor speeds by creating speed traps in each lane. One of the requirements of this system is that the probes remain relatively vertical, so keeping the horizontal bores straight is critical. Probes placed in a non-vertical orientation can lead to speed errors. MnDOT tests under pavement indicated excellent volume and speed results. The absolute percent volume difference between sensor and baseline was under 2.5 percent, which is within the accuracy capability of the baseline loop system. For speeds, the test system generated 24-hour test data with absolute percent difference of average speed between baseline and test system from 1.4 to 4.8 percent for all three lanes (Minnesota DOT, 2002). At a relatively low-to-moderate volume site in College Station, Texas, TTI found that, for a six-day count period, 3M microloops were almost always within 5 percent of baseline counts. In the right lane, all except two 15-minute intervals out of the 330 total intervals were within 5 percent of baseline counts. The remaining two were within 10 percent of baseline counts. Therefore, microloop counts were within 5 percent of baseline counts 99.4 percent of the time in the right lane (dual probes). In the left lane (single probes), 94.5 percent of the 15-minute intervals were within 5 percent, 4.5 percent were between 5 and 10 percent, and 1.0 percent were more than 10 percent from the baseline (Middleton and Parker, 2000). NYSDOT tested 3M Microloops for bridge deck applications. NYSDOT also tested SAS-1 Acoustic sensors due to their advantages of low-power requirements and low cost. The main advantage stated by New York is the safety of traffic personnel.
4.2 Non-Intrusive Data Collection Equipment
A number of non-intrusive technologies also can be used for counting traffic volumes and for classifying vehicles. The use of non-intrusive data collection equipment for traffic data collection has been investigated by various states. While some of the states are experimenting and testing some types of non-intrusive equipment, other states are now beginning to review that option. This category of vehicle detectors includes active and passive infrared sensing systems, passive acoustic detectors, ultrasonic detectors, microwave and radar detection systems, automatic vehicle identification systems, and video detection systems. Some of the potential advantages of non-intrusive devices include ease of repair and ability to do so off the roadway. Several potential disadvantages were identified, including:
HPMS AADT for High Volume Routes – Final Report 45 September 3, 2004
Set-up can be difficult Classification problems, undercounting and length-based instead of axle-based
calculations Occlusion problems Difficult to use as a volume or classification station over a long period of time.
Illinois DOT is a strong proponent of length-based classification and has worked with FHWA to report length-based classification for HPMS. The use of length-based classifications encourages the use of non-intrusive detectors. Often the inability of such devices to classify vehicles into 13 vehicle categories is mentioned as a major impediment to their increased use. The following paragraphs describe each of these systems and discuss advantages and disadvantages of system equipment.
4.2.1 Active Infrared Detection Systems
Active infrared sensors operate by focusing a narrow beam of energy and either measuring the reflected energy or measuring the direct energy disruption by an infrared-sensitive cell. In the first case, one device both sends and receives energy, and interprets the reflected pattern. In the second, energy disruption represents vehicle presence so that detections occur when vehicles pass through the beam and interrupt the signal. The infrared beam can be transmitted from overhead or from one side of the road to the other. Infrared systems can provide information on vehicle height, width, and length, in addition to simple passage of vehicles. Preliminary testing of active infrared detectors by public agencies indicates very promising results for monitoring vehicle speeds and classifications. TTI tested the Autosense II by Schwartz Electro-Optics (SEO) and found it to operate during day/night transitions and other lighting conditions without significant problems. However, its cost of $10,000 per lane may be a deterrent to its use. A second disadvantage of this sensor as compared to most other non-intrusive sensors is the requirement to be placed directly over each lane. This requires lane closure to install and remove the sensor element. Advantages include its ease of setup and generation of data protocols for interpreting its output. Also, it was more accurate in its classification accuracy (based on vehicle dimensions) than another non-intrusive sensors tested (Middleton et al. 1997). Based on information from others, weather conditions that appear to be problematic for this device are heavy fog, heavy dust, and heavy rain. England uses infrared detectors extensively for both pedestrian crosswalks and signal control. The San Francisco-Oakland Bay Bridge uses infrared detection systems to detect presence of vehicles across all five lanes of the upper deck of the bridge (ITE, 1991). In contrast to the SEO ASII, which monitors and measures vehicle dimensions, the Autosense IIA counts axles. Installation of the IIA is above and to the side of each lane being monitored so that its field of scan includes a side view of the vehicle and its axles. Early testing by the vendor in November 1998 and during the first quarter of 1999 indicates axle-counting accuracy of 95 percent. The manufacturer anticipates further refinement of system algorithms based on “real world” data and improvement of classification accuracy to the design goal of 99.5 percent. The design used by SEO for this detector allows its firmware to execute the axle-counting algorithm
HPMS AADT for High Volume Routes – Final Report 46 September 3, 2004
without a dedicated computer to perform post-processing. Vehicle classification and axle count are reported within 25 milliseconds of vehicle passage. The release date for the Autosense IIA to be available to the general public was scheduled for April 1999. The Autosense IIA is the only non-intrusive detector identified by the authors that can classify according to the standard FHWA classification scheme using number of axles and axle spacings.
4.2.2 Microwave Sensors
As noted earlier, ODOT uses EIS RTMS units in five locations to collect traffic volume data. ODOT also owns four Off Road Axle Detection Sensors (ORADS) developed and constructed as part of a research project. In addition, ODOT provided funding for an Ohio University research project on Improved Work Zone Design Guidelines. As part of this study, they will be purchasing 16 mobile trailer units equipped with non-intrusive sensors. ODOT will receive these units once the study is complete. ODOT also has tested video (Autoscope) and acoustic. ODOT feels that the main disadvantages are no classification information and difficult set-up.
Virginia DOT is actively researching several non-intrusive technology devices. To date, only the RTMS sidefire radar has been approved for use. It can be used as a portable detector and has the required accuracy needed. Virginia DOT has reviewed other non-intrusive products, but none has met their current needs. For example,
Laser-detector technology may have an inherent limitation with respect to roadway crown at some locations.
Due to occlusion (vehicles being missed due to being in the shadow of a larger vehicle),
current technology limitations may not provide the needed performance at the more difficult congested traffic locations.
Acoustic sensors require a higher setup requirement and do not meet the portable
requirements of the current portable system. However, VDOT’s ITS groups are working on establishing permanent count sites with acoustic sensors and the intention is to share these data.
Caltrans tested RTMS extensively but did not obtain favorable results, including long set-up times and occlusion problems. However, Caltrans recognizes that these technologies have improved since and has developed guidelines/requirements for non-intrusive detectors. The draft guidelines are intended to help California personnel make educated estimates of whether microwave sensors can fulfill their requirements. The document contains checklists of requirements that must be met, test results of various microwave models, technology descriptions, and installation overviews. VDOT uses a portable customized side fire RTMS device for high-volume freeway. The device needs some training to set up and calibrate but works well for volume counts. TTI tested the accuracy of RTMS at a site on the I-35 in Texas. This site does have stop-and-go traffic sometimes during the peak periods so it provides a good test for non-intrusive sensors. It was noted that the RTMS has to be located a minimum of about 18-ft from the nearest traffic lane to
HPMS AADT for High Volume Routes – Final Report 47 September 3, 2004
be effective. Detectors located less than 6-ft from the nearest lane did not yield reasonable results for that lane. The results indicate that, RTMS accuracy ranges 0 to 5 percent and that occlusion reduces accuracy (both counts and speeds). Also, slow speeds compromise RTMS accuracy. With regards to setup time, it was observed that it takes about an hour per lane even with trained personnel.
4.2.3 Passive Acoustic Detection Systems
The SmarTek SAS-1 is a passive acoustic detector that monitors vehicular noise (primarily tire noise) as vehicles pass the detection area. The detector can monitor as many as five lanes and the SAS-1 must be oriented in a sidefire position. Precise alignment is not critical because the sensor can cover a wide area. Heights recommended by the vendor range from 25 feet to 40 feet, and the recommended offset range is 10 feet to 20 feet. Higher mounting positions can reduce the effects of occlusion in multiple lane applications. TTI research found that the SAS-1 predominantly undercounted in both peak and off-peak conditions. The SAS-1 speed estimates were within 5 to 10 mph of baseline during some peak periods but as much as 20 to 25 mph different in others. Free-flow speed estimates were usually within 5 mph of baseline speeds (Middleton and Parker, 2002). TTI has not tested the accuracy of the SAS-1 vehicle classification algorithm. The Traffic Monitoring Unit of the New York State Department of Transportation has successfully developed a permanent acoustic traffic monitoring site. This type of site was developed in-house by NYSDOT personnel to support non-intrusive sensor technology with applications in data collection and ITS activities. The conceptual priority for use of this type of site was installation on facilities where the cost of in-pavement sensors was not justified due to roadway and traffic conditions that greatly limited sensor service life. Use of this type of site greatly reduces data collection costs, but still meets the needs of the Department. Each site consists of a Smartek SAS-1 acoustic sensor mounted on an existing light pole or sign structure at a height of 30 to 40 feet, structure dependant. A small cabinet mounted at the base houses Smartek electronic and communication interfaces as well as power management electronics. The platform is supported by a 12 volt electrical system with one 50 watt Kyocera solar module charging two 75 Ah deep-cycle batteries to supply power. A Trafinfo.com Trafmate digital pager is used to download archived data via telemetry. In addition to using the acoustic sensors as permanent stations, NYSDOT also has four mobile platforms equipped with the sensor for portable counts including coverage counts, special counts and some ITS design applications. Four Mobile Traffic Monitoring Platforms have been built to date. Each is used to collect volume data on high-speed, high-volume multi-lane facilities where safety concerns or equipment limitations prevent use of typical collection methods. Each platform supports a Smartek SAS-1 acoustic sensor extended on a 35-foot telescoping mast. The platform weighs approximately 1000 pounds, is easily transportable, and can be erected outside the traveled way and operational in approximately 30 minutes. The cost of each platform fully outfitted with solar power, deep-cycle batteries, a telescoping 35-foot mast, acoustic sensor, and supporting electronics is approximately $7,000. A somewhat similar commercial version of the platform is available for approximately $28,000. However,
HPMS AADT for High Volume Routes – Final Report 48 September 3, 2004
that setup uses a different type of sensor with a high power consumption rate. It requires generator-supplied power and has no communications capability. The in-house research, development, and construction of this project represent an initial cost savings to NYSDOT of approximately $21,000 for each platform. The anticipated life span of the clean, maintenance-free, solar cell-charged deep-cycle batteries is five years with no additional fuel costs. The batteries are recycled at the end of their useful life. The average cost of construction of one three-to-six-lane count site with loop sensors that is typically used for only a few weeks during the life span of the loops is approximately $30,000. Each count taken utilizing the platform at each location will save the Department $30,000 each time. Assuming two trailers will be used to take a minimum of ten scheduled counts each year on facilities with three or more lanes, the benefit cost ratio for such a device was estimated to be 21:4.
4.2.4 Video Image Detection Systems
A video image detection (VID) system consists of one or more cameras providing a clear view of the area, a microprocessor-based system to process the video image, and a module to interpret the processed images. Advanced VID systems can collect, analyze, and record traditional traffic data; detect and verify incidents; classify vehicles by length; and monitor intersections. The ability of VID systems to classify vehicles is generally limited to daylight hours unless street lighting is bright enough for the VID’s daytime algorithm. Their nighttime detection algorithms depend on detection of headlights, and the systems cannot distinguish between the various headlights of individual vehicle classes. It should also be noted that video systems on the market today provide only three to five vehicle length classifications. Therefore, these systems cannot be used to classify by axles as required by the FHWA classification scheme unless approved by FHWA. The most recent Texas Transportation Institute (TTI) tests indicate some very promising features of one VID system, the Autoscope Solo Pro, but its classification accuracy was not included in the tests.
4.3 Equipment Summary
While there have been rapid advances in vehicle detection technology, inductive loops and piezo electric sensors are considered by states as the most efficient way to collect traffic data. Improvements in loop installations and vehicle counters have greatly reduced the problems associated with inductive loops. Advanced vehicle counters with loop signatures-based detection and classifications promise to build upon the improvements. However, the use of loops continues to be cumbersome due to its inherent requirements such as pavement cutting, traffic control and lane closures, and maintenance problems. Pneumatic tubes are the preferred technology for short-term counts. Non-intrusive detectors provide an alternative to minimize or eliminate some of the safety and maintenance issues with loops and tubes. These technologies include infrared-, acoustic-, microwave-, and video-based sensors. Various tests have shown that these sensors currently meet requirements as far as volume monitoring is concerned but fall short on classification of vehicles.
HPMS AADT for High Volume Routes – Final Report 49 September 3, 2004
5.0 Guidelines for Data Collection for High-Volume Routes
The art and practice of traffic data gathering and processing has been well established over the years. Each state DOT follows a set of procedures, chooses, and uses equipment that best meets their specific needs. The guidelines presented in this chapter acknowledge the existence of these state-specific practices and procedures. These guidelines are intended to help enhance the process and improve the quality of traffic data collection and processing on high-volume routes especially. The guidelines are not intended as a set of uniform standards that all states must follow, neither are they intended to replace existing successful practices. Instead, these guidelines are intended as a guide or reference source based on states’ experiences and lessons learned to help states seeking direction or guidance on addressing common or specific issues relating to traffic data collection and processing for high-volume routes. The primary objective is to improve the quality of traffic data on high-volume routes. The guidelines are grouped into four broad categories – data collection, data processing and quality assurance, use of ITS data, and equipment. These are based on best or common practices and equipment descriptions presented in chapters 3 and 4 of this report. The guidelines are presented with examples and hyperlinks to further detailed information on the accompanying CD.
5.1 Data Collection
Data collection for HPMS reporting will continue to be based on short-term counts and permanent count stations. The following steps are considered useful for traffic monitoring on high-volume routes.
5.1.1 Define High-Traffic Volume
The first step is to define what constitutes high-traffic volume. While most states tend to define high-traffic volume routes in terms of the ability to install data collection equipment safely, such perception can be translated into traffic volume. The definition of high-volume routes in terms of AADT is believed to provide a standard way of identifying routes that carry traffic volumes that are high enough to endanger the safety of data collection crew. It is probable that the traffic threshold value may not be the same across all states. In some states, AADT of 50,000 may be considered high, while 100,000 may be the threshold in other states. For example, IlDOT uses 70,000 AADT while NYSDOT uses 80,000 AADT to define high volume routes. However, analysis of AADT data to determine which states to interview indicate that invariably, the top 10 states based of the mileages of roadway carrying traffic volumes satisfying the three thresholds (50,000, 75,000, and 100,000 AADT) are the same. The ranking of the states however vary depending on the threshold. As a guide, therefore, it is recommended that high-volume routes can be defined as those carrying traffic in excess of 50,000 AADT.
HPMS AADT for High Volume Routes – Final Report 50 September 3, 2004
5.1.2 Identify High-Volume Locations
The next step is to identify routes carrying traffic volume that satisfy the threshold value. Safety of traffic personnel during installation of traffic sensors was the primary concern expressed by the states interviewed. Therefore, it is important that state DOTs identify locations where safety is a concern due to traffic volumes, geometry, or other reasons. This step also involves identifying locations where data collection is difficult due to technological limitations caused by congestion and stop-and-go traffic. Once such locations have been identified, it becomes easy to identify appropriate data collection strategies regarding
the type of equipment number of traffic personnel needed times of installation and removal (peak, off-peak, night-time only) available data sharing or use of ITS data data collection strategy (e.g., ramp balancing)
Washington state uses color coded safety zones to identify locations for data collection. These zones were not identified strictly based on traffic volume but a combination of traffic and roadway characteristics and identify personnel and installation time requirements for locations. Details of this approach are provided in “Safety Zones for Traffic Monitoring”, (WsDOT) [CD].
5.1.3 Select Data Collection Strategies
Strategies suitable for the high-volume locations are intended to improve the data collection process and address the problems and challenges associated with high-volume routes as discussed in the previous chapter. Following are some recommended strategies and approaches: 5.1.1.1 Provide training and guidelines A strategy to improve data collection practices on high volume routes is to provide training, including safety guidelines for all field personnel and additional safety procedures to follow in equipment installation and retrieval. The use of safety guidelines or operational manuals that include safety requirements should be encouraged. Useful examples include the following.
Florida DOT’s Traffic Monitoring Handbook [CD] includes safety guidelines and a safety video for traffic personnel. The comprehensive handbook also contains information on installation, and site selection.
VDOT has created a Pocket Guide (“Guide to Installing Road-Tubes in Virginia") [CD]
on installation of road tubes based on traffic conditions. In addition, VDOT conducts annual program meetings, quarterly reviews, and other equipment-related training to enhance the skills and experience of the field staff and contractors. On-going training helps field personnel in selecting areas with the best characteristics needed to collect accurate traffic data.
NYSDOT trains county personnel, contractors, and state personnel on traffic monitoring
in annual workshops. These workshops are open to all and serves as a valuable forum for
HPMS AADT for High Volume Routes – Final Report 51 September 3, 2004
all the parties involved with traffic monitoring in the state to meet and discuss concerns, opportunities, and emerging approaches.
5.1.1.2 Coordinate Equipment Installation with Construction and Maintenance It is recommended that states plan the installation and maintain data collection equipment (e.g., inductive loops) to coincide with pavement construction and maintenance activities (e.g., in California). This ensures safety to data collection personnel and allows equipment installation, inspection, and maintenance under controlled traffic conditions. Also, it is recommended that equipment installation is carried out during off-peak hours. Inductive loops and piezo sensors are the preferred equipment for ATRs. However, some states (e.g., Florida) are trying to install loops and conduits on multilane facilities and then use them for short-term counts by connecting a traffic counter when required. A properly installed loop and conduit can provide good quality data when a traffic detector is connected without compromising safety of the traffic personnel. The installation of such equipment is better accomplished when coordinated with construction and maintenance operations.
5.1.1.3 Use ramp-balancing techniques On limited access facilities with high-volume traffic, ramp balancing is suggested if permanent count stations are not available for sections of the mainline. The Traffic Monitoring Guide [CD] provides guidelines on ramp counting. In locations where ramp-balancing approaches are used, attempts should be made to automate the data reduction steps, especially in calculating mainline volumes from ramp counts, in converting volume counts to AADTs, and in converting segment volumes to HPMS section volumes. California, Florida, Georgia, Michigan, Ohio, Texas, and Washington use of ramp-balancing approaches that were developed based on the guidelines and recommendations of the Traffic Monitoring Guide. The following examples serve as guides in the use of ramp balancing technique.
California uses ramp balancing extensively on high-volume roads where there are no have permanent counters and cannot safely install portable counters. Caltrans uses a MS Excel spreadsheet (Computational Worksheet, Caltrans) [CD] that contains formulae to calculate AADT volumes based on daily ramp counts. Such a simple spreadsheet can reduce the effort and the errors. Instructions to complete the worksheet are also provided to the field staff and have been shown in Figure 3.3 in Chapter 3 of this report.
MDOT uses a ramp-counting program in S.E. Michigan (Detroit area). State personnel
count at ramp entry and exit locations instead of counting mainline segments. These counts are then used in combination with the ITS detectors and the loops on the mainline to obtain the AADTs for the segments between two entry and access points. The ramp-counting program is conducted according to the TMG guidelines.
In Texas, a new database system (STARS) is expected to automate the ramp-balancing
process. The ramp-balancing programs are being set up based on the TMG guidelines.
HPMS AADT for High Volume Routes – Final Report 52 September 3, 2004
5.1.1.4 Use of Techniques for Better Classification and Lane-by-Lane Detection One of the reported problems of traffic monitoring on high-volume routes is miscounting and misclassification of vehicles due to multiple hits, phantom hits on multi-lane facilities. It is recommended that on such facilities, technologies and techniques that improve lane-by-lane detection and classification of vehicles be used. The following examples illustrate successful techniques:
VDOT uses methods like “blockers” and “independent arrays” to separate the vehicle actuations in adjacent lanes in order to successfully gather traffic data in high-volume routes with pneumatic tubes. Details of this technique are provided in “Guide to Installing Road Tube in Virginia”(VDOT), [CD]. Coverage counts are collected with road-tubes using the ADR 1000+ in addition to tailgating logic algorithms. In addition, VDOT has tested and thoroughly reviewed classification tables where only the approved and current classification tables are to be used on equipment.
NJDOT requires that on multi-lane roadways with volumes greater than 10,000 one-way
AADT, portable loops and electronic axle sensors must be employed to collect classification data. No more than one lane shall be monitored for vehicle type classification per AVC recorder and pair of tubes. On two-lane roads, one AVC recorder and pair of tubes shall be installed on each side of the roadway. On four lane roads with a suitable median, one additional four-channel AVC recorder or two additional two-channel AVC recorders shall be installed in the median to classify traffic in the lanes adjacent to that median. Details of this technique are provided in “Traffic Monitoring Standards” (NJDOT, 2002) [CD].
5.1.3.5 Use data and resource sharing agreements with local agencies The Urban Transportation Monitor (April 16, 2004) survey referenced earlier indicated that 79 percent of the responding cities ( i.e., 98 out of 124) do not have any agreements among local agencies that coordinate traffic collection activities, resulting in waste of funding, duplication of efforts, and inability to share resources. Data and resource sharing agreements codify the roles, expectations, and responsibilities among the parties providing and using traffic data. Such agreements can conceivably occur between public entities, entirely between private entities, or between private and public entities. Data-sharing agreements typically discuss such items as security and confidentiality, liability, frequency of data transmittals, to which the data may be disseminated, and fees. For example, NYSDOT uses counties for traffic data collection. 5.1.3.6 Use contractors for data collection The use of private contractors to collect traffic data is increasing in states. This is especially true for short-term count data. It is suggested that the quality of data and requirements for system operation be included as a standard in specifications. The following are examples of successful contracts with private data providers.
Maryland and Virginia have detailed specifications for short-term counts performed by contractors. These specifications include quality levels, installation, and data collection
HPMS AADT for High Volume Routes – Final Report 53 September 3, 2004
procedures. According to the Maryland State Highway Administration’s “Specification for Consulting Services for the collection of Manual Traffic and Portable Machine Counts and On-Site Traffic Engineering and Highway Engineering Assistance” 2004 [CD], if short-term counts are found to be in error, the agency requires contractors to recount the section.
VDOT has established performance-based lease criteria for payment of data collection
services. Contractor compensation is based on the amount of acceptable data being submitted by the contractor. Furthermore, VDOT requires a certain quantity of acceptable data from each site to be able to use that site for traffic factor creation
NYSDOT has incorporated the requirement to ensure the continuous count stations, AVC
stations and AVC-WIM system operational readiness (up time) is at least 95% into contractor specifications. Further details are available in NYSDOT’s Zone 3 Contractor Specifications (NYSDOT, 2003) [CD].
5.2 Data Processing and Data Quality Assurance
Traffic data for high-volume routes is currently processed in the same manner as for other traffic locations. In reporting AADT values required for HPMS, two related steps are involved – data processing to verify validity and completeness, and calculation of adjustment factors. These and other data quality assurance guidelines are presented below.
5.2.1 Data validation
Data processing to verify validity and completeness is carried out using either in-house software packages or legacy mainframe programs by all states interviewed. For HPMS and traffic monitoring, all states interviewed use software to flag potentially erroneous data for further review by DOT personnel who have extensive local knowledge and experience. Most of the states DOTs interviewed do not use data processing software to process short-term count data except in cases where vendor-provided software is used to download data from the device. Some states have in-house software packages to process short-count data (e.g., Florida uses a software product called “Survey Processing Software”; Washington State uses an in-house program; New Jersey uses TRADAS, a commercially available system and legacy mainframe software that was developed in-house).
A recent Urban Transportation Monitor (April 16, 2004) survey of traffic engineers in the U.S. and Canada reported that about 36 percent of the respondents (i.e., 45 out of 124) did not use any quality control software in processing data. The survey indicated that the software used for quality control of traffic counts is mostly from the manufacturer (56 percent), with some third-party (8 percent) and in-house software (11 percent). It is recommended that all agencies collecting data assess the quality of data, especially for high-volume routes. It is important that in the absence of third-party or in-house software, agencies should at least require vendors to provide software with equipment that would allow data-validity checks based on common or
HPMS AADT for High Volume Routes – Final Report 54 September 3, 2004
published criteria, especially for short-term counts. Several states have recently updated their traffic-processing software to more recent relational database-driven applications. Several states are in the process of developing comprehensive database systems to store, process, and query all their traffic data. These database systems are also expected to have rigorous quality control and assessment procedures. For example, Texas is developing the Statewide Traffic and Recording System (STARS), Ohio is developing Traffic Keeper-Ohio (TKO), and Georgia is updating their QC/QA system. California is already using a relational database system called the Transportation Systems Network (TSN). Documentation and user guides for some of the software used by states are provided on the CD. These include:
Ohio Department of Transportation, “Traffic Keeper-Ohio (TKO) Traffic Edit Guidelines” [CD]
New York State Department of Transportation, Highway Data Services Bureau, “Traffic Count Editor: User Manual and System Documentation” [CD], February 2003
Florida Department of Transportation, “Survey Processing Software (SPS) User Manual”, [CD] , June 2001
FHWA initiated a pooled fund study with Minnesota, Wisconsin, South Dakota, Indiana, New York, Connecticut, North Carolina, South Carolina, Georgia, Florida, New Mexico, California, Idaho, and Montana to develop a system for consistent traffic data quality edits. Although concluded before all its intended objectives were met, the study compiled a list of all data-screening tools used by one or more of the participating states as they are applied to short or continuous volume, vehicle classification, and/or WIM data for the selected data products. The report included a set of logically consistent, state-of-the-practice rules for traffic-data screening derived from five, multiple-day knowledge-engineering sessions attended by more than 60 traffic-data screening experts. The report also included traffic-data screening algorithms, definitions, and pseudo-code statements to support the development of rule-based testing software (MnDOT, 1997).
5.2.2 Adjustment Factors and Growth Factors
Adjustment factors based on TMG [CD] recommendations are needed to convert short-term volume counts to AADTs by accounting for seasonal, monthly, and daily variations. TMG recommends that counts missed because of equipment failures, bad weather, or other reasons should be made up during the year. Partial counts of less than 24 hours should, as a general rule, be retaken. Most states interviewed indicated that they calculate seasonal factors based on rolling averages of ATR data based on TMG guidelines and factor groups. The following are examples of other approaches in use by some states. These are described in detail in Chapter 3 of this report.
Florida DOT publishes a “Project Traffic Forecasting Handbook” [CD] which provides details of the factor calculations. FDOT also has a video on AADT estimation procedures in their traffic monitoring handbook.
HPMS AADT for High Volume Routes – Final Report 55 September 3, 2004
California’s approach to adjustment factor calculation is described in Chapter 3 of this
report.
Washington DOT has developed a short count “Factoring Guide” [CD] available from the WsDOT website. The document contains information on the sensors used, the types of counts, the adjustment factors used etc. Adjustment factors are updated every year.
New Jersey uses pattern factors (Seasonal Adjustment Factors) that are computed by
grouping continuous monitoring stations into broad functional class groups. These factors are updated annually. Deviations from the group average by more than 20 percent are rejected. This process is iterated until the stations within each group conform to the group pattern. Axle Correction Factors are computed by grouping all available vehicle-type classification data by functional classification. The Axle Correction Factors are updated annually based on a three-year moving average.
In Massachusetts, seasonal adjustment factors are developed from the permanent
inductive loop/piezo cable stations. The axle correction factors are developed from the TMG/HPMS required 300 vehicle classification stations (100/year on a 3 year cycle). The factors are developed and updated each year. They are entered into an Excel spreadsheet by group for seasonal adjustment factors and functional classification for axle correction (truck) factors, and then analyzed to develop the listed adjustment factors.
5.2.3 Assessment of Data Quality
Several states interviewed noted that, concerns about the quality of data obtained from external sources preclude their extensive use. Currently, there is no accepted method to assess traffic data quality from different sources and applications. A framework for assessing the quality of traffic data was developed that provides a valuable tool for agencies involved in data collection8. The framework provides methodology for calculating six recommended fundamental measures of traffic data quality. The methodologies presented in the framework are applicable to both ITS and non-ITS generated traffic data. The framework is expected to provide guidance to states on how to assess the quality of traffic data. The fundamental traffic data quality measures are defined below:
Accuracy – The measure or degree of agreement between a data value or set of values and a source assumed to be correct. It is also defined as a qualitative assessment of freedom from error, with a high assessment corresponding to a small error.
Completeness (also referred to as availability) – The degree to which data values are
present in the attributes (e.g., volume and speed are attributes of traffic) that require them. Completeness is typically described in terms of percentages or number of data values. Completeness can refer to both the temporal and spatial aspect of data quality, in the
8 Traffic Data Quality Measurement, Battelle for FHWA’s Office of Highway Policy Information, 2004.
HPMS AADT for High Volume Routes – Final Report 56 September 3, 2004
sense that completeness measures how much data are available compared to how much data should be available.
Validity – The degree to which data values satisfy acceptance requirements of the validation criteria or fall within the respective domain of acceptable values. Data validity can be expressed in numerous ways. One common way is to indicate the percentage of data values that either pass or fail data validity checks.
Timeliness – The degree to which data values or a set of values are provided at the time
required or specified. Timeliness can be expressed in absolute or relative terms.
Coverage – The degree to which data values in a sample accurately represent the whole of that which is to be measured. As with other measures, coverage can be expressed in absolute or relative units.
Accessibility (also referred to as usability) – The relative ease with which data can be
retrieved and manipulated by data consumers to meet their needs. Accessibility can be expressed in qualitative or quantitative terms.
Depending on the application, not all six measures will be required. For purposes of HPMS reporting, accuracy, completeness, validity, and coverage appear to be the most important data quality measures. As noted earlier (Chapter 3), all states interviewed conduct some limited quality control checks to at least identify potentially erroneous data. All states interviewed use validity criteria or data processing rules to assess the quality of the data. Data processing rules used by the states interviewed are based on AASHTO and TMG guidelines and included range checks, completeness of data, and lane-distribution splits. For example, California uses a relational database system called the Transportation Systems Network (TSN). Virginia uses a detailed quality assessment procedure that includes six different categories of quality. However, none of the states interviewed uses a comprehensive data quality assessment procedure compared to the data quality assessment framework referenced above. States are encouraged to review the Traffic Data Quality Measurement Framework, Draft Report ( Battelle, 2004) [CD] for use in assessing the quality of traffic data from different sources and for different applications.
5.3 Use of ITS and Other Data Sources
ITS data offer a valuable source of traffic data especially to the HPMS program. Many of the states interviewed view the ITS data as a potential source for some of their data. Two major issues are quality of the data and the inability to provide classification data. Some state DOTs already rely on ITS-generated data to report AADT for HPMS for parts of their program, other states have concerns about the quality and reliability of such data. The difference in quality of data from these sensors is directly related to the differing requirements of the operations and traffic monitoring groups. While it is acknowledged that many of the ITS sensor locations suffer

HPMS AADT for High Volume Routes – Final Report 57 September 3, 2004
from quality concerns such as missing and inaccurate data, no classification, and frequent and extended downtimes, it is still possible to collect useable data from ITS data sources, especially in lieu of short-term counts. The following sections describe some potential approaches to encourage the use of ITS data for HPMS volume reporting.
5.3.1 Resource Sharing
Merging ITS field infrastructure (like inductive loops and sensors) with traditional traffic counting devices would allow the use of the traffic counters/ classifiers alongside ITS devices. The Detector Isolation Assembly (DIA) approach used in California is a good example. The DIA approach allows the use of existing infrastructure on high-volume routes and enhances the safety of the traffic personnel. Caltrans is in the process of developing sensor-sharing technology to use the existing infrastructure of loops, cabinets, and power supplies to collect planning data. Caltrans’ DIA device also provides total isolation between the traffic recording and the traffic control functions. The DIA device is housed in the same cabinet as the traffic controller and senses the electronic switch closure produced by the detector and passes the signal to the traffic recorder. This technology offers great potential for using existing infrastructure to obtain planning data and is of immediate use at high-volume locations with traffic controllers and ITS detectors (Triplett and Avis, 2002) . California does not use ITS data yet for HPMS reporting. However, Caltran’s counting program has about 219 locations where detector infrastructure on signals and ramps is shared. Similarly, Ohio DOT, working on the same principle of detector sharing, uses loops currently not used for operational analysis by the ITS groups for its traffic data collection.
5.3.2 Compatible Equipment
Both ITS and traffic monitoring groups collect similar traffic data. More often, the equipment used by the two groups is incompatible. It is suggested that agencies investigate the use of compatible equipment or sensor-sharing arrangements where the signals from the in-road sensors are split into two devices. For example, certain equipment in certain locations would allow data to be polled at short intervals of time as required for operations and would also have enough storage for daily downloads by the traffic monitoring groups. Some early efforts in this area already exist. For example, the Division of Planning in Kentucky invested in equipment they like and trust and ARTIMIS (the TMC in the Cincinnati area) identified modifications to these devices so that they also can be used for ITS applications by the TMC.
5.3.3 Strategic Locations
The key to the success of the approaches presented above (i.e., resource sharing and compatible equipment) is the identification of locations where these strategies can be implemented. Also, locating ITS sensors strategically would allow the sensors to be maintained jointly by the traffic monitoring and ITS groups. These locations should be identified by the traffic monitoring group
HPMS AADT for High Volume Routes – Final Report 58 September 3, 2004
as important components of the traffic monitoring program either due to high volumes or for other reasons. Cooperation can range from informal technical assistance to formal data-sharing agreements and personnel support. The following are some examples.
Ohio DOT uses ITS data from ARTIMIS that provides the data in TMG format. ODOT also gets data from certain unused loops installed by Columbus city TMC. The data is derived from loop outputs using contact closure cards. Also, ODOT installed 44 new Roadway Weather Information Systems (RWIS) that will collect traffic data in TMG format and as well as provide real-time weather information.
Michigan DOT uses ITS data from Detroit freeways for AADT reporting. Michigan ITS
(MITS) is responsible for collecting and summarizing traffic data into hourly intervals. MITS is responsible for the quality checks on the raw data. This is a relationship that has grown and been in place for the past 12 years. The ITS data also provide more control points to the ramp counting program.
Illinois uses data from toll way authorities and CATS in the Chicago area collected using
a combination of loops, toll plazas etc to collect data on these high-volume roads
5.3.4 Supplemental Data Sources
Increasing use of data from ITS data archives could supplement HPMS and traffic monitoring programs. However, the use of ITS data archives is being limited by concerns about quality of data and the effort needed to successfully process and integrate these sources into the remainder of the traffic monitoring program. Examples of data archive projects are outlined below. Other states (e.g., Ohio, Illinois, Michigan notably) also use ITS data in archival form to supplement their data collection needs.
Caltrans has a Performance Measurement System (PeMS) for the inductive loops (Choe, et al, 2002) [CD]. PeMS obtains 30-second loop detector data in real time from each Caltrans District Transportation Management Center (TMC). The data are transferred through the Caltrans wide area network (WAN) to which all districts are connected. Caltrans is working with the PeMS project team to enable transfer/sharing of data between the PeMS databases and the state highway counting program. The use of PeMS data will provide the state highway traffic-counting program with a wealth of detectors that can function either as permanent detectors or control points.
FDOT has conducted research to utilize archived ITS data for HPMS and transportation
planning purposes. FDOT has developed a software system to mine ITS data from the I-4 region in Orlando. The software is used to convert the data obtained from TMC to a format usable by the quality control software (Survey Processing Software). The plan is to expand it to other TMCs. FDOT indicated that as a first step, data from ITS sources have to be available in an archive.
HPMS AADT for High Volume Routes – Final Report 59 September 3, 2004
5.4 Equipment
Chapter 4 of this report provides detailed descriptions of the various types of traffic data collection equipment. It is acknowledged that all states employ data collection equipment by different manufacturers. The selection of equipment is based on individual state experiences, needs, and conditions. Invariably, inductive loops are the primary choice with permanently installed equipment used for continuous and short-term counts while pneumatic tubes are used for short-term counts. The equipment from different manufacturers, although designed to perform identical tasks, may have different characteristics in terms of reliability, accuracy, robustness, and durability, among others. The following are highlights of advances in data collection technology, both traditional and non-intrusive. These are designed to guide the selection of equipment and technologies for data collection.
5.4.1 Advances in Detection Technology
There are some recent advances in detection technology directed at improving traffic volume and vehicle classification on high-volume routes especially in congested and stop-and-go traffic conditions. Improvements in loop installations and vehicle counters have reduced greatly the problems with inductive loops. Advanced vehicle counters with loop signatures-based detection and classifications promise to build upon the improvements. Inductive loop signatures, a technology that involves several algorithms designed for use in roadside vehicle detection equipment, may apply to vehicle classification, toll applications, and incident detection. For example, recent tests on the loop-signature technology conducted by the TTI indicated that the technology was very accurate as a classifier, counter, and speed-detection device and as a generator of simultaneous contact closure output (Middleton and Parker, 2002).
5.4.2 Equipment Calibration and Testing
Accuracy testing of equipment is often done at the time of procurement rather than during regular operations. In order to test equipment installed in the field for accuracy, it is necessary to develop quick and easy methods for field personnel, including such methods as visual displays on counters or manual counts prior to setting up short-term counts, which are used by Washington, Virginia, and Georgia. In Washington, tube counters are set and validated prior to every count. A manual count (100 axles or 5 minutes of traffic, whichever comes first) is performed and compared to the data from the traffic counters. Similarly, each of the continuous count sites is validated once a year by a manual traffic count (three hours duration). In Virginia, trained operators check equipment for accuracy during the initial setup operation in all cases. All equipment currently in use has a visual display with real-time results. Advanced loop logic functions are included to provide warning signs when piezo-sensors begin to fail so that preventive maintenance can be planned. Georgia DOT randomly tests ATRs for accuracy using video logs, which are then compared to the collected data. GDOT allows a tolerance level of 5 percent variance from the ground truth that all equipment are expected to meet. Ohio DOT provides guidelines for testing and acceptance of traffic counters. Details can be found in “Warranty, Service and Acceptance Requirements”, Ohio DOT, 2004 [CD].
HPMS AADT for High Volume Routes – Final Report 60 September 3, 2004
5.4.3 Equipment Maintenance
The use of maintenance contracts for rapid restoration of ATRs is a strategy being considered by some states interviewed. The ability to restore an ATR in the least possible time is critical for state DOTs because of the importance of these sites to traffic monitoring programs. Tasks for such contracts include performing regular maintenance of equipment, on-call duties, and installation of new sites. Some states, including Ohio, New York, and Maryland, have used on-call contractors for maintaining and installing permanent count stations. Other states also have expressed interest in task-order-based maintenance contracts including Texas, Florida, and Maryland (Fekpe et al. 2003). The following are some examples.
NYSDOT uses performance-based maintenance contracts for the regular maintenance of
equipment, on-call duties, and installation of new sites. These contracts are renewed annually. The scope of work for contractors provides details about the maintenance activities, turnaround times and on-time performance criteria (NYSDOT Zone 3 Contractor Specifications, 2003). [CD] The scope of work includes on-time requirements, turnaround times, and site inspection / preventive maintenance and repair visits consisting of:
o Repair of sensor epoxy o Repair of sensor lead-in epoxy o Battery condition check o Power system condition check o Communication system condition and operation check o Surge protection equipment condition check o Clean cabinet and solar panel o Repair conduit-sealing material o Manual traffic counts to verify ATR performance and data collection accuracy in
all lanes.
ODOT is in the process of executing a task-order-type contract for maintenance to have contractors on board for anticipated and unanticipated maintenance requirements of the traditional data collection equipment statewide. ODOT is issuing a task-order-type maintenance contract to repair equipment including loops, piezo-sensors, and WIM sites.
5.4.4 Non-intrusive Equipment
Many states are considering the use of non-intrusive equipment. Out of 13 states interviewed, 10 indicated they either use or are testing non-intrusive detection equipment. These devices are being tested through small pilot tests and programs. In order for state DOTs to appreciate the capabilities of non-intrusive equipment and to meet individual state requirements, it is suggested that states develop specifications or criteria that non-intrusive detectors must satisfy. These specifications or criteria would include, at a minimum, information on:
o Situations/locations where non-intrusive detectors are useful o Installation and calibration guidelines o Functionality requirements (e.g., volume accuracy, classification accuracy) o Testing procedures

HPMS AADT for High Volume Routes – Final Report 61 September 3, 2004
o Equipment specifications, including power supply issues, weather-related issues o Data polling, processing and review issues
These specifications or criteria would be useful to both state DOTs and equipment vendors. For example, Caltrans has developed guidelines/requirements for non-intrusive detectors (Microwave Vehicle Detection Systems Guidelines, 2003) [CD]. The draft guidelines are intended to help personnel in California to make educated estimates of whether microwave sensors can fulfill their requirements. The document contains checklists of requirements that must be met, test results of various microwave models, technology descriptions, and installation overviews. Also, FHWA sponsored a Field Test of Monitoring of Urban Vehicle Operations Using Non-Intrusive Technologies (FHWA-PL-97-018). The final report of the evaluation is available in html format at http://www.dot.state.mn.us/guidestar/nitfinal/about.htm
5.4.5 Testing and Evaluation Results
The rapid improvements in detection technology have resulted in various products being tried by the state DOTs. Sharing information about the capabilities or experiences with certain technologies and vendors is considered important to state DOTs. A clearinghouse of vehicle-detector information would be useful to state DOTs in comparing and selecting detection equipment. The Vehicle Detection Clearinghouse (VDC), a multi-state, pooled-fund project managed by the Southwest Technology Development Institute (SWTDI) at New Mexico State University (NMSU) (www.nmsu.edu/~traffic) and sponsored in cooperation with the U.S. DOT FHWA, is a valuable resource for information on technology, evaluation, testing results, and level of use by states. FHWA in conjunction with VDC produced a summary of vehicle detection and surveillance technologies in 2000 (“A Summary of Vehicle Detection and Surveillance Technologies used in Intelligent Transportation Systems”) [CD]. The document describes the common types of vehicle detection and surveillance technologies in terms of theory of operation, installation methods, advantages and disadvantages, summary information about performance in clear and inclement weather, as well as their relative costs. The descriptions also include vendor-provided information about specific sensor models, their functions and applications, users, and installation and maintenance costs. Martin et al., (2003) [CD].also conducted a comprehensive evaluation of vehicle detector technologies.
HPMS AADT for High Volume Routes – Final Report 62 September 3, 2004
6.0 Concluding Remarks
The practices and guidelines presented in this report are intended as a reference document for states to improve the quality of traffic data collection and processing on high-volume routes especially. The guidelines are not intended as uniform standards that all states must follow, and they are not intended to replace existing successful practices. This report and the accompanying CD are intended to serve as a resource to state DOTs by providing information on best and common practices as well as a library of additional documents produced by state DOTs. While many of the practices are common and widely known, it is expected that this compendium assembles the various approaches being used to improve HPMS traffic data collection activities especially on high-volume routes. Following are general conclusions from this examination of current data collection and processing practices. The definition of high-volume traffic routes varies from agency to agency. In fact, no state has a definition based solely on traffic volume. Rather high-volume locations are defined in terms of the difficulty in installing data-collecting equipment with safety of traffic personnel mentioned as the primary concern. It is recommended that states have adopted several practices to improve data collection, processing, and reporting for such routes. The practices are grouped into four major categories: (i) general, (ii) data collection equipment (iii) data collection, and (iv) data processing, quality control, and quality assurance. Descriptions of these practices are provided in Chapter 3 and illustrate how states address the issues and challenges, and include sources of further information and contacts. Training and guidelines for field personnel involved in installing and removing equipment was identified as crucial by many states. Approaches like ramp balancing on limited access freeways, coordinating equipment installation with construction activities, and use of safety procedures are some strategies used by state DOTs to improve their data collection efforts. It was also noted that data and resource sharing is becoming an increasingly common practice among state agencies. The use of ITS generated data for HPMS reporting is increasing. Several states like Florida, Ohio, Michigan, and Illinois have successfully used ITS data for HPMS reporting. Other states are experimenting with using ITS data sources for HPMS reporting. While quality concerns exist, ITS data have great potential especially to supplement short-term counts. Inductive loops and pneumatic road-tubes are the prevalent equipment of choice among the state DOTs. Equipment problems were common to all states interviewed, regardless of the type of equipment and traffic conditions. Several strategies are identified to improve data collection including the use of maintenance contracts, installation guidelines, the use of advanced technologies and techniques. Non-intrusive equipment are being tested by many states for data collection. Various technologies ranging from microwave, acoustic, laser, etc have been investigated by 10 of the 13 states interviewed. Descriptions of non-intrusive data collection equipment identify the limitations, advantages, and evaluation results and provide a guide to technology selection.
HPMS AADT for High Volume Routes – Final Report 63 September 3, 2004
7.0 References
AASHTO Standard Practice for Determination of International Roughness Index for Quantifying Roughness of Pavements, AASHTO PP 37-02. AASHTO, Joint Task Force on Traffic Monitoring Standards of the AASHTO Highway Subcommittee on Traffic Engineering. AASHTO Guidelines for Traffic Data Programs. American Association of State Highway and Transportation Officials, Washington, D.C., 1992. American Society for Testing and Materials (ASTM), Standard Specification and Test Methods for Highway Traffic Monitoring Devices, Review Copy: Version C for E17.52, Draft December 2002. Avis, J., Transportation System Network, Presentation at NATMEC 2002. Cunagin, W.D., A.B. Grubbs, and D.J. Vitello Jr. Development of an Overhead Vehicle Sensor System. Research Report 426-1F. Texas Transportation Institute, Texas A&M University System, College Station, TX, October 1987. Cunagin, W.D., S.O. Majdi, and H.Y. Yeom. Development of Low Cost Piezoelectric Film WIM System, Research Report 1220-1F, Texas Transportation Institute, Texas A&M University System, College Station, TX, 1991. Federal Highway Administration (FHWA), HPMS Field Manual, 2001b, http://www.fhwa.dot.gov/ohim/hpmsmanl/hpms.htm. Federal Highway Administration (FHWA), Study Tour for European Traffic Monitoring Programs and Technologies, FHWA’s Scanning Program, U.S. Department of Transportation, Federal Highway Administration, Washington D.C., August 1997. Federal Highway Administration (FHWA), Traffic Monitoring Guide, 2001, http://www.fhwa.dot.gov/ohim/tmguide/. Fekpe, E., Gopalakrishna, D., Margiotta, R., Turner, S., Middleton, D., Traffic Data Quality Workshop Proceedings and Action Plan, Report to FHWA Office of Highway Policy Information, September 2003. Florida DOT, Project Forecasting Handbook, 2002. Florida DOT, Traffic Monitoring Handbook, Transportation Statistics Office, 2002. Gillmann, R., Status of ITS Data for HPMS, Memo for FHWA, 2002. Harvey, B.A., and G.H. Champion. “Classification Algorithms/Vehicle Classification Accuracy,” presented at NATDAC96 hosted by Alliance for Transportation Research, Federal
HPMS AADT for High Volume Routes – Final Report 64 September 3, 2004
Highway Administration, and the New Mexico State Highway and Transportation Department, Albuquerque, NM, May 5-6, 1996. Heltebridle, L., Pennsylvania’s HPMS Quality Review, Presented at the HPMS Issues Workshop, Chicago, August 2002 Institute of Transportation Engineers (ITE), The Traffic Detector Handbook, Second Edition, Washington, D.C., 1991. Labell, L.N., and A.D. May. Detectors for Freeway Surveillance and Control: Final Report. Institute of Transportation Studies. University of California at Berkeley, Berkeley, CA, 1990. Labi, S., and Fricker, J.D., “Assessing and Updating INDOT’s Traffic Monitoring System for Highways”, FHWA/IN/JTRP-98/12, 2001. Available at http://rebar.ecn.purdue.edu/JTRP_Completed_Project_Documents/HPR%5F0438/FinalReport/Hpr_0438_final_Prelude.pdf Margiotta, R., State of the Practice for Traffic Data Quality, White Paper for FHWA Office of Policy, http://www.itsdocs.fhwa.dot.gov/JPODOCS/REPTS_TE/13768.html, 2003. Martin.P.,, Feng.Y., Wang.X., Detector Technology Evaluation, Department of Civil and Environmental Engineering, University of Utah Traffic Lab, November 2003. Middleton, D., R. White, and J. Crawford. Initial Evaluation for Traffic Monitoring Equipment Evaluation Facility. Report FHWA/TX-04/0-4664-1, Texas Transportation Institute, Texas A&M University, College Station, TX, May 2004. Middleton, D. and R. Parker. Initial Evaluation of Selected Detectors to Replace Inductive Loops on Freeways, Research Report FHWA/TX1439-7, Texas Transportation Institute, College Station, TX, April 2000. Middleton, D., and Parker, R., Evaluation of Promising Vehicle Detection Systems, Research Report FHWA/TX-03/2119-1, Draft, Texas Transportation Institute, College Station, TX, October 2002. Middleton, D., Jasek, D., Charara, H., and Morris, D. Evaluation of Innovative Methods to Reduce Stops to Trucks at Isolated Intersections, Study No. 7-2972, Research Report TX 97/2972-1S, Sponsored by the Texas Department of Transportation, Austin, TX, August 1997. Minnesota DOT (MnDOT), Phase II Evaluation of Non-Intrusive Technologies for Traffic Detection, Final Report, St. Paul, MN, September 2002. NYSDOT, Highway Data Services Bureau, Loop/Piezo Automatic Traffic Recorder specification, September 2001 Texas Transportation Institute (TTI), Texas Traffic Signal Detector Manual. Texas Transportation Institute Report 1163-1. Texas A&M University, Texas A&M University System, College Station, TX, July 1992.
HPMS AADT for High Volume Routes – Final Report 65 September 3, 2004
Triplett, R. and Avis, J., Sensor Sharing Project, Presentation at NATMEC 2002. Tyburski, R.M. “A Review of Road Sensor Technology for Monitoring Vehicle Traffic,” Institute of Transportation Engineers Journal, Volume 59, Number 8, Institute of Transportation Engineers, Washington D.C., August 1989. Volpe National Transportation Systems Center, An Overview of Traffic Monitoring Programs in Large Urban Areas, Report for FHWA Office of Information Management, July 1997. Volpe National Transportation Systems Center, Case Studies of Traffic Monitoring Programs in Large Urban Areas, Report for FHWA Office of Information Management, July 1997b. Washington DOT, Short Term Count Factoring Guide, 2003. Woods, D.L., J.D. Blaschke, and H.G. Hawkins. A Short Course on Traffic Signal Design. Texas Transportation Institute, Texas A&M University System, College Station, TX, November 1986. Wright, T., Hu, P.S., et al. Variability in Traffic Monitoring Data, Oak Ridge National Laboratory, August 1997.
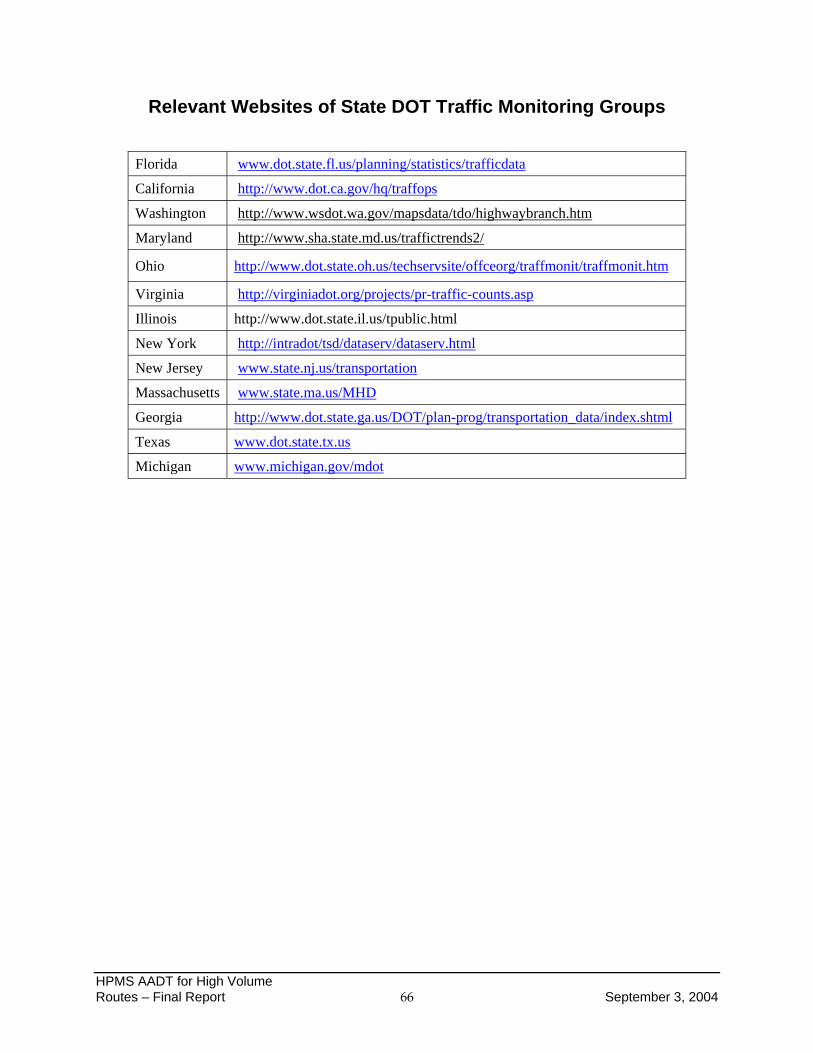
HPMS AADT for High Volume Routes – Final Report 66 September 3, 2004
Relevant Websites of State DOT Traffic Monitoring Groups
Florida www.dot.state.fl.us/planning/statistics/trafficdata
California http://www.dot.ca.gov/hq/traffops
Washington http://www.wsdot.wa.gov/mapsdata/tdo/highwaybranch.htm
Maryland http://www.sha.state.md.us/traffictrends2/
Ohio http://www.dot.state.oh.us/techservsite/offceorg/traffmonit/traffmonit.htm
Virginia http://virginiadot.org/projects/pr-traffic-counts.asp
Illinois http://www.dot.state.il.us/tpublic.html
New York http://intradot/tsd/dataserv/dataserv.html
New Jersey www.state.nj.us/transportation
Massachusetts www.state.ma.us/MHD
Georgia http://www.dot.state.ga.us/DOT/plan-prog/transportation_data/index.shtml
Texas www.dot.state.tx.us
Michigan www.michigan.gov/mdot
HPMS AADT for High Volume Routes – Final Report 67 September 3, 2004
List of Interviewees
Joe Avis Chief Traffic Data and Photolog Unit Division of Traffic Operations California Department of Transportation (Caltrans) [email protected] Ph: (916) 654-3072 Brian Domsic Division of Transportation System Information California Department of Transportation (Caltrans) Ph: (916) 653-3272 Fax: (916) 654-6583 [email protected] Jim Neidigh Transportation Planning & Programming Division Texas Department of Transportation (TxDOT) Ph: (512) 486-5137 [email protected] Rob Robinson Data Management Unit Chief Illinois Department of Transportation (IDOT) Ph: (217) 785-2353 Fax: (217) 524-6251 [email protected] Harshad Desai (formerly) Manager, Traffic Data Section Florida DOT (FDOT) Ph: (850) 414-4718 [email protected] (now) Office of Highway Policy Information Federal Highway Administration (202) 366-5047 [email protected]
Nabeel Akhtar Florida Department of Transportation (FDOT) [email protected] David Gardner Manager, Traffic Monitoring Section Ohio Department of Transportation Ph: (614) 752-5740 [email protected] Tony Manch Engineer, Office of Technical Services Ohio Department of Transportation (ODOT) [email protected] Ph: (614) 466-3075 Mike Baxter Assistant Division Chief, HISD Database Management, Traffic Monitoring, HPMS, Road Inventory Maryland State Highway Administration Ph: (410) 545-5511 Fax: (410) 209-5033 [email protected] Mike Walimaki Supervisor, Travel Information Unit Data Collection Section Asset Management Division Michigan Department of Transportation (MDOT) Ph: (517) 335-2914 [email protected] Tom Schinkel Virginia DOT, Planning Ph: (804) 225-3123 Fax: (804) 371-0190 [email protected]
HPMS AADT for High Volume Routes – Final Report 68 September 3, 2004
John Rosen Highway Usage Branch Manager Washington DOT (WsDOT) [email protected] David Adams Office of Transportation Data Georgia Department of Transportation [email protected] Ph: (770) 986-1364 Todd Westhuis NYSDOT Highway Data Services Bureau Traffic Monitoring Section Supervisor Ph: (518) 457-7203 [email protected]
Louis Whiteley Section Chief, Traffic and Technology Section New Jersey DOT (NJDOT) [email protected] Philip Hughes Contracts/Agreements Administrator Massachusetts Highway Department [email protected] Ph: (617) 973-7330
HPMS AADT for High Volume Routes – Final Report 69 September 3, 2004
Glossary
Annual Average Daily Traffic (AADT) The estimate of typical daily traffic on a road segment for all days of the week, Sunday through Saturday, over the period of one year. Average Daily Traffic (ADT) The total traffic volume during a given time period (more than a day and less than a year) divided by the number of days in that time period. Automatic Traffic Recorder (ATR) A device that records the continuous passage of vehicles across a given section of roadway by hours of the day, days of the week or months of the year. ATR Counts Base traffic counts recorded at an automatic traffic recorder. Automatic Vehicle Classifier AVC) A device that works in conjunction with computerized electronic equipment that counts and classifies vehicles by type and axle configuration. Axle Correction Factor The factor developed to adjust vehicle-axle sensor-base data for the incidence of vehicles with more than two axles, or the estimate of total axles based on automatic vehicle classification data divided by the total number of vehicles counted. Count The data collected as a result of measuring and recording traffic characteristics such as vehicle volume, classification, speed, weight, or a combination of these characteristics. Count Period The beginning and ending date and time of traffic characteristic measurement. Count Type The traffic characteristic being measured, the measurement device, and time period. Coverage Count A traffic count taken as part of the requirement for system-level estimates of traffic. The count is typically short-term, and may be volume, classification, or Weigh-in-Motion. Functional Classification The grouping of streets and highways into classes, or systems, according to the character of service they are intended to provide. The recognition that individual roads do not serve travel independently and most travel involves movement through a network of roads is basic to functional classification.
HPMS AADT for High Volume Routes – Final Report 70 September 3, 2004
Geographic Information System GIS) A method of storing, analyzing, and displaying spatial data. Highway Performance Monitoring System (HPMS) A federally mandated data reporting system for all roads except local. Intelligent Transportation System (ITS) A system that employs electronics, communications, and/or information processing to improve the efficiency of surface transportation operations and provide real-time information about travel options. Loop Detector A detector that senses changes in inductance, of its inductive loop sensor, caused by the passage or presence of a vehicle near the sensor. Manual Counts Measurement of traffic characteristics based on human observation, which may or may not be electronically recorded. Metropolitan Planning Organization (MPO) Regional agency responsible for urbanized area transportation planning. National Highway System (NHS) A designated system of highways of National Significance mandated under the Intermodal Surface Transportation Efficiency Act of 1991. The purpose of the NHS is to provide an interconnected system of principal arterial routes to serve major population centers, airports and public transportation facilities, to meet national defense requirements and to serve interstate and interregional travel. Permanent Count Stations ATRs that are permanently placed at specific locations throughout the region to record the distribution and variation of traffic flow by hours of the day, days of the week, and months of the year from year to year. Seasonal Factors Parameters used to adjust base counts that consider travel behavior fluctuations by day of the week and month of the year. Strategic Highway Research Program (SHRP) A five-year program for pavement and operations research funded by Congress and managed through the National Academy of Sciences. One of the four research areas, Long-term Pavement Performance, is planned as a 20-year program. Traffic Management Center (TMC) Also known as Traffic Operations Center, it serves as the nerve center for a traffic management system. Data on traffic conditions collected in real time by any of a variety of means are

HPMS AADT for High Volume Routes – Final Report 71 September 3, 2004
transmitted to the TMC where traffic engineers, assisted by computer, monitor traffic flow and respond to congestion in a variety of ways, such as adjusting traffic signal timing or transmitting information on current conditions to motorists via changeable message signs. Traffic Monitoring Guide (TMG) Document that provides FHWA’s recommended approach to the monitoring of traffic characteristics. The guide provides direction for persons interested in conducting a statistically based monitoring of traffic counting, vehicle classification, and truck weighing. Traffic Program The collection, editing, summarization, reporting, and analysis of traffic volume, classification, and weight data. Vehicle Classification The measurement, summarization, and reporting of traffic volume by vehicle type and axle configuration. Vehicle Miles Traveled (VMT) Average Sunday through Saturday vehicle movement on a specific road segment multiplied by the length of the road segment, reported in the form of daily and annual VMT. Weigh-in-Motion (WIM) The process of estimating a moving vehicle’s static gross weight and the portion of that weight that is carried by each wheel, axle, or axle group or combination thereof, by measurement and analysis of dynamic forces applied by its tires to a measuring device.

A-1
Appendix A:
Guide to CD
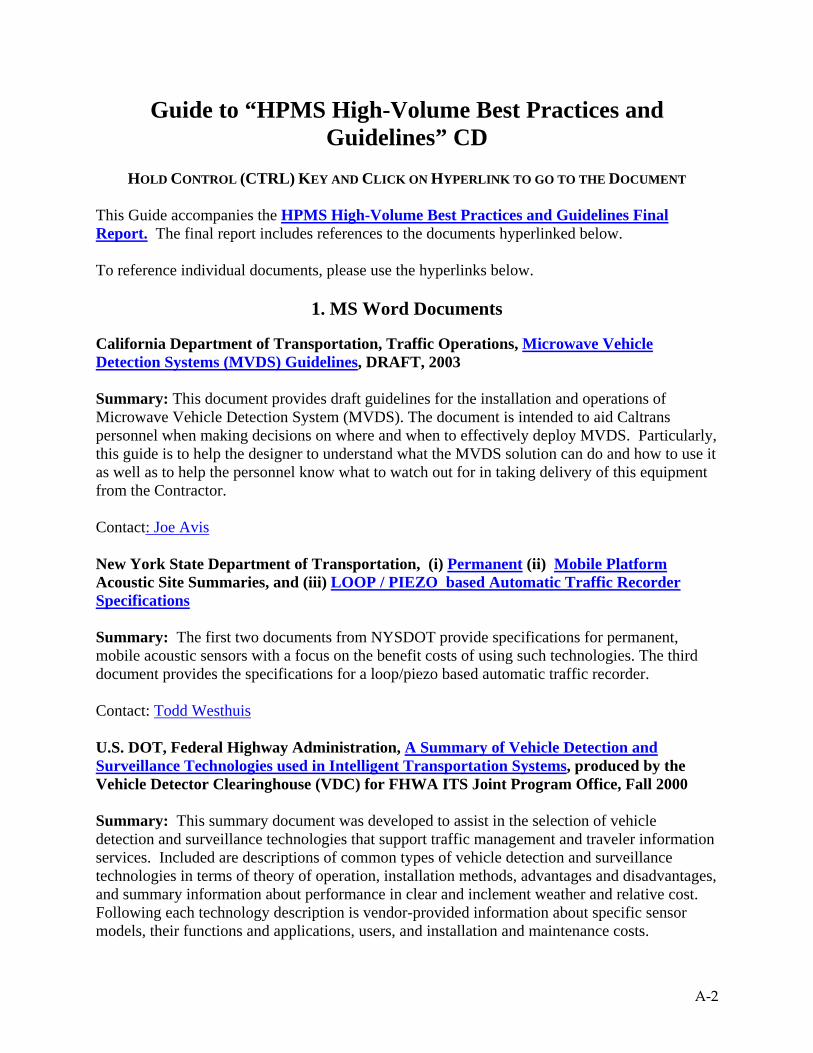
A-2
Guide to “HPMS High-Volume Best Practices and Guidelines” CD
HOLD CONTROL (CTRL) KEY AND CLICK ON HYPERLINK TO GO TO THE DOCUMENT
This Guide accompanies the HPMS High-Volume Best Practices and Guidelines Final Report. The final report includes references to the documents hyperlinked below. To reference individual documents, please use the hyperlinks below.
1. MS Word Documents California Department of Transportation, Traffic Operations, Microwave Vehicle Detection Systems (MVDS) Guidelines, DRAFT, 2003 Summary: This document provides draft guidelines for the installation and operations of Microwave Vehicle Detection System (MVDS). The document is intended to aid Caltrans personnel when making decisions on where and when to effectively deploy MVDS. Particularly, this guide is to help the designer to understand what the MVDS solution can do and how to use it as well as to help the personnel know what to watch out for in taking delivery of this equipment from the Contractor. Contact: Joe Avis New York State Department of Transportation, (i) Permanent (ii) Mobile Platform Acoustic Site Summaries, and (iii) LOOP / PIEZO based Automatic Traffic Recorder Specifications Summary: The first two documents from NYSDOT provide specifications for permanent, mobile acoustic sensors with a focus on the benefit costs of using such technologies. The third document provides the specifications for a loop/piezo based automatic traffic recorder. Contact: Todd Westhuis U.S. DOT, Federal Highway Administration, A Summary of Vehicle Detection and Surveillance Technologies used in Intelligent Transportation Systems, produced by the Vehicle Detector Clearinghouse (VDC) for FHWA ITS Joint Program Office, Fall 2000 Summary: This summary document was developed to assist in the selection of vehicle detection and surveillance technologies that support traffic management and traveler information services. Included are descriptions of common types of vehicle detection and surveillance technologies in terms of theory of operation, installation methods, advantages and disadvantages, and summary information about performance in clear and inclement weather and relative cost. Following each technology description is vendor-provided information about specific sensor models, their functions and applications, users, and installation and maintenance costs.
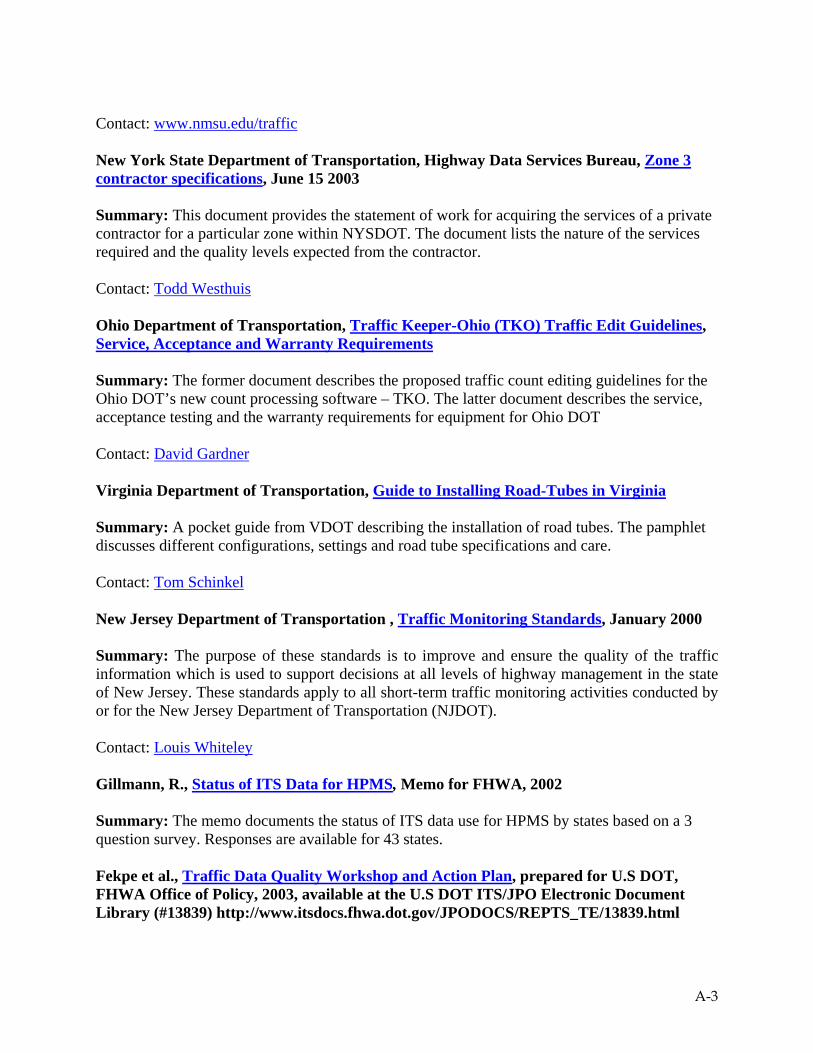
A-3
Contact: www.nmsu.edu/traffic New York State Department of Transportation, Highway Data Services Bureau, Zone 3 contractor specifications, June 15 2003 Summary: This document provides the statement of work for acquiring the services of a private contractor for a particular zone within NYSDOT. The document lists the nature of the services required and the quality levels expected from the contractor. Contact: Todd Westhuis Ohio Department of Transportation, Traffic Keeper-Ohio (TKO) Traffic Edit Guidelines, Service, Acceptance and Warranty Requirements Summary: The former document describes the proposed traffic count editing guidelines for the Ohio DOT’s new count processing software – TKO. The latter document describes the service, acceptance testing and the warranty requirements for equipment for Ohio DOT Contact: David Gardner Virginia Department of Transportation, Guide to Installing Road-Tubes in Virginia Summary: A pocket guide from VDOT describing the installation of road tubes. The pamphlet discusses different configurations, settings and road tube specifications and care. Contact: Tom Schinkel New Jersey Department of Transportation , Traffic Monitoring Standards, January 2000 Summary: The purpose of these standards is to improve and ensure the quality of the traffic information which is used to support decisions at all levels of highway management in the state of New Jersey. These standards apply to all short-term traffic monitoring activities conducted by or for the New Jersey Department of Transportation (NJDOT). Contact: Louis Whiteley Gillmann, R., Status of ITS Data for HPMS, Memo for FHWA, 2002 Summary: The memo documents the status of ITS data use for HPMS by states based on a 3 question survey. Responses are available for 43 states. Fekpe et al., Traffic Data Quality Workshop and Action Plan, prepared for U.S DOT, FHWA Office of Policy, 2003, available at the U.S DOT ITS/JPO Electronic Document Library (#13839) http://www.itsdocs.fhwa.dot.gov/JPODOCS/REPTS_TE/13839.html
A-4
Summary: The quality of the traffic data and the information produced from the data are critical factors that affect the abilities of transportation agencies to ensure the security of transportation and the management of the nation’s transportation resources. The focus of data quality is on establishing a consistent methodology for ensuring that data are managed so that a measure of reliability is sustained. The report defines an action plan to address traffic data quality issues including work items that can be executed through the U.S. Department of Transportation (DOT), stakeholder organizations (e.g., American Association of State Highway Transportation Officials [AASHTO], ITS America), and state DOTs.
2. Adobe Acrobat PDF Documents U.S. Department of Transportation, Office of Policy, Traffic Monitoring Guide, 2001 Summary: The TMG offers suggestions to help improve and advance current programs with a view towards the future of traffic monitoring. A basic program structure for traffic monitoring is presented. The guide provides specific examples of how statewide data collection programs should be structured, describes the analytical logic behind that structure, and provides the information highway agencies need to optimize the framework for their particular organizational, financial, and political structures. Mergel, J., Case Studies of Traffic Monitoring Programs in Large Urban Areas, prepared by Volpe National Transportation Systems Center, July 1997 Summary: The paper documents a series of examples of urban traffic monitoring data collection programs in order to support the development of urban traffic monitoring databases and promote the upgrading of urban traffic monitoring programs. Examples include – Philadelphia, Portland, Minneapolis-St. Paul and the Tampa metropolitan area. Mergel, J., An Overview of Traffic Monitoring Programs in Large Urban Areas, prepared by Volpe National Transportation Systems Center, July 1997 Summary: The document provides an overview of traffic monitoring programs with a focus on case studies, or model approaches on urban traffic monitoring data collection programs in large urban areas. This report documents the status of traffic monitoring data collection and program activities found in urbanized areas, including cost, staffing, organization, institutional arrangements, equipment used, sharing of data, uses of the data, problems encountered, etc based on a survey of local traffic data collection personnel. Choe, T., Skabordonis, A., Variya, P., Freeway Performance Measurement System (PeMS): An operational analysis tool, for presentation and publication in the 81st TRB Annual Meeting, 2002 Summary: Performance Measurement Systems (PeMS) is a freeway performance measurement system for loop detector data for all of California. The paper describes the use of PeMS in
A-5
conducting operational analysis, planning and research studies. The advantages of PeMS over conventional study approaches is demonstrated from case studies on conducting freeway operational analyses, bottleneck identification, Level of Service determination, assessment of incident impacts, and evaluation of advanced control strategies. Contact: PEMS Website New York State Department of Transportation, Highway Data Services Bureau, Traffic Count Editor: User Manual and System Documentation, February 2003 Summary: This document provides user and technical documentation for the Traffic Count Editor, the software program used by New York State DOT. The document also lists the business rules or the validity checks provided by the software. Contact: Todd Westhuis Washington Department of Transportation, Safety Zones for Traffic Monitoring, Regions: Eastern, North Central, North Western, South Central, South Western, Olympia Summary: Washington State identified safety zone maps for installation of data collection equipment. Zones are differentiated based on crew requirements and time-of-day constraints. These zones were not identified strictly based on traffic volume but a combination of traffic and roadway characteristics. Contact: John Rosen Washington Department of Transportation, Short Count Factoring Guide, June 2004 Summary: This guide was created to promote good practice and uniformity in techniques being used for traffic counting and the estimation of Annual Average Daily Traffic (AADT) figures from short duration count data. It is an informational guide to encourage high standards and uniform practices among traffic counting programs for accurate representation of traffic on our public roadways is available to all interested parties. Contact: John Rosen California Department of Transportation, HPMS Workbook, 2002 Summary: The California Department of Transportation, Division of Transportation System Information, Highway Performance Branch, in cooperation with the U.S. Department of Transportation, Federal Highway Administration, prepared this workbook as a guide for reporting the federally mandated HPMS data. Contact: Brian Domsic Peter Martin et al, Detector Technology Evaluation, November 2003
A-6
Summary: This paper reports on the present status of detector technologies and on development trends in these technologies. This report designs a systematic selection method suitable for permanent applications. The selection method considers factors including data type, data accuracy (in different environmental and traffic conditions), ease of installation and calibration, costs, reliability, and maintenance. A variety of detector technologies and devices are compared. This report provides comparison matrixes based on detector technology and specific devices in this field of technology. The technology matrixes offer general information about each detector technology. The device matrixes give specific information regarding each particular detector device. Selecting an appropriate device is more important than choosing a specific technology. The matrixes must be continuously updated to reflect changes in the detector market. Maryland State Highway Administration, Specification for Consulting Services for the collection of Manual Traffic and Portable Machine Counts and On-Site Traffic Engineering and Highway Engineering Assistance, 09/2004 Summary: The document describes the scope of work, requirements and qualifications for contractors to perform traffic counts in the state of Maryland as part of a task-order contract. Contact: Mike Baxter Battelle, Traffic Data Quality Measurement Framework, prepared for U.S DOT FHWA Office of Highway Policy Information, 2004, DRAFT Summary: The report describes methods and tools to enable traffic data collectors and users to determine the quality of traffic data they are providing, sharing, and using. This report presents the framework that provides methodologies for calculating the data quality metrics for different applications and illustrates them with case study examples. The report also presents guidelines and standards for calculating data quality measures that are intended to address the following key traffic data quality issues: • Defining and measuring traffic data quality • Quantitative and qualitative metrics of traffic data quality • Acceptable levels of quality • Methodology for assessing traffic data quality.
3. MS Excel Documents
California Department of Transportation, Ramp Balancing Process, Computational Worksheet Summary: The document from Caltrans provide more information about the processing of traffic data with some sample spreadsheets used for ramp balancing by the district offices. Contact: Joe Avis
A-7
4. MS PowerPoint Files Pennsylvania Department of Transportation, PennDOT Quality Reviews, 2002. Summary: The PowerPoint presentation discusses Pennsylvania DOT’s HPMS Quality review approach. The purposes of the review are to ascertain the current state of HPMS data quality, ensure that errors found are corrected, and identify training needs and institutional issues. The presentation provides an example of an approach to train and ensure good quality data from MPOs, city and local agencies involved in data collection and reporting Contact: Laine Heltebridle
5. Florida DOT’s Traffic Monitoring Handbook (includes video) Florida Department of Transportation, Transportation Statistics Office, Traffic Monitoring Handbook, October 2002 Summary: The traffic monitoring handbook is Florida DOT’s comprehensive document on all traffic monitoring related issues including data collection and processing guidelines. The handbook contains many useful videos about traffic monitoring. Contact: Nabeel Akhtar
Highlights of Traffic Monitoring Handbook: Florida Department of Transportation, Safety Video for Field Personnel Summary: The short video provides guidance on safely installing traffic detectors. Florida Department of Transportation, Standardization of Count and Classification equipment set-up and configuration process, prepared by PB Farradyne, 1995 Summary: The report outlines the steps needed to set-up and configure Florida DOT’s traffic monitoring equipment to ensure uniform, complete and consistent outputs. Florida Department of Transportation, Survey Processing Software (SPS) User Manual, June 2001 Summary: The report provides a user manual for Survey Processing Software (SPS), Version 3.2 which is used by Florida DOT to process short-term count data. The software was developed to provide the Florida DOT District Offices with software that can transfer data from a variety of highway traffic counters to PCs, perform standards editing, and then transfer summarized classification and count data statistics from their PC to the FDOT mainframe. The software will also download the station inventory from the mainframe to the District PC.
A-8
Contact List
Joe Avis
Chief Traffic Data and Photolog Unit Division of Traffic Operations California Department of Transportation (Caltrans) [email protected] Ph: (916) 654-3072
Brian Domsic
Division of Transportation System Information California Department of Transportation (Caltrans) Ph: (916) 653-3272 Fax: (916) 654-6583 [email protected]
Nabeel Akhtar
Florida Department of Transportation (FDOT) [email protected]
David Gardner
Manager, Traffic Monitoring Section Ohio Department of Transportation Ph: (614) 752-5740 [email protected]
Mike Baxter
Assistant Division Chief, HISD Database Management, Traffic Monitoring, HPMS, Road Inventory Maryland State Highway Administration Ph: (410) 545-5511 Fax: (410) 209-5033 [email protected]
Mike Walimaki
Supervisor, Travel Information Unit Data Collection Section Asset Management Division
Michigan Department of Transportation (MDOT) Ph: (517) 335-2914 [email protected]
Tom Schinkel
Virginia DOT, Planning Ph: (804) 225-3123 Fax: (804) 371-0190 [email protected]
John Rosen
Highway Usage Branch Manager Washington DOT (WsDOT) [email protected]
Todd Westhuis
NYSDOT Highway Data Services Bureau Traffic Monitoring Section Supervisor Ph: (518) 457-7203 [email protected]
Philip Hughes
Contracts/Agreements Administrator Massachusetts Highway Department [email protected] Ph: (617) 973-7330
Louis Whiteley
Section Chief, Traffic and Technology Section New Jersey DOT (NJDOT) [email protected].