Embed Size (px)
Citation preview

Best-Practice Trapping of Ferret Populations
Grant Norbury, Nick Spencer, Ray Webster Landcare Research PO Box 69, Lincoln 8152 New Zealand
Joe Bailey, Ron Walker, Rick Wilson Southern Pest Management PO Box 179, Mosgiel New Zealand
Mark Hunter, Craig Reed Environment Southland Private Bag 90116, Invercargill New Zealand
Landcare Research Contract Report: LCOOOl/140 (revised version)
PREPARED FOR: Animal Health Board PO Box 3412, Wellington
DATE: February 2002
ISO 14001

Reviewed by:
Dr Andrea Byrom Scientist Landcare Research
Approved for release by:
Dr Phil Cowan Science Manager - Biosecurity and Pest Management Landcare Research
© Landcare Research New Zealand Ltd 2002
No part of this work covered by copyright may be reproduced or copied in any form or by any means (graphic, electronic or mechanical, including photocopying, recording, taping, information retrieval systems, or otherwise) without the written permission of the publisher.
The findings in this report are specific to this project. Landcare Research accepts no responsibility where information in the report is used for any other purpose, and will not be liable for any loss or damage suffered as a result of such other use.

3
Contents
Summary ........................................................................................................................... 5
1. Introduction ....................................................................................................................... 7
2. Background ....................................................................................................................... 7
3. Objectives .......................................................................................................................... 7
4. Methods ............................................................................................................................. 7
5. Results ............................................................................................................................... 8
5 .1 Test of rainfall .......................................................................................................... 8
5.2 Other factors ............................................................................................................. 8
6. Discussion ....................................................................................................................... 12
7. Recommendations ........................................................................................................... 13
8. Acknowledgements ......................................................................................................... 14
9. References ....................................................................................................................... 14
10. Appendices ...................................................................................................................... 15
10.1 Trap codes .............................................................................................................. 15
10.2 Habitat codes .......................................................................................................... 16
10.3 Bait codes ............................................................................................................... 22
Landcare Research

4
Landcare Research

5
Summary
Project and Client The Animal Health Board commissioned Landcare Research to analyse a database (owned by Environment Southland and Southern Pest Management) on ferret control operations in Southland and Otago to determine trap-set characteristics that maximise ferret captures. The analysis was carried out from September 2000 to March 2001.
Objectives
• Determine from an existing database on ferret control operations, the optimum characteristics of traps that maximise ferret captures.
• Identify ways of improving the utility of the database by reducing the effects of confounded variables, and by streamlining data entry.
Methods
• Data were collected by Environment Southland and Southern Pest Management in 1999 and 2000. We analysed 3,677 ferret captures taken over 320,818 corrected trap nights (representing a trap rate of 1.1 % ).
• Generalised linear models were fitted and compared using likelihood-ratio tests to test for relationships between ferret capture rates and the trap-set characteristics, bait type, trap type, habitat, temperature, McLean score (high or low), and rainfall (high or low).
• Too many types of trap-set characteristics were listed to enable sensible interpretation of the analysis. This was overcome by pooling category types.
• Models included only up to second-order interactions (e.g., does the effect of bait depend on trap type?). Estimating higher order effects was not worthwhile due to the sparseness of the data, and many combinations of trap-set characteristics were absent (e.g., Fenn traps were not used with possum bait).
Results
• Timms tunnel traps often caught the most ferrets, particularly in bush, bush edge, and culverts (2.0 - 2.3% trap-catch rate), and on nights with dew or frost (2.1 % and 2.5%, respectively).
• Victor traps also caught relatively high numbers of ferrets, but only on bushedgefenceline boundaries. Victor traps with wire covers (Victor cages) also caught relatively high ferret numbers, but only around offal pits, and especially during frosts. Fenn tunnel traps also had high catch rates, mainly along fencelines, culverts, and waterways, and during warm or cold conditions. However, Fenn traps are not recommended because they are unacceptably inhumane.
• Timms traps (without tunnels) performed more consistently than other traps types in all conditions, though maximum ferret captures were not apparent in any particular habitat.
• Rabbit was the most consistent bait and was especially effective on bushedge-fenceline boundaries and in Fenn tunnels. Possum bait performed even better along waterways and in Timms tunnels and Victor cages. Possum bait may be equally effective in other habitats and traps, but this requires further investigation.
• Rabbit appeared to be the most effective bait where rabbit abundance was relatively high, as did possum bait where rabbit abundance was relatively low.
Landcare Research

6
• Rainfall and temperature had either no relationship, or an inconsistent relationship, with catch rates of ferrets.
• The quality of data was sometimes undermined by pest contractors using inconsistent definitions of trap-set characteristics, despite their being provided with strict definitions.
Discussion
• Although Timms traps appear to be the best option, there are often difficulties obtaining permission from landholders to use them near houses because these traps also kill cats. Victor traps or Victor cages are recommended in this case.
• Timms traps (and perhaps Victor cages) might catch more ferrets because they catch fewer non-target species, thereby making more trap nights available to catch ferrets.
• The potentially high attractiveness of possum meat is reinforced by the fact that possum meat is used as bait mostly in areas where rabbits are less obtainable, and therefore where ferrets are less abundant.
• There was some evidence that linear features (e.g., fencelines, bushedges, waterways) were attractive to ferrets.
• Because all trap sites have GPS coordinates, a spatial analysis of the database could be undertaken to see if ferret capture rates are spatially clustered. If captures are clustered, and trap-set characteristics are not, this would suggest that ferret density may partly confound the results.
• This analysis of correlative data can only be a guide to best practice. The relative ability of rabbit and possum meat to attract ferrets, and the relative efficacy of Timms traps, Victor traps, and Victor cages, are best determined from field experiments.
Recommendations
• Because the data were not collected in a random fashion, there is the potential for variables to be confounded with ferret density. We therefore emphasise that care be taken when using the guidelines from this study.
• Where possible, Timms traps (with or without tunnels) should be used, and baited with either rabbit or (pending further investigation) possum meat. Victor traps or Victor cages should be used where Timms traps cannot.
• Greatest ferret captures will be obtained by placing traps in areas with highest rabbit abundance. However, because there are generally more ferrets where there are more rabbits, this may not necessarily maximise reductions in ferret populations.
• The guidelines that have emerged from the database are useful, but we suggest that future expenditure on data collection is better utilised by contributing to field experiments to test some of the hypotheses raised.
• Such experiments should test whether possum bait has the ability to catch more ferrets than rabbit bait, and whether Victor traps or Victor cages catch more ferrets than Timms traps.
• If the same sort of data collection is continued, we suggest that fewer types of trap-set characteristics be recorded, that steps be taken to ensure contractors adhere to strict definitions, and that data are captured electronically by recording trap-set characteristics in the GPS way-points for each trap location. Most importantly, we recommend that in order to minimise the confounding effects of ferret density, data are collected in a random fashion by ensuring that variable types are randomised across the landscape.
Landcare Research

7
1. Introduction
The Animal Health Board commissioned Landcare Research to analyse a database (owned by Environment Southland and Southern Pest Management) on ferret control operations in Southland and Otago to determine trap-set characteristics that maximise ferret captures. The analysis was carried out from September 2000 to March 2001.
2. Background
Reducing the threat that ferrets pose to the spread and transmission of bovine Tb requires cost-effective tools for reducing their abundance. Trapping is currently the primary tool for controlling ferret populations. There are many ways that traps can be presented to ferrets, and indeed, each pest control contractor has their own view on what makes the perfect set. There has been no formal study of the conditions that maximise ferret trap-catch rates, although Clapperton (2001) recently reviewed habitat preferences by ferrets. In the absence of experimental evidence that tests the conditions that maximise trap-catch rates, the success or failure of commercial contractors are all we have to go on.
3. Objectives
• Determine from an existing database on ferret control operations, the optimum characteristics of traps that maximise ferret captures.
• Identify ways of improving the utility of the database by reducing the effects of confounded variables, and by streamlining data entry.
4. Methods
Ferret capture data were collected in Southland and Otago by commercial contractors employed by Environment Southland and Southern Pest Management in 1999 and 2000, and entered into a relational database (Microsoft ACCESS). The database matches ferret captures with trap type, habitat, bait, time of year (February to May), GPS coordinates, weather, and local abundance of rabbits. We analysed 3,677 ferret captures taken over 320,818 corrected trap nights. This represents a trap-catch rate of 1.1 %.
Data were analysed by fitting generalised linear models for count data (Poisson models) in the statistics computer program, S-PLUS. Nested models were compared using likelihood-ratio tests in order to test for relationships between ferret trap-catch and the independent variables. Models included only up to second-order interactions (e.g., does the effect of bait depend on trap type?). Estimating higher order effects was not worthwhile due to the sparseness of the data, and many combinations of factors were absent (e.g., Fenn traps were not used with possum bait).
Landcare Research

8
The data were not collected in a purely random fashion. Traps were set in clusters along trap lines (mostly at intervals of 50-100 m), trap lines were not assigned randomly to different areas, and they were subjected to repeated measures during one-off periods of mostly 10 consecutive nights. Ideally these effects would be explicitly accounted for in the statistical modelling. We could only do this to a limited degree. The clustering of trapping effort is likely to lead to over-dispersed data (variance greater than mean). We allowed for this overdispersion by using the approximate F-tests detailed in McCullagh & Nelder (1989), rather than the usual chi-squared tests.
Because of the sparseness of the data, it was necessary to simplify the analysis by pooling variable categories (see Appendix). Pooling was also required where pest contractors used inconsistent definitions of category types.
The dependent variable was counts of ferret captures, and the independent variables were bait type, trap type, habitat, temperature (cold, dew, frost, mild, warm), rabbit abundance (low McLean score = 1,2 (none or very infrequent rabbit sign or sightings); high McLean score = 3,4,5,6 (some or very abundant rabbit sign or sightings)), and rainfall (low = <10 mm per night; high = > 10 mm per night). The varying numbers of traps used for each combination of the independent variables were accounted for by including log( corrected number of trap nights) as an offset term. This effectively makes the response variable log(captures/trap night), the natural logarithm of trap catch. The number of trap nights was corrected for traps set-off and non-target captures.
5. Results
5.1 Test of rainfall
Using the classification of "low" and "high" rainfall, there was no evidence that rainfall was a useful predictor of ferret catch (F30,1740=0.93, P=0.574: combined test of main effect and all second-order interactions with rainfall).
5.2 Other factors
All other independent variables were significant predictors of ferret catch, with each variable interacting in some way with at least one other (Table 1).
Table 1 Statistically significant second-order interactions Interaction F value P value
trap*habitat F6s,1233= 1.68 0.001
trap*temperature F2s,1233= 1.83 0.006
bait*habitat Fn,1233=1.43 0.012
bait*trap F33,1233=1.50 0.034
McLean score*bait F4,1233=2.59 0.038
Landcare Research

9
Trap*habitat This interaction can be interpreted using the mean catches in Table 2. It is clear that some traps have higher catches than others, and that the performance of some trap types depends on the habitat in which they are set. It is important to consider the standard errors in this table: many combinations of factors had few trap nights, and this is reflected in high standard errors. The estimated catch rates for these are imprecise, and so are less reliable than more frequently observed combinations. Such values are given less weight in the discussion that follows.
Good catches were made using Timms tunnels, especially in bush, bush edge and culverts. Timms .traps without tunnels were more consistent, though maximum ferret captures were not apparent in any particular habitat - the best being waterways. Victor traps had high mean catches along bushedge-fenceline boundaries, as did Victor cages in offal pits. Captures in Fenn tunnels were more erratic but they had relatively good catches along fencelines, culverts, and waterways. Other trap types either performed poorly, or high catches were accompanied by high standard errors making the estimates unreliable (e.g., Fenn tunnels in buildings and pad runs).
Table 2 Mean catch rate and standard errors (in brackets) for trap*habitat interactions. High catch rates (:?. 1.8%) with low standard errors (::;; 1.0%) are highlighted. Approximate 95% confidence intervals for catch rates = ± 2 standard errors. NA= insufficient data available.
Trap
Timms Timms Victor Victor Victor Fenn tunnel Gin Misc. Habitat tunnel tunnel cage
Mean catch/trap night ( % )
Fenceline 0.9 (0.1) 1.0 (0.2) 0.9 (0.1) 1.5 (0.2) 1.1 (0.1) L9 (0.5) 1.2 (0.5) 0.9 (0.8) Building 1.1 (0.2) 1.2 (0.3) 0.7 (0.4) 0.6 (0.4) 0.7 (0.2) 3.3 (1.5) <0.05 (0.1) <0.05 (0.1) Bush 1.5 (0.2) 2.3 (0.5) 0.8 (0.2) 1.3 (0.2) 1.2 (0.2) 1.5 (0.9) 0.5 (0.3) <0.05 (0.3) Bushedge 1.2 (0.2) 2.0 (0.4) 0.8 (0.3) 0.6 (0.2) 0.8 (0.1) 1.4 (0.7) 3.1 (3.0) <0.05 (0.6) Bushedge I 1.1 (0.3) 0.9 (0.6) 1.9 (0.8) 0 (0) 1.7 (0.2) 0 (0) NA NA Fenceline
Culvert 1.3 (0.2) 2.0 (0.5) 0.7 (0.4) 1.4 (0.5) 1.5 (0.3) 2.7 (1.0) 1.0 (0.5) NA Misc. 1.2 (0.7) 2.1 (3.0) 0.5 (0.7) <0.05 (0.5) 0.5 (0.4) <0.05 (0.3) NA NA Offal 0.9 (0.3) 1.4 (0.6) 0.9 (0.6) 1.6 (0.8) 2.0 (0.5) 1.5 (1.5) <0.05 (0.1) NA Open 1.3(0.1) 1.2 (0.4) 0.8 (0.2) 0.3 (0.3) 1.0 (0.3) 0.8 (1.2) 0.2 (0.2) <0.05 (0.4) Pad run 1.2 (0.3) 0.8 (0.4) 0.7 (0.5) 0.5 (0.3) 0.8 (0.8) 3.7 (2.3) <0.05 (0.2) NA Tracks 1.2 (0.1) 0.9 (0.2) 0.8 (0.3) 1.1 (0.2) 1.0 (0.1) 1.0 (0.5) 0.7 (1.0) <0.05 (0.1) Waterways 1.6 (0.1) 1.5 (0.2) 1.2 (0.3) 1.0 (0.2) 1.4 (0.1) 1.8 (0.5) 1.5 (0.5) <0.05 (0.1)
Trap*temperature The success of most traps depended on the temperature (Table 3). Catches in Timms tunnels doubled on nights with frost or dew, Victor tunnels appeared more effective in warm conditions, Victor cages in frosts, Fenn tunnels in either cold or warm conditions, and gin traps in mild conditions. Again, Timms traps were comparatively consistent. Imprecise estimates for other trap*temperature interactions makes it more difficult to say with confidence under which conditions they catch most ferrets.
Landcare Research

Habitat
10
Table 3 Mean catch rate and standard errors (in brackets) for trap*temperature interactions. High catch rates (z 1.8%) with low standard errors (.s: 1.0%) are highlighted. Approximate 95% confidence intervals for catch rates = ± 2 standard errors. NA = insufficient data available.
Trap
Timms Timms Victor Victor Victor Fenn Gin Misc. Temperature tunnel tunnel cage tunnel
Mean catch/trap night ( % )
Cold 1.2(0.1) 1.3 (0.1) 1.0 (0.1) 1.0 (0.1) 1.2(0.1) '.2.2 (0.5) 0.5 (0.2) 0 (0) Dew 1.1 (0.6) 2.1 (0.9) <0.05 (0.4) NA 0.9 (1.3) 4.3 (1.7) NA NA Frost 1.5 (0.2) 2.5 (0.4) 1.0 (0.4) 0.7 (0.3) ~1.9 (0.4) 0.9 (0.4) <0.05 (1.7) <0.05 (0.2) Mild 1.1 (0.1) 1.0(0.1) 0.9 (0.1) 1.0 (0.1) 1.0(0.1) 1.5 (0.4) :1.8 (0.5) 2.6 (2.6) Warm 1.1 (0.1) 1.2 (0.3) 0.4 (0.1) '1.8 (0.2) 1.1 (0.2) 2.0 (0.7) 1.3 (0.8) <0.05 (0.1)
Bait*habitat Rabbit was the most consistent of the baits and was especially effective on bushedge/fenceline boundaries. Higher mean catch rates in habitats where other baits were used were generally imprecisely estimated (Table 4). The most notable of these other baits was possum, which had high mean catches in most habitats, but all (except waterways) had high standard errors due to its infrequent use. It is clearly desirable to collect more data for this bait to determine if these results are just due to chance, or if in fact possum has the potential to catch substantially more ferrets than the standard rabbit bait.
Table 4 Mean catch rate and standard errors (in brackets) for bait*habitat interactions. High catch rates (z 1.8%) with low standard errors (.s: 1.0%) are highlighted. Approximate 95% confidence intervals for catch rates = ± 2 standard errors. NA = insufficient data available.
Bait
Rabbit Bird Cat food Fish Horse Offal Possum Red
Misc. meat
No bait
Mean catch/trap night(%)
Fenceline 1.3 (0.1) 0.8 (0.2) 0.6 (0.2) 0.6 (0.1) 4.3 (5.8) 0.4 (0.1) 1.2 (0.4) 1.3 (0.3) 0.5 (0.4) NA
Building 1.0 (0.2) 1.4 (0.7) 0.7 (0.9) 0.6 (0.3) <0.05 (0.5) 0.5 (0.3) 4.3 (1.8) 0.9 (0.9) NA <0.05 (0.3) Bush 1.6 (0.1) 1.2 (0.5) 0.7 (0.7) 0.8 (0.2) NA 0.4 (0.1) 2.7 (1.3) 1.0 (0.6) 0 (0) NA Bushedge 1.1 (0.1) 1.7 (0.7) 0.7 (0.4) 1.2 (0.4) NA 0.6 (0.1) <0.05 (0.2) 0 (0) NA NA
Bushedge il.8 (0.2) 0.7 (0.5) <0.05 (0.1) 0.1 (0.2) NA 0.4 (0.3) <0.05 (0.1) 0.7 (0.6) NA NA
I Fenceline Culvert 1.7 (0.2) 1.4 (0.6) 1.1 (0.7) 1.6 (0.6) NA 0.7 (0.2) 4.6 (2.8) 1.1 (0.5) <0.05 (0.2) NA
Misc. 1.1 (0.5) 0 (0) NA <0.05 (0.1) NA 0 (0) 3.8 (5.2) NA NA NA
Offal 1.3 (0.3) 1.0 (0.8) 1.9 ( 1.2) 1.2 (0.7) NA 0.7 (0.4) 4.8 (2.1) 0.8 (0.7) NA NA
Open 1.5 (0.1) 0.7 (0.6) 0.4 (0.4) 0.8 (0.2) NA 0.3 (0.1) 2.8 (2.2) 0.4 (0.3) <0.05 (0.1) <0.05 (0.4) Pad run 1.1 (0.2) 1.0 (0.8) 0.6 (0.5) 0.5 (0.2) <0.05 (0.2) 1.6 (1.0) <0.05 (0.2) 3.6 (2.2) NA NA
Tracks 1.3 (0.1) 0.9 (0.3) 1.3 (0.1) 0.9 (0.2) 3.1 (3.0) 0.4 (0.1) 1.4 (1.1) 1.6 (0.7) <0.05 (0.1) NA
Waterway 1.6(0.1) 1.3 (0.3) 0.5 (0.3) 1.2 (0.2) NA 1.1 (0.2) 3.0 (0.8) 0.9 (0.3) 0.5 (0.7) NA s
Landcare Research
Trap
11
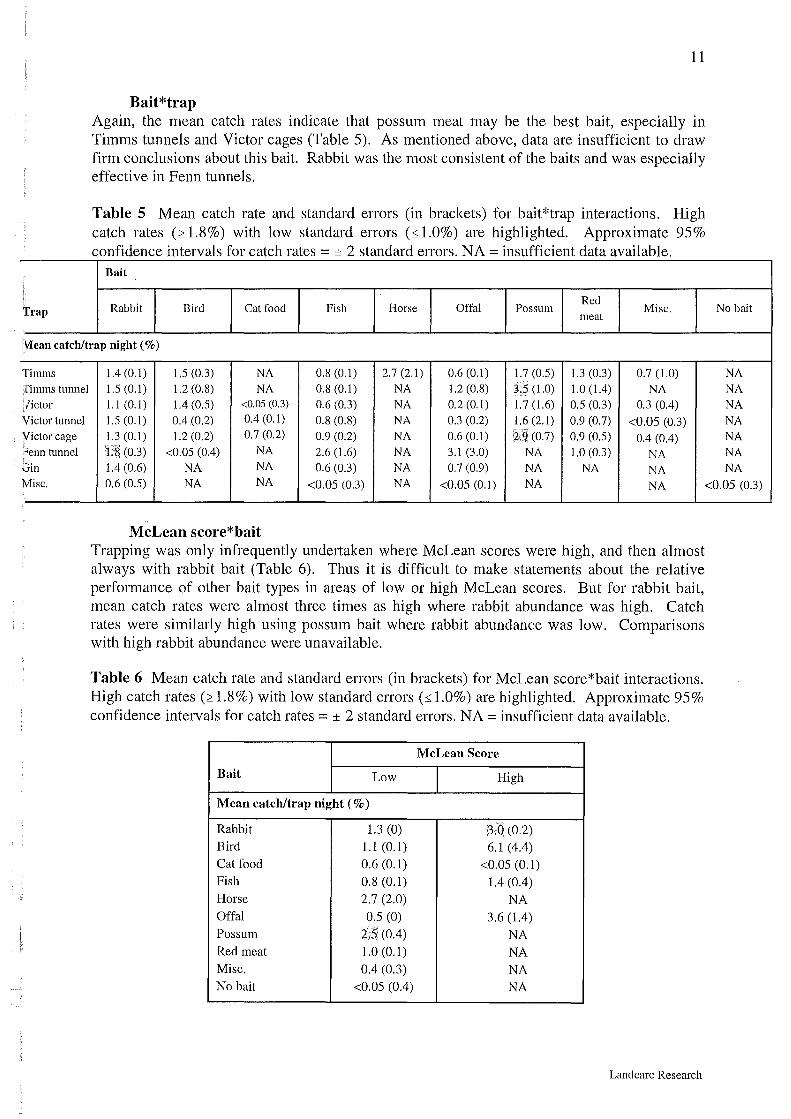
Bait* trap Again, the mean catch rates indicate that possum meat may be the best bait, especially in Timms tunnels and Victor cages (Table 5). As mentioned above, data are insufficient to draw firm conclusions about this bait. Rabbit was the most consistent of the baits and was especially effective in Fenn tunnels.
Table 5 Mean catch rate and standard errors (in brackets) for bait*trap interactions. High catch rates (::o:l.8%) with low standard errors (d.0%) are highlighted. Approximate 95% confidence intervals for catch rates= ± 2 standard errors. NA= insufficient data available.
Bait
Rabbit Bird Cat food Fish Horse Offal Possum Red
Misc. meat
No bait
Vlean catch/trap night ( % )
Timms limms tunnel victor
Victor tunnel Victor cage <enn tunnel
Jin Misc.
1.4 (0.1) 1.5 (0.3) NA 0.8 (0.1) 2.7 (2.1) 0.6 (0.1) 1.7 (0.5) 1.3 (0.3) 0.7 (1.0) 1.5 (0.1) 1.2 (0.8) NA 0.8 (0.1) NA 1.2 (0.8) 3.$ (1.0) 1.0 (1.4) NA 1.1 (0.1) 1.4 (0.5) <0.05 (0.3) 0.6 (0.3) NA 0.2 (0.1) 1.7 (1.6) 0.5 (0.3) 0.3 (0.4) 1.5 (0.1) 0.4 (0.2) 0.4 (0.1) 0.8 (0.8) NA 0.3 (0.2) 1.6 (2.1) 0.9 (0.7) <0.05 (0.3) 1.3 (0.1) 1.2 (0.2) 0.7 (0.2) 0.9 (0.2) NA 0.6 (0.1) '.2.9 (0.7) 0.9 (0.5) 0.4 (0.4) 1.8 (0.3) <0.05 (0.4) NA 2.6 (1.6) NA 3.1 (3.0) NA 1.0 (0.3) NA 1.4 (0.6) NA NA 0.6 (0.3) NA 0.7 (0.9) NA NA NA 0.6 (0.5) NA NA <0.05 (0.3) NA <0.05 (0.1) NA NA
McLean score*bait Trapping was only infrequently undertaken where McLean scores were high, and then almost always with rabbit bait (Table 6). Thus it is difficult to make statements about the relative performance of other bait types in areas of low or high McLean scores. But for rabbit bait, mean catch rates were almost three times as high where rabbit abundance was high. Catch rates were similarly high using possum bait where rabbit abundance was low. Comparisons with high rabbit abundance were unavailable.
Table 6 Mean catch rate and standard errors (in brackets) for McLean score*bait interactions. High catch rates (~l.8%) with low standard errors (::::1.0%) are highlighted. Approximate 95% confidence intervals for catch rates = ± 2 standard errors. NA = insufficient data available.
McLean Score
Bait Low High
Mean catch/trap night ( % )
Rabbit 1.3 (0) 3.0 (0.2) Bird 1.1 (0.1) 6.1 (4.4) Cat food 0.6 (0.1) <0.05 (0.1) Fish 0.8(0.1) 1.4 (0.4) Horse 2.7 (2.0) NA Offal 0.5 (0) 3.6 (1.4) Possum 2.5: (0.4) NA Red meat 1.0(0.1) NA Misc. 0.4 (0.3) NA No bait <0.05 (0.4) NA
Landcare Research
NA
NA NA
NA
NA NA
NA
<0.05 (0.3)

12
6. Discussion
Recent trials with stoats have indicated that Fenn traps are unacceptably inhumane (Bruce Warburton, Landcare Research, pers. comm.). This also appears to be the case for other species caught in gin traps. In terms of animal welfare, these traps may not be an acceptable option for ferret control. We therefore recommend that the use of these traps be discontinued.
Although Timms traps appear to be the best option from this analysis, there are often difficulties obtaining permission from landholders to use them near houses because these traps also kill cats. The data suggest that the next best options are Victor traps or Victor cages. Until the efficacy of these traps are further investigated, it is unclear whether they will achieve the same capture rate as Timms traps.
One possible reason Timms traps (and perhaps Victor cages) have high catch rates is because they catch relatively few non-target species, thereby making more trap nights available to catch ferrets (less interference = greater catch opportunity). However, this seems unlikely because the competition for traps is so low (only 1.1 % of traps were occupied by ferrets). This could be tested by looking at the relative number of non-target species caught in each trap type.
A more likely explanation for higher catch rates in Timms traps is that ferrets were more abundant where Timms traps were used. Most of the Timms traps were used in dry land Otago where rabbits, and therefore ferrets (see Norbury & McGlinchy 1996), were abundant. However, the analysis did not point to this potential bias because no interaction was found between trap type and McLean score. Nevertheless, our general finding was that greatest ferret captures were obtained from areas with highest rabbit abundance. Therefore, greatest ferret captures may not necessarily reflect greatest reductions in ferret populations. We looked to see if there were higher rates of decline in trap catch in areas where rabbits were abundant, but there were insufficient long-term data.
Because all trap sites have GPS coordinates, further work with the database could include a spatial analysis to see whether ferret capture rates were spatially clustered. If captures were clustered, and trap-set characteristics were not, this would suggest that ferret density may partly confound the results.
The suggestion that possum meat may be highly attractive to ferrets is reinforced by the fact that possum meat was used as bait mostly in areas where rabbits were less obtainable, and therefore where ferrets were less abundant. The attractiveness of possum meat versus ·rabbit meat should be examined further.
Climate appeared to have little consistent effect on catch rates of ferrets. No effect of rainfall was detected, and there were inconsistent relationships with temperature. There were also inconsistent relationships with habitat features. However, in addition to high catch rates in culverts and offal pits, there it appeared that linear features (fencelines, bushedges, bushedge/fenceline boundaries, waterways) were also attractive to ferrets. This has been reported in Clapperton's (2001) review of habitat use by ferrets.
The aim of collecting the data was to provide guidelines on best practice and to develop hypotheses that could be explored further. The relative ability of Timms traps, Victor traps, and Victor cage traps, baited with rabbit or possum meat, to catch ferrets should be experimentally
Landcare Research

13
tested in a field study. Landcare Research, Southern Pest Management, and Environment Southland have agreed, in principle, to co-operate in this venture by providing research sites and manipulating management accordingly. We propose to conduct these trials in an area of high rabbit abundance (e.g., 9,000-ha Shag Valley in Otago) and low rabbit abundance (e.g., 18,000-ha Pebbly Hills in Southland). We would conduct simple experiments during existing commercial operations whereby contractors would be required to set random combinations of the above trap and bait types. Because trap and bait types will not be independent (i.e., attraction to one type will mean repulsion from another), this trial will not provide unbiased estimates of the extent to which a given trap and bait type attracts ferrets, but it will provide information about which type is preferred over another. We believe the significantly lower costs and pragmatic advantages of this simple design outweigh the disadvantages of less powerful data. If we were to go ahead with this trial, we also see an opportunity to answer a more important question of what level of ferret population decline is achieved by trapping. This would require contractors to mark and release ferrets for 10 days prior to the trap-bait trial. These mark-recapture data would be modelled in program MARK to provide robust estimates of population size. The number of ferrets captured and removed during the trap-bait trial would indicate the population decline achieved by trapping. Although there would be considerable cost savings using existing commercial operations, we will need to seek external funding.
In the meantime we suggest data collection be continued, but with five modifications: 1. Record fewer trap-set characteristics, but include at least trap type, bait type, and rabbit
abundance because they were important variables in this study. 2. Record fewer definitions for a given trap-set characteristic. This will help to simplify future
analyses and enable more coherent interpretation of results. 3. Ensure contractors adhere to strict definitions. 4. Streamline data entry by capturing data electronically in the field. 5. Most importantly, we recommend that data are collected in a random fashion by ensuring that
variable types are randomised across the landscape.
Every pest contractor records the position of traps using GPS units. A simple way of capturing trap, bait, and rabbit abundance data electronically is to record them as single-character codes in the way-points for each trap location. This would allow data to be downloaded directly into spreadsheets without the cost and errors of inputting data from raw field sheets.
7. Recommendations
• Because the data were not collected in a random fashion, there is the potential for variables to be confounded with ferret density. We therefore emphasise that care be taken when using the guidelines from this study.
• Where possible, Timms traps (with or without tunnels) should be used, and baited with either rabbit or (pending further investigation) possum meat. Victor traps or Victor cages should be used where Timms traps cannot.
• Greatest ferret captures will be obtained by placing traps in areas with highest rabbit abundance. However, because there are generally more ferrets where there are more rabbits, this may not necessarily maximise reductions in ferret populations.
Landcare Research
14
• The guidelines that have emerged from the database are useful, but we suggest that future expenditure on data collection is better utilised by contributing to field experiments to test some of the hypotheses raised.
• Such experiments should test whether possum bait has the ability to catch more ferrets than rabbit bait, and whether Victor traps or Victor cages catch more ferrets than Timms traps.
• If the same sort of data collection is continued, we suggest that fewer types of trap-set characteristics be recorded, that steps be taken to ensure contractors adhere to strict definitions, and that data are captured electronically by recording trap-set characteristics in the GPS way-points for each trap location. Most importantly, we recommend that in order to minimise the confounding effects of ferret density, data are collected in a random fashion by ensuring that variable types are randomised across the landscape.
8. Acknowledgements
We thank all the pest control contractors for collecting the data. Andrea Byrom, Christine Bezar, and Phil Cowan commented on the report. Thanks to Wendy Weller for retyping the tables.
9. References
Clapperton, B.K. 2001: Advances in New Zealand Mammalogy 1990-2000: Feral ferret. Journal of the Royal Society of New Zealand 31: 185-203.
McCullagh, P.; Nelder, J. A. 1989: Generalized linear models. Second Edition. London, Chapman and Hall.
Norbury, G.; McGlinchy, A. 1996: The impact of rabbit control on predator sightings in the semi-arid high country of the South Island, New Zealand. Wildlife Research 23: 93-97.
Landcare Research

15
10. Appendices
10.1 Trap codes
Original trap code used in database New trap code used for analysis
BC Bridger Victor cage
Black Fenn Fenn tunnel
Bridger Cage Victor cage
Bridger Tunnel Victor tunnel
Cup Misc.
Fenn Fenn tunnel
Fenn Tunnel Fenn tunnel
Gin Trap Gin
Holden Cage Victor cage
Lanes Ace Misc.
None Misc.
Shot Misc.
Timms Timms
Timms Tunnel Timms tunnel
Timms with tunnel Timms tunnel
V Tunnel Victor tunnel
VC Victor with Cage Victor cage
Victor Victor
Victor Cage Victor cage
Victor Tunnel Victor tunnel
Wilton Trap Misc.
Yellow Fenn Fenn tunnel
Landcare Research
16
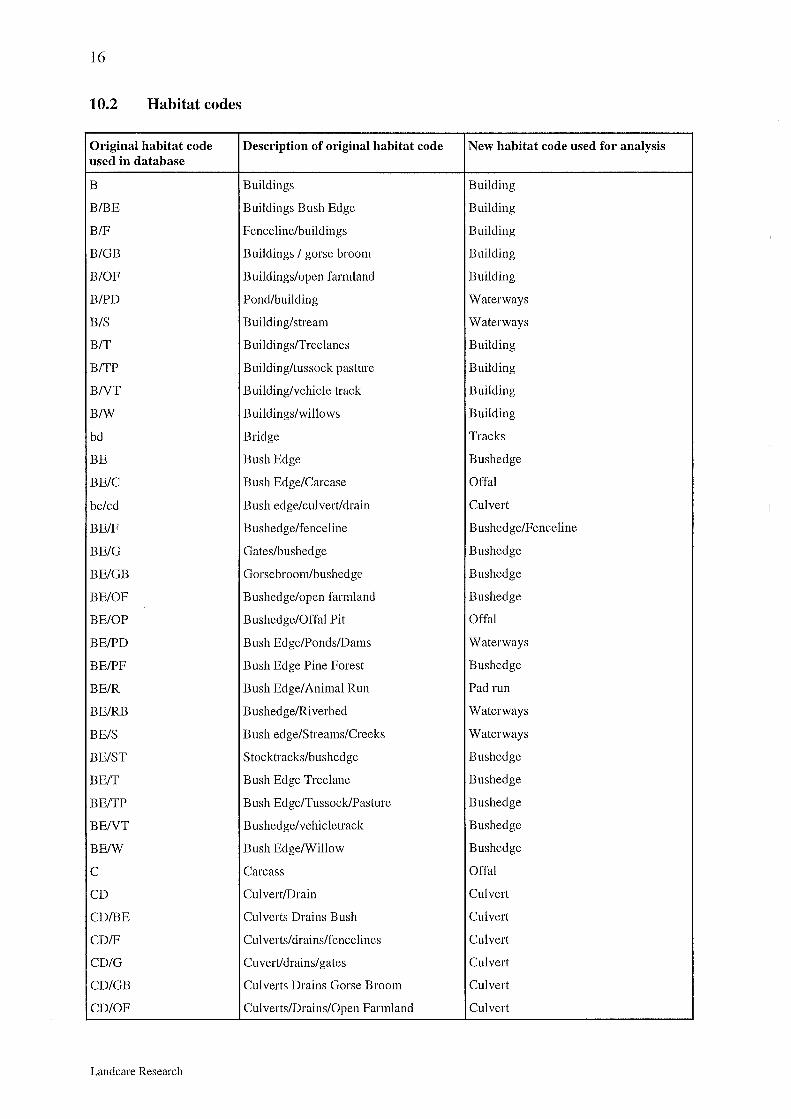
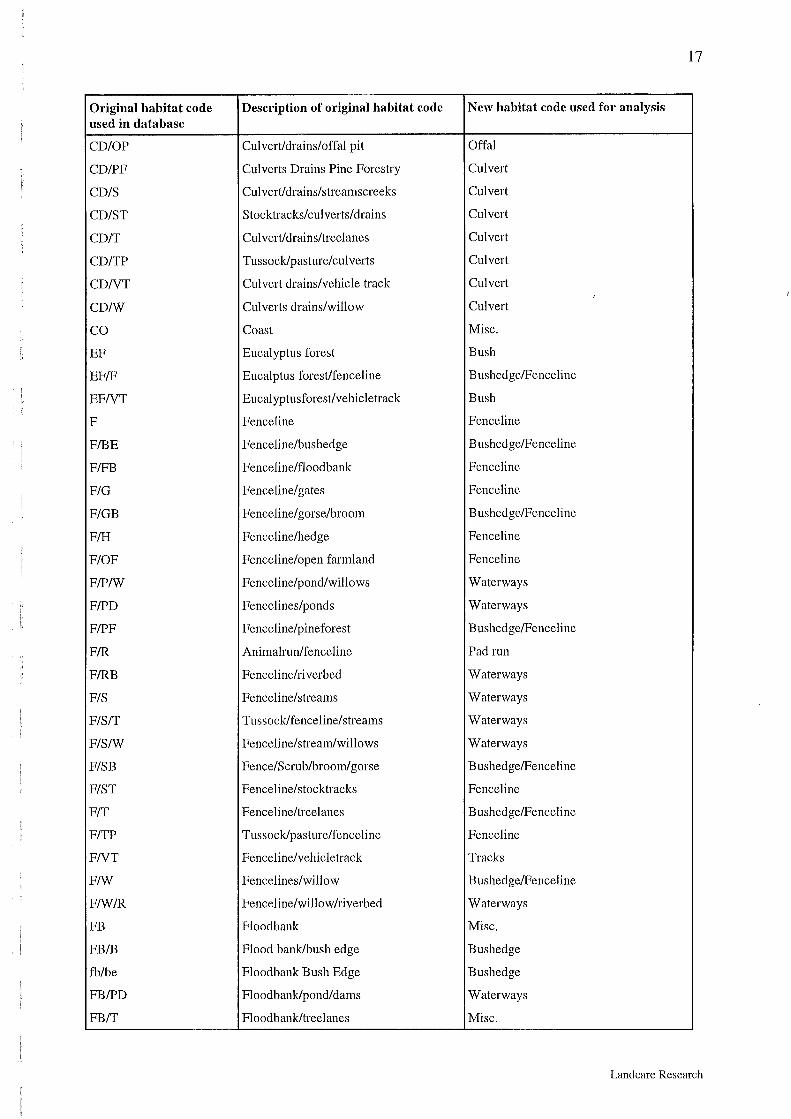
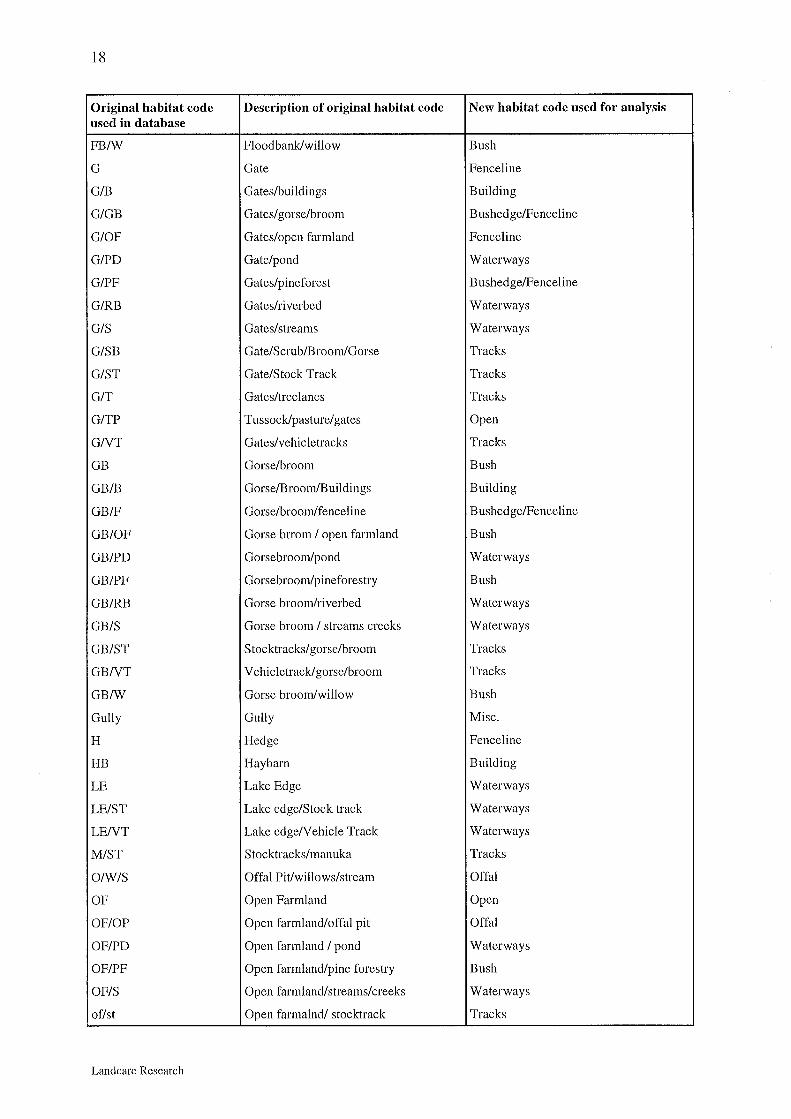
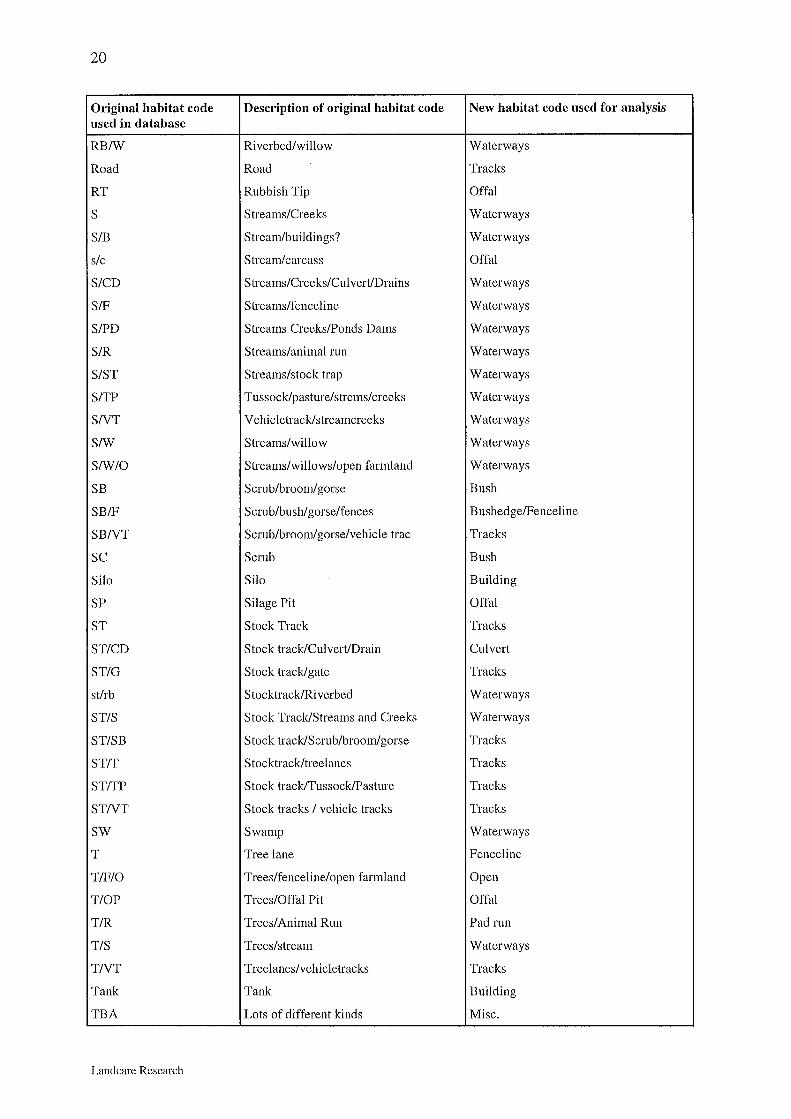
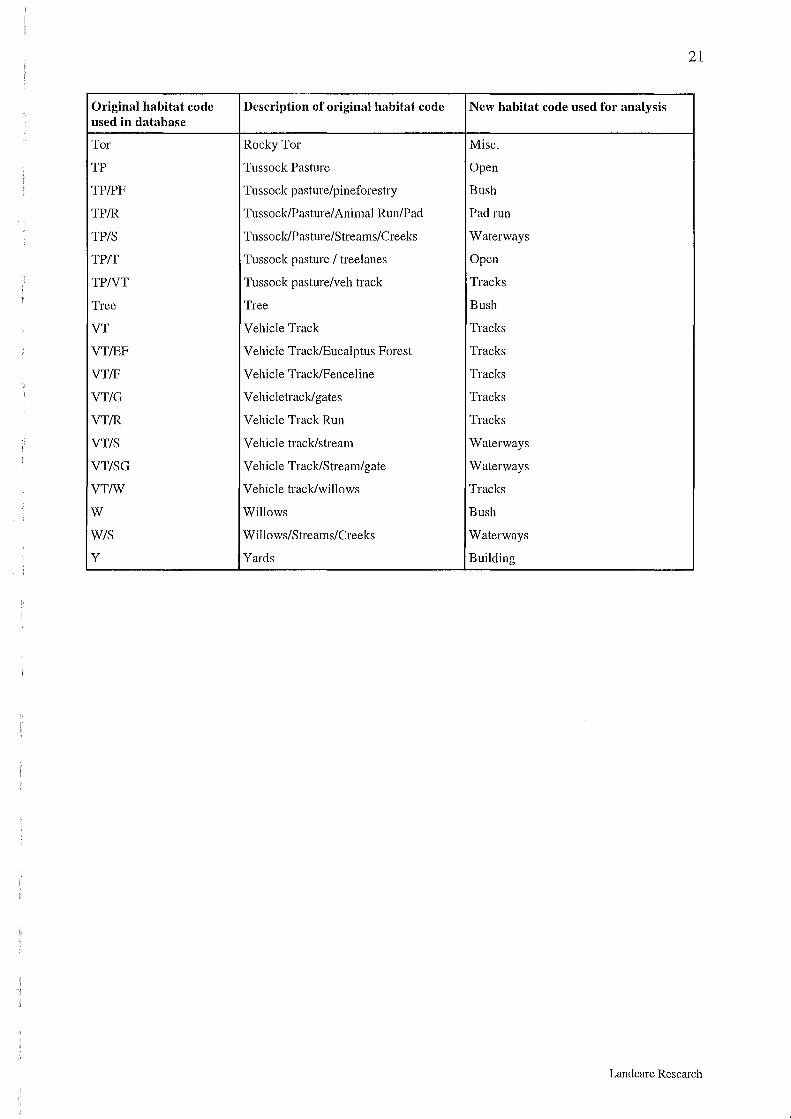
10.2 Habitat codes
Original habitat code Description of original habitat code New habitat code used for analysis used in database
B Buildings Building
B/BE Buildings Bush Edge Building
B/F Fenceline/buildings Building
B/GB Buildings I gorse broom Building
B/OF Buildings/open farmland Building
B/PD Pond/building Waterways
BIS Building/stream Waterways
BIT B uildings/Treelanes Building
B/TP Building/tussock pasture Building
BNT Building/vehicle track Building
B/W Buildings/willows Building
bd Bridge Tracks
BE Bush Edge Bushedge
BE/C Bush Edge/Carcase Offal
be/cd Bush edge/culvert/drain Culvert
BE/F B ushedge/fenceline B ushedge/Fenceline
BE/G Gates/bushedge Bushedge
BE/GB Gorsebroom/bushedge Bushedge
BE/OF Bushedge/open farmland Bushedge
BE/OP Bushedge/Offal Pit Offal
BE/PD Bush Edge/Ponds/Dams Waterways
BE/PF Bush Edge Pine Forest Bushedge
BE/R Bush Edge/ Animal Run Pad run
BE/RB Bushed ge/Ri verbed Waterways
BE/S Bush edge/Streams/Creeks Waterways
BE/ST Stocktracks/bushedge Bushedge
BE/T Bush Edge Treelane Bushedge
BE/TP Bush Edge/Tussock/Pasture Bushedge
BENT B ushedge/vehicletrack Bushedge
BE/W Bush Edge/Willow Bushedge
c Carcass Offal
CD Culvert/Drain Culvert
CD/BE Culverts Drains Bush Culvert
CD/F Cul verts/drains/fencelines Culvert
CD/G Cu vert/ drains/ gates Culvert
CD/GB Culverts Drains Gorse Broom Culvert
CD/OF Culverts/Drains/Open Farmland Culvert
Landcare Research
17
Original habitat code Description of original habitat code New habitat code used for analysis used in database
CD/OP Culvert/drains/offal pit Offal
CD/PF Culverts Drains Pine Forestry Culvert
CD/S Culvert/drains/streamscreeks Culvert
CD/ST Stocktracks/culverts/drains Culvert
CD/T Culvert/drains/treelanes Culvert
CD/TP Tussock/pasture/culverts Culvert
CDNT Culvert drains/vehicle track Culvert I
CDIW Culverts drains/willow Culvert
co Coast Misc.
EF Eucalyptus forest Bush
EF/F Eucalptus forest/fenceline Bushedge/Fenceline
EFNT Eucalyptusforest/vehicletrack Bush
F Fenceline Fence line
F/BE Fenceline/bushedge Bushedge/Fenceline
F/FB Fenceline/floodbank Fenceline
FIG Fenceline/gates Fenceline
F/GB Fence line/ gorse/broom Bushedge/Fenceline
F/H Fenceline/hedge Fenceline
F/OF Fenceline/open farmland Fenceline
F/P/W Fenceline/pond/willows Waterways
F/PD Fencelines/ponds Waterways
F/PF Fenceline/pineforest Bushedge/Fenceline
FIR Animalrun/fenceline Pad run
F/RB Fenceline/ri verbed Waterways
FIS Fenceline/streams Waterways
F/S/T Tussock/fenceline/streams Waterways
F/S/W Fenceline/stream/willows Waterways
F/SB Fence/Scrub/broom/ gorse B ushedge/Fenceline
FIST Fenceline/stocktracks Fenceline
FIT Fenceline/treelanes B ushedge/Fenceline
F/TP Tussock/pasture/fenceline Fence line
FNT Fenceline/vehicletrack Tracks
F/W Fencelines/willow B ushedge/Fenceline
F/W/R Fenceline/willow/riverbed Waterways
FB Floodbank Misc.
FB/B Flood bank/bush edge Bushedge
fb/be Floodbank Bush Edge Bushedge
FB/PD Floodbank/pond/dams Waterways
FB/T Floodbank/treelanes Misc.
Landcare Research
18
Original habitat code Description of original habitat code New habitat code used for analysis used in database
FB/W Flood bank/willow Bush
G Gate Fenceline
G/B Gates/buildings Building
G/GB Gates/ gorse/broom B ushedge/Fenceline
G/OF Gates/open farmland Fence line
G/PD Gate/pond Waterways
G/PF Gates/pineforest B ushedge/Fenceline
G/RB Gates/riverbed Waterways
G/S Gates/streams Waterways
G/SB Gate/Scrub/Broom/Gorse Tracks
GIST Gate/Stock Track Tracks
GIT Gates/tree lanes Tracks
G/TP Tussock/pasture/gates Open
GNT Gates/vehicletracks Tracks
GB Gorse/broom Bush
GB/B Gorse/Broom/Buildings Building
GB/F Gorse/broom/fenceline Bushedge/Fenceline
GB/OF Gorse brrom I open farmland Bush
GB/PD Gorsebroom/pond Waterways
GB/PF Gorsebroom/pineforestry Bush
GB/RB Gorse broom/riverbed Waterways
GB/S Gorse broom I streams creeks Waterways
GB/ST S tocktracks/ gorse/broom Tracks
GBNT Vehicletrack/ gorse/broom Tracks
GBIW Gorse broom/willow Bush
Gully Gully Misc.
H Hedge Fenceline
HB Hay barn Building
LE Lake Edge Waterways
LE/ST Lake edge/Stock track Waterways
LENT Lake edgeN ehicle Track Waterways
MIST Stocktracks/manuka Tracks
OIW/S Offal Pit/willows/stream Offal
OF Open Farmland Open
OF/OP Open farmland/offal pit Offal
OF/PD Open farmland I pond Waterways
OF/PF Open farmland/pine forestry Bush
OF/S Open farmland/streams/creeks Waterways
of/st Open farmalnd/ stocktrack Tracks
Landcare Research

19
Original habitat code Description of original habitat code New habitat code used for analysis used in database
OF ff Open farmland/treelanes Open
OFNT Open farmland/vehicletrack Tracks
OF/W Open farmland/willow Bush
OP Offal Pit Offal
op/of Open paddock offal pit Offal
OP/S Offal Pit/Streams/Creeks Offal
OP/W Offal Pit/Willows Offal
p Pond Waterways
PD Pond/Dam Waterways
PD/BE Pond/Dam/Bush Edge Waterways
PD/PF Ponds Dams Pine Forestry Waterways
PD/R Ponds Dams Animal Run Waterways
PD/RB Pond/riverbed Waterways
PD/ST Ponds/Dams/Stock Track Waterways
PD/T Ponds/Dams/Trees Waterways
PD/TP Pond/tussock pasture Waterways
PDNT Ponds/DamsN ehicle Tracks Waterways
PD/W Pond/willow Waterways
PF Pine/Forestry Bush
pf/b Pine forestry/building Building
PF/C Pine Forestry Carcass Offal
PF/F Pines/Forestry/Fenceline B ushedge/Fenceline
PF/G Pines/Forestry /Gates Bushedge/Fenceline
PF/OP Pines/Forestry/Offal Pit Bush
PF/R Pineforest I animalrun Pad run
PF/S Pine forest/streams Waterways
PFNT Pineforestry/vehicle tracks Bush
PF/W Pineforestry/willow Bush
Py Pylon Building
Q Quarry Misc.
R Animal Run/pad run Pad run
RIS Aniaml Run/Pad/Streams/Creeks Pad run
R/TP Tussock/pasture/animal run Pad run
r/w Animal Run/Pad Willows Pad run
RB Riverbed Waterways
RB/FB Riverbed Floodbank Waterways
RB/ST Stocktracks/riverbed Waterways
RB ff Riverbed I treelanes Waterways
RBNT Riverbed/vehicletrack Waterways
Landcare Research
20
Original habitat code Description of original habitat code New habitat code used for analysis used in database
RB/W Riverbed/willow Waterways
Road Road Tracks
RT Rubbish Tip Offal
s Streams/Creeks Waterways
SIB Stream/buildings? Waterways
sic Stream/carcass Offal
S/CD Streams/Creeks/Culvert/Drains Waterways
S/F Streams/fenceline Waterways
S/PD Streams Creeks/Ponds Dams Waterways
SIR Streams/animal run Waterways
S/ST Streams/stock trap Waterways
S/TP Tussock/pasture/strems/creeks Waterways
SNT Vehicletrack/streamcreeks Waterways
S/W Streams/willow Waterways
S/W/O Streams/willows/open farmland Waterways
SB Scrub/broom/ gorse Bush
SB/F Scrub/bush/ gorse/fences B ushedge/Fenceline
SBNT Scrub/broom/ gorse/vehicle trac Tracks
SC Scrub Bush
Silo Silo Building
SP Silage Pit Offal
ST Stock Track Tracks
ST/CD Stock track/Culvert/Drain Culvert
ST/G Stock track/gate Tracks
st/rb Stocktrack/Ri verbed Waterways
ST/S Stock Track/Streams and Creeks Waterways
ST/SB Stock track/Scrub/broom/gorse Tracks
ST/T Stocktrack/treelanes Tracks
ST/TP Stock track/Tussock/Pasture Tracks
STNT Stock tracks I vehicle tracks Tracks
SW Swamp Waterways
T Tree lane Fenceline
T/F/O Trees/fenceline/open farmland Open
T/OP Trees/Offal Pit Offal
T/R Trees/Animal Run Pad run
T/S Trees/stream Waterways
TNT Treelanes/vehicletracks Tracks
Tank Tank Building
TBA Lots of different kinds Misc.
Landcare Research
21
Original habitat code Description of original habitat code New habitat code used for analysis used in database
Tor Rocky Tor Misc.
TP Tussock Pasture Open
TP/PF Tussock pasture/pineforestry Bush
TP/R Tussock/Pasture/ Animal Run/Pad Pad run
TP/S Tussock/Pasture/Streams/Creeks Waterways
TP/T Tussock pasture I treelanes Open
TPNT Tussock pasture/veh track Tracks
Tree Tree Bush
VT Vehicle Track Tracks
VT/EF Vehicle Track/Eucalptus Forest Tracks
VT/F Vehicle Track/Fenceline Tracks
VT/G Vehicletrack/ gates Tracks
VT/R Vehicle Track Run Tracks
VT/S Vehicle track/stream Waterways
VT/SG Vehicle Track/Stream/gate Waterways
VT/W Vehicle track/willows Tracks
w Willows Bush
W/S Willows/Streams/Creeks Waterways
y Yards Building
Landcare Research

22
10.3 Bait codes
Original bait code Description of original New bait code used for used in database bait code analysis
A Apple Misc.
B Beef Red meat
Bird Bird Bird
Bl Blood Misc.
c Chicken Bird
CF Cat Food Cat food
D Duck Bird
F Fish Fish
FL Flour Misc.
G Goose Bird
H Hare Rabbit
HO Horse Horse
K Kidney Offal
L Liver Offal
M Mutton Red meat
Nil No Bait Used No bait
0 Ox Heart Offal
p Possum Possum
Pi Pig Red meat
Q Quail Bird
R Rabbit Rabbit
R/F Rabbit/fish Rabbit
R/V Rabbit/Venison Rabbit
SH Sheep Heart Offal
T Tuna Fish
v Venison Red meat
Landcare Research

I I I I I I I I I I I I I I I I I I I I I

I I I I
-~ I Manaaki Whenua I Landcare Research
I