Embed Size (px)
Citation preview
ACI WORLD INFORMATION TECHNOLOGY STANDING COMMITTEE
ACI WORLD FACILITATION AND SERVICES STANDING COMMITTEE
ACI WORLD FACILITATION AND SERVICES & IT STANDING COMMITTEE Page 1/29 20150827
Best Practice on Automated Passenger Flow Measurement Solutions Responsible for the content: ACI World Airport IT Standing Committee – Task Force “Best Practice for Passenger Flow Measurement” Date: 27th of August 2015 Version: 1.1
ACI WORLD INFORMATION TECHNOLOGY STANDING COMMITTEE
ACI WORLD FACILITATION AND SERVICES STANDING COMMITTEE
ACI WORLD FACILITATION AND SERVICES & IT STANDING COMMITTEE Page 2/29 20150827
2
Content 1. Table of changes .............................................................................................................................. 5
2. Management Summary .................................................................................................................... 6
3. Introduction ....................................................................................................................................... 8
3.1 Target group of this best practice paper ................................................................................... 9
3.2 Related documents ................................................................................................................. 10
4. Business drivers and use cases ..................................................................................................... 10
4.1 Adaption to other business ..................................................................................................... 10
4.2 Use cases ............................................................................................................................... 11
4.2.1 Operational use cases ..................................................................................................... 11
4.2.1.1 Public and online information on waiting times for passengers ................................... 11
4.2.1.2 Online quality check of forecasting tool ....................................................................... 11
4.2.2 Post-operational use cases ............................................................................................. 11
4.2.2.1 Reporting ...................................................................................................................... 11
4.2.2.2 Performance dashboard ............................................................................................... 11
4.2.3 Pre-operational use cases ............................................................................................... 12
4.2.3.1 Resource allocation ...................................................................................................... 12
4.2.3.2 Terminal layout and capacity planning ......................................................................... 12
4.2.3.3 Parameter calibration in forecasting tools .................................................................... 12
5. General definitions ......................................................................................................................... 12
5.1 Performance Indicator (PI) ...................................................................................................... 12
5.2 Key Performance Indicator (KPI) ............................................................................................ 13
5.3 Raw Data (RD) ........................................................................................................................ 13
5.4 From raw data to PIs (and to KPIs) ......................................................................................... 13
5.5 Detection errors and their effect on the performance indicator .............................................. 14
5.6 Performance indicator types (PI types) ................................................................................... 14
6. Influencing factors .......................................................................................................................... 15
6.1 Technology: sensors and software ......................................................................................... 15
6.2 Terminal environment ............................................................................................................. 16
6.3 Passenger behavior and flow characteristics ......................................................................... 16
7. Performance Indicator types (PI types) .......................................................................................... 16
7.1 Waiting times ........................................................................................................................... 16
7.1.1 Waiting time – using mobile device signal peak .............................................................. 17
7.1.1.1 Capturing raw data ....................................................................................................... 17
7.1.1.2 Calculation of PI ........................................................................................................... 17
7.1.1.3 Terminal environment .................................................................................................. 17
7.1.1.4 Passenger behavior and flow characteristics ............................................................... 18
7.1.1.5 Any other issues ........................................................................................................... 18
7.1.2 Waiting time – using inflow / outflow / occupancy level ................................................... 18
7.1.2.1 Capturing raw data ....................................................................................................... 18

ACI WORLD INFORMATION TECHNOLOGY STANDING COMMITTEE
ACI WORLD FACILITATION AND SERVICES STANDING COMMITTEE
ACI WORLD FACILITATION AND SERVICES & IT STANDING COMMITTEE Page 3/29 20150827
3
7.1.2.2 Calculation of PI ........................................................................................................... 18
7.1.2.3 Terminal environment .................................................................................................. 19
7.1.2.4 Passenger behavior and flow characteristics ............................................................... 19
7.1.2.5 Any other issues ........................................................................................................... 19
7.1.3 Waiting time – using inflow / outflow / imaginary pairs .................................................... 19
7.1.3.1 Capturing raw data ....................................................................................................... 20
7.1.3.2 Calculation of PI ........................................................................................................... 20
7.1.3.3 Terminal environment .................................................................................................. 20
7.1.3.4 Passenger behavior and flow characteristics ............................................................... 20
7.1.3.5 Any other issues ........................................................................................................... 20
7.1.4 Waiting time – using occupancy level and outflow .......................................................... 21
7.1.4.1 Capturing raw data ....................................................................................................... 21
7.1.4.2 Calculation of PI ........................................................................................................... 21
7.1.4.3 Terminal environment .................................................................................................. 21
7.1.4.4 Passenger behavior and flow characteristics ............................................................... 22
7.1.5 Waiting time – using passenger tracking ......................................................................... 22
7.1.5.1 Capturing raw data ....................................................................................................... 22
7.1.5.2 Calculation of PI ........................................................................................................... 22
7.1.5.3 Terminal environment .................................................................................................. 23
7.1.5.4 Passenger behavior and flow characteristics ............................................................... 23
7.1.5.5 Any other issues ........................................................................................................... 23
7.1.6 Waiting time – using facial recognition biometrics ........................................................... 23
7.1.6.1 Capturing raw data ....................................................................................................... 23
7.1.6.2 Calculation of PI ........................................................................................................... 23
7.1.6.3 Terminal environment .................................................................................................. 24
7.1.6.4 Passenger behavior and flow characteristics ............................................................... 24
7.1.6.5 Any other issues ........................................................................................................... 24
7.2 Process throughput ................................................................................................................. 24
7.2.1 Capturing raw data .......................................................................................................... 24
7.2.2 Calculation of PI ............................................................................................................... 25
7.2.3 Terminal environment ...................................................................................................... 25
7.2.4 Passenger behavior and flow characteristics .................................................................. 25
7.3 Passenger show-up profile ..................................................................................................... 25
7.3.1 Capturing raw data .......................................................................................................... 25
7.3.2 Calculation of PI ............................................................................................................... 25
7.3.3 Terminal environment ...................................................................................................... 25
7.3.4 Passenger behavior and flow characteristics .................................................................. 25
7.3.5 Any other issues .............................................................................................................. 26
7.4 Queue length overrun ............................................................................................................. 26
7.4.1 Capturing raw data .......................................................................................................... 26
ACI WORLD INFORMATION TECHNOLOGY STANDING COMMITTEE
ACI WORLD FACILITATION AND SERVICES STANDING COMMITTEE
ACI WORLD FACILITATION AND SERVICES & IT STANDING COMMITTEE Page 4/29 20150827
4
7.4.2 Calculation of PI ............................................................................................................... 26
7.4.3 Terminal environment ...................................................................................................... 26
7.4.4 Passenger behavior and flow characteristics .................................................................. 26
7.5 Area occupancy ...................................................................................................................... 26
7.5.1 Area occupancy – using inflow-outflow deltas ................................................................. 26
7.5.1.1 Capturing raw data ....................................................................................................... 26
7.5.1.2 Calculation of PI ........................................................................................................... 27
7.5.1.3 Terminal environment .................................................................................................. 27
7.5.1.4 Passenger behavior and flow characteristics ............................................................... 27
7.5.2 Area occupancy – direct counting.................................................................................... 27
7.5.2.1 Capturing raw data ....................................................................................................... 27
7.5.2.2 Calculation of PI ........................................................................................................... 28
7.5.2.3 Terminal environment .................................................................................................. 28
7.5.2.4 Passenger behavior and flow characteristics ............................................................... 28
8. List of abbreviations ....................................................................................................................... 28
9. Annexes ......................................................................................................................................... 28

ACI WORLD INFORMATION TECHNOLOGY STANDING COMMITTEE
ACI WORLD FACILITATION AND SERVICES STANDING COMMITTEE
ACI WORLD FACILITATION AND SERVICES & IT STANDING COMMITTEE Page 5/29 20150827
5
Best Practice on Automated Passenger Flow Measurement Solutions ACI World Airport IT Standing Committee Task Force “Best Practice for Passenger Flow Measurement” Version 1.1 27th of August 2015
1. Table of changes
Version Date Changes Responsible
1.0 Oct 10th 2014 Version 1.0 endorsed by the World Airport IT Standing Committee in Durban SA
ACI World
1.1 Aug 27th 2015 New PI type for waiting time added. ACI World

ACI WORLD INFORMATION TECHNOLOGY STANDING COMMITTEE
ACI WORLD FACILITATION AND SERVICES STANDING COMMITTEE
ACI WORLD FACILITATION AND SERVICES & IT STANDING COMMITTEE Page 6/29 20150827
6
2. Management Summary
The number of airports with detailed operational experience of passenger flow monitoring is rapidly increasing. Recognizing this, the Airports Council International (ACI) World Airport IT Standing Committee (WAITSC) has recently published this Best Practice Paper that brings together existing experience on passenger flow measurement solutions and provides a guideline for airports intending to use passenger flow measurement technologies in the future. The scope of the Paper is on technical solutions that do not assume explicitly cooperative (or opt-in) passenger behavior. These non-cooperative solutions are typically integrated in the terminal infrastructure or use data from existing passenger processes, such as boarding pass scans or mobile devices and Wi-Fi signals. From the passengers’ perspective these solutions are transparent – they measure the flow without any awareness of the passenger, or breach of data privacy, as they monitor passenger movements anonymously. The Best Practice paper takes into account: performance indicators (PI) as the final output data of a technical measurement solution, how PIs are derived from raw data (RD) delivered by different sensor solutions, the properties of the technologies used (sensors and algorithms), several influencing factors such as terminal environment, individual passenger behavior, and
general passenger flow characteristics, and the characteristics of use cases in terminal operations and planning. The performance indicator is the top level structuring element, with the following elements analyzed: What is the correct interpretation of the PI type? Which technology (or combinations of technologies) can deliver the PI type? How can the terminal environment influence the results? How can the passenger’s behavior influence the results? What other issues might arise during implementation? There are five types of performance indicator covered in the Best Practice Paper: WAITING TIMES are the most difficult to measure and calculate, although they are often the most interesting for airport terminal management. There are two different classes of measured waiting times that have to be distinguished: The retrospective (backward-looking or historical) waiting time: the time passengers have waited in
a queuing area before they left it. The predictive (forward-looking) waiting time: the expected time a passenger will have to wait in the
queuing area when he enters the area. There are six ways of measuring waiting time, discussed in more detail in the Best Practice Paper as different PI types. PROCESS THROUGHPUT is the (average) throughput count of a process point per time interval. PASSENGER SHOW-UP PROFILE uses BCBP scanners capable of reading both paper and mobile BCBPs. The comparison of the time stamps of the scans and relevant flight data from the AODB gives a show-up profile. QUEUE LENGTH OVERRUN is the number of people in the indication area (at the end of a queuing area) greater than a threshold for predefined minimum time a queue length overrun is indicated.

ACI WORLD INFORMATION TECHNOLOGY STANDING COMMITTEE
ACI WORLD FACILITATION AND SERVICES STANDING COMMITTEE
ACI WORLD FACILITATION AND SERVICES & IT STANDING COMMITTEE Page 7/29 20150827
7
AREA OCCUPANCY is typically defined as the number of passengers in a pre-defined area. From this it is easily possible to calculate a density of passengers in an area by dividing the number of passengers in the pre-defined area by its square meters. Moreover different use cases for PIs have also been analyzed based on a range of general characteristics. There is no specific mapping of PIs to use cases, since each PI might be used in each case. Nonetheless, as each airport and terminal is truly unique, usage scenarios have individual properties that should be considered in order to improve the benefit for terminal operations and planning. Two underlying lessons have become apparent through the preparation of the Best Practice Paper: Each location and environment is different, so only a sufficiently long testing phase in a live operations setting can help to avoid painful surprises Once implemented, regular checks of the automated measurement solutions are necessary to guarantee a constant level of high quality data.

ACI WORLD INFORMATION TECHNOLOGY STANDING COMMITTEE
ACI WORLD FACILITATION AND SERVICES STANDING COMMITTEE
ACI WORLD FACILITATION AND SERVICES & IT STANDING COMMITTEE Page 8/29 20150827
8
3. Introduction
Technical solutions to measure the passenger flow within (airport) terminal buildings and similar facilities have emerged and have been globally implemented over the past few years. Frequently discussed in the airport community, such solutions could deliver various indicators to evaluate the performance of the passenger flow and thus enable the terminal operator to achieve their goals to improve the passenger experience. Meanwhile, more and more airports have gathered detailed operational experience, using various technical solutions and learned more about their advantages as well as the challenges that these solutions bring. Beside the numerous successful implementations and positive effects on the improvement of the passenger flow, some airports have actually switched off previously implemented solutions due to the lack of benefits and quality of the results. The objective of this Best Practice Paper issued by the ACI World Airport IT Standing Committee (WAITSC) is to collect as much of the existing experience on passenger flow measurement solutions as possible and to provide a guideline for those airports that intend to use passenger flow measurement solutions in the future. The scope of this document is on technical solutions that do not assume an explicitly cooperative1 passenger behavior. These non-cooperative solutions are typically integrated in the terminal infrastructure or use data from existing passenger processes, such as boarding pass scans. From the passengers perspective these solutions are transparent – they measure the flow without any awareness of the passenger. The approach of this paper is the result of a WAITSC discussion taking into account: the performance indicator (PI) as the final output data of a technical measurement solution, the properties of the technologies used, several influencing factors such as:
terminal environment,
individual passenger behavior,
general passenger flow characteristics, and the characteristics of the use cases in terminal operations and planning.
Figure 1: Categories and influencing factors
1 e.g. download and usage of special mobile app by the passenger

ACI WORLD INFORMATION TECHNOLOGY STANDING COMMITTEE
ACI WORLD FACILITATION AND SERVICES STANDING COMMITTEE
ACI WORLD FACILITATION AND SERVICES & IT STANDING COMMITTEE Page 9/29 20150827
9
The performance indicator was chosen as the top level structuring element. Distinguished in so called performance indicator types (PI type – see the definitions provided in Chapter 5), depending on their special properties and ways of generation. In Chapter 6 the following questions for each PI type are answered by best effort: What is the correct interpretation of the PI type? Which technology (or combinations of technologies) can deliver the PI type? How can the terminal environment influence the results? How can the passenger’s behavior influence the results? What other issues might arise during implementation? After the collection and discussion of the performance indicator types in Chapter 6, different use cases for PIs are analyzed according to their general characteristics in Chapter 7. There is no specific mapping of the PIs to the use cases since each PI might be used in each case. Nonetheless, the usage scenarios have individual properties that should be considered in order to improve the benefit for terminal operations and planning. Finally, Chapter 8 provides an overview of existing and upcoming passenger flow measurement solutions and the technologies used within. It should be emphasized that this paper is not about rating suppliers and their products, solutions and no suppliers’ name or product names have been mentioned. Acknowledging that each airport is unique, the intent of this whitepaper is: to render decision support for an airport regarding the best choice of passenger flow solutions, provide airport implementation guidelines, and detail the usage of the delivered PIs. In addition to the information based on airports’ experiences provided on the following pages: always keep in mind the following lessons learned: Each location and environment is different so only a sufficiently long testing phase in a live
operations terminal environment can help to avoid painful surprises! Once implemented, regular quality checks of the automated measurement solutions are
necessary to guarantee a constant level of high quality data! A final remark should be spent on the actuality of this document. The contained information on performance indicators, solutions and influencing factors is a collection of best practices and experiences from several airports and suppliers. It makes no claim to be exhaustive of all state-of-the-art solutions at the time of its submission. Since IT is well known as one of the fastest moving technical areas in the world, any new concept, solution, or product in the field of automated passenger flow measurement solutions, as well as essential product improvements will potentially demand changes to this document. Therefore the WAITSC will initiate a review process on a regular basis in order to keep it up to date.
3.1 Target group of this best practice paper
The information covered by this paper is designed for airport staff working on either side of the interface between the terminal operations department and the IT department. The reader should be able to understand: at a minimum basic technical aspects of IT solutions,

ACI WORLD INFORMATION TECHNOLOGY STANDING COMMITTEE
ACI WORLD FACILITATION AND SERVICES STANDING COMMITTEE
ACI WORLD FACILITATION AND SERVICES & IT STANDING COMMITTEE Page 10/29 20150827
10
the needs of the potential users of a passenger flow measurement solution – typically the staff responsible for passenger flow control and supervision within the terminal management, as well as those that may want to use the data for analytical purposes.
Further, the reader should be able to describe functional and non-functional requirements Typical roles with this know-how are Business Analysts and/or Solution Architects.
3.2 Related documents
SITA Passenger Counting and Tracking Technology – Comparison Fact Sheet – Version 4.7 from 18th of August 2014; see Annex 1.
ACI World – Recommended Practice 300A12: Manual Measurement of Passenger Service Process Times and KPI’s
ACI World - Best Practice Guidelines: Airport Service Level Agreement Framework from 26th of March 2014.
4. Business drivers and use cases
The following chapters cover experiences and challenges of using automated passenger flow measurement solutions in terminal buildings. Automated passenger flow measurement solutions can be of great value if the passenger terminal management department wants to improve its business: both in terms of efficiency and passenger service quality. In this context the best practice paper should help to avoid some of the typical challenges in selecting and implementing the technical solution, and thereby improve the business value. Generally speaking, the measurement of passenger flow performance indicators will at a minimum help to: confirm and improve passenger service quality estimate temporary and continuous bottlenecks in the terminal building estimate future resource allocation at several process points calibrate automated passenger flow forecast tools It is also possible to measure the performance of the passenger flow manually, but compared with automated solutions this has some disadvantages: depends - in terms of quality - on the experience and concentration of the staff performing the
measurement, can only be performed as a sample and not continuously over a long period of time. These disadvantages do not exist using automated, IT-based solutions because IT solutions deliver a continuously updated stream of performance indicators with an equal level of quality. While the automated solution usually delivers a better return on investment, the calculation of a local business case depends on the specific needs of that individual airport and the local conditions within the terminal facilities.
4.1 Adaption to other business
Writing this document was mainly motivated by the special needs and challenges of airport companies operating passenger terminal buildings. Nonetheless, most of the results can be adapted to other businesses as long as they are processing large amounts of people in a complex environment. Examples may be shopping malls, railway and multi-modal transportation stations, sports stadiums, fair grounds, and other locations where cultural and political events are taking place. One of the first businesses using automated people counting solutions were in fact not airports, but retail companies operating large stores and shopping malls. Their motivation is mainly to identify interesting spots to support merchandising, marketing, and lease space.

ACI WORLD INFORMATION TECHNOLOGY STANDING COMMITTEE
ACI WORLD FACILITATION AND SERVICES STANDING COMMITTEE
ACI WORLD FACILITATION AND SERVICES & IT STANDING COMMITTEE Page 11/29 20150827
11
Having this in mind, the usage of an automated passenger flow measurement solution can doubly profit an airport, both to support the needs of the terminal management department, and to deliver valuable figures for the retail department, in order to optimize the placement of brands and products inside the retail areas of the terminal building.
4.2 Use cases
The output of passenger flow measurement solutions can be used in several scenarios to improve passenger terminal management and planning. To distinguish these use cases it is helpful to separate them as operational, post-operational, and pre-operational. The operational ones are relevant for the management of the current and upcoming passenger flow; post-operations typically requires historical reports on what happened at different time intervals; pre-operation is mainly for planning and resource allocation.
4.2.1 Operational use cases
4.2.1.1 Public and online information on waiting times for passengers
More and more airports in the world are keeping their passengers informed about real-time wait times at certain process points, especially security check points and immigration areas. The motivation for this information is to reduce passenger stress levels and to provide additional information such as alternate routes or other processing areas with less congestion or wait times. Additionally this feature can be combined with walking and processing times to give the passenger a more comprehensive understanding of total time to the departure gate or baggage belt. As more and more airports adopt these solutions, they are quickly becoming standard elements of passenger service improvement initiatives. The provision of current wait times can technically be done by displays, integration with mobile apps, airport web pages, and point-of-information systems. Thereby the waiting time should be displayed in a standard format (e.g. <5Min, 5-10Min, 10-15Min, >15Min). In terms of PI types a predictive waiting time should be used for such a usage scenario. The usage of retrospective solutions for displaying current waiting times is generally not feasible. The difference is explained in chapter 7.1.
4.2.1.2 Online quality check of forecasting tool
Whenever a forecasting tool is used to predict the passenger demand at certain process points (e.g. security check or immigration) for the coming hours, the measured information can be used to establish an online quality check. For example the measured inflow to a waiting area can be compared with the calculated demand at the process point. If essential and unexplainable deltas occur a quality check of the forecasting solution might be necessary.
4.2.2 Post-operational use cases
4.2.2.1 Reporting
A typical use case for measured passenger flow related PIs and KPIs is the reporting of what happened in the terminal building yesterday, last week, or last month. Therefore the PIs should be loaded in a Business Intelligence (BI) solution or a less sophisticated reporting tool so the PIs can be stored and categorized for future analysis.
4.2.2.2 Performance dashboard
The most popular mode of reporting flow data is via online dashboards. PIs and often KPIs are displayed on a dashboard giving the current situation (e.g. 5 minutes old), trend information, and the average data
ACI WORLD INFORMATION TECHNOLOGY STANDING COMMITTEE
ACI WORLD FACILITATION AND SERVICES STANDING COMMITTEE
ACI WORLD FACILITATION AND SERVICES & IT STANDING COMMITTEE Page 12/29 20150827
12
over the entire day. These dashboards use typical graphical features such as symbolic “traffic lights” or red-yellow-green indicators.
4.2.3 Pre-operational use cases
4.2.3.1 Resource allocation
The resource allocation is typically the area with the highest potential to improve efficiency. The better the forecast of the demand at a process point in the future is, the better the resources can be allocated depending on the real demand and a pre-defined service level. Measured PIs can be used to support this. The historicized PIs should be analyzed by a BI tool in order to identity patterns and predict scenarios, resource needs for the future.
4.2.3.2 Terminal layout and capacity planning
Measured passenger flow PIs are very often a valuable input parameter for terminal layout and capacity planning. Thereby the mean values from historical PIs like throughput, arrival time profiles for a specific process, or waiting times can be used to maximize the terminal facilities and confirm the layout, quantity of operators (e.g. security lanes). For the validation of a planned terminal layout typically simulation tools are used that also need valuable parameters like throughput etc., that can be given by an analysis of the historicized PIs from a passenger flow measurement solution.
4.2.3.3 Parameter calibration in forecasting tools
Similar to the calibration of terminal planning simulation tools, a passenger flow forecasting tool to support more operational purposes need an appropriate calibration of its parameters. The measured PIs from a measurement solution can also support this. However, an automated feedback-loop between measurement solution and parameter re-calibration without a quality check by skilled staff should be avoided.
5. General definitions
To describe the characteristics of passenger flow measurement solutions some general remarks and definitions are needed to understand how passenger flow measurement technologies work in general.
5.1 Performance Indicator (PI)
A Performance Indicator (PI) is aggregated information in the context of passenger flow. The PI is derived from raw data (RD) which was technically measured by any kind of sensor solution. A PI delivers performance information on a certain aspect of the passenger flow, e.g. the waiting process of passengers or the throughput of a process. The calculation of a PI is often part of the measurement solution itself. PIs are usually functions of time and process locations. They may be calculated for predefined time ranges of different length (one minute, five minutes, one hour, one day, etc.) and predefined locations in the passenger terminal building (security check point, border control, etc.). A PI depends – in quality and quantity – on raw data and algorithms to calculate the PI from the raw data. In general, it is possible to use raw data from different sensors to calculate a PI, as long as they are comparable in their meaning, quantity, and quality. Examples for PIs covered by this Best Practice Paper are: Passenger wait time in a queuing area, including a differentiation between retrospective waiting time
and predictive waiting time, Throughput of a process point, Occupancy level of a defined area.
ACI WORLD INFORMATION TECHNOLOGY STANDING COMMITTEE
ACI WORLD FACILITATION AND SERVICES STANDING COMMITTEE
ACI WORLD FACILITATION AND SERVICES & IT STANDING COMMITTEE Page 13/29 20150827
13
5.2 Key Performance Indicator (KPI)
PIs that are extremely important to certain stakeholders may be agreed upon to become Key Performance Indicators (KPIs). Usually, KPIs are associated with corporate objectives such as a Passenger Satisfaction Index or a Service Level Agreement.
5.3 Raw Data (RD)
Raw data is the basic information measured by a (technical) sensor solution, which could include one or more of the following: Data collected through BCBP (Bar Coded Boarding Pass) scans, Timestamps of Bluetooth® and Wi-Fi field strength peaks, People counting impulses/signals of a passenger passing an imaginary line in the terminal, using
thermal, infrared and/or visual camera sensors, or counts of an AMD (Automated Metal Detector)
Raw data is measured as an event, at a singular point in time, at a predefined location. Raw data is generally without any contextual information. Nevertheless, quality assurance should be applied to raw data to some extent (e.g. filtering, formatting).
5.4 From raw data to PIs (and to KPIs)
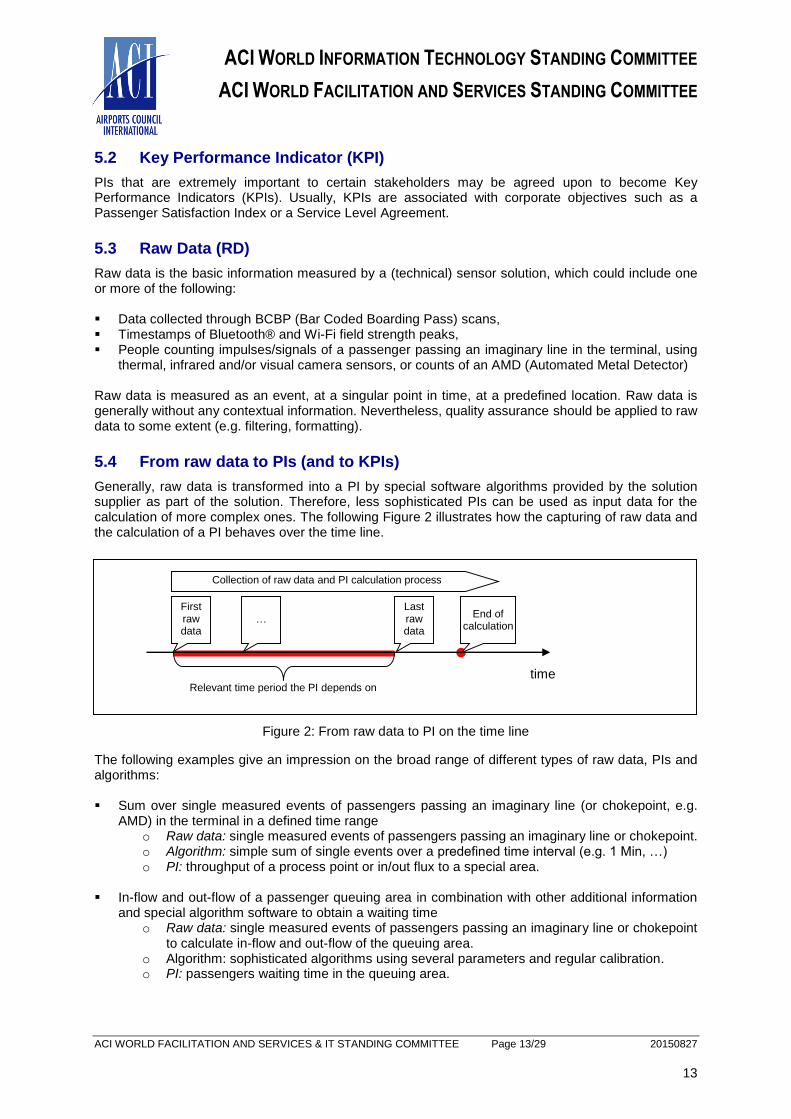
Generally, raw data is transformed into a PI by special software algorithms provided by the solution supplier as part of the solution. Therefore, less sophisticated PIs can be used as input data for the calculation of more complex ones. The following Figure 2 illustrates how the capturing of raw data and the calculation of a PI behaves over the time line.
Figure 2: From raw data to PI on the time line
The following examples give an impression on the broad range of different types of raw data, PIs and algorithms: Sum over single measured events of passengers passing an imaginary line (or chokepoint, e.g.
AMD) in the terminal in a defined time range o Raw data: single measured events of passengers passing an imaginary line or chokepoint. o Algorithm: simple sum of single events over a predefined time interval (e.g. 1 Min, …) o PI: throughput of a process point or in/out flux to a special area.
In-flow and out-flow of a passenger queuing area in combination with other additional information
and special algorithm software to obtain a waiting time o Raw data: single measured events of passengers passing an imaginary line or chokepoint
to calculate in-flow and out-flow of the queuing area. o Algorithm: sophisticated algorithms using several parameters and regular calibration. o PI: passengers waiting time in the queuing area.
Relevant time period the PI depends on
time
First raw data
Last raw data
…
End of calculation
Collection of raw data and PI calculation process
ACI WORLD INFORMATION TECHNOLOGY STANDING COMMITTEE
ACI WORLD FACILITATION AND SERVICES STANDING COMMITTEE
ACI WORLD FACILITATION AND SERVICES & IT STANDING COMMITTEE Page 14/29 20150827
14
5.5 Detection errors and their effect on the performance indicator
“Nobody is perfect!” This well-known statement also describes automated passenger flow measurement solutions – none of the existing solutions and products is perfect as the sensor solution always has accuracy limitations. Therefore, the knowledge, interpretation, and management of detection errors and their effect on PIs is always part of the task. For example: if a sensor detecting in-flow to a queuing area as raw data has an accuracy of approximately 95% and the total amount of passengers to measure has a number of 10,000 per day, the accumulated error over the whole day is up to 500 passengers. The problem with the majority of sensor solutions is the fact that they do not have an equal spreading of errors, e.g. following a normal distribution around the real number of passengers. Typically they detect fewer passengers than are actually present; seldom do they interpret an object (e.g. a suitcase) as an additional, non-existing passenger. Thus, following the example above, the measured number of passengers entering the queuing area will be approx. 9,500, not 10,000. Assuming that the outward flow of the queuing area can be measured with a higher accuracy (e.g. by a different type of sensor or better lighting conditions) the number of passengers in the queuing area calculated as the difference between in- and out-flow will be negative. The knowledge about the typical error rate of a sensor in general and the achievable accuracy of the sensor in the real world terminal environment are very important first steps to interpret the PI generated by the raw data. The second one is to know how the error in the raw data might affect the quality of the PI as the intended output. This error propagation depends very much on the algorithm and can only be examined individually. Some algorithmic approaches will reduce the effect of the error in the raw data, others will not. It is also possible that the PI as the final output of the solution will deliver an unreasonable figure, such as a negative number of passengers in a queuing area. The lessons learned from this can only be: Discuss the typical error rates in the raw data and their effect on the PIs with your solution
provider. Check the real, achievable accuracy of the sensors in the terminal environment. Discuss these issues with the users of the PIs in order to manage their expectations and to
achieve good user acceptance.
5.6 Performance indicator types (PI types)
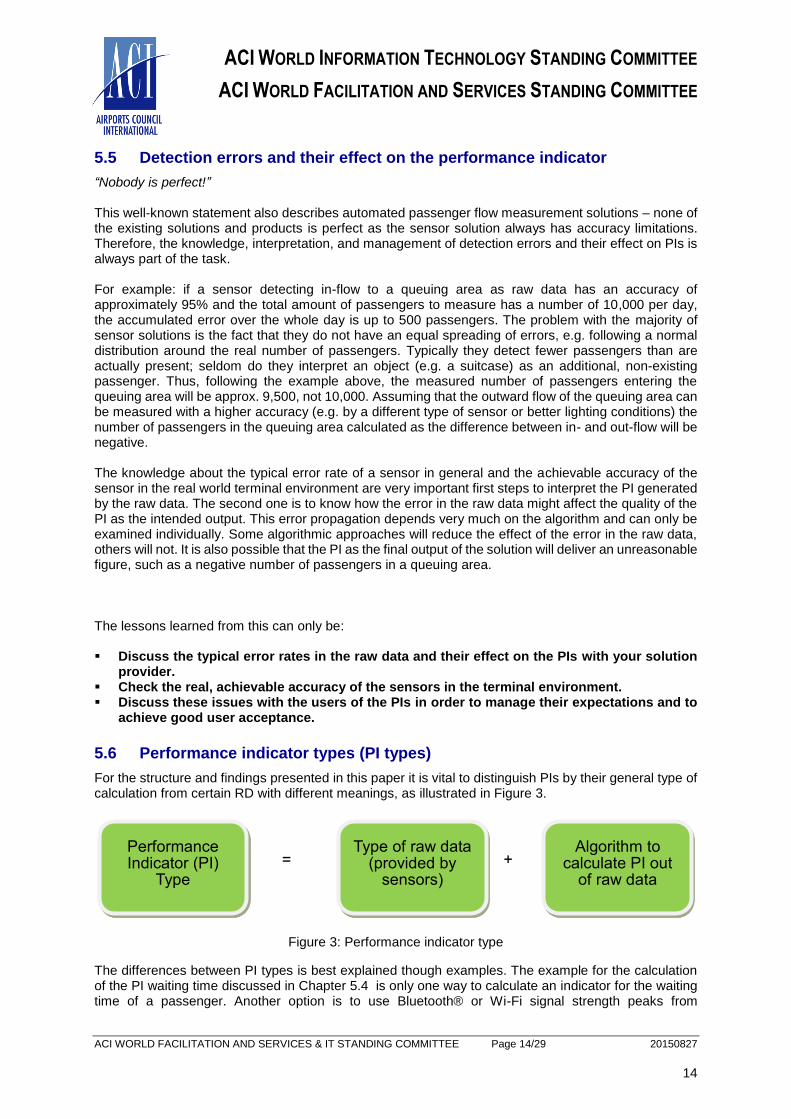
For the structure and findings presented in this paper it is vital to distinguish PIs by their general type of calculation from certain RD with different meanings, as illustrated in Figure 3.
Figure 3: Performance indicator type
The differences between PI types is best explained though examples. The example for the calculation of the PI waiting time discussed in Chapter 5.4 is only one way to calculate an indicator for the waiting time of a passenger. Another option is to use Bluetooth® or Wi-Fi signal strength peaks from
Performance Indicator (PI)
Type
= + Algorithm to
calculate PI out of raw data
Type of raw data (provided by
sensors)
ACI WORLD INFORMATION TECHNOLOGY STANDING COMMITTEE
ACI WORLD FACILITATION AND SERVICES STANDING COMMITTEE
ACI WORLD FACILITATION AND SERVICES & IT STANDING COMMITTEE Page 15/29 20150827
15
passengers’ mobile devices as raw data and derive a waiting time by using algorithms analyzing individual device addresses and time stamps. On the following pages not less than six different PI types for the calculation of wait time are given. Each one is essentially different from the other and therefore examined separately. Finally, it is very important to consider that to some degree, within the calculation of one PI type, one type of sensor technology can be substituted or supplemented by others, e.g. video based passenger counting sensors at the entrance of a security check points queuing area can be substituted or supplemented by BCBP scans. So a mix of well-chosen sensor technologies can support a measurement solution, as long as the quality of the raw data captured with the sensors is comparable and the supplier’s software solution to calculate the PI type supports this option.
6. Influencing factors
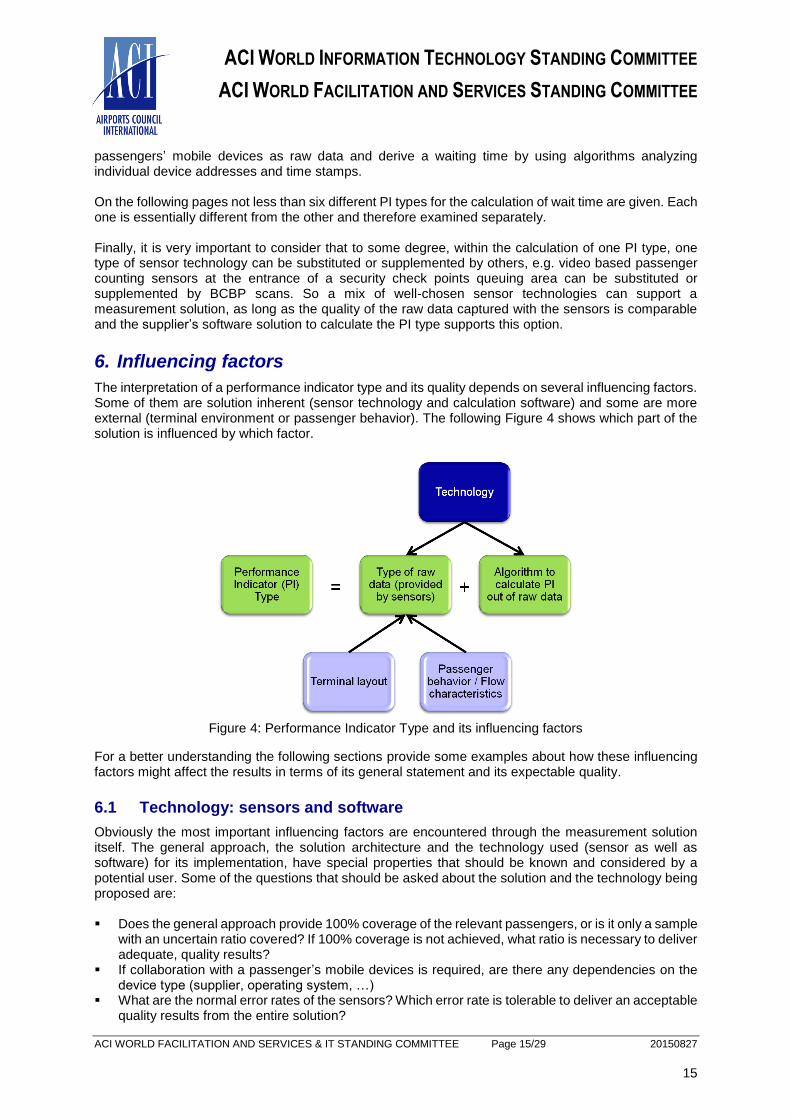
The interpretation of a performance indicator type and its quality depends on several influencing factors. Some of them are solution inherent (sensor technology and calculation software) and some are more external (terminal environment or passenger behavior). The following Figure 4 shows which part of the solution is influenced by which factor.
Figure 4: Performance Indicator Type and its influencing factors
For a better understanding the following sections provide some examples about how these influencing factors might affect the results in terms of its general statement and its expectable quality.
6.1 Technology: sensors and software
Obviously the most important influencing factors are encountered through the measurement solution itself. The general approach, the solution architecture and the technology used (sensor as well as software) for its implementation, have special properties that should be known and considered by a potential user. Some of the questions that should be asked about the solution and the technology being proposed are: Does the general approach provide 100% coverage of the relevant passengers, or is it only a sample
with an uncertain ratio covered? If 100% coverage is not achieved, what ratio is necessary to deliver adequate, quality results?
If collaboration with a passenger’s mobile devices is required, are there any dependencies on the device type (supplier, operating system, …)
What are the normal error rates of the sensors? Which error rate is tolerable to deliver an acceptable quality results from the entire solution?
ACI WORLD INFORMATION TECHNOLOGY STANDING COMMITTEE
ACI WORLD FACILITATION AND SERVICES STANDING COMMITTEE
ACI WORLD FACILITATION AND SERVICES & IT STANDING COMMITTEE Page 16/29 20150827
16
Are there any relevant time schemes to be considered in the process of capturing the raw data to the calculation of the PI?
What is the exact meaning of the PI compared with the passenger flow (retrospective or predictive)? If it is retrospective, how long was the time from the first raw data captured to the provisioning of the PI?
Are there any data privacy aspects to be considered? What is the system supposed to do in “irregular” situations, such as a total lack of passengers or
too many (non-moving) passengers in a defined area at a certain time?
6.2 Terminal environment
The environment of the passenger terminal and the location of sensors can influence the quality of the measurement solution. Precautions that should be taken are: Avoid a mixture of different passenger streams in one observed area when PI is focused on one
stream only. Define queuing areas clearly– especially entrances, lines, and exits - where applicable. Ensure that sensors are not blocked or influenced by obstacles, e.g. doors, walls Ensure that construction activities in the terminal are planned and implemented hand-in-hand with
the measurement solutions Consider the lighting conditions as suitable lighting is often necessary for visual sensors
6.3 Passenger behavior and flow characteristics
Interpreting the results of a passenger flow measurement solution must also take into account the possible behavior of the individual or group of passengers, and the characteristics of passenger flow as a whole. Some issues to consider: The timely resolution of PIs should be higher than the mean variability in passenger flow. Single individuals may not behave as expected e.g. entering or leaving queuing area via the wrong
direction, moving within the queuing area in an unexpected way, waiting longer than necessary due to a telephone call.
Detection of people that are not actually passengers, e.g. staff Movement of people in groups
7. Performance Indicator types (PI types)
7.1 Waiting times
Among all possible PIs the most difficult one to measure and calculate is the waiting time. At the same time this PI very often is the most interesting one for airport terminal management. Hence a short comment on waiting times and their interpretation should help to better understand the following waiting time PI types described in chapters 7.1.1 through 7.1.6. There are two different classes of measured waiting times that have to be distinguished: The retrospective (backward-looking or historical) waiting time: the time passengers have waited in
a queuing area before they left it. The predictive (forward-looking) waiting time: the expected time a passenger will have to wait in the
queuing area when he enters the area. To use a retrospective solution for the prediction of wait times is generally not feasible and is successful only under very special conditions that seldom exist. Therefore, if it is planned to display waiting times to passengers in the terminal building, the only suitable PI is the predictive (forward-looking) wait time.

ACI WORLD INFORMATION TECHNOLOGY STANDING COMMITTEE
ACI WORLD FACILITATION AND SERVICES STANDING COMMITTEE
ACI WORLD FACILITATION AND SERVICES & IT STANDING COMMITTEE Page 17/29 20150827
17
7.1.1 Waiting time – using mobile device signal peak
7.1.1.1 Capturing raw data
Sensor: Bluetooth® or Wi-Fi sensors at the entrances and exits of a queuing area delivering the field strength of the Bluetooth® or Wi-Fi signal strength of an individual mobile device with activated Bluetooth® or Wi-Fi interface. Raw Data: Field strength of the Bluetooth® or Wi-Fi signal of a passenger’s mobile device is identified by its MAC-address. The number of identifiable and therewith potentially useable devices depends on the number of passengers with a mobile device with activated Bluetooth® or Wi-Fi interface. Note: MAC addresses are typically converted to a unique tracking IDs by hashing algorithms, such that no customer specific information is stored. Relevant to know (not exhaustive): Ensure an appropriate focusing of the Bluetooth® or Wi-Fi sensor to avoid unclear signal peaks,
e.g. from far outside of the queuing area. Sufficient ratio of passengers with catchable Bluetooth® or Wi-Fi devices (minimum 10%,
recommended at least 20%). Modern solution sensors typically support both Bluetooth® and Wi-Fi and can reach a higher sample rate (up to 40% and higher) than Bluetooth® or Wi-Fi alone. From the combined sample size approximately half provides usable raw data.
Signal strength does not correlate necessarily with distance between device and sensor, e.g. a change of the mobile device position (inside a bag, pocket, and hand) can influence the signal strength.
Behavior of the Bluetooth® or Wi-Fi interface of a mobile device depends on the implementation of the device supplier, for example, changes in the behavior of the Bluetooth® interface between iOS 4.x to 5.0 reduced the detectability.
The materials used in the interior of the terminal can influence the raw data e.g. by reflections on metal covered walls or metalized glass panes.
Data privacy policies vary from country to country. Therefore, it is advised to check the country-specific regulations (e.g. concerning the usage of MAC-addresses) before selecting a solution
7.1.1.2 Calculation of PI
Algorithm: a) Timestamp identification of an individual mobile device field strength peak at the entrance and
at the exit of a queuing area. (Some sensor types might deliver the timestamp itself as the raw data).
b) Difference between the time stamps is the individual waiting time of the passenger (or the mobile device respectively).
c) Average over all wait time in a predefined time interval (e.g. 15min) is a PI for the waiting time of the passengers in the respective queuing area.
PI: Retrospective wait time – average waiting time of a sufficiently large sample of individual wait times. Relevant to know (not exhaustive): PI is always retrospective (backward looking): all measured waiting processes are in the past, as
well as the average of the measured retrospective waiting times. Unclear identification of a passenger’s mobile device exit peak might increase calculation time
(waiting for signal to vanish to a certain low level).
7.1.1.3 Terminal environment
Relevant to know (not exhaustive):

ACI WORLD INFORMATION TECHNOLOGY STANDING COMMITTEE
ACI WORLD FACILITATION AND SERVICES STANDING COMMITTEE
ACI WORLD FACILITATION AND SERVICES & IT STANDING COMMITTEE Page 18/29 20150827
18
Avoid or reduce zigzagging of passengers before sensors in order to get timely and well defined exit signal peaks. Optimal configuration: one entrance – one exit – one way straight forward.
Avoid other passenger streams passing next to the queuing area to limit mismatches – signal strength does not correlate automatically with the distance to the sensor.
7.1.1.4 Passenger behavior and flow characteristics
Relevant to know (not exhaustive): Passengers telephoning in the queuing area, but standing outside the queue can influence the
measured wait times negatively. Note: some algorithms can filter out such anomalies. Low number of passengers with catchable mobile devices might cause problems Staff working in the queuing area should be advised to disable their mobile device Bluetooth® and
Wi-Fi interfaces to avoid anomalies of the algorithms
7.1.1.5 Any other issues
Relevant to know (not exhaustive): Data privacy issues – in some countries the passengers must be informed by signs or flyers that
their mobile devices’ Bluetooth® or Wi-Fi interfaces are used for other purposes. Strategy of the mobile device suppliers according to BT and Wi-Fi interface configuration: e.g.
problems with Bluetooth® catchability of iOS®-devices2.
7.1.2 Waiting time – using inflow / outflow / occupancy level
This kind of PI type delivers a predictive waiting time. It might be interpreted as a prediction of the waiting time for the next passenger starting his wait process and can thus support public displays indicating actual wait times.
7.1.2.1 Capturing raw data
Sensor: Sensor detecting passengers as they pass over imaginary lines at the entrance and the exit of the
respective waiting area in the terminal. Technology: optical or thermal sensors (cameras with detection and counting firmware), laser
sensors, photo sensor, BCBP scans, AMD scans In the case of different types of sensor usage (which is generally possible, e.g. camera based
sensors at the entrance and AMD scans at the exit) the individual error rates should be as equal as possible. Example: inward flow captured by BCBP scans with nearly 100% accuracy and outward flow captured by a sensor solution with approx. 95% accuracy will lead to inaccurate results. Nonetheless, the typical situation is the usage of one unique kind of sensor – the one provided or recommended by the solution supplier.
Raw Data: Single events of inward or outward moving passengers to or from the respective waiting area. Relevant to know (not exhaustive): Sensors should be able to detect >95% (up to 100%) of the passengers entering or leaving the
relevant area. Errors in capturing of the raw data must be reduced to an absolute minimum. Equal error rates in captured in-flow and out-flow is highly recommended (see above). For optical sensors (cameras) the lighting conditions have to be appropriate at any time of the day.
7.1.2.2 Calculation of PI
Algorithm:
2 In the past Apple changed the behavior of the Bluetooth® devices in a way that makes it more difficult to use the Bluetooth ® signals in such a context.

ACI WORLD INFORMATION TECHNOLOGY STANDING COMMITTEE
ACI WORLD FACILITATION AND SERVICES STANDING COMMITTEE
ACI WORLD FACILITATION AND SERVICES & IT STANDING COMMITTEE Page 19/29 20150827
19
a) Calibration - detect an initial number of people inside the waiting area – ideally “number of passengers in the area” is equal to zero, when the area is truly empty.
b) Increase or decrease “Number of passengers in the waiting area” depending on the inward and outward passing passengers. Therewith continuously update the number of passengers in the waiting area at any point of time.
c) Calculate out-flow rate from the captured out-flow raw-data (number of passengers leaving the waiting area per time interval e.g. 1 min.)
d) “Number of passengers in the waiting area” divided by out-flow rate gives predicted waiting time for the next passenger entering the waiting area.
e) Due to unavoidable measurement errors in the raw data a recalibration of the actual number of passengers in the queuing area is needed after a certain time (at least once a day) – ideally when the area is really empty.
PI:
Predictive waiting time – expected waiting time of the next passenger entering the waiting area. Relevant to know (not exhaustive): The calibration and recalibration of the number of passengers in the relevant waiting area is very
important. The recalibrations should be at least once a day, e.g. in the night when the area is really empty. The higher the error rate in the raw data is, the shorter the intervals between the recalibration should be.
The calibration/recalibration step can be done automatically or manually. In some situations the automatic calibration itself can lead to incorrect calculation results. For
example, due to an irregular terminal situation the queuing area is filled with passengers that are not moving (no in-flow, no out-flow). The system may assume that the queuing area is empty and thus recalibrate. This would result in a waiting time of zero minutes.
The out-flow rate should be updated on a regular basis and whenever a change in the number of allocated process resources takes place – e.g. when the number of open security check point or number of border control lanes changes.
7.1.2.3 Terminal environment
The relevant waiting area must be well defined and the points where passengers can enter and leave have to be covered 100% by the measurement solution. Even minor amendments in the surrounding area of the entry or exit points can cause problems in the measurement process. Thus, after each amendment a check of the sensor calibration is recommended.
Generally the accuracy of the raw data, and therefore of the PI, can be improved when the entering and leaving passengers from the waiting area are forced to separate from each other. For example by a narrow entrance or exit, allowing only a single file of passengers to pass.
Depending on the sensor solution the light conditions must be as optimal and constant as possible. Different kinds of waiting processes must be treated separately in the measurement solution, e.g.
passengers waiting at a priority lane must never be mixed with passengers waiting at a regular lane.
7.1.2.4 Passenger behavior and flow characteristics
A separation of the passengers could help to achieve higher accuracy in the inward or outward flow (raw data)
7.1.2.5 Any other issues
Note that the PI types from chapter 7.1.2 and 7.1.3 use identical raw data. Therefore these PI types can be generated by two different algorithms within the same solution.
7.1.3 Waiting time – using inflow / outflow / imaginary pairs
This kind of PI type delivers a retrospective waiting time.

ACI WORLD INFORMATION TECHNOLOGY STANDING COMMITTEE
ACI WORLD FACILITATION AND SERVICES STANDING COMMITTEE
ACI WORLD FACILITATION AND SERVICES & IT STANDING COMMITTEE Page 20/29 20150827
20
7.1.3.1 Capturing raw data
See chapter 7.1.2.1.
7.1.3.2 Calculation of PI
Algorithm: a) Calibration - detect an initial number of people inside the waiting area; ideally the “number of
passengers in the area” is equal to zero, when the area is really empty. b) Line up timely the data from passenger-entry-events and passenger-exit-events. c) Build pairs of orderly corresponding exit and entry-events (first to first, second to second, and
so on) representing an imaginary passenger entering and leaving the waiting area. d) Calculate time difference between exit and entry per imaginary passenger as a single waiting
time. e) Calculate the average waiting time over a predefined time range (e.g. 1 min or 2 min). f) Due to unavoidable measurement errors in the raw data a recalibration of the actual number of
passengers in the queuing area is needed after a certain time (at least once a day); ideally when the area is really empty.
PI: Retrospective waiting time - average of wait times from imaginary passengers (entry-exit-event
pairs). Relevant to know (not exhaustive): The calibration and recalibration of the number of passengers in the relevant waiting area is very
important. The recalibrations should be at least once a day, e.g. in the night when the area is really empty. The higher the error rate in the raw data is, the shorter the intervals between the recalibration should be.
The calibration/recalibration step can be done automatically or manually. In some situations the automatic calibration itself can lead to inaccurate calculation results. For
example, due to an irregular terminal situation the queuing area is filled with passengers that are not moving (no in-flow, no out-flow). The system may assume that the queuing area is empty and thus recalibrates. This would result in a waiting time of zero minutes.
7.1.3.3 Terminal environment
The relevant waiting area must be well defined and the points where passengers enter and leave the area have to be covered 100% by the measurement solution. Even minor amendments in the surrounding area of the entry or exit points can cause problems in the measurement process. Thus, after each amendment a check of the sensor calibration is recommended.
Generally the accuracy of the raw data, and therewith of the PI, can be improved when the entering and leaving passengers of the wait area are forced to separate from each other. For example by a narrow entrance or exit, allowing only one, single file passenger to pass.
Depending on the sensor solution the light conditions must be as optimal and constant as possible. Different kinds of waiting processes must be treated separately in the measurement solution, e.g.
passengers waiting at a priority lane must never be mixed with passengers waiting at a regular lane. The idea of the PI type is based on an imaginary first-in-first-out (fifo) principle, therefore a well-
defined lining in the waiting area supports this idea by avoiding passing-by effects.
7.1.3.4 Passenger behavior and flow characteristics
A separation of the passengers could help to achieve higher accuracy for the in or outward flow (raw data)
Well defined queues the waiting area to avoid “overtaking” by passengers
7.1.3.5 Any other issues
Note that the PI types from chapter 7.1.2 and 7.1.3 use identical raw data. Therefore these PI types can be generated by two different algorithms within the same solution.
ACI WORLD INFORMATION TECHNOLOGY STANDING COMMITTEE
ACI WORLD FACILITATION AND SERVICES STANDING COMMITTEE
ACI WORLD FACILITATION AND SERVICES & IT STANDING COMMITTEE Page 21/29 20150827
21
7.1.4 Waiting time – using occupancy level and outflow
This kind of PI type delivers a predictive waiting time which may be interpreted as the estimated wait time for the passenger starting the queue process. The information can be used on public displays indicating estimated wait times. The general idea of this PI type follows the one presented in 7.1.2. The difference is, that the occupancy level is directly measured instead of calculated from in and outflow.
7.1.4.1 Capturing raw data
Sensor: Sensors covering the whole waiting area and detecting all passengers waiting at any time. Technology: optical or thermal sensors (cameras with detection and evaluation firmware). Some
sensor solutions are able to use cameras with an overlapping field of view to cover completely a large waiting area.
Sensors detecting passengers as they pass over imaginary lines at the exit of the respective waiting area in the terminal (outflow).
Ideally the sensors for the detection of the occupancy level can also be used to determine the outflow. Otherwise a second type of sensor can be used for the detection of the outflow.
Raw Data: Number of passengers waiting at the respective waiting area at any time and single events of
outward moving passengers from the respective waiting area. Relevant to know (not exhaustive): Sensors should be able to detect >95% (up to 100%) of the passengers. Errors in capturing of the
raw data must be reduced to an absolute minimum. For optical sensors (cameras) the lighting conditions have to be appropriate at any time of the day.
7.1.4.2 Calculation of PI
Algorithm: a) Calculate out-flow rate from the captured out-flow raw-data (number of passengers leaving the
waiting area per time interval e.g. 1 min.) b) Detect the number of passengers waiting in the respective waiting area. c) The number of passengers in the waiting area divided by the actual out-flow rate gives predicted
waiting time for the next passenger entering the waiting area. PI: Predictive waiting time – expected waiting time of the next passenger entering the waiting area. Relevant to know (not exhaustive): A calibration and recalibration process as described in section 7.1.2 is not necessary as the sensor
solution delivers the number of passengers in the defined waiting area at any time. If the waiting area cannot be covered by one single sensor then a sufficient number of identical
sensors can be combined to provide an acceptable solution. The fields of view of these sensors are assembled to one complete picture of the defined waiting area.
The outward flow at the exit of the waiting area can be measured by the same sensors as the occupancy of the waiting area. If this is not possible for any reason, a different sensor solution can be used to capture the outward flow raw data.
7.1.4.3 Terminal environment
The relevant waiting area must be well defined and has to be covered 100% by the measurement solution. Thus, after each amendment a check of the sensor calibration is recommended.
To achieve a 100% coverage of the defined waiting area very often more than one sensor must be combined. When the ceiling is low and the waiting area is large, multiple sensors might be necessary. If this is the case, the overall cost may be much higher than the solutions for the PI types provided in section 7.1.2. Nonetheless, the effort might be beneficial since the number of passengers in the waiting area are measured directly in high accuracy at any time.
ACI WORLD INFORMATION TECHNOLOGY STANDING COMMITTEE
ACI WORLD FACILITATION AND SERVICES STANDING COMMITTEE
ACI WORLD FACILITATION AND SERVICES & IT STANDING COMMITTEE Page 22/29 20150827
22
Generally the accuracy of the outward flow raw data, and therefore of the PI, can be improved when the passengers exiting the waiting area are forced to separate from each other. For example through a narrow entrance or exit, allowing only a single file of passengers to pass.
Depending on the sensor solution the light conditions must be as optimal and constant as possible. Different kinds of waiting processes must be treated separately in the measurement solution, e.g.
passengers waiting at a priority lane must never be mixed with passengers waiting at a regular lane.
7.1.4.4 Passenger behavior and flow characteristics
A separation of the passengers could help to achieve higher accuracy in the outward flow (raw data)
7.1.5 Waiting time – using passenger tracking
This kind of PI type delivers a retrospective waiting time.
7.1.5.1 Capturing raw data
Sensor: Sensors that can track the movement of an individual passenger through a defined terminal area,
e.g. a waiting area Technology: array of optical camera sensors (with detection firmware) that cover the entire waiting
area and are able to follow “a track” over several cameras or a set of Wi-Fi access points in combination with triangulation software (using Wi-Fi signal strength) to generate a path of a passenger’s mobile device throughout the waiting area.
Raw Data: Individual passenger 4D-track (X-Y(-Z) space coordinates plus time) throughout the waiting area
(location and time). Relevant to know (not exhaustive): Camera based solutions will only be applicable when the height of the ceiling is sufficient to use a
limited amount of cameras to cover the whole waiting area. If the ceiling is too low a large number of cameras will be needed.
For optical sensors (cameras) the lighting conditions have to be appropriate at any time of the day. Access point placement must be designed for proper triangulation. The sample size of a camera based solution is naturally independent on the passenger’s mobile
device settings and the Wi-Fi based solution depends on the ratio of present mobile devices with activated Wi-Fi interface.
The accuracy of the 4D-track must be good enough to properly derive when a passenger entered and left the waiting area.
The materials used in the interior of the terminal can influence the Wi-Fi based raw data e.g. by reflections on metal covered walls or metalized glass panes.
For the Wi-Fi version the positioning of a mobile device in the passengers belongings might influence the accuracy of the track.
7.1.5.2 Calculation of PI
Algorithm: a) Identify the timestamps for entering and leaving the wait area in a 4D-track. b) Calculate the time difference between entry and exit as an individual wait time of a passenger. c) Calculate the average wait time over a predefined time range (e.g. 1 min or 2 min) over the
entire sample set. d) Algorithms can make use of the speed of the passengers/mobile device in the 4D-track to
distinguish normal movement from waiting. PI: Retrospective waiting time - average waiting times from 4D-tracks (entry point to exit point). Relevant to know (not exhaustive):

ACI WORLD INFORMATION TECHNOLOGY STANDING COMMITTEE
ACI WORLD FACILITATION AND SERVICES STANDING COMMITTEE
ACI WORLD FACILITATION AND SERVICES & IT STANDING COMMITTEE Page 23/29 20150827
23
The sample size should be sufficient to calculate an appropriate average wait time (absolute minimum 10%, recommendation >20%). Modern Wi-Fi-based solutions can reach a higher sample rate (up to 40% and higher). From the combined sample size approximately half provides usable raw data.
For camera based systems the sample size should not be a problem since camera based solutions should reach easily between 80% and 95%.
Sensor placement and number is must be optimized to generate proper 4D-tracks. Wi-Fi signals from staff devices must be filtered by the algorithm.
7.1.5.3 Terminal environment
No strict definition of entry and exit points needed, but helpful. Entry areas or lines and exit areas or lines are also applicable.
Optimal placement of sensors (Wi-Fi as well as camera) to get valid 4D-tracks. Depending on the sensor solution the light conditions must be as optimal and constant as possible.
7.1.5.4 Passenger behavior and flow characteristics
Passengers standing still, using their smart device just outside the queue area can influence the measured wait times negatively. Note: some algorithms can filter out such anomalies.
Low number of passengers with Wi-Fi catchable mobile devices might cause problems for Wi-Fi based solutions.
7.1.5.5 Any other issues
Data privacy issues – in some countries the passengers must be informed by signs or flyers that their mobile devices Wi-Fi interfaces are used for other purposes.
7.1.6 Waiting time – using facial recognition biometrics
This kind of PI type delivers a retrospective waiting time.
7.1.6.1 Capturing raw data
Sensor: Any kind of optical camera that could provide a video stream of passengers entering or leaving a
waiting area. The positions and resolution of the cameras should be such that it delivers an appropriate video stream to apply facial recognition software on captured faces.
At least one camera covering each entry point or exit point of a waiting area. Raw data: Video stream with time line. Relevant to know (not exhaustive): The position of the cameras should ensure as many faces captured as possible. As with each camera based solution, the lighting conditions should be considered in order to reach
an optimal video stream.
7.1.6.2 Calculation of PI
Algorithm: a) Capture faces from the video streams and extract biometrical information from the pictures of
the faces. b) Compare the biometrical information from the exit points and the entry points in order to match
faces. c) Whenever a face from the entry point was recognized at an exit point, compute the time
difference between entry and exit as a waiting time of this individual passenger. d) Calculate the average waiting time over all individual waiting times in a predefined time range
(e.g. 1 min or 2 min).
ACI WORLD INFORMATION TECHNOLOGY STANDING COMMITTEE
ACI WORLD FACILITATION AND SERVICES STANDING COMMITTEE
ACI WORLD FACILITATION AND SERVICES & IT STANDING COMMITTEE Page 24/29 20150827
24
PI: Retrospective waiting time - average waiting time of a sufficient sample of finished real waiting
processes. Relevant to know (not exhaustive): Such a solution always works with a sample of the real passengers, since a facial recognition
solution based on video technology cannot guarantee a 100% capturing and processing of all passengers.
A sample size of >20% recognized faces should be easy to achieve and sufficient to generate good waiting time data.
The sample size could be increased by an optimal positioning of the cameras and lighting conditions. In some countries a data privacy issue might arise. This might be mitigated by a pro-active
information policy: the solution is not identifying passengers, but rather comparing faces from the entry point and the exit point, and the data is not stored for other purposes. If a face is biometrically recognized, then this indicates a complete waiting process.
Due to data privacy issues neither the raw data (video stream), nor the biometrical information should be stored longer than necessary to generate the wait time of a passenger.
7.1.6.3 Terminal environment
Generally the accuracy of the PI can be improved when the passengers entering and exiting the wait area are forced to separate from each other, for example by a narrow entrance or exit, allowing only one, single file passenger to pass.
Light conditions should be optimized for the cameras.
7.1.6.4 Passenger behavior and flow characteristics
Passengers should be guided in a way that allows for a clear face capture on the video stream.
7.1.6.5 Any other issues
Data privacy issues – in some countries the passengers must be informed by signs or flyers that their biometrical information is captured.
7.2 Process throughput
7.2.1 Capturing raw data
Sensor: Sensor detecting directional flow of passengers over an imaginary line, e.g. at the exit of a process
area, such as immigration or security Technology: optical sensors (cameras with detection and counting firmware), laser sensors, thermal
sensors, infrared sensors, BCBP scans, AMD scans, … Aside from BCBP scans which provide nearly 100%-accuracy, other counting solutions typically
range from 95-98% accuracy. As cumulative errors may occur, counting should be done per interval of time, e.g., count within the last one to five minutes.
Raw Data: Inward and outward flow to and from the respective area per time interval or as single counting
events. Relevant to know (not exhaustive): Sensors should be able to detect nearly 100% of the passengers entering or exiting the relevant
area. Errors in capturing of the raw data must be reduced to an absolute minimum. For optical sensors (cameras) the lighting conditions have to be appropriate at any time of the day. The accuracy of the sensors can typically be supported by different kinds of measures –
constructional or technical.
ACI WORLD INFORMATION TECHNOLOGY STANDING COMMITTEE
ACI WORLD FACILITATION AND SERVICES STANDING COMMITTEE
ACI WORLD FACILITATION AND SERVICES & IT STANDING COMMITTEE Page 25/29 20150827
25
7.2.2 Calculation of PI
Algorithm: Average throughput count per time interval = PI Relevant to know (not exhaustive): Most sensor technologies provide a net count, should a passenger go backwards through the
process, e.g. 10 in less 2 out equals 8
7.2.3 Terminal environment
Relevant to know (not exhaustive): Aside from using BCBP scans and visual cameras, an imaginary count line needs to be located in
an area where passengers move and do not dwell, as some technologies cannot see the passenger without movement, e.g. thermal sensors
Depending on the sensor solution the light conditions must be as optimal and constant as possible.
7.2.4 Passenger behavior and flow characteristics
Relevant to know (not exhaustive): The solution should factor out staff movements
7.3 Passenger show-up profile
7.3.1 Capturing raw data
Sensor: BCBP scanner/sensors are typically located at the entry to security, or at boarding, with optional
sensors at intermediate points, such as lounge access Technology: BCBP scanners capable of reading both paper and mobile BCBPs, which provide
nearly 100% accuracy, assuming the use of IATA standard type M bar codes Raw Data: BCBP scanners collect the contents of the entire BCBP, as well as a location and time stamp Relevant to know (not exhaustive): BCBP data can typically be filtered to provide only the data fields necessary, e.g. flight number, as
there are typically data ownership and privacy issues.
7.3.2 Calculation of PI
PI algorithm: comparison of time stamp and relevant flight data from AODB parameter fitting with assumed stochastic distribution show-up profile = PI
7.3.3 Terminal environment
The BCBP scanner can be provided through agent manned workstations, handheld terminals, and/or via automated security and boarding gates
7.3.4 Passenger behavior and flow characteristics
Some passengers have difficulty in scanning their own BCBPs. As such, it may be necessary for an agent to monitor the use of self-service security and boarding gates, and provide assistance as required
Manually boarded passengers are not seen by the application, as they are not scanned, and hence not recorded
Non standard BCBPs, e.g. 1D bar codes, are typically not supported
ACI WORLD INFORMATION TECHNOLOGY STANDING COMMITTEE
ACI WORLD FACILITATION AND SERVICES STANDING COMMITTEE
ACI WORLD FACILITATION AND SERVICES & IT STANDING COMMITTEE Page 26/29 20150827
26
7.3.5 Any other issues
In addition to validate against flight info within the AODB, BCBPs can be validated against the airline DCS provided that the airline has implemented the IATA standard for such purpose
7.4 Queue length overrun
7.4.1 Capturing raw data
Sensor: Technology: although best measured via an optical sensor(s), by simply counting heads, it is
possible to detect overflow queues, and their impact on queue times, with other technologies, e.g., Bluetooth/Wi-Fi (adjusting for the population with/without Bluetooth/Wi-Fi enabled phones), typically in combination with some form(s) of in-flow and out-flow people counting
Raw Data: Number of people in a pre-defined queue-overrun area provided by optical sensor Relevant to know (not exhaustive): Requires a structured overflow queuing area(s). Visual cameras typically provide 95-98% accuracy
7.4.2 Calculation of PI
PI algorithm: number of people in the indication area greater than threshold for predefined minimum time queue length overrun indicated = PI
7.4.3 Terminal environment
With visual cameras, ceiling height is a key factor, e.g. the lower the ceilings, the greater the number of cameras required. It should be noted that the cost can become prohibitive
In low ceiling situations it is necessary to “stitch” together multiple visual cameras to provide an accurate count within an area
7.4.4 Passenger behavior and flow characteristics
Overflow areas may consist of both passengers and non passengers, which will vary by the location being measured, hence the need for structured overflow queues
7.5 Area occupancy
The PI area occupancy is typically defined as the number of passengers in a pre-defined area. From this PI it is easily possible to calculate a density of passengers in an area by dividing the number of passengers in the pre-defined area by its square meters.
7.5.1 Area occupancy – using inflow-outflow deltas
The calculation of this PI type is typically part of the waiting time PI type described in chapter 7.1.2. Hence the accuracy of these two PI types depends on the same factors.
7.5.1.1 Capturing raw data
Sensor: Sensor detecting passengers as they pass over imaginary lines limiting the respective area in the
terminal. Technology: optical sensors (cameras with detection and counting firmware), laser sensors, thermal
sensors, infrared sensors, BCBP scans, AMD scans, … In case of a usage of different types of sensors the individual errors rates should be as equal as
possible, for example, inward flow captured by BCBP scans with nearly 100% accuracy and outward flow captured by a sensors solution with approx. 95% accuracy will lead to inaccurate results.
ACI WORLD INFORMATION TECHNOLOGY STANDING COMMITTEE
ACI WORLD FACILITATION AND SERVICES STANDING COMMITTEE
ACI WORLD FACILITATION AND SERVICES & IT STANDING COMMITTEE Page 27/29 20150827
27
Raw Data: Inward and outward flow to and from the respective area per time interval or as single counting
events. Relevant to know (not exhaustive): Sensors should be able to detect 100% of the passengers entering or leaving the relevant area.
Errors in capturing of the raw data must be reduced to an absolute minimum. Equal error rates in captured in-flow and out-flow is highly recommended. For optical sensors (cameras) the lighting conditions have to be appropriate at any time of the day. The accuracy of the sensors can typically be supported by different kinds of measures –
constructional or technical.
7.5.1.2 Calculation of PI
Algorithm:
a) Calibration - detect an initial number of people inside the relevant area – ideally “number of passengers in the area” is equal to zero, when the area is really empty.
b) Increase or decrease “number of passengers in the area” depending on the inward and outward passing passengers. Calculated per time interval or continuously when single counting events are used.
c) Due to unavoidable measurement errors in the raw data a recalibration is needed after a certain time.
PI: Number of passengers in a relevant area Density of passengers in an area = number of passengers in the area / square meters of the area Relevant to know (not exhaustive): The calibration and recalibration of the number of passengers in the relevant waiting area is very
important. The recalibrations should be at least once a day, e.g. in the night when the area is really empty. The higher the error rate in the raw data is, the shorter the intervals between the recalibration should be.
The calibration/recalibration step can be done automatically or manually
7.5.1.3 Terminal environment
Relevant to know (not exhaustive): Relevant area must be well defined and all boundaries where passengers can enter and leave the
area have to be covered 100% by the measurement solution. Depending on the sensor solution the light conditions must be as optimal and constant as possible.
7.5.1.4 Passenger behavior and flow characteristics
Relevant to know (not exhaustive): A separation of the passengers could help to achieve higher accuracy for the in- or outward flow
(raw data) In- and outward movements at the same position should be avoided
7.5.2 Area occupancy – direct counting
7.5.2.1 Capturing raw data
Sensor: Technology: best measured via an optical sensor(s), by simply counting heads Raw Data: Number of people in a defined indication area provided by optical sensor Relevant to know (not exhaustive): Visual cameras typically provide 95-98% accuracy

ACI WORLD INFORMATION TECHNOLOGY STANDING COMMITTEE
ACI WORLD FACILITATION AND SERVICES STANDING COMMITTEE
ACI WORLD FACILITATION AND SERVICES & IT STANDING COMMITTEE Page 28/29 20150827
28
7.5.2.2 Calculation of PI
PI algorithm: actual people count = PI
PI: Number of passengers in a relevant area Density of passengers in an area = number of passengers in the area / square meters of the area
7.5.2.3 Terminal environment
With visual cameras, ceiling height is a key factor, e.g. the lower the ceilings, the greater the number of cameras required. It should be noted that the cost can become prohibitive
In low ceiling situations it is necessary to “stitch” together multiple visual cameras to provide an accurate occupancy count within an area
Visual cameras are very affordable when the ceilings are higher For visual cameras, the light conditions must be as optimal and constant as possible
7.5.2.4 Passenger behavior and flow characteristics
No comments
8. List of abbreviations
ACI Airports Council International AMD Automated Metal Detector AODB Airport Operational Data Base BCBP Bar Coded Boarding Pass BI Business Intelligence IATA International Air transport Association iOS Apple mobile operating system KPI Key Performance Indicator MAC-Address Media-Access-Control Address PI Performance Indicator RD Raw Data SITA Société Internationale de Télécommunication Aéronautique WAITSC World Airport Information Technology Standing Committee Wi-Fi Wireless Local Access Network
9. Annexes
Annex 1: SITA Passenger Counting and Tracking Technology – Comparison Fact Sheet – Version 4.7 from 18th of August 2018

ACI WORLD INFORMATION TECHNOLOGY STANDING COMMITTEE
ACI WORLD FACILITATION AND SERVICES STANDING COMMITTEE
ACI WORLD FACILITATION AND SERVICES & IT STANDING COMMITTEE Page 29/29 20150827
29
(double click on the picture to open the document)