Embed Size (px)
Citation preview

www.pwc.com/hospitality
Best placed to grow? European cities hotel forecast for 2018 and 2019
April 2018

Overview Best placed to grow in 2018 and 2019
The 7th edition of PwC’s European cities hotel forecast for 2018 and 2019 analyses past trading trends and provides econometric forecasts for 12 cities, all national or regional capitals of finance, commerce, culture or tourism. This year we also look at some key challenges facing hotels, including profitability erosion, responding to changing guest needs, the threat of overtourism and the sharing economy. We also look at what the record trading metrics mean for deals and investment.
2
Euro
pean
cit
ies
hote
l for
ecas
t for
201
8 an
d 20
19

2017 was an exceptional year for international travel in Europe. Record travel demand pushed volumes up to 671 million international tourist visits, an 8% increase on 2016. Growth was driven by extraordinary results in the southern and Mediterranean region, where tourist arrivals were up 13%, according to the United Nations World Travel Organisation (UNWTO). This record growth was primarily underpinned by the improving economic outlook across the Eurozone which continued to propel business and leisure travel. Besides the strong demand from intra-European markets, the US, China and the return of demand from Russia were significant influences.
Hotels were a major beneficiary of this strong demand, which was also supported by limited overall growth in new supply across the region. The majority of gateway cities and key resort destinations saw strong RevPAR growth (a key sales metric) in 2017. Many hotel groups cite plans to take advantage of the boom to exploit new growth opportunities, launch new brands, new generational concepts and to make acquisitions to grow portfolios.
How long can this good fortune continue? While there are plenty of geopolitical headwinds, we remain cautiously optimistic and our latest expectations are for further fairly strong RevPAR growth overall in Europe. With occupancies already at high or record levels, it’s primarily ADR driving growth. Some cities hope to become winners from Brexit, e.g. the European Medicines Agency, which used to generate around 40,000 annual London room nights, is relocating to Amsterdam. Others hope to benefit from corporate relocations from London.
In 2018, we expect the strongest RevPAR growth in Porto, whose continued tourism success story means over 10% RevPAR growth is forecast. Amsterdam, Lisbon and Prague all see around 7% growth. Paris is seeing signs of a sustained recovery and for it and Milan we expect 3.6% and 3.9% RevPAR growth, respectively. Other cities seeing growth include Geneva (+2%), Rome (+1.8%), and Berlin (+1.3%).
A slower pace of growth is expected in London (+0.6%) where Brexit uncertainty, a fizzling out of the weak pound effect and a supply spike are expected; Only Frankfurt (-0.2% as the fair cycle impacts) and Zurich (-1.9% as hotels lower ADR in response to increased competition i.e. supply additions) are expected to show declines in 2018.
In 2019, Paris jointly tops the growth chart with Lisbon, with around 6.5% growth apiece forecast. Porto, Frankfurt, Amsterdam and Prague also exhibit strong growth expectations. London and Berlin are expected to see RevPAR strengthen.
There are plenty of challenges facing the sector. We highlight four issues: profitability erosion as increased RevPAR fails to automatically translate into increased profitability; changing guest needs, how can hotels can provide what new generations and new market segments want? the sharing economy – ignore it or embrace it? and overtourism, an issue being tackled by some cities such as Amsterdam, Venice and Barcelona. When do cities have too many visitors?
European hotel transaction volume reached €20.9 billion in 2017. This was an 11% increase compared to 2016 deal volume and surpassed the record level achieved in 2015. This growth was driven by a resurgence in UK hotel investment activity in 2017 and record levels of investment in the Spanish hotel market.
The start of 2018 has seen a strong level of investment activity in the UK through the sale of SACO serviced apartments and with Lone Star’s sale of its Mecure/Hilton portfolio and Starwood Capital’s sale of its Principal/De Vere portfolio reportedly progressing well. The Spanish hotel market has also seen Blackstone’s takeover bid for Hispania and HNA’s stake in NH Hotels being brought to market. Put together with the continued European and international interest in the German hotel market, we anticipate European hotel transaction volume to moderately increase in 2018 from 2017 levels.
2017 was an exceptional year for hotels but we remain cautiously optimistic for 2018 and 2019
3
Euro
pean
cit
ies
hote
l for
ecas
t for
201
8 an
d 20
19
3

4
Euro
pean
cit
ies
hote
l for
ecas
t for
201
8 an
d 20
19
5
ContentsOverview 3
The forecasts: city prospects 6
Which cities will be the most expensive, the fullest and have the highest RevPAR? 9
Economic, travel and supply drivers 14
Four challenges facing hotels 20
Deal talk 24
The European cities forecasts 26
Methodology for the hotel forecasts 2018 and 2019 48
Further reading 49
Contact 50
5
Euro
pean
cit
ies
hote
l for
ecas
t for
201
8 an
d 20
19

The forecasts: City prospects in 2018 and 2019
What’s driving the growth?Each city has its own story to tell with its own specific drivers but generally, the performance of Europe’s cities displays some common themes. Continuing global and regional economic recovery following the financial crisis has fuelled strong leisure and business demand for travel and hotels.
Many are gateway cities, capitals of culture and tourism magnets. Performance reflects Europe’s position as a key tourism destination and the continued demand from travellers to visit exceptional short break and holiday destinations. Many of the cities are also regional or national capitals of finance and commerce and business travel is their lifeblood, e.g. 75% of Frankfurt’s tourism arrivals are business visitors.
Some cities attract both business and leisure tourists and events remain a key catalyst. Fairs and congresses remain a mainstay of German demand and their cyclicality is reflected in hotel performances. Every second year (2019 will be the next) the 11 day International Automobile Fair (‘IAA’) comes to Frankfurt, attracting 800,000 visitors. It’s not just Germany that sees an uplift from cyclical events, The Farnborough International Airshow (‘FIA’) comes to London this year and returns to Paris in 2019; the GSMA Mobile World Congress is in Barcelona again in 2018 and Amsterdam Dance Event 2018 is the world’s biggest Club festival and Amsterdam’s leading electronic music festival, with over 400,000 visitors expected. Other cities, such as Geneva and Lisbon, are leading MICE markets.
Accessibility is an important differentiator, as Lisbon and Porto have demonstrated with better air connectivity. Investment in transport infrastructure can facilitate tourism. Berlin’s Brandenburg Airport could finally open in late 2020; Lisbon reports tourism expansion could be constrained by lack of airport capacity. In Geneva, airport investment and modernisation currently precedes a push for more long haul and international leisure travellers.
Safety and security is a crucial issue for leisure travellers. Witness the move away from North African destinations in recent years and the incipient comeback of Morocco, Egypt and Tunisia. Perceived safe environments such as Spain, Portugal and the Czech Republic have benefitted and are expected to continue to benefit.
Supply constraints or oversupply are also a factor helping or hindering performance. A lack of new supply in Prague is reported as boosting ADR. In other cities, like London, imbalances can cause a headache for hoteliers for a while. Others prosper despite supply imbalances.
The sharing economy continues to boost travel and create positive perceptions/experiences of Europe’s destinations but at the same time may absorb room nights from hotels.
Tourism is a highly competitive global market and countries and cities seek to gain market share. France has set ambitious tourism targets and demonstrated the political will to accelerate visa procedures and reduce waiting times at airport borders, which should result in tourism growth.
European cities saw exceptional hotel performance in 2017. Almost all the cities in this latest forecast are expected to see further growth in 2018 and 2019. Strong demand has propelled some into the spotlight yet again; others have moved up or down the growth rankings. In 2018. Porto leads the growth pack with just over 10% RevPAR growth anticipated; Amsterdam and Lisbon could see around 7% RevPAR growth and further robust gains are expected in Prague, Milan and Paris. Geneva and Rome are also forecast to see some moderate growth, but the pace is expected to slow in London in 2018. Paris has shown sustained recovery and shares the top spot in 2019 with Lisbon, with around 6.5% RevPAR growth expected for both cities.
6
Euro
pean
cit
ies
hote
l for
ecas
t for
201
8 an
d 20
19

So how does the travel boom in Europe play out in the markets we have analysed? In 2018, the highest potential growth is forecast for Portugal’s tourism star, Porto, which could see a further 10.3% RevPAR growth, on top of four years of consecutive double digit growth. 2017 alone saw almost 21% RevPAR growth. Amsterdam is next up, with 7.1% RevPAR growth, after double digit growth in 2017. Amsterdam’s growth is driven by strong ADR gains. Lisbon also expects a 7% gain in RevPAR, as the Eurovision Song Contest and the Web Summit support demand, and follows 22% growth last year. Prague makes the top four with almost 7% growth reflecting constrained supply, buoyant weekend travel and a return of Russian tourists. See Table 1.
Milan achieved almost double digit growth in 2017 supported by the EXPO legacy and we expect further growth of almost 4% this year. Tourists came back to Paris in 2017 as safety concerns appeared to ease and Paris saw around 8% growth last year (after a 14% fall in RevPAR and smaller declines between 2013-2015). Aided by favourable economic growth, this year we expect around 3.6% further RevPAR growth.
Geneva, home to over 400 international organisations and non-government organisations (‘NGOs’), could see 2% RevPAR growth in 2018.
Although Rome is one of the leading hotel markets in Europe, performance growth recorded in 2017 was very limited, especially when compared to other major markets in Italy, such as Venice, Milan, and Florence, which all saw substantial increases in RevPAR. For 2018, we expect almost 2% RevPAR growth, mainly driven by an increase in ADR, which is still below pre-crisis levels. Berlin’s performance was dampened by the insolvency of the Berlin-based Air Berlin, new supply growth and the strong growth in the sharing economy, which has been cited as a pressure by hoteliers.
At the opposite end of the table to the leaders, the pace of growth is expected to slow in London in 2018. Frankfurt and Zurich are expected to see no growth. Frankfurt’s hotel performance is traditionally slightly volatile due to the biennial scheduled fairs and RevPAR grew by 4% y-o-y in 2017. In Zurich, a continuous increase in supply and flat demand, has meant Zurich’s hotels have turned towards competitive pricing strategies. Falling ADR and flat occupancy is exacerbated by large supply additions. We forecast a 1.9% decline in RevPAR for Zurich in 2018.
2018 forecast: Porto, Amsterdam, Lisbon and Prague forge ahead
City 2018 RevPAR growth City 2019 RevPAR growth
Amsterdam 7.1% Amsterdam 3.5%
Berlin 1.3% Berlin 2.0%
Frankfurt -0.2% Frankfurt 4.3%
Geneva 2.0% Geneva 1.5%
Lisbon 7.0% Lisbon 6.5%
London 0.6% London 1.9%
Milan 3.9% Milan 2.6%
Paris 3.6% Paris 6.4%
Porto 10.3% Porto 5.2%
Prague 6.8% Prague 3.4%
Rome 1.8% Rome 1.5%
Zurich -1.9% Zurich 0.5%
Source: Econometric forecast PwC 2018 Benchmarking data: STR 2018
Table 1: Best placed for growth RevPAR (local currency) growth rates
Prospects are rather encouraging in Paris after the solid rebound of 2017. The market is not yet back to the levels of 2015 in terms of RevPAR, but we can expect to be there by end of 2018 - early 2019. Ronan Keravel, Director Hotel Asset Management, ATREAM, 2018
7
Euro
pean
cit
ies
hote
l for
ecas
t for
201
8 an
d 20
19

2019 forecast: Paris makes a strong comeback, as growth beds in
Lisbon and Porto stay up in the growth table but the pace of growth for Porto halves to just over 5%, still not bad compared to growth in some other cities. Frankfurt sees a good fair and congress year in 2019, with the IAA returning and the city expects around 4.3% RevPAR growth. Frankfurt hopes to capitalise on corporates and organisations leaving London pre and post Brexit, and so far, there are reports that several international banks have already decided to move to Frankfurt and others (like Goldman Sachs) plan to enlarge their operations in the city. 2019 has the potential to be a positive year for Frankfurt’s hotel sector.
Amsterdam too hopes to capitalise on Brexit. The European Medicines Agency (EMA) will relocate to Amsterdam in 2019. The EMA is reported to generate around 40,000 room nights a year. Nevertheless, in 2019 Amsterdam’s growth slips a little, however 3.5% RevPAR growth is still anticipated, driven by continued economic growth.
Milan’s hotel market should continue to grow, driven by the EXPO legacy, international events and increasing leisure demand, with RevPAR forecasted to increase by 2.6% in 2019.
In 2019, Berlin’s growth picks up slightly, driven by a marginal uptick in occupancy and ADR, and the city sees 2% RevPAR, as economic growth continues and tourism arrivals stabilise.
In 2019, some modest growth is expected to return to London, despite uncertainty and potential Brexit related issues, as economic growth is expected to stabilise, and y-o-y comparables become less challenging. Geneva is expected to see a marginal fall in occupancy in 2019 but 1.7% growth in ADR drives continued RevPAR growth of around 1.5%. Rome also sees 1.5% RevPAR growth in 2019, mainly driven by ADR, which remains below pre-crisis levels. In Zurich, occupancy sees a 1.3% gain in 2019, to 73%, giving a marginal RevPAR uptick of 0.5%.
We expect further growth in all the cities in 2019 but it is particularly Paris that stands out. The French capital is expected to enjoy a sustained comeback with 6.4% RevPAR growth expected, driven by economic improvement and recovery from historic terrorist events.
8
Euro
pean
cit
ies
hote
l for
ecas
t for
201
8 an
d 20
19

The highest occupanciesThe highest occupancies are forecast to be in London in 2018 (despite high supply additions) with 82% occupancy and Amsterdam (also despite high new supply), with almost 82% occupancy. Prague is hot on their heels, with 81% occupancy. Lisbon, Berlin and Porto should have occupancies in the high 70’s.
Remarkably, all the other cities have occupancies in the mid to low 70s, reflecting strong demand and perhaps a structural shift towards more branded budget hotels, a higher proportion of chains in some countries, as well as access to online distribution channels and a greater propensity to travel.
Prague and London top the table in 2019 with occupancy at 82.3%; followed by Amsterdam, at almost 82%. There is some shifting in relative positions below these three in 2019, but all the cities see occupancy continue in the 70’s.
The highest ADRs (€)Geneva continues to rank as one of Europe’s leaders in terms of ADR, and in 2018 the city has an ADR in euro terms of €241.6 In recent years however, Geneva has been facing challenges in maintaining its average rates and attracting leisure demand.
Paris follows in second place with ADR of €236.2 ADR growth of 2.1% is forecast for 2018, mainly due to the upward trend in luxury hotel rates. Next comes Zurich with ADR of €197.1 and London follows with €162.4.
The cost of a hotel room in Geneva and Zurich partly reflects the appreciation of the Swiss franc and exchange rate assumptions against the euro.
Berlin and Prague’s ADR remain below €100. In Prague, performance measured in euro has been positively impacted by CZK appreciation after the Czech National Bank exited the currency intervention regime in 2017. Berlin has a relatively strong midscale segment, which leads to a quite low ADR.
The ADR rankings for the top 7 cities, remain the same in 2019.
The highest RevPARs (€)Interestingly, the RevPAR rankings remain the same in both 2018 and 2019.
Paris tops the chart with an expected RevPAR of €176.3 in 2018 and €187.6 in 2019. Geneva shadows Paris with €170.3 and €172.9 in 2018 and 2019 respectively. Zurich follows in third place with €142.7 (2018) and €143.5 (2019).
London takes fourth place each year, with €133.2 in 2018 and €134.1, the following year.
For Amsterdam we forecast €124.5 in 2018 and €128.9 in 2019. In 2018, Rome and Milan follow, all with RevPAR above €100 and are joined by Lisbon, with €100.6 in 2019.
At the other end of the table, Berlin, Prague and Porto’s RevPAR remains around €100 lower than that of Paris. In 2018, these cities could see RevPAR of €74.3 (Berlin), €74.9 (Prague) and €77.5 (Porto).
PwC’s research shows that while growth remains a dominant theme it’s not just about growth rates and the absolute levels of trading are a key piece of the hotel jigsaw in each city and analysis of three key metrics in absolute terms shows a very different picture.
Which cities will be the most expensive, the fullest and have the highest RevPAR?
9
Euro
pean
cit
ies
hote
l for
ecas
t for
201
8 an
d 20
19

Occupancy rankingsLondon is the fullest in 2018, tying with Prague in 2019
20172017 rank 2018 (F)
2018 (F)rank 2019 (F)
2019 (F)rank
London (81.7%) 1 London (82%) 1 Prague (82.3%) 1
Amsterdam (81.5%) 2 Amsterdam (81.8%) 2 London (82.3%) 2
Prague (79.9%) 3 Prague (81%) 3 Amsterdam (81.6%) 3
Lisbon (77.6%) 4 Lisbon (78.1%) 4 Lisbon (78.8%) 4
Berlin (76.6%) 5 Berlin (76.9%) 5 Paris (77.9%) 5
Porto (76.4%) 6 Porto (76.7%) 6 Berlin (77.3%) 6
Paris (73.5%) 7 Paris (74.7%) 7 Porto (77.1%) 7
Zurich (72.8%) 8 Zurich (72.4%) 8 Zurich (73.3%) 8
Milan (70.5%) 9 Milan (71.7%) 9 Milan (71.6%) 9
Geneva (70.1%) 10 Geneva (70.5%) 10 Rome (70.6%) 10
Rome (70%) 11 Rome (70.3%) 11 Frankfurt (70.5%) 11
Frankfurt (69.5%) 12 Frankfurt (70%) 12 Geneva (70.4%) 12
Source: Econometric forecast PwC Benchmarking data: STR
10
Euro
pean
cit
ies
hote
l for
ecas
t for
201
8 an
d 20
19

ADR rankingsGeneva tops the charts each year but Paris closes the gap in 2019
20172017 rank 2018 (F)
2018(F)rank 2019 (F)
2019 (F)rank
Geneva (€242.9) 1 Geneva (€241.6) 1 Geneva (€245.8) 1
Paris (€231.3) 2 Paris (€236.2) 2 Paris (€241) 2
Zurich (€203.9) 3 Zurich (€197.1) 3 Zurich (€195.6) 3
London (€169.2) 4 London (€162.4) 4 London (€163) 4
Rome (€145) 5 Amsterdam (€152.2) 5 Amsterdam (€157.8) 5
Amsterdam (€142.6) 6 Rome (€147.1) 6 Rome (€148.8) 6
Milan (€137.2) 7 Milan (€140.2) 7 Milan (€144) 7
Frankfurt (€122.1) 8 Frankfurt (€121.1) 8 Lisbon (€127.7) 8
Lisbon (€113.8) 9 Lisbon (€120.9) 9 Frankfurt (€125.3) 9
Berlin (€95.7) 10 Porto (€101.1) 10 Porto (€105.8) 10
Porto (€92) 11 Berlin (€96.6) 11 Berlin (€98) 11
Prague (€85.6) 12 Prague (€92.6) 12 Prague (€95.5) 12
Source: Econometric forecast PwC Benchmarking data: STRAll annual figures are calculated as unweighted monthly averages as our approach does allow forecasting of monthly demand weightings
11
Euro
pean
cit
ies
hote
l for
ecas
t for
201
8 an
d 20
19

RevPAR rankingsParis tops the chart in 2018 and 2019
Source: Econometric forecast PwC Benchmarking data: STR
20172017 rank 2018 (F)
2018 (F)rank 2019 (F)
2019 (F)rank
Geneva (€170.3) 1 Paris (€176.3) 1 Paris (€187.6) 1
Paris (€170.1) 2 Geneva (€170.3) 2 Geneva (€172.9) 2
Zurich (€148.4) 3 Zurich (€142.7) 3 Zurich (€143.5) 3
London (€138.2) 4 London (€133.2) 4 London (€134.1) 4
Amsterdam (€116.2) 5 Amsterdam (€124.5) 5 Amsterdam (€128.9) 5
Rome (€101.6) 6 Rome (€103.4) 6 Rome (€105) 6
Milan (€96.7) 7 Milan (€100.5) 7 Milan (€103.1) 7
Lisbon (€88.2) 8 Lisbon (€94.4) 8 Lisbon (€100.6) 8
Frankfurt (€84.9) 9 Frankfurt (€84.7) 9 Frankfurt (€88.3) 9
Berlin (€73.4) 10 Porto (€77.5) 10 Porto (€81.6) 10
Porto (€70.3) 11 Prague (€74.9) 11 Prague (€78.6) 11
Prague (€68.4) 12 Berlin (€74.3) 12 Berlin (€75.8) 12
All annual figures are calculated as unweighted monthly averages as our approach does allow forecasting of monthly demand weightings
12
Euro
pean
cit
ies
hote
l for
ecas
t for
201
8 an
d 20
19

13
Euro
pean
cit
ies
hote
l for
ecas
t for
201
8 an
d 20
19

Global:The global economic outlook is relatively upbeat with global economic growth in 2018 on track to be the fastest since 2011. In our main scenario, we project the global economy will grow by almost 4% in purchasing power parity (PPP) terms, adding an extra $5 trillion to global output in current value terms. More importantly, we expect growth to be broad based and synchronised, rather than dependent on a few countries.
This has supported declines in unemployment which we expect to reach a 40 year low across the G7 in 2018. We expect unemployment to dip below 5% – equivalent to about 19 million workers which may support a pickup in wage growth. This could be driven by tight labour markets like in the US which is expected to hit an unemployment rate of about 4% but offset by other economies like Italy, where unemployment levels remain relatively high. Both strong wage growth and high employment should support leisure and travel spending.
Economic, travel and supply drivers
Relatively upbeat global growth is forecast, with the peripheral Eurozone economies expected to outpace the core. Both strong wage growth and high employment should support leisure and travel spending.
Economic outlook should support leisure and travel spending:
HOTEL
HOTEL2011
2018
14
Euro
pean
cit
ies
hote
l for
ecas
t for
201
8 an
d 20
19

Eurozone:In our main scenario projections for 2018, we expect the GDP-weighted growth rate of the peripheral Eurozone economies to exceed that of the core. Specifically, we expect growth of around 2.5% in the periphery and 2% in the core.
This would be the fifth consecutive year the peripheral Eurozone economies have outpaced the core. Of the larger Eurozone economies, the Netherlands is expected to lead the core economies’ performance (2.6% growth). Ireland is expected to be the fastest growing peripheral economy (3.5% growth). Greece is likely to exit its performance programme in August marking the first year since 2009 where no Eurozone economy is under IMF surveillance. Germany will continue to post the world’s largest current account surplus in absolute terms to the tune of over $300 billion. By contrast with the recovering Eurozone, uncertainty relating to Brexit is expected to drag on UK growth, which is expected to be only around 1.5% in 2018.
One risk to this picture however is the beginning of the end of easy money. Since the US Federal Reserve started to gradually reduce the size of its balance sheet and raise rates, the question has been who will follow next. We expect the European Central Bank (ECB) to further reduce its monthly asset purchases in 2018. If Eurozone inflation rebounds faster than our baseline projection, 2018 could see the end of the ECB’s asset purchase programme.
UK:The UK economy held up well in the six months after the EU referendum, but growth slowed markedly from early 2017 as consumer spending growth moderated. A key factor behind that moderation was the increase in the rate of consumer price inflation (CPI) from around zero on average in 2015 to 3% in the year to January 2018, as global commodity prices have picked up from lows in early 2016, and the effects of the weak pound after the Brexit vote have fed through supply chains. Higher inflation has squeezed real household incomes and this has taken the edge off consumer-led growth. Brexit-related uncertainty has also dampened business investment growth.
In our main scenario, we project UK growth to remain modest at around 1.5% in 2018 and 1.6% in 2019. This is due to continued subdued real consumer spending growth and the drag on business investment from ongoing economic and political uncertainty relating to the outcome of the Brexit negotiations. The Bank of England could raise interest rates once or twice this year, though the pace of increase will remain limited and gradual.
United States: The growth forecast for the United States has been revised up given stronger than expected activity in 2017, higher projected external demand, and the expected macroeconomic impact of the tax reform, in particular the reduction in corporate tax rates and the temporary allowance for full expensing of investment. We are projecting US economic growth of 2.8% in 2018 and 2.3% in 2019.
China:We project China, the world’s largest economy in PPP terms, to grow by around 6-7% in 2018. At the 2017 party congress, President Xi outlined China’s shift in focus from high speed to high quality growth. This was coupled with supply side reforms addressing structural problems, such as excess factory production and pollution. Any further, unexpected, reduction in Chinese growth (for example because of financial stability issues related to high debt levels in the property sector) is a downside risk.
15
Euro
pean
cit
ies
hote
l for
ecas
t for
201
8 an
d 20
19

Ireland
3.5 3.0
UK
1.5 1.6
Portugal
2.1 1.7
Spain
2.8 2.5
France
2.1 1.9
Germany
2.4 2.3
Switzerland
1.3 1.6
Italy
1.2 1.0
Czech Republic
2.6 2.3
Netherlands
2.6 2.2
Global growth will continue to strengthen in all major economies through 2018
Source: PwC forecasts (March 2018), IMF World Economic Outlook October 2017
India
7.4 7.6
Canada
2.1 2.0
US
2.8 2.3
Mexico
2.1 2.2Brazil
1.8 2.1
South Africa
1.3 1.5
Australia
2.9 3.0
Russia
1.8 1.6
China
6.5 6.3
= % Real GDP growth in 2018
Global (MER) 3.3%
Global (PPP) 3.8%
Eurozone 2.2%
Global (MER) 3.1%
Global (PPP) 3.7%
Eurozone 2.0%
= % Real GDP growth in 2019
Europe
16
Euro
pean
cit
ies
hote
l for
ecas
t for
201
8 an
d 20
19

Source: PwC forecasts (February 2017), IMF World Economic Outlook October 2016
A buoyant travel backdrop: Another record year anticipated in 2018
There is no sign that the travel boom is running out of steam yet.
Stellar global travel demand drove 671m overnight visitors to Europe
There was particularly strong demand for international travel in 2017. Globally, according to the UNWTO, 2017 saw the highest tourism volumes in seven years. International tourism arrivals grew by 7% year on year to reach a total of 1,322 million overnight visitors (for both business and leisure).
Southern and Mediterranean region benefitted with 13% growth
Overall, UNWTO shows that Europe recorded above average tourism growth with an 8% increase in international tourism arrivals in 2017. The outstanding sub-regions were Southern and Mediterranean Europe which saw a remarkable 13% growth over the prior year. Northern Europe and Central Europe both saw 5% growth, while Western Europe saw a 7% gain.
Which countries were winners?
Data from the European Travel Commission (ETC) show that in 2017 Turkey (+28%) experienced an impressive rebound in visitor arrivals with growth largely driven by Russian travellers (+465.2%). Iceland (+24%), the fastest growing destination since 2012, showed robust results while its government considers measures to address overtourism. In southern Europe, destinations like Montenegro (+19%), Serbia (+18%) Malta (+16%), Slovenia and Cyprus (both +15%) also boosted growth and have proved their success in overcoming seasonality. Finland (+14%) enjoyed a solid increase driven by Chinese and Indian arrivals. Established summer destinations Croatia (+14%), Portugal (+12%) and Spain (+9%) also saw healthy growth. ETC reports that in Spain political tensions in Catalonia didn’t depress tourism demand while improved air connectivity continued to underpin Portugal’s strong performance.
More than 12 million Chinese visitors expected in 2018
Besides the strong demand from intra-European markets, US, China and the Russian Federation have contributed significantly to the reported growth in tourist arrivals to Europe.
Results from the latest European Travel Commission (ETC) Long-Haul Travel Barometer indicate that among highest-volume extra-European markets, intention for overseas trips in the first months of 2018 is strongest among respondents from China. The positive sentiment in this market is considered by ETC to be a reassuring indicator paving the way for more than 12 million expected Chinese arrivals in 2018. (ETC Dashboard, Tourism Economics 2017).
We expect the year could see a modest recovery in tourism to some North African destinations as well as Turkey, as no frills carriers and tour operator begin to increase capacity again e.g. into Turkey and Tunisia, where the first UK charter flights recently returned since the Sousse terror attacks in 2015. The ‘North African effect’ benefitting Europe’s southern Mediterranean destinations could slow, although safety and security concerns are likely to sustain the tourism boom for some time yet.
What next?
While volumes rise, what travellers expect from their holidays continues to evolve – short breaks remain popular, personalised packages too, travellers want something different e.g. visits to less well known centres in popular countries and new experiences ranging from expert led running excursions around landmark sites to culinary skills courses, combining business and leisure, staycations and so on. Where travellers choose to stay is also clearly evolving.
Looking to this year, we remain cautiously optimistic as the improving economic outlook across the Eurozone continues to drive holiday and business demand. On the flipside, a stronger euro may deter some inbound visits and slower US travel growth may result from a weaker dollar and rising transatlantic airfares. Nevertheless the overwhelming message is growth and the UNWTO is predicting growth of 4-5% in international tourism arrivals to Europe in 2018.
17
Euro
pean
cit
ies
hote
l for
ecas
t for
201
8 an
d 20
19

A fragmented sector with around 5 million rooms
There are close to 5 million hotel rooms in Europe and the sector remains fragmented with around 3 million unaffiliated rooms. Around only 15% of rooms in Austria are affiliated to a chain compared to 57% of rooms in Spain, according to Horwath HTL (European Hotels and Chains Report 2017).
According to STR data, there are a total of 308,000 rooms in the development pipeline with 105,000 in construction and 69,000 in final planning.
Tighter regulation: the shape of things to come?
In some cities concerns about overtourism and damage to residential quality of life means that they seek to regulate the development of new hotels in certain areas. For example, in Amsterdam, the policy of ‘NEE, tenzij’ meaning ‘NO, unless’, seeks to ensure hotels wanting to develop in central Amsterdam only develop what is best for the city, with projects that are creative, economically support the neighbourhood, have a good social plan and are sustainable.
There are still hot spots
At the same time as there being relatively low overall new supply levels, some cities have high pipelines and this includes London (with the highest pipeline) where some 9,000 rooms could open in 2018 – more than opened in 2012 when there was an Olympic sized demand boost. Berlin has around 6,500 new rooms in the pipeline with almost 4,000 of these already under construction. Some other cities with sizeable numbers of rooms under construction include Istanbul (3,000+), Moscow (3,400), Munich (3,000+), Hamburg (2,770), Dublin (2,600), and the total number of rooms in Amsterdam will grow by approximately 7,000 rooms by 2020, when the new restrictive planning regulations start to bite. Zurich will see 2,800 rooms built in the next three years.
Sharing economy booms
At the same time alternative accommodation platforms such as Airbnb and serviced apartments also compete for tourists, and the commentaries in the city pages of this report suggest a significant increase in shared home listings as well as municipal reactions to control unfettered growth. Many destinations are now heavily regulating many aspects of Airbnb.
Supply backdrop remains benign: But hotspots challenge some cities
Supply growth has remained relatively constrained in many destinations across Europe and this has allowed occupancies to soar, driving up ADR. But how long can this continue?
18
Euro
pean
cit
ies
hote
l for
ecas
t for
201
8 an
d 20
19

In Milan, the budget and limited service segment is considered to have high potential with chains including Meininger, Motel One, Moxy, and B&B Hotels expanding in the market.
19
Euro
pean
cit
ies
hote
l for
ecas
t for
201
8 an
d 20
19
Four challenges facing hotels
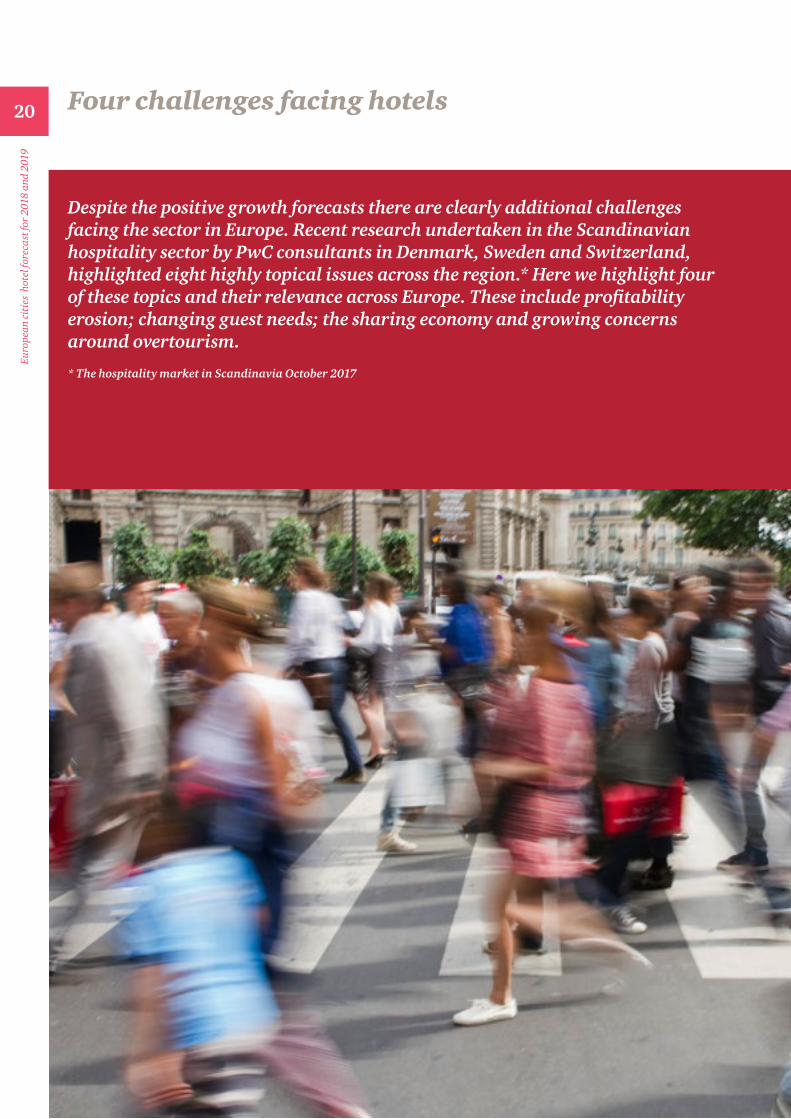
Despite the positive growth forecasts there are clearly additional challenges facing the sector in Europe. Recent research undertaken in the Scandinavian hospitality sector by PwC consultants in Denmark, Sweden and Switzerland, highlighted eight highly topical issues across the region.* Here we highlight four of these topics and their relevance across Europe. These include profitability erosion; changing guest needs; the sharing economy and growing concerns around overtourism.
* The hospitality market in Scandinavia October 2017
20
Euro
pean
cit
ies
hote
l for
ecas
t for
201
8 an
d 20
19

Profitability erosion – why me? What can I do about it?RevPAR used to be a reliable KPI for measuring the strength and performance of hotel markets. In recent years, however, increased RevPAR has not automatically translated into increased profitability (GOP). From our varied conversations, we understand that one of the main factors causing this profitability erosion is the increasing cost of rooms sold, especially as a consequence of increased spend on commissions. Depending on the market strength of a property, OTAs ask for commissions as high as 20% to 25%. If the proportion of the inventory sold via OTAs is high, this can be a considerable cost to a property or small chain. In our discussions with industry professionals, opinion has been divided in terms of how to best deal with OTAs. While some players prefer to get rid of OTAs completely, others have responded by implementing strong revenue management and distribution guidelines to curb the proportion of inventory sold via the OTA channel. Some players are even considering making a larger share of hotel room stock available for sale via OTAs and reducing their own sales force. A consequence of this is that they would lose direct contact with these guests and the advantages of their loyalty. Most of the industry experts we talked to placed great emphasis on loyalty schemes as a way of ensuring direct bookings.
PwC’s opinionWe think OTAs have an important role to play in selling perishable goods (rooms) and should be integrated in a well-defined corporate and property-based revenue management strategy.
The aim for a smaller chain should therefore be to formulate a coherent strategy at corporate level while providing the properties with support in the form of processes, systems, and human capabilities to enable them to implement the daily tactics of the strategy.
A robust monitoring and control framework will give the management a solid decision-making basis and the relevant framework for reducing the proportion of rooms sold via OTAs to a reasonable level for driving margin. A bigger threat for operators who decide to sell a large proportion of room stock via an OTA is the loss of guest data. As we move into a world where data is king, we are convinced that comprehensive, organised and easily retrievable guest data will be a vital ingredient in the profitable growth of operators going forward.
1
Changing guests needs – how can we adapt to the needs of new market segments?As the proportion of international guests has grown steadily, this is in theory good news for hoteliers across Europe. But the trend does bring challenges of its own. One challenge is to adapt products and services to the requirements of new guest segments. For example, industry experts cite Japanese tourists’ desire to have a bathtub in their room, while American guests look for comparatively large rooms and Chinese guests want basic cooking facilities. But its not just about the needs of international travellers, domestic travellers also have changing needs. Different generations of travellers may also have specific requirements. Much has been written about Generation Y known as Millennials (23-36 years). But, don’t forget about other groups such as Generation X (37-53 years), or the Baby Boomers (54-74)and the upper age cohort of Generation Z, the so called Smartphone generation (8-22 years). Segmenting by context/need for travel/brand/budget may also see similar requirements and buying patterns across these different age groups.
2
A key risk for hoteliers is the ageing of the customer base and the need to capture a new generation of customers. We carry out a lot of discussions with start-ups to better understand how we can collaborate to reach younger customers and see how we can adapt our offer to better suit the needs of Millennials.Julien Guintrand, Group Finance Director, B&B Hotels, 2018
PwC’s opinionAdapting to changing guest requirements is a challenge for all hoteliers around the world. The recent trend to increased tourism worldwide driven by low-cost airlines, cheaper hotel offers and globalisation has increased the number of people travelling to destinations they would not have visited 20 years ago.
In our opinion, two tools are becoming indispensable for hoteliers who want to find out what guests want. First, hoteliers need to thoroughly analyse online guest reviews and use review comments as a foundation for CAPEX and operational process decisions. Online comments should not be a ‘nice to have’, but should be treated as the most important source of guest feedback and taken as a basis for change. Secondly, the industry needs to leverage rapid developments in digitalization and big data to capture, segment, analyse and group guest data in the most useful way. Another way to adapt product and service offerings on a market level would be the addition of international operators and their distinct products.
21
Euro
pean
cit
ies
hote
l for
ecas
t for
201
8 an
d 20
19

The threat of overtourism – when is many too many?Can there be such a thing as too many tourists? Many industry players we talked to answered with ‘No’. At the same time we see the residents of Amsterdam, Barcelona and Venice starting to oppose ever-growing numbers of tourists. For example, in Amsterdam, the policy of, ‘NEE, tenzij’ meaning ‘NO, unless’ seeks to ensure hotels seeking to develop in central Amsterdam develop what is best for the city and are creative, economically support the neighbourhood, have a good social plan as well as sustainable. Interestingly, PwC research amongst hotels in Copenhagen revealed they were not directly worried about overtourism. Their primary concern was the risk of hasty political decisions to limit tourism or hotel expansion if politicians see overtourism as a significant threat.
PwC’s opinionRecent news, especially from Amsterdam, Barcelona and Venice, show the difficulties faced by cities trying to deal with a huge surge of tourists in a relatively short period of time. Noise, litter, and ‘not recognising my own city any more’ are the most frequently cited complaints from residents. Lessons should be learnt from the struggle of cities that have already experienced a high influx of tourists. For this reason we believe that increasing international demand for key destinations needs to be carefully managed. An approach to controlled growth should include formulating a clear destination strategy, including a clear positioning, as a basis for government action and the provision of private services, including city planning, and zoning, hotel development regulation, centralised product offering planning, infrastructure planning, and so on.
3
Sharing economy – ignore or embrace it?In recent years there has been a considerable increase in renting out private homes and rooms via online services. One of the largest providers of private home rental services is Airbnb, an online marketplace for renting out and booking overnight accommodation. The number of bookings via Airbnb is still sky-rocketing, and it’s emerging that in addition to private renters, the popular booking portal is increasingly being used by professional rental operators as a distribution channel. Currently the mid to lower-range hotel segment is hardest hit; upmarket and luxury products aren’t likely to see the same impact. At present, privately sharing a home online is an unregulated market. Many destinations are now going down the route of regulating and fining Airbnb.
The Nordic countries have been quite open to the sharing economy. In Sweden, for example, ‘Allemansrätten’ – or the freedom to roam – is a principle protected by law that gives all people the right to be free in Swedish nature and Sweden has launched a campaign listing the entire country on Airbnb, even camping grounds and meadows.
PwC’s opinionThere are two sides to the coin when it comes to the impact of Airbnb on demand generation. On the one hand the new offering attracts new guest segments to destinations they wouldn’t have travelled to previously. They eat in restaurants and visit attractions, so for the destination as a whole this is a great benefit. The other side of the coin, of course, is that some guests who have previously gone to a hotel now use Airbnb, which means a loss for the hotel industry. The hotel industry should take care not to make the same mistakes with Airbnb that it made with OTAs 20 years ago, when most players expected the new channels to disappear as quickly as they had sprung up. Instead, the industry should listen very carefully to guests who are saying that they’re looking for authentic, real and tailored accommodation products for a variety of needs – on different occasions the same person may be travelling with their spouse, on business, or on a stag or hen weekend and take cues in terms of their product and service offering.
4
The ‘phygital model’ is at the heart of hoteliers’ concerns. It has become essential to ensure continuity in the customer relationship, by combining a high-performing digital platform (i.e. including a chatbot) and a strong human dimension. This model should allow hoteliers to better know and understand customers and to provide more personalised services.Nicolas Broussaud, Head of Transactions, Accorhotels
Overtourism: primarily up to destinations to exert a controlling interest. Intelligent marketing concepts can help reduce the numbers at hotspots.Norbert Fiebig, President, German Association DRV
22
Euro
pean
cit
ies
hote
l for
ecas
t for
201
8 an
d 20
19

23
Euro
pean
cit
ies
hote
l for
ecas
t for
201
8 an
d 20
19

European hotel deal volume (€bn)
Source: PwC Analysis, RCA, HVS, Hotel Analyst, AM:PM, STR
Geographic split of transaction volume (€bn)
2016 2017 Germany
France
Italy
Pan European
United Kingdom
Spain
Ireland
Rest of Europe
27%
25%8%
11%
6%
4%
6%
15% 11%
30%
4%25%
5%
1%
6%
19%
24
Euro
pean
cit
ies
hote
l for
ecas
t for
201
8 an
d 20
19
European hotel transaction volume increased 11% to €20.9bn in 2017, surpassing the record-high levels seen in 2015. This was driven by an increase in investment activity in the UK where owners are considering whether the end of the current cycle is in sight, and in Spain where investors are sensing an opportunity for yield compression in a maturing market.
Deal talk
OverviewEuropean hotel transaction volume reached €20.9 billion in 2017. This was an 11% increase compared to 2016 deal volume and surpassed the record level achieved in 2015. The movement in transaction volume continued to show a strong positive correlation to changes in RevPAR growth which increased by 5.6% in 2017 compared to 2.1% in 2016.
The growth in transaction volume was driven by a resurgence in UK hotel investment activity in 2017 and record levels of investment in the Spanish hotel market. UK hotel deal volume in 2017 increased by 34% from €4.7 billion in 2016 to €6.3 billion in 2017 and represented 30% of the total European hotel transactions by deal volume. This rebound from 2016, which saw a cross sector decline in transactions due to Brexit uncertainty, was driven by the completion of large portfolio transactions in the second half of the year and an improved sense of macroeconomic stability. The number of exits in the second half of the year and the portfolios currently in market indicate that owners are considering whether we are potentially approaching the top of the current cycle. Hotel deal volume in Spain more than doubled in comparison to 2016 with significant portfolio and single assets being brought to market as investors sensed an opportunity for yield compression. Transactions across the UK and Spain combined accounted for more than half of total European transactions by deal volume in 2017.
Germany meanwhile accounted for 11% of total European transaction volume compared to 27% in 2016. This decline in
0
3
6
15
2008 2009 2012 2013 2014 2015 2016 2017
Portfolio Single
Deal Volume (€ billions) RevPAR Growth p.a. (%)
Rev PAR Growth (%)
2010 2011
9
12
18
21
-20
-15
-10
5
-5
0
10
15
Sources: PwC Analysis, RCA, HVS, Hotel Analyst, AM:PM, STR
Sources: PwC Analysis, RCA, HVS, Hotel Analyst, AM:PM, STR
deal volume was a function of the limited availability of product in the market particularly in prime hotel locations.
The 2017 transaction market also saw sustained level of investment in Pan European portfolios and high-profile transactions in the Netherlands, France and Italy in particular.

2017 investment review Investment trends
European investors acquired some of the largest portfolio transactions in 2017 in what was a continuation of the trend observed in 2016.
US private equity groups also acquired significant portfolios particularly in Spain where Apollo’s acquisition of CaixaBank’s loan portfolio (Project Sun) and Blackstone’s purchase of HI Partners were amongst the largest ever transactions in the country. However, Lone Star’s sale of the Jurys Inn portfolio and Bain Capital Credit and Canyon Partners sale of the QHotel portfolio showed that North American private equity investors continued looking to exit their UK hotel investments.
Real estate and institutional investors acquired the largest single assets in 2017 which was a deviation to the trend observed in 2016 where investment was driven by domestic private and private equity investors.
Market trends
The UK and Spain accounted for the five largest portfolio transactions in 2017. The growth in European deal volume was largely driven by the increase in UK transaction volume following a subdued 2016 due to Brexit uncertainty. This increase saw the UK represent the largest proportion of deal volume by geographic split in 2017 – a return to the position it had held in 2015. The growth in Spain was fueled by private equity investors who are seeing opportunities for yield compression in a maturing Spanish hotel market.
Meanwhile the core and cosmopolitan cities of London, Paris and Amsterdam accounted for the five largest single asset transactions in 2017 highlighting the ongoing demand for prime ‘trophy assets’ from overseas investors.
The 2017 European hotel transaction market also saw two significant hostel transactions namely Queensgate Investments acquisition of Generator Hostels and TPG’s acquisition of A&O Hostels. These transactions highlight the increasing depth of the hotel sub-sector which continues to become a mainstream asset class for global investors. 2018 deals outlook A change in the flow of capital
The 2017 European hotel transaction market saw a slowdown in investment from Chinese investors who have accounted for more than €4.7 billion of investments since 2014. This was driven by state regulations restricting outbound investment in global real estate.
At the start of 2018 it was reported that HNA Group was looking to exit its 29.5% stake in Spain’s NH Hotels, its 25% stake in Park Hotels & Resorts and its stake in Hilton Worldwide. Given the debt issues and regulatory pressures HNA is facing, it will be interesting to monitor its stance towards its holding in Radisson Hotel Group (recently rebranded from Carlson Rezidor Hotel Group).
Anbang Insurance is also reportedly considering a part sale of its holding in the US based Strategic Hotels & Resorts and the New York Waldorf Astoria. The disposals of these assets could determine the potential exit route for Anbang’s European investments too. Dalian Wanda’s recent sale of its luxury hotel development at Nine Elms in London further illustrates the wider sell-off by large Chinese investors.Despite recent acquisitions such as Anbang’s purchase of the DoubleTree Amsterdam, perhaps 2018 will see an increase in outflow of Chinese capital from the European hotel market as investors rebalance their portfolios amidst regulatory and financial pressures.
Current mega hotel company trends
Following the completion of mega-mergers in 2016 including Marriott International’s acquisition of Starwood Hotels and AccorHotels’ acquisition of Fairmont Raffles Hotels, a quieter 2017 was to be expected as companies focused on post-merger integration. InterContinental Hotels’ acquisition of a 51% stake in Regent Hotels in March 2018 showed that mega hotel companies continued to expand their brand offerings.
With AccorHotels continuing to progress with restructuring its property subsidiary (AccorInvest) and HNA’s stake in NH Hotels, Park Hotels & Resorts and Hilton Worldwide up for grabs, 2018 could see significant changes in the ownership structures of mega hotel companies.
What to expect in 2018
The start of 2018 has seen a strong level of investment activity in the UK through the sale of SACO serviced apartments and with Lone Star’s sale of its Mecure/Hilton portfolio and Starwood Capital’s sale of its Principal/De Vere portfolio reportedly progressing well. The Spanish hotel market has also seen Blackstone’s takeover bid for Hispania and HNA’s stake in NH Hotels being brought to market. Put together with the continued European and international interest in the German hotel market, we anticipate European hotel transaction volume to moderately increase in 2018 from 2017 levels.
Country Portfolio Reported Value (€) Type of Acquirer Origin of Acquirer
United Kingdom Jurys Inn c. €909m Real Estate Company & Hospitality Company Sweden & Israel
Spain Project Sun c. €700m Private Equity USA
Spain HI Partners c. €631m Private Equity USA
United Kingdom QHotel c. €571m Real Estate Investor United Kingdom
Spain 19 Merlin Hotels c. €559m REIT France
Country Hotel Reported Value (€) Type of Acquirer Origin of Acquirer
United Kingdom Grosvenor House Hotel c. €627m Real Estate Investor USA
France Westin Paris c. €550m Real Estate Investor United Kingdom
Netherlands DoubleTree Amsterdam c. €356m Institutional China
Netherlands W Amsterdam c. €260m Institutional Germany
United Kingdom DoubleTree Westminster c. €221m Real Estate Investor United Kingdom
Top 5 single asset transactions
Top 5 portfolio transactions in 2017
25
Euro
pean
cit
ies
hote
l for
ecas
t for
201
8 an
d 20
19
Sources: PwC Analysis, RCA, HVS, Hotel Analyst, AM:PM, STR

From Amsterdam to Zurich: Which cities are best placed to grow in 2018 and 2019?
The European cities forecasts26
Euro
pean
cit
ies
hote
l for
ecas
t for
201
8 an
d 20
19

From Amsterdam to Zurich: Which cities are best placed to grow in 2018 and 2019?
The European cities forecasts 27
Euro
pean
cit
ies
hote
l for
ecas
t for
201
8 an
d 20
19

2018 and 2019 forecast: The Dutch economy is another of Europe’s strong performers registering 3.1% growth in the year to Q4 2017. We are expecting growth of 2.6% in 2018 and 2.2% in 2019. Like much of the Eurozone, inflation remains muted at 1.3% in February 2018 whilst the unemployment level was just 4.2% in February 2018.
Continued economic growth will stimulate further growth in business and leisure volumes to Amsterdam. While supply is still increasing it is likely that in two years the more restrictive planning regime will kick-in and support existing hoteliers. Our latest forecast is for further strong RevPAR growth in 2018, driven by robust ADR gains. In 2019, further but slower paced growth of 3.5% is forecast, again driven by ADR, as occupancy dips marginally.
Source: Data: STR Global 2018 Econometric forecast: PwC 2018 All annual figures are calculated as unweighted monthly averages as our approach does allow forecasting of monthly demand weightings NB: in 2019, VAT will increase from 6% to 9%,. Demand remains strong and we do not foresee a major impact on the forecasted ADR.
Annual hotel statisticsOccupancy (%) ADR (€) RevPAR (€)
2016 78% 135 105
2017 81% 143 116
2018F 82% 152 124
2019F 82% 158 129
Growth on previous yearOccupancy ADR RevPAR
2016 0.2% 2.6% 2.8%
2017 4.1% 5.9% 10.3%
2018F 0.4% 6.7% 7.1%
2019F (0.2%) 3.7% 3.5%
As hotel performance starts to peak, existing Amsterdam hoteliers could soon start to benefit (KPIs and values) as the city’s restrictive new hotel policy kicks in. Meanwhile, 2017 saw the greater Amsterdam hotel market enjoy an extraordinary performance, as occupancy, ADR and RevPAR recorded major gains, partially fuelled by over 3% Dutch GDP growth in Q4 2017.
RoleAmsterdam is the capital of the Netherlands and also its financial and cultural hotspot. Its famous canals are listed on the UNESCO World Heritage List. The city can be seen as a gateway into other parts of Europe, for leisure and business. Amsterdam is economically and politically stable and is currently performing as one of the top global cities, in terms of quality of life and living. In 2017 the city of Amsterdam had a record number of tourists (6.6 million), with an estimated increase of almost 12%, compared to 2016.
Historical tradingThe greater Amsterdam hotel market has shown increased KPI’s since 2009. The KPI’s reached new heights in 2017, with occupancy up by 4.1%, ADR up by 5.9% and RevPAR up by 10.3%.
Deals In 2017, the Amsterdam hotel market attracted the largest volume of hotel investment in the Netherlands. A reported total of approximately €1.1 billion worth in hotel deals have been done in 2017 on the Amsterdam market, with noteworthy single asset transactions of DoubleTree by Hilton, W Amsterdam and the NH Barbizon Palace.
AmsterdamA notable Dutch portfolio transaction is the sale of the Dutch hotel chain Bilderberg Hotels. European institutional funds, together with investors from the U.S. and Asia are expected to be looking to invest in the Amsterdam hotel market and beyond.
Supply trendsPast municipal hotel policy (2007-2015) continues to impact current supply levels. The total number of hotel rooms in Amsterdam will grow by approximately 5,150 room (+16%) to total almost 37,170 in 2019. This will increase to approximately 39,120 rooms per 2020. After 2020 the impact of the previous hotel policy is expected to diminish, as the new restrictive policy kicks-in.
At the end of 2017 Amsterdam had a total of 18,800 Airbnb listings, a significant growth from 2015 (approximately 15,000 listings). The city has come to an agreement with Airbnb regarding the maximum number of days in which a listing can be rented out. From 1 January 2019 this will be limited to 30 days per year, down from a yearly maximum of 60 days.
OpportunitiesAmsterdam saw more than 13.9 million overnight stays in 2016, increasing to 15.5 million in 2017. It’s expected that the volume of tourists traveling to the Netherlands will grow by at least 5%, in 2018. We expect that this will positively influence the number of overnight stays in the capital.
Due to the high level of supply growth expected for 2018/2019, together with moderate growth in guest volumes in 2018, we expect some pressure on hotel KPI’s outside of the city centre. However, as long as economic growth continues, two years from now hotels in Amsterdam will further benefit in terms of KPI’s and hotel values, from the city’s restrictive new hotel policy (2015-2021). The number of passengers served by Schiphol Amsterdam Airport has grown from 63.5 million in 2016 to 68.5 million in 2017, an increase of 7.7%. The growing number of passengers is also expected to have a positive effect on the demand for hotel rooms in Amsterdam.
28
Euro
pean
cit
ies
hote
l for
ecas
t for
201
8 an
d 20
19
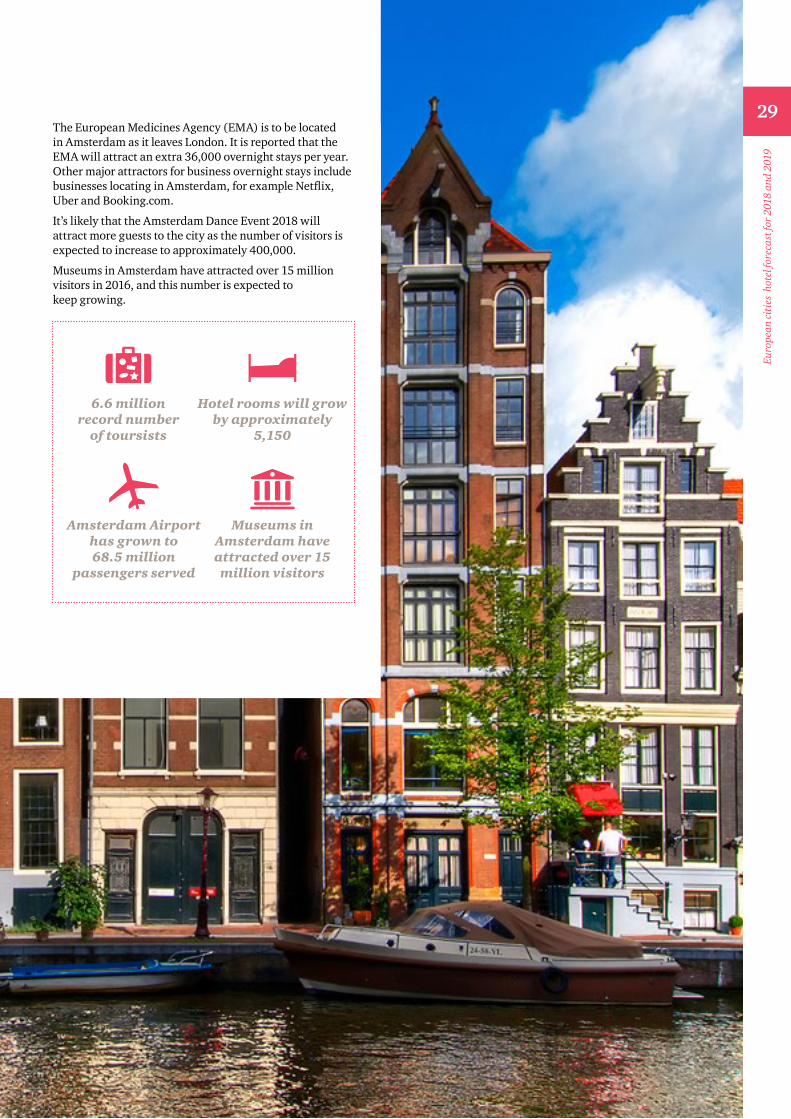
The European Medicines Agency (EMA) is to be located in Amsterdam as it leaves London. It is reported that the EMA will attract an extra 36,000 overnight stays per year. Other major attractors for business overnight stays include businesses locating in Amsterdam, for example Netflix, Uber and Booking.com.
It’s likely that the Amsterdam Dance Event 2018 will attract more guests to the city as the number of visitors is expected to increase to approximately 400,000.
Museums in Amsterdam have attracted over 15 million visitors in 2016, and this number is expected to keep growing.
6.6 millionrecord number
of toursists
Amsterdam Airport has grown to 68.5 million
passengers served
Hotel rooms will grow by approximately
5,150
Museums in Amsterdam have attracted over 15
million visitors
29
Euro
pean
cit
ies
hote
l for
ecas
t for
201
8 an
d 20
19

Over the last 15 years, Berlin has shown strong growth in hotel overnight stays. However, the last third of 2017 turned out relatively weak and led to a quite low growth for 2017 in total. While fundamentals remain solid, the hotel industry anticipates more modest growth expectations in 2018. Occupancy stagnated in 2017 as the sector felt some pressure from strong growth in the sharing economy sector.
RoleBerlin, the capital and largest city of Germany, is one of the top city destinations in Europe, attracting 13 million tourists and generating 31 million overnight stays in 2017, through international events and a broad offer of cultural activities. Overseas tourists accounted for 45% of the total in 2017 (same as 2016). Around a quarter (7.9 m overnight stays) were generated through the MICE segment in 2017. Berlin is increasingly popular for congresses and conferences. In general, the city welcomes both leisure and business travellers alike.
Historical tradingHotels in Berlin achieved a 2% RevPAR increase in 2017, compared to 2016, the weakest in four years. This moderate RevPAR growth was driven by a slight drop in occupancy (-0.3%) and an ADR gain of 2.3%. Room occupancy (76.7% in 2017) remains at a very high level, and is the second highest rate recorded this century. ADR climbed to 96 Euro, the highest ADR in the same period. Since August 2017, occupancy has weakened, as a result, among other factors, of the insolvency of the Berlin-based Air Berlin airline.
BerlinFurthermore, strong growth in the sharing economy segment has exacerbated this weakness.
Supply trendsIn 2017, Motel One opened two high-rise hotels in central Berlin, offering nearly 1,300 rooms. The remaining biggest hotel project in the city is the extension of the Estrel Hotel, which will add more than 800 rooms. The Estrel is already the largest hotel in Germany, offering 1,125 rooms. Another large project is the Tokyo Inn Hotel, which will be located next to the Alexanderplatz (City East).
A further 6,400 rooms are currently being built or developed by many international hotel brands. The majority of the new hotels are within the budget and mid scale segments.
DealsInvestments in the German hotel sector remained very attractive in 2017. Several mid scale hotels (Motel One, Hampton by Hilton) were individually sold to real estate investors. In addition, four and five star hotels were also acquired e.g. the Abba Hotel by Axa and the Swissotel by RFR. Berlin will remain one of the hot spots for hotel acquisitions in Germany.
OpportunitiesBerlin saw overnight stays reach the 30 million mark in 2015. While 2017 saw weaker growth, there remains good potential for further increases. Hoteliers in Berlin remark that a further state of the art congress center would help generate further business in the MICE segment.
After years of delay, Berlin Brandenburg Airport is expected to open in October 2020, improving international flight connections and the attractiveness of the city for tourists and congress organizers and participants.
One of the challenges for hotels in Berlin is increased competition from the sharing economy. This segment of the market grew by 17% in 2017 and absorbed nearly 3 million overnight stays.
2018 and 2019 forecast: The German economy continues to motor ahead with growth of 2.9% in the year to Q4 2017 and unemployment around record lows at 3.6%. We expect growth to continue, albeit at a reduced rate of 2.4% in 2018 and 2.3% in 2019. One risk to this picture however is the beginning of the end of easy money. Since the US Federal Reserve started to gradually reduce the size of its balance sheet and raise rates, the question has been who will follow next. We expect the European Central Bank (ECB) to further reduce its monthly asset purchases in 2018. If Eurozone inflation rebounds faster than our baseline projection, 2018 could see the end of the ECB’s asset purchase programme.
ForecastFor 2018 we expect only marginal occupancy growth as occupancy remains high, at 77%. ADR growth of 1% drives a weak RevPAR gain of 1.3%, taking RevPAR to €74. Looking to 2019, a further marginal occupancy gain keeps occupancy at a historic high of 77%, but slightly stronger 1.5% ADR growth takes rates to €98 and nudges RevPAR up by 2%, to €76.
Annual hotel statisticsOccupancy (%) ADR (€) RevPAR (€)
2016 77% 94 72
2017 77% 96 73
2018F 77% 97 74
2019F 77% 98 76
Growth on previous yearOccupancy ADR RevPAR
2016 0.7% 2.0% 2.7%
2017 (0.3%) 2.3% 2.0%
2018F 0.3% 1.0% 1.3%
2019F 0.5% 1.5% 2.0%
Source: Data: STR Global 2018 Econometric forecast: PwC 2018 All annual figures are calculated as unweighted monthly averages as our approach does allow forecasting of monthly demand weightings.
30
Euro
pean
cit
ies
hote
l for
ecas
t for
201
8 an
d 20
19

Frankfurt’s hotel performance is cyclical due to the scheduled fair cycle. RevPAR grew by 4% y-o-y in 2017. However, performance in 2018 is expected to be stable, compared to 2017, with lower demand from the fair segment, partly compensated by Brexit related demand. 2019 could become a strong year for hotels in Frankfurt.
RoleFrankfurt is the main financial centre in Germany as well as an important European financial centre. Brexit has meant that international banks and companies have been strengthening their presence in Frankfurt, as the city is centrally located in Europe and served by Germany’s largest airport. The airport recorded more than 64 million passengers in 2017, an increase of about 6% compared to 2016.
Business tourists make up 75% of all the city’s tourists. Frankfurt is also a major centre for international fairs and congresses.
Historical trading2017 was a strong year for the fair market – like every second year in Frankfurt. This is mainly driven by the IAA, the International Automobile Fair, which is attended by more than 800,000 visitors. Strong demand pushed occupancy towards 70% and ADR to 122 Euro. RevPAR grew by 3.7% compared to 2016 and reached 85 Euro, equal to 2015’s record.
Frankfurt
Source: Data: STR Global 2016 Econometric forecast: PwC 2016 All annual figures are calculated as unweighted monthly averages as our approach does allow forecasting of monthly demand weightings
Supply trendsThe hotel industry in Frankfurt accounted for 47,355 hotel beds in 2017 in over 251 hotels. The number of hotels in Frankfurt’s development pipeline remains high, as hotel operators and investor anticipate further growth opportunities. More than 3,500 hotel rooms are planned or under construction – a significant increase.
Hotel groups based in Spain, such as NH and Melia, are very active in the market and account for around 1,100 new hotel rooms. Asia-based hotel groups plan to open at least two new hotels (Tokyo Inn, Soluxe).
In addition, more and new budget and mid market products are to be developed (niu, Motel One, Gekko Hotels, InterCity, Flemings Express, etc.). Typical locations for new hotels are the city centre, between the main station and the fairground and at Gateway Gardens district, next to the airport.
DealsThe largest hotel transaction in Frankfurt was the acquisition of the Le Méridien Parkhotel sold by Art Invest and purchased by CDL Hospitality. It was sold for approx. 280k Euro per room. Further hotel transactions comprised an ibis Styles Hotel, a newly built Innside Hotel (which was acquired by Zurich Group) and a Mercure Hotel.
OpportunitiesBrexit is expected to have a positive impact for the economy, and also for the hotel sector in Frankfurt. Several international banks have already decided to move to Frankfurt and others (like Goldman Sachs) plan to enlarge their operations in Frankfurt.
The biggest fair, the International Automobile Fair, will be held in September 2019. This will support increases in hotel performance in 2019.
2018 and 2019 forecast: For the latest German economic outlook, please refer to the Berlin commentary.
ForecastOur RevPAR forecasts for 2018 expect a marginal decline in 2018 taking RevPAR to €85. However, a recovery in 2019 sees RevPAR increase by 4.3% taking RevPAR up to €88. Despite, the strong pipeline of new projects, we expect occupancy to remain stable at around 70% in 2018 and 2019. The latest ADR forecasts for the Frankfurt hotel market anticipate a -0.9% decline in 2018 and a strong +3.5% in 2019, reflecting the strong demand driven by the Automobile Fair, which is held every two years. In general the high share of international guests supports a higher ADR, as international guests are less price-sensitive than German guests.
Annual hotel statisticsOccupancy (%) ADR (€) RevPAR (€)
2016 69% 119 82
2017 70% 122 85
2018F 70% 121 85
2019F 70% 125 88
Growth on previous yearOccupancy ADR RevPAR
2016 (1.0%) (3.2%) (4.2%)
2017 0.9% 2.8% 3.7%
2018F 0.7% (0.9%) (0.2%)
2019F 0.7% 3.5% 4.3%
31
Euro
pean
cit
ies
hote
l for
ecas
t for
201
8 an
d 20
19

The second most populated city in Switzerland, home to numerous international institutions, financial centers and high-end watchmakers, is also the home of some of the highest hotel prices in Europe. In recent years however, Geneva has been facing challenges in maintaining its average rates and attracting leisure demand. Developers seek to expand the budget hotel sector – a trend that may further lower daily rates.
RoleGeneva is the second most populated city in Switzerland. With over 40% of residents coming from abroad, the city is widely regarded as a global hub. Often called ‘the capital of peace’, Geneva is home to 35 international organizations and more than 350 non-government organizations (NGO). Considered the birthplace and capital of international asset management and commodity trading, the city’s financial sector includes 140 banks, of which 62 are international. Geneva and its surroundings also host some of the most renowned luxury watchmakers in the world.
Historical tradingFor many years Geneva has ranked as one of the European market leaders in ADR. However, the city has been struggling with declining rates and a need for higher leisure demand – essential for stable occupancies. The continued appreciation of the Swiss Franc towards the Euro has lead to reduced buying power from international visitors – a threat that triggered a chain of price decrease reactions by the Geneva hotels, materializing in an ADR decrease of -2.2% in 2017. With regards to occupancy, in 2017 Geneva hotels exceeded their pre-crisis (2008) levels of 69%, driven mostly by the MICE segment.
Geneva
Source: Data: STR Global 2018 Econometric forecast: PwC 2018 All annual figures are calculated as unweighted monthly averages as our approach does allow forecasting of monthly demand weightings.
Historically unable to effectively attract a steady flow of leisure demand, Geneva hotels have seen challenges in staying occupied during the weekends and public holidays, which explains the moderate occupancy averages of 61%-70% in the past 10 years.
Supply trendsThe Geneva hotel supply ecosystem is positioned towards the upper tier, namely upper upscale and luxury which constitute more than half of the total rooms supply. However, with the exception of the recently rebranded Ritz Carlton Hotel de La Paix, the majority of new pipeline hotels capitalize on a clear market need for midscale and budget products. Four Ibis properties recently opened – Ibis Geneve Centre Lac, Ibis budget Palexpo, Ibis Styles Palexpo and Ibis Styles Carouge, with a combined inventory of approx. 465 bedrooms. Another approx. 760 rooms will enter supply after the openings of Groupe Boas, Radisson Blu, Meininger Geneva, CitizenM and YotelPAD Plan-les-Ouates, all of which focus on a more price-conscious midscale segment.
OpportunitiesWith very high entry barriers for new hotels in the city center (scarcity of suitable locations and significantly high land purchase prices), developers turn towards budget and midscale projects in the vicinities as an answer to a clear market need for a more affordable product. Average market rates will likely remain stable even though the market sees midscale and budget hotel additions. Geneva airport will play an important role in providing the infrastructure necessary to accommodate a larger number of travelers. Thanks to a recent investment of approx. CHF 500 million, the infrastructure for long-haul and large capacity flights has been notably upgraded in anticipation of the potential increase in leisure demand.
2018 and 2019 forecast: The Swiss economy has continued growing at a modest pace. Growth in 2018 is expected to reach 1.3% followed by 1.6% in 2019. The Swiss franc has gradually weakened against the euro since 2015 which is supporting exports and the encouraging foreign arrivals.
Following reasonable growth in RevPAR of 1.8% in 2017, we forecast another RevPAR gain of 2% in 2018, taking RevPAR to CHF 193, mainly driven by ADR, and near 1.5% growth in RevPAR in 2019.
The Swiss franc, although stable, remains appreciated and puts pressure on Geneva’s hotel market which, although dependent on the relatively stable business demand from the UN and other organizations, is also dependent on more price sensitive leisure tourists.
Annual hotel statistics
Occupancy (%) ADR (CHF) RevPAR (CHF)
2016 67% 276 186
2017 70% 270 189
2018F 70% 274 193
2019F 70% 278 196
Growth on previous yearOccupancy ADR RevPAR
2016 (0.4%) 0.7% 0.3%
2017 4.0% (2.2%) 1.8%
2018F 0.6% 1.4% 2.0%
2019F (0.2%) 1.7% 1.5%
32
Euro
pean
cit
ies
hote
l for
ecas
t for
201
8 an
d 20
19

With over 40% of residents coming from abroad, the city is widely regarded as a global hub.
33
Euro
pean
cit
ies
hote
l for
ecas
t for
201
8 an
d 20
19
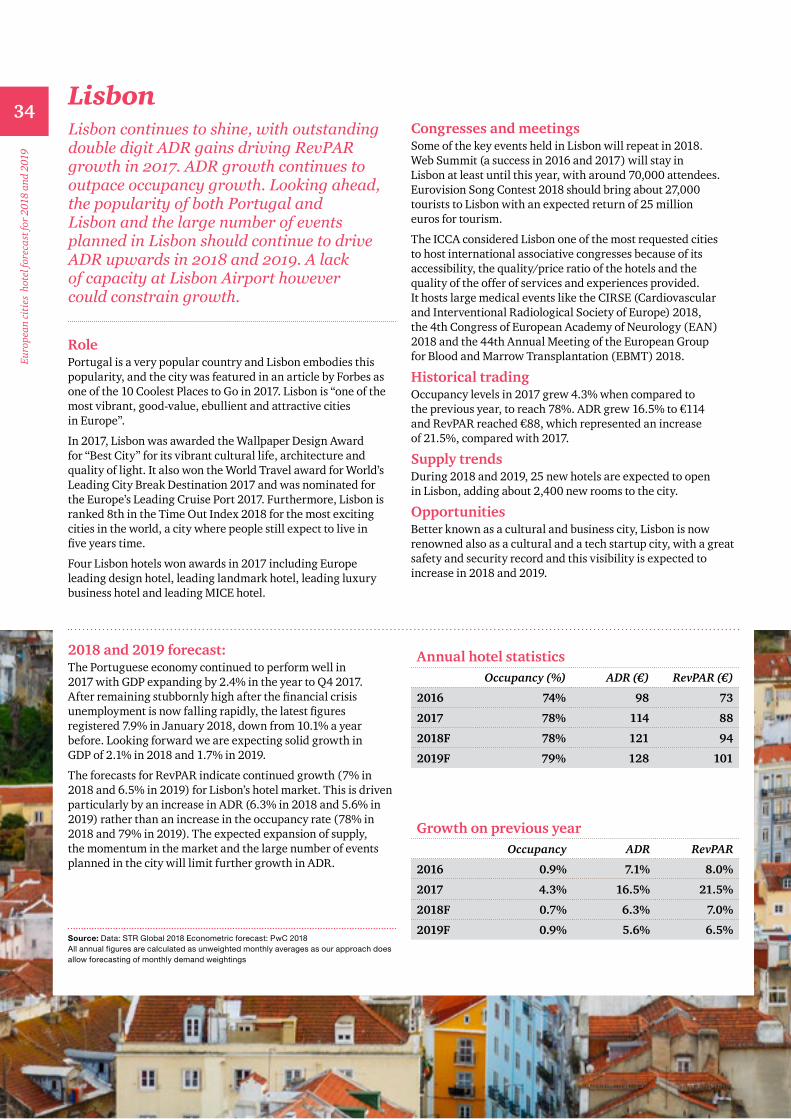
Lisbon continues to shine, with outstanding double digit ADR gains driving RevPAR growth in 2017. ADR growth continues to outpace occupancy growth. Looking ahead, the popularity of both Portugal and Lisbon and the large number of events planned in Lisbon should continue to drive ADR upwards in 2018 and 2019. A lack of capacity at Lisbon Airport however could constrain growth.
RolePortugal is a very popular country and Lisbon embodies this popularity, and the city was featured in an article by Forbes as one of the 10 Coolest Places to Go in 2017. Lisbon is “one of the most vibrant, good-value, ebullient and attractive cities in Europe”.
In 2017, Lisbon was awarded the Wallpaper Design Award for “Best City” for its vibrant cultural life, architecture and quality of light. It also won the World Travel award for World’s Leading City Break Destination 2017 and was nominated for the Europe’s Leading Cruise Port 2017. Furthermore, Lisbon is ranked 8th in the Time Out Index 2018 for the most exciting cities in the world, a city where people still expect to live in five years time.
Four Lisbon hotels won awards in 2017 including Europe leading design hotel, leading landmark hotel, leading luxury business hotel and leading MICE hotel.
Lisbon
Source: Data: STR Global 2018 Econometric forecast: PwC 2018 All annual figures are calculated as unweighted monthly averages as our approach does allow forecasting of monthly demand weightings
2018 and 2019 forecast: The Portuguese economy continued to perform well in 2017 with GDP expanding by 2.4% in the year to Q4 2017. After remaining stubbornly high after the financial crisis unemployment is now falling rapidly, the latest figures registered 7.9% in January 2018, down from 10.1% a year before. Looking forward we are expecting solid growth in GDP of 2.1% in 2018 and 1.7% in 2019.
The forecasts for RevPAR indicate continued growth (7% in 2018 and 6.5% in 2019) for Lisbon’s hotel market. This is driven particularly by an increase in ADR (6.3% in 2018 and 5.6% in 2019) rather than an increase in the occupancy rate (78% in 2018 and 79% in 2019). The expected expansion of supply, the momentum in the market and the large number of events planned in the city will limit further growth in ADR.
Congresses and meetingsSome of the key events held in Lisbon will repeat in 2018. Web Summit (a success in 2016 and 2017) will stay in Lisbon at least until this year, with around 70,000 attendees. Eurovision Song Contest 2018 should bring about 27,000 tourists to Lisbon with an expected return of 25 million euros for tourism.
The ICCA considered Lisbon one of the most requested cities to host international associative congresses because of its accessibility, the quality/price ratio of the hotels and the quality of the offer of services and experiences provided. It hosts large medical events like the CIRSE (Cardiovascular and Interventional Radiological Society of Europe) 2018, the 4th Congress of European Academy of Neurology (EAN) 2018 and the 44th Annual Meeting of the European Group for Blood and Marrow Transplantation (EBMT) 2018.
Historical tradingOccupancy levels in 2017 grew 4.3% when compared to the previous year, to reach 78%. ADR grew 16.5% to €114 and RevPAR reached €88, which represented an increase of 21.5%, compared with 2017.
Supply trendsDuring 2018 and 2019, 25 new hotels are expected to open in Lisbon, adding about 2,400 new rooms to the city.
OpportunitiesBetter known as a cultural and business city, Lisbon is now renowned also as a cultural and a tech startup city, with a great safety and security record and this visibility is expected to increase in 2018 and 2019.
Annual hotel statisticsOccupancy (%) ADR (€) RevPAR (€)
2016 74% 98 73
2017 78% 114 88
2018F 78% 121 94
2019F 79% 128 101
Growth on previous yearOccupancy ADR RevPAR
2016 0.9% 7.1% 8.0%
2017 4.3% 16.5% 21.5%
2018F 0.7% 6.3% 7.0%
2019F 0.9% 5.6% 6.5%
34
Euro
pean
cit
ies
hote
l for
ecas
t for
201
8 an
d 20
19

In 2017, international passengers flights to Lisbon grew 19.6%. TAP announced two new routes to Lisbon (Florence and Nouakchott); Ryanair a new Lisbon-Edinburgh route and Air Canada opened a Lisbon-Montreal route. The Air bridge between Lisbon and Hangzhou (China) opened in August and, in the first six months had an occupancy rate of over 80%, which represents about 40,000 tourists.
Lisbon airport is considered almost at full capacity and this is a factor that could prevent the potential increase in passenger numbers. The construction of a new airport would allow a significant growth in the number of visitors, especially in high season.
Occupancy levels in 2017 grew 4.3%
Four Lisbon hotels won awards in 2017
25 new hotels are expected to open
2,400 new rooms
35
Euro
pean
cit
ies
hote
l for
ecas
t for
201
8 an
d 20
19

Still, on balance, we feel it’s going to be a challenging year in 2018.
36
Euro
pean
cit
ies
hote
l for
ecas
t for
201
8 an
d 20
19

PwC’s revised outlook for London in 2018 reflects relatively lacklustre UK economic growth (despite a strong global economy), a continued squeeze on real incomes, shaky inbound travel trends and a large supply spike in London this year, with more new rooms opening than we saw during the last growth peak in 2012. Nevertheless, we are still forecasting growth and metrics remain high.
RoleLondon is the largest urban area in Europe, a mega city and one of the world’s largest financial centres. It leads in many fields and global business clusters. It is a leading destination for international tourism.
Historical tradingThe ‘shape’ of London trading in 2017 versus that expected in 2018 is an issue this year. The very strong trading in the first half of 2017 and the much weaker second half of the year will mean some particularly tough monthly comparisons until the end of July 2018, followed by easier comparisons for the rest of the year.
London
2018 and 2019 forecast: The UK economy held up well in the six months after the EU referendum, but growth slowed markedly from early 2017 as consumer spending growth moderated. A key factor behind that moderation was the increase in the rate of consumer price inflation (CPI) from around zero on average in 2015 to 3% in the year to January 2018, as global commodity prices have picked up from lows in early 2016, and the effects of the weak pound after the Brexit vote have fed through supply chains. Higher inflation has squeezed real household incomes and this has taken the edge off consumer-led growth. Brexit-related uncertainty has also dampened business investment growth. In our main scenario, we project UK growth to remain modest at around 1.5% in 2018 and 1.6% in 2019.
We anticipate occupancy growth will remain weak and forecast only 0.4% and 0.3% growth in 2018 and 2019 respectively.
ADR growth assumptions for 2018 reflect a falling inflation forecast and only a 0.2% gain in 2018, taking ADR to £149, still a record in nominal terms; in 2019 more robust growth of 1.6% takes ADR up to £151.
RevPAR is forecast to see only 0.6% growth in 2018, taking RevPAR to £122, and to see a 1.9% gain in 2019, taking RevPAR to £124.
Source: Data: STR Global 2018 Econometric forecast: PwC 2018 All annual figures are calculated as unweighted monthly averages as our approach does allow forecasting of monthly demand weightings.
Supply trendsDevelopers have been making hay while the sun shines and above average supply growth is expected with a particularly sharp spike in new supply openings in 2018 (+6%) with a potential 9,000 rooms opening their doors – more than the 8,000 that opened in 2012, the Olympic year. An additional 5,000 new rooms could open in 2019. While London always soaks up new supply (eventually) there can be imbalances for a while and weaker demand trends could make this the case this year. Even if all the rooms don’t get built it’s a lot of new rooms to fill, especially if demand weakens, and comes on top of over 5,000 new rooms in 2017.
OpportunitiesContinued economic growth remains a positive factor underpinning business and holiday demand. Weaker UK economic growth is expected to persist in 2018, as considerable uncertainty still relates to Brexit and weighs on UK economic growth. In addition, there remain pressures on UK household spending and real income growth is expected to continue to be subdued in 2018. While stronger global growth should help cushion inbound business and leisure travel to the UK, weaker UK GDP is likely to depress ADR growth. The weak pound had made the UK more affordable for inbound tourists but it appears that this effect may have ‘fizzled-out’.
Despite many uncertainties, it’s clearly not all gloom, there’s still some growth and London enjoys very high performance metrics, compared to many global cities.
Additional uplift should come from the Royal Wedding in May, Farnborough International Air Show in July and many unique sporting and cultural events around the country, which may also boost London. VisitBritain’s forecast for inbound visits for 2018 is also positive.
Annual hotel statisticsOccupancy (%) ADR (£) RevPAR (£)
2016 81% 142 116
2017 82% 148 121
2018F 82% 149 122
2019F 82% 151 124
Growth on previous yearOccupancy ADR RevPAR
2016 (0.9%) (0.1%) (-1%)
2017 0.2% 4.3% 4.6%
2018F 0.4% 0.2% 0.6%
2019F 0.3% 1.6% 1.9%
37
Euro
pean
cit
ies
hote
l for
ecas
t for
201
8 an
d 20
19

Milan is one of the most important Italian cities not only for business but also for international fashion and fairs, and has been gaining popularity as a leisure destination in recent years, especially since it held the EXPO in 2015. In 2017, tourism in Milan boomed with hotels reaching record occupancy levels of more than 70%, which pushed RevPAR up by almost 10% from the previous year. This momentum is expected to continue over the next couple of years with RevPAR forecasted to grow by 3.9% and 2.6% in 2018 and 2019, respectively.
RoleMilan, one of the biggest and more cosmopolitan Italian cities, is the national business and financial centre and leader in technological and scientific research. Many national and international companies already have HQs in the city, with other large companies searching to be present in the local market as well. The city is well known for its leading museums, theatres, and landmarks as well as international events and fairs, which include the Fashion Week (in February and September), Milan Furniture Fair (in April), SMAU (in October), and EICMA (in November). New events and social activities are constantly being organized in Milan, such as the Fall Design Week, which had its pilot edition in October 2016 and its first full edition in 2017, and MAPIC Italy, which also launched in 2016.
MilanHistorical tradingMilan has historically been supported by business demand, although the leisure component has been increasing over the last few years, especially since the EXPO 2015. The EXPO was a very significant event for the Milanese hotel market in terms of performance and exposure at the international level, with its legacy still positively influencing Milan’s market. Although RevPAR declined in 2016 following the event, which was to be expected, ADR and occupancy still remained above pre-EXPO levels. 2017 was a tremendous year for the hotel market. RevPAR grew by 9.7% from the previous year to €97, with occupancy reaching an all-time high of approx. 71%, pushing the market back towards levels recorded pre-crisis (RevPAR of €104 in 2007).
Investments and New OpeningsMilan continues to be one of the major markets that national and international players are pushing to enter and 2017 was no different. Hotels transacted in 2017 regard both purpose built hotels and conversions, and four major hotel transactions were: the 4-star Hotel NYX (300 rooms), which is a conversion next to the central station that opened in 2017; 5-star Westin Palace Milan (227 rooms) in Piazza della Repubblica; the recently built 4-star M89 hotel (55 rooms); and the 3-star B&B Hotel (188 rooms) in Sesto San Giovanni, which is an office conversion. More than 700 rooms entered the market in 2017, which included the 5-star hotel VIU near the Monumentale metro station (new construction), the 5-star Savona 18 suites in the Navigli district (conversion), and the 4-star hotel NYX (conversion) and the 3-star B&B Hotel (complete refurbishment), both near the central station. Demand is forecast to remain high over the coming years with circa 1,500 rooms expected to enter the market.
2018 and 2019 forecast: The recovery of the Italian economy is expected to continue in 2018 and 2019 with real GDP forecasted to grow at 1.2% in 2018 and 1.0% in 2019. Wages in both the public and private sector are expected to increase along with employment, which will both drive private consumption and support growth.
The legacy of the EXPO, new large-scale developments, an expanding economy, international events, and increasing leisure demand are all expected to contribute to the continued growth of the Milan market, with RevPAR forecasted to increase at 3.9% and 2.6% in 2018 and 2019, respectively.
Source: Data: STR Global 2018 Econometric forecast: PwC 2018 All annual figures are calculated as unweighted monthly averages as our approach does allow forecasting of monthly demand weightings.
Annual hotel statisticsOccupancy (%) ADR (€) RevPAR (€)
2016 65% 135 88
2017 71% 137 97
2018 72% 140 100
2019 72% 144 103
Growth on previous yearOccupancy ADR RevPAR
2016 (5.6%) (10.1%) (15.1%)
2017 7.7% 1.8% 9.7%
2018 1.6% 2.2% 3.9%
2019 0.0% 2.7% 2.6%
38
Euro
pean
cit
ies
hote
l for
ecas
t for
201
8 an
d 20
19

OpportunitiesNational and international investors and hotel operators continue to search for opportunities in Milan and are willing to carry out conversions in the heart of the city. Interest in the budget and limited services category continues to increase as well.
In addition, there is significant activity of large-scale developments throughout Milan. Lendlease just won the public bid to redevelop the area that held the EXPO 2015. The project envisions a permanent hub with a new hospital, international research facility and university campus, mixed with new housing, student accommodations, business, retail and a vibrant public realm, making it one of the largest real estate developments in Europe.
Further, the redevelopment of the disused train stations, better known as ‘scali ferroviari’, around Milan represent additional opportunities in popular locations around the city. Milan has attracted international and national chains in recent years, mostly in the 4 and 5-star categories. The budget and limited service segment is considered to have high potential with chains including Meininger, Motel One, Moxy, and B&B Hotels focusing on the market. Conversions have been playing a key role in Milan, as well as other major markets in Italy, providing investors and operators a way to enter the city centre, which is known to have high barriers to entry. This trend is expected to persist in the coming years as demand to have a flag in Milan continues to increase.
39
Euro
pean
cit
ies
hote
l for
ecas
t for
201
8 an
d 20
19

Tourists flocked back to Paris in 2017 as safety concerns appeared to ease, making 2017 the city’s best year for foreign visitors in at least a decade. As we anticipated, RevPAR rose sharply in 2017, driven by increases in both Occupancy and, to a lesser extent, ADR. Growth should continue in 2018, benefiting from a favourable economic momentum (+2.0% GDP growth in 2017) and the increased attractiveness of France as a destination. The dynamism of key market players in Paris is illustrated by the continued development of the luxury offering together with the launch of new concepts and services, which should positively impact the position of Paris in Europe.
RoleOver 15.9 million visitors stayed in a hotel in Paris in 2017 (+9.9%).
Paris is highly attractive to domestic and international leisure tourists thanks to its rich cultural (2,185 listed monuments) and shopping (62,000 shops, including 5,000 for ready-to-wear) offers.
At the centre of the European economy, Paris is also a major city for business travellers (~50% of nights spent in 2017), thanks to leading international conferences (1,000+ per year) and trade shows (400 per year).
ParisHistorical tradingIn 2017, French economic growth reached its highest level in six years (+2.0%), while the election of President Macron and his early reforms have been positively perceived abroad.
After a significant drop in occupancy in 2015 and 2016, following security incidents, strikes and bad weather incidents, the trend reversed in 2017 reversed in 2017 and occupancy rose from 69.7% in 2016 to 73.5% in 2017. Combined with a rise in ADR to reach €231.3 on average (+3.0%), this led to strong growth in RevPAR, mainly boosted by the double-digit growth in leisure tourism (+13.9% in the number of nights) and strong business tourism (+7.8%).
Supply trendsHotel capacity in Paris grew by 0.5% in 2017 (80,617 rooms in 1,573 hotels).
With about 50% of rooms supplied by hotel chains (stable), the Parisian hotel industry remains characterised by a significant share of independent hoteliers.
The luxury segment will continue to grow with Parisian palaces set to increase from 10 to 13 after the reopening of the Crillon (Jul-17) and the Lutetia (May-18), as well as the construction of the Cheval Blanc. In addition, a number of awaited 5* and 4* hotel openings are planned (e.g. Hôtel Fauchon in 2018).
Economy and budget segments are increasingly addressed by existing or new hotels and collaborative economy players. After the opening of Yooma, MOB Hotel and Okko in 2017, 25hours Hotel and Motel One will open in 2018.
The crackdown on Airbnb illegal listings (which must now obtain a registration number, random controls by The City Hall of Paris, etc.) led to a 12% reduction in listings in Q4 2017, which is set to continue in 2018.
2018 and 2019 forecast: In 2018, we forecast a steady RevPAR increase (+3.6%), resulting from a combination of occupancy (+1.5%) and ADR (+2.1%) growth. Occupancy is mainly driven by macro fundamentals (inflation, unemployment rate, exchange rates). As for ADR, the 2.1% increase is mainly due to the upward trend in the rates of luxury hotels. In 2019, RevPAR is expected to grow by a further 6.4%, driven by the continued improvement in the economic environment and a return to normal following terrorist attacks.
NB: these figures mainly relate to midscale, upscale and luxury hotels (STR data scope).
In the economy/budget hotels segment, we expect RevPAR to recover to its 2014 level (~€70) and reach €71 in 2018 and €81 in 2019 due to a strong increase in occupancy (+5.2%) and a rise in ADR levels (+8.4%in 2019). Occupancy and ADR trends in this category are expected to benefit from changes in unemployment, the USD/EUR exchange rate and the inflation rate.
Source: Data: STR Global 2018 and PwC Analysis Econometric forecast: PwC 2018 All annual figures are calculated as unweighted monthly averages as our approach does allow forecasting of monthly demand weightings.
Annual hotel statisticsOccupancy (%) ADR (€) RevPAR (€)
2016 70% 225 157
2017 74% 231 170
2018F 75% 236 176
2019F 78% 241 188
Growth on previous yearOccupancy ADR RevPAR
2016 (9.0%) (5.6%) (14.2%)
2017 5.5% 3.0% 8.6%
2018F 1.5% 2.1% 3.6%
2019F 4.3% 2% 6.4%
40
Euro
pean
cit
ies
hote
l for
ecas
t for
201
8 an
d 20
19

Hospitality deals were more limited in 2017, apart from the continued diversification of AccorHotels into travel & hotel services (e.g. acquisitions of TravelKeys, Gekko, Availpro, VeryChic in 2017).
In 2018, AccorHotels sold a majority stake in AccorInvest and will use some of the proceeds to enhance its dynamic growth and innovation strategy.
OpportunitiesIn 2018, economic recovery should continue in France with a projected +2.1% GDP growth, likely to drive the domestic demand for hotels.
The growing number of air passengers from outside Europe (+6.2%) and Europe (4.2%) flying to Paris airports in 2017 should continue in 2018 and help maintain the positive momentum of international demand.
The proportion of international customers increased in 2017 thanks to a general increase in key international markets. American, British and German guests account for a third of hotel arrivals.
In addition, the Government has set an ambitious target to reach 100 million tourists in France by 2020 by accelerating the visa procedure and reducing waiting times at airport borders.
In 2018-19, attractive events will take place in the Paris region, including the Ryder Cup (Sept-18), the Paris Air Show (Jun-19) as well as museum openings (e.g. Pinault-Paris Museum in 2019).
In the longer term, the organisation of the 2024 Paris Olympic Games and the €2bn investment plan recently announced to expand Disneyland Paris should be beneficial to tourism activity.
41
Euro
pean
cit
ies
hote
l for
ecas
t for
201
8 an
d 20
19
Porto continues to grow as a leading European tourism city destination, winning several prizes and accolades in 2017. Portugal’s economy continues to perform strongly and key events in Porto should also help increase ADR and RevPAR levels even higher.
RolePorto, Portugal’s second city, is a picturesque destination of old medieval neighborhoods rising up to embrace the other side of the Douro River through the bridges and the rabelo boats.
According to Timeout Index 2018, Porto is the second most exciting city in the world “for making friends, finding love, feeling free to be yourself and the most affordable night”. Awarded European Best Destination in 2017, Porto also won the World Excellence Award 2018 for Best Startup-Friendly City of Europe by the World Business Angels Investment Forum. Moreover, Porto obtained a distinction as 8th Best Mid-Sized City for FDI Strategy by fDi ‘Intelligence European Cities of the Future’ 2018/19 awards, for its quality of life, strategic location, labour and real estate costs which are important factors to attract investment.
The Port of Leixões’ Cruise Terminal has been elected ‘Building of the Year 2017’ by one of the most prestigious international awards of ArchDaily. Porto’s Francisco Sá Carneiro’s airport, was voted by ACI – Airports Council International as one of the best in the European Region for airports handling between 5 and 15 million passengers/year.
PortoHistorical tradingOnce again, Porto enjoyed a very strong tourism and hotel performance in 2017.
According to official data, overnight stays in northern Portugal in 2017, exceeded 7 million. Porto’s own guest numbers totalled around 1.5 million.
According to AirDNA (Airbnb Data & Analytics) the popularity of New Year, saw Porto’s prices more than double in December 2017, compared to December 2016. The median price was 129€, which is more than Lisbon’s 113€.
Supply trendsDue to growing tourist interest in the metropolitan area of Porto for gastronomy, wine tourism, historical heritage and its cultural offer, 16 new hotels (around 900 new rooms) are expected to open in 2018 and 2019.
OpportunitiesPorto continues to gain visibility as a consolidated tourism destination, supporting sustainable growth in the hotel sector. Growth trends are expected to remain positive in 2018.
Porto will again host a wide diversity of events in 2018 and 2019, creating additional tourism opportunities.
The main events include: São João festival, NOS Primavera Sound, Porto’s New Years Eve (around 200,000 people at Aliados square in 2017), several international congresses such as: 96th Conference of the pharmaceutical Trade Marks Group PTMG; 13th EuroSys: European Conference on Computer Systems; 8th European Conference on Protective Clothing (ECPC); 20th International Union of Shoe Industry Technicians (UITIC) Congress; 31st International Conference
2018 and 2019 forecast: The Portuguese economy continued to perform well in 2017 with GDP expanding by 2.4% in the year to Q4 2017. After remaining stubbornly high after the financial crisis, unemployment is now falling rapidly, the latest figures registered 7.9% in January 2018, down from 10.1% a year before. Looking forward we are expecting solid growth of 2.1% in 2018 and 1.7% in 2019.
The forecasts for RevPAR growth indicates continued growth of 10.3% in 2018 and 5.2% in 2019, through an increase in ADR (9.9% in 2018 and 4.7% in 2019) rather than an increase in occupancy (77% in 2018 and 2019).
An expansion in supply, continued momentum in the market and the large number of events planned in the city, could help increase Porto’s ADR.
Source: Data: STR Global 2018 and PwC Analysis Econometric forecast: PwC 2018 All annual figures are calculated as unweighted monthly averages as our approach does allow forecasting of monthly demand weightings.
Annual hotel statistics Occupancy (%) ADR (€) RevPAR (€)
2016 74% 79 58
2017 76% 92 70
2018F 77% 101 78
2019F 77% 106 82
Growth on previous yearOccupancy ADR RevPAR
2016 4.5% 10.9% 15.9%
2017 3.5% 16.5% 20.5%
2018F 0.4% 9.9% 10.3%
2019F 0.5% 4.7% 5.2%
42
Euro
pean
cit
ies
hote
l for
ecas
t for
201
8 an
d 20
19

on Antiviral Research (ICAR); 24th European Meeting of Environmental and Engineering Geophysics Near Surface 2018; 16th International Conference on Communication in Healthcare – ICCH. In 2019, Porto is expected to host the 13th International Congress on Ambulatory Surgery – IAAS and the 14th European Meeting on Glial Cell in Health and Disease – EUROGLIA 2019. Among many others, these events will help to increase the number of tourists in 2018 and 2019.
Guest numbers totalled around
1.5 million
According to Timeout Index
2018, Porto is the 2nd most exciting city in the world
16 new hotels are expected to open
900 new rooms
43
Euro
pean
cit
ies
hote
l for
ecas
t for
201
8 an
d 20
19

In 2017, the hotel market experienced another year of exceptional growth. Whilst GDP growth is expected to slow down in 2018 we still expect a positive outlook for the hotels market, supported by limited supply growth and strong tourism demand as a comparatively safe holiday destination with wonderful sightseeing opportunities.
Role Prague has a growing reputation as one of the most beautiful European capital cities, and boasts a rich cultural heritage. It regularly attracts visitors from all corners of the world, welcoming between 6 and 7 million tourists each year. Known as the ‘City of a Hundred Spires’, Prague’s cultural importance has been recognized since 1992, when the Historic Centre of Prague was included in the UNESCO list of World Heritage Sites. During September 2017, Prague hosted the Laver Cup, a major new international tennis tournament which was broadcast around the world.
Historical trading The Prague hotel market experienced another year of exceptional growth. Average occupancy rose to 80%, its highest level since the economic crisis of the last decade. Average daily rate (ADR) increased 8% year-on-year, to more than EUR 86 (growth was around 5% in local currency terms). Performance measured in euro has been positively impacted by CZK appreciation after the Czech National Bank exited the currency intervention regime in April 2017.
PragueSupply trends Consistently with previous years, there were no major additions to Prague’s hotel supply during 2017. There are a few hotel openings in the pipeline for Prague, however the trend appears to have moved away from completely new development projects to reconstructing older buildings, many of which previously served as office space. The EuroAgentur chain is planning to open a new hotel in Zitna street at the end of 2018, revitalising a previously derelict building. CPI Property is planning to transform its LongIn Business centre into a hotel in the same part of town, commencing in 2018. The years 2019 to 2021 promise to bring a number of new or refurbished properties to the market, including four separate projects on Senovazne namesti; Prague’s first W Hotel (currently known as the Grand Hotel Evropa) on Wenceslas Square and Skanska’s hotel project in the Holesovice district, an area untypical for hotels historically, but which is growing into a well-populated office centre.
DealsAfter significant deals activity in recent years, especially during 2015 and 2016, the pace slowed down in 2017, as owners focused on developing existing properties or preparing them for sale at some point in the future. There have been several transactions of note in 2017, a number involving Asian investors, who once again dominated the market. The design hotel NYX was acquired by a locally-based Vietnamese investor; the Chinese group CEFC bought Motel One from Penta group; and a Thai investment group acquired the 4-star hotel Diplomat as part of a wider cross-border deal. The largest transaction of the year in the whole CEE region was the sale of the 293-room Marriott Hotel in the centre of Prague. Three further Marriott hotels in the Czech Republic are currently on the market and expected to transact in 2018. We have already seen the first transaction of 2018, with the boutique Hotel Leonardo being acquired by Jan Hotel Group.
2018 and 2019 forecast: The Czech economy has grown at a tremendous rate over the last year, increasing by 5.2% in the year to Q4 2017. Whilst we don’t expect this rate to continue we are still projecting a 2.6% expansion in 2018 followed by 2.3% in 2019. This slowdown appears likely because the economy already operating around full capacity, with unemployment at just 2.4% in January 2018, the lowest of any EU nation. Despite the strong economic picture, inflation has remained subdued at 1.6% in February 2018.
We expect continued strong ADR growth of 5.4% will drive a RevPAR gain of almost 7% in 2018, taking RevPAR to CZK 1,922. Occupancy remains high at 81% in 2018, increasing by one percentage point to 82.3% in 2019, the joint highest forecast occupancy rate in this report (with London). ADR growth is expected to moderate to 1.7% in 2019, pushing up RevPAR by 3.4% to CZK 1,987.
Source: Data: STR Global 2018 Econometric forecast: PwC 2018 All annual figures are calculated as unweighted monthly averages as our approach does allow forecasting of monthly demand weightings.
Growth on previous year Occupancy (%) ADR (CZK) RevPAR (CZK)
2016 77% 2,151 1,657
2017 80% 2,251 1,800
2018F 81% 2,374 1,922
2019F 82% 2,414 1,987
Annual hotel statistics Occupancy ADR RevPAR
2016 2.8% 2.6% 5.5%
2017 3.8% 4.7% 8.6%
2018F 1.3% 5.4% 6.8%
2019F 1.6% 1.7% 3.4%
44
Euro
pean
cit
ies
hote
l for
ecas
t for
201
8 an
d 20
19

Opportunities Looking beyond 2018, there are no major events planned in Prague expected to attract one-off visitors. However, Prague is well-placed to capitalise on its reputation for being a comparatively safe holiday destination with wonderful sightseeing opportunities. This should help continue the RevPAR growth story, but it will need to be achieved principally through increased ADR, given that occupancy levels are already at a saturation levels for certain periods of the year.
Whilst GDP growth is expected to slow down in 2018 (from 4.4% in 2017 to 2.6% in 2018), we still expect a positive outlook for the hotels market. After a decline in Russian visitor numbers due to political reasons in 2016, Russian demand returned in 2017. Moreover, the growing demand among European tourists for weekend breaks in Prague could be boosted by the planned high-speed rail network development between Prague and Hamburg, with Dresden and Berlin along the route. In the coming years, we are also expecting a major overhaul of Prague’s Congress Centre, which should help drive an increase in congress tourism. One of the hot topics of recent years – competition from Airbnb and similar providers – has had its impact on the Prague market. Whilst regulation of the shared economy is something the government is considering, so far there are no firm plans. In 2017, the annual increase of tourists using shared accommodation was 60%, according to some market estimates.
45
Euro
pean
cit
ies
hote
l for
ecas
t for
201
8 an
d 20
19

The hotel market in Rome is expected to continue to grow at a moderate pace. We forecast RevPAR growth rates of 1.8% and 1.5% in 2018 and 2019 mainly driven by an increase in ADR, which is still below pre-crisis levels.
RoleRome, the capital of Italy, is not only the city where all the national public institutions, international political and cultural organisations, embassies and largest companies are headquartered, but it’s also the cultural, artistic and spiritual capital of the country. In 2017, the city recorded 29 million overnight stays with 12 million arrivals supported by various segments.
Historical tradingWhile strong RevPAR growth was recorded in Venice (+13%), Milan (+10%), and Florence (+9%) in 2017 over the previous year, Rome’s performance was less noteworthy with only a 0.6% increase from a slight bump in occupancy. In 2017, Rome recorded an occupancy level of 70% and an ADR of €145, which led to a RevPAR of €102.
Supply and deals trendsAfter a period of declining supply and demand as monitored by STR, 2017 recorded positive results with an increase in both the room supply (+0.4%) and the number of rooms sold (+1.1%). During the first few years of the recovery, Rome’s hotel transaction market mainly consisted of international investors acquiring trophy/luxury assets in prime locations. Although there is still strong demand for these types of assets, recent transactions in 2017 and 2016 also included hotels in the 4 and 3-star categories with various investor profiles deploying capital.
Rome
2018 and 2019 forecast: The recovery of the Italian economy is expected to continue in 2018 and 2019 with real GDP forecasted to grow at 1.2% in 2018 and 1.0% in 2019. Wages in both the public and private sector are expected to increase along with employment, which will both drive private consumption and support growth.
Although Rome is one of the leading hotel markets in Europe, performance growth recorded in 2017 was stagnant, especially when compared to other major markets in Italy, such as Venice, Milan, and Florence, which all saw substantial increases in RevPAR.
The hotel market in Rome is expected to continue to grow at a moderate pace. We forecast RevPAR growth rates of 1.8% and 1.5% in 2018 and 2019 mainly driven by an increase in ADR, which is still below pre-crisis levels.
Growth on previous year Occupancy (%) ADR (€) RevPAR (€)
2016 70% 145 101
2017 70% 145 102
2018F 70% 147 103
2019F 71% 149 105
Annual hotel statistics Occupancy ADR RevPAR
2016 0.9% 0.9% 1.8%
2017 0.6% (0.1%) 0.6%
2018F 0.4% 1.5% 1.8%
2019F 0.4% 1.1% 1.5%Source: Data: STR Global 2018 Econometric forecast: PwC 2018 All annual figures are calculated as unweighted monthly averages as our approach does allow forecasting of monthly demand weightings.
In addition, there is strong demand for conversion opportunities to renovate historical buildings into 5-star hotels in the city centre, which is confirmed by the purchase of the former BNL headquarters in 2016 (100 rooms), and two assets in 2017, one on Via Liguria (160 rooms) and another close to the Trevi Fountain. In 2017, three leading hotels re-opened in Rome to much fanfare: the luxurious 98 room Hotel Eden finally opened after an extensive 18-month restoration, along with the Méridien Visconti Palace (240 rooms) and the Hotel Aleph (88 rooms) (now operated under the Curio by Hilton brand). 2017 saw the inauguration of the 118 room, 4-star Meininger near Termini station.
In 2018 and 2019, circa 1,800 rooms are expected to enter the market, mostly in the 4 and 5-star categories. One of the most anticipated hotels to return to the market in 2018/2019 is the Hotel De La Ville, which is expected to re-open after an extensive refurbishment with 105 rooms under the Rocco Forte brand. In addition, one of the major new openings in the near future is the conversion of the former government building ‘Ex Zecca di Stato’ in Piazza Verdi into a top luxury hotel with circa 200 rooms emerging from an agreement between Rosewood and CDP (Cassa Depositi e Prestiti).
OpportunitiesDue to the lack of opportunities and high barriers to entry in the city centre, which have both restricted the potential of Rome’s hotel investment market and new openings, investments regarding conversions of historical buildings in prime locations are expected to continue into 2018 and 2019. International and national hotel operators and investors continue to search for opportunities in Venice, Rome, Milan, and Florence, with demand increasing for seaside and other seasonal tourist destinations as well.
46
Euro
pean
cit
ies
hote
l for
ecas
t for
201
8 an
d 20
19

With a continuous increase in supply and flat demand, Zurich’s hotels have turned towards competitive pricing strategies. As a result, RevPAR has decreased and occupancy remained stable. This trend is expected to continue due to a substantial supply pipeline over the coming years.
RoleZurich is one of the economic hubs of Switzerland with local and global business flourishing in a tax favorable environment. Home to many international and national financial institutions and acting as the gateway for Switzerland with the largest airport and train station, Zurich is equally attractive for business and leisure travelers alike.
Historical tradingIn 2017, Switzerland registered a positive year in terms of overnight stays at levels comparable to the record years 1990 and 2008. Zurich’s hospitality sector has not been able to reflect Switzerland’s tourism developments in terms of performance improvement due to the significant supply expansion that has triggered competitive pricing strategies. As a result Zurich’s ADR dropped by -1.7% to CHF 226 in 2017, whilst average occupancy has remained stable at 72.8% and market RevPAR decreased by -1.7% to CHF 165.
Supply trendsWith an office sector suffering from oversupply and financing costs at an all time low, hotel investments continue to be attractive to local and international investors. Consequently, the Zurich hotel market experienced a strong increase in supply with the addition of 800 rooms in 2018. The segments experiencing the highest increase in supply are lifestyle and boutique hotels in the middle and upper market segments.
Zurich
2018 and 2019 forecast: The Swiss economy has continued growing at a modest pace. Growth in 2018 is expected to reach 1.3% followed by 1.6% in 2019. The Swiss franc has gradually weakened against the euro since 2015 which is supporting exports and the encouraging foreign arrivals. With a continuous increase in supply and flat demand, Zurich’s hotels have turned towards competitive pricing strategies. Declines in ADR are forecast for 2018 (-1.4%) and 2019 (-0.8%) driving a RevPAR decline of -1.9% in 2018, taking RevPAR down to CHF 162. Occupancy sees a 1.3% gain in 2019, to 73%, giving a marginal RevPAR uptick of 0.5%.
Growth on previous year Occupancy ADR RevPAR
2016 (0.7%) (3.1%) (3.8%)
2017 0.0% (1.7%) (1.7%)
2018F (0.6%) (1.4%) (1.9%)
2019F 1.3% (0.8%) 0.5%
Annual hotel statistics Occupancy (%) ADR (CHF) RevPAR (CHF)
2016 73% 230 168
2017 73% 226 165
2018F 72% 223 162
2019F 73% 222 162
Source: Data: STR Global 2018 Econometric forecast: PwC 2018 All annual figures are calculated as unweighted monthly averages as our approach does allow forecasting of monthly demand weightings.
An additional increase of up to 2,200 rooms, is forecast in Zurich and its surrounding area, until 2021.
Hotels in the pipeline, mostly under construction for 2018, include the a-ja resort, two B&B hotels, Harry’s Home, Westgate, Dolder Waldhaus and Green City Hotel. In 2019, the Meininger and a combined Hyatt Regency and Hyatt Place at Zurich Airport’s ‘The Circle’ are scheduled to open. The Intercity Hotel Airport is planned for 2020, while the Niu Hotel and the Ruby Hotel are planned for 2021 respectively.
OpportunitiesSupply is expected to continue to outpace the increase in demand as a devaluation of the Swiss Franc against the Euro is unlikely in the short term. Hotel offerings with lean cost structures are thus most likely to achieve desired yields.
The budget hotel sector is underdeveloped in Zurich’s city center and its suburbs. Centrally located hotel concepts with limited services, appealing to both business and leisure travelers are more likely to avoid the general negative performance trend in Zurich.
Alternative lodging offerings for leisure visitors are already on the rise. This development is mostly driven by AirBnb which lists 2,970 apartments across town and similarly, serviced apartment offerings are growing.
The business segment is expected to remain stable and tourism arrivals and overnight stays from traditional European markets are recovering. Markets such as India and Korea are increasing at a fast pace. Catering to these guests with competitive prices through efficient budget sector concepts might thus provide attractive investment opportunities.
47
Euro
pean
cit
ies
hote
l for
ecas
t for
201
8 an
d 20
19

This section outlines in more detail the PwC models used to forecast hotel occupancy, Average Daily Rate (ADR) and Revenue Per Available Room (RevPAR) for each European city.
Methodology for the hotel forecasts 2018 and 2019
DataOur hotels dataset provided by STR Global contains ADR, hotel room supply, demand and occupancy on a monthly basis for each city.
Macroeconomic variables such as GDP growth and Consumer Price Indices (CPI) were obtained from the International Monetary Fund’s World Economic Outlook Database. All exchange rate data were obtained from Thomson Reuters Datastream. The total nights spent by residents and non-residents in hotels, used to calculate GDP weights, are obtained from Eurostat for all countries.
Econometric modelWe developed a 2-stage least squares (2SLS) instrumental variables approach that models hotel demand and price (ADR) using a two-stage process with the specifications on the panel of data for the cities. This allows us to include relationships between cities as well as the trends for each city. As we used a panel dataset instead of individual time series, this is different from the modelling approach we used for London and the rest of the UK in our regularly published UK report. The key drivers used in this modelling system include visitor demand weighted GDP (see note below), exchange rates, inflation, business investment and dummy variables used to control for one off impacts from terrorist attacks and sporting events.
ForecastsForecasts for ADR growth and hotel demand were generated using PwC forecasts of macroeconomic variables, supplemented by additional forecast data for hotel supply based on country-level pipeline data provided by STR Global. Allowance was made for attrition in the existing supply stock and pipeline based on historic trends and local expectations. RevPAR forecasts were constructed using ADR, demand and supply forecasts.
NotesWe have used a weighted GDP measure in our models; this is a weighted average of GDP growth of the major countries of origin of hotel guests, the weights being the proportion of hotel guests from the corresponding country. For example, if 80% of a city’s hotel guests were from the UK, 10% from France and 10% from the US, then, the weighted GDP measure for the city is the weighted average of GDP growth in the UK (weight 80%), France (10%) and US (10%).
48
Euro
pean
cit
ies
hote
l for
ecas
t for
201
8 an
d 20
19

Emerging Trends in Real Estate®
Reshaping the futureEurope 2018
Further reading
Visit www.pwc.com/hospitality or contact Liz Hall, Head of Hospitality and Leisure research
US Hospitality Directions forecast
The hospitality market in Scandinavia
Women in Hospitality, Travel and Leisure 2020
CEO Survey 2018
Emerging Trends in Real Estate Europe Reshaping the future
European cities hotel forecast – Standing out from the crowd
UK hotels forecast Sept 2017 – As good as it gets
September 2017: Hotels’ good fortune continues but as uncertainty weighs in, is this as good as it gets?
As good as it gets?UK hotels forecast 2018
Standing out from the crowdEuropean cities hotel forecast for 2017 and 2018
March 2017
www.pwc.com/hospitality
The hospitality market in ScandinaviaOverview and challenges faced by hotel operators
October 2017
ceosurvey.pwc
21st CEO Survey
The Anxious Optimist in the Corner Office
Women in Hospitality, Travel, and Leisure 2020 WiH2020 ReviewCreating executive level opportunity for women in hospitality, travel, and leisure, achieving 33 percent female executive leadership by 2020.
Wom
en in Hospitality, Travel, and Leisure 2020
November 2017
Hospitality Directions USOur updated lodging outlook
Harvey and Irma recovery efforts boost lodging industry performance in the third quarterNine months into the new administration, the US lodging industry and broader economy appear to have shrugged offworries of any initial disruption to the economy. Though initial expectations of broad-based economic stimulus,regulatory reform, and tax policy reform have been significantly tempered, underlying macroeconomic conditions,such as consumer spending and employment remain solid.
Our outlook for 2017 anticipates:
Supply growth of 1.8%,just shy of the long-term average
Occupancy of
65.8%
Average daily rate is primary driver of
2.6%increase in RevPAR
Our outlook for 2018 anticipates:
Slight increase in supply growth to long-term average of
1.9%
Slowing growth in demand still results in slight increase in occupancy to
65.9%
After slowing in 2017, average daily rate growth flattens, driving RevPAR increase of
2.5%
Economists at IHS-Markit anticipate that the back-to-backhurricanes in late August and early September (Harvey inHouston and Irma in South Florida) will end up having anegative impact on GDP growth in the third quarter.However, as recovery efforts continue and local andregional economies stabilize, fourth quarter GDP isexpected to recover meaningfully, recouping most of thelost output. The significant impact of these storms on theUS lodging industry has been initially positive, particularlyin areas like Houston where hotels initially filled up withdisplaced families and teams from FEMA, followed byrecovery work crews. Though outperformance in severalindividual metropolitan areas is typically not enough tosway the performance of the domestic industry as a whole,data provided by STR throughout October suggest that therecovery after Harvey and Irma has significantly boostedlodging performance not only in the cities directly impactedby the storms, but in the surrounding areas as well.
In addition to these one-off events, continued strength inconsumer spending, supported by rising disposable income,employment, and household asset values, continues to actas a tailwind for the lodging industry. Though supply is stillan exigent worry for many hoteliers, our updated lodgingforecast anticipates a resilient demand base, supported bysolid macroeconomic fundamentals, and boosted bycontinued storm recovery efforts through at least thebeginning of next year. For 2017, we anticipate demand tosupport an increase in occupancy to 65.8 percent, with ADRgrowth driving a RevPAR increase of 2.6 percent.
Looking ahead to 2018, economic momentum is expected toremain relatively strong. Though changes to FederalReserve leadership are looming, monetary policy is largelyseen as being comparable to that of the current Fed Chair.Unlike last quarter, the prospect of major tax policy reformis more tangible, though it faces many hurdles. Overall, weanticipate demand will continue to outpace supply in 2018,albeit barely, resulting in the highest occupancy level since1981, at 65.9 percent. ADR growth of 2.2 percent isexpected to continue to outpace inflation, resulting in aRevPAR increase of 2.5 percent.
UK hotels forecast update 2018 and 2019
49
Euro
pean
cit
ies
hote
l for
ecas
t for
201
8 an
d 20
19

Contacts
Czech RepublicTomas Basta Partner T: +420 251 152 087 E: [email protected]
Jan Musil Senior Manager T: +420 251 152 160 E: [email protected]
GermanyDirk HennigPartner T: +49 30 2636 1166 E: [email protected]
Markus HaukManagerT: +49 69 9585 5910 E: [email protected]
ItalyAntonio Martino MRICSReal Estate Deals Leader T: +39 346 7855519 E: [email protected]
Christopher HaugM&A Real EstateT: +39 345 0214140 E: [email protected]
FranceArnaud Thibesart PwC | Transaction Services | Partner T: +33 1 5657 7334 E: [email protected]
Vladislava IovkovaDirector StrategyT: +33 1 5657 8452 E: [email protected]
NetherlandsBart KruijssenHospitality & Leisure Leader T: +31 (0) 624 675 054 E: [email protected]
Tjalling Boswijk RT Real Estate Advisor T: +31 (0) 653 882 635 E: [email protected]
PortugalCesar GonçalvesPartner T: +351 213 599 436 E: [email protected]
João Rui BaptistaManager – Knowledge ManagementT: +351 213 599 344 E: [email protected]
SwitzerlandNicolas MayerPartner and Industry Leader – Lodging & Tourism Clients Hospitality & Tourism Center of Excellence EMEA
T: +41 58 792 2191 E: [email protected]
Marco Rensch Head of Investor Services Hospitality & Tourism Center of Excellence EMEA
T: +41 58 792 4618 E: [email protected]
UKDavid TrunkfieldHospitality & Leisure Leader T: +44 020 7804 6397 E: [email protected]
Philip Shepherd Partner – Hospitality & LeisureT: +44 020 7804 9366 E: [email protected]
Liz HallHead of Hospitality & Leisure Research T: +44 020 7213 4995 E: [email protected]
Samantha Ward Hotels LeaderT: +44 020 7212 2974 E: [email protected]
Richard Snook EconomistT: +44 020 7212 1195 E: [email protected]
50
Euro
pean
cit
ies
hote
l for
ecas
t for
201
8 an
d 20
19

51
Euro
pean
cit
ies
hote
l for
ecas
t for
201
8 an
d 20
19

www.pwc.co.ukThis publication has been prepared for general guidance on matters of interest only, and does not constitute professional advice. You should not act upon the information contained in this publication without obtaining specific professional advice. No representation or warranty (express or implied) is given as to the accuracy or completeness of the information contained in this publication, and, to the extent permitted by law, PricewaterhouseCoopers Legal LLP, its members, employees and agents do not accept or assume any liability, responsibility or duty of care for any consequences of you or anyone else acting, or refraining to act, in reliance on the information contained in this publication or for any decision based on it.
© 2018 PricewaterhouseCoopers Legal LLP. All rights reserved. PricewaterhouseCoopers Legal LLP is a member of PricewaterhouseCoopers International Limited, each member firm of which is a separate legal entity.
PWC100124_HB_MISC_0418