Embed Size (px)
Citation preview

Best for the Buck:Using Asset Management
for Project Design atHighline Water District
Matthew J. Maring, P.E.
April 30, 2008
Best for the Buck I April 30, 2008
Initial Project Design Concept
Transmission Capacity Improvements–4600’ 16” Diameter Mains–$1.8M Estimated Capital Cost
Dead-End Main Looping Improvements–6500’ 8” Diameter Mains–$2.1M Estimated Capital Cost
New Pressure Zone Creation–7 PRVs and 12 Isolation Valves–$0.8M Estimated Capital Cost
$4.7M Total Estimated Capital Cost
Best for the Buck I April 30, 2008
Project Approach
Asset Management Predesign Review–Business Case Evaluation–Hydraulic Modeling Analysis–Alternative Design
Approaches Identify, Optimize, Assess, Compare
– Identify Preferred Design Alternatives
Detailed Design Construction

Best for the Buck I April 30, 2008
Business Case Evaluation Process
Form Expert Team – Highline and BC Staff
Problem and Level of Service Definition
Data Collection, Problem Characterization
Alternative Development Brainstorming
Alternative Performance Evaluations–Hydraulic Modeling Analysis
Alternative Performance, Cost, and Risk Comparison
Preferred Solutions Detailed Design
Best for the Buck I April 30, 2008
Business Case Difference
Lifecycle Cost – A dollar is a dollar–Capital, O&M, R&R, Risk Costs
Triple Bottom Line Costing–Financial–Community/Social–Environmental
Preferred Solution = Lowest Lifecycle Cost that Meets Level of Service
Decisions–Documented, Defensible,
Transparent
Best for the Buck I April 30, 2008
Problem Definition
Low Pressures Limited Fire Flow Availability Dead-End Mains
–Water Circulation and Turn Over
–Low Pressures, Limited Fire Flow
High Pressures–Frequent Main Breaks
Best for the Buck I April 30, 2008
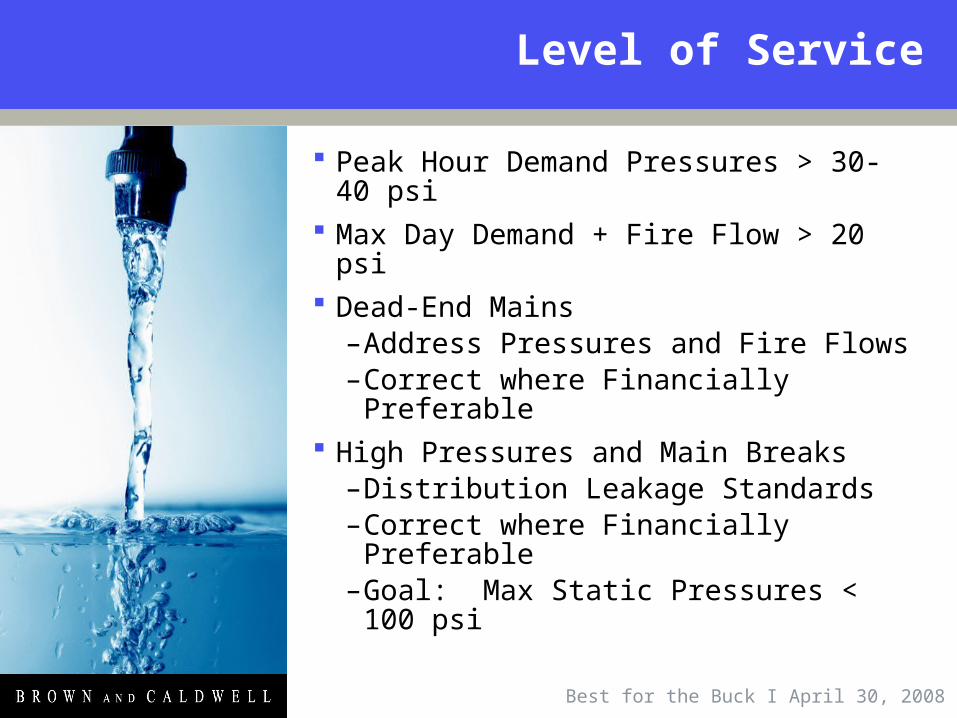
Level of Service
Peak Hour Demand Pressures > 30-40 psi
Max Day Demand + Fire Flow > 20 psi
Dead-End Mains–Address Pressures and Fire Flows–Correct where Financially
Preferable High Pressures and Main Breaks
–Distribution Leakage Standards–Correct where Financially
Preferable–Goal: Max Static Pressures < 100
psi
Best for the Buck I April 30, 2008
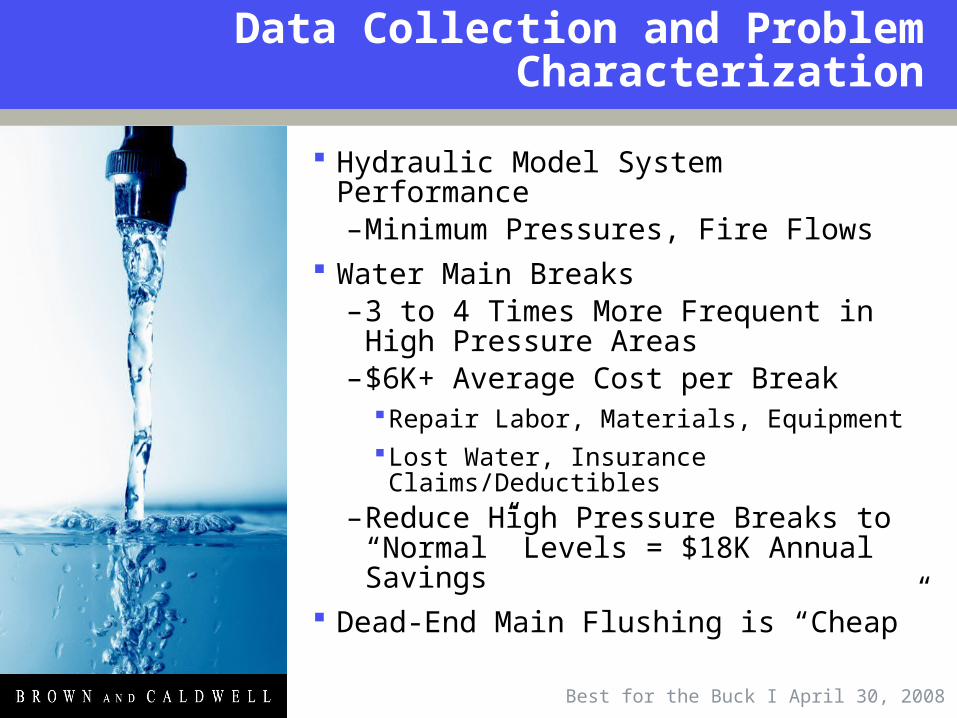
Data Collection and Problem Characterization
Hydraulic Model System Performance–Minimum Pressures, Fire Flows
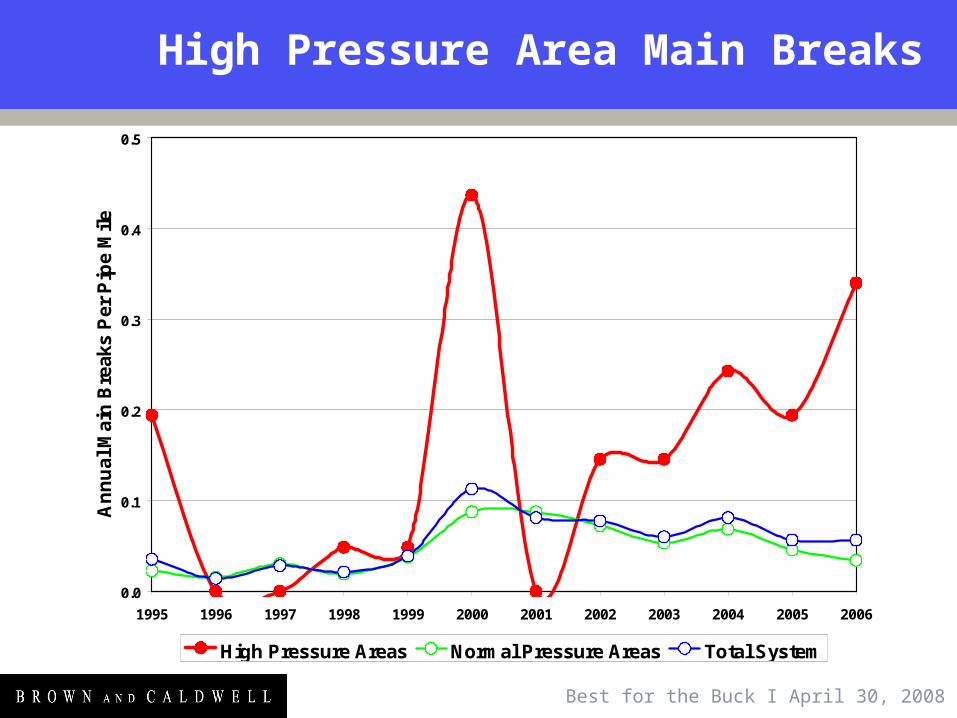
Water Main Breaks–3 to 4 Times More Frequent in
High Pressure Areas–$6K+ Average Cost per Break
Repair Labor, Materials, EquipmentLost Water, Insurance Claims/Deductibles
–Reduce High Pressure Breaks to “Normal” Levels = $18K Annual Savings
Dead-End Main Flushing is “Cheap”
Best for the Buck I April 30, 2008
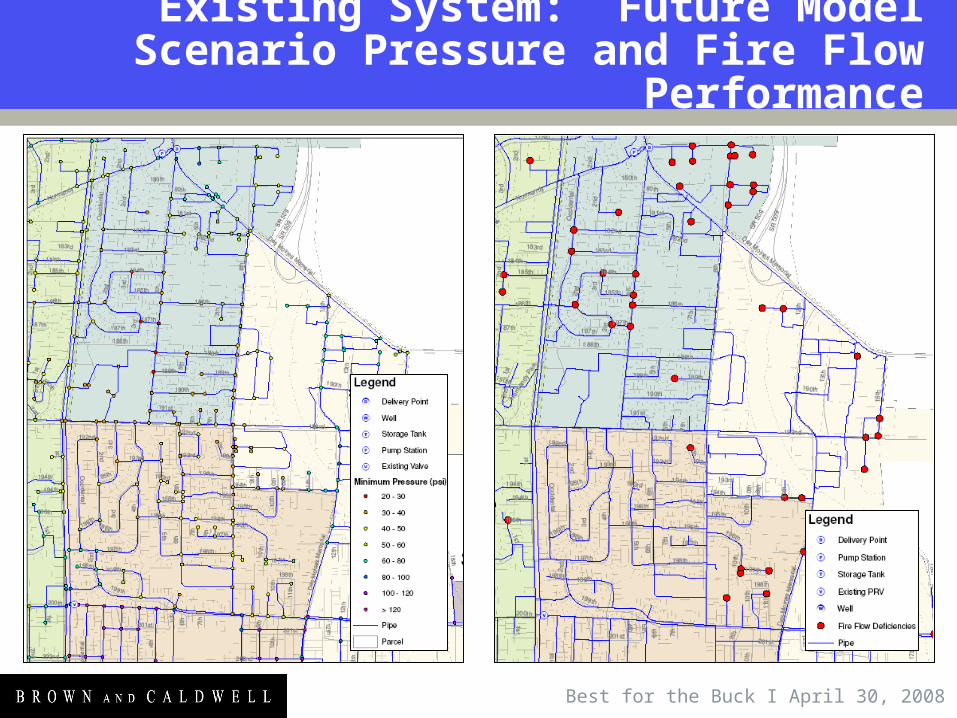
Existing System: Future Model Scenario Pressure and Fire Flow
Performance
Best for the Buck I April 30, 2008
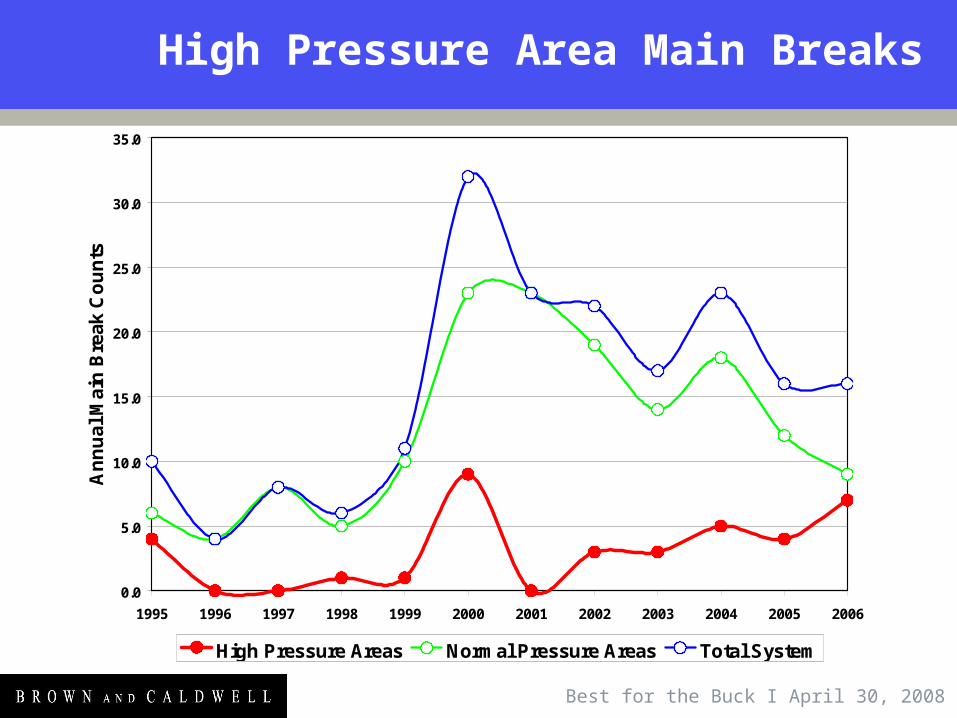
High Pressure Area Main Breaks
0.0
5.0
10.0
15.0
20.0
25.0
30.0
35.0
1995 1996 1997 1998 1999 2000 2001 2002 2003 2004 2005 2006
An
nu
al M
ain
Bre
ak C
ou
nts
High Pressure Areas Normal Pressure Areas Total System
Best for the Buck I April 30, 2008
High Pressure Area Main Breaks
0.0
0.1
0.2
0.3
0.4
0.5
1995 1996 1997 1998 1999 2000 2001 2002 2003 2004 2005 2006
An
nu
al M
ain
Bre
aks
Pe
r P
ipe
Mile
High Pressure Areas Normal Pressure Areas Total System
Best for the Buck I April 30, 2008
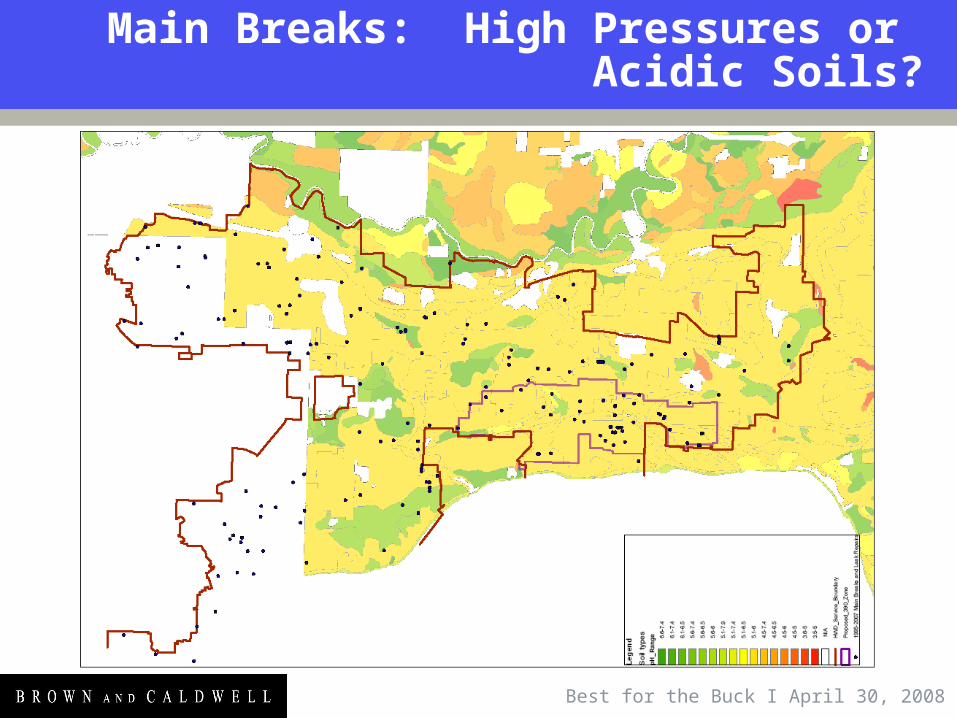
Main Breaks: High Pressures or Acidic Soils?
Best for the Buck I April 30, 2008
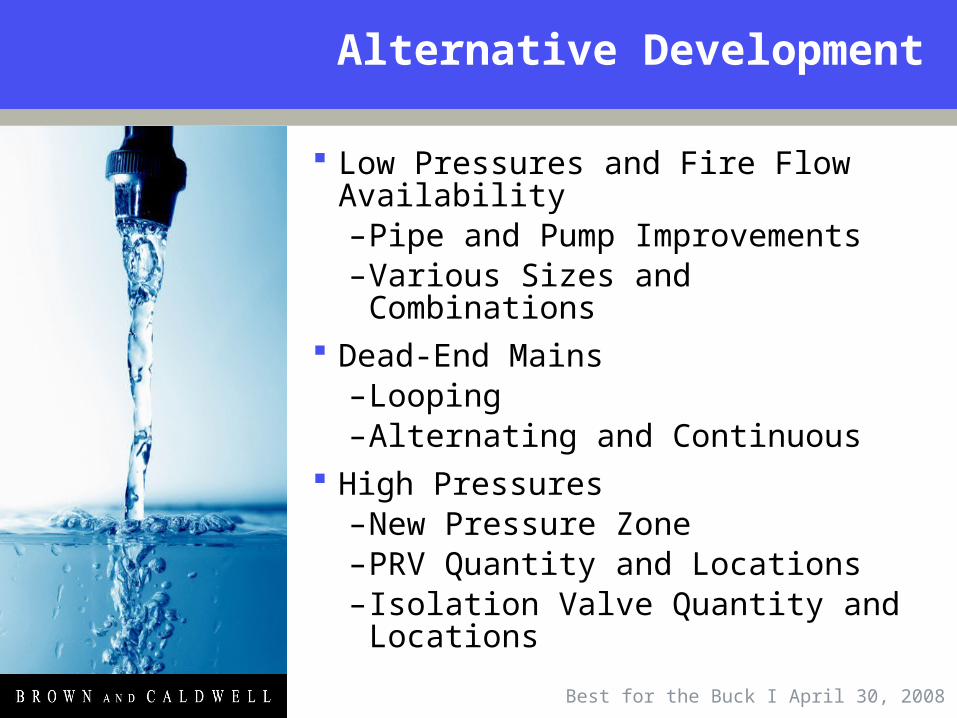
Alternative Development
Low Pressures and Fire Flow Availability–Pipe and Pump Improvements–Various Sizes and Combinations
Dead-End Mains–Looping–Alternating and Continuous
High Pressures–New Pressure Zone–PRV Quantity and Locations– Isolation Valve Quantity and
Locations
Best for the Buck I April 30, 2008
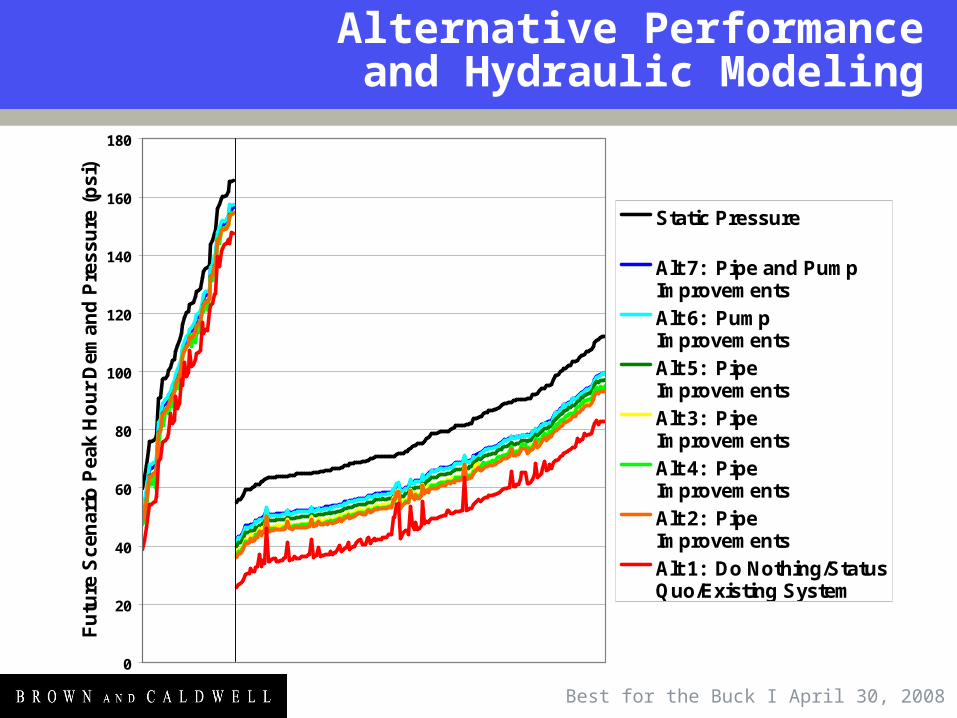
Alternative Performanceand Hydraulic Modeling
0
20
40
60
80
100
120
140
160
180
Fu
ture
Sce
nar
io P
eak
Ho
ur
Dem
and
Pre
ssu
re (
psi
)
Static Pressure
Alt 7: Pipe and PumpImprovements
Alt 6: PumpImprovements
Alt 5: PipeImprovements
Alt 3: PipeImprovements
Alt 4: PipeImprovements
Alt 2: PipeImprovements
Alt 1: Do Nothing/StatusQuo/Existing System
South Area Model Nodes
North AreaModel Nodes
Best for the Buck I April 30, 2008
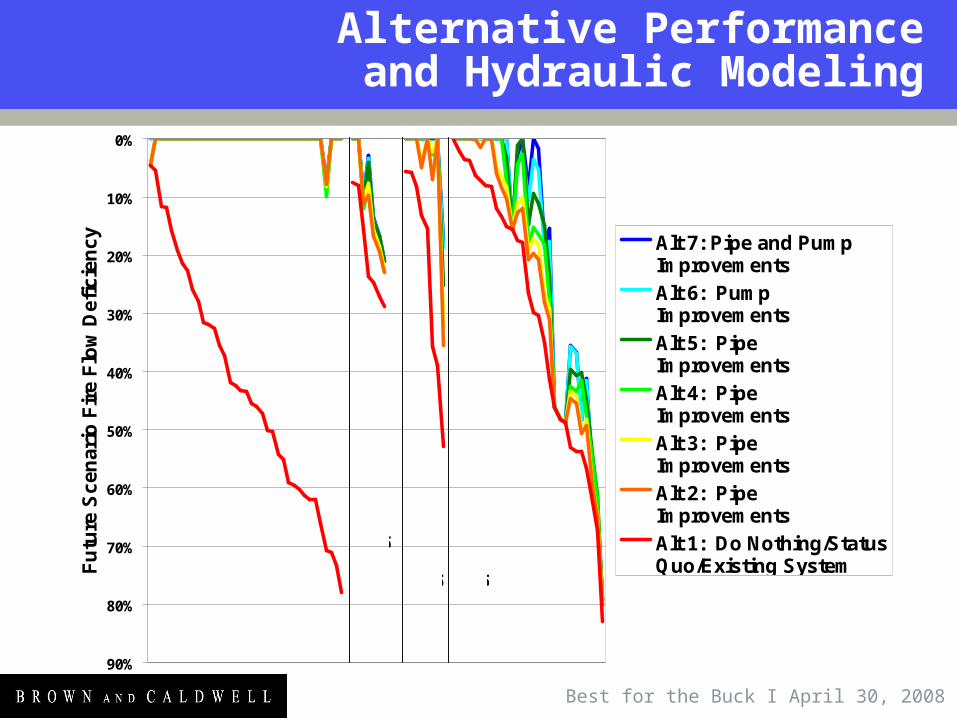
Alternative Performanceand Hydraulic Modeling
0%
10%
20%
30%
40%
50%
60%
70%
80%
90%
Fu
ture
Sce
nar
io F
ire
Flo
w D
efic
ien
cy Alt 7: Pipe and PumpImprovements
Alt 6: PumpImprovements
Alt 5: PipeImprovements
Alt 4: PipeImprovements
Alt 3: PipeImprovements
Alt 2: PipeImprovements
Alt 1: Do Nothing/StatusQuo/Existing System
So
uth
Are
a M
od
el N
od
es10
00 g
pm
Fir
e F
low
No
rth
Are
a M
od
el N
od
es10
00-1
500
gp
m F
ire
No
rth
Are
a M
od
el N
od
es25
00 g
pm
Fir
e F
low
No
rth
Are
a M
od
el N
od
es35
00 g
pm
Fir
e F
low
Best for the Buck I April 30, 2008
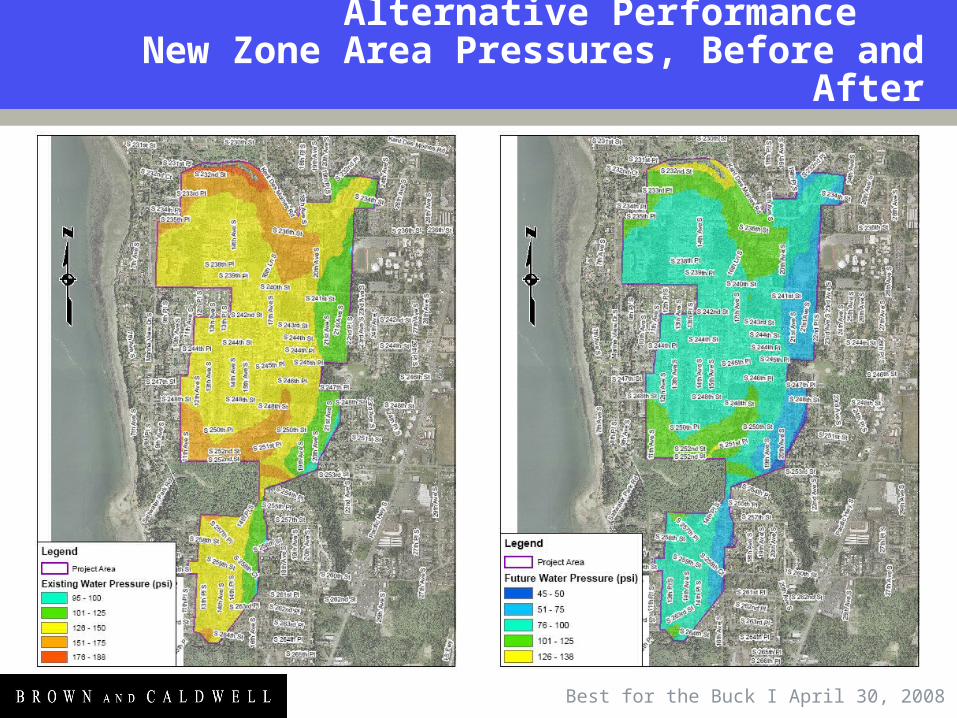
Alternative Performance New Zone Area Pressures, Before and
After
Best for the Buck I April 30, 2008
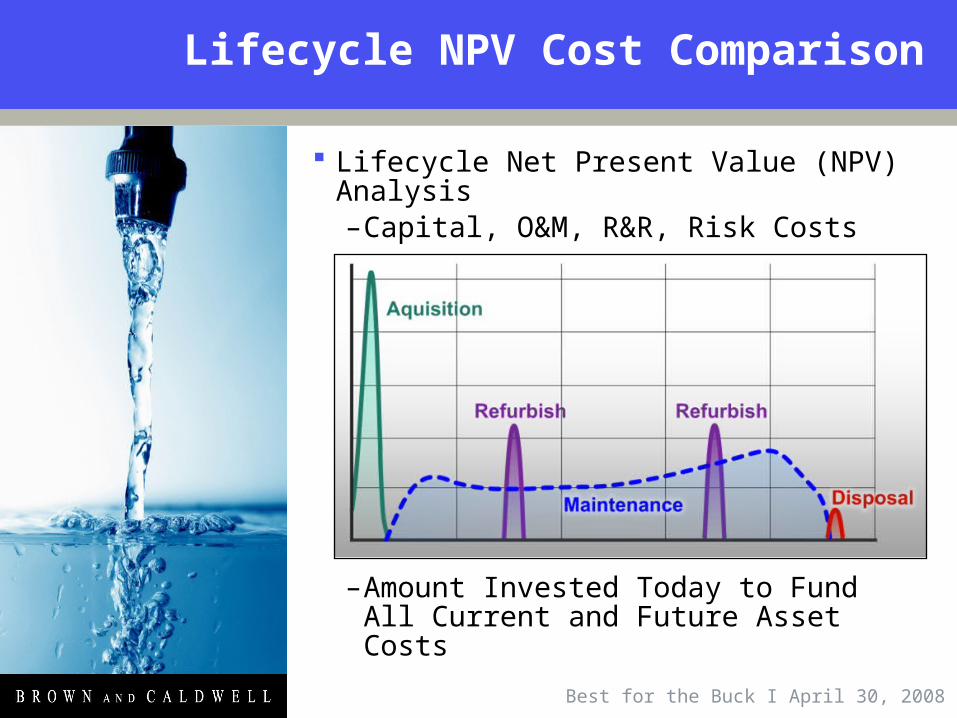
Lifecycle NPV Cost Comparison
Lifecycle Net Present Value (NPV) Analysis–Capital, O&M, R&R, Risk Costs
–Amount Invested Today to Fund All Current and Future Asset Costs
Best for the Buck I April 30, 2008
Risk Cost Considerations
Risk Cost = (Probability) x (Consequence)–Example A:
(Annual Number of Main Breaks) x (Average Break Repair Cost)
–Example B:(Likelihood of Insurance Claim) x (Insurance Deductible + Staff Costs)
Benefit Cost = (Probability) x (Avoided Consequence)–Example C:
(Avoided Number of Main Breaks) x (Average Break Repair Cost)
Best for the Buck I April 30, 2008
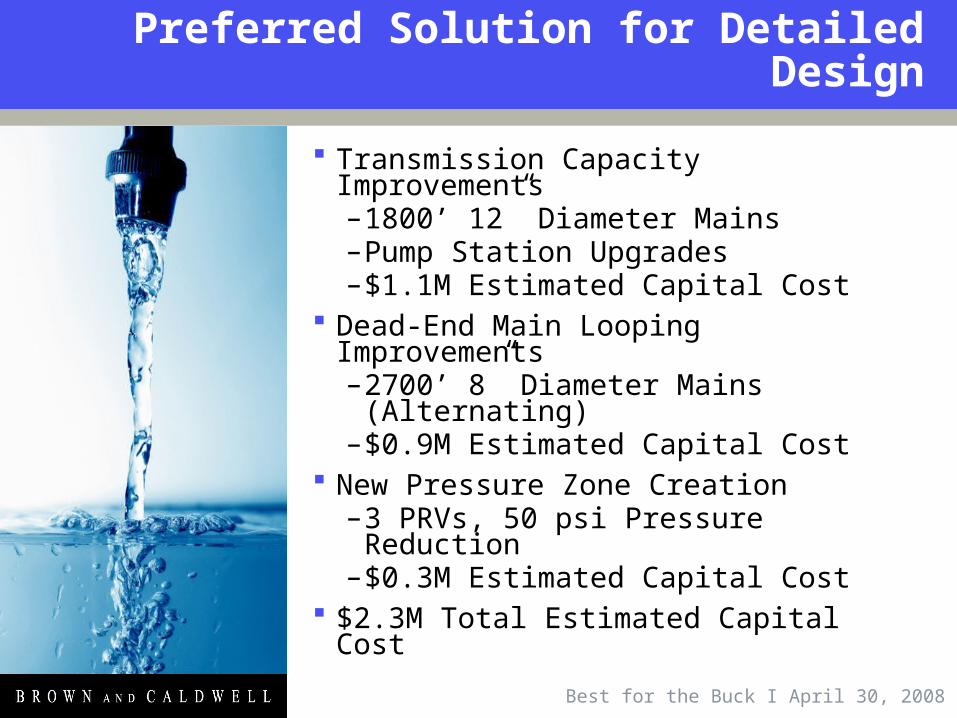
Preferred Solution for Detailed Design
Transmission Capacity Improvements–1800’ 12” Diameter Mains–Pump Station Upgrades–$1.1M Estimated Capital Cost
Dead-End Main Looping Improvements–2700’ 8” Diameter Mains
(Alternating)–$0.9M Estimated Capital Cost
New Pressure Zone Creation–3 PRVs, 50 psi Pressure
Reduction–$0.3M Estimated Capital Cost
$2.3M Total Estimated Capital Cost
Best for the Buck I April 30, 2008
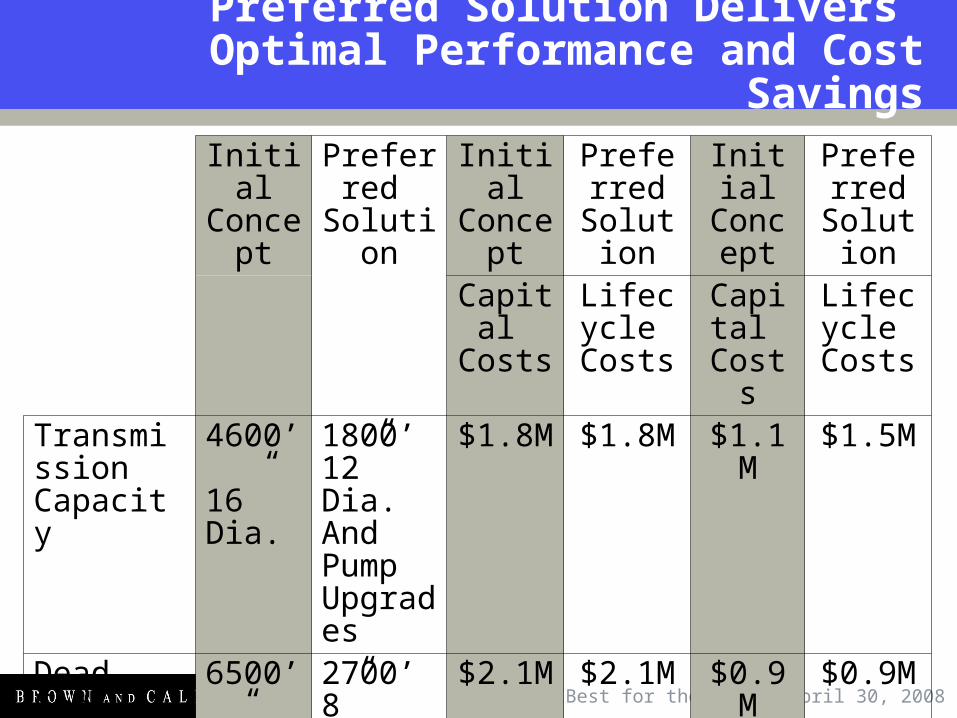
Preferred Solution Delivers Optimal Performance and Cost
SavingsInitialConcept
Preferred
Solution
InitialConcept
Preferred
Solution
InitialConcept
Preferred
Solution
Capital
Costs
Lifecycle
Costs
Capital
Costs
Lifecycle
CostsTransmissionCapacity
4600’
16” Dia.
1800’ 12” Dia. And Pump Upgrades
$1.8M
$1.8M $1.1M
$1.5M
Dead-End Loops
6500’
8” Dia.
2700’ 8” Dia.
$2.1M
$2.1M $0.9M
$0.9M
New PressureZone
8 PRVs12 Iso. Valves
3 PRVs $0.8M
$1.2M $0.3M
$0.4M
Totals $4.7M
$5.1M $2.3M
$2.8M
Best for the Buck I April 30, 2008
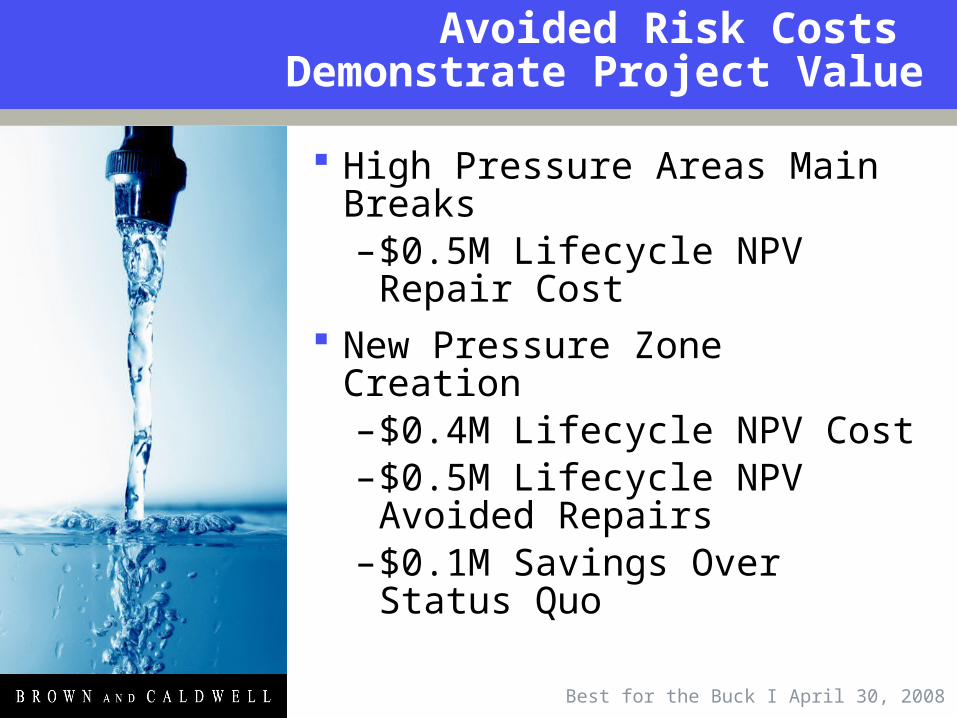
Avoided Risk Costs Demonstrate Project Value
High Pressure Areas Main Breaks–$0.5M Lifecycle NPV Repair
Cost New Pressure Zone Creation
–$0.4M Lifecycle NPV Cost–$0.5M Lifecycle NPV
Avoided Repairs–$0.1M Savings Over Status
Quo
Best for the Buck I April 30, 2008
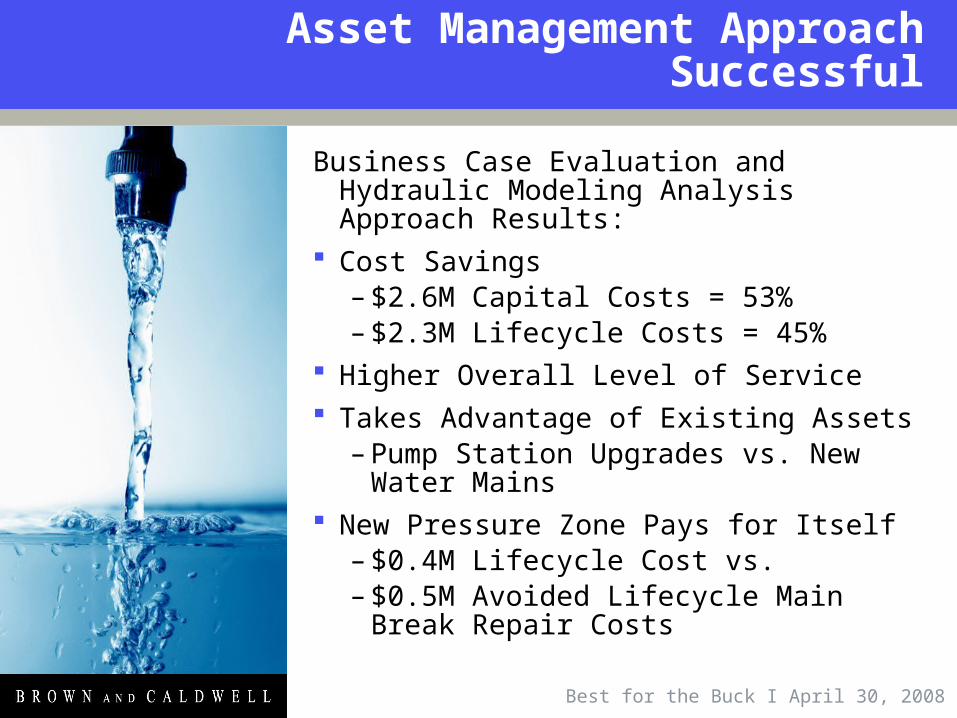
Asset Management Approach Successful
Business Case Evaluation and Hydraulic Modeling Analysis Approach Results:
Cost Savings– $2.6M Capital Costs = 53%– $2.3M Lifecycle Costs = 45%
Higher Overall Level of Service Takes Advantage of Existing Assets
– Pump Station Upgrades vs. New Water Mains
New Pressure Zone Pays for Itself– $0.4M Lifecycle Cost vs.– $0.5M Avoided Lifecycle Main
Break Repair Costs
Best for the Buck I April 30, 2008
Questions?