Embed Size (px)
Citation preview

BestAvailable
Copy

M ~Distr,,±;u±on Statemonts oni 2Tachnicul Zx-ntS
.. J. .- la "ervicas Branch 15 I"Ov 71Mhief, soil!: D.Lv GDl~/wh27
1. t~:a a Xerox copy of Chc-nZO 3 to Appendix 11 of AR 70-31, StarAd=As forTccmnialFLM-'Wng(Inc) 1). Also inclosed are the pceas from our' complete ZIAA Of
Public~. evi,, ioO- reports of you~r Dlivision ha~ving restrictive ",t.=.ntz 11 )
Affect-o. titlecz .rc indicated in red.
2. ZitrZtat ~-cat 2, "7-his doa.'vent is subject to special. c*_,ort controls ndeach ii alto ,'orai~n governzaonrrt or foreign national1s =w.; I.a =aae o."aY '-ith
jor ~oaJ.OI (controllina of ficc), " cvi our reports nust ba cb.,',-ed to eitherStac~2~ Aor Statazer:1t B (soc pae-es ±. nd 5 of In). 1) befor.e tno end o- 19Th.
There-, rep i s requested th-at yoai riw the reports bearing Stevem~nt 2 ni-di~~by e~btitle on the livt tho r.c*. r.z'atC=3nt to be impoczd oa dcuent =d
r-turn co;: .-.2.oted list to Public w.,iOnS L3 zoon as possible.
3. if ~~ B is to be oms ; .uet loase 3-ive -^ml ztWatc--nt (see pg5 ~':~2. ~ t~. w cinLw~~wct. ;int~L.t~.~rd ,lzc n rcning copie
5o0 rc f -0 liati~ I-e ~ . . a~lei u cOc.rc Cr.er Liary. A.11re
0--tc on;~ -.ol in va £o"...:./xon ib. re..
2c -.. n ",e iD L
Best Available Copy

Rev 2/1971
CONTRACT REPORTS (Continued)
Nvfmber Date Title Restrictions
Soils Division, 1969
S-69-1 May 1967 The Use of Sodium Silicate and Transmittal out-Sulphur as a Dust Palliative side U. S. Govt
agencies must beapproved by AMC
S-69-2 June 1968 Study of Wave Propagation in Con-fined Soils
S-69-3 Apr 1969 Effect of Degree of Saturation onCompressibility of Soils from theDefence Research Establishment,Suffield
s-69-4 Oct 1969 Dutch Friction-Cone PenetrometerExploration of Research Area atField 5, Eglin APB, Florida
*S-69-5 Apr 1969 Cracking of Earth and Rockfill Dams;A Theoretical Investigation by Meansof the Finite Element Method
*S-69-6 Sept 1969 Finite Element Analyses of Port
Allen and Old River Locks
*S-69-7 July 1969 A Theoretical Study of Landing Subject to spe-Mat Behavior -ial export con-
trols by AMC
',*s-69-8 Nov 1969 Finite Element Ana21ses ofStresses and Movements in Em-bankments During Construction
Miscellaneous Subjects, 1969
0-69-1 May 1969 A Water Resources Ecology Capa-bility for the Waterways Experi-ment Szation and Corps of Engineers
* Issued in 1970.
30

644
.41
000
moW
A4
'fiV

T-
>vt
VC
4O
I0h' 'xt V 10 o be osmdaaolf~r
t(A wvvA40lu'el

0
CONTRACT REPORT S-69-7
wA THEORETICAL STUDY OF LANDING MATBEHAVIOR
by
M. E. Harr, J. C. Rosner
liii W101ft SWGs
$1 l' . ....... ---
• W1. : . ....A .'. ~ 1T13 's 'j
July 1969
Sponsored by U. S. Army Materiel Command
Research and Development Directorate, Washington, D. C.
Conducted for U., S. Army Engineer Waterways Experiment Station, Vicksburg, Mississippi
Under Contract DACA39-67-C-0044
By Purdue Research Foundation, Purdue University, Lafayette, Indiana
&RMY MRC VICKSBURG MISS
Thi -onalsma l iApproved for Public Release, Distribution Unlimitedl

41
FOREWORD
The work reported herein was performed by the Purdue Research Founda-tion, Purdue University, Lafayette, Indiana, for the U. S. Army EngineerWaterways Experiment Station (WES) under Contract DACA 39-67-C-oohh, duringthe period July 1967 to March 1969. The study was conducted as a part ofthe landing mat program under Research and Development Project No. 1T062103AO46,"Trafficability and Mobility Research," Task 05, "Mobility Engineering Support,"under the sponsorship of the Research and Development Directorate, U. S. ArmyMateriel Command (AMC). The principal investigators were Messrs.'Milton E.Harr, Professor of Soil Mechanics, and John C. Rosner, Graduate Instructor.
WES Soils Division personnel directly concerned with monitoring thiscontract were Messrs. D. N. Brown, Chief, Design and Analysis Section, andD. W. White, Mat Section, under the general supervision of Mr. J. P. Sale,Chief, Soils Division. COL Levi A. Brown, CE, was Director of the WES andMr. F. R. Brown was Technical Director during this study.
ii 72%S3

TABLE OF CONTENTS
Page
LIST OF TABLES. . . . . . . . . . . . . v
LIST OF FIGURES . . . . . . . . . . vi
LIST OF SYMBOLS . . . . . . . . . . . . ix
ABSTRACT . . ....... * xii
INTRODUCTION . . . . . . . . . . . . 1
REVIEW OF LITERATURE. . . . . . . . . . . 3
Existing Theories of Surface Displacements . . . 3Winkler Concept . . . . . . . . . . . 3Elastic Solid Models . . ..... . . 5Viscoelastic Models . . . . . . . . 8
Prototype Tests on Landing Mats . . . . . . 10Application of Theories to Landing Mats . . . . 12
MODEL DEVELOPMENT AND SIMULATION . . . . . . . 15
Introduction . . . . . . . . . . 15Development of Mat-Soil Model . . ... . . . 15Parameter Identification Techniques . . . . . 21State Variable Filter . . . . . . . . . 22Steep Descent Method ......... 22Identification of the Parameter y ..... 25
Correlation of Model Parameters to Mat-SubgradeProperties . . . . . . . . . . . . 27
Results . . . . . .. . . . . . . 29Layer Thickness Investigation .. .. . . 29Correlation of Model Parameters to Mat-Subgrade
Properties . . . . . . . . . . . . 29Summary and Discussion of Model . . . . . . 37
DEVELOPMENT OF FAILURE CRITERION . . . . . . . 44
Introduction. . . . . . . . . . . 44Residual Load Concept .. . . . . . 45Dimensional Analysis and Taylor Expansion . . . 47Regression Analysis .......... 50
iii

Page
Educated Trial and Error Procedure . . . . . . 58Results . . . . 62Su, nary and Discussion of Failure Criterion . . . 64
ASYMMETRIC LOAD MODEL ........ . 72
Introduction . ..... .....-.- 72Analysis of Model Behavior " e " ' " " " " 74Development of Landing Mat-Soil Model . . . . . 76Results . . . . . . . . . . . . . . . 80Discussion. . . . . . . . . . . . . . 86
MOMENT TRANSFER INVESTIGATION . . . . . . . . 88
SUGGESTIONS FOR FURTHER RESEARCH . . . . . . . 99
SUMMARY AND CONCLUSIONS . . . . . . . . 100
LIST OF REFERENCES. . . . ...... . 101
APPE:7DIX A: VARIATIONAL METHOD OF ANALYSIS FORELASTIC FOUNDATIONS . . . . . . . 108
APoENDIX B, INFINITE BEAM ON AN ELASTIC FOUNDATION . 116
APPENDIX C: STATE VARIABLE FILTER FORMULATION . . 122
APPENDIX D: STEEP DESCENT METHOD . . . . . . . 125
APPENDIX E: FORMULATION FOR MOMENT TRANSFERINVESTIGATION .. . . . . . . . 128
iv

LIST OF TABLES
Table Page
1. Effect of Poisson's Ratio on Deflection . . . 21
2. Values of k Along the Valley of the ErrorFunctional • • • . . . . . . o . 25
3. Comparison of Simulation Error for DifferentSoil Layer Thicknesses . . . . . . . 30
4. Comparison of the Variability of theCharacteristic k . . . . . . . 31
5. k Values for Minimum Simulation Error 33
6. Comparison of Deflection Patterns . 38
7. Comparison of Simulated to Calculated Valuesof kiNT . . . . . 40
8. Results of Dimensional Analysis Study ofSingle-Wheel Tests . . . . . . . . 51
9. Predicted Deflections of the Mat at Failurefor Single-Wheel Tests . . . . . . . 53
10. Predicted Deflections of the Mat at Failurefor Dual-Wheel Tests . . . . . . . . 55
11. Comparison of Performance for Dual-Wheel Tests. 66
12. Comparison of Performance for Single-Wheel Tests . . . . . . . . .. . . 67
13. End Joint Moment Transfer Deficiency Based
Upon Uniform Subgrade Conditions . . . . 91
14. Comparison of k Values . . . . 94
15.--Ratio of k Values . . . . o 97
v

LIST OF FIGURES
Figure Page
1. Distribution of Stresses with Depth .... 19
2. Distribution of Displacement with Depth • • 19
3. Behavior of Error Functional (Section 1,Lane 2, Item 3) ........ . 23
4. Behavior of Error Functional (Section 9,Lane 22, Item 2) .. . . . . . 24
5. Influence of the Parameter Gamma on theDeflection Pattern . . . 26
6. Variation of Parameter k with Coverage forSingle-Wheel Tests .... . .... 35
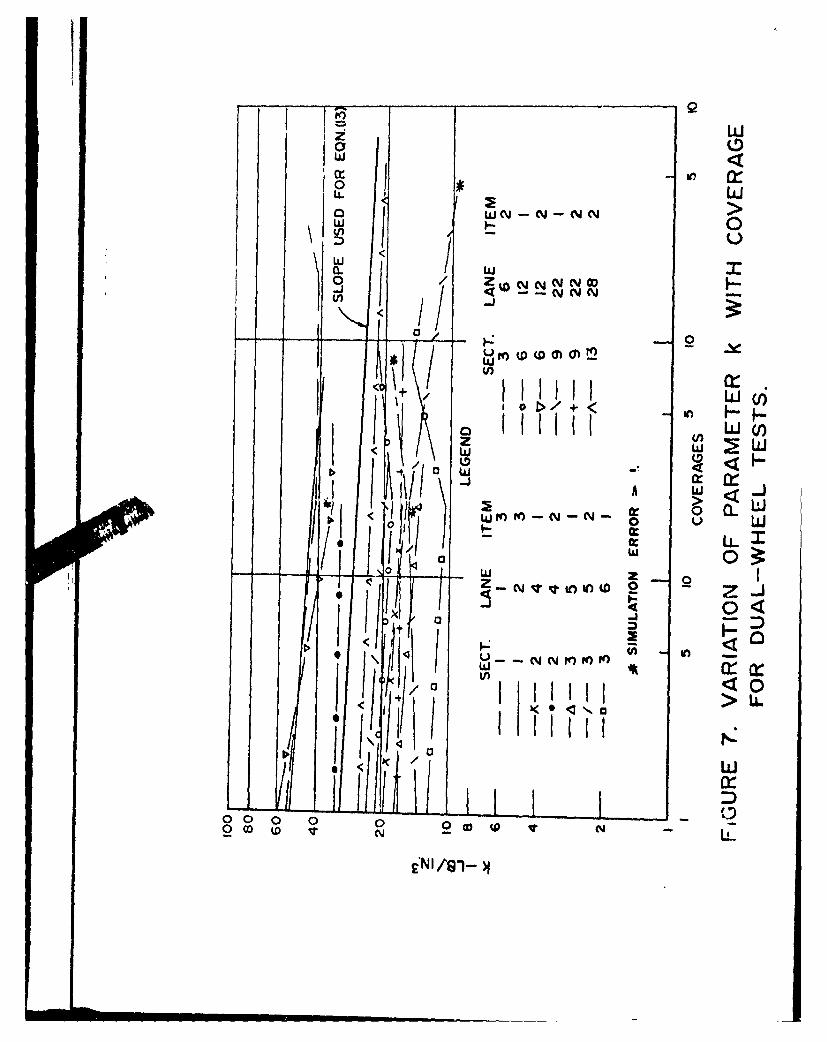
7. Variation of Parameter k with Coverage forDual-Wheel Tests . . . . . . 36
8. Influence of k on Maximum Deflection 41INT
9. Traffic Distribution Across Traffic Lane . 46
10. Deflection at Center of Wheel from Modelat the Failure Coverage . . . . . . . . 54
11. Deflection at Centerline of Wheel Assemblyfrom Model at the Failure Coverage . . . . 56
12. Regression Analysis for Single-Wheel Tests . 57
13. Regression Analysis with Tire PressureConsidered . . . . . . . . . . . 59
14. Performance Test for a Single-Wheel Test . . 61
..15. Performance Test for a Dual-Wheel Test . . . 61
16. Correlation of Failure for Dual-Wheel Tests . 63
vi

Figure- Page
17. Correlation of Failure for Single-Wheel Tests. 65
18. Typical Deformation at the Centerline ofTraffic Lane . . . . . . . . . . . 73
19. Stress-Strain-Time Behavior 75
20. Behavior of System to Applied Step Stress . . 77
21. Load Distribution at a Point During aSingle Pass . . . . . . . . . 78
22. Variation of Stress with Load Position . . . 78
23. Loading Arrangement and Sequence for Single-Wheel Test . . . . . . . . . . . . 81
24. Loading Arrangement and Sequence for Dual-Wheel Test ..... . . . . . . 82
25. Comparison of Deformations (Section 1, Lane 1,Item 3) . . . . . . . . . . . . . 83
26. Predicted Deformation Patterns for Section 1,Lane 1, Item3 . . . . . . . . . 84
27. Predicted Deformation Patterns for Section 2,Lane 3, Item1. . . . . . . . . . . 84
28. Comparison of Deformations (Section 2, Lane 3,Item 1 . . . . . . . . . . . . . 85
29. Arrangement of Mat Elements within the
Traffic Lane . . . . . . . . . 89
30. Superposition of Load Conditions . . . . . 89
AppendixFigure
Al. Stress State in Soil Mass . . . . . . . 109
A2. Differential Elements of Soil Mass . . . . 112
A3. Displacement of Soil Surface . . . . . . 112
B1. Concentrated Load on Model . . . . . . 118
vii

Appendix
Figure Page
B2. Uniform Load on Model . . . . . . . . . . 118
Dl. Typical Five Point Grid for Steep DescentProcedure . . . . . . . . . . . . . . 126
El. Moment Loading on End of Semi-Infinite Beam . 129
viii

LIST OF SYMBOLS
A Coefficient
aD Shift factor
C. CoefficientsJ
C(C) Stress dependent parameter
CA Contact area
CAR - Relative contact area
CBR California Bearing Ratio
Do 0 Elastic compliance
D I Coefficient
D(t) Inelastic compliance
D (t) Total complianceU
D(c) Deviator stress
E Young's modulus of mat or beam
E0 Young's modulus of subgrade
EIR Relative rigidity
H Thickness of subgrade layer
I Moment of inertia of the mat or beam
k Model characteristic
kiNT Model characteristic at zero coverages
kN Model characteristic at N coverages
(ke iNT Model characteristic at the end joint at zero
coveragesix

(k ) Model characteristic at the end joint at Ne N
coverages
L Elastic characteristic of the beam
m Slope of strain-time relationship
N Number of coverages
p(x) Loading function
q(x) Loading function2
r Coefficient of governing differential equation
s Coefficient of governing differential equation
T Membrane tension
t Model characteristic
t Time
t Time duration of load
TPR Relative tire pressure
V Deflection
w Deflection
w Water content
WL Wheel load
WLR Relative wheel load
WSR Relative wheel spacing
x Coordinate
y Coordinate
Y Dimensionless parameter
IDry unit weight of subgrade
YN Value of dimensionless parameter at N coverages
6 Width of beamx

Deflection at failure
(t) Residual deflection
€ (t) Time dependent strain
(t) Strain
Co Elastic strain
C (t) Residual strainr
n Dimensionless coordinate
Poisson's ratio of the subgrade
ffj Dimensionless parameter
a Normal stress
Shear stress
Displacement distribution function2V Laplacian operator
xi

ABSTRACT
Rosner, John Christopher. Ph.D., Purdue University,August 1969. Theoretical S of Landing Mat Behavior.Major Professor: Dr. Milton E. Harr.
Mechanistic models are developed to help predict the
behavior of landing mat systems. The first model, which is
based upon elastic theory, is capable of duplicating the
action of such systems under static loads. The associated
assumptions are: 1) that an infinite beam is the structural
equivalent of the mat; 2) that the subgrade is homogeneous;
3) that horizontal displacements within the subgrade are
negligible; and 4) that the mat always remains in contact
with the subgrade. The model parameters are established from
simulations of full-scale experimental tests. These param-
eters are also correlated with prototype test variables.
Results from prototype tests indicate that fhe model
parameter k, the subgrade modulus, decreases as trafficking
of the section progresses. Contrary to common belief the
model behavior is found to be extremely sensitive to the
magnitude of the subgrade modulus. Results also indicate
that the performance of dual-wheel prototype tests can be
predicted with reasonable confidence by the procedure devel-
oped herein: use for the single-wheel tests appears to be
somewhat limited.xii

-An investigation of the effect of end joint connections
indicates that some increase in service life can be attained
by strengthening the standard end joint connectors.
A second mechanistic model is developed to simulate
actual loading sequences and to provide a means of esti-
mating the residual deformations of the mat surface. The
applicability of this model is demonstrated for both single-
wheel and dual-wheel tests. Complete evaluation of the
potentialities of this model is not possible from the avail-
able data.
iC
.... xiii
IETRODUCTION
Present indications are that landing mats will be usedextensively in the for-arrd areas of any future air opera-tions. This is particularly true in theaters of operationswhere time and the availability of nati-:e constructionmaterials will not peruit a more permanent type of installa-tion. Since the efforts and cost required to produce anddeliver landing mats .o theaters of operations are so great,the efficient use of the mat is esrential. Inefficient useof mats may prevent the timely accomplishment of assignedmissions.
Existing criteria for designing runways to be surfacedwith landing mats have developed, by and large, from full-scale experimental tests. Prototype tests were conductedby the Corps of Engineers [10, 12f? on individual mat typesunder various conditions of load, number of coverages,wheel spacing, tire pressure, tire ply rating, base thick-ness, and California Bearing Ratio (CBR) of the subbasematerial. Most of these tests were conducted until failureoccurred. Failure was judged on the basis of the roughnessof the mat surface or excessive breakage in the mat. Inregards to the roughness requirement, the test section wa!considered to have failed when permanent deviations of 3inches or more occurred in a 10 foot length in any directionwithin the traffic lane. When breakage developed in 10 per-cent or more of the mat panels within the traffic lane, thetest section was considered to have failed. In most testsboth failure criteria were met simultaneously.
The results of each test when failure occurred wereused in connection with established desin curves developedoriginally for flexible pavements. Such design curves aregiven by Yoder [68] and the procedure for using the obtaineddata is given in Corps of Engineers publications [8, 10].An effective thickness of flexible pavement was assigned tothe mat using the design curves. The performance of a land-ing mat could then be estimated by interpolation and extra-polation.
' The numbers in brackets refer to references given in theList of References.

In tests where failure was not in evidence after amaximum established number of coverages, the effectivethickness of the mat was determined using the same proceduregiven above. For these, the effective thickness assigned tothe mat was less than optimal for the established failurecriteria.
For each type of mat tested a set of design curves hasbeen developed. In line with this procedure, each altera-tion in the structure or configuration of the individual matelements has necessitvted a new series of performance tests.
The objective of this study was to develop a reliableprocedure or method for predicting the performance of land-ing mats. It was anticipated that the success of this studywould serve to reduce greatly the need for costly perform-ance testing and the procedure could be used for comparisonsof the relative effectiveness of existing mat types. Inaddition, it was hoped that the study would provide a meanswhereby more efficient utilization of landing mats could beachieved.
For this study the results of the prototype tests asreported by the Corp of Engineers [10, 12) were used.
2
| II|| I1| L
REVIEW OF LITERATURE
- Existing Theories of Surface Displacements
The benefits to be accrued from the use of selectedsurface materials as agents for the transmission of wheelloads to the existing sub-soils have long been realized.The behavior of these materials, be they concrete, asphalticmixtures, chemically stabilized soils, or landing mats, hasbeen of considerable interest to the engineer. Many theo-ries for the analysis of such systems have been proposedlyet, no general theory exists today.
Winkler Concept
One of the initial analyses of load transfer betweensurface materials and a subgrade was provided by Winkler[67]. In his work he assumed that the action of the sub-grade was analogous to a dense fluid or a system of linearindependent springs wherein the reactive pressures developedin the subgrade were proportional to the deflection of thesurface. Winkler's hypothesis stated that
p kw (1)
where p is the pressure exerted by the subgradek is a proportionality constantw is the deflection of the subgrade surface.
However he did not indicate what value or values should beassociated with the proportionality constant, k.
In his analyses of railway ties and rails, Zimmermann(70] utilized the Winkler concept and concluded that theproportionality constant was dependent upon the type of sub-grade. Experimental studies conducted by Foppl (19] indi-cated that the response of such systems could be approxi-mated by using the Winkler hypothesis.
3

AIn a mathematical treatment of the subject, Hayashi
(25] o)loyed the -7.inkler hypothesis to analyse beams rest-in on soil. IHe prezented the solution for the conditionwhure shearinj forces cxisted at the interface of the beemand th, sail. Th3 governing differential ecuation took theform
4 4 A c12 w +k W 2- + i w = (2)EI 2 I El
wherein EI is the rigidity of the beamA is a constantq(x) is the loading function.
If interfacial shear can be neglected, the second term inEqn. (2) may be omitted. From a later investigation whichconsidered the presence of interfacial shear forces, Florin(18] concluded that these frictional forces had negligibleinfluence on the distribution of the vertical pressureexerted by the soil.
In 1926, Westergaard (64] used the Winkler hypothesisto compute the stresses in concrete highway pavements.Later [65] he extended his analysis to airport pavements.In his initial study, he observed that an increase of thesubgrade modulus from 50 lbs./cu. in. to 200 lbs./cu. in.produced only minor variations irn pavement stresses. There-fore it was surmised that an appro:imate single value of thesubgrade modulus, k, should be sufficient for determinationof the stresses in pavements. It was also suggested that astandard procedure he developed whereby the value of k couldbe determined.
Prior use of the Winkler hypothesis assumed that thesubgrade followed the structural member. This necessitatedthe development of normal tensile stresses at the interfaceof the load transfer mechanism and the subgrade. Murphy(39] investigated the stresses and deflections of plateswhose edges were free of foundation support. In additionto observing that the size of the plate had a considerableeffect upon the developed stresses, calculations indicatedthat an increase in the stiffness of the foundation rcduccdappreciably the stresses and deflections of the plate. Inan analogous manner, Harr and Leonards [24 ], employing theWinkler hypothesis, demonstrated that appreciable stressesand deflections could be produced in concrete slabs whenmoisture ano/or temperature gradients across the depth werepresent.
4

In 1946, Hetenyi [26] presented a collection of solu-tions for boams on ;linkler foundations; finite as wall asnfinfiite- lcngth bLacns. To remove the discontinuity in the
dccflciion patcrn that occurs at the end of a finite lonrthboam uuinv the :iiiker hypothosis, he suggested that thefinite hoze:ii be placed ovcr dn infinite beam which in turnwo-, c:,b?.K,,e in the system of cprings. Hotenyi did not giveII:ACrx: .,-z vcJti,:,E for the nbcradc modulus, nor did he sug-yc-LL ' FaL ctoru may influance this measure.
In a study conducted in 1955, Drapkin [16] obtained thesolution for finite length beams utilizing the principle ofsuperposition. He noted that contrary to prevailing prac-•tice increasing the length of a beam did not reduce sub-stantially the maximum vertical foundation pressures.
In 1955, Terzaghi (62 ) presented a critical review ofthe history and development of existing theory based uponthe subgrade modulus. He pointed out that the magnitude ofthe subgrade modulus was dependent upon the dimensions ofthe lo-aded area as well as the elastic properties of thesoil. He also established a procedure whereby consistentvalues for the subgrade modulus could be obtained. Terzaghinoted that intelligent use of the Winkler hypothesis wouldproduce reliable stresses and bending moments but the theoryfailed to provide reasonable estimates for settlements.
In 1962, Lenczer [36) experimentally investigated theeffect of soil depth on the magnitude of the subgrademodulus. He observed that for shallow depths, less than 12,inches, the variation in the numerical values of k wasappreciable. He, as did Terzaghi before him, found that thesubgrade modulus was dependent upon the size ol loaded area.In addition, he presented an empirical relationship whereinthe subgrade modulus could be taken as a function of depositdepth.
Many other investigators (21, 29, 38, 51] have employedthe Winkler hypothesis or minor variations thereof to the;analysis of load transfer systems.
Elastic Solid Models
In the 1930's with the advance of soil mechanics, ques-tions were directed concerning the validity of the Winklerhypothesis. In 1937, Biot (4] presented the means of com-
5

puting the contact pressures on the base of an infiniteelastic beam resting on a semi-infinite elastic solid. Thissolution made it possible to determine an equivalent valuefor the subgrade modulus, k. Subsequent investigations ledto the conclusion that the subgrade modulus was a compli-cated function dependent not only on the elastic modulus ofthe soil and the width of the beam but alsu upon the beam'sflexural rigidity. Biot concluded that no unique value ofthe subgrade modulus could be assigned to a given subgrade.
In 1943, Burmister [ 6 ]obtained the solution for a twolayered system acted upon by a uniform circular load. Eachlayer was assumed to be a homogeneous, isotropic, andlinearly elastic solid. A perfectly rough interface condi-tion was assumed to exist between layers with the lowerlayer providing continuous support to the upper layer.Lemcoe (35 1 confirmed the results given hy Burmister andalso investigated the condition of a frictionless interface.He reported that only a very slight change occurred in thevertical normal stresses as the interface condition changedfrom perfectly rough to perfectly smooth.
The semi-infinite elastic solid model and an elasticlayer of finite thickness were employed by Pickett [ 43) inhis investigation of the behavior of concrete pavements.Influence charts for deflections and moments at differentpoints in the concrete slab were presented for both an elas-tic solid subgrade and a dense liquid subgrade. However,he gave no suggestions for associating the model parameterswith given subgrade conditions. The solution for an elasticsolid of finite depth was also presented by Sovinc 60 . Asan aid to obtaining this soluition he approximated the dis-placements within the solid by a double Fourier Series.
In 1961, Davis and Taylor [13 ]investigated the influ-ince of horizontal loading on the surface displacements ofan elastic layer. They concluded that care in selectingthe values of the elastic constants was necessary for thistype of loading because some portions of the soil mass ex-periences a stress reduction. In 1963, Lee [34] concludedthat for horizontal surface loads the normal stressdistribution along the contact surface of a flexible stripwas essentially independent of the magnitude of the contactshearing stresses. Lee also expressed the belief that theabsumption of a smocth contact surface leads to conservativeestimates of the bending moment and shearing force inducedin the strip. In an earlier study, Leonov[ 37] also foundthat horizontal forces have practically no influence on thedistribution of the vertical reactive pressure.
6

In an attempt to simplify future computations, DeBeer(14.) using an iterative procedure, obtained the contactprepsure distribution beneath a beam. He suggested that asccond or fourth order polynominal could be used to approxi-mate the contact pressure distribution. Using this relation-ship he obtained reasonably correct detlections and bendingmoments. From the results of an experimental investigationDeBeer[ 15 ]concluded that the second degree parabolic dis-tribution reflected the results of the tests regardless ofthe beam stiffness. Comparisons of the test results withcomputations based upon the Winkler hypothesis were alsomade. Barden [2) in his studies of finite beams employedDeBeer's approximation for the contact pressure and con-cluded that the results obtained were more valid than thoseobtained from the Winkler analysis.
Many procedures and techniques have been developed[57, 41, 23, 34, 48 ]to approximate the distribution ofsurface contact pressures. A method developed by Zhemochkin[69 ]assumed that the load transfer element was connectedto the elastic solid by linkages (two-force members). Bytreating the forces in these linkages as unknowns and usingthe "method of virtual displacements", he was able toapproximate the contact pressures transmitted by the elastic
solid. A high degree of accuracy could be achieved by usingmany linkages in the system. This procedure gave resultswhich agreed well with the more rigorous mathematical soli-tion. Sinitsyn [ 59 ) extended the application of Zhemochkin'sprocedure and Barden[ l]later presented another variation.
In his discussion to Barden's paper, Chueng [7] indicated a
further simplification and noted that this method had been
used in Asiatic countries in design for many years.
A recent theory for analyzing structures on elasticfoundations based upon a general variational method was'developed by Vlasov and Leont'ev [63]. This theory is more
complex than the Winkler theory yet simpler than the elas-
tic half-space analysis. The form of the basic differential
equation given to describe the state of strain in a loaded
single-layer foundation had the same form as that obtained
earlier by Filonenko-Borodich [ 17 ] and by Pastarnak [42).The method possesses great flexibility. By judicious selec-
tion of the coefficients in the differential equation, the
equation for either the Winkler hypothesis or the.elastic
solid model may be obtained. In addition, boundary condi-
tions are easily introduced and the developed procedure canbe readily extended for complex three-dimensional considera-
tions. This method forms the background of a large part of
the analysis developed in this report.
7

Viscoelastic Models
Recently attention has been directed toward applicationof viscoelastic theory to the response of soils subjectedto static and dynamic loading. Many rheological models havebeen proposed for simulating the stress-strain-time behaviorof soils and for mocelin9 studies of creep phenomena andstress relaxation in soil.
Freudenthal and Lorsch (20] were among the first inves-tigators who employed a linear viscoelastic analysis toinfinite beams. In their study the soil support was replacedby a series of K'elvin, 1,1ax.well, or Standard Linear Solidelements. For each of these elements the authors were ableto develop relationships for the deflection of an infinitebeam subjected to time invariant concentrated and uniformloads.
In a brief note in 1958, Reissner (52] presented thesolution of a thin plate resting on a viscoelastic founda-tion which possessed shear interaction; a frictionlessplate-foundation interface was assumed. Two years later,Pister and Williams (47] extended the work of Reissner toincorporate a rough interface condition. In addition, theypresented response curves for the maximum deflection andmoment for an applied step force. Later Pister [4]presented the solution for the axisymetric bending of aviscoelastic plate of finite thickness supported by a visco-elastic foundation of infinite extent. He, as did Reissner,assumed a frictionless interface condition.
In his study of the creep behavior of snow foundations,Kerr [28] employed a linear viscoelastic media. The timeinvariant load was applied directly to the foundation ratherthan by a load transfer mechanism (such as a beam or a plate).
Hoskin and Lee [27] used linear viscoelastic models fortheir analysis of the stress and deformation characteristicsof a subgrade, strengthened by a flexible surface plate andsubjected to a suddce ly applied uniformly distributed invari-ant load. They conciuded that the Maxwell model gave unreal-istic values for deflections, subgrade pressures, and platebending moments for long time loading; however, the use ofthe Standard Linear Solid model was founa to be satisfactory.They also noted that under certain circumstances (by use oftransform theory the time dependence of the system could beremoved) stress and deflection analy:es of a system contain-ing linear viscoelastic components could be treated as an
8

zi.o,;ous cldtic problem having the cane geometric boundarycolt L ionc. "'his analojy is known as the "corrospondoncoP : TI , • ' oaclucc that the response of a linear,!is--uc. 1t.ic ::ztorial to stress could be prooictcd by an
L..Lic ... ,..horcin the elastic constants wore replacedby tiia-c,3* ncnt parclmters.
,; 1.)c": V (53, 54] reported that the solution of manynon-linc.-r vi..coclastic problems may also be closely approy.-in 6't by rcuucinj thci to an equivalent elastic conditionw,'crcin the Par:meters, which characterize the non-linearviscoclastic material, are taken as functions of time. Thevalidity of thi. ; procedure (quasi-elastic method of analysis)was dcmonstratcd by Schapery (53] for a viscoelastic'canti-lever--beam subjected to a concentrated load at the free end.Schapery [54] also applied this procedure to the analysis ofthe creep of glass fiber reinforced resin under an uniaxialstress condition and demonstrated that the procedure couldalso predict the creep response of Polystyrene under a vary-ing stress condition. Three different samples of Polysty-rene were subjected to a triple-step stress application.Predictions of the magnitude of the strains were within 9%of those observed from experimental investigation over anelapsed time of 1512 hours.
Konder and Krizek (31] investigated the creep responseof a commercially available cohesive soil, Jordan Buff,under uniaxial and constant compressive stress. They wereable to predict creep response for this material whichexhibited definite non-linear behavior with an expressionof the form
2- c=C(a) + CI (a) (log t -C 2 log t) (3)
where C(a), C1 (a) are constants with respect to timebut are stress dependent
C 2 is a constantt is the time variable.
Singh and Mitchell (58] studied the creep response ofa number of soil types subjected to various test conditions.They developed an expression for the strain of the form
c = C(a) + C, e D (a) -m (m # 1) (4)
9

where C(o) is - constant which is dependent on thestrain at unit time
C1 is a constanta is a dashpot constantD(o) is the deviator stressM is the slope of logarithm of strain rate versus
lo-arithm of time (straight line)t is tii.e.
They concluded that the expression was applicable irrespec-tive of whether the soils were undisturbed or remolded, wetor dry, normally consolidated or over-consolidated, ortested in a drained or undrained condition. They statedthat the developed creep function reflected the effect ofsoil composition, soil structure, stress history, stressintensity and the slope of the strain rate vs. time relation-ship on a log-log plot. They indicated that further researchwas being conducted to attest the validity of their creepfunction for repetitive load conditions.
In his analysis of viscoelastic layered pavement sys-tems, Barksdale [3] was able to develop a creep complianceresponse for an asphalt mixture and one for a clay subgrade.Both relationships were developed for materials subjected torepetitive stationary step loadings.
t The primary limitation of applying viscoelastic modelsto real soil behavior has been the difficulty in assigningrepresentative numerical values to the parameters for eventhe simplest model.
Prototype Tests on Landing Mats
Accelerated traffic tests simulating aircraft taxiingoperations were cond :ted by the Corps of Engineers [ 10] ontest sections constructed with a range of subgrade strengthsthat represented airstrips surfaced with landing mats. Thepurpose of th'se tests was to provide data on the servicelife of mat-surfaced airstrips under various conditions ofwheel load, tire pressure, and subgrade strength. As notedpreviously, design curves were developed by modification ofthe conventional CBR (California Bearing Ratio) designcurves for flexible pavements.
10

The traffic simulated the operations of military air-c12t with both single- ond duol-wheel assemblages. Single-_,.,mml loadis rzinycd from 10,000 to 50,000 lbs and tire pres-
ru)nrncd from 40 to 300 psi. For dual-wheel assembly,Ioc , ot 5o,000 ibs were used a.ith a wheel spacing of 37.5in. (centcr to center) and tire pressures ranged from 100 to300 pi. Theie loaciing arrangements were applied by a loadcart [!0] . L~ch test section was approximately 26 ft. wideanc, 30 ft. long with the traffic applied over a width of12 ft.--
Two types of subgrades were used: (1) a fat clay (CH)with an average liquid limit of 60 and a plasticity indexof 39 and (2) a lean clay (CL) with an average liquid limitof 36 and a plasticity index of 15. The strength of thesubgrade was classified into three groups: (1) high strengthwith a CBR above 20, (2) medium strength with a CBR between7 and 20, axd (3) low strength with a CBR between 3 and 7.
The tests were made on standard M6, MS, and M9 landingmats. The M6 mat is a pierced steel pank with a moment ofinertia per foot of width of 0.069 in. ; the M8 mat is aheavy, deep-ribbed steel m~t with a moment of inertia perfoot of width of 0.269 in. The M9 mat is a deep-ribbedaluminum mat with an average moment of inertia per foot ofwidth of 0.618 in. 4 These mats, which are rectangular inghlpa, ware placod on the cubgrae in a mamonry typo aranqo-ment and connected by integral locking lugs on the sides andhooked ponnectors on the ends.
The tests were continued until the test section failedor until 700 coverages had been completed by the load cart.Failure of the sections was judged on the basis of: (1)development of roughness of the mat surface to the point ofendangering aircraft operations and (2) excessive mat break-age.
In 1967, the Corps of Engineers conducted an extensivestudy [12 ] to develop criteria for the efficient design ofaircraft landing gear for aircraft required to operate frommat-surfaced airfields. Traffic tests were conducted withnumerous combinations of wheel configurations, loads, andtire pressures. The wheel configurations varied from asingle-wheel up to 12 wheels: the loading varied from 35,000to 273,000 lbs and the tire pressures ranged from 50 to 250
i11
psi. The two soils, which formed the subgrade, exhibitedonly minor differences in characteristics. One soil was afat clay (Ci) .with a liquid limit of 5C and a plastdcitvindcx ,f 31 while the other soil was a fat clay (CH) with alicuic. liit of 61 and a plasticity index of 37. The in-place, initial strenath of these subgrades as indicated byCBR values ranged from 1.1 to 9.0.
These te.ts were made on the 18 mat (previouslydescribcd) and the modified TlI mat which is a lightweight,extruded-aluminum panel with an abrasive surface [ 11]. Themoment of inertia per foot of width of the Tll mat is1.368 in. 4 The method of placement of the rectangular-shaped Tll mat was also of the masonry dtbign. The behavior-al characteristics and performance of the mat surfaces,whether loaded or unloadE., are well documented ( 12 ) foreach test at various coverage levels. The single-wheel anddual-wheel data from this test series constitute the basisof the investigation reported herein.
Application of Theories to Landing Mats
It is well recognized [9] that the action of 7.andingmats in distributing wheel loads to the subgrade is compli-cated and that the exact mechanism through which distribu-tion is accomplished has not been defined. The consensusof opinion is, however, that the mat distributes loads in amanner similar to that of a beam or flat plate. Conseruent-ly, most theoretical studies of landing mats have employedthis type of analysis.
In 1951, Pickett [44] conducted a theoretical investi-gation of the behavior of landing mats. In this investiga-tion, he considered the landing mat capable of: (1) tensilestrength only, (2) flexural strength only, and (3) bothflexural and tensile strength. Initially, the assumptionwas made that the composite mat and subgrade material couldbe represented by a model composed of a thin membrane ofinfinite extent supported on a licuid subgra3e incapable ofsupporting shear stresses. Vertical loads were applieddirectly to the membrane. The governing differential equa-tion for this model was
2T A w - kw : -q (5)
12

where is the membrane tension (assumed to be constant)a is the Laplacian operatorw is the deflection of the surfacek is the density of the liquidq is the intensity of pressure in the direction
of positive deflection.
In earlier studies, Schiel [56] and Filonenko-Borodich [17]arrived at this identical differential equation in theiranalyses of beams on elastic foundations. After obtainingthe solution of Eqn. (5), Pickett developed an influencechart by which the deflection of the surface and the reac-tive pressure could be determined graphically for a uniformload of any configuration.
Next.Pickett [44] assumed that the composite mat andsubgrade material could be represented by a membrane sup-ported on an elastic solid. For this model, influencecharts were prepared for both deflection and reactive pres-sures for two finite thicknesses of the elastic solid inaddition to the case of infinite thickness. As could beexpected, the presence of the membrane reduced the magnitudeof the deflection as compared to the simple elastic half-space model. A model composed of a thin plate type of mem-brane (wherein the membrane tension could vary with direc-tion at a point, and vary from point to point) and a subgrade,assumed to be a dense liquid with respect to vertical reac-tions but providing elastic resistance to horizontal dis-placements of the membrane, was investigated by the finitedifference method. Mathematical difficulties prevented thecompletion of this solution.
In a later study, Pickett [45] extended his analyticalwork to include considerations of orthotropic mats on elastic
subgrades. In these investigations, he considered the mat
capable of only flexural resistance and assigned to the mat
a wide range of combinations of transverse, longitudinal,and torsional stiffnesses. He concluded that a given amount
of transverse flexural rigidity was several times as effec-
tive in reducing maximum deflection as an equal amount of
torsional rigidity and that both of these rigidities wereof less relative importance than the longitudinal rigidity.It was further noted for widely distributed loads that all
mat rigidities were of less relative importance than the
subgrade rigidity.
13
ti

In all of Pickett's studies it was assumed that the matand subgrade remained in contact at all points and that theshear oeveloped at the interface could be neglectei. Innone of the stuaies uid he actually utilize his models topredict the perfortiance of landing mats.
In 1955, the Corps of Engineers [9] presented theresults of Lull-scale landing mat tests and model testswhich were compared with the analytical studies conductedby Pickett (44, 45]. It was concluded that the beneficialeffects of the landing mat was dependent upon its longitu-dinal, transverse, and to a very minor extent its torsionalrigidity. It w1s further noted that because of slack inthe end joint connections and practical considerations inlaying the mat little, if any, over-all membrane action waspossible. The report concluded that landing mats act pri-marily "in flexure" and that additional stiffness at theend joints add considerably to the smoothness of the operat-ing surface under traffic conditions, approximately doublingthe service life of the mat.
14

MODEL DEVELOPMENT AND SIMULATION
Introduction
A mechanistic model was sought whose deflection behav-ior reflcqted the action of landing mats. Initial consider-ation was given to the selcction of a representative loadtransfer element. In accordance with the findings of theCorps of Engineers ( 9], a membrane was eliminated as a pos-sible element. Also as indicated in Photograph 5 of thisreport, (particularly for a group of M8 type mats) there isan apparent lack of resistance to lateral bending due to thepresence of longitudinal joints. This would tend to excludea thin plate from consideration. Thus for the sake of expe-diency, a beam was selected for the basic load transferelement.
The second consideration was the idealization of thesoil media. The Winkler hypothesis, Eqn. (1), was not con-sidered suitable due to its shortcomings as pointed out byTerzaghi [62) and its neglection of interfacial shearstresses. Initially, a viscoelastic model was not usedbecause of its complexity and the anticipated difficulty ofcorrelating the model parameters with the given soil proper-ties. Since it was shown (12] that the "average deflection"increased with the number of coverages, a conventionalelastic solid model was also not directly applicable. How-ever, this behavioral characteristic could be accommodatedby an elastic solid model wherein the model parameters aremade coverage dependent. Such a quasi-elastic model forthe soil media was employed initially in this study.
Development of Mat-Soil Model
Since it was anticipated that the mat-soil model param-eters would have to be established by analytical simulationof prototype test data, careful consideration was given tothe method of analysis. The general variational method of
15

analysis, developed by Vlasov and Leont'ev [63] for elasticfo:nd.ations, nipeared to provide the Cesired degree of flex-ibility. i. c..taile- roresentation of this method for asingjle layer founCation is given in Appendix A.
The reaction of a beam of infinite length to loadingwas selectecl zs the mechanistic equivalent to that of themat urr s,',:.. carC'..,,tances. This selection was predi-cated upon several prevailing conditions. First, actualfield operaLions a test procedures employed by the r-7ater-ways Exp .'iment StaLion [12 1 demonstrated that the mat ele-ments e.xtend laterally fur an appreciable distance outsidethe normal traffic lane. The traffic lane widths for thesingle wheel tests ranged from 4.75 ft. to 12.00 ft. Aminimum extension of 10.J.6 ft. beyond the traffic laneexisted for all cases. Typically the width over which thewheel load was applied was only 14.7 inches. Secondly, thelongitudinal joint used for the mats (necessitated by theconstruction procedure) provided virtually no moment trans-fer from one mat element to the next. However, as attestedby Photograph 4 of reference 9, in the transverse directionan appreciable amount of moment transfer was afforded bythe end joint connectors. Tests ( 9 ]on the M8 mat indi-cated that the longitudinal rigidity was approximately 150times larger than the lateral rigidity.
The width of the infinite beam was taken as the lengthof a rectangle whose area was equivalent to the tire printarea and whose width was equal to the maximum width of thetire print. In those cases where this equivalent beam widthwas greater than the width of the actual mat element thelongitudinal joint was neglected. Initially, it was assumedthat complete continuity existed at the end joints of themat el.ments; that is, the end joint connections providedtotal shear and moment transfer between mat elements.
In addition to the above, the following assumptionswere made:
1. The wheel loads can be represented by uniformlydistributed loads.
2. The beam obeys Eulerian conditions regardless of
the stress level.
3. The beam and the soil always remain in contact.
4. Horizontal displacements within the soil mediaare negligible.
16

Under thcsu assumptiors, the response of the mat-Eoil modelis giver by the differential equction (Ecn. (135) , I.ppcndi:"B3)
- 2r 2 61 2V(n) + s ) = (6)d n dn El
where
2 tL 2 I-j o H 2r - = 2H $ 2! dy (7)
E= 2LEI- 2L, 2cly (8)
and
/EI1-Lo . (9)
At the present time there is no reliable informationavailable as to the actual distribution of displacementswith depth in a soil layer. This is particularly true forthe selected soil model wherein horizontal displacements inthe soil media are assumed to be of negligible magnitude.Information available for homogeneous deposits indicatesthat the distribution of displacements with depth is non-periodic and has a maximum at the surface. Tests conductedby the Corps of Engineers [9] on a rubber subgrade loadedboth without a mat and through a steel mat indicate anasymptotic attenuating distribution of displacement withdepth- (see Plate 17 of reference 9). It appears reasonableto assume that with different mat rigidities the samegeneral shape would be maintained but that the rate ofattenuation ,.!ould vary with depth. Functional representa-tions of this type of distribution may take many forms.One form, suggested by Vlasov and Leont'ev (63], assumed aratio of hyperbolic functions as
sinh y
sinh y H
17

where H is the thickness of the soil layery is the distance from the subgrade surfacey is the 6iL-rsionless parameter
Ith the Cistribuzicn of oisplacements described by Eqn.(10) and after applying the assumption of negligible hori-zontal displa -- 'cenzs, the s'Cresses can be expressed as(from 2c:ns. (:.16), iU~endix A)
E d'(y)a y - V, (v) dy (11a)
1V20
ET0Xy 2(i+4 0) I(x)*! (Y) (11b)
A typical distribution of the above stresses is given inFigure 1.
With the form of i (y) taken as in Eqn. (10), any vari-ation in the rate of attenuation of the displacement due todifferent mat rigidities can be incorporated by judiciousselection of the parametery . As indicated in Figure 2,
(y) does not produce a unique distribution until thecimensionless parameter y is established. Since the valueof Y could not be established from any previous studies, itwas necessary to examine the "average de.lection" patternsfor the cases at hand with the hope that a simulation pro-cedure could be developed which would yield reasonablemeasures of this parameter.
In addition to the p,-rameter y , some measure wasrequired for the ecuivalent layer thickness, H. In most ofthe test sections, the natural soil was excavated to adepth of 6 ft. and the excavation was backfilled under con-trolled conditions to produce the recuired soil strengths.In some test sections, the subgrade ;,as controlled only for_a depth of two feet. An analytical study of the effect oflayer thickness on the deflection pattern was made. Forthis investigation the layer thickness was varied in incre-ments from 12 in. to an infinite depth. From the simulationof the "average deflection" patterns, results (to be dis-cussed later, see Tablc, 3) for the extremue conditions inc(-cate that the layer thickness was immaterial. For sixplicitv,the soil media was assumed to be of infinite extent. Undcrthis assumption, the model characteristics k and t in Ecns.(7) and (6), become
18

SHEAR STRESS NORMAL STRESSO 0
y
H
RIGID BASE RIGID BASE
O 0
FIGURE 1. DISTRIBUTION OF STRESSESWITH DEPTH
0
y x 4.
H(-ysinh L
sinh L
77~~~~777 777777 / I Il/
FIGURE, 2' ,DISTRIBUTION -OF DISPLACEMENTWITH DEPTH

E 6k (12a)
2 ( - 2) L0
Eo6 Tt l=) - (12b)
As can be noted from the above relations, the two modelcharacteristics Ere functions of the unknown parameters(modulus of elasticity of the soil), (Poisson's ratio lorthe soil), nnd y. Therefore to use ths developed mat-soilmodel, the parameters EO and li must be numerically identi-fied in addition to the parameter y . The identification ofthese parameters could be accomplished by simulating the"average deflection" patterns; however, to consider theeffect of each parameter independently would necessitateextensive computer time.
Previous studies of beams on elastic foundations indi-cated that ji generally has a negligible effect on the re-sulting defl~ctin pattern. To assess the validity of thisassertion for the present problem, the deflections of twopoints in the mat, one directly under a wheel and one 36.75in. from the centerline of the wheel, weie determined forconditions identical to those of Section 13, Lane 26, Item2 for Poisson's ratios of 0.3 and 0.5. The resulting Ceflec-tions are tabulated in Table 1. For this particular test,a Poisson's ratio of 0.4 appears adequate. Hence in thisstudy, 1o is assumed to be 0.4. This assumption is alsoin line with that made previously by Pickett[ 43, 44]. Inany event, any appreciable error incurred by this assumptionwould be compensatea for, in part, by the other parameters,E0 and y, obtained from the simulation procedure.
2C

Table 1
Effcct of Poisson's Ratio on Dcflection
Deflection
Deflection 36.75 in.E at i of from 4 of
(psi) Wheel (in.) Wheel (in.)
= 0.3 3.00 250 1.098 0.099
= 0.5 3.00 250 0.900 0.054
Actual- (from "average 1.0 0.0deflection"pattern)
Parameter Identification Techniques
Several identification methods were applied to thedeflection data obtained from the prototype tests to deter-mine equivalent mat-soil model parameters. The first method,which has been used successfully by mechanical engineers forsimilar systems, utilizes a state variable filter. Unfor-tunately, for the present problem it proved to be totallyunsatisfactory. ,The second approach, the so-called "steep.descent" method, proved to be adequate for the identificationof the model characteristic k, Eqn. (12a). A simplificationwas introduced to this method to reduce computer time. The1"steep descent" method failed to provide a reliable measureof the parameter y. Finally, success was registered in thisregard by employing a trial and error procedure.
For each method and modification, input conditions wereimposed upon the developed mat-soil model identical to thoseof the prototype tests. The criterion followed in the iden--tification of the model parameters was to minimize theresponse differences in deflection of at least nine discretepoints taken from the "average deflections" patterns. Incases where the curvature of the deflection pattern changedappreciably from point to point, more reference points wereselected. In some cases as many as sixteen reference pointswere used.
21

State Variable Filter
The inJtial procedure utilized a state variable filter
in conjui-tion wiLh a steep descent linear identifier as
outl.;eC 1 I\Kohr [ 30]. The procedure (see Appendix C) w;s
I u n- the field data; however, unrealistic valucsfor t'i pc i, ters rcsulted. Additional modifications also
proved un u:ce.sfu1 and the method was eventually abanuones.
Failure 0: Lhis . .... . .re to produce ..eaningful values ;as
believed to be primaily due to the selection of a step
function as the forcing function for the load. The leck of
success for a step load ha6 been noted previously in other
cases by Kohr [301.
Steep Descent Method
The second nethod employed to provide a measure of theparameters, E and y, was based upon the "steep descent"method (40, 6e]. A brief explanation of the proceduralaspects of this method is given in Appendix D.
This procedure was initially applied to data from thetert designated as Section 1, Lane 2, Item 3, for zerocoverages. The initial values assumed for E and y were100 psi. and 1.55, respectively. Using the teep descentprocedure, a minimum of the error functional (defined inAppendix D) o 0.0G0 was obtaincd vhen E 750 psi. andY = 1.59C; this is indicated as trial 1 Tn Figure 3. Todetermine whether the minimum obtained was global ratherthan local another trial was performed. Trial 2, Figure 3,which was initiated with E = 200 psi. and y = 6.00, pro-duced a minimum of 0.079 w~en E0 = 280 psi. and y = 6.006.With these results it was apparent that the surface of theerror functional was not bowl-like in form. Additionaltrials were made as indicated in Figure 3. As can be seenfrom Figure 3, the error functional possessed a curvedvalley of minirmal values which for all practical purposeswere identical. Unfortunately, the shape of the error
functional proved not to be unique as shown for another testection in Figure 4.
It was apparent that unique values of E and y couldnot be obtained with the selected form of thR error functional.Fortunately, as can be seen in Table 2, the values of theparameter k varied only slightly along the valley of theerror functional. Therefore, representative values of thecharacteristic k could be generated regardless of the valueof
22

d00 'q 0
0-
w
-J <Z Li. Z< 0 0Q0.
CY LLLH
06 W cr 0 LIZui w +u z w Z
+0 o o 0 r +0-c w Lz
LL -
000 +
NV S CdI4- 03 U -X LL
+ 4 L

00
11
w w
z -j41a ~
0 0 N
U-
2
0 0
>)
IWo~6Oo
1_ QC w
ODD
0)0
NI 0S /SdI)4 - 03

Table 2
Values of k Along the Vrilley of the Error Functional
Section 1 Lane 2 Item 3 Zero Coverage
I Y Error k
750 psi. 1.598 0.060 52.5 pci.530 psi. 2.620 0.095 52.4 pci.400 psi. 3.608 0.100 51.0 pci.2S0 psi. 6.006 0.079 52.8 pci.
Since the line of steepest descent for all trials,Figures 3 and 4, was essentially parallel to the Eo axis,the identification procedure was modified somewhat. Valuesof 1.0, 2.5, 4.0, 5.5, 7.0, and 8.5 were assigned to theparameter y and for each of these values E was incrementeduntil the error functional was minimized. This procedurewas subsequently employed for all relevant test sections andat al). coverage levels.
For a few of the coverage levels, where the actualdeflection pattern was relatively unsymmetrical, the magni-tude of the error functional was found to be greater than1.0. Nevertheless, the representative value of k was takenas that which existed.when the error functional was a mini-mum for the selected values of y.
With the parameter k defined, only one additional param-eter had to be identified. As noted in Table 2, the param-eter E showed considerable variation for the range of valuesof y iRvestigated. As the parameter y appeared more stableit was selected for identification.
Identification of the Parameter Y
Due to the small variation in the error functional for
the range of y values investigated, it was concluded that
the preceding procedure was not satisfactory for identifying
the parameter y The procedure developed for determiningywas less direct than that used previously for the parameter
k. Preliminary studies, Figure 5, indicated that the value
of Y did not influence greatly the magnitude of the deflec-
tions. However, it was noted that as y increased deflections
25
72093

*j wU . c
0 - a.
WoW
. N LLo
0 0
-- -jzww
CY W
Z w
(S3DNI N If) 0 3

in the vicinity of the loads became larger and were dissi-t :,ore rzpi:ly as the distance from the load increased.
Thi.. ir~ic1 tu that the value of y was dependent upon theri .:-f iL.u rat; that is, the less rigid the mat, the
1,irifer thte .Lccion under the load and the more rapid thedipip2ation of Lieflection. From comparison of deflection1- aLt'erls at 2C.tical coverage levels, it was also Observed
hI t, -i -en1rl, the convexity (curvature) of the deflec-tion patte-ns for the MC mat was greater than that for theTll mat. In aicdition, the subgrade strength, as representedby the CBR values, was higher for the 148 mat tests than thatfor the TIl mat tests. It was therefore concluded that thedifference in the convexity of the deflection patterns resu.l-ted primarily from the differences in mat rigidity and couldbe accounted for in the model by the selection of the param-eter y.
The parameter y was established by a trial and errorprocedure utilizing the computed model deflections. Thepreviously determined value of k was maintained constantfor each coverage level while different values were assignedto y. The "correct" value of y was established by comparingthe computed model deflection configuration to the prototypedeflection pattern. After the parameter y had been estab-lished slight modifications were made in the value of theparameter k to produce even better correspondence betweendeflection patterns. This procedure was applied to alltests to provide both y and k values.
Correlation of Model Parameters to Mat-Subgrade Properties
From the results of the identification procedure (to be
discussed later, see Figures 6 and 7), it was found that the
magnitude of k at any coverage level could be established asa function of the initial value. The functional relationshipwas established as
kINTkN = (13)
where k is the k value at zero coverage and k is the k
value ai r N ntmber of coverages.
27

In order to determine k,, and the resulting deflectionsat any coverage, mcans for obtaining a measure of k hacto be estalished. To avoic developing a new soil , ftwhicli could be bouh expensive and time consuming to conduct,it d'a o cecidc-l to try correlating k with the stanoardsoil properti E, water content, dry 1 nsit CBR, obtainedat the test site. Previous worK by Black [5] indicated thattherc exists a strong correlation between soil strength,water content, anJ dry density. Since k I is in a sense ameasure Df soil strength, it was thought 1:at there mightexist some corrclation between k w, and Y Representa-tive values of the .ater contentad dry dens~ty were takenas the average of the respective values given for the top18 inches of the subgrade. Attempts to develop a relation-ship among these parameters proved to be fruitless.
The literature (49, 50, 68 ]also indicated the exist-ence of an empirical relationship between the subgrademodalus and CBR. However, this relation was establishedfor subgrade moduli greater than 100 pci. Extension ofthese relations to prototype test conditions proved unreli-able. Computations did disclose a reasonable correlationamong CBR, w y (weight of water per unit volume of soil) andthe parameter q. It was found for these prototype test sub-grades that k could be reliably established from therelation INT
k NT = 164.0 + 3.0 CBR - 5.45 wtd (14)
where CBR is the average CBR for the upper eighteen inchesof subgrade and w I is in pounds per cubic foot.
Observations of the "average deflection" patterns dur-ing the prototype tests indicate that the curvature, ingeneral, increased with increasing number of coverages.Hence, the parameter y must also increase with coveragcs.The identification procedure demonstrated this response:the value of y did increase with coverages. In addition itbecame slightly larger with decreasing mat rigidity. Thelatter was found to be more pronounced for low coveragelevels than for high coverage levels. At all coveragelevels, the variation with mat rigidity was small. Fromthe simulation of the "average deflection" patterns therelationship for YN was established as
28

4 (EI)T " (EI) (NT1) (15)
=N V 7 +G I ) M A
herc N is the Epcific nu:iber of coverages, (EI)W ! is therg..iCity per foot of widLh of the Tll aluminum mat, and(iiz a) t.e -ricity per foot of width of the mat being
S The econd term of Eqn. (15) has groateri .u~nce on y for low coverages than for high coverages.
'.ith the parameters k ... and y defined, respectively,by -cns. :(14) and (15), E1.' (12a) IBay be solved for E andthe cha acteristic t may be found from Eqn. (12b). Ha ingobtained the characteristics k and t, the mat-soil model maybe use, to estimate the expected deflections for the mat atdifferent coverage levels.
Results
Layer Thickness Investigation
Data from six different test sections [12] were usedfor this investigation. Identical conditions of wheel load,wheel spacing, width of tire print, and mat rigidity as used
in the prototype tests were imposed upon the mat-soil model.
The subgrade thickness was varied from 12 in. to an infinitedepth. Fbr each layer thickness the simulation of the"average deflection" pattern was achieved by minimizing theerror functional, Eqn. (D2). The modified steep descent
method was used with the value of 2.50 assigned to the param-
etery . Values of the error functional and the model charac-teristic k for the extreme layer thicknesses are given inTable 3.
Correlation of Model Parameters to Mat-Subgrade Properties
The identification procedure was applied to all test
sections. Values of the parameters y, E , k, and the error
functional for a few typical test sectio s are given in
Table 4. For the remaining sections, the k values producing
the minimum error functional for the selected valueu ofy
are given in Table 5.
Plotting the magnitude of k against the number of covdr-ages, Figures 6 and 7, it can be observed that with only
rare exception the magnitude of k decreases with coverage
29

Table 3
Comparison of Simulation Error for
Different Soil Layer Thicknesses
H = 12 inches H = infinitySect Lane Item Coverages
Error k-pci. Error k-pci.
1 1 3 0 .164 51. .167 51.20 .182 39. .166 39.200 .278 40. .281 39.300 .435 45. .439 45.
1 2 3 0 .072 55. .068 54.20 .064 45. .062 45.40 .284 41. .278 41.68 .286 40. .279 40.
3 5 1 0 .105 17. .122 17.30 1.982 21. .758 15.
3 5 2 0 .176 23. .214 24.30 .347 19. .349 19.
6 11 1 0 .040 36. .040 37.600 .069 28. .070 26.
6 11 2 0 .020 53. .020 53.600 .017 47. .017 47.
30

Table 4
Comparison of the Variability of the Characteristic k
Section 1 Lnne 1 Item 3
Coverage zero Coverage 20
% 0o-pji. k-pci. Error Eo-psi. k-pci. Error
0.22
1.0 1030. 50. 0.218 830. 37. 0.2292.5 530. 51. 0.167 430. 39. 0.1864.0 380. 53. 0.161 310. 40. 0.193
5.5 300. 53. 0.157 260. 44. 0.368
7.0 260. 56. 0. 181 210. 42. 0.214
8.5 220. 54. 0.156 180. 41. 0.184
Coverage 200 Coverage 300
E -psi. k-pci. Error E -psi. k-pci. Error
0 0
1.0 840. 38. 0.334 940. 44. 0.513
2.5 430. 39. 0.281 480. 45. 0.439
4.0 310. 40. 0.271 340. 46. 0.429
5.5 260. 43. 0.404 270. 46. 0.425
7.0 210. 42. 0.278 230. 47. 0.421
8.5 180. 41. 0.265 210. 51. 0.512
Section 1 Lane 2 Item 3
Coverage zero Coverage 20
y E -psi. k-pci. Error E -psi. k-pci. Error00
1.0 1070. 52. 0.052 930. 44. 0.0572.5 550. 54. 0.068 480. 45. 0.0614.0 390. 55. 0.075 340. 46. 0.067
5.5 310. 55. 0.077 270. 46. 0.070
7.0 260. 56. 0.079 230. 47. 0.072
8.5 230. 57. 0.079 210. 51. 0.167
31

Table 4 (Cont'.)
Section I Lane 2 Item 3
Coverage 40 Coverage 68
y Eo-psi k-pci. Error E -psi. k-pci. Error
1.0 870. 40. 0.262 850. 39. 0.2422.5 450. 41. 0.270 440. 40. 0.2794.0 320. 42. 0.286 310. 40. 0.2945.5 260. 44. 0.297 260. 44. 0.3697.0 220. 45. 0.305 210. 42. 0.2998.5 210. 51. 0.682 210. 51. 0.971
Section 3 Lane 5 Item 1
Coverage zero Coverage 30
Eo-psi. k-pci. Error E0-psi. k-pci. Error
1.0 430. 16. 0.116 380. 13. 0.4332.5 230. 17. 0.122 210. 15. 0.7584.0 160. 17. 0.135 200. 22. 1.6935.5 200. 31. 3.189 120. 16. 0.6727.0 110. 18. 0.107 150. 27. 1.9508.5 150. 32. 1.453 150. 32. 6.370
Section 3 Lane 5 Item 2
Coverage zero Coverage 30
y Eo-psi. k-pci. Error Eo-psi. k-pci. Error
1.0 480. 22. 0.222 41). 18. 0.3902.5 260. 24. 0.214 22". 19. 0.3494.0 180. 24. 0.174 160. 20. 0.3795.5 160. 27. 0.601 150. 25. 2.0657.0 120. 24. 0.196 110. 21. 0.4338.5 110. 26. 0.194 150. 39. 2.374
Section 6 Lane 11 Item 1
Coverage zero Coverage 600
y E -psi. k-pci. Error Eo-psi. k-pci. Error
1.0 770. 34. 0.038 640. 26. 0.0772.5 410. 37. 0.040 340. 2E. 0.0704.0 290. 37. 0.041 240. 29. 0.0695.5 230. 37. 0.041 190. 29. 0.0697.0 190. 37. 0.043 160. 29. 0.0698.5 170. 38. 0.041 140. 30. 0.069
32

Table 5
1 Vluo, for :ininiuj.: Simulation Error
Sect Lane Item Coverage k-pci. Error
3 1 0 38.4 0.102200 28.8 o.b23600 28.7 0.040
2 3 2 0 42.6 0.17266 32.2 0.872
120 57.4 0.086200 30.3 0.144
2 4 1 0 19.9 0.17720 16.5 0.373
2 4 2 0 33.0 0.13020 32.2 2.836*
3 6 1 0 12.3 0.17420 10.5 0.21176 15.0 0.661
156 13.9 0.298
3 6 2 0 21.8 0.30820 15.9 0.84176 18.4 5.818*
6 Il 2 0 50.2 0.014600 48.5 0.016
6 11A 1 0 32.1 0.13720 27.0 0.259
130 26.4 0.168
6 11A 2 0 48.8 0.42520 38.0 0.623
130 32.6 1.951*
6 12 1 0 21.6 3.689*20 18.5 0.64690 21.6 0.203
6 12 2 0 60.0 0.15220 34.1 0.25344 34.3 0.669
33

Table 5 (Cont'd.)
Sect Lane Ite~n Coverage k-pci. Error
9 21 1 0 18.9 0.07020 15.6 0.159200 12.6 0.131300 11.3 0.541600 10.4 0.868
9 21 2 0 29.1 0.05320 26.7 0.041
200 25.9 0.500300 21.8 0.126
9 22 1 0 13.9 0.51120 15.3 1.266*
400 9.6 7.937*
9 22 2 0 16.8 0.57320 16.8 0.425100 16.8 0.927
10 23A 1 0 42.9 0.222
32 32.9 0.160
10 231 2 2 32.2 3.825*
10 23B 1 4 32.1 0.586
13 28 1 0 14.0 0.687200 8.9 0.992
ic1550 5.6 2.890*ii sos o
13 28 2 0 25.3 0.145200 21.1 0.336550 20.5 0.579
13 29 1 0 22.7 0.39542 7.8 2.201*140 5.6 7.704*
13 29 2 0 26.1 0.38442 19.9 0.542140 19.9 0.432200 19.9 1.714*
* Indicates that the deflection pattern as given [12 ] is
significantly unsymctrical.
34

- - - -- -. ___ - - -
w
o w
/0WI 0
LL
co~~ (.wI
z w00
LL wa0 \- N - N N >w 0
LirU
I~ I A -z w 2W /r
w -
-JA w
NI 0-- 1 - w 2
>>La
* < 0
0000 0 0 1 - L(0W CD CY -

for both the single-wheel and dual-wheel tests. In theseillustrationls to acco:-'.noduatr the log scal.e, the value ob-t.,ined by siMulcting the "nvorage deflection" pattern for
....o co,.':.:C, r h* (.Cn plotted -s occurring at one coverage.:,lso sho%,:n, is the slope used for establishing the functionalrelationship for. k,., Eqn. (13). For clarity of presentation,rcsu.lts for so,,7on "Avilable sections were omitted from theseficjures. As can be observed from Table 5, they exhibitedsimilar behavior to those shown plotted.
Deflection patterns were calculated incorporating the
refined values of k and Eqns. (13) and (15). Some typicaldeflection pntternsI e presented in Table 6 along with the
actual deflection patterns. The distances given in thistable are referenced from a point ten feet left of the cen-terline of the traffic lane.
Table 7 provides a comparison of the initial subgrade
modulus as given by Eqn. (14) with simulated values. It is
noted that the largest discrepancies occur for those sections
where the simulated values are generally high. In Figure 8,it is observed that small variations in the subgrade strength,
as reflected by the subgrade modulus, have appreciable influ-
ence on the deflection characteristics of the load transfer
element. Consequently, Eqn. (14) was developed with a bias
directed toward the better reproduction of low values of
kINT-
Summary and Discussion of Model
As indicated by the results presented in Table 3, any
choice of layer thickness greater than twelve inches appears
to have negligible effect upon the simulation of the "average
deflection" patterns. Similar behavior was also observed by
Lenczer [36 f in his study of the influence of layer thickness.
The assumption of an infinite depth for the subgrade was both
expeditious and justifiable.
Indications were that a Poisson's ratio of 0.4 for the
subgrade material was reasonable; selection of this value
was based uponthe work of Pickett [43, 441 and the results
of the preliminary study, Table 1.
37

Table 6
Comparison of Deflection Patterns
Section 1 Lane 1 Item 3
kinT = 50.5pci. YINT = 1.00
Zero Coverages - Error = 0.059 20 Coverages - Error = 0.059
Actual Estimated Actual EstiimatedDeflection Deflection Deflection Deflection
Distance (in) (in) Distance (in) (in)(in) (in)
47. 0.00 0.07 44. 0.00 0.0151. 0.10 0.14 51. 0.20 0.1456. 0.22 0.26 56. 0.35 0.2966. 0.75 0.66 66. 0.80 0.7876. 1.10 1.22 69. 1.00 0.9686. 1.55 1.65 76. 1.40 1.4396. 1.79 1.75 86. 1.85 1.94
106. 1.59 1.65 96. 2.20 2.08116. 1.18 1.22 106. 1.90 1.94119. 1.00 1.05 116. 1.30 1.43126. 0.75 0.66 123. 1.00 0.96136. 0.31 0.26 126. 0.85 0.78146. 0.00 0.05 136. 0.31 0.29
148. 0.00 0.01
40 Coverages - Error 0.313 68 Coverages - Error = 0.348
Actual Estimated Actual EstimatedDeflection Deflection Deflection Deflection
Distance (in) (in) Distance (in) (in)(in) (in)
41. 0.00 -0.03 49. 0.00 0.1051. 0.31 0.15 56. 0.48 0.3256. 0.38 0.31 66. 1.10 0.8367. 1.00 0.87 76. 1.40 1.5276. 1.50 1.48 87. 2.00 2.0984. 2.00 1.93 96. 2.50 2.2096. 2.50 2.15 109. 2.00 1.94
106. 2.00 2.01 116. 1.48 1.52116. 1.20 1.48 121. 1.38 1.17126. 0.92 0.81 126. 0.90 0.83131. 0.50 0.53 136. 0.50 0.32141. 0.35 0.15 141. 0.35 0.15151. 0.00 -0.03 151. 0.00 -0.03
38

Table 6 (Cont'd.)
Section 3 Lane 5 Item 2
kINT 21.0 pci. yNT " 1.75
o , cr T 'yn - Error -' 0.621 30 Coverages - Error - 0.619
Actual Estimated Actual EstimatedDeflection Deflection Deflection Deflection
Distance (in) (in) Distance (in) (in)(in) (in)
99. 0.00 0.47 96. 0.00 0.42104. 0.50 0.73 104. 0.79 0.88109. 1.00 1.04 114. 1.72 1.64119. 1.71 1.73 119. 2.00 2.03124. 2.16 2.01 124. 2.66 2.35134. 2.10 2.20 135. 2.80 2.60144, 1.99 2.17 144. 2.60 2.58154. 2.11 2.00 154. 2.60 2.60166. 2.00 1.91 164. 2.35 2.35174. 1.37 1.39 169. 1.67 2.03183. 0.50 0.79 174. 1.60 1.64190. 0.00 0.42 184. 0.68 0.88
194. 0.00 0.34
Section 13 Lane 28 Item 2
k 25.0 pci. INT 1.75
Zero Coverages - Error = 0.157 550 Coverages - Error = 0.788
Actual Estimated Actual EstimatedDeflection Deflection Deflection Deflection
Distance (in) (in) Distance (in) (in)(in) (in)
32.- -0.16 0.05 32. -0.16 0.09
36. 0.00 0.10 42. 0.15 0.3242. 0.13 0.22 52. 0.52 0.70
62. 1.00 0.86 57. 1.00 0.92
72. 1.00 1.06 72. 1.35 1.3882. 1.00 0.93 82. 1.30 1.24
92. 0.73 0.64 94. 1.00 0.88102. 0.51 0.52 102. 0.82 0.79112. 0.68 0.65 114. 1.00 0.98
122. 1.00 0.92 122. 1.00 1.23
132. 1.02 1.06 132. 0.83 1.38142. 1.00 0.86 142. 0.81 1.14
152. 0.40 0.51 152. 0.30 0.70162. 0.12 0.22 170. 0.00 0.12
167. 0.00 0.12 39

Table 7
Comparison of Simulated to Calculated Values of kINT
Test k pci.
Sect Lane Item Simulated Calculated
1 1 3 48.5 59.31 2 3 50.5 66.12 3 1 35.5 18.52 3 2 41.0 35.12 4 1 19.0 15.92 4 2 31.5 38.33 5 1 16.0 17.03 5 2 21.0 32.73 6 1 12.5 20.43 6 2 18.0 29.26 11 1 34.0 20.66 11 2 50.5 41.86 12 1 22.0 29.46 12 2 36.0 36.79 21 1 14.0 11.99 21 2 25.5 20.29 22 1 10.0 11.29 22 2 16.0 13.5
10. 23A 1 37.5 27.110 23A 2 27.5 31.710 23B 1 32.5 27.113 28 1 11.0 11.613 28 2 25.0 25.313 29 1 18.0 11.713 29 2 28.0 24.2
40

U
w.p
AlZD
0
o =-w w
z
0
__o
LLz
0N..
K)a3±OVinoivo .:0
(N1) 133HM JO -1 JV NOII)3143O

It is believed that failure of the state variable filterand its raccifications to idcntifv the rodel characteristics, and t was 6ue to tbhe intrinsic repreaentation of theapp:LId !oovs Fs step functions. Zimilar difficulties i.ithstep loaus had been noted earlier by Kohr (30].
The rtodel characteristics k and t, Ecns. (12a) and (12b),are functicnE of Y in C._ition to the conventional E andparameters. The "steep desccnt" method, in which the deZ.e,-tion difference b3t-;een the rodcl and the prototype for atleast nine discrete points was minimized, also failed toproduce unicue values of the parameters E and Y , Figures 3and 4. However, the error functional Eqn. (D2), was foundto possess a valley of minimums along which the value of thecharacteristic k was essentially constant.
The simulation of the "average deflection" patterns,Table 4, indicated that the value of the model parameter kincreased slightly with increases in Y. For a specific valueof y (as shown in Table 4) the magnitude of k was found todecrease with the number of coverages. Computations indi-cated that the magnitude of k was more sensitive to thenumber of coverages than to the value of the parameter Y.The evident validity of the developed expression for kEqn. (13) is amply demonstrated in Tables 4 and 5 and igures6 and 7.
As noted in Figure 5, variations in the parameter Y werereflected primarily as alterations of the deflection patterncurvature. This type of response could not be identifie6 bythe selected form of the error functional, Ecn. (D2). Therepresentative value of Y was established from the similarityof model deflection curvature for various values of y withprototype deflection curvature. From this comparison it wasnoted that the curvature, thus Y, increased with coveragesand decreased with increasing mat rigidity. This behavioris expressed by Eqn. (15).
After the parameter Y was established (by the aboveprocedure), slight mo6ifications were made in the magnitudeof k to provide even better correspondence between the 6eflec -
tion patterns. The simulated values of the characteristic kat zero coverages, Table 7, were found to be less than 51 pci.In this range, the moCel deflections were found to be auitesensitive to the magnitude of k For an incrementalchange in k;NT ' the difference L deflection characteristicswas found tO increase as kinT decrcasea, Figure 8.
42

An,-empirical relotionship, Ein. (14), was establishedto rclate k_,.M to the given coil properties of CBR, w, an6Y ,)ic toI1:. above mcri,,. r.odel rcnsitivity, thisr,.atio.2hip was 01olop(4 with a bias toward the smallerVLl.uCS of k
IN Ti
In ali cases 'Therv the "average deflection" patterns%,re fairlv ,'.xetricn!, the devoloped mat-soil model wasable to duplicatc the mat behavior under static loads witha rcasoritb.ly ic; c.cree of error. The degree of reliabilityof the simulation of prototype behavior, as reflected by themajnitude of the error functional, can be inferred fromTable 6. The magnitude of the error reflects the number ofpoints used for simulation. For example, assuming that the
totzal error is uniformly distributed among all points,errors--of 0.5625 and 0.6250 are equivalent to a quarter inch
difference at each point on deflection patterns represented
by nine and ten points, respectively. It is further noted
that only a few deflection patterns were described by the
minimum of nine points. The results, Table 5 and particu-
larly Table 6, demonstrate the general reliability of the
chosen model and the latter table confirms Eqns. (13) and
(15).
For those coverage levels where the resulting error was
* greater than unity, the prototype deflection pattern was
grossly non-symmetrical [12). Behavior of this type could
not be simulated with the chosen mat-soil model because
imposed conditions assumed: 1) that the applied load was
syrnetrical and 2) that the subgrade was homogeneous.
3
i 43

DEVELOPMT OF FAILURE CRITERION
Introduction
A failure criterion had to be established to use thedeveloped mat-soil model as a means of predicting mat per-formance. The scarch for a failure criterion which wouldrelate well to performance produced many blind alleys.Finally, success was had through an educated "trial anderror" procedure. The full chronicle of procedures andmethods examined will be given below in the hopes thattheir display will prove valuable to others on similarexpeditions.
Initially, the failure criterion employed was theroughness criterion established by the Corps cf Engineers(12]. The basis of this failure criterion was a deviationin the mat sucface of 3 inches or more within a 10 feetlength in any direction within the traffic lane. Measure-ments were always made on the unloaded mat and the con-figuration of the mat surface at intermediate coveragelevels and at failure were recorded as "average cross-sectional deformations" (12]. These configurations arereferred to as "deformation" patterns in the present studyand they represent the residual or irrecoverable displace-ments of the mat.
The established roughness criterion depended in somecomplicated way upon the residual deformation of the sub-grade and the permanent set that occurred in the mat element.As the selected mat-soil model was capable of estimatingdeflections only when loads were applied, a fictitious loadwas assumed to act on the mat. The distribution of thisload was taken to be similar to the distribution of thetraffic imposed during each test. The magnitude of thisfictitious load was selected to be that necessary tosimulate the maximum deformation. Investigation of themodel deflection curvature revealed that the roughnesscriterion could not be satisfied at the failure coverage;thus this approach was deemed not successful and anotherprocedure was sought.
44

A dimensional model was selected as the second meansof establishing a filurc criterion for the mat'or of
in car t2e dominate factors. Atterpts to developbetwen the failure coverage and
tho test pa ~tc,:s indicate0 that the developed functionalrelationship was not a reliable measure of performance.
Ne.t, the nat-,oil model deflection at the indicatedfailure covtra e "aas expressed as a product function of thefailure cvora~je and test parameters. A stepwise regressionanalysis of the data in this form was undertaken. The datawere divided into two categories: single-wheel tests anddual--wheel tests. Unfortunately, for both categories, theregression analysis indicated that the number of coveragesto failure was an insignificant factor.
In light of the above study, various parametric com-binations were analyzed in an effort to obtain an orderingwhich would be more dependent upon the number of coveragesto failure, N By adjusting the exponents occurring inthe product f nction, a combination was found for the dualrwheel tests which proved reasonably reliable as a failurecriterion. Success for the single-wheel tests was limited.
Residual Load Concept
Comparison of the observed "deformation" patterns withthe observed "average deflection" patterns revealed that,although the magnitude of displacements in both patternswere relatively the same, the curvature was much less pro-nounced in the "deformation" pattern. The primary differ-ence between the "deformation" pattern and the "averagedeflection" pattern was assumed to be attributed solely tothe manner of loading. On this basis the model parametersobtained from simulation of the "average deflection" patternwere e'ually applicable for the simulation of the "deforma-tion" patterns.
Two types of traffic distribution, uniform and nonuni-form, were used during the prototype tests. For the testswith uniform distribution, the fictitious load on the modelwas applied uniformly over the traffic lane. For thenonuniform traffic distribution, the distribution of thefictitious load, qf, was taken as shown in Figure 9.
45

VARIES VARIES VARIES VARIES VARIES1
100
La.0
zwu
wa.
/ /
207 /20
TRAFFIC LANE WIDTHVARIES WITH TESTS
FIGURE 9. TRAFFIC DISTRIBUTIONACROSS TRAFFIC LANE

Tho rnzInitu ce of 'f ;os determined by uimulating tho* !::!',', ',:' r t:ico ~.or fa:th prototype test. Tho range of
,, ,L ,: to be larrge. In addition, as noted,. t1: o' .urc of the deflection patterns,
otji !: t'D :u 1., wis much less then that of te" , -:,., , . This was particularly noted int.. ,. . w,,rco uniformly loaded. Consequently, the
,' ro'.:T'h, ~criLerion could not be met at acove'c~j hx,,e. ',Lich could be considered to produce failure.Thus, Lhi -ipjs:ozichn for establishing a failure criterionwas abandonoi.
Drimensional Analysis and Ta lor Expansion
Another approach followed to define failure was toobtain a functional relationship among the mat, soil, load.ing properties, and the number of coverayes which causedfailure. It was thought that a functional relationshipof the form
N = f(WL, CA, EI, wyd, CBR) (16)
where WL is the single wheel load in kipsCA is the contact area in sq. in.and the other symbols are as previously defined
would provide some insight to the development of a failurecriterion or could possibly even serve as a means of predictingperformance. To reduce the nutber of variables, theBuckingham Pi theorem [32] was applied to the system,allowing Eqn. (16) to be expressed as
N = f(Tr, 12 , T3) (17)
where the fr's are dimensionless ratios or numbers. Lettinggi be a dimensionless ratio of Wyd, WL, and EI,
C1 C2h r and (Wyd) ( ) (E )(18)
where C and are constants, it was found that
47
, j

(, )2/ 3 (l"1 (,3 (/a (19)
11-/
Similarly, letting 12 be a c .cnsionless ratio of w
and CA,
( .?y) 2/3 (CA)2 (20)(W'L) 2/3
as CDR is a ciiensionless quantity,
V 3 = CBR (21)
With the % terms so designated, the pursuit of a reasonablefunctional relationship followed. The function was expanded
0 0 - 0into a Taylor series about the fixed points v W2 , ana v 3which were assigned typical values for the vI, W2' and w13factors. The expansion of Eqn. (17) lead to-the f 0ollowingrelationship
0 00f(wl '2 w3) = f(If 1 12,1V3
+ 0( ' 0 ) 0 -1o22-_-+ W+( i _ ) i-3 f (, 1,3 w3) I o 0 0
r o j2 (22)
-1 )- -2) +i+ - 2 O
a1 2 3 1 3 2 3
+ D , -O 0 (i0 r
where f(, ,, ,w1) represents the value of the function atthe fixed poin ts3 0., ff 2 and wo and hence is a constant.
2 3
48

The expression
f ("w 72 ' R 3) of 0 0 0 1, 2, 3)
ff 2 71
roprosents the partial cerivative of the functio with 0rc :!)ct to 7T. ez' ted at the fixed points , w2 , an 3All of the p~irtial derivatives are unknown but once fixedpoints are selected they become constants.
Data were used from the prototype tests for the single-wheel load assemblages wherein failure occurred before 700coverages. In all, a total of 26 different sets of data'were jtilized. With this amount of available data as manyterms of the Taylor -eries were used as possible. Consideringonly the first 4 terms of the series, 20 different coefficientsor constants had to be evaluated to obtain the requiredfunctional relationship. If the functional relationshipwas to apply, of necessity, it had to satisfy each set of-data. Thus in order to determine the coefficients, thedata for 20 different tests were used to produce 20 differ-ent relationships which were then solved simultaneously toproduce the 20 required coefficients.
All of the dual-wheel tests which produced failure werealso investigated in the same manner with the inclusion ofthe wheel spacing, US, as an additional variable. This
* additional variable necessitated an additional 7 term.Letting w be the dimensionless ratio between wY d WL, and1U S, it was found that
1/3~(WS)4 w= ) I/ s (23)
(W)L)
Hence, for dual-wheel tests the functional relationshipbecomes
N = f(w '2' 3 (24)1 1 3, 4)
where r , '' and w3 are as defined previously. Due to thelimited amont of data available, only the first three termsof the series expansion could be considered. This necessi-tated the evaluation of 15 coefficients.
49

Data from 20 different tests were used to develop thefunctional relationship for the single-aheel tests, Ecn. (22).
h U fncti'nal relati,-,ship o-tai;ed from one particularco.bixnation o.Z 20 data scts was
N - 2.208 + 0.265(1 - 4
0.154(z 2-1y - 05.261(T-3- 0"31
0 0,00.001(r 1 -ri) ( 2-1r2) + 1.070( 1 -T°)(0-
+ 2 C42'- 2) -,1T) + 0.002(w- 0 )02 020.02C(w 2 - 12) + 015.730(2- ) (25)
o0 006 (w W 0 W 00 2 o01) OO06 -2 - 2)N-W 3 ) - O.O00(wI-W ) (W 2 "W2
2 0 0 0 2-0. 003 ( w -WO) (W -I3) - 0."000 ( W -_ )W 2-?1 012 3 o 30 1 ( 2
- 0.016(02-2) (?r1"03) + 1.036(w 1-2 ) (w-it0
S 0203-3.602(lt2" V2) (W3 - W3) " O'O00(w I -W )
- 0.ooo(W 2- 2 . + 8.466(w3-_ r3
,.i - 1, lP ":ac applied to all 26 available fieldtests. Table 6 gives the results.
As expected, the functional relationship predicted theedxact failure coverage for the 20 sets of data used in itsdevelcpment. However, the prediction )f the failure coveragewas quite poor for the other tests. A total of 100 differ-ent combinations of data sets were investigated. The coeffi-cients obtained from the different data combinations werevery erratic.
The same procedure was also applied to the dual-wheeltest data. Again the developed functional relationshipfailed to repioduce the failure coverage. Pence this pro-cedure was abandoned.
Regression Analysis
Actual wheel loadings were applied to the mat-soil modelusing Ecns. (!_3), (14), ana (15), and the 'cflec t.on of themaLs ,..as cor.:pvied for the failure coverage. In the single-wheel tests, the deflection of the mats at the center of the
50

Table 8
Results of Dimnosional Analysis Study
of Single-Wheel Tests
T cst Coveragee
Sect. Lane Item Actual PredictedFailure Failure
2 3 1 * 600. 600.2 3 2 * 120. 120.9 21 2 * 300. 300.
6 11A 1 * 130. 130.6 11A 2 * 130. 130.
10 23A 1* 32. 32.10 23A 2 * 2. 2.
10 23B 1 * 4. 4.10 23B 2 * 2. 2.
7 ** 94. 94.8 ** 6. 6.9 ** 94. 94.
36 ** 14. 14.
37 ** 98. 98.L38 ** 197. 197.39 ** 60. 60.40 ** 30. 30.41 ** 30. 30.71 ** 160. 466.
72 ** 675. 11384.
73 ** 473. 5428.
74 ** 74. 74.
75 ** 360. 7292.
76 ** 223. 738.
92 ** 300. 300.93 ** 23. 156.
* Reference 12
•* Reference 10
51

wheel was recorded and is presented in Table 9 and Figure 10.For the dual-wheel test sections, the deflection of the matsat the ccntcrlino of the wheel assembly was recorcci an I'spresentecd in Tab.c 10 nnd Figure 11. It was anticiopatcithat a failure criterion could be established empirica!!yprovidec that the results, as shown in Figures 10 and 11,could be grouped in some manner. Since the predicted "efcc-tions were themselves functions of oLher test parameters, inacoition to coveragces, the predicted ceflections for eachtest were taken as a product function of these parameters.For a single-wheel test, this relation was expressed as
(wLR)CI (EIR)C2 (CAR)C3 (CBR)C4 NC5 (26)
where Af is the predicted deflection at the failurecoverage in inches
WL is the wheel load relative to 35 kipsEI R is the rigidity per foot of width relative to
13680 kip-inCA is the contact area relative to 150 sq. in.N is the number of coverages to failureC1 , C2, C3, C4, (5 are exponents whose values are
to be determined.
The parameters of tire inflation pressure and tire plyrating were not included because their effects were con-sidered to be reflected by the parameters WLR and CAR.
The data from each single-wheel test section waswritten in the form
logAf= C 1 log (wLR) +C2 log (EIR) +C3 log (CAR) +C4 log (CBR) +C 5logN
(27)
A multiple stepwise regression analysis of the data wasperformed using a computer program [ Gl] to obtain the coef-ficients, C , C2, C3 , C4, alnd C. The failure conditionfor all 26 tests are shown in Figure 12. Also indicatedin this figure is the regression line for the failure con-dition. The results of this analysis indicated that thefactor sought, failure coverage (N), was of only minorimportance.
52

Table 9
Predicted Dcflections of the Mat
at Pailure ior Single-Wheel Tests
Failure Deflection
Sec t. LZne Item Coverage in.
2 3 1 600 2.322 3 2 120 1.52
6 1A 1 130 2.68
6 IIA 2 130 1.749 21 2 300 1.70
10 23A 1 32 2.6910 23A 2 2 2.50
10 23B 1 4 4.24
10 23B 2 2 4.26
Failure DeflectionTest Coverage in.
7 94 1.148 6 1.749 94 1.37
36 14 1.8037 98 1.5638 197 1.3539 60 1.5940 30 1.4941 30 .1.6371 160 1.2372 675 0.9573 473 0.9774 74 1.5975 360 1.18
76 223 1.43
91 570 0.77
93 23 1.75108 160 1.21109 50 1.38
53
NJ

+ 4.
+ L
++ MLi.+ L
z r++ - -0 + 00u
ww
F- :w
w + + w0 Lx ~ +
w+
+~ J-
_j- W
02
4. +W
'NI 133HM IV NOIID)31d3O

Table 10
i'r¢: ictc Deflecticn of tiie Mat
-0- Failure for DuaJ-hol Tests
Failure DeflectionSect. Lane Item Coverege in.
1 1 3 300. 1.521 2 3 40. 1.682 4 1 20. 3.762 4 2 20. 1.873 5 1 28. 3.03
3 5 2 28. 1.653 6 1 130. 2.04
3 6 2 76. 1.27
4 8 1 460. 0.57
4 '8 2 142. 0.50
6 12 1 90. 1.37
6 12 2 44. 0.829 22 1 400. 3.14
9 22 2 100. 2.6213 28 1 700. 2.37
13 28 2 700. 0.87
13 29 1 140. 3.27
13 29 2 200. 1.68
55
V

2 Co
+ 2I
+<
+ wJ(
+J <
+ wL+, + w-
0
ww+ WZW L
+ + U
+ >Lii
ww
F-0ifl 10 Nu
N1 16~3SV13HM.J0~ V OI.~U3

CD Co o W D
ED_ n.- _ _) 0
w
00
*o 0IL
OF~at)
__0_ -j oW
0 Y)
V)W CL L. 0
w 000 w~
+.Q x 0 JrQ
w
0 0 0 OD W U)
NI 133HM J IV NOLL31z.~a

From the prototype data, it was observed that the sametire ply rnting ots not used in all tests; thus, the ratioof tire inflation pressure to contact pressure was not aconstant. This ohservttion incicated that possibly the tireinflation pressure :i:-Lt indeed be a significant pararm.ater.Thus another regression analysis was performed on the datawhere each test .-as expresse6 as
logA f=C I log ((LR) C2log(EIR) +C3 log (CAR) +C log (CBR)
(26)
+C5 log (N) +C6 log (TPR)
where TP is the tire pressure normalized relative to 100psi. After obtaining the coefficients, the failure condi-tions were as shown in Figure 13. This analysis also indi-cated that the failure coverage was of minor importance.
The dual-wheel test sections were investigated by asimilar regression analysis with an additional parameterof wheel spacing. Each dual-wheel data set was expressed as
logtf=C ilog (WLR )+C2 log (EIR) +C3 log (CAR) +C log (CBR
(29)
+CS log(N) +C 6 1og (TPR) +C7 109 (WSR)
where WSR is the wheel spacing normalized relative to 25 in.Surprisingly, the N parameter was again found not to be asignificant parameter. In view of the fact that the Iparameter is of primary importance to the establishment ofa failure criterion, the regression analysis program, asapplied to the data in the form of Ean. (29), was alsodiscarded.
Educated Trial and Error Procedure
Finally, an educated trial and error procedure wasundertaken to achieve the combination of test parameterswhose order was more dependent upon the number of coverages,
58

w
- - z
CY 0
OD__ _Inc;
0 .0 LL~*N 13M I 01-14

N;. Con'J.inations of parameters ,-ere set up by 6eletinqcer t a-in pa Ze trE t _ n ,, v -a - ,i3 .,s fo rins o f_ Cho funct ion '.,ere
.. t .h- o:r ts For each co n
c o = ,' c a o n - .. Cir c ( t , a rd6 t h e 1e v e l o j)!:,e n t o f alin ... , o .1 i , on ... .... pl2 ot, b)et;:een the Pre-
dicted fail, re ceflcrtfons (T~bes 9 and 10), the failurecovre, :i th, £c~ectU test plrar, eters. FCllo',inrt>±: Frc. - 1. " e correlsaion was ;.vcnurellyachieve, for Lhe cual-'heel failure conditions.
P linear " . i.. tion of the failure conditions wasesta!)ished Es the failure criterion for both the single-wheel and the- Cual-.':h!el tests. A cor.vputer prooram wasdeveloped whcrey the performance of a mat could be pre-dicted from tlhe paras'rters of the test section. This com-puter progran is given in Appendix G. It recuires entriesof: modulus of elasticity of the mat, moment of inertia ofthe mat per foot of width, the length of a rectangle ",.hosearea is equivalent to that of the tire print and whose widthis the same as the actual tire print, the number of wheelloads, the weight of water per unit volume of soil, CBR,wheel load, contact area, tire inflation pressure, the dis-tances to the beginning and end of each wheel load from anarbitrarily located origin and the magnitude of the wheelload expressed as a uniform load over the width of the tireprint.
The ectuation of the failure criterion line can beexpressed as
f= C(N) 14 (30)
where A is either the deflection of the center of the wheelfor the single-wheel test or the deflection at the center-line of the assembly for the dual-wheel test and C anC M areeach constants which are dependent on the type of test. Inthe computer program, the N oaraieter is incremented and thedeflection at the specified point is computed. For valuesof N less than 200 the increment interval is 5 and forvalues of N greater than 200 the increment interval is 20.
For a single-wheel test as the value of N increases,the deflection as given by the failure criterion will alsoincrease; thus, the deflection will follow the line "C" inFigure 14. From the simulation model, the deflection of thesame point also increases as the value of N increases, line"D, Figure 14. As N is incremented the mozel deflection is
60

-J
tCJN
L -w
LfL
o-JHC
(LG .AE
FIUE1.PROMNCwETFRADAWHELTET

computed and compared to the deflection required by thefailure criterion. ;hcn the latter deflection is just equalto or reatc: than that -Z the mocoel, the corresponcingvalue of N is c- nsicuered the failure coverage.
Tihe proc:Coc2re given above was also followed for thedual-.heel teszc. For this case the failure criterioninfic7t-4 t'.: ,h dalections cecrcased. as N increased,line "F", Fijure 15. Thus, for small values of N, thedeflection Fs c ivan by the criterion would be larger thanthe moJel derlc .on, ine "G", Figure 15. Failure wascons nered to be im'inent when the model deflection becamejust ecual to or greateri than the deflection given by thecriterion.
Results
When the trial and error procedure, which was biasedtoward a significant N parameter, was applied to the dual-wheel test data the "best" ordering of the parametersresulted in a plot of the failure conditions as shown inFigure 16. All data points, except three shown encircled,were fitted with a linear function using a least squarestechnique. The three points were believed to be in errorbecause,
1) The maximum differential deformation for Section 1,Lane 2, Item 3 at the indicated failure coveragewas 2.31 in. This was less than the establishedcriterion for failure. To meet the roughnesscriterion m:.ore actual coverages would be necessary.This indicated that the failure condition shouldplace the point ko the left of that shown inFigure 16.
2) The deflection pattern for Section 4, Lane E,Item 1 was pronouncedly unsymmetrical. Thisindicated the likelihood that the reported soilproperties were not representative of the soilconditions that g-overned in the process. Ifthis was the case, then the resulting predicteddeflection should be larger than shown in i'icjure16. I- addition, the mDimum differentialdeformation for this section at failure wasrecorded as 2.63 in. Consideration of thesetwo factors woild place the failure conaitionup and to the left of that sho,rn in Figure ]6.
62

-~~~~~0(J'
w
0 W-ZI
49
0I IL
_ zY.J
+ 0~ 0
+4 0
CYLU_
- -V4SS 13H JO_ 0NI3I3 0VNI:3z

3) The CBR values reported at the beginning of test,
Section 4, Lane L, Item 2, showed a decrease oJstrong-th ?ith Ce~th for the upper ia in. of scii.
For all other cual-hcel test sections the ir.erseof thir condition existed. It appears that tre
perforu,,nce of this test section is governed by
weaY>r underlying material. Accounting for theweil]er concitions, the predicted 6eflection atfailure would have to be largbr than that shownin 2igjre 16.
The "calculated" trial and error procedure was also
applied to the single-whe] test data. The failure condi-tions for one of the "better" parametr'c combinations of
these is shown in Figure 17. In an attempt to establish a
failure criterion for the single-wheel tests, the datashown were fitted by a linear function. The three pointsindicated by circles in Figure 17 were omitted in the curvefitting procedure. These points represent tests whichfailed at four or less coverages. In view of the extremelylow number of coverages to failure, it was felt that thesetests should not be included as they did not representreasonable engineering solutions for which mats could beemployed.
The computer program, Appendix G, developed to predictthe perforrmance of a test section, incorporates the linearrelationships indicated in Figures 16 and 17. The data forthe given prototype tests [ 10, 12] were processed by thiscomputer program. The predicted failure coverages, alongwith the actual failure coverages, for the dual-wheel testsare given in Table 11. Similar tabulation for the single-wheel tests is provided in Table 12.
Sumrtar% and Discussion of Failure C--iter
The roughness criterion established by 'e Corps n'fEngineers [12] for the prototype tests was based upon thepermanent displacements of the unloaded mat. With thedeveloped elastic mat-soil model displacements of the matcould be determined only when the surface was subjectec toexternal loading. Thus in oraer to use the developed mat-soil model as a means of predicting performance, thebehavior of the model, under actual or fictitious loading,had to be relatea to failure. Initially, a fictitious loadwith a distribution identical to the traffic distribution
64

10.0 - _ _ _ _ _ _ _ _
6.0__ _
(SECT 10, LANE 236B ITEM I)(SECT 10, LANE 238B ITEM 2)
4.0
w(SECT. 10, LANE 2 3A, ITEM 2)
2.a
z++0
+(-+
&~ REFERENCE [12]
0.8 ___________+ REFERENCE__[10)
0.6
0.50.01 0.02 0.04 0.06 0.08 0.10
(WL)' N .
MOW) CBR CA
FIGURE 17. CORRELATION OF FAILURE FOR
SINGLE -WHEEL TESTS.

Table 11
Comparison of Perforiance
for Dual-Wheel Tests
Actual Failure Predicted FailureSection Coverage Coverage
1-1-3 300 2201-2-3 40 (56)* 2602-4-1 20 252-4-2 20 253-5-1 28 353-5-2 28 353-6-1 130 1503-6-2 76 856-12-1 90 1206-12-2 44 (54)* 659-22-1 400 3209-22-2 100 (56)* 30
13-28-1 700 (967)* 88013-20-2 700 156013-29-1 140 17013-29-2 200 (145)* 1304-8-1 460 >50004-L-2 142 1000
* More realistic values, see Summary and Discussion of
Failure Criterion.
66

Table 12
Comparison of Performance
.for Single-qhcl Tests
Actual Failure Predicted FailureTeszt Coverages Coverages
2-3-1 600 6802-3-2 120 1206-11A-I 130 1256-l1A-2 130 1159-21-1 >600 4009-21-2 300 135
7 94 .408 6 659 94 105
361 12-16 7537 70-126 14038 170-224 12039 40-80 12040 20-40 7541 20-40 13571 150-170 4572 650-700 8073 400-546 4074 40-108 5075 350-370 11076 170-276 5591 570 3592 300 .60
23 220S!3- 160 195
109 50 17010-23A-1 32 56010-23A-2 2 34010-23B-1 4 500010-23B-2 2 4940
67

was assumed to act on the mat-soil model. The magnitude ofthis !c 'as determincd from simulation of the maximu,
, io:L. Inves 'aion of the curvature of the recult-jr.g -oiel ection pa: Le::n :evealed that the roughncsscriLi:_n aotU net bc satisfied at the uefined failureco; a... g Cc..p-rions of the mwgnituoe of the fictitiouslo-6E _o .,-:c co.cra..,cs was also unsuccessful.
An attempt wNs made to develop a functional relation-ship botwe._n za.!ure coverag4s and tcsL parameters by dimern-sional V:lin e . The- rsults, T~ble F, -ndicated that a
ucu.r.... . coulC not be established. The inabilityto uevelop a 2atis actocy functional re~ationship by thisprocedure ,as attributed to: 1) consideration of only alimited numlbr of terms in the series expansion, anC/or 2)omission of significant factors in the selected dimensionalmodel. For this study more terms were not considered due tothe lack of reliable data available. For example, to includethe next term in the series for the single-wheel tests wouldrequire fifteen additional sets of data. Further examinationof Eon. (25) failed to establish which w term was most influ-ential in the functional relationship.
The mat-soil model was subjected to loading identicalto that used to obtain the "average deflection" patterns[12]. Under this loading the mat deflection was computec-L Z-, io~lr co'"Crz--. For consistency, the
mat deflection was computed at the center of the wheel andunder the centerline of the wheel assembly respectively forthe single-wheel ana dual-wheel tests. These deflectionswere then expressed as a product function of the failurecoverage and remaining test parameters. A regression ana!-sis of both the single-wheel and dual-wheel test data indi-cated that the failure coveragc ,,;as Pn insignificant para m-eter, Figures 12 and 13.
An educated trial and error procedure was undertaken toachieve an ordering of the test parameters .,viich was depen-dent upon the failure coverage. Numerous conbinations ofthe test parameters were investigated. For each combination,computations were directed to',.ard the development of a linearrelationship on a log-lo4 plot. A reasonable correlation ofthe dIual-wheel tests was achieved and the results are pre-sented in Figure 16. The results as shown were fitted w:itha linear function which vas established as the failure cri-terion. Using this criterion the performance of each test
68
s :ctzon was nrccictc& with the aid of the computer program,
SG. , ro is prograra may L.c comparcd .,ithLU ,_ 2. i.. cove C, Table i.. The results indicate
th:L "ic >r o: similar tests may be predicted wit'- by this procedure. Apparent discrepan-
:iC2..Ccr ~:-:_i~c t s 'may be attributed to the followingfc. t Ch. c Lt o protoype cdata:
1) Section 1, Lane 2, Item 3. This test section wasconsi6ercd to have failed at 40 coverages due toroughness and mat deterioration. However, thema:,imiia differential deformation at this coveragelevel was 2.31 inches. To meet the establishedfailure criterion for roughness, additional cover-ages -would be necessary. Thus it is believed thatthe performance of this test was governed by mat
" deterioration rather than by surface roughnessupon which the prediction of performance is based.
2) Section 6, Lane 12, Item 1. The "average deflec-tion" patterns for the various coverages when theload assembly was at the center of the panel arepronouncedly unsymmetrical. In addition the deflec-tion did not increase consistently with the numberof coverages. Due to the unsymmetrical character-istic of the deflection patterns, the soil proper-
ties reported may not be representative of thegoverning subgrade conditions.
3) Section 6, Lane 12, Item 2. The maximum differentialdeformation at failure was reported as 2.63 in. Con-
formance with the roughnebs criterion would necessi-
tate more coverages and therefore better agreementwith the predicted failure.
4) Section 9, Lane 22, Item 2. The maximum differential
deformation at failure was reported as 4.39 in. This
indicated that the failure criterion was satisfied
at a coverage level less than 100. Appl'ing a linear
interpolation between the maximum differentialsettlement reported for 20 coverages and 100
coverages, the section would have satisfied the
failure criterion at 56 coverages.
5) Section 13, Lane 29, Item 2. The maximum differ-
ential deformation at failure was 4.00 in. Again
applying a linear interpolation for the maximum
differential.deformations reported for early
69

coverage levels, failure would have occurred at
145 coverages.
6) Section 4, Lane 6, Item I. As noted earlier the
deflection pattern was pronouncedly unsy'metrical.The soil properties rcported, which were use., lorthe meat-scil moLe!, r'ay represent a strongjer sub-grics tha.n actuaally c:;isted. If there wa-, Pn
a-preciable cifferenca between the worst soil con-ditions ano the conditions as reported, one shouldnot expect the performance of this section to bepredicteQ by the developed procedure.
7) Section 4, Lane 8, Item 2. Also, as noted earlier,the strength of the subgrade as reflected by theCBR values decreased with depth. The performanceof this section appeared to have been governed byunderlying weaker material.
8) Section 13, Lane 26, Item 1. This section failedat 700 coverages due to elastic deflections; thatis, excessive displacements were in evidence underche wheel loads. This failure, therefore, couldnot be attributed to roughness. Extrapolation ofthe given deformation data indicated that the sec-tion woulC satisfy the roughness criterion at 967coverages.
9) Section 13, Lane 22, Item 2. No apparent reasoncan be found from the available data for the dis-crepancy shown for this section between observedand predicted performance.
Apparently as incicated in Tuble 12 and again in Figure17, the develeopd procedure Ceionstrated less succes- -'henpredicting the performance of sinle-wheel tests. Thepaucity o2 available information and test results for thesections sholving the poorest comoarison of performance(sections reported in reference [-30)) rencer the correlationfor the single-,-heel tests academic. This is particularlytrue since the three inch roughness criterion was not speci:- Iically employed; further, the macnitudes of the differentialdeformations and the "deformation" patterns were also 1aLe -ing. If one can speculate, a prime factor which mighteffect this correlation is the variability of the number ofpasses necessary to complete one coverage. For the tests
70

7 t C in reforencc [I0 ] these ranged from a minimum of 7ri :r ;u:,i of 29 fna-sE. Thus the input energy level per,,-ou1: > cuito cifferent for seemingly similir
St . . " it v..'e.- thouglht a,,visable to turn to anv2 :...r:ov cA: ' 2. ,..hereby ictu;l loaings could be simulated.
71

ASIPM'i.RIC LOAD MODEL
Int--oduacticn
The "deforrmation" patterns of the prototype landingmat tests conducted by the Corps of Engineers 112] indicatethat tho time rrte o deformation decreases 1*iith coverages.Typical mat deformations at the centerline of the trafficlane when plotted as a function of coverages, shown by thecircles in Figure 16, suggest that a continuous plot of thisrelationship might follow the dash-line. Larew and Leonards( 33] obtained the same general shape in their study of thedeformation characteristics of fine-grained soils subject torepetitive loads. They concluded that for repetitive loads,wherein the ratio of the repeatedly applied deviator stressto the static deviator stress causing shear failure was inexcess of 0.91, the behavior might best be represented by aviscoelastic model.
Most works to date which employ viscoelastic modelsassume for mathematical expediency, the existence of a con-tinuously appli-U constant load or a single step load intime (20, 55]. Generally, the first type of load is utilize6in the study of creep phenomena while the latter is employedin the study of stress relaxation.
The time-dependent response of a soil may assume avariety of forms depencing on such factors as soil type,soil structure, stress history, type of loading, and otherfactors [56 1. In most studies these factors are classifiedinto two croups of effects: a creep effect and a relanationeffect. It has been shown, Singh and Mitchell ['5] andKonder and Krize% (31], that in general soils exhibit-bothlinear and non-linear behavior. It is also comvionly assumecdthat the magnitude of the strain is stress dependent. Thusany strain-time function which is to describe the responseof such materials must: 1) he applicable to the range ofstress levels encountered; 2) account for both linear andnon-linear relationships between strain and tirme; and 3) berelatively simple in form for ease of application and deter-mination of parameters.
72

00
_ _ .1 _
w
w8
z
UJ4
w
00
co
QOc
0 q q
S3HONI NOIVYOQ

In this section a viscoelastic model is developed forprecictingJ tie reFuonse of landing mats to a simulation ofLt'e actual seccnce of tra.£ic loa6E. Although only thesu.r~cc will bo taken to possess viscoelastic properttis,t: e rc.o~l rwhlich afe established from the rcstoneof actual tests will al.so indirectly reflect the viscoelasticbehavior of the lanaing mts.
;nalysis of Miodel Behavior
Assume that a load applied to a mat-soil system pro-duccs a constant stress a , as shown in Figure 19(a). Theresponse of the system due to this stress will be as shownin Figure 19(b) wherein 0 represents the immediate elasticstrain and c(t) represents the strain for times t > 0. Iftransient effects are considered negligible in the elasticrange, c0 will be a constant and c (t) may be expressed as
C(t) = C0 + AC (t) (31)
where AE(t) contains all the time effects, Figure 19(b). Anincrease in the magnitude of the constant stress will sirmplydisplace the response curve upward, Figure 19(c). Assumingstrain is time dependent ana stress is independent of time,......~~ ~~ at - i- ..... I"i __~r. 1 t a%,e t he form
E(t) = Du (t)a (32)
where a represents the magnitude of the (constant) stressand D (t) is a "compliance" function. According to Schapery[551 his function can be expressed as
D u(t) = DO + D(t) (33)
where D is a test dependent constantD~t) is a function of time so defined that D(0) = 0.
The assumption is comonly made (55, 56 ] that timie effectscan be enpressed by a power law of the form
D(t) = D! (0< n<.i) (34)
74

-0*
TIME (t)
a)APPLIED STRESS
0- 00
TIME Wt
b) RFEPO DUES TO VEL
FIGUREC EFFT O STRESS L EVBELAIR

where D I and n are parameters to be determined from response
curves; aD is the shift factor which is stress dependent andcxqpressecas
aD = aD(a) = i/j (35)
and o. iz a constant. For constant stress con6itions aL isseen o be ecrual to unity. Hence from Eqns. (32) and (33),the strain at any time t> 0 under a constant stress will begiven by
e (t) = (Do +I tn) (36)
If a step stress of time duration t is applied, thecorresponding strain will be as shown in Figure 20. For anytime t < tI the strain will be defined by Eqn. (36). Fortimes t > t the residual strain in the system can beexpressed b
c (t) = Do +D (t)n ] -[D 0 + DI(t - t )n],r 0
or (37)
Cr(t) = D1 tn - D (t - t I )n]a
Development of Landing Mat-Soil Model
Under the action of a single pass of a load vehicle, apoint on the surface of the £ubgrade experienccs a normalstress variation similar tu that shownm in Figure 21. Thisstress variation can be represented bv a step stress provideCthat the time duration for stress builc-up and release ismall. The effective time duration of the step stress, sayt I = ti - ti , will be a fraction of the time required tocomplee one pass.
It will be assumed that trafficking of the section wascontinuous and performed at uniform speed. The actual timeto complete one pass will then be a constant and one 'iassmay serve as a basic time unit. Also, the duration t, cfthe step stress will be a constant independent of pas .. Themagnituce of the step stress will be cependent upon theassembly load and the position of the point under considera-tion relative to the path foliow.ed during the pass.
76

tj'
APPIE STEP__RES
e TIME (t)
0) PPIE EP STRESS

jo
I"ACTUALn I. f ,SSUMED
ti t~
TIME (t)
FIGURE 21. LOAD DISTRIBUTION AT A POINT DURING A
SINGLE PASS.
TRAFFIC LANE WIDTH
TIRE * NUMBER INDICATES
WDH POSITION OF WHEEL AT
SUCCESSIVE PASSES
Lii I -i~g 1 v,
I POINT I
0) LOADING SEQUENCE
03
b) MAXIMUM STRESS AT POINT I
FIGURE 22. VARIATION OF STRESS WITH LOAD
ITPOSITION.

Assuming the surface displacement of the subgrade fortime t < t I can be e..pressed by Ec-n. (36), the residualdisplacemlent at the end of one pass will be given by
Ar (1) = ED (1)n - DI (I-yI) o (1> t ) (36)
where t I is the ti-me duration of the step stressa is the magnitude of the step stress
and n are constants.
The superposition principle may be used to extend theapplicability o Ecn. (36) to more than one pass of the loadvehicle. For examp-.!, if two passes of the load vehicle aremade along the same path, the residual deformation at -heend of the second pass will be
)n )n + DI (39
(2) = D1 (2) - D1 (2-t) D1 (1) n - D (l-t n ] (39)
f Generalizing Eqn. (39) for any number of passes N, along thesame path, one obtains
m=N1r (N) = D I t (Mn (m-tl)n ] (40)
m= l
Under normal traffic conditions the path of the loadvehicle changes with passes. Thus, the magnitude of thestep stress is also altered as the path of the load vehiclechanges, see Figure 22. Therefore the stress is spacedependent and must remain in the summation operation, Eqn.(40). The residual deformation at any numiber of passesregardless of the path followed would then be given by
M=N nr (N) =D r mn D(-) m (41)*
where a is the magnitude of the stress at the point forthe specific position of the load vehicle.
*nIt is noted that D mN(rn .(m-t )n] is analogous to the
M= I
reciprocal of the subgrade modulus used in the Winklerhypothesis assuming it to be time dependent.
79

IA quasi-elastic analysis was developed to predict the
resi6uol deformation of a landing mat-subgrade system (co;-,-
putt r rog rm given in Appendix H). The m-ocel cona-isted ofan infiJti u bePin with rjicity iuentical to that of the matan, c'ntinuously suportej by a subgraze whose response toloadi2Ig could be expressed by Ecan. (41). The loading onthe !xL wes ccciqned to approximate the loading sec uencee,,lU-Deu L I the prootype tests (from reference1 12] ) .,:icreunifomn distribution o: traffic was applied. The loaciing
wa ,: iJ Loth tima and space dependent. The secuence ofloFCing for a single-wheel test is given in Figure 23 andfor a 6ual-wheel test in Figure 24.
To be consistent with the prototype tests, thi basictime unit was taken as one coverage. Due to lack of infor-mation as to the actual time to conduct the prototype tests,the duration of load application was assumed equal to one-half the time recuired to make one pass. This assumptionmay be unrealistic but lacking more information it wasexpedient and in adeition it does not effect the validityof the model or the method of application. Only the numeri-cal values of the p~cameters D! and n are influenced by thisassumption. Not having adequate test information available,these parameters could only be roughly approximated.
The developed model was applied +-o a dual wheel test.The vplues of the parameters, DI and n, were obtain& "-ycoinparing tle r oclel rerponse for a point located on thecenterline ct he trp.ffic lane to the ectual rcsponse ofthe se':ne poi . jring the prototype test. In F4 ure 25,the fitted :-o.1a: deformatior of a point on the ccnterlineis indicated by the cur've labeled "thoretical" anc theactual d f:.ation is qiven (by crosses) at three coverngelevels. The actual deformations shown are the average ofthe centerline deforxations at three coverage levelsobtained fro.n the two "dcformation" patterns given inreference [12]. Some predicted deformation patterns atvarious coverage levels are shown in Figure 26.
The model was also employed fo2 a single wheel test.Some results are given in Figure 27 and Figure 26.
80

-jw
z
u wzz
Da 0Dow400
w(D. 0
x zw-,W
U U () 0
40 z
w
TIJ.QM WN~
0
o <
00
U-

w
w
40
w> z
wz
133El ElO
w
=z.VqV38 DNO'V 30NJLSI

-Jco
wZ
F 0U ~I--o U.
z
-- N 0~Ww a0
-004~7 soJ g
w ~0wocw
-- J
U..
0 - c
0 0 UD
NI NOIJV~3Od6
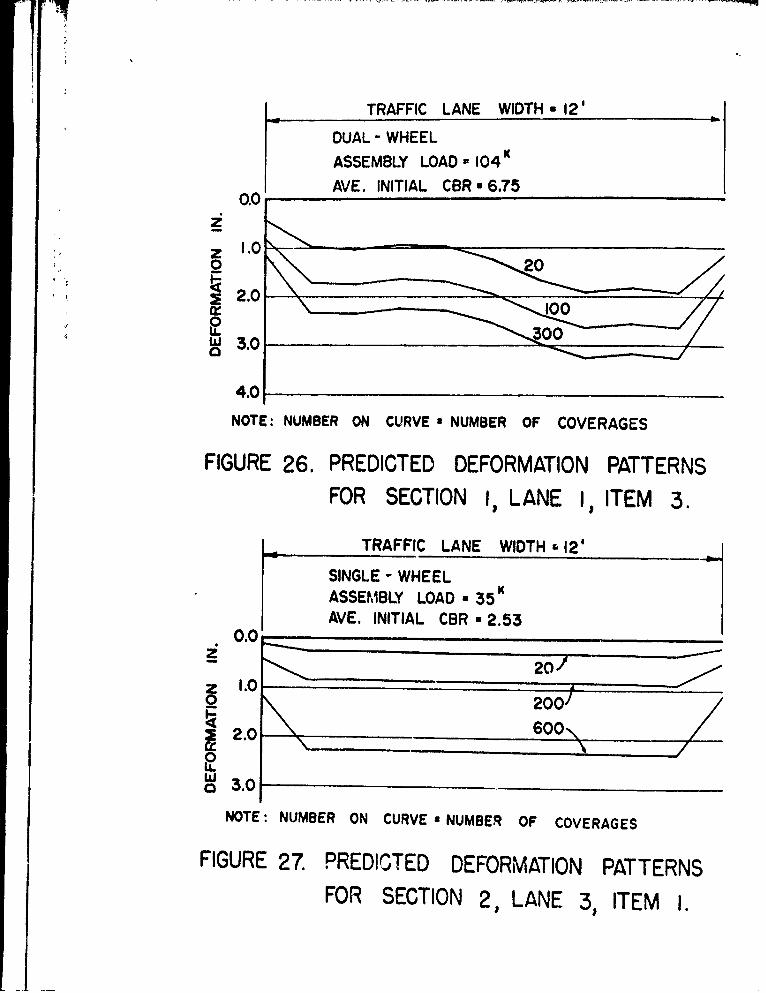
TRAFFIC LANE WIDTH 1 2'
DUAL - WHEELASSEMBLY LOAD - 10 4 K
0.0AVE. INITIAL CBR *6.75
1.00 20
~~2.0100 .'0
L 300-
4.0
NOTE: NUMBER ON CURVE aNUMBER OF COVERAGES
FIGURE 26. PREDICTED DEFORMATION PATTERNSFOR SECTION I, LANE I, ITEM 3.
TRAFFIC LANE WIDTH 121
I SINGLE -WHEELI ASSEMBLY LOAD 1 35~
0. AVE. INITIAL CBR *2.53
20z 1.0
Q 200J~2.0 6O
~3.0
NOTE: NUMBER ON CURVE aNUMBEIR OF COVERAGES
FIGURE 27. PREDICTED DEFORMATION PATTERNSFOR SECTION 2 , LANE 3, ITEM 1.

LL
ww
zz
w zz z
0 0
a W090
z 0
z 0
U-
0 U0
0 --
co) ___ 0
NOD0c;
a-
* 0
N
0.i 0
NI NOUVAHNOd3O

DiscuIssionIt s o~!od ! rcc lc , that the parareers, D and n
sro'n in 2'i -r-s 2 aii, 2 , were selected so as to proviaethe si:mulation of the deformation at a single point. i~o
tt-e: pt bccn na.e to attach Fny physical significanceto the :.:s of thse pararaeters. In adition to the usualtcrt laria bels, whel loaC, ninmbur of wheels, wheel spacing,contact a,:ea, mat rigicity, and soil conditions, theseparameters are influenced by the width of the traffic laneand the numbiJcr of positions of the load vehicle recuired tocomplete one coveraye. More detailed information of thedeformation-coverage response of sections and loadingsequences are necessary to develop a procedure of identify-ing these parameters with conditions of either past or con-templated future tests.
It is noted that the shape of the deflection patternfor the dual-wheel test, Figure 26, is very different thanthat for the single-w-heel test, Figure 27. This is dueprimarily to the assemblages used and the magnitude of thetotal load applied to the subgrade. Another contributingfactor is the test procedure itself. For th. dual-wheeltest six different assembly locations were used to completeone coverage; w:hereas, for the single-wheel test, elevenassembly locations were necessary to complete one coverage.To maintain a correspondence between coverages, it wasassumed that the load for the dual-wheel test was appliedfor a time 1.835 longer than that for the single-wheel tezt.For these conditions, the effect of the precedin9 positionof loading is more pronounced for the dual-wheel test thanfor the single-wheel test.
Ecuation (41) may be generalized further. Under theassumption of a steady, continuous trafficking, the valueof t 1 may be 'taken as a constant and Eqn. (41) can beexpressed as the difference equation
(N) mN fm -(m-tit = Di t f - (42)m=1 1 I
Recognizing that the value of tI is small in comparison tothe time reuiiired to complete one pass, the terms in thebrackets may be taken as the derivative of the f(m) withrespect to t The s.mation of this quantity approximatesthe integral of the derivative which is the function itself,f(m) . Unde'r an average stress condition Eqn. (42) may bee lfressed as

r D f(N) (43)t ave
If the residual deformation at a point k can be measuredat two spcc.iic nuriar of passes, N. and Ni, the function5 (u) may be cstablishcd by 1 j
r 1.i = ) (44)a f(N)
rj
Thus the function f(A) could be taken as any form whichsatisfies Eqn. (44).
In summary, a mechanistic model has been developedwhich is capable of simulating the actual loading sequenceand which also provides a means whereby residual deforma-tions of the mat surface may be predicted. The potentiali-ties of this molel have bean demonstrated for a single-wheeland dual-wheel prototype test. To fruitfully pursue thecapabilities of thir model, more detailed test data are neces-sary to identity or attach physical significance to themodel parameters. A continuous record of the deflection asa function of the number of passes is necessary along witha record of the position of the load vehicle during eachpass. Also, information i oncerning the speed of the loadvehicle and the time interval (expressed as a function ofthe time required to complete one pass) required to shiftthe position of the load vehicle -is necessary. With thisadditional data and by selecting a single pass rather than
a single coveragie as the basic time unit, better correspon-dence between Geformation patterns can be achieved thusallowing the possible establishment of a limiting deformationas the Zailure criterion.
87
r°.

AMOMENT TRAXSTTR IliVESTIGATION
In most of the test sections reported in the Corps ofEngineer's report (12] it was observed that the distress inthe traffic lane was quite pronounced in the vicinity ofthe end joints of thA mat elements. This is why in allsimulations the load wa:. laced in the center of the matelement. In view of t 's observation, a study was under-taken to investigate the effectiveness of the end jointsto transfer moment from one mat element to another undersimulated test conditiuns.
Due to the masorry type of placement of the mats,Figure 29, it was not possible to determine the amount ofmoment transferred solely across the end joints. A signifi-cant amount of moment could be transferred around the endjoint between mat elements A and B, Figure 29, due to thetransfer of shear across the transverse joints. An inves-tigation that considers the presence of elements C and Dunder field conditions is further complicate by the contactlength of the tires under test loading being greater thanthe width of the mat element. Thus it was decided in thisstudy to restrict the investigation to the overall influencethat the presence of an end joint has on the transversecontinuity of the traffic lane. Emphasis will be placedupon the performance of the Tll aluminum and the MS steelmats as reported by the Corps of Engineers( 10, 12].
The type of end connector employed for the T11 mat wasdescribed in some detail in the Corps of Engineer's report11]. The method of connecting the M6 mat, which is aself-locking mat, was also described. A modified orstrengthened joint connection was given in a later report[ 9]. An examination of the performance of these connectorssuggested efficient shear transfer across the end joints;however, the capacity of the end joint to transfer momentappeared to be less than that of the mat itself. The latteris attested to by the ena joints shown in the photographs,Figure 22, Part III and Figure 8, Part XI of [ 12]. As aconsequence of the above, the assumption was mace that inthe simulation model there exists corplete transfer ofshear across the end joint.
88

TRANSVERSE JOINTS
_ J ELEMENT C__
ELEMENT A ELEMENT B
I ELEMENT D
LEND JOINT
FIGURE 29. ARRANGEMENT OF MAT ELEMENTS
WITHIN THE TRAFFIC LANE.
JOINT LOCATION
WHEEL LOADS
0) ACTUAL FIELD CONDITION
WHEEL LOADS
b) WHEEL LOADS ON INFINITE BEAM
-HINGE LOCATIONm M
O D 41 A. .... .... .... .4. . ..4
c) CONCENTRATED MOMENT APPLIED TO JOINT
FIGURE 30. SUPERPOSITION OF LOAD CONDITIONS
i

Since the subgrade in the prototype tests was con-structed unier tight control, it was further assumed thattha strength of the subgrade, as expressed by the k param-eter, was unifolrm throughout thc traffic lane. In linewith this a-sorption, any variation in the "average deflec-tion" patterns (becween that at the end joint and that atthe ccnter of panel) might then be taken as a measure ofthe dc.-re. to which the end joint provi.ed moment transfer.
The mat-soil model developed earlier was employed tosimulate the "average. deflection" patterns at the end joints.The k parameter was assigned the values, Table 13, Column 5,which resu].'d in a minimum of the error functional for theprevious simulation of the "average deflection" patterns atthe center of the panel. These k values were used to excludeany inherent errors in Eqns. (13) and (14). The parameter ywas permitted to vary with coverages in accordance withEqn. (15).
Postulating the validity of superposition, Figure 30,two distinct steps were followed to simulate the "averagedeflection" pattern reported in the vicinity of an end joint.Initially, the mat was considered to be of infinite extentand devoid of any joints. Actual wheel loads were applied
M1 symmetrically about what would be the location of an endjoint. The moment developed in the mat at the location ofth: fictit! - end joint was then computed in addition tothe deflections of the nine or more discrete points used tocharacterize the "average deflection" pattern. Next, themat was considered to be hinged and a concentrated momentwas applied at the end joint, Figure 30(c). The mathematicaldevelopment for this condition is given in Appendix E. Thedeflections of the mat under the action of the concentratedmoment loeding were determined and algebraically added to
J the deflections of the mat wherein complete continuity ,,asassumed. Sinulation of the "average deflection" patternwas achieved by increasing incrementally the magnitude of[ the concentrated moment until the error functional, Eqn.(D2), was a minimum. The increment size was taken as onepercent of the moment which existed at the fictiious jointin the infinite beam. The deficiency of moment transferacross the end joint was taken as the ratio of the magnitudcof the concentrated moment to the moment in the assumedinfinite beam. These deficiency percentages are listed inthe last column of Table 13.
90

Table 13
EnC Joint Noment Transfer Deficiency Based
Upon Uniform Subgrade Conditions
Sect. Lane Item Coy. k-pci Deficiency %
1 1 3 0 54.1 1.20 41.4 1.
200 41.4 1.300 46.0 1.
1 2 3 0 52.5 337.20 43.5 158.40 39.8 197.
2 3 1 0 38.4 107.200 28.8 187.600 28.7 271.
2 3 2 0 42.6 531.120 57.4 2896.200 30.3 711.
2 4 1 0 19.9 72.20 16.5 122.
2 4 2 0 33.0 246.20 32.2 155.
3 5 1 0 17.7 1427.30 13.2 504.
3 5 2 0 23.5 104.30 19.2 1.
3 6 1 0 12.3 1.20 10.5 1.
t 76 15.0 1.156 13.9 1.
ue3 6 2 0 21.8 78.
20 15.9 32.[ 76 18.4 41.
6 1A 1 0 32.1 73.
l. 20 27.0 59.130 28.4 64.
91

Table 13 (cont'd.)
Sect. Lane Item Coy. k-pci Deficiency %
6 1A 2 0 48.8 1.20 38.0 68.
130 32.6 47.
6 12 1 0 21.6 48.20 IS.5 28.90 21.6 1.
6 12 2 0 60.0 134.20 34.1 53.44 34.3 79.
9 21 1 0 18.9 85.20 15.6 16.
200 12.6 8.300 11.3 16.
9 21 2 0 29.1 61.20 26.7 106.200 25.9 175.300 21.8 186.
9 22 1 0 13.9 1.20 15.3 1.
400 9.6 1310.
9 22 2 0 16.8 105.20 16.8 71.
100 16.8 1.
10 23A 1 0 42.9 1.32 32.9 1376.
10 23B 1 4 32.1 1 .
92

F£r many coverage levels the percentage of momentdeficiency was found to be greater than 100; obviously, theselected ass"-nntions %,ere in error. It wlas apparent forthese cases that e,.'en a perfect hinge could not accountmathe.ntatically for variations in the "average deflection"patterns.
To ex amine the assumption of uniform support (asc.esre s.a Ly a an-ciuc I paraletcr), the "average deflection"patterns for the end joints were again simulated by themat-soil model assuming an infinite beam and that no jointsexisted. A new value of the 'A parameter was obtained fromthis simnlation. A comparison of these k values, denotedby k , with those obtained from the simulation of the"average deflection" patterns at the center of the mat ele-ment can be had from Table 14, Columns 5 and 7. It may beobserved that, in general, the difference in the k valuesis not large; however, they are large enough to influencethei magnitude of deflections because of the great sensi-tivity of the model to this parameter, particularly atrelatively low values of k. The respective simulationerrors for the continuous mat analysis are also given inTable 14. A comparison of these errors indicates thatconsiderably better simulation of the end joint "averagedeflection" patterns were achieved by using ke .
Values of k , like those of k, were found to decreasewith the number Sf coverages. More importantly, the valueof ke at any coverage level was found, with only very fewexceptions, to be less than that of the corresponding k.This tends to indicate, as was noted previously in Eqn.(13), that the mat and subgrade in the vicinity of the endjoints effectively experienced more coverages (in the sensethat more energy was applied).
One might speculate on the nature of the behavior at ajoint. The difference in the values of k and k at zerocoverages could be attributed, in part, to the inherentslack generally found in end joint connections necessary topermit such connections to be made under field conditions.Also, high stress concentrations are undoubtealy developedin the connectors which could produce local yielding of thematerial. A strong case can be made for the latter pointby examining the distress exhibited by the end joints inthe photographs accompanying the Corps of Engineer's reports[9, 10, 123.
93
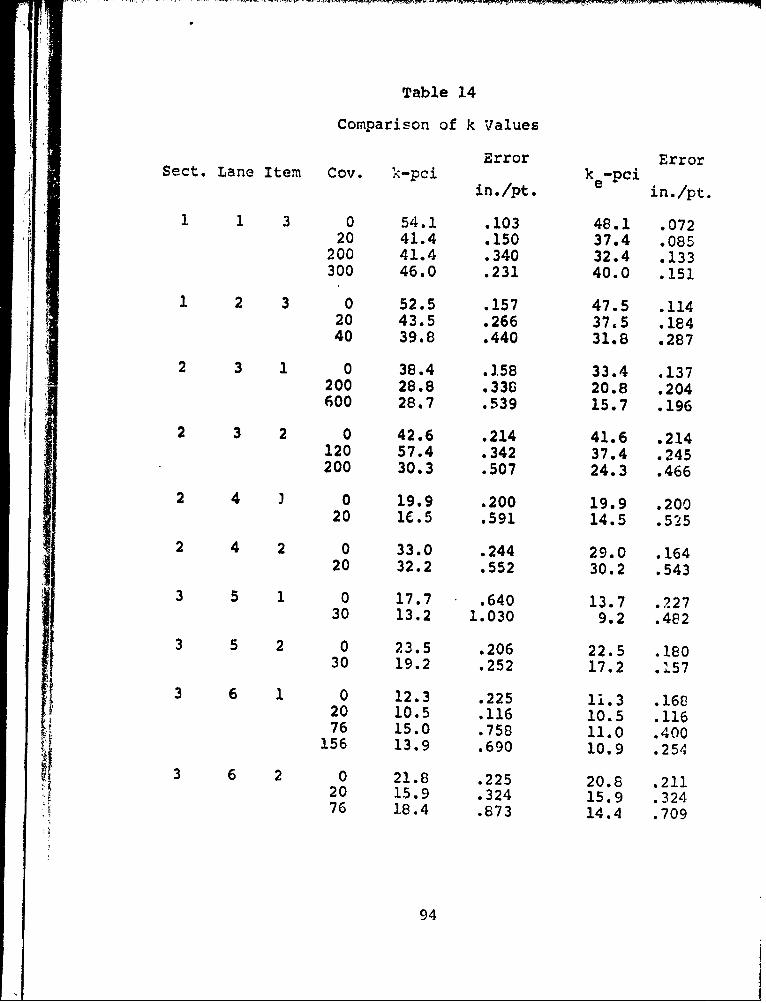
Table 14
Comparison of k Values
Error ErrorSect. Lane Item Coy. k-pci ke-pCiin./pt, in./pt.
1 1 3 0 54.1 .103 48.1 .07220 41.4 .150 37.4 .085
200 41.4 .340 32.4 .133300 46.0 .231 40.0 .151
1 2 3 0 52.5 .157 47.5 .11420 43.5 .266 37.5 .18440 39.8 .440 31.8 .287
2 3 1 0 38.4 .3.58 33.4 .137200 28.8 .338 20.8 .204600 28.7 .539 15.7 .196
2 3 2 0 42.6 .214 41.6 .214120 57.4 .342 37.4 .245200 30.3 .507 24.3 .466
2 4 1 0 19.9 .200 19.9 .20020 1.5 .591 14.5 .525
2 4 2 0 33.0 .244 29.0 .16420 32.2 .552 30.2 .543
3 5 1 0 17.7 .640 13.7 .22730 13.2 1.030 9.2 .482
3 5 2 0 23.5 .206 22.5 .18030 19.2 .252 17.2 .157
3 6 1 0 12.3 .225 11.3 .16820 10.5 .116 10.5 .11676 15.0 .758 11.0 .400
156 13.9 .690 10.9 .254
3 6 2 0 21.8 .225 20.8 .21120 15.9 .324 15.9 .32476 18.4 .873 14.4 .709
94

Table 14 (Cont'd.)
Error Error
Sect. Lane Item Coy. k-pci in./pt. ke-pCi in./pt
6 IA 0 32.1 .211 27.1 .15220 27.0 .210 24.0 .181
130 2E.4 .261 23.4 .175
6 IA 2 0 46.8 .167 48.8 .167
20 36.0 .273 38.0 .273
130 32.6 .210 32.6 .210
. 12 1 0 21.6 .427 21.6 .427
20 18.5 .395 18.5 .39590 21.6 .362 17.6 .137
6 12 2 0 60.0 .216 53.0 .202
20 34.1 .240 30.1 .204
44 34.3 .232 34.3 .232
9 21 1 0 18.9 .259 13.9 .06920 15.6 .085 14.6 .059
200 12.6 .152 12.6 .152300 11.3 .201 11.3 .201
9 21 2 0 29.1 .119 25.1 .096
20 26.7 .223 23.7 .211
200 25.9 .411 18.9 .348
300 21.8 .422 18.8 .409
9 22 1 0 13.9 .439 10.9 .199
20 15.3 1.034 8.3 .290
400 9.6 2.160 4.6 .734
9 22 2 0 16.8 .213 15.8 .200
20 16.8 .190 15.8 .172
100 16.8 .395 12.8 .173
10 23A 1 0 42.9 .252 36.9 .206
32 32.9 .650 24.9 .761
10 23B 1 4 32.1 .668 32.1 .668
L 95

In general, k decreased more rapidly with~coveragesthL.n h (7able 15, eoltans 5 and 6). This behavior is notsurprisi licJ- in l] test sections the mats in thevicinity of the end joint expcrience6 progressive eeteriora-tion uc '-o - con:r ;itaticn oL mat breaks (rivet filure,cracking, an. curling) [l21. The weakened mat evidentlyIosse iLs effectiveness and the underlying subgra6e issujcCe, tu hi;ho- :nrgy 1lels. Thus in the vicinityof the end joint, the subgrade experiences larger sheardeformations an considerably itore remolding than in otherlouatiow-:.
Regardless of the exact nature of the behavior of the
end joints, a measure of their effectiveness might followfrom an examination of the ratios of k to k. Table 15,Column 7, provides a listing of these Fatios. Discountingthe differences in the error functionals, average valuesfor these ratios are 0.84 and 0.90 for the Tll and M8 matsrespectively. If credence can be placed upon the abovesupposition, it appears that the effectiveness of the endjoint connections is approximately 10 to 16 percent lessthan that of the mat elements. The foregoing results arenot in conflict with the observations of the Corps ofEngineers noted earlier (9]. Indications suggest that someincrease in serviceability can be achieved by furtherstrengthening of the end joint connector.
96

Table 15
Ratio of k Values Pf
ES3c t L r, e I t Cm' Coll k k/k (k )/(k) ( /N INT e N e INT e NN
1 1 3 0 1.00 1.00 .8920 .77 .78 .91
200 .77 .67 .79300 .85 .83 .87 i
12 3 0 1.00 1.00 .9120 .81 .79 .8640 .76 .67 .80
2 3 1 0 1.00 1.00 .87200 .75 .62 .73600 .75 .47 .55
2 3 2 0 1.00 1.00 .98120 1.35 .90 .65200 .71 .59 .80
2 4 1 0 1.00 1.00 1.0020 .83 .73 PI8
2 4 2 0 1.00 1.00 .8820 .95 1.07 .94
3 5 1 0 1.00 1.00 .7830 .75 .67 .70
3 5 2 0 1.00 1.00 .9630 c82 .76 .90
3 6 1 0 1.00 1.00 .
20 .65 .93 1.0076 1.22 .97 .74
156 1.33 .96 .79
3 6 2 0 1.00 1.00 .9620 .73 .76 1.0076 .84 .69 .79

Table 15 (Cont'd.)
Sect. Lane Item Coy. kN/kNT (ke)N/(keiNT (ke) ,
6 11A 1 0 1.00 1.00 .E520 .84 .89 .69
130 .69 .86 .836 11A 2 0 1.00 1.00 1.00
20 .78 .78 1.00130 .67 .67 1.00
6 12 1 0 1.00 1.00 1.0020 .86 .86 1.0090 1.00 .82 .82
6 12 2 0 1.00 1.00 .8920 .57 .57 .8944 .57 .65 1.00
9 21 1 0 1.00 1.00 .7420 .83 1.05 .94
200 .67 .91 1.00300 .60 .81 1.00
9 21 2 0 1.00 1.00 .8620 .92 .95 .89
200 .89 .75 .73300 .75 .75 .6
9 22 1 0 1.00 1.CO .7920 1.10 .76 .54
400 .69 .42 .489 22 2 0 1.00 1.00 .94
20 1.00 1.00 .94100 1.00 .81 .76
10 23A 1 0 1.00 1.00 .6632 .77 .68 .76
10 23B 1 4 1.00 1.00 1.00
98

I I l | i i . • . ... .. . . ... . . .
SUGGESTIONS FOR FUTHER RESEARCH
Based upon the results of this study, the followingsuggestions for future study are presented:
I. A study should be undertaken to establish a basicunit for defining a single coverage: one whichis not test dependent.
2. it is urged that a comprehensive study be conductedto investigate the full capabilities of the asym-metric load model described herein. Althoughlaboratory testing of isolated subgrade samplessubjected to repetitive loads would be of value forsuch a study, a test series, smaller in size thanthe conventional prototype tests, could providemeaningful data for the determination of the modelparameters. Necessary information to establish thetime duration for the applied load, could be ob-tained by installing a continuously monitored loadcell at tho subgrade surface of a conventionalprototype test.
r
99

SUMMARY AND CONCLUSIONS
Two mechanistic models have been developed to simulatethe behavior of landing mat systems. The first model, whichis based upon elastic theory, was shown to be capplle of dup-licating the action of such systems under static loads witha reasonably low degree of error. Numerical values forparameters entering the model were obtained from the simu-lation of prototype deflection patterns. Values of the k
parameter, the subgrade modulus, were found to be less than51 pci. at the start of the prototype tests. The magnitudeof this parameter was then found to decrease as traffickingprogressed. It is particularly noteworthy that contrary toprevailing opinion, model behavior is extremely sensitiveto the magnitude of the subgrade modulus.
Empirical relationships were developed which relatedtest properties to all model parameters. Use of these re-lationships along with the failure criterion establishedherein indicated that the performance of dual-wheel testscan be predicted with a reasonable degree of confidence.Apparently, the developed procedure is less satisfactorywhen employed for the prediction of single-wheel tests.There is a strong indication that the variability of thenumber of passes necessary to complete one coverage in thelatter case may be a prime factor influencing performance.This is particularly true as input energy level per cover-age can be quite different for seemingly similar situations.
It appears that the effectiveness of the end jointconnections is approximately 10 to 16 percent less than thatof the mat elements. Indications suggest that some increasein the serviceability of a landing mat system can be achievedby strengthening the end joint connectors.
The second mechanistic model developed is capable cfsimulating actual loading sequences and can also provide ameans of estimating residual deformations of the mat surface.The potentialities of this model were demonstrated for bothsingle-wheel and dual-wheel prototype tests. Lacking ade-quate experimental information the full capabilities ofthis model could not be examined in this study.
100

LIST OF REFERENCES
1. Barden, L., "Distribution of Contact Pressure underFounJitioas, " Geotechnicue, Vol. 12, No. 3, September,1962, pp. iI-196. ..
2. Barden, L., "Approximate Solution for Finite BeamsResting on Elastic Soil," Civil Engineering and PublicWorks Review, Vol. 57, No. 676, November, 1962, pp.1429-1433.
3. Barksdale, R. D., "Elastic and Viscoelastic Analysis ofLayered Pavement Systems," Ph.D. Thesis, Purdue Univer-sity, Lafayette, Indiana, 1966.
4. Biot, M. A., "Bending of an Infinite Beam on an ElasticFoundation," Journal of Applied Mechanics, Transactionsof the ASME, Vol. 59, 1937, pp. Al-A?.
5. Black, W. P. M., "The Calculation of Laboratory andIn-Situ Values of California Bearing Ratio from BearingCapacity Data," Geotechnicue, Vol. 11, No. 1, March,1961, pp. 14-21.
6. Burmister, D. M., "The Theory of Stresses and Displace-ments in Layered Systems and Applications to the Designof Airport Runways," Proceedings of the Highway ResearchBoard, Vol. 23, 1943, pp. 126-144.
7. Cheung, Y. K., Discussion of Paper by L. Barden, "Dis-tribution of Contact Pressure under Foundations,"Geotechnigue, Vol. 13, No. 1, March, 1963, pp. 14-21.
8. Corps of Engineers, U. S. Army, "Development of Tenta-tive CBR Design Curves for Landing Mats," MiscellaneousPaoe__ r No. 4-29, Waterways Experiment Station, Vicksburg,Miss., Eecember, 1952.
9. Corps of Engineers, U. S. Army, "Theoretical Landing
Nat Studies," Technical Memorandum No. 3-418, WaterwaysExperiment Station, vicksburg, Miss., October, 1955.
t101

10. Corps of Engineers, U. S. Army, "Criteria for DesigningRunweys to be Surfaced with Landing Mat and Membrane-Type M'1terials," Thn'ca. Rep'ort No. 3-539, WaterwaysL::perimeni 6tatioi, Vicki-burg, i April, 1960.
11. Corps of Engineers, U. S. Army,, "Engineering Tests ofTlxperimzuntal T31 Aluminum Airplane Landing Mat," Tech-nic?] R.ort Wo. J-63-1, ;aterwayc Experiment Station,
Vicksbur9, i September, 1963.
12. Corps of Engineers, U. S. Army, "Aircraft Ground-Floata-tion Investigation," Technical Documentary ReportAFFDL-TDR-ki6-13, Part I, II, III, IV, V, VII, X, XI,XII-- 7r Force Flight Dynamics Laboratory, Wright-Patterson Air Force Base, Ohio, 1966.
13. Davis, E. H., and Taylor, H., "Tha Surface Displacementof an Elastic Layer due to Horizontal and VerticalSurface Loading," Proceedings, Fifth International.
pi Conference on Soil Mechanics and Foundation Engineering,Vol. 1, Paris, 1961, pp. 621-627.
14. DeBeer, E. E., "Computation of Beams Resting on Soil,"Proceedings, Second International Conference on SoilMechanics and i oundation EI neering, Vol. 1, Rotterdam,1948, pp. 119-121.
15. DeBeer, E. H., "Tests for the Determination of theDistribution of Soil Reactions underneath Beams Restingon Soil," Proceedinis, Second International Conferenceon Soil mechanics and Founcation Engineering, Vol. 2,
16. Drapkin, B., "Grillage Beams on Elastic Foundation,"Proceedings of the ASCE, Vol. 81, No. 771, August,1955, pp. 771:1-771:19.
17. Filonenko-Borodich, M. 1., "Some Approximate Theoriesof the Elastic Foundation," Uchenyie Zapiski :voskovs),oZoGosudarstvcnnoo Universiteta e'khanica, No. 46, 1S40,pp. 3-18, (in R~ussian) .
16. Florin, V. A., "Analyses of Foundations for Hydro-Engi-neering Structures," Raschety Osnovan.i Gidrotekhnich-
kikh Sooruzhenii, Stroiizuat, l9'4b.
19. Foppl, A., Vorlesungen uber technische Mechanik, Vol.5, B. G. Teuber, Leipzig, 1922, pp. 20-22.
102

20. Freudenthal, A. M., and Lorsch, H. G., "The InfiniteElastic Benra on a Linear Viscoelastic Foundation,"Journal o thc Engnincorin- Mechanics Division, Procc6-
of t . Vol. £3, No. E;41, January, 1957, pp.
21. Gis, D. C., "A.nalycis of Finite Beams on Elasticz) Jvns, " Journal of the Structural Division, Pro
$of "!.ja o e , C:, Vol. 84, No. ST4, July, 1956,
22. Gorbunov-PosaCov, 14. I., Beams and Plates on an ElasticBase, Lioiizat, ".ioscow, l 9.
23. Gorbunov-PEsaCov, 14. I., and Serebrjanyi, R. V., "Designof Structures on Elastic Foundations," Proceedings,Fifth Internetional ConZerence on Soil Mechanics andFoiiCdation Z ia ing, Vol. 1, Paris 1961, pp. 643-648.
24. Harr, M. E., and Leonards, G. A., "Analysis of ConcreteSlabs on Ground," Journal of the Soil Mechanics andFoundations DivisifonProceedings of the ASCE, Vo. 85,No. SM 3, June, 1959, pp. 35-58.
25. Hayashi, K., Theorie des T auf elastischer Unter-laj, J. Springer, Berlrn, 1921, pp. 31-33.
26. Heteni, M., Beams on Elastic Foundations, The Universityof %Richigan Press, Ann Arbor, 1946.
27. kios]in, B. C., and Lee, E. H., "Flex ible Surfaces onViscoelastic Subgradec," Journal of th' EngineeringMechanics Division, rroceedingjs othe--Asc-, Vol. 15,No. 144, OctoLr, 1959, pp. 11-30.
26. Kerr, A. D., "Viscoelastic Winkler Foundation with Shear
Interaction," Journal of the Fnineerinq mechanic:
Division, Procee6ings of the AiSCE, Vol. 67, No. EM
June, 1961, pp. 13-30.
29. Klepikov, S. N., "Calculation of Beams on an Elastic
Foundation .ith a Variable Modulus of Subgrade Reaction,"Soil Mechanics and Foundationl Engineering, No. 5,
SeptCT=er-October, 1965, Consultants Bureau, New York,
pp. 296-299.
20. Kohr, R. I., "On the Identification of Linear and
Nonlinear Systems," Si;-ulation, Vol. C, No. 3, March,
1967, pp. 165-174.
103

31. Konder, R. L., and Krizek, R. J., "Creep ComplianceResponse of a Cohesive Soil," Jotrnal of the FranklinInstitute, vol. 279, No. 5, May, 1965, pp. 366-373.
32. Lanhair, J. L., Limensional Analysis and Theory ofMol'els, Wiley, New York, 1951.
33. Larew, H. G., aicd Leonards, G. A., "A Strength Criterionfor Repaate Loads,," 'Proceedings of the Highway Research
Board, Vol. 41, 1962, pp. 529-556.
34. Lee, I. K., "Elastic Settlements of Footing with RoughInterface," 1'roceedinqs, Fourth Australia-New ZealandConference on Soil Mechanics and Founcation Engineering,August, 1963, pp. 225-232.
35. Lemcoe, M. M., "Stresses in Layered Elastic Solids,"Journal of the Engineering Mechanics Division, Proceed-ings of the ASCE, Vol. 86, No. Et44, August, 1960, pp.1-22.
36. Lenczner, D., "Variation of Subgrade Modulus with Depthof Sand," Civil Engineering and Public Works Review,Vol. 57, No. 667, February, 1962, pp. 210-212.
37. Leonov, M. Ia, "Consideration of Horizontal Forces inthe Analywis of an In~i~iite Plate on the Elastic Half-Space," Prikl Mat. Mekh., Vol. 3, No. 3, 1949.
38. Malter, H., "Numerical Solutions for Beams on ElasticFoundations," Transactions of the ASCE, Vol. 125, 1960,pp. 757-791.
39. Murphy, G., Stresses and Deflections in Loaded Rectangu-lar Plates on Elartic Foundations, Bulletin 135, IowaEnglineering EXperiment Station, Ames, 1937.
A 40. Noble, B.. "The Exploration of Functional Relationships- An Aspect of Optimization," Applications of Under-graduate Mathematics in Engineering, MacMillan, NewYork, 1947.
41. Panchanathan, S., and Chandrasekaran, V. S., "S udy ofContact Pressure Distribution below SymmetricallyLoaded Rectangular Footings," Journal of Scientific andIndustrial Research, Vol. 21D, No. 10, October, 1962,pp. 356-361.
104

42. Pasternak, P. L., "On a Method of Analysis of an ElasticFoundation by Means of T qo Foundation Constants,"Gosuedarstvennoe Izadatelstvo Literaturi M Stroitelstvui Arkhitekture, Moscow, 1954, (In Russian).
43. Pickett, G., et al., "Deflections, Moments, and ReactivePressures for Concrete Pavemxnts," Kansas State CollegeBulletin No. 65, Manhattan, Kansas, October, 1951.
44. Pickett, G., "Analytical Studies of Landing Mats forForward Airfields," Final Re rt to Corps of Engineers,Waterways Experiment Station, Vicksburg, Miss., December,1951.
45. Pickett, G., "Analytical Studies of Orthotropic LandingMats for Forward Airfields," Miscellaneous Paer No.4-113, Corps of Engineers, Waterways Experiment Stataon,Vicksburg, Miss., February, 1955.
46. Pister, K. S., "Viscoelastic Plate on a ViscoelasticFoundation," Journal of the Engineerina MechanicsDivision, Proceedings of the ASCE, Vol. 87, No. EMl,February, 1961, pp. 43-54.
47. Pister, K. S., and williams, M. L., "Bending of Plateson a Viscoelastic Foundation," Journal of the Encineer-i Mechanics Division, Proceedings of the ASCE, Vol.86, No. EMS, October, 1960, pp. 31-44.
48. Popov, E. P., "Successive Approximation for Beams on anElastic Foundation," Proceedings of the ASCE, Vol. 76,No. 18, May, 1950, pp. 18:1-18:13.
49. Portland Cement Association, Concrete Pavement Design,Portland Cement Association, Chicago, I1l., 1951, p. 11.
50. Portland Cement Association, PCA Soil Primer, PortlandCement Association, Chicago, Ill., 1962, p. 36.
51. Ray, K. C., "Influence Lines for Pressure Distribution- under a Finite Beam on Elastic Foundations," Journa of
American Concrete Institute, Vol. 30, No. 6, December,1958, pp. 729-740.
•52. Reissner .E, "A Note on Deflections of Plates on a
viscoelastic Foundation," Transactions of the ASME,
Vo]. 25, No. 1, March, 1958, pp. 144-145.
105

53. Schapery, R. A., "A Method of Viscoalastic StressAnalysis Using Elastic Solutions," Journal of theFran hur. Institute, Vol. 27, No. 4, April, 19 5,pp. 26L-2b9.
54. Schapery, R. A., "Stress Analysis of ViscoelasticComposite Material.," Jolurnal of Composite :-aterials,vol. 1, No. 3, July, 1.67, pp. 22E-267.
55. Schapery, R. A., "On the Application of a ThermodynamicConstitutive Etuation to Various Nonlinear Materials,"Renort AA and AES E0-4, Purdue Research Foundation, WestLafayette, Inian-, June, 196.
56. Schiel, F., "Der Schwimmende Balken," Zeitschrift furangewandte Mathematik und Mechanik, Vol. 22, 1942.
57. Schultze, E., "Distribution of Stress Beneath a RigidFoundation," Proceedings, Fifth International Conferenceon Soil Mechanics and Foundation Engineering, Vol. 1,Paris, 1961, pp. 807-813.
58. Singh, A. and Mitchell, J. K., "General Stress-Strain-Time Function for Soils," Journal of the Soil Mechanicsand Foundations Division, Proceedings of the ASCE, Vol.94, No. S41, January, 1968, pp. 21-46.
59. Sinitsyn, A. P., Computations of Beams and Plates onElastic Bases for Limiting Elasticity, Stroizdat,Moscow, 1964, (In Russian).
60. Sovinc, I., "Stresses and Displacements in a LimitedLayer of Uniform Thic'Kness, Resting on a Rigid Base,and Subjected to an Uniformly Distributed Flexible Loadof Rectangula Shape," Proceedings, Fifth InternationalConferL,ce on Soil Mechanics and Foundation Encincering,Vol. 1, Paris, 1961, pp. 823-[327.
61. Stepwise Regression, BMD2R, Computer Science Center,Purdue University, Lafayette, Indiana, December, 1965.
62. Terzaghi, K., "Evaluation of Coefficients of SubgradeReaction," Geotechnique, Vol. 5, No. 4, December, 1955,pp. 297-326.
106

0
63. Vlasov, V. Z., and Leont'ev, N. N., Beams, Plates, andS,-:els on an Zlastic Fouindati3n, (Translated from-Russian), Israel Program for Scientific Translations,Jerusalem, 1966.
04. Toste.aard, III. M., "Stresses in Concrete PavementsCoputed by Theoretical Analysis," Journal of Pu-liRoads, Vol. 7, No. 2, 1926, pp. 25-35.
65. Westergaard, H. M., "New Formulas for Stresses inConcrete Pavements of Airfields," Proceedins of theASCE, Vol. 73, 1947, pp. 687-701.
66. Wilde, D. J. and Beighter, C. S., "Direct Climbing,"Foundations of Optimization, Prentice-Hall, New Jersey,1967, pp. 288-313.
67. winkler, E., Die Lehre von der Elasticitaet andFestigkeit, Dominricus, Prag., 1867.
68. Yoder, E. J., Principles of Pavement Design, Wiley,New York, 1964.
69. Zhemochkin, B. N., Practical Method of CalculatingFoundations, Beams, an Plrtes on Elastic Bases, Gos.Izd. Lit. Stroit., Arkh. i Stroit. Mater., Moscow,1962, (In Russian).
70. Zimmermann, H., Die. Berechnung des Eisenbahnoberbaues,Berlin, 1888.
107

APPENDIX A
V.R7hTION .L LCTHCD OF ANALYSIS FOA ELASTIC FOUlDAWTIO!S
She variational method of analysis for elastic founda-tions presented here was developed originally by Vlasov and5Leont'ev [63]. Dve to the limited circulation of thisimportant publication, a detailed formulation is given for
Ia single-layer foundation under plane strain conditions.
Consider a homogeneous, elastic compressible layer oZsoil of thickness H resting on a rigid base subjected toimposed loadings which produce conditions of plane strain,
Figure Al(a). Under such conditions if the horizontal andvertical displacements, respectively, u(x,y) and v(x,y), atall points are known, the stresses and strains ir. the soillayer may be obtained from established strass-stzain rela-tionships. Following Vlasov and Leont'ev, the vnknown dis-placements will be taken as 'he finite series
U(x,y) - it JUi (x) y) (i = 1, 2, 3,...m) (Ala)
nv(x,y) = I Vk(x)4 k(y) (k = 1, 2, 3,...n) (.k
k= I
Here it is assumed that the functions #. (y) and * (y), whichrepresent, rcspectively, the distributi6n of the iplacementsu(x,y) and v(x,y) over any section x = constant, are eitherknown or may be assigned. With ft(y) and *k(y) establishedas dimensionless functions, the £unctions U(x) and V1 (X)will have dimensions of length. The latter1 are seen torepresent the magnitude of the displacements u(x,y) andv(x,y) at the section x = constant.
r Once the form of the functions f (y) and *,(y) areestablished for a given physical problem the fuhctionsU.(x) and Vk(x) can be determined from equilibrium condi-tions relative to a differential strip of length dx, FigureAl(b), and the stress-strain relationships developed fromthe conventional theory of elasticity.
10l

Z p(Xly)/~ q(x,y)
M Mxy) U(z,y)
H TO
y ~ ~ Y' VXy)00
(a)
dxs+ d
(b)
FIGURE Al. STRESS STATE IN SOIL MASS.
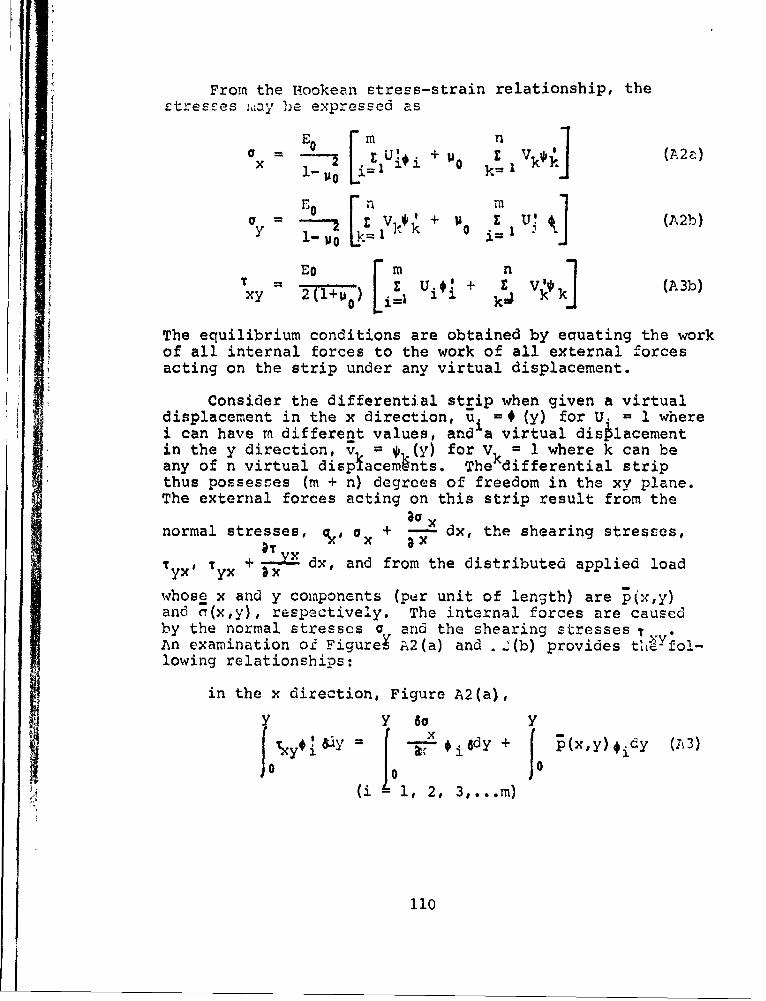
From the Hookean stress-strain relationship, thectresses ~y be expressed as
E 0,]a - U!,i +. E k*], (A2a)
0 ' + U! (A2b)y= 0 'Y- 1; " i "
EO Fm n 1z U 4 + z vl (A3b)
XY 2(1+ui0 [ i 1 kk
f The equilibrium conditions are obtained by equating the workof all internal forces to the work of all external forcesacting on the strip under any virtual displacement.I, Consider the differential strip when given a virtual
displacement in the x direction, u =# (y) for U. = 1 wherei can have m different values, and a virtual disblacementin the y direction, v = * (y) for V. = 1 where k can beany of n virtual dispfacemnts. The differential stripthus possesses (m + n) degrees of freedom in the xy plane.The external forces acting on this strip result from the
anormal stresses, f, a + -- dx, the shearing stresses,
Tyx' Tyx + x dx, and from the distributed applied load
whose x and y components (per unit of length) are (.x,y)and c(x,y), respectively. The internal forces are causedby the normal stresses a and the shearing stresses >'.,An examination oi Figure A2(a) and .-'(b) provides te fo!-lowing relationships:
in the x direction, Figure A2(a),
= x +0 y
iXY "- X #i6dy J (x,y)¢dy (A3)
10 0 10
S(i - i, 2, 3,,,,m)
110

in the y direction, Figure A2(b),y I8T
6dy 6dy ((Xy)* dy (A4)
(k = 1, 2, 3,...n)
Substitution of Eqns. (A2) into Eons. (A3) and (A)
leads to a system of ordinary differential equations in
U. (x) and V, (x). This system consists of (m + n) equa-
tions and caR be expressed as
m (m-) m n 1-Pa O-iaa U'1- - b .U,+ b t 0
~ij 2 ii i ~~ ~ k 0 h
(A5a)
(j 1 1, 2, 3,...m)
2
n (1-N0) \(1-1' ) n so (-ia)(Viot - - ) U!+ t+- r tk= I hl k k%4hkUk+ EF-1hh.ti" -- Cil2 E k rhkv hk" E *h
(A5b)
(h = 1, 2, 3,...n)
where the coefficients are obtained from the following
a j ¢.4 6dy ; r hk = Oh,6dy (A6a)
bij =*.¢*6dy ; Sh = I 6dy (A6b)
ci j =l # 6dy Chi f h! 6 dy (A6c)
tk = dy; thi J hk dy (A6d)
*. (x )dy; ar h (xly)*h dy (A6e)
where the loads j(x,y) and (x,y) are taken as positive when
acting in the positive direction of the coordinate axis.
1311

q (xy)
Iy +yxd xdax dy ,tx TY - Tx
Ix
(a)(b
FIGURE A2. DIFFERENTIAL ELEMENTSOF SOIL MASS.
- x
'Eo Po>
7 7n117117, /71/// 7 777 7
FIGURE A3. DISPLACEMENT OF SOILSURFACE.

The applied loads p(x,y) and (x,y) are assumed to bedistributed over the plate height as arbitrary functions of Iv, Iiwever. if only exLernal normal and shearing forces,
( a p(:;,O), act on the upper surface of the layer,t~ie C iimsp.. and qbecome
hI
p4 p(x)* (0) ; q= (x)*h(0) (A7)
The system of ordinary differential equations in U (x) andV I (x) obtained from Eqns. (A) can be solved to obtain theu Iknown displaccments for the plane strain problem.
If it is assumed that the horizontal displacements inthe compressible layer are either zero or are negligible#. (y) = 0, the displacements u(xy) and v(',y) can beekpressed as
u(x,y) 0 (A8a)
nv(x,y) -5 VW(Y) (ABb)
The system of Eqns. (A5) reduces to
2- h 0 (A9)2 rhkVk(x) -hkxk +k
where
r = 6lk dy ; Shk *,6 dy (AlO)rhk k
Also assuming that tile base of the elaslic layer is fixed tothe rigid base; that is, there is no slip at the interface,the displacement function v(x,y) becomes
v(x,y) = V (x) (y) (All)
113

and the function VI (x) represents the deflection of thefoundation lyer surface as illustrated in iigurc A3. ThislJest asswution u'ecb tot procuce a moC'el with a uniquc solu-Ljao a-- L , _'.ion (y) may be selected inany bit_ary 4.Rnncr przvid d . that * (P) = 0.
lhe iois -ssurnption of a fi:;ee basc, Eqn.(,9) r,.C-cc to th_ sincle ciffcrer.tial ecuation
I- 0 Xi- 10 2- -- 5,V"(x) -s vI (x) + - --q 0 (;12)1.11 111E
0
where2 H ,
r = *18 dy sl-= (AAY
Eqn. (Al2)Emay be further simplified by multiplying each
term by -- to yield,(l i0)
2tV" (x) - kVI (x) + q(x) = 0 (A14)
where
iO r:o I Eo 0 s 1t - k 1 (A15)
00and r and s are defined by Eqns. (A13).
Differential equation (A14) defines a model whereby thevertical displacemcnts of the surface of the soil are re!z t2c'to the load a-plied on the surface. This rmoCel not only con-siders the co.1pressive strains in the elastic foundeation butalso the shearing strains within the foundations.
With the displacements of all points expressed by Ean.(All) and employing the stress-strain relationships of theclassical thcory of elasticity the normal and shearingstresses may be obtained from Eans. (AS) as
114

" V (Y) (Al6b)
1 (Al6c)y:: (I 7(-) v', (Y)*, (Y) (Ic
Seli-cting any Eection x = constant, the total force T in the~H
direction is given by Ti Hx a *idy (i = 1, 2, 3,...m)I0
and the total force in the y direction is given by
s h = Oyxh6dy (h = 1, 2, 3,...n). Pleading the assump-
tion of negligible horizontal displacements and applyingEqn. (Al6c) there results
T f0axi d y m o (Al7a)
H E06 H 2 (y) dy = 2tV' (x) (Al7b)
If yx '18dy 2(1+u V(0) 10 1
The foundation model is now completely defined once thedimensionless fu:.ction * (y) has been established.
115

APPENDIX B
iI II;~iZBA-"C4 ON AN; EI;MSIC -OU-_ZDr2ICN
Superimpose on the surlace oJ7 the soil model, asdtfillCw iA :..6n".. A, an infinitely long beam which obeysEulerian coiiditions. Let p(x) represent the applieG normalload on the beam, q(x) represent the reaction due to theelastic Zoundation and V(-) represent the beam deflection.The bending of the beam will be described by (63J
= p(x) - (Bl)
dx
In Appendix A the relationship
2t V(x) + kV(x) = q(x) (B2)dx
was developed to relate surface deflections of the soil tosuperficial loads. Assuming that the beam and the soil arealways in contact, Eqns. (Bl) and (D2) can be combined byelimination of the interfacial normal force a(x), to yield
4EI d -~x 2t 2 x + kV(x) = pWx (B33)
dx 4 dx 2
Implicitly, this last assumption requires the developmentof normal tensile stresses across the beald-soil interface.Fortunately, any develop.nent of these stresses generally willoccur in a region somewchat removed from the load and willbe of small magnituce.
For computational expediency, Vlasov qnd Leont'ev
defined a non-dimensional coordinate, n = , as
11661~ 76 i(4

APPENDI; 1
rimxoJ on the surlacc o0 the soil model, asc i ,.n.J.; A, an infinitely long beam which obeys
Lulerian co1cd.tioLri. Let p(x) represent the applie. nor~ulload on the beam, q(::) represent the reaction due to theelastic fouudation and V(x) represent the beam deflection.The bending of the beam will be described by (63]
d4 p(x) - q(V) (BI)dx
In Appendix A the relationship
2t 4V(2X) + kV(x) = q(x) (B2)dx2
was developed to relate surface deflections of the soil tosuperficial loads. Assuiing that the beam and the soil arealwajs in contact, Eqns. (BI) and (B2) can be combined byelimination of the interfrcial normal force cy(x), to yield
El (,Vc) - 2t a + kV(x) = p(x) (B3)dx 4 dX 2
Implicitly, this last assumption requires the developmentof normial tensile stresces across the beam-Eoil interface.Fortunately, any develop.nent of these stresses generally -illoccur in a region soime'.!hat removed from the load and willbe of small roagnituoe.
For computational expedicncy, Vlasov gnd Leont'evdefined a non-dimensional coordinate, T1 = as
L 2I (I- lI = I6- (B4)
116

where E is Young's modulus of the beamI is the ro-ient of inertia of the beamED is Young's moulus of the soil
is roisson's ratio of the soil6i t:ic .- dth of the beam
Employin? tbe r.C onoimensional coordinate and dividing Ecrn.(D3) by t0 h _:m ri"idity, the governing differential ecua-tion is established as
d VWd +__dn 4 dn 2 El
where
2 l i2r 2 = 21uy (B6a)
'9HEL 2LJ 'l
s2 =kL. 2L H y(B6b)
If a cir.entrated force P, Figure B10 acts at the originof coordinates, the following homogeneous differential equa-tion is applicable for all points except tle origin
dn - 2r 2 + sV(j) = 0 (B)d, 2
The corresponding characteristic equation is
m - 2rm + s = 0 (Be)
As r and s are positive, the ratio r must be positive andthe solution of the characteristic 8cuation may take one ofthree forms depending on the relative magnitudes of r and s.The s:' tion of prime importance for the present study isobtain, for the condition when s > r. Physically, thiscondition implies that Lhe majority o the supporting capac-ity of the soil is developcd by normal stresses rather thanby the shearing stresses within the foundation. Close inves-tigation of Eqn. (,37) reveals that for the condition r = 0,the model becomes identica] to the one which employs theWinkler hypothesis. At the other extreme as s approaches
1{ 117
Ii

P El-I)
FIGURE BI1. CONCENTRATED LOAD ON MODEL.
b/L
dC-.. 2 El)
0 2 43
H 12
'773
T ~Eo , Ao
FIGURE 82. UNIFORM LOAD ON MODEL.

zero, the model becomes one for a beam supported by a mem-brzane. ;J1 further formulation is restricted to the condi-
S- s > r. 10 this conrditio,' the roots of the charac-teristic equation ara
m =+ +ji (B9)
ahere and B are real and positive
2+2 2 2S= 2L± ; = s-__ (Blo)2 2
The solution of Eqn. (B7) then has the general form
-; "- - in ;n +V( 4=C e sinIBT+C 2e CosPC 3e sirI +c e cosljn (BlI)
Due to symmetry only that portion of the beam for , 0need be considered. Since the deflection of the beam mustapproach zero as the nondimensional coordinate becomeslarge (i-.). the following must occur
C3 = C 4' 0 (B12)
The deflection equation, Eqn. (BIl), then becomes
v( ) C F + C F (B13)1 1 2 2
where
F e ansinh (Bl4a)I
F e-an coshn (Bl4b)2
The remaining constants C and C can be determined from the
conditions at the origin felatedto the slope and the shear.
Thus for n 0
e(0) d 0 (B15)
119

-FXrd V(.)- 2___r = L d0) 2r = -r' (BIG)
It ,holild be noted that the shear at any section iscornoke3 of two distinct components. The first tern. Eqn.(B16), result r o the shear force developed in the beam
'! ~s te , - : term arises Zrom the shear force develoge6in the soil. The latter term is expressed in integral form
in Eqn. (;.7b).
Substituting the appropriate derivatives of Ecn. (B13)into (cBs. (115) ind (Bl6) and solving for the constantsproduces
3PLC = PL. (Bl7a)
41s 2 EI
a PO (Bl7b)2 4;s2 EI
Thus the general equation for the deflection of the beamsubject to a concentrated load becomes
PL3 2 F () + F2 (1)] (B18)Qs El
Modification of Erin. (BI8) is necessary when uniformlydistributed loads are encountered. Referring to Figure B2,three expressions are developed for the beam deflectionwhich depend upon the location of the unifoirm load relativeto the point at which the deflection is sought. In thedevelopment of each expression a differential element 12used in conjunction with Eqn. (BlS) which is thep integratedover the length of the load. Thus for 0 c
V 3 C (N){(r2. [(a ,) - ( -, ) 2 [rf. - ri -F(.-
(Bl9a)
a bfor ( n< L
120

vin) -r2~ [F1 ( - F -
2 n[ 2 (n-) + (o% (B n.)
-- , (n 3 + 2-F
(Bl9c)
With the use of Eqns. (B19), the deflection of the beam atal) Pny point can be determined for a given uniform load. After
employing superposition, any number of upiform loads may behandled. The parameters j, 1, s ., and r are all functions
7b) of the displacement distribution function (y).
-18)
ly
B20
tive
rated
121

APPELDIX C
ST.;E VAI'IADL I FILTER FORXITICOI
The proceciura for identification of the model parameterspresented below follows Kohr [30].
From the data available from prototype tests [ 12 1 asystem (relationship) can be established between the knowninput and the resulting output. The form of this system hasbeen postulated as Eqn. (B3). For this system to reflectadequately the behavior of landing mats, the model parametersmust be representative of the test conditions.
By writing Eqn. (B3) as
d 4V d2Va* + b*V (Cl)EI
dx dx
whore2t ka* =--;b =kEI EI
separation of the unknown cuantities can be achieve.. Theterm on the right is exclusively input data; that is, loanconfiguration, expressed by step functions, and mat rigidity.
Let the "modcl residue", c, at a point be define as
=d 4V _* d2 INC = a =- + b*V - (C2)dx dx EI
and the error functional, f(c), for all points be defineuas
f (C) e d x (c3)
122

If V, 2V, and d can be obtained, then the "model residue"dx
and the error functional can be made a minimnum through thepogc.r sclctiz n e. * b*. "cn this occurs, a* an6 b*
ere cz!1z d -. "bzt E ti"atc r o the model parar eters.
&irvt- 1 ~2v . r, 4VThC Orivatives, znd 4 ecquired in Eqn. (C2) may
be t~n2 fro-I t>e ectual deflections by use of a statev~irUQ1],. ftcu [20 ]. For this operation, it was convenientto represent the "averag7e deflection" patterns by a continu-ous function rather than by a series of discrete points. Toobtain cflection as a function of position, the selectedpoints from the "average deflection" patterns were approxi-mated by a polynomial using a least squares technic'ue. Thecriterion ebtablished for the polynomial was that it approxi-mate the discrete points witnin a selected standard devia-tion of 0.05. For the three deflection patterns investigatedby this procedure, a sixth degree polynomial was found tosatisfy the standard deviation criterion. The polynomialthus obtained, denoted by , was established as the expres-sion for the test output and served as the forcing functionfor the state variable filter. Following Kohr, the statevariable filter employed was a differential eauation of oneorder higher than the highest derivative of the model. Thusthe filter selected was taken as
4V 3dcc dV + cV dV - (C4)
d 'V + + +q + +V4 dx 3 dx3 2 dx dx c
where the coefficients, q1 q2 q3 , and q , for this filter
were
q 3.297101
q = 4.895322 (5
q = 4.53948 (C5)
3
= 2.15678
These coefficients, called the Paynter filter coefficients,
were also given by Kohr (30]. Solution of Eqn. (C4) yieldedd *7 d2V
the values of c c and V Cdx4 dx2
123
, I

Once these values were known, they were substituted intoEon. (C2) and the error functional, Eon. (03), was minimizedby using the "descent ecuations" (30, 66]. These ecuationsfor a two pa;-amcter system are
d* _ K =_ 2K _L
dx a a* a F*(06)
dh* = K f (C) = - 2KbC Dedx b ab* - -b*
where K and k are arbitrary positive constants. Theseconstanes, called the "identification gains", stipulate thespeed at which the minimum is approached.
Noting from Eqn. (C2) that
Sc - d 2VC
aa* dx2
S = (c7)
and making the appropriate substitutions, the values of a*and b* are obtained by
dVca* =2K c dx
a L 2fL dx2
b* - 2KbILEVcdx (c8)
Solution of Eqns. (CS) was obtained by evaluating the inte-gral between the points of zero deflection and by conven-iently setting Ka and Kb eaual to 0.5.
124

APPENDIX D
STEEP DErSCNT METHOD
As dcmonstrated1 in Appendix B, the behavior of the mat-soil model is governed by an expression of the form
theoretical =( 0 ,) (Dl)
where EO and y are unknown parameters and G is the differen-tial equation, Eqn. (B5). The behavior of the prototypetests can be simulated by the model only if the parametersE o and y are representative of the test subgrade conditions.To determine E and y, a criterion is established as to
minimize the sam of the squares of the deviations of the
theoretical deflections from the experimental deflections.
As the "average deflection" patterns (12] have been definedby discrete points, let the error functional to be minimized
be defined as
n 2f c E (i 1, 2, 3,...n) (D2)
where c represents the deflection deviation at a discrete
point ant n is the number of discrete points. Equation (D2)
can be minimized by a "trial and error" procedure; however,
a more direct procedure, "steep descent method"[ 40, 66 ],
e. which is based upon the behavior of the error functional can
be employed.
Five combinations of E and y are selected in a manner
as to form a five point gri, Figure Dl, and the error
functional is computed for each combination. From this
grid a spatial surface is developed which reflects the
local behavior of the error functional. Assuming that the
error functional possesses a bowl-like surface in the
vicinity of the minimum a second order surface of the form
125
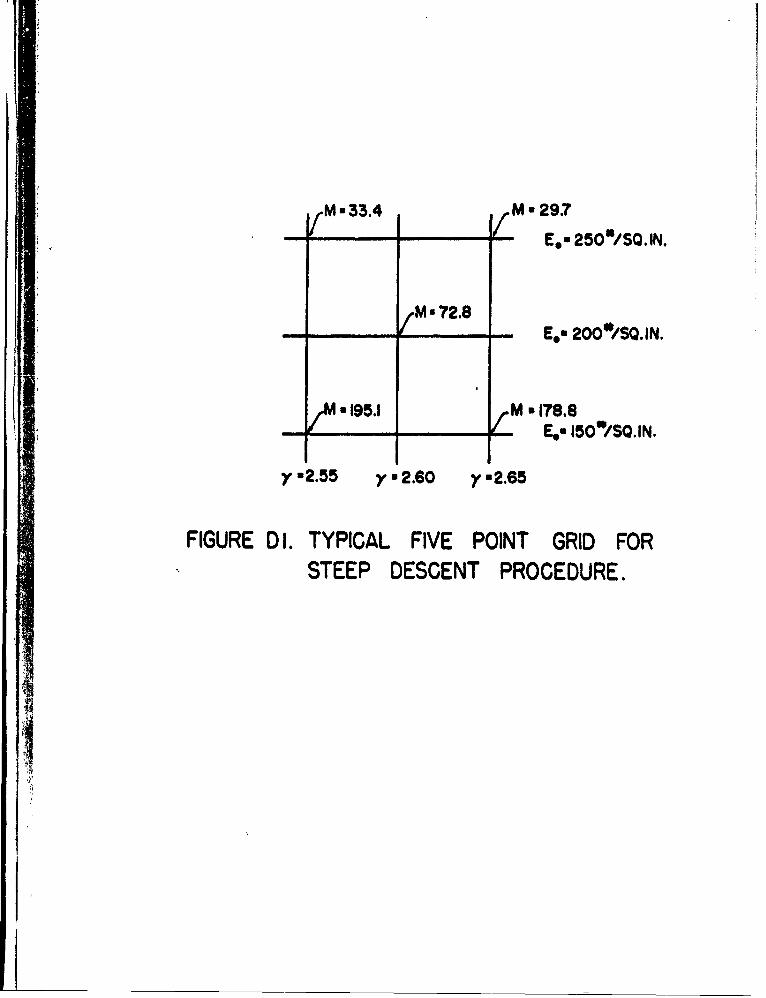
M*33.E4 / E25O'*/SQ. IN.
- M 728 -E~w 200/SQ.IN.
8195.1 vM a 18.8- M Ego__ __ _ _ - E 15O"1' .lN.
~2.55 y2.60 26
FIGURE D 1. TYPICAL FIVE POINT GRID FORSTEEP DESCENT PROCEDURE.

2
Z ay + 2hyE0 + b4 + 2gy + 2fE0 + c (D3)
is fitted to the uric. The influence of the quadratic terms,in ln. (13), 'ill become neglicrible in a region removedfro,., th? minimr' Fncd a pIane containing the central grid canauecuat. describe the local behavior of the error functional.The ecuction of this plane is taken as
Z = 2gy + M + c (D4)
where 9j and f are obtained from Eqn. (D3) and c is the valueof the error functional at the central grid point. The coef-ficients, g and f are determined in this manner so as toobtain the most representative plane. The direction of theline of maximum slope, steepest descent, in this plane isgiven by
tang = 2f (D5)2g
A minimum of the error functional will be rapidly attainedby proceeding in the I direction from the central gridpoint.
Reasonably small increments should be used when pro-ceeding along the steep descent line to avoid bypassing theminimun. Also, it is advisable to inl'6tiate the procedurefrom various locations on the error functional surface to
determine %hether the minimum obtained is global ratherthan local.
127

APPENDIX E
• . l:TFCRJ$FR I,-VESTIGA TION
TO facilitate tho corputation of the deflections of ahingeC beam, two c ci-infinite beams, one on each sice ofthe hinge, are loadc.d with a concentrated moment as shownin Figure El. Two distinct expressions are developed, onefor the deflection of the semi-infinite beam and the otherfor the exposed ground surface. The latter is necessitatedto insure the continuity of the soil media.
With reference to Figure El, it is apparent that Ecrn.(B7) is applicable for n > 0 and that the deflection forthis rcgion can be expressed by Eqn. (B13). The governingdifferential equation for the exposed foundation surfacefrom Eqn. (A14) for x < 0 is
2t d2 V(x) - kV(x) = 0 (El)dN 2
of which the general integral is
V(x) DI e- + De x (E2)
where
Api teonr(E3)
Applying the boundary condition that the deflection V(x)approaches Lero as x approaches minus infinity yields
120
128

I,
FIGURE El. MOMENT LOADING ON END OF
SEMI - INFINITE BEAM.

The deflection of the foundation surface for x < 0 is
V (x) = D e (E4)2
To determine the constants C , 2, of Eqns. (B13), and D2,the follo.:incj bounr.ry conaitions are used at the origin
v(-O) = v(o)
M - - v(0) (E5)L 2
N(-O) = N(O)
where N(-O) = 2tV' - 2,tD is the generalized shear at minuszero. Applying the first2of Eqns. (E5) produces
lD2 = C2 (E6)
From the second of Eqns. (E5) after substituting the seconddeviatives of the F functions, Eqns. (B14), at the originthere results
2 2
-- -- + r C 2 (E7)
where , j, and r2 are as defined in Eqns. (B6a) and (Bl0).The third boundary condition gives
2atD2 = - LYMd - d2r
3
Multiplying by -L /EI and making the appropriate substitu-tions for the derivatives ;: the F functions, EqnE. (B14),one obtains
3-2daL D2 =_ (2 2 2 22E L D; - )-2r 2] C +[i (3j 2 _2) +2r2,] C2 (E8)
130

From thc simultaneous solution of Eqns. (E6), (E7), and (E6),
hc iat~j cornsLtants are found to be
222 c EI 9is]
r
where 3
D{2(3;.2-2) + E;aLEI
2and s is as defined by Eqns. (B6b). Thus the deflectionfor the semi-infinite beam is given by
v() = C F + C F (E10)1 1 2 2(E)
and the deflection of the ground surface by
2V(x) = ML is 2 e -- (Eli)E ID
If the semi-infinite beam extends to the left of theorigin, the coorainate system is reversed and Eqns. (ElO)and (Ell) are then applicable.
13114111lllll

APPE401X F
CrI)PPUTER PR3GRAM FO PARAMETEA IDENTIFICATION
C *** * 4, ******#*********4*******4****41****4************4********* A j
C PARA'tETER IDENTIFICATION PROGRAM A 2C *1 * * *4* ****4**4***********************e***4*** *44*44*4*4*4* *4* *44* A 3C INFI'JITE BEAM 3N A VLAS3V A4D LFONTEV MO)EL A 4C UUW 'WARO OFFLETI3h IS TAKEN AS PUSITIVE A 5C *4*4**4*44*4*4e*44*44**4*e*****ee *****44*4*e*****4ee*ee*e4*** A 6C CEFINITION OF VARIABLES USE) A 7C KNK x NUMBER OF TEST SECTIONS TO) HE INVESTIGATED A 8C KNN a INTEGER CJIJNTFR A 3C E a YCUNCS M'DULUS OF THE MAT MATERIAL IKIPS/SQ.IN.l A 10C I - MOMENT OF INERTIA OF T14E MAT PER FOOT OF WIDTH IIN. **4) A IIC CELTA x WIDTH IF THE MAT - TAKEN AS THE LENGTH OF A RECTA\'.Ll A 1?C WHUSE AREA IS E JU4L TO THAT OF THE TIRE PRINT AND WHCSE WIDTH A 13C Ih THE MAX IMUMW WIDN OF THE TIRE PAINT uIN.) A 14C KKK - NJM3ER OF SETS OF DATA PER SEC TIC - A SET IS A A 15
A C CEFLECTION PATTFRN FOR A PARTICULAR COV.RAGE WITHIN THE TFIST A 16C NN5 a NUMBEA IF STATIC UNIFORM LOADS - WHIEEL LOADS A I1C POIS a POISSONS RATIO OF THE SOIL A 18C H TFICK1NESS OF SO IL LAYER - ICCO USE3 FOA Ha UFINI NF AC SAI a DISTANCE TO THE BEGINNINS OF STATIC UNIFORM LOAU FRCM A 23C T E C1IG IN (I.) A 21C SQO x r4ACNITUDE OF STATIC UNIFORM LOA0 IKIPS/INCHI A 22C Sea m CISTANCE TO THE END OF STATI UNIFORM LOAD FROW THE A 23C OrIGIN (I.) A 24C NN a IITEGER COUNTER A 25C IN z INTEGER VARIABLE ASSOCIATED WITH THE TYPE OF STRESS A 26C CISTRIBUTION A 0C I a LINEAR A 28C 2 a HYPERBOLIC - FINITE DEPTH A 24C 3 x HYPERBOLIC - INFINITE DEPTH A 33C NOP - NUM8FR OF DEFLECTION POINTS PER SET A 31C I aSECTION NUMBER A 3?
-1 "--LANE NUMRER A 33C 13 a ITEM NUMBER A 34C 14 a LOCATION NUMBER A 34
CCETEROF PANEL- A 36C 2 a QUARTER POINT OF PANEL A 37C 3 a JOINT A 38C ICOVER a NUMeE OF COVERAGE S FO Ti.--SE-T A 39C XS a DISTANCE FROM ORIGIN TO POINT AT WHICH DEFLECTION IS GIVEN A 43C (IN.) A 41

C D~S PJFASJ~r-O OEFLECT1' AT 'HE POINT XS A 4.2
C CAM ATE OF DECR~EASE 3F STRESS WITYH -DEPT-H- -. A 43C EC zYOUNGS M9DULUS OF THE SOIL A 44C *** ~ s.*. *4**s*...*s**.*e.~*e~ A 45C A 46
RF.AL ILKSqm9MEMSMALMOMES A 47riMFNSION SAl(51, SQO(S)o Sf11153, XS(203, DS',#Q * XDEFL(20) A 48C;.l"CN L,&,CA3,52,S4,R2,E*1hN5,X(60),AI(53,QOIS),BI(53,DEFL(bO3,S A 0
ILOPE160 ),MtMFt 6C)o SHEAR( 6C3 A to0RFA(r (5,15) K4 A III
KNINO "A 521 KN%-KNN.1 A 53
IF (KNN.EC*(KNK*l)3 STOP A b4C A 55C READ INFORMAl IO'4 ABOUJT BEAM PROPERTIES A 56
C A 5?READ (5,16) EiDELTA A 5SIs I*DELTA/12. A 59
I A b3
C READ INFORMATION ABOUT FOUNDATION PROPSRTIES A 6112c A b2
RFAC (5,203 KK~vNN5,POI$lH A 63
C A 64
C REAO) LOADINC INFORMATION A 65
C A b6RFAD (5,16) (SAII(3SQO(~.)SBI(K),KI(UINNS A b?
NNvO A 68it2 N. IKN* A 69ifIF INN.EC.(KKK*I33 GO TO I A TO
C A 73.C REAC INFORMATION ABOUT DISTRIBUTION OF STRESS A 12
c A ?3A EAD (5,3.7) IHNOP A 74
c A 75C _READ TEST SECTION IDENTIFICAT-10N _________ A 716
25C - - - - -- - - A 7716REAC 15,18) 11,129 13, IAICOVER A 78
C- A 79
C- -fA DDA1 A -P~t~ -DIT A 83
c A 81
READ (5,19) (KS(J),DS(J3,J-1,NDP) A 82IRTt(,1 A b3
A 32 WRITE (6,22) IhI?, 13, 14, ICOVE~t A 84.
£ )) WRITE (6,23) A d8
35wRITE (6,253 A 87£ 6 GAMMA-1. ____________________ A -88
PC A oci13 C ERRS 9 STORED VALUE OF ERROR - SET INITIALLY TO 10000. A 90
C __ _ _ _ _ _ _ __ _ _ _ _ _ _ A 41.
A 4) 37 WRS.ooO A 42
A 1EOs .1 A 93
4 L((2.*E*I*(1.-POIS*2.33i(EO*DELTA)0O33 3 33 3 A--94

C SELECT EQUATION FOR PROPER STRESS DISTIBIUTION A' 96C A 9?
IF (IH.F^.l) 5) 1) 5 A 98IF (I.E.') J Ti 6 A 94IF IIH.EQ.3) Gri TJ I A 133
5 AluCELTA*H/3. A 131StInCELTA/H A 1327T1 EOORII)/(4.*( 1.4POIS)) A IJ3KSUIEO*SII)/( 1.-PoIS**Z.) A 134PZ, (T*L**2. M/ E*el) A 105S4mIKS*L**4.)/(E*1j A 13bGO TO 8 A 137
C A 1086 GI4LaIGAP~MA*H)/L A 109
PSIKCO.5CGHL*(ISINH(GHL)CCOSH(GHL),GHL)/ISINH(GNLIC.2.)) A 113PSItal.5/GHL*((SIN(GH.L)*COSH(GHL)-GHLI/(SINHgGHL)s.Z.I A IIITx( EO*DELTA*H*PSTT M/ 12.*( 1.+P3IS)l A 112,SulEO*CELrA*PSIK)/(I-*( 1.-POIS**Zd1) A 113R2a(94*( .-POIS)*PSITI/(6.*L) A 114SA. (2.*L*PS 1K )/H A I115GO TO 6 A 116
C -______ A 117
Tat EDOELTA*L M 8.*GAMMA* t.+POI5)) A 11?R2* I.s#4D o-__ POIS_14_e_*GAMMAA
I1"1S~xGAMMAA 121
a S~aS$*O.SA 122C A 125
LinEAPPLICABLE*O. A 124C A 128
A8.2.*A*B A 129NSzNN5 A 13300 9 Ka1,NS A 131
AME IaSA IIK I______A 13?QO(K IzSQO(K IA 1339 P11 K)x$BIIK ) A 134
00 10 JulNDP _____________________A 135X(J)GXSIJ) A 136CALL ULOAD (J) A 13XOEFL(J)*DEFL(J I A 138
to CONTINUE A 139ERROR&O .0 A 14300 11 Ju1,NDP _____________________ A 14111 ER~RRE-WROR4ABS( XDc_;FL (j )ST)*S2. _A_14 2IF fERROR.GT.ERRSJ GO TO 13 A 143
____ RRSuERROR _____________________ A 144IFI IERR #L1L I GO TO 12 A 145ECSSEO A 146SKSmKS A 147TSwT A 148EOvEO+0.O5
A11

GO TO 4 A 150
4 12 Es - OA 1521i SKSRKS 5T£153T~sTA 154
E02 EO*0OI 01A1551RGC TO4 A£156
13 SUBR*SKS/CELTA A 157TTTrtr/ ELTA' A 151WI1TE 16976) EOSvGAMNASu86,1TL,ERS A160
-- IF IGAPMD.GE.8.)_Go To 2A11ltGAMMA2GAmMA*I. -- - A 162itGO0TO3 A 163
IN A£164111 4 WRTC bf-, A' 165
is £A166la5i FORMAT 11110) A I b.?A16
16 £P0-t320.S-A16817 FORMAT (2115) A 169l8 FORMAT (5110) _____ - A 719 FORMAT 4?FZO.5) A Il20 FORMAT (2IIS,2F15#5)A1721 FORMAT_/ 1I0K9 IPSECT ION t OXI 4HLANE 9 0X, 441 TE MtlOX98H.LOCATt O4el,17 _A 173
INCOVERAGES) A 17422 FORM4AT 111491169 114s 116,119) A 17523 FORMAT I/SX,qHE OF SQIL,9X,5HGA'MA,5XtqHSUB3RAOE,1ZX,1HT,13X,1HLL A 116
24 FORMAT (37)(97H'MOfULUS) A% 1102 FORMAT (3K IIi.K IPS/SQ. 1'.,20X,15HKIPS/SQ-o.N./lIN. ,5XHKIPS/IN.l)- A 17T9
2i6 FORMAT (61.2A 1802? FORMAT (110X:3HR2 IS GREATER THAN $2 NO SOLUTION) A 151l
IIIENO-____ A Ii?-
li
18
131-0_ _ _ __ _ _- ------- __ _ _
E-O-J

APPE4DIX G
-.. - COMPUTER PROGRA FOR PERFORMANCE PREDICTION
CC PERFORMANCE PREDICTION PA3GRAMC
C INFINITE BEAM On A VLASOV A4D LEONTEV MODELC HYPERBOLIC STRESS DISTRIBUTION
-C OWNWARD DEFLECTION IS TAKE AS POSITIVECC CEFINITIO4 OF VARIABLES USED- KNK aUMB-ER --OF TEST SE-TIO4S TO BE N-VEnTISATEDC KNN * INTEGER COUNTEKC 11 a SECTION NUMBERt 12 * LANE NUMEA.C 13 • ITEM NUMBERC INCA • ACTUAL NUMBER OF COVERAGES AT W4ilCH T4E SECTION FAILED.C E a YOUNGS ODULUS OF THE MAr MATERIAL (KIPS/SOo INo)C I a MOMENT OF INERTIA OF THE MAT PER FOOT OF WIDTH (IN.**A)C DELTA a WIDTP OF THE 4AT - TAKEN AS THE LENGTH OF A RECTANLEC WHOSE AREA IS EQiJAL TO THAT OF THE TIRE PRINT AND WHOSE WIDTHC IS THE MAXIMUM WIDTH OF THE TIRE PAINT (IN.)C NN5 a NUMBER OF STATIC UNIFORM LOADS - W4EEL LOADSC wGMM- * THE PRODUCT OF THE AVERAGE WATER CONTENT (PERCENT)C AND THE AVERAGE DRY UNIT WEIGHT OF THE TOP 18 INCHES OF SCIL.C LtSW * AVERAGE C.BR. VALUE FOR THE TOP IB INCHES CF SCI LC WL • MAGNtUDE OF THE-LOAD - FOt DUAL W-iEELS-USE TCTAL LCAD ONC THE ASSEMBLY - FOR SINGLE WHEEL USE WHEEL LOAD. (IN KIPS)C CA • CONTACT AREA (IN SQ.IN.) - FOR_ BOTH SINGLE AND DUALC -EAS-ELY-USE -CON4T-CT AREA OF ONE WHtEL.C TP * TIRE INFLATIO PRESSURE. (IN LBS./ SQ.IN.),C SAI DISTANCE TO THE BEGINNING OF STATIC UNIFORM LOAD FtCMSTiHE ORIt+iN(-"l IN.) .
C SOO m MAGNITUDE OF STATIC UNIFORM LOAD (KIPS/INCH)C SSI - rISTANCE TO THE END OF STATIC UNIFORM LOAD FROM THEC OR GIN .) (INC POIS - POISSONS RATIO OF THE SOILC GA'MA a RATE OF DECREASE OF STRESS WITH DEPTHC EOa•Y rjiGS-i-nboL'US O+F-i- THE SIL----
CP'AL ItKSLpITKS, lIsMOMECIMENSION SAI(S),SOD( 5)vSBI(5)C0MMCN X( 6 0)#AI(5)pQO(5),BI(5),LABvAsSZS4,R2vEtI *N5DEFL160),
I SLOPE( 60)9MO4E(_60,SHEARf6C)__
ViI

REA C (5P420) K'dK420. rCARAT ( 110 )
C KNK--NUMPER UF SECT10~4S Vi4VESTIGATEDKNN=O
410 KNP4KNN + I________
IF IKNN.FQ.IKNK~i)-) STOP.- __
C q[ALC SECTION IDENTIFICATIONREAD (5,101) 11,I2i13,iNCA -
C READ PROPERTIES OF MATREAD (59100) E,1,DEFLTA
C REAU. NIJMiPER OF WIFEELS AND SOIL PROPERTIES,RE An (59102) NN5,WGAMMACBRt
C RCAC W14EEL LOAD, CONTACT AREA,T IRE PRESSURE.RFAD (59100) ,41,CATP
C READ LOAD PLACEME%4T AND MAGNITUDE.READ (59 10) (SAI(K),SQU(K),SBI (K),KxI,NN5)JIK: _ _ _ __________
I- I *DELTA/ 12*
INrKSx 164.+3.*CBR-5oS,*WGA'4AICOVE'4uIF (JIK*EQ.1) GO TO 69
73 ICOVEt~uIIF (JIK.EQ.2) GO TO 70
69 ICOVER. INCA70 Elf~uE*It
NNNK: I501 SUBRaINTKS/(FLOAT( ICOVFR)*S0.C48455)
GAIVMAS.FLOAT ( I CV ER )**0. 25GAMMASGAMMAf( 13,u.Man,,iKS x StJBR*DELTA/1000.EOx(( 2.*(l.-POIS**2.)l/0ELTA*((E*I*KS*3)/(GAMA*3,*OZS0.Lx((2.*E*I*(1.-POIS**~2.))/(EO*DELTA))*0 3 3 333 3 3 3
Ts(EU*L)ELTA*L)/(8.*GAMMA*(le+POIS))TTuT/OELTAR2: (1.-POTS )/( 4.*GAMMA)S4w GAM'MA------------ -- --
S2r S4**0.5Aa( (S2+R2)/2. )**0.Se&aUS2-R2)/2-)**0.S ___
AB= 2.*A*BN5.NN500 111 Kut,N5
A ( K)xS AI(K ) ICO(K)=SQ0(K)
III BI(K)xS81(K) ___________
IF (NN5.EQ.2) X(J )-A II + B1( 2)-A 1 1)1/2
IF (NNS.EQ.1) X(j I A(I)I(B I ( t- A III I ZCALL ULOAD(J)-IF (JIK.EQ.1) GO TO 71IF (NN5.FQ.1l) GO TO 78-- --____

C AC*CA* *0 .5
FA1L\NzFLOAr( ICJVF4 U**.325-CRlfER=(EIC*Cn,,,CC*TDC/.iLC*FAILiJ)
CR1 rE-4=(C:1 E4**O.9459?4)/( IC.c'*eC.5C5?4)
IF (NNNK.EQ.I) 1COVER=tC0VR-1IF ( C4I TEI L 9DEFL( 1)) 00 ToJ 80G9 TF(IOVRC.0) 79TO8
IFC (ICvE.C.20 ICOVE )**1*E 3
Fir (ICOE.TIC00E) ICVEuIOVR
I NNNK oQI a 2R~CVE-
0 IE (6,10)EDcLI) O Oe10 IF(R (//10ER 7HSECI0NOX GANOXtI241X8CvR~ TO
,~I (6,1ERC29 ) I2,13,I C VI2
62 Flr (/10XE,ZT*20HI SERCTO IL AL T,4,14 OERGS
51 WRITE 169,10)
w.RITE ( 6,129) 1It 129,13, INCA
WR ITE ( 6,83) IOb2 FORMAT (/IOX,45HHRECTO WL FAIL IS ATE T491N 5000 C0ERAo
GO TO 410
100 FORMAT 13F20.5)102 FO]RPAr ( 120,2F20.5) --
110 FORMAT (2F20.5)101 FORMAT (4110)120 FORMAT (4F20.5) __________
71 WRITE (6972) IC0VE~vUCFL( 1) --- _________-- -
72 FCRMAT ( I10,5X,2lI*AILURE DEFLECTION IS ,FIO.5)_J-IKx2 ___ _______
GO TO 73 -- - _______
END
E-O-Jj

APPENCIA 14
COMPUTER FROGRAPA, FOR $SYMMETRIC LOAD MODEL V
C ASYMMETRIC LOAC MODELC, 4*4*4* 4444**444***4**4***4****s4**
PEAL 'ICII4ENSICN M12I0),AX21 20),IeXI?2C )tB~i(~2C)tXDEFL(25I#ADDEFLt25)CO~MMON X160),DEFLI6O)*AII S),I 5 )IQO(5).INS
C. READ SECTICN ICENTIFICATIONC IluSECTION NUIOERC 128 LANE NUMEERC 13a ITEM MJMEER
READ 15,101) 11912913C RE~AD INFORMATICN AeCUT 8E6M PROPERTIESC _ EMODULUS CF ELASTICITY Of REAM - KIPS/SQ.IN.
CI- F4CMENT C'F INERTIA OF BEAM PER FU3T 3F wIDTH -N**
IFAD (5,100) EiC NLOAnmNUI'BEA CF W~HEELS.c- WHEFLSsWHfFL SPACING IN INCIHES.c %IDLANsW'DVTP CF THE TRAFFIC LA4E 1~4 INCHES.
READ 15,2) NLMO,94HEELSowICLANC NSHIFTeNUMeER OF POSITIONS OF THE ASSEMBLY BEFORE IT ISC MOVEC LATERALLY TH-E WICTH OF THE ASSEMBLY. THIS 'VALLE IS LSE-Dc ONLY FOR MULTIPLE-WhEEL TESTS. FOR T14E LOADING SECLENCE $HUINC IN FIGURE 24 CF TMI REPORT - NSHIFI~u3.O. THIS VALLE FORC SINGLE-wHEEL TESTS IS SET EQUAL 10 UNITY.C CONTAmCChTaCr AREA OF TIRE IN 50.11.C QNTCTAL LOAC ON ONE WHEFEL IN KIPS.
RFAD (5921 NSHIFTCONTAQc NFOSITxNUMPER CF POSITIONS OF WHEEL ASSEMBLAGES 10 CO'VER TIE
C TRAFFIC LANE WICTH.READ (5,421) NPOSIT
C _ TIREW=WIDTH OF THE TIRE PRINT IN H'CHESOC TIRELuLENiGTH CF THE TIRE PRINT IN IlChES.C, ABOVE TWO VALUES PASEC UPON A RECTA'4GULAR TIRE PRINT.
IF INLCAC.EQ.1) TIREWsWICLAN/( FLOAT(NP]SIT))IF (NLOAC.EQ.2) TIREWxWICLAN/f2.*FL0AT(NP3SIT))TIRELxCONTA/TIQEWkIl*TIREL/12*
OsO/TIREW-AC ATRLENGTH CF TIME THA THE LOAD IS APPLIED.
-* CBT.LENGTH CF TIME THAT THE LOAC IS )FF BEFORE THE LOAD I S

Ii iW Al (591.)3) Al gel
c AT ANC PlT MUST BE SO SELkCTEE TI-hi
C THF :IICVE P CUIREPENT IS NECESSARY Ml~ I CUIVERA4GE TO BE 7,4E
C. REAIL INFCRMAfTICN CE VARIhTliN OF PoJUULUS OF SOIL0 T I! PC';CA CKLY TI-E RESICUAL PFF01MAT1ONS AR4E OF
C INTEAIEST, htUS ti-E VALUE OF C CAN BiE AABIT4A~Y.C It, r'-I.- FRCC.~t AI3=1.O ( SEE REPn(T-SECTI[UN1 ON AEVMFIRIC
cCA LL)'U L
C, XCa rIST AIrF F RCM, CR IC IN TO ErGE O F tRAFF1IC LNE t% T-I1SL Ft'CCiF.01 T-F CPICIN I-AS eEEN SELECTrI) AS A POINT tC FEET LEFTC OF TI-F ECGF rF TI-E TRAFFIC LANE.
I F INL C-C .E Co I) CL r C 650rC 65 1 J-~I v PCS ITIF i...GT.NSI-IFT I GO TC 720AXI (j): XC+FLCAT (J-1)*T IREWAX? (Jis AXI C j).FLCArC NSHIFT *T IREWPX ( J) a1X II J),+r IRFWSx2 (j)z hX2(j)+r I REWGO TO b51
770 AXI J) aXC+ .*FLOAT INSH IFT I T IR E1%FLO A ItJ-1-N S IF I * I RE 1AX? (J) a AXI ( J ) 4 FL CAT I NS H. IFT I*T lot EWFX1 IJ)uAXI(j.1TIREW
651 CCNTINUE
65C DC 653 Jr1,NPCSITA9I (J)z XO+FLOAT(J-1)0T IRE[i
653 I XII J)0 AXi ( J)+r IRE"u652 N52 NLCAO
rC 6154 WKa I pNS654. CCC KK)C
C ESTAPLIS- rISTANLES TO WI-ERE CFFLECr IONS ARE TO BE CO10PLTEU.C LEI THIS ARi~DY PF X(J).C COMPUTED UEFLECTICN At ONE-TENT- PJINTS ACROSS TRAFFIC LANE.
D0 303 ~jul,11303 X ( J J)X0&FLCAT4JJ-1 )*# I CLAN/ 1C0.
W41TE (6,129) 11912,13iiC NWMCGV= IJ02ER OF COVEPACES.c NFASSit NUMeER CF SPECIFIC PASS W1I-14J A COVERAGE AT THE END OF
C %HIIFI TH-E CEFLFCT ICN 15 CESIREC.C NFASS MUST BE LESS TI-AN OR EQUAL TO NP3SIT.C NCFASS= TOTAL NUPPERU OF PASSES 14ECESSAAY TO COMPLETE *IHE 'IVENC NUjMt[P CF CCVERAGES.
810 RrAC (5 ,420)I NJ MCOV , NPASSNCPASS=KUMCCV*NFCSIT
C LUF:COMFLEtE NJMBER OF PASSES FOR ALL FULL AND PARTIAL CO ER.
LU F=NOP £SS+ NP ASS

C FTIF'E FINAL TI[ME TU hi -IRE CEFLECT10~4 IS DESIREDFFI MExFLOAT (LUP)OAT4FL(1ATILUP ),eTC LET THE TCrAL CEFLECTICN AT EACI- POINT BE AEPRESEN1ED BVC xCEFL~i). ZERC ALL. OF TIESE LOCATItINS INI1TIALLV
00 '444 j:I,ll'444 )'EFLIJ)so.
C COMPUTE THE CEFLECt IONS FOR FA0i- LOAD APPLIC4110h AND RELEASE.Ila 1Mm NFOS IT
NumccZ NUMCV+?IF (NN.(C.NutACC? M3sNPASSIFr (043.EQ.0) GC TO 301DE 302 tM*Iul3IF (NLCA.EC.11 GO TC 660Al (1).AXI(MM)At (2). AX2(MM)
t81 (?)8X211Mm)
GC TO 661660 At ll)uAXI(NM)
al Mt'laO MM661 NMI wfNNhF0S IT-( 2*NP0S IT-20MM42-KMM)
ISTAPTU FLOAT INM1I *AT4FLOAT( NM 11*BTTI ME.FT IME-TST ARTTI. ATCOMFwuOC*(41T4IAC1 * 1#IN)**EN-c~( CDI TIV- T )**EN)ONSeTI REL/COM'PWLAMCAa teKS/(4..F*t))**0o2500 309 Jml,11CALL WULOAD (JWLAMCAv8KS)
309 AD9lEFLlJ)wOEFL(J)00 663 JulI1
663 XDEFLfJ)sXDfFLlJ)+ACtEFL(J)
KM~mKM*IF (KN.14EG.) GO TO 661
302 CONTINUE301 CONTINUE
911-11-1JNNa MN-?
OF WRITE 16,130) JNN%RITE (69131) MMKlIUTE (6,132) CI*ENhmRITE (60133)%RI'TE (69134.)%RITE (69135) ( XOEFL(J),XIJ)tJm1,11)GO TO 810
I FORMAT (4FI0.5)k, 2 FORMAT (15,ZFlO*5)
10 FORMAT (//IOX,7HSECTICN,lOK,4ItANE1C,4t'1ITEM I___100 FORM4AT 42FIO.5)

13oJ G(RMAT f6x,4lHT14E FOLLOWING RESULTS OCCUR AT THE END OF* lX914*IXv9HCCVEAAcES)
131 FORMAT (6X?33HTIPE LAST PoSITIO4 OF TI E LOAD %AS ti5,1X934AN4D/*2X#11NA TOTtL CF 915,1X93811LOACS IAVF BEEN APPLIED TO THE SY TEP#*)
13? FORMAT( ISX,19HIME VALUE OF 01 IS vF6*3/I5XtIMTHE VALLE CF EIN IS
133 FORMAT (SX,37HT14L CEFOR14ATICN PATTERN IS AS FOLLO19S)134 FORMAT f'4X 20N-AES I UAL CEFORMATION 4AXv;CHDISTANCE FRnM ORIGIN/
* 1X*614KNES ,19X,61-INCME135 FCRMAr (lOX,F8.5,15X,F1O*5I410 FORMAT (21101421, FCRMAf 1110)
END
1.O-

APPENDIX I
CCMFUTER FROGRAM FOO I4QPENT TRANSFER 14VESTIGATIGtd
C. MO0MENT TRANSFER ANALYSIS
C ******* W.4**.***E**..,**,*******..*********C HYFPfEOLIC STRESS DISTRIeUTION
REAL IKlSIPTISMUEFLMCEFLLMOMESMOM4EtLv11DIMENSIEN $Al45)9SMC5),SeI( S)oXS(2C )t0S12C)tXOlEFLI2C)vMoEFLf20)t
I F0EFLtkO)sPCEFLL(20I9CCfFLI2C)COMMON X00O)9AII5ICC(5)seIt5)tLAIABvS2vS4tR2,FtI PN5,EFL(bo) f
I SLOFE(60jMOME(60),SI4EAR(60),CMI)I(5) ,~llN2,AATC- 9N~nNUMBER EF SECTIONS INVESTIGATED
PEAC 15,420) KN9
410 PNNwI(NN.IIF f~hNNEQ.1KNK4I)) STOP
C READ INFCPMATION AeOUT BEAM PROPERTIESREAD 15o100) EICELTA
C OELT~jaWICTH OF BEAR IN INCHES.C READ INFORMATICN AeOUT FOUNCATION PROPERTIESe
PFAC (5,102) KKKNNSPOIS,c PKKJNUER CF SETS OF CATA PER SECTION.
C NNS&NUPBER CF STATIC UNIFORM LOACS.AFAD (5,100) (SAIIK)vSCOIK),SeIIK ),KsIvNNS)
Il*ILTA/I?.
02NNUOt4
IF INN.CQ.(KKK+I)) GO TO 4.10READ 15,4) MZNOP
C N2vNUMeEF CF MCMENT RELEASES.REAO Is5,101) It,IZ,!i3, 14, ICOVER
C INTKSuSUEGRA(E MOCULUS IN LeS ./Ct .14.READ f5,9991 INTKSREAD (S59110)1 (XS (J )CSIJ ),JolNCP)I
c SAtuCISTINCE Ta eEG1NPNINCG OF STATIC tNIFORM LOAD IN INCH4F5o
c SBInCISTONCE TO ENC OF STATIC U4IF)M LOAD IN INCHE5.
C__ IIeTSECTICN MJA'BERc 12*LAtE WiMBefC l3sITEP NUMeER
I1uLOCAT ICN NUMBER

C ICOvE~uNUMBER OF COVERAGESC, LET taCENTER OF PANEL 2uUIARTER P01~4T 3F PANEL 3vJOIN1
WRITE (693)WRITE (6,129)I11I2PI39I491COVER
IF (ICOvEA.GTe0) Go To S01GANAw 1.0
GAMMAUGAI4HA*Al36609-El94),EI
~ G#MAGAMMA+(13680e-EIMI/EIMS2!SUBROCELTA/1O0.4031:0 f 2s*11*-PCIS**)fl/ELTAM I E*IOKS*I'3)/(GAMMA** !9 1)*00.ZS
L4( U?.*E4*I 1. -fIS$#*I 1Q*CEL TA) gC. 33333T'IEO.DFLTD.L)/l6..G.MMA.(1..POISIITUT/DELTA02aft.-FOISWI4.9GAMMA)S4' GAMM#
AAuSQRT 1YS12eflT 1AU AL PHA
AwIIS2+F2)/?.)6$0eSSlfS2-0?)/2.1*,5AS. Z.*A00
Cc III Kw1,NsAllpI)=SAIII
00O 114 JulNCP
CALL ULOAD IJI)DE FL U .CE FLU I
114 CCNTINUFC CALCULATE THE MOMENT AT TM JOINT LOCATION ASSUM4ING THEC BEAM TC tE CONTINUOUS.V Jul
XfJ)whI l1)4(BI(Z)-AI(I1)1/i.CALL ULOAO(J)ACT NON. MOME (JJIERR S810 000.
OISTI1)aX(JICMII).- OsCTMoN$O.O I
117 Co 115 JmIqNcP)(JIBXSIU)CALL ',EMIM(J)IOEFLIJ)-CEF.AJ)
115 CONTINUE00 Ilb J=1,NOPX(J1=OIST (1 )(CIST1I )-XS(J1)
LALL SEMIM(J)

FMOEFLL ( J) ar EVL(J IC,.)FFL (Ji)xMCEFL( J).MCEFLL(J I
116 FOUFL(J)rXCEFL( J) (.CEFLIJ)PEIRCm CM(1)/ACrMON*100.ERR ORzO .0UO 2UO JulNtlP
200 i'!#.A0PE;POR+6eSlFDEFL(J I-CS(J ))0*2eIF (JlJ.Eg.2) GC TO 401IF (EQA~l;*GTaEIQQS) GO TO 400ERQRSxERACR
GC TC -1174.00 CM(1)XCIP(l)' I ACTMCN*0.0)I
GO TO 117401 WRITE 169130) ACYMON
W41TE (6,131) C011)WRlITE l6,132) PERCWRITE (6,133) EpRcRWRITE (6,134)VAITE (6,1351WqITE (6,136)WRITE (6,137)WgRifE (6,1381WRITE l6,1133 (ESIJ),CS1J)XCEFL(J)tIACEFL(J),M0EFLL(J3,COEFL(J) ,
I FDFFLJ),Jm1,NOP)GO TO 402
3 FORAhT (//l0X9?ThSECT ION9 1OX9 *LANE,1CXq4lITEM,1ICXveHLCCATICN9I IOX,9MCOVERAGES 1
4 FORMAT (2115)InO FCRMAT (3F20*51101 FORMAT (51101102 FORMAT (21159 F155110 FORMAT (2F20.53113 FOPMAT (TFIS55129 FORMA~T (149116911491169119)130 FORMAT (//5X,6WHTI-C MCVENT AT TI-E LOCATION OF THE HINGE IN THE CONT
*INUOUS PEAP IS *F9.2, 1XsB8HIP-INS. )
131 FORMAT (/5X t8HrHE MACN ITUDE OF T CUNCENTRAIEO MOMENT APPLIED TO*THF END OF THE SEMI-INFINITE eEAM IS ,FS.2sI1X,8HKIP-INS*
132 FORMAT 1/5X,78HT3E RATIO OF TIE APPLIED CO'4CENTRAYEO 1MOMENT IC THE
*0M0MENT AT THE HINGE IN THE /5K, IeKONTINUUS 3EhM IS ,Fq,IsAt
08HPEPCEK NT.133 FORP0AT(5Xv23HTIHE SIMULATIC4 ERROR IS ,FS*S)
134 FORMAT (/3XI13HOISTANCE FRCM ,6X,6IACTUAL q 7XIOHOEFLECTICN S~X,
*1OHDEFLECTICK ,5X91OHCEFLECT ICN tSX9 ICIHOEFLECT1ON vIX,5HIOTAL 3
135 FORMAT 17Xo6lCRICGIN ,7X,I-CEFLECTION ,5XvI HOF INFINITIE ,SX,
*8HOF SEMI- ,7X,8HOF SEMI- ,eX99OF HI"4GEO , ex, HMODEL)
136 FOAM~AT138X4HEA ,6X,13IINFINITE BEAM ,2XtI3HINFINIlE BEAM ,6K,
*411BEAM ,9xIOHCEFLECTION)13? FORMAT(51WHIRICHT) ,9X,6HfLEFT)138 FORMAT (7X,6HINCHES ,6(9X,6HINCHES3//)420 FORMAT (110)999 FORMAT (FIO.Ol
END

APPENDIX J
SUBROUT1'4ES FOR COMPUTEI PROGR414S
SUBROUTIME ULOADWJ-REAL IMOMlESMSMALMOMEtL
COMMCI$ X(bO3,Al(5),QOI5),BI(5),LAB,&8,S2tS4,R2,EIN5,OEFL(lI),I SLOPEI 60),MOE( 60 3,SIEAR(6C),CM(5) ,DIST(53 ,N? AAtr
DEFL(J)w0.0 _
SLOPEI J )-0.MOM El J ) 0SHE ARt J 3. .D0 600 KalN5IF (XiJi) *GT eAI(K ) GO TO 601ALETAmI AM(K )-X(J ) I/LBLETAut 0119 )-X( J ))ULCI. (L**4.)/(4.*A*B*S4*E*13*R2CUs IL**493/(4o*A*B*S4*E*I)*ABGO TO 603
601 IF (X(J),GTBI(K)) GO TO 602ALETA.EX(J)-A(K ) UL__BLETAU(I (K )-XlJ))3Clu -(L**d,.)/(4o*A*B*S,*E*I )'R2C2u-lL**4.)/( 4.*A*B*SI.*E*I )*ABV~ TO 60?
602 ALETAsIX(J)-Al(K))/LBLEr A~lpX(J )-BI IK ) U/L ____________
Cla (L**4.)/14.*A*B*S4*E$13*R2Usc (L**4o)/(4o*A*B*S4*E*I)*AB
603 AAKSA*ALETA _____
4 OA~uB*ALETAABEh* BI El ABBX.8*BL1ETAFAlaSINl8AX )/(EXP(AAX3)FAZ.COS (EAX M/ EXP( AAX 3UAI IaB*FA2-A*FA1 ___________________________
FA21La-f A*FA?+B*FAI)FAluR2*FAI.-AB*FA2FA?2u A? *F A?4AB*FAIFA13.B*13.*A**2.-8**2.)*FA2.A*13.*B**2.-A**2.)*FAIFA23uB*lB*u?.-3.*A**2.3*FAI+A*(3.*B**2.-A**2.3*FA2FS1.SINfE8BX)/.IEXPIABX))_____________________FB2.COS(PBX 3/CEXPI ABX 3FB11uB*FB2-A*FB1FOP lu-I A*FB2.B*FB I)_____________________

F81 2=A2*F8I-AB*FP2FP22=Rl*F24AB*FB.FPj 3:3*( 3.*A**2.-B**?. )*F82+A*( 3.*B**2.-A**2. )*FBIFtA?3=8*( e**2.-3.*A**2. )*FB l4A( 3.*13**2..A**2. SFB'Ir- (X( J ).-T .41(K I GO TO 6O04VSMAL=Cl*( FAI-F61 )+C2*( F42-FB21
PSMAL a Cl*t F412-FBI2)*C?.CFA22-F822)CSVAALUC 1*tFe13-FA13)4C25( FB23-FA23)OSMAL- .OS MALCSMALZ-QSm'ALGCTC 606
604 IF(X(J).GTEl(K)) GO T3 6C5CC: (L**4. )/(S4*E*I)VSHALaCI*( FAI+F81 )4C2*( FA24FB2).CCCSMALzCl*( FAtI-Fgll)+C2*(FA21-FB21)poSALxCI*I FAl?4FB12'4C2*( FA224FBZZ)QSMALzCl*f FA13-FBl3)4C2*(FA23-F6231CSHALm-OSMALCSMALz-QSMAL __
GO TO 606605 VSMALsCl*(FB1-FAI)+C2*fFB2-FA2)
0% AL-(C I* FB II- FAI ) +C 2*FB 2 1-FA 2I1PSM14AL C I*( F B17- F k2) *C2* ( F9 'd2-;0 A2 21QfAS~AL- ICl* (FB 13.FA 13) +C2* IFB 23-FA23)
606 DEFLS=QO(K)*VSMbl.-SLOPtS.-QO(k )/L i(SMAL' -MOMESs-IQO(K)*F*I)/(L*L )*MSMALSHEAR~m-I QDIK)*E*I )/(L**3. )*QSMALCFFL(J)zOEFLIJ)4DEFLSSLOPE( J )wSLOPE( J ) +SLOP FS
-MOME(J)uMOME(J )+MOM4ES60SHEAR(J )xSHEAR(J )1SHEARS-
RETURNENO-.--.- --
SUBROUTINE WU LOAD (JWLA'104,BKS)CI--INFINIT E- bEAM 04 WINKLtR MCOELC UNIFORM LOADS
COdMN X(6),EFL(6QAI(5),8I(53,0O(!1,'tJ5
DO 800 KmI.,N5--.- -IF (X(J)oGT*AI(KI-) -GQ TO 80.1 ____
AWs AI(K)-X(J)
GO TO 803661 IF tX(J).GT.61(Kf) GO'TO 802
AWz X(J)-.ftI(K)EW* 01 (K)- (IJ~ I -
GO TO 803802 AWr.XU)-AI(K)
eW£X I JI1-8 1 (K)~80i3 hLAMCA-- AW*WL4MOA ---

J BLAf/OAz fRW*WLAMAACLAz COS( ALAMDA)/tEXPIALAMOAICLBx COS( BLA)/(EXP(BLAMDA))IF (XJ).GT.AI(K)) GO TO e04CEFLS=(Qn0K )*( OLA-IB) )/( 2.*BKS)GC TO 800
804 IF MXJ ).GT.i3IfKfl GO TO e05CFFLS=(QO(K)*(2.-DLA-DLB))/(2.*BKS) __---
GO TO 800805 CEFLSz-(0(K)*( DL.A-DL6)ff2o*BKS)800 CEfL(JizCEFLWJ+nEFLS
RETJRNdEND
S U BR.OU I NE S E MI M fjREAL IPOMESM)MELCCMMON X160 ),AU 5),QO( 5),1( 5),LABAB ,S2,S4,R2,E,1,N5,DEFL(60),1 SLOPE(eObtM4E(60),SHEAR(6O),CM(5),D!STI5)tN2,AAT
DEFL(J Ju0,0 _
SLOPE(J )s.0MOMEM)0.00SHEAR(J)a* -______ ___
Du-B*(S 2*( 3.*A**.-O**)4f fq*A*AA* T*L**3.)/(E*1)
C2z (CM(K)*S?*8*L**2. )/(E*I*D)IF (X(J)GEoDIST(IKi) GO TO 301XD1STuDIST(K-Xu___________AANEGaAA*XOISTCEFLSuC2/( EXP( AA'JEG))CEFLfJ)=DEFL(J )DEFLS_GO TO 300
301 XDISTuX (J )-CIST(K)hE. h~x*XO 1ST/ILEX. B*XO 1ST/IFlzS tNt BX M/ EXP( AX)F2v COS( 80 / (Ex P( AX)
F21u-(A*F2+8*Fl)F12sR2*f i-AB*F? ____
F22uR2*F2+AB*Fl
F23=-B*f B**2.-3.*A**2. )*FI.A*( 3.*B**2.-k*2a*FO)EFLSxC1*Fl*C2*F2- - -
SLOPES=CI*F 11.C2*F21PCM ES=C l*FI2.C2*F22 ____
DEFL4j)ODEFL(J )*OEFLS___SLOPFf J )=SLOPE( J )+SLOP .ES
MOME(J )-MLME J )4M04ESS14E AR(J )-SHEAR( i )*SHEARS
300-CCNTINUE______f RETURN
END