Embed Size (px)
Citation preview
ff
I I I I
o CO
2
NA-70-*
»I
THE EARLY DETECTION OF FATIGUE DAMAGE
THIRD SEMIANNUAL REPORT
1 JUNE 1970 - 30 NOVEMBER 1970
SPONSORED BY
ADVANCED RESEARCH PROJECTS AGENCY
ARPA ORDER NO. 1244
PROGRAM CODE NO. 8D10
NATIONALTECHNICAL INFORMATION SERVICE
"•PM.ujM'id VA 331M
€> Lot AngtlM Dlvltion
North American Rockwell
_D D C
I* KC M m
B
^

BEST AVAILABLE COPY
·""
oorptctlont. and «odSlcSläS: ch'n«e8'
J J J
NA-70-640
•cniAk. NO. ÖJ
IHE EARLY DETECTION OF FATIGUE DAMAGE
Third Semiannual Report
1 June 1970 - 30 Novenber 1970
(John F. Moore Program Manager
DAT« 30 November 1970 NO. or PAOKS vi<*>38
*
North American Rockwell IntcmtlloMl Alryerl. Lo* AwflM. Callfoml« MOOI. (211) 9704181
\A-70-640
FORIiMDRI)
iliis is the third technical management report on a study lor tlu*
development of methods for the early detection of fatigue damage, carried out
by the Los Angeles Division of North American RocUvJl Corporation. This
research was supported by the Advanced Research Projects Agency of the Depart-
ment of Defense under ARl'A Order 1244, Program Lode SDK) and vas monitored by
the Air Force Materials Laboratory, LLN, under Contract F33615-68-C-1706.
Lt.J. W. Bohlen was the Air Force Project lingineer. Hüs report covers the
period 1 June 1970 to 30 November 1970.
The program is being conducted by the Materials and Producibility Depart-
ment, N. Kliirmek, Manager, under the direction of Mr. J. F. Moore, Program
Manager. The work described in this report was carried out by Mr. J. F. Moore,
Dr. S. Tsang, Mr. F. M. Coate, Mr. D. S. Weinstein, and Mr. R. C. Sapp.
Acknowledgment is also due to Dr. S. Hoenig, Professor of Electrical Engi-
neering, University of Arizona, for his outstanding technical support.
ii
\A-7n-(»40
AHSTKACI
lliis ivport Ji'^-ribrs tlu." conlinuinn iMfort to ilovvlop nondostmctive
tfst iiK'thuds capal'k' ol' dotomining the extent of fatigue Jamatte and providinp
;i im-ans of predicting the future safe life of aerospace materials and struc-
tures. l>uriiig this report period, the fatigue process in 1100-0 a 1 uminun was
studied by means of exoclectron emission and acoustic emission measurements.
Hie exoelectron observations sere by means of measuring the current produced
by fatigue damage in air; the acoustic emission measurement was based on the
number of acoustic events occurring in selected time intervals during fatigue.
It appears that there is a trend indicative of a stress-independent relation-
ship between the change of exoelectron emission current and the percentage of
the spent fatigue life based on the current after a selected number of cycles.
The intensity of acoustic emission was shown to increase or decrease by orders
of magnitude during the fatigue life. The first significant change of acoustic
emission was apparently coirelatable to 8 to 20 percent of the specimen
fatigue life. The continuing metallographic examination confirmed that sur-
face slip striations appear very early in the fatigue process and appear to
directly correlate with the exoelectron emission phenomenon.
m
NA-70-640
Section
TABU: OF CÜffniNTS
l'agc
1 INTROÜUCilüN 1
II LXPI-RIMLVIAL I^UIIM-VI 2
Fatigue Test Unit -
lixoelectron limission 2
Acoustic limission **
III SPIiCIMliN MATHRIAL AND PREPARATION 10
Materials lü
Specimens lü
IV DCPERIMENTAL RESULTS AND DISCUSSION 12
Exoelectron Emission 12
Acoustic Emission 21
Ultrasonic Methods 27
Metallographic Examination 51
Fatigue Tests 32
V SUNMARY AND CONCLUSIONS 36
VI FUrURE WORK 38
IV
NA-70-t»40
ISI 01 ILUISIKMUINS
' Uuiv lilK« |»agc
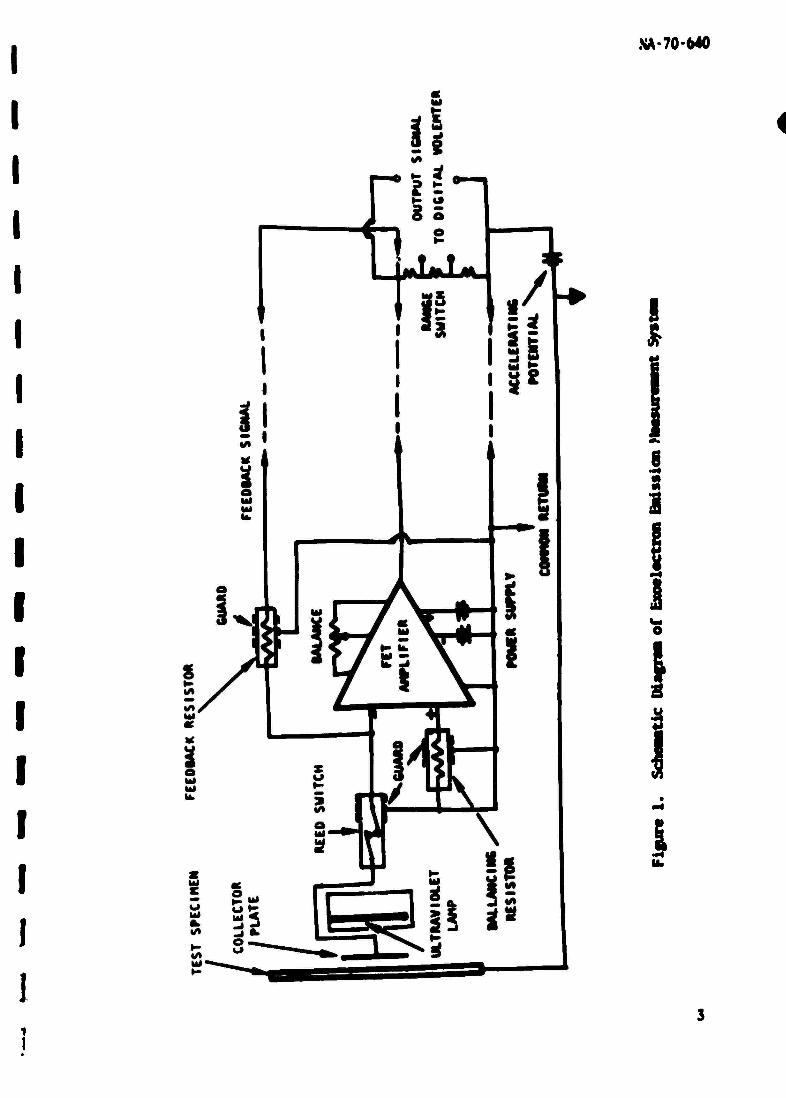
I ^liomtic I'laj-iM.. ut I xoi'Uvtrou Inission Measurement System.... 3
IJUX'K'CIIüII Ijnission Mfasuronn'iit System c
.> Spiviuu.'!! in lAix'Uvtron ljuission and .Acoustic Imission Test b
| I lUock Diagram of .Acoustic Ijnission Measurement System s
5 Acoustic iinission Measurement System y
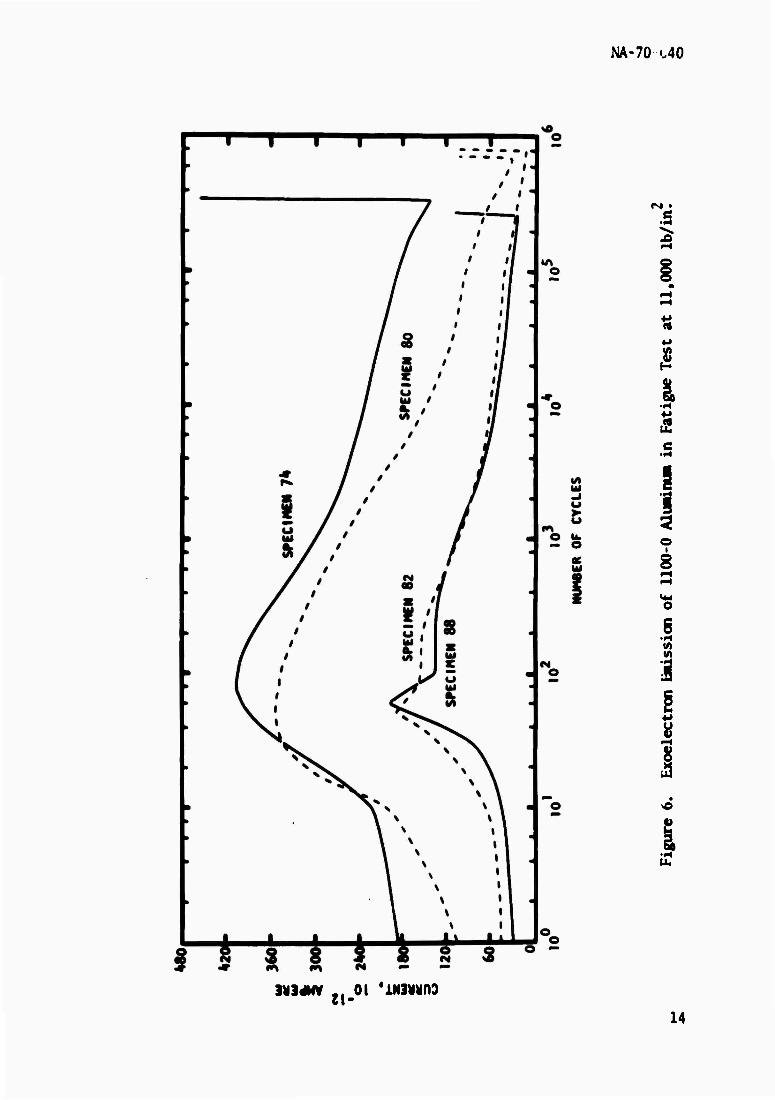
o l_\oolcctron ljuission of 1100-O Aluninun in Fatigue Test at 11,001) Pounds per Square Inch 14
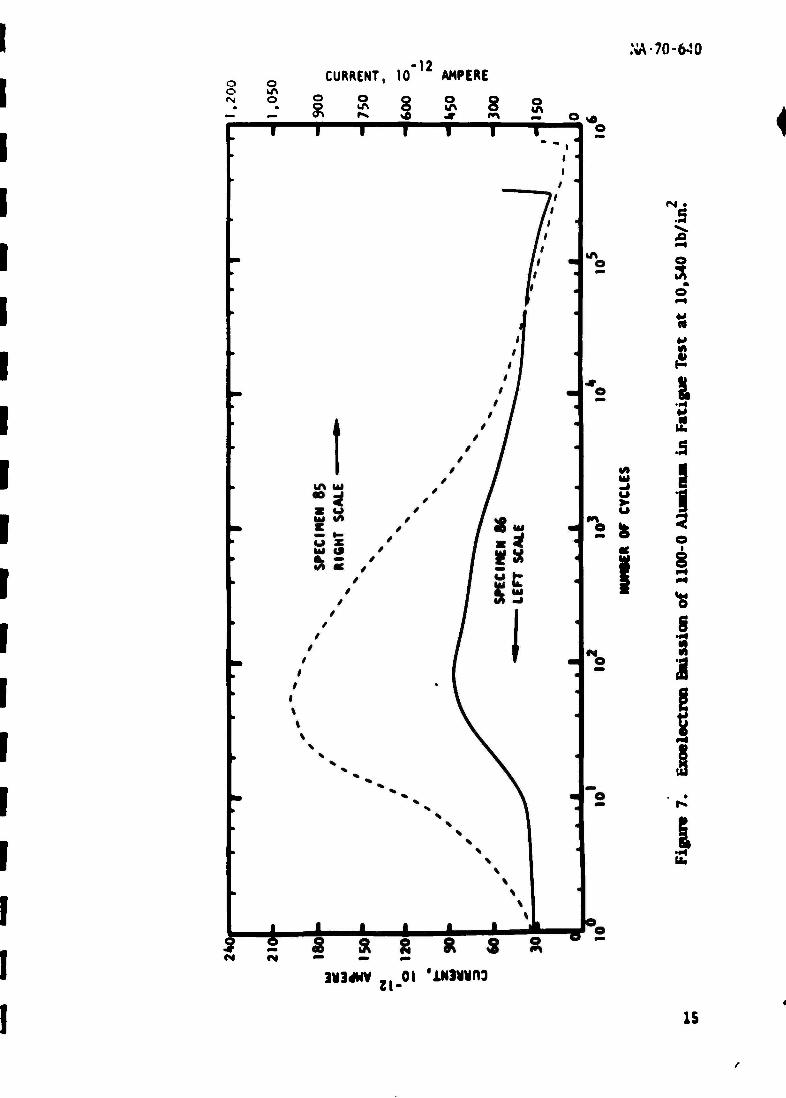
7 ILxoclectron ljuission of 110Ü-Ü Aluninun in Fatigue Test at 10,540 Pounds per Square Inch 15
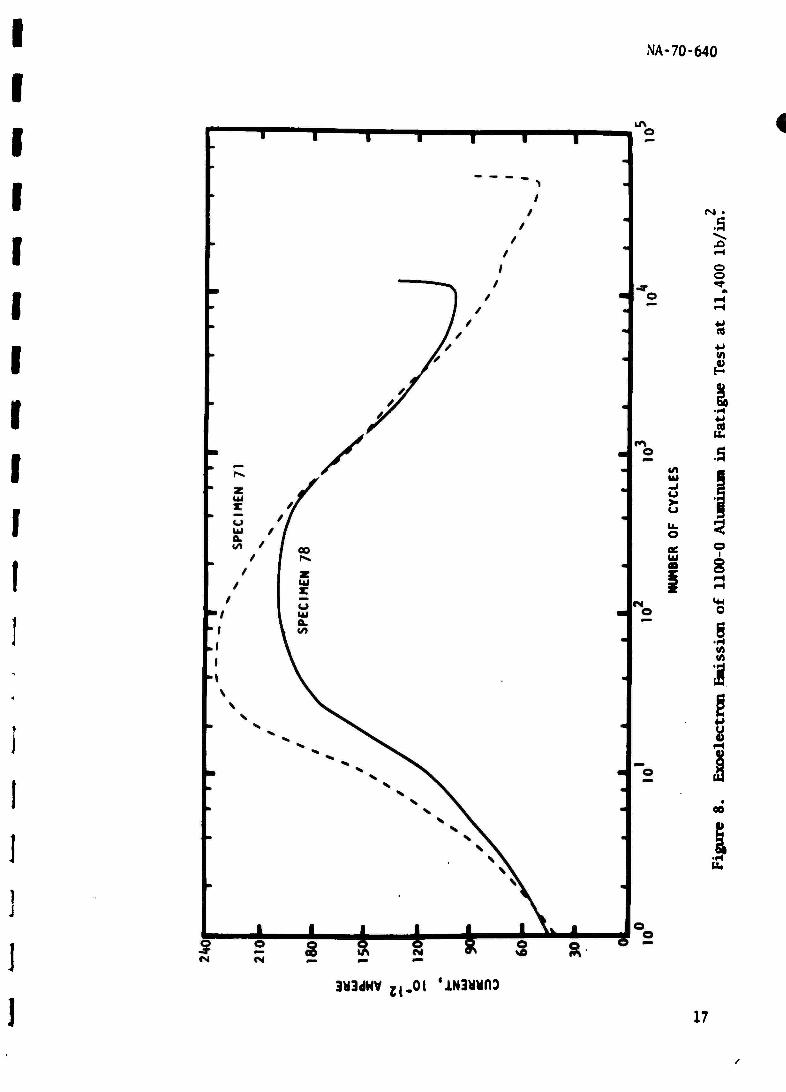
8 Lxoolectron Emission of 1100-0 Aluninun in Fatigue Test at 11,400 Pounds per Square Inch 17
'.) Relation of Percentage Change of Current to Percentage Change of Fatigue Life for 1100-0 Aluninun 19
10 Acoustic limission of 1100-0 Aluminum in Fatigue Test at 11,400 Pounds per Square Inch 22
11 Acoustic limission of UOO-O Aluminum in Fatigue Test at 11,000 Pounds per Square Inch 23
12 Acoustic Ijnission of UOO-O Aluminum in Fatigue Test at 10,540 Pounds per Square Inch 24
13 Optical Micrographs of Fatigued UOO-O Aluminum Specimens (250X) 33
14 Electron Micrographs of Fatigued UOO-O Aluminum Specimens (b,400X) 34
NA-70-640
LIST OF TABUS
TiiMc Title Page
1 Sunury of Fatigue lest Ke*ult* for 1100 o Alunimn 13
II Smaary of Acoustic Inission Measurement for lloou Aluminm in Fatigue Test 26
vi
I I
\A-70-040
wtion I
ivrmmiTiuN
,h ji. !^.«j„« .,,» ijiiiim- oi ffli*t4l!i and »lloy* liavt* been m iifiortaiit
^..iJtrjttoti Hi xU' j|^>lic4ttoii of aero«|taa* aatcrUU. the possibility of
ti.e '41 h it tcvtioit oi iati|:ui* JdBui^.- coulJ significant 1)* i^rovr the material
ut 111..it ion ml sv-Htiin n>lijl>ility. Most available Method* arc related to
tl.v .kti«.tiut; oi jctiul crjck> which, hofcvver, generally appear late in the
i.iti^ur prowrs!*.
ihf ohjoctive of this progrsn is the developwnt of Methods suitable for
I tin- i-arlv Jitcction of fatigue daMage. During the first year of this prograM,
tin- prov.v^s of oxoelectron enission during the fatigue defonMtion of alUM*
imm unJor vacuum conditions and the propagation characteristics of ultrasonic
•iuriacc waves were investigated to deteraine their potential for detecting
t'jti£uc damage, fhc process of exoelectron esiissian was shown to he Most
promising and was further studied, not in vaoaai but in air, in order to
adapt this pre cess more conveniently for practical plication as a non-
destructive test technique. The acoustic eMission of Metals by fatigue
stressing was also measured to determine its feasibility for detacting fatigue
damage.
t
NA-70-640
Section II
LXI'I RIMXIAI. KUH IM NT
KAI iqjl nST iJXIT
The Cttigu? losH unit was Jcscrilvd in the final report for the
first-year effort puhlisheJ as Icchnical Ri-porl MML IKTt» i:i. Hie specimen
and instnaentation transducer for ovasuring the exoelcctron emission in air
Mere enclosed in the glass chanber (previously used for the fatigue tests in
vacuit) in order to lessen air aovement around the specimen to preclude drift
of the flMistion current. The acoustic hackground noise level was also greatly
reduced for the acoustic cnission neasurements.
BcoaamPN OUSSION
Hie current of exoelectron eaission of deformed metals is generally very
»•11. It it necessary to stimulate the emission to enhance the current level
so that it can be measured in air. A special current measuring system was
devised (based on designs for a similar instmnent developed by Professor
S. Itoenig of the University of Arizona) to measure currents as small as 10"14
a^wre. Hie NR/LAD system (figure 1) uses an operational amplifier having
field-effect transistors in the input stage. Current feedback through a very
high precision resistor is used to null the input of the anplifier. The
amplitude of the average voltage qplied to the feedback resistor is a direct
indicator of the current entering the collector plate from the specimen. The
voltage is then converted to digital readings, using Electro Instnments
.NA-70-*40
8 8
I o
3
I
NA-70-640
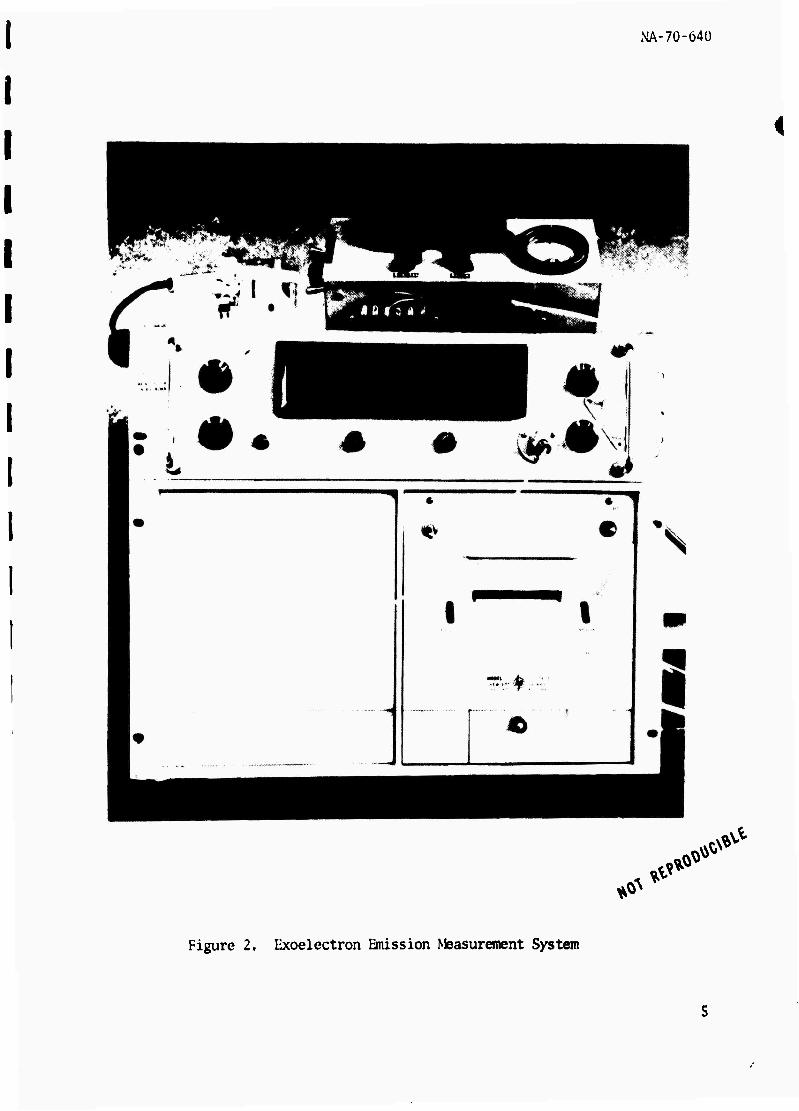
MoJol 8409 electronic digital voltmeter, and is printed on tape with
Hewlett-Packard digital recorder Model SblA. The time interval between print-
ing is controlled by the cycling of the hydraulic system of the fatigue test
unit. A current reading is printed every 101, 10-, lo3, or 104 fatigue cycles.
Measurements of exoelectron emission during a test required three current
ranges of 10' ,10' , and 10'*0 ampere per volt of output. The ranges were
manually selected. A photograph showing this measuring system enclosed in
two boxes on top of the digital voltmeter and the recorder is reproduced in
figure 2.
Ihe exoelectron emission was stimulated with a short-wave ultraviolet
pencil laq) source shielded in a metal box. The current collector plate con-
sisted of a fine stainless steel screen having about 80 percent of open area.
The ultraviolet light leaves the box through a 1/2-inch-diameter hole, passes
through the screen, and impinges upon the middle portion of the test specimen.
The distance between the specimen and the screen is maintained at one-fourth
inch; the ultraviolet laii|> is five-eighths inch further away from the screen.
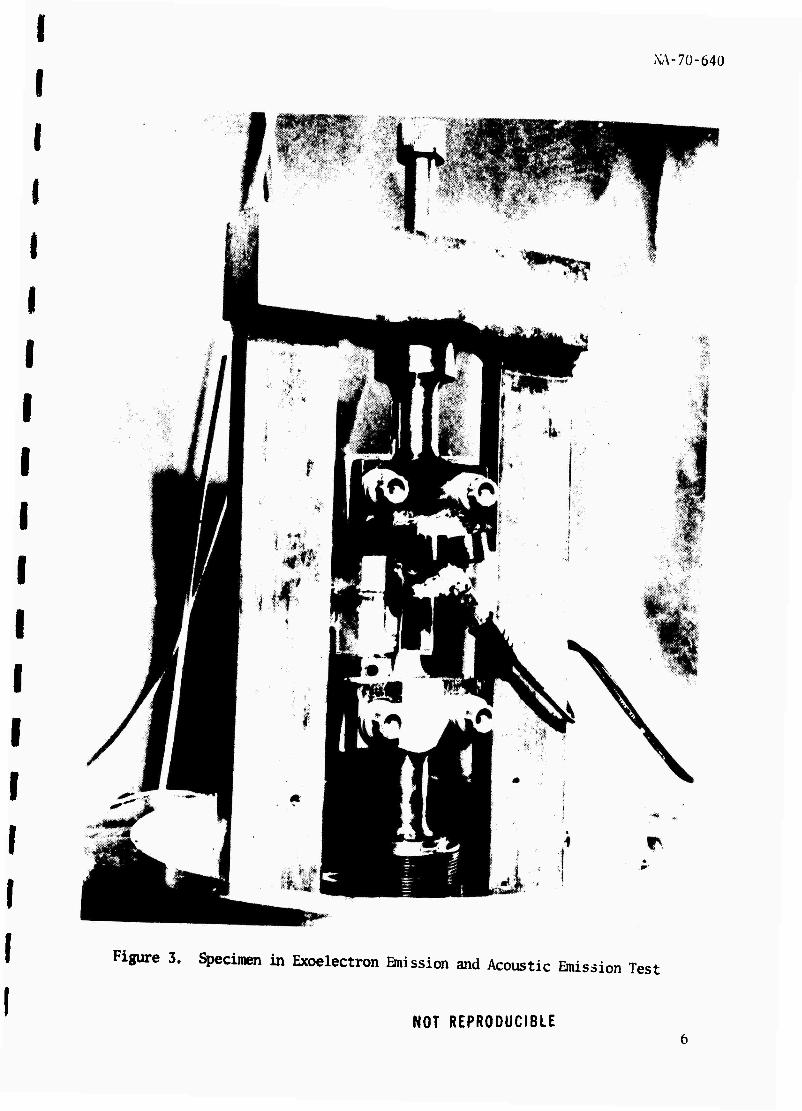
Figure 3 shows the specimen installed in the loading frame with the collector
plate and the box housing the ultraviolet lamp.
ACOUSTIC PUSSION
The acoustic emission from the specimen during fatigue test was detected
using a Dunigan acoustic emission transducer No. D-1408. This transducer is
electrically shielded and has a differential output, so it is less susceptible
NA-70-640
^ tf* ^ ^ ̂
Figure 2. Exoelectron Emission Measurement System
XA-7Ü-640
Figure 3. Specimen in Exoelectron Emission and Acoustic Emission Test
NOT REPRODUCIBLE
NA-70-640
to electrical noise. In addition, it has a narrow bandwidth with a resonance
frequency at approximately 210 kJlz. The transducer is held in position on
the specimen by a spring clip us shown in figure 3 and is acoustically coupled
to the specimen surface with Apiezon-N grease.
The acoustic signal from the transducer is amplified by an oscilloscope
preamplifier, fed into a counter, and recorded as the number of acoustic
pulses. Hie time interval between printing (which is either 101, 102, 103,
or 10"* fatigue cycles) is controlled in a similar manner as the printing of
the digital voltmeter readings for exoelectron emission measurements. The
printed number of counts indicates the total number of events that have taken
place within the selected time interval. In the case of exoelectron emission,
however, the recorded digital voltmeter reading is a measure of the current
at the time of printing.
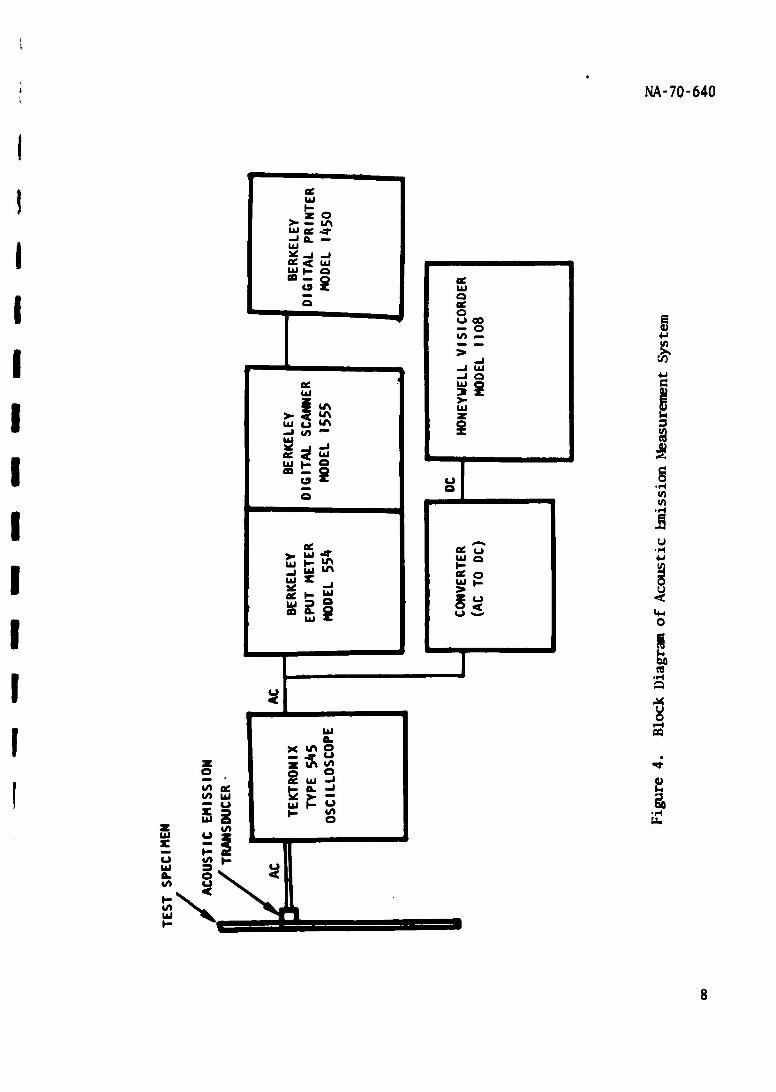
If needed, the total events of acoustic emission can be further broken
down into a number of events occurring in any one cycle by converting the ac
signal to dc and feeding the converted signal to a Visicorder. Each deflec-
tion on the recording graph indicates a number of pulses that are detected
by the transducer at the time of recording. The height of the deflection is
a measure of the acoustic emission power which has been generated. Figure 4
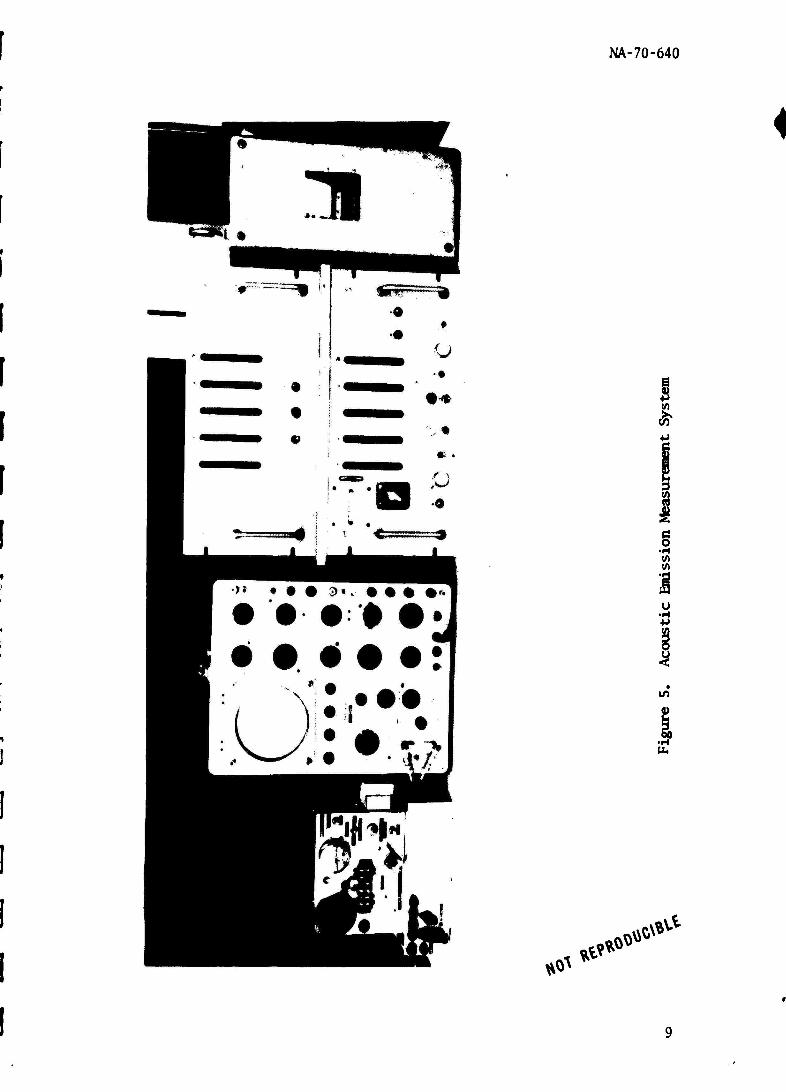
is a block diagram for measuring the acoustic emission, while figure 5 is a
photograph showing the control box for controlling the time interval between
printing, the oscilloscope, the counter, and the printer.
NA-70-640
«/) ec (/> UJ
53
ec UJ 1- z o
>- — LT» uj oe 4- -»Q. - UJ
Üi ►- o
M3? ac UJ ^ Q
Q o O 00 § — o (/) — 4J
(/) > ,^
_J _J UJ
C/3
-1 o y ec UJ 512 e
> B z ^ UJ Q)
> < KJ M UJ o ^ -J w> — i i
4 ö J -1 <* < ÜJ UJ K 0 - a Z o
o § a • H a ^HM
in
s (J
^ Ul -^ uJ H ^ J UJ w> RT
ER
3 DC
•H 4-*
BERKE
EPUT W
HODEL
CONVE
(AC
T(
«4-1 o
i M^BB ' &>
i ns Q o
< M u o iH
UJ 00 Ck.
X Uft O
z i^ «2 •
o o S uj -i fl)
5 P «J l H «; •H 1 0 u. 1 I 1
NA-70-640
fr
§ •H
u •H 4J
Ifi
tu
^ tf*
^ c\^
NA-70-640
Section III
SPliCIMIiN MATliRIALS AM) PREPARATION
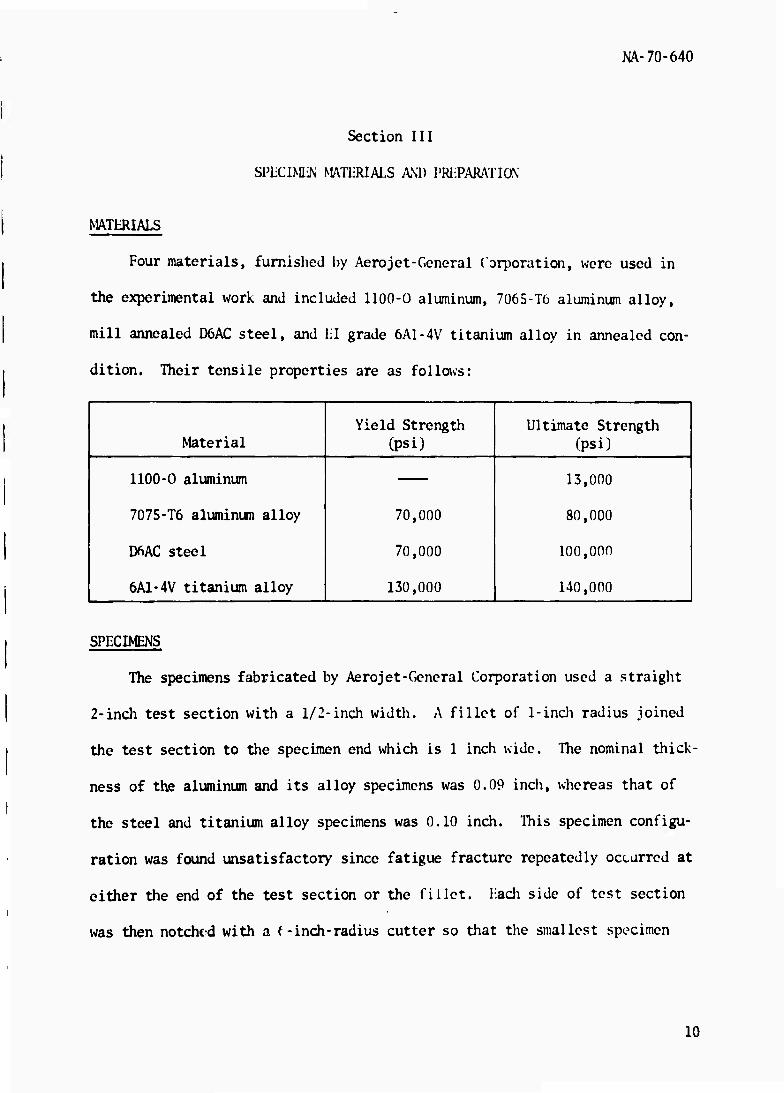
MATERIALS
Four materials, furnished by Aerojet-General Corporation, were used in
the experimental work and included 1100-0 aluminum, 7065-T6 aluminum alloy,
mill annealed D6AC steel, and HI grade 6A1-4V titanium alloy in annealed con-
dition. TTieir tensile properties are as follows:
Material Yield Strength
(psi) Ultimate Strength
(psi)
1100-0 aluminum 13,000
7075-T6 aluminum alloy 70,000 80,000
1 DftAC steel 70,000 100,000
6A1-4V titanium alloy 130,000 140,000
1 SPECIMENS
The specimens fabricated by Aerojet-General Corporation used a straight
2-inch test section with a 1/2-inch width. A fillet of 1-inch radius joined
the test section to the specimen end which is 1 inch wide. The nominal thick-
ness of the aluminum and its alloy specimens was 0.09 inch, whereas that of
the steel and titanium alloy specimens was 0.10 inch. This specimen configu-
ration was found unsatisfactory since fatigue fracture repeatedly occurred at
either the end of the test section or the fillet. Each side of test section
was then notched with a f-inch-radius cutter so that the smallest specimen
10
NA-70-640
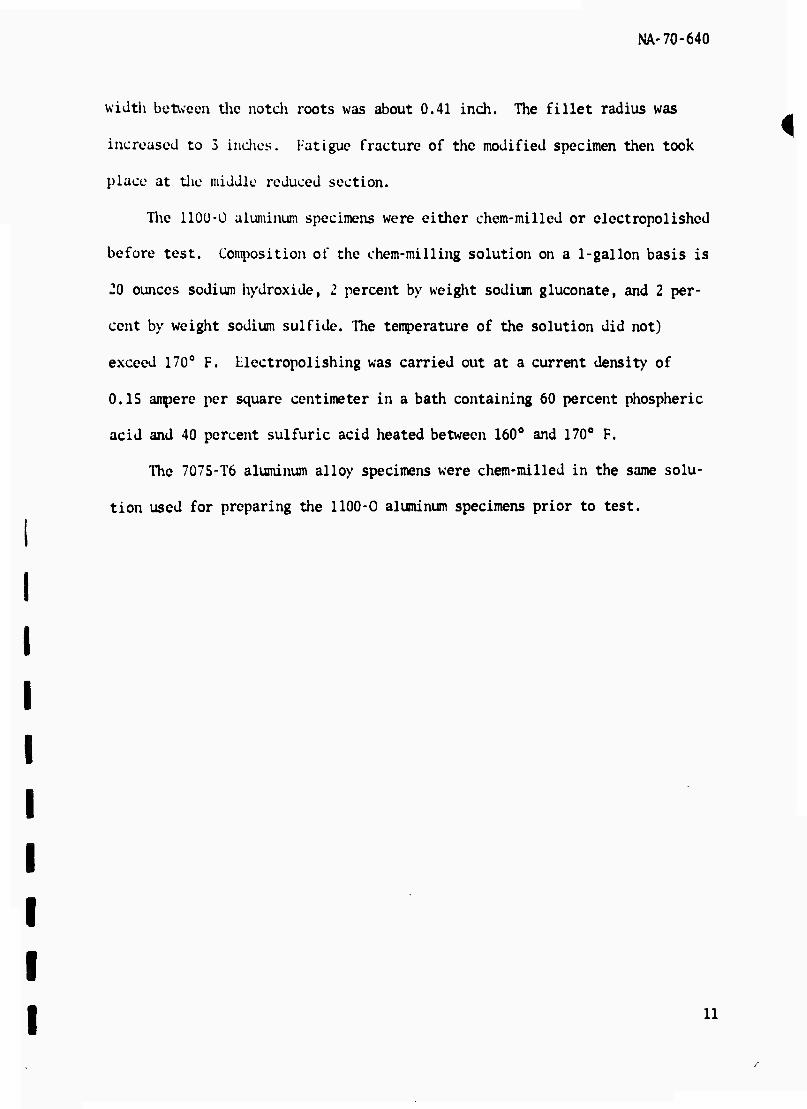
width between the notch roots was about 0.41 inch. The fillet radius was
increased to 3 indies. Fatigue fracture of the modified specimen then took
place at the middle reduced section.
The 110Ü-0 aluminum specimens were either chem-milled or electropolished
before test. Composition of the chem-milling solution on a 1-gallon basis is
20 ounces sodium hydroxide, 2 percent by weight sodium gluconate, and 2 per-
cent by weight sodium sulfide. The temperature of the solution did not)
exceed 170° F. tlectropolishing was carried out at a current density of
0.15 ampere per square centimeter in a bath containing 60 percent phospheric
acid and 40 percent sulfuric acid heated between 160° and 170° F.
The 7075-T6 aluminum alloy specimens were chem-milled in the same solu-
tion used for preparing the 1100-0 aluminum specimens prior to test.
11
NA-70-640
Section IV
EXPERIMENTAL RESULTS AND DISCUSSION
EXOELECTRON EMISSION
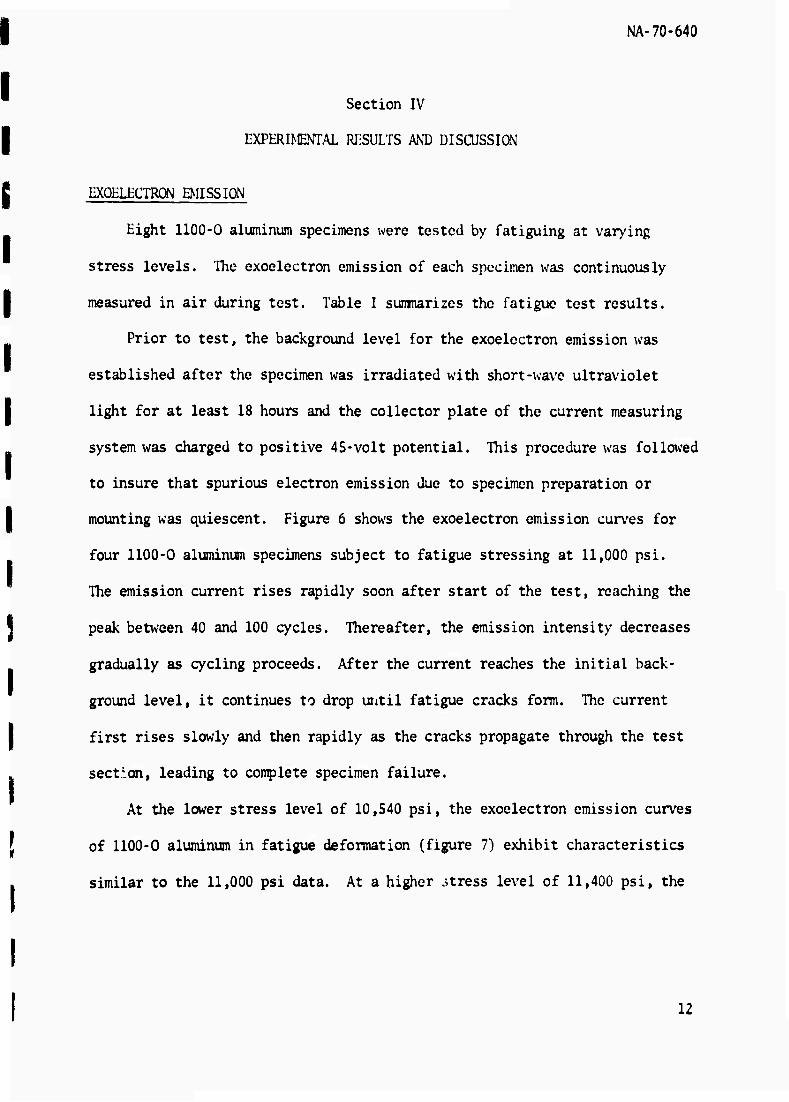
Eight 1100-O aluminum specimens were tested by fatiguing at varying
stress levels. The exoelectron emission of each specimen was continuously
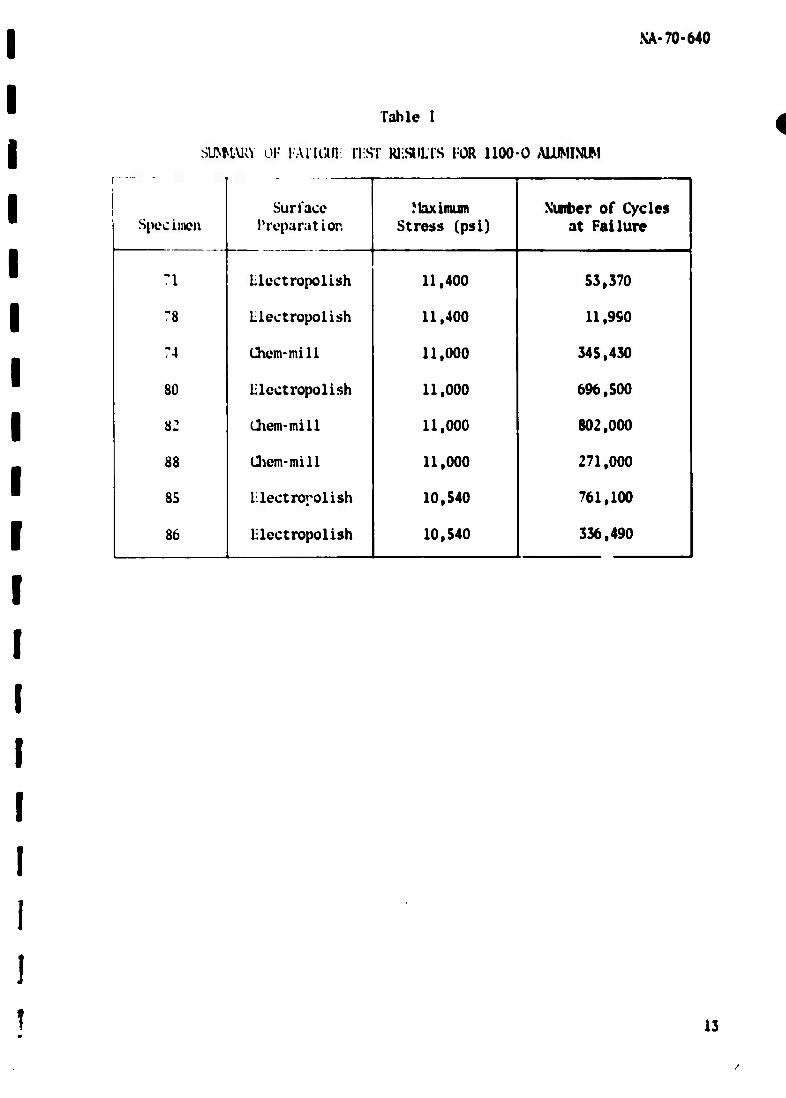
measured in air during test. Table I summarizes the fatigue test results.
Prior to test, the background level for the exoelectron emission was
established after the specimen was irradiated with short-wave ultraviolet
light for at least 18 hours and the collector plate of the current measuring
system was charged to positive 45-volt potential. This procedure was followed
to insure that spurious electron emission due to specimen preparation or
mounting was quiescent. Figure 6 shows the exoelectron emission curves for
four 1100-O aluminum specimens subject to fatigue stressing at 11,000 psi.
The emission current rises rapidly soon after start of the test, reaching the
peak between 40 and 100 cycles. Thereafter, the emission intensity decreases
gradually as cycling proceeds. After the current reaches the initial back-
ground level, it continues to drop until fatigue cracks form. The current
first rises slowly and then rapidly as the cracks propagate through the test
section, leading to complete specimen failure.
At the lower stress level of 10,540 psi, the exoelectron emission curves
of 1100-0 aluminum in fatigue deformation (figure 7) exhibit characteristics
similar to the 11,000 psi data. At a higher itress level of 11,400 psi, the
12
NA-70-640
Table I
SLWIARY Öl-' i AillUn: li:ST RliSlILlS I-OR 1100-O ALUMINUM
Specimen Surface
Preparation Maximum
Stress (psl) Nurber of Cycles
at Failure
"1 Llectropolish 11,400 53,370
78 Llectropolish 11,400 11,990
74 Chem-mill 11,000 345,430
80 Llectropolish 11,000 696,500
82 üiem-mill 11,000 802,000
88 Üiem-mill 11,000 271,000
85 lilectropolish 10,540 761,100
86 Hlectropolish 10,540 336,490
13
NA-70 t40
.s
i £
s I O
i s o
8 •H M M
I
I I
3«9dNV r(-0l 'iNaWfO
14
.^•70-640
o o o
o
CURRENT, lo''2 AMPERE
o o s ^ s >0 * *>
I I I ? O
5
«A
S »
^
§
s
5 I 2 5
8
8
'S 5
audw Z(aoi ,iN3)i\in3
is
NA-70-640
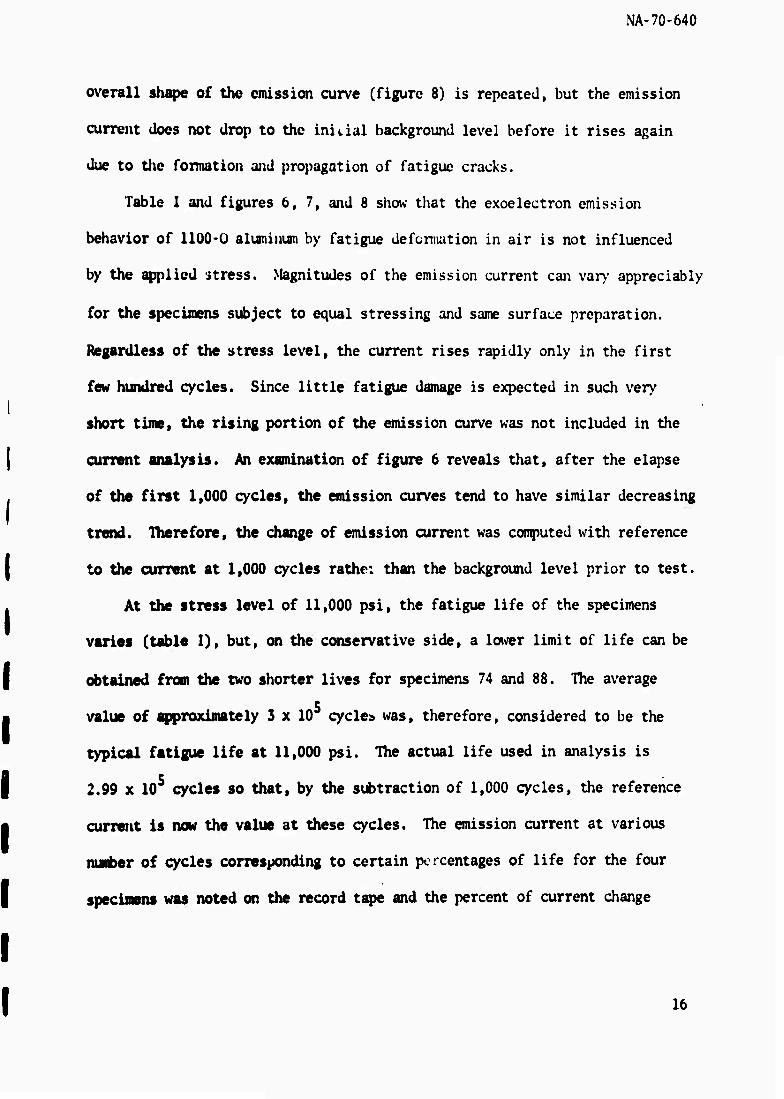
overall shape of the emission curve (figure 8) is repeated, but the emission
current does not drop to the initial background level before it rises again
due to the formation and propagation of fatigue cracks.
Table I and figures 6,7, and 8 show that the exoelectron emission
behavior of 1100-O aluminum by fatigue deformation in air is not influenced
by the applied itress. Magnitudes of the emission current can vary appreciably
for the specimens subject to equal stressing and some surface preparation.
Regardless of the stress level, the current rises rapidly only in the first
few hundred cycles. Since little fatigue damage is expected in such very
short time, the rising portion of the emission curve was not included in the
current analysis. An examination of figure 6 reveals that, after the elapse
of the first 1,000 cycles, the emission curves tend to have similar decreasing
trend. Iherefore, the change of emission current was computed with reference
to the current at 1,000 cycles rathe: than the background level prior to test.
At the stress level of 11,000 psi, the fatigue life of the specimens
varies (table I), but, on the conservative side, a lower limit of life can be
obtained from the two shorter lives for specimens 74 and 88. The average
value of approximately 3 x 10 cycles was, therefore, considered to be the
typical fatigue life at 11,000 psi. Hie actual life used in analysis is
2.99 x 10 cycles so that, by the subtraction of 1,000 cycles, the reference
current is now the value at these cycles. The emission current at various
nunber of cycles corresponding to certain percentages of life for the four
specimens was noted on the record tape and the percent of current change
16
NA-70-640
in ui
u >
O o
tfl
i ■rt
.s
o
8 •H (A tf)
3
S
u.
avsdHv 2(.oi 'iNawns
17
s
I
I I
NA-70-640
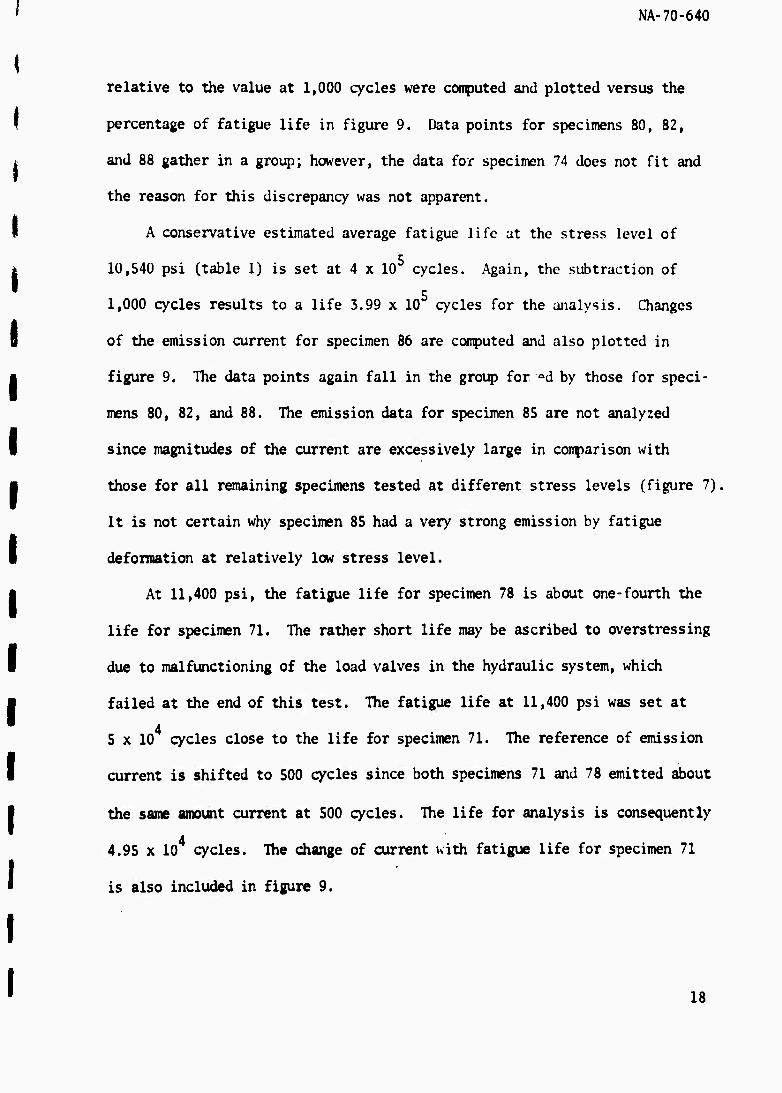
relative to the value at 1,000 cycles were computed and plotted versus the
percentage of fatigue life in figure 9. Data points for specimens 80, 82,
and 88 gather in a group; however, the data for specimen 74 does not fit and
the reason for this discrepancy was not apparent.
A conservative estimated average fatigue life at the stress level of
10,540 psi (table I) is set at 4 x 10 cycles. Again, the subtraction of
1,000 cycles results to a life 3.99 x 10 cycles for the analysis. Changes
of the emission current for specimen 86 are computed and also plotted in
figure 9. The data points again fall in the group for od by those for speci-
mens 80, 82, and 88. The emission data for specimen 85 are not analyzed
since magnitudes of the current are excessively large in comparison with
those for all remaining specimens tested at different stress levels (figure 7).
It is not certain why specimen 85 had a very strong emission by fatigue
deformation at relatively low stress level.
At 11,400 psi, the fatigue life for specimen 78 is about one-fourth the
life for specimen 71. The rather short life may be ascribed to overstressing
due to malfunctioning of the load valves in the hydraulic system, which
failed at the end of this test. The fatigue life at 11,400 psi was set at
4 5 x 10 cycles close to the life for specimen 71. The reference of emission
current is shifted to 500 cycles since both specimens 71 and 78 emitted about
the same amount current at 500 cycles. The life for analysis is consequently
4 4.95 x 10 cycles. The change of current with fatigue life for specimen 71
is also included in figure 9.
18
NA-70-640
=3
z
<
128
112
96
80
61«
k6
32
16
0
0
r">"T SPECIMEN STRESS, SURFACE '
iBOL NO. PSI PREPARATION
X 71 II,1»00 ELECTROPOLISH
0 7A ; 1,000 CHEM-MILL
V 80 11,000 CHEM-MILL
A 82 11,000 CHEM-MILL
Q 86 11,000 ELECTROPOLISH
-♦■ 88 10.SM) ELECTROPOLISH
o
L-i—L l i
20 40 60
PERCENTAGE OF FATIGUE LIFE
80
i
100
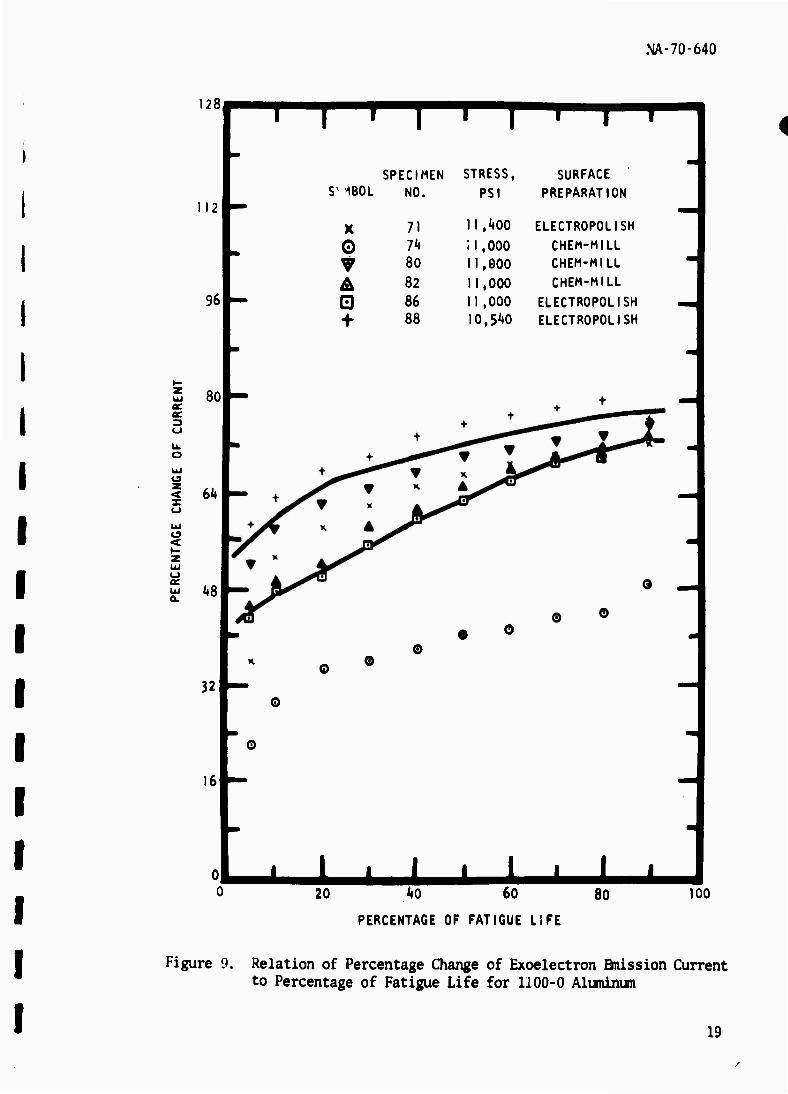
Figure 9. Relation of Percentage Change of Exoelectron Bnission Current to Percentage of Fatigue Life for 1100-0 Aluminum
19
NA-70-640
Figure 9 shows that it is possible to predict the remaining safe fatigue
life of 1100-0 aluminum by estimating the change of exoelectron emission cur-
rent at the end of the spent life, if the change is based upon the current at
the first few hundreds or thousands of cycles when the current decreases
steadily after its initial rapid rise and fall.
It is believed that the relation of the emission current change to the
percentage of fatigue life should be independent of applied stress levels.
A number of specimens subject to fatigue deformation at differing stress
levels exhibit the same percentage change of current after the elapse of
various numbers of cycles. A single curve should tell what the percentages
of life have been spent at these cycles. The remaining safe life can, there-
fore, be easily estimated. A trend approaching this idealized relation is
clearly shown in figure 9, even though a band instead of a single curve is
drawn to cover most of the data points. Therefore, the measurement of exo-
electron emission in air during fatigue stressing is a promising tool for
detecting early fatigue damage and assessing the remaining safe life at least
for 1100-0 aluminum.
There appears to be a similarity in the exoelectron emission curves for
1100-0 aluminum by fatigue deformation in air and in vacuum. Both curves exhibit
an early rapid rise and decay of the emission intensity, and again a rapid rise
shortly before the specimen failure. Though a relationship between the change
of emission intensity and the percentage of fatigue life for the tests in
vacuum is not apparent, a few checks with the emission curves at stress levels
above 10,540 psi indicate a possible existence of such stress-independent trend.
20
I NA-70-640
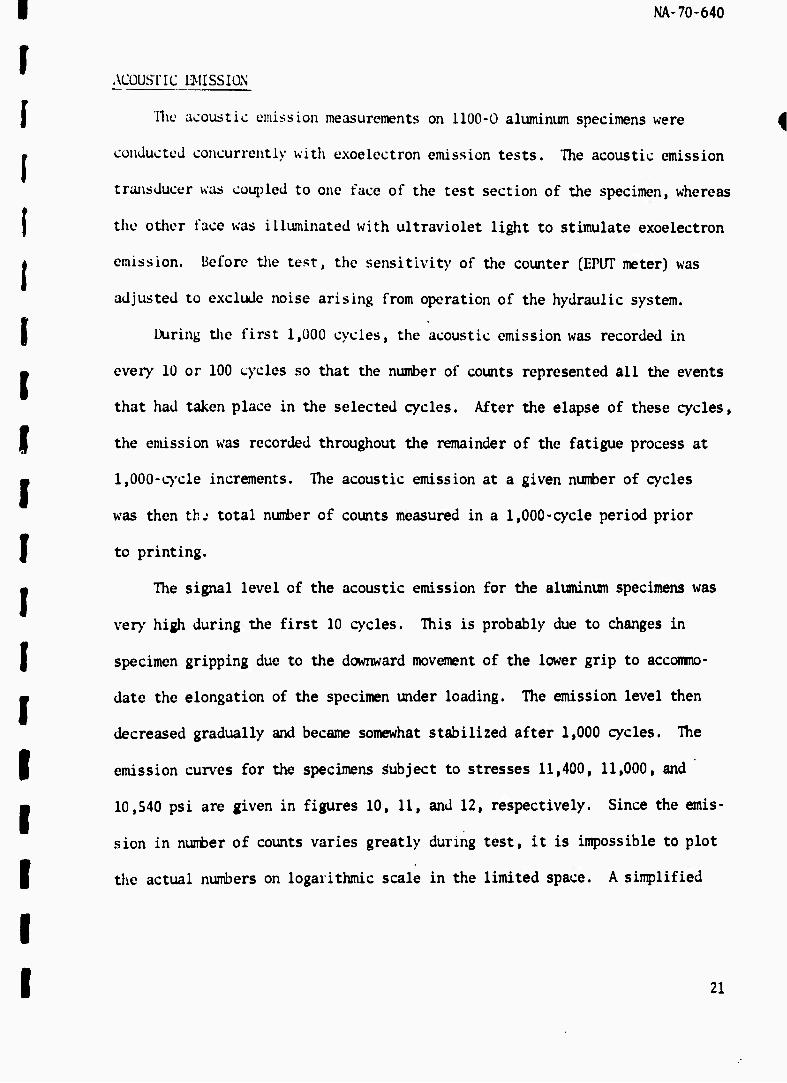
ACOUSTIC 1MSSIQN
Hie acoustic emission measurements on UOO-O aluminum specimens were
conducted concurrently with exoelectron emission tests. The acoustic emission
transducer was coupled to one face of the test section of the specimen, whereas
the other face was illuminated with ultraviolet light to stimulate exoelectron
emission. Before the test, the sensitivity of the counter (EPUT meter) was
adjusted to exclude noise arising from operation of the hydraulic system.
During the first 1,000 cycles, the acoustic emission was recorded in
every 10 or 100 cycles so that the number of counts represented all the events
that had taken place in the selected cycles. After the elapse of these cycles,
the emission was recorded throughout the remainder of the fatigue process at
1,000-cycle increments. The acoustic emission at a given number of cycles
was then th-* total number of counts measured in a 1,000-cycle period prior
to printing.
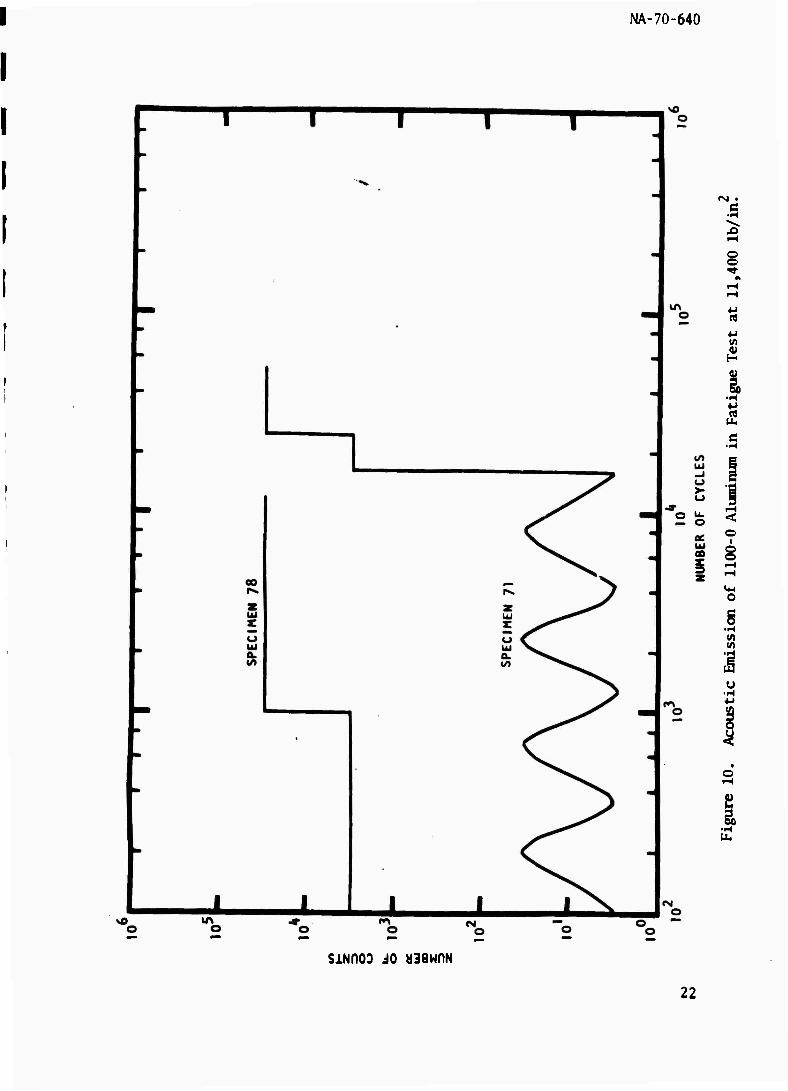
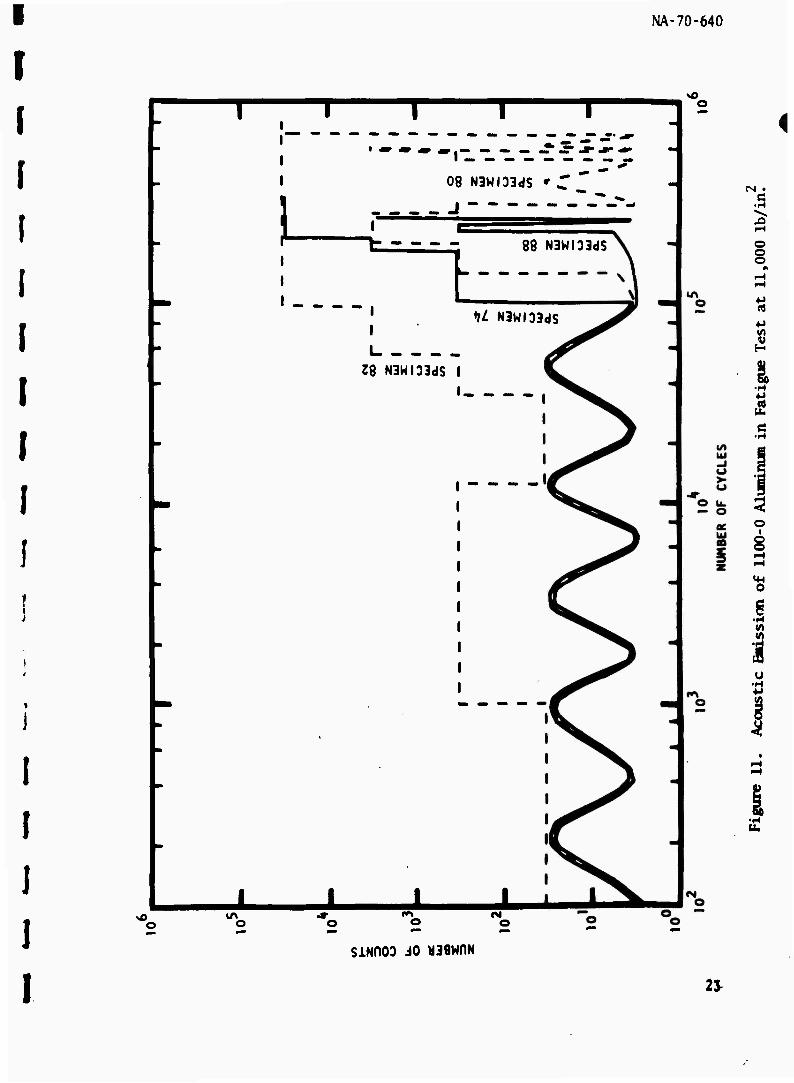
The signal level of the acoustic emission for the aluminum specimens was
very high during the first 10 cycles. This is probably due to changes in
specimen gripping due to the downward movement of the lower grip to accommo-
date the elongation of the specimen under loading. The emission level then
decreased gradually and became somewhat stabilized after 1,000 cycles. Hie
emission curves for the specimens Subject to stresses 11,400, 11,000, and
10,540 psi are given in figures 10, 11, and 12, respectively. Since the emis-
sion in number of counts varies greatly during test, it is impossible to plot
the actual numbers on logarithmic scale in the limited space. A simplified
21
NA-70-640
c
? J* <
i 5 o
g
o o o
SiNn03 iO U3flWnN
22
I
r
^o
NA-70-640
^1 o
i-ii'L-- it:*! 08 N3WI33dS »r J
J
> 88 N3WI33dS
I
I I-
Z8 N3WI33dS I
<rl N3WI33dS
o ö
SiNnOO iO U38HnN
o
CM
o o o
id
I ä s
3 o
o
•H (A (A
I
23^
NA-70-640
<S1 • C
o
4-1 1/1 ft» H
• H 4->
o I o o
o
g « IA
'I
O o
siMnoo io «awnN
24
NA-70-640
presentation ol" the data was made using only the signal variation by the
power jt" 1U, The sinusoidal curve centered between the ordinate scales 10
;ind iü" indicates that the number of counts has either one or two digits. A
horizontal line signifies that the number of counts is of the same order of
magnitude, whereas a vertical line means that the number of counts changes
from one order of magnitude to another at the end of the next 1,000 cycles
when the recorder prints again.
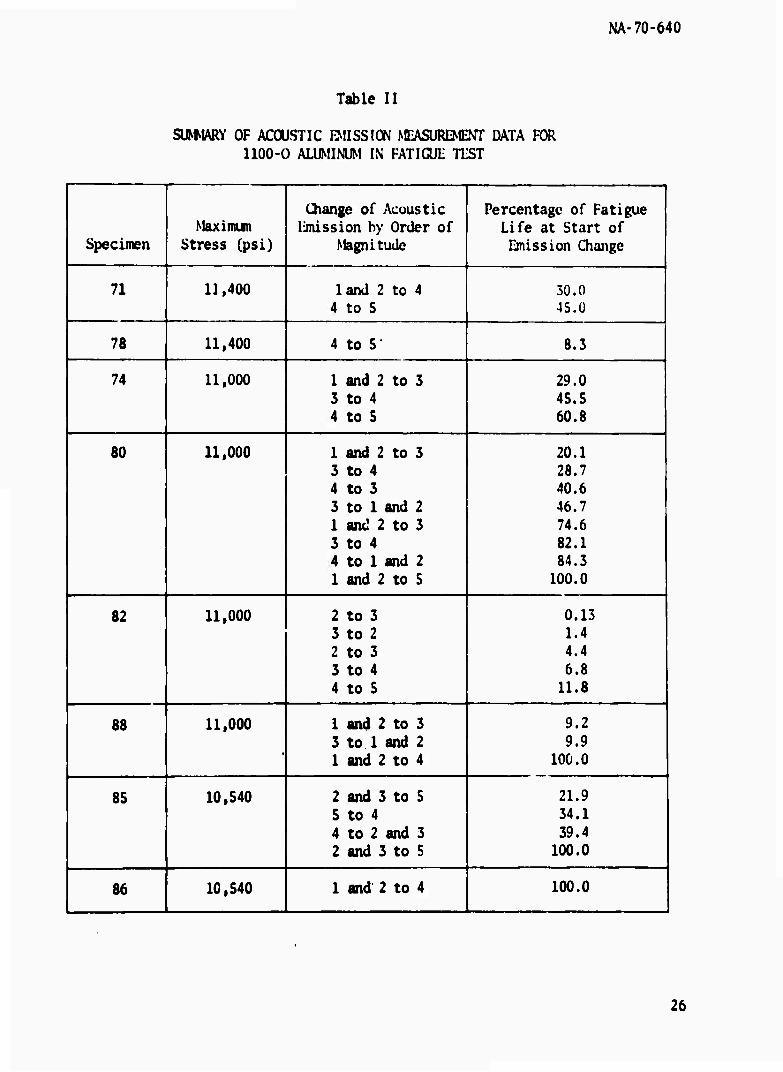
The acoustic emission intensity, measured in number of counts, can change
an order of magnitude several times in the specimen life. Table II sunmarizes
these changes for all the eight 1100-0 aluminum specimens. At a high stress
level of 11,400 psi, the emission intensity is fairly high throughout the
entire life. An increase of one decade in emission from four to five orders
of magnitude occurs before half of the life has been spent. At lower stress
levels of 11,000 and 10,540 psi, the emission intensity is not only somewhat
weaker, but it undergoes several changes in order of magnitude.
In comparing the data presented in table II, it is evident that in seven
of the eight tests the acoustic intensity changed by an order of magnitude
during the period of 8 to 30 percent of the specimen fatigue life. Further,
this is the first significant change noted, and, as such, could be readily
flagged as early indicator of fatigue damage. The data scatter for this
indicator is about 22 percent, and is most likei/ accountable to the scatter
in actual fatigue failure data. Although this indication is considered most
promising, additional tests will be conducted to more firmly establish this
25
NA-70-640
Table II
SUNWARY OF ACOUSTIC EMISSION MEASUREMEtfT DATA FOR 1100-O ALUMINUM IN FATIGUI: TLST
Change of Acoustic Percentage of Fatigue Maximun limission by Order of Life at Start of
Specimen Stress (psi) Magnitude Emission Change
71 11,400 1 and 2 to 4 30.0 4 to 5 45.Ü
78 11,400 4 to 5• 8.3
74 11,000 l and 2 to 3 29.0 3 to 4 45.5 4 to S 60.8
80 11,000 1 and 2 to 3 20.1 3 to 4 28.7 4 to 3 40.6 3 to 1 and 2 46.7 1 and 2 to 3 74.6 3 to 4 82.1 4 to 1 and 2 84.3 1 and 2 to 5 100.0
82 11,000 2 to 3 0.13 3 to 2 1.4 2 to 3 4.4 3 to 4 6.8 4 to 5 11.8
88 11,000 1 and 2 to 3 9.2 3 to 1 and 2 9.9 1 and 2 to 4 100.0
85 10,540 2 and 3 to S 21.9 5 to 4 34.1 4 to 2 and 3 39.4 2 and 3 to 5 100.0
86 10,540 1 and 2 to 4 100.0
26
NA-70-640
relationship and attempt further correlation between the apparently random
variation ol" the acoustic emission, which occurs after the initial major
chonye and before Hie emission obviously associated with the crack propaga-
tion, and specimen failure.
ULTRASOMC MLlllUUS
One of the objectives of this program is to determine the feasibility
of detecting early fatigue damage through ultrasonic measurements. It has
been established that evidence of fatigue usually appears first at the sur-
face of the material. Very small changes such as microcracks originate
within a few microns of the surface and grow until they are large enough to
be detected by optical or metallographic methods.
Ultrasonic longitudinal or shear wave signals penetrate the material
and generally describe the bulk properties of a material. Surface wave
energy, however, travels primarily within one wavelength of the surface.
To increase the relative importance of phenomena at the surface, the depth
of penetration should be as small as possible. High frequency produces short
wavelength and gives added importance to variations at the surface.
The initial investigation using surface wave measurements was perfomed
at frequencies of 10 Mi: and lower because higher frequency transducers were
not available. The wavelength at 10 Miz is about 0.012 inch or 300 microns
for surface waves in aluninum. Sources were sought for surface wave trans-
ducers to operate at bO Mlz where the wavelength and, therefore, the penetra-
tion would be approximately 0.002 inch or SO microns. Several manufacturers
27
NA-70-640
have made experimental units to operate as high as 30 NHz. TVo companies,
Panametrics and Nortec, have offered to design and build higher frequency
units as special items. The Science Center of North American Rockwell
Corporation has had experience with surface wave measurements using both com-
mercial units where available and developing new techniques for special tests.
Other sources are being investigated and several transducers used by Tracor,
Inc, for similar measurements were evaluated. Some of these units are pres-
ently inoperative, and none have been found to operate as well as available
connercial transducers.
An unmounted shear wave crystal made of Y-cut quartz has been obtained
with a nominal natural frequency of 50 Miz. This crystal will be mounted on
a plastic wedge to make an experimental surface wave transducer using mode
conversion.
Both velocity and attenuation of the surface wave are being considered
as possible indicators of fatigue. The microcracks and slip lines are very
small and probably do not have high density in early stages of fatigue. A
change in the ultrasonic velocity or attenuation may be affected by micro-
cracking, stress, etc, during the fatigue process.
The two primary problems currently being studied are (1) how to propa-
gate well-defined high-frequency ultrasonic signals into and ouc of the speci-
mens, and (2) how to measure the velocity or attenuation with sufficient
accuracy to give definitive measurements of small changes.
28
I r
NA-70-640
Time measurements required for velocity have traditionally been made
using a shurp pulse or step function as the ultrasonic signal. This type of
signal consists net ol one frequency, but of a broad band of frequencies.
Since wavelength is different for each frequency component, the depth of pene-
tration is not easily defined. An alternate method of time measurement is to
use continuous-wave signals at a known frequency and measure phase difference
in a known travel distance.
fhe selection of transducers includes consideration of test frequency,
signal damping and acoustic coupling method. Mode conversion wedges tend to
ring or reflect badly, and the coupling changes substantially with either
small differences in applied pressure or small changes in material. The
signal pattern can be changed very significantly by shifting the pressure
from the front to the back of the transducer or by varying the amount of coup-
lant. The optimum wedge angle also changes with the velocity in the specimen.
The importance of this effect increases directly with frequency.
Several other coupling methods are being considered. A comb or ridged
surface coupling with points of contact spaced an integral number of wave-
lengths can be used in some applications. It becomes very difficult to space
these ridges only 0.002 inch as they would need to be at 60 Mlz. Microwave
ultrasonic delay lines are being made by etching interdigital electrode pat-
terns on LiNO. crystals. This performs essentially the same job as the comb
and provides good surface waves in the crystal, but there seems to be no good
way to couple the energy into a metal test specimen. An alternate method
29
NA-70-640
converts longitudinal waves to surface waves in an immersion tank. With the
specimen inmersed in liquid, the attenuation is high.
After surface waves have been generated in the test specimen, there are
several methods by which acoustic signal characteristics can be measured to
determine velocity and attenuation.
Wedge or comb transducers can be used for transmitters or receivers.
Another type of transducer system suitable for receiving only is available
using the Tracor laser system. A narrow beam of light from a HeN'e laser is
focused on the specimen. As a surface wave passes this point, the light
beam is disturbed. Detection may be accomplished by several means. An
interference or heterodyne pattern between direct and reflected light can be
detected by the photodetector. Motion much less than one wavelength of light
can be measured. Another detection method takes advantage of the fact that
surface waves change the angle of the surface. The reflected light can be
passed through a diffraction grating or split by a knife edge to cause rela-
tively large variations in light intensity at the photodetector for small
angular deflections.
When the time delay and signal amplitude have been measured at one loca-
tion on the specimen, the length of the signal path can be changed by a known
increment and a second reading taken. Velocity and attenuation readings can
be based on changes in travel time and signal anplitude. Signal anplitude is
strongly influenced by conjling efficiencies and repeatability of setup pro-
cedures. Methods are being sought to inprove the repeatability and accuracy
of attenuation measurements.
30
1 I f
NA-70-640
Time measurements can be made very accurately, but this advantage is
partly offset by the fact that velocities are not expected to change much.
If velocity differences between fatigued and unfatigued specimens are very
small, it will be necessary to measure both distance and time very accurately.
A method is being considered which would use phase measurements for both dis-
tance and time. If both the laser light frequency and the excitation ultra-
sonic frequency are known very precisely they can be used to accurately
detcmine the other variables.
The accurate measurement of distance by means of laser light and inter-
ference patterns is well established. The distance a specimen is moved car
be determined by the number of wavelengths gained or lost in a heterodyne
system. Using a similar technique, the phase shift of the ultrasonic signal
can be measured over the known distance. The nuirber of full cycles plus the
angular proportion of a partial cycle can be determined. Knowing the distance
moved and the exact phase shift of the ultrasonic signal, we can establish
the wavelength of the surface wave. Knowing wavelength and ultrasonic fre-
quency, the velocity is easily determined.
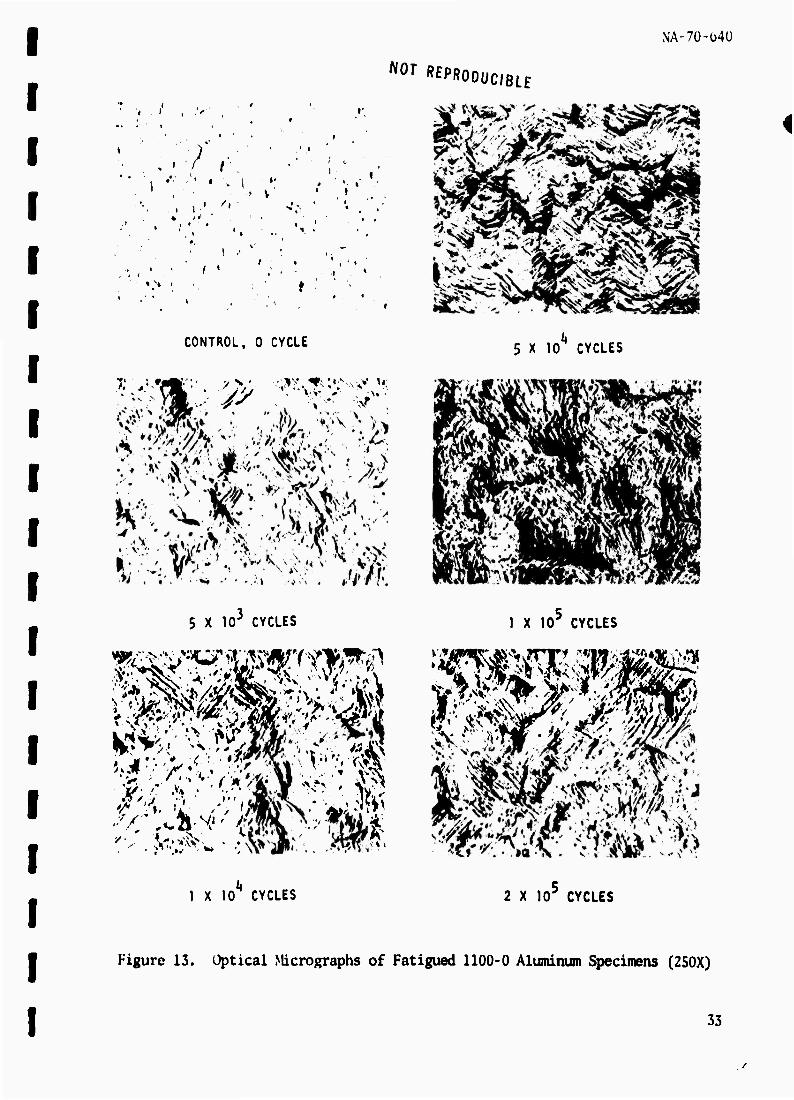
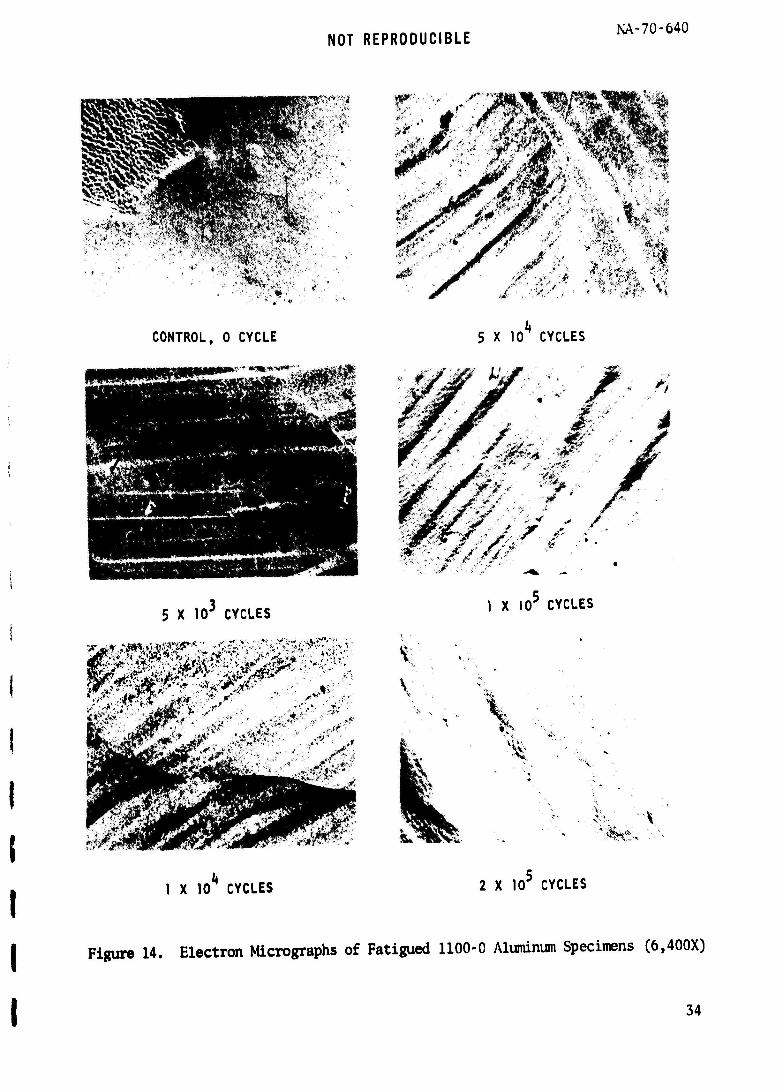
METALLOGRAPHIC HXAMINATION
Metallographic examination using an optical microscope and an electron
microscope was conducted on the six electropolished 1100-O aluminum speci-
mens. One was a control while the other five had been subject to fatigue
3 4 4 deformation at a maximum stress 11,000 psi for 5 x 10 , 1 x 10 , 5 x 10 ,
31
NA-70-640
1 x 10 , and 2 x 10 cycles. Since the average fatigue life at this stress
level is 3 x 10 cycles, the percentages of the spent life for the five speci-
mens are 1.3, 3.3, 16.7, 33.3, and 66.7.
The optical micrographs and electron micrographs for the six specimens
are reproduced in figures 13 and 14, respectively. The control surface shows
a relatively smooth grain structure. The fatigued specimen surface exhibits
considerable evidence of slip. Slip lines or bands are visible on the surface
of the specimen which had spent only about 1.3 percent of the life. These
slip lines are a little widely separated from one another. As the number of
cycles increases, the width between slip lines becomes narrower.
The early appearance of slip lines or bands on the fatigue-deformed sur-
face does not necessarily indicate fatigue damage, since only those slip bands
that are resistant to removal are thought to be the potential nucleation sites
for fatigue cracks. The presence of the persistent bands are usually ascer-
tained by successive removal of deformed surface layers. The removal is bet-
ter performed under secondary electron emission microscope, using gas etching,
because the rate of removal is constant and the fresh, new surface can be
examined in the etching process. This work is now in progress.
FATIGUE TESTS
The average fatigue life of 7075-T6 aluminum alloys at two maximum stress
t 6 levels (40,000 and 6,000 psi) was determined to be 3.3 x 10 and 2.5 x 10
cycles, respectively. Three specimens each were then fatigue tested at these
32
NA-70-Ü4Ü
N0T ^PRODUCIBLE
• < >
> i » w
. * i
« i
CONTROL, 0 CYCLE
5 X 10³ CYCLES
5 X 10 CYCLES
1 X 10^ CYCLES
m
1 X 10 CYCLES 2 X 10^ CYCLES
Figure 13. Optical Micrographs of Fatigued 1100-0 Aluminum Specimens (250X)
33
NOT REPRODUCIBLE NA-70-640
3V,*n
CONTROL, 0 CYCLE 5 X 10 CYCLES
5 X lO^ CYCLES
^^.<ä;-.V
1 x lO3 CYCLES
1
•>
^
■«S^*:,,
1 X 10 CYCLES 2 X 10⁵ CYCLES
I Figure 14. Electron Micrographs of Fatigued 1100-0 Aluminum Specimens (6,400X)
I 34
NA-70-640
stress levels for 2, 5, 10, and 25 percent of the life. The fatigued 1
specimens will be used in ultrasonic tests to correlate fatigue damage with
material response to the propagation of surface waves.
3S
NA-70-640
Section V
SUNWARY AND CONCLUSIONS
The exoelec^ron emission current was characterized in air in terms of
the fatigue deformation of 1100-O aluminum. The current level increases soon
after the start of the test, reaching a peak in the first hundred cycles.
Thereafter, it decreases steadily for the most part of the remaining fatigue
life. Near the end of the life, a slow and then rapid rise of current is
observed. Tliis rise is attributed to the formation and propagation of fatigue
cracks, leading to conplete specimen failure. The variation of the change of
emission current, relative to the current after the elapse of a few hundred
or a few thousand cycles, with time tends to be independent of applied stress
levels. This relationship offers a means to assess the accrued damage as
well as to predict the remaining safe life of the fatigued material.
The acoustic emission of 1100-0 aluminum was measured concurrently with
exoelectron emission tests. The intensity of the acoustic emission, expressed
in number of counts in 1,000 cycles, appears to vary by several orders of
magnitudes during the test. An apparent relationship was established between
the first significant emission level change and the percent of fatigue life.
The change occurs during the early portion of the fatigue life (8 to 30 per-
cent) and offers a possible early fatigue damage warning. Other acoustic
emission tests and characterizations are needed to verify this relationship
and clarify the meaning of subsequent emissions prior to the failure-related
emission activity.
36
NA-70-640
Metallographic examination of fatigued 1100-0 aluminum specimens reveals ^
tlut slip bajiJs appeal- at as early as 1.3 percent of the fatigue life, when
the i;ia,\iiiiuiu applied stress is 11,000 psi. 'Hie bands become more dense with
increasing nuiiiber of cycles.
37
NA-70-640
Section VI
FUTURE WORK
During the next report period, the following major tasks are planned:
1. Investigation of the effect of heat on exoelectron emission. The
emission current of the five UOO-O aluminum specimens which had
been fatigue stressed to various percentages of the life will be
measured while they are being heated up to 194° F (90° C).
2. Continued investigation of the exoelectron emission in air using
7075-T6 aluminum alloy, D6AC steel, and 6A1-4V titanium alloy
specimens. The change of current-percentage of fatigue life
relationship observed in tests on 100-0 aluminum will be checked.
3. Concurrent measurement of acoustic emission with exoelectron emis-
sion to establish and confirm the relationship between acoustic
emission and spent fatigue life.
4. Evaluation of the response of fatigued 7075-T6 aluminum alloy and
D6AC steel to the propagation of ultrasonic surface waves.
38


![1886.] Tlu Book of Jubilees. 455 - BiblicalStudies.org.uk · Tlu Book of Jubilees. 455 relieve the sufferers in the slums, and certainly spiritual maladies, as much as physical afflictions,](https://img.pdfslide.us/doc/110x75/5f5dac0cd795e66fba3d8787/1886-tlu-book-of-jubilees-455-tlu-book-of-jubilees-455-relieve-the-sufferers.jpg)


![tlu~rnnttnt (15azette › gazette › gazette.nsf › gazlist › C...[3791J tlu~rnnttnt (15azette OF AUSTRALIA. [Published by Authority at 3'30 p.m.] [REGIS'l'E!{'ED AT TliE GgNEH..AL](https://img.pdfslide.us/doc/110x75/60bb546aebbc5a72d65cb859/tlurnnttnt-a-gazette-a-gazettensf-a-gazlist-a-c-3791j-tlurnnttnt.jpg)