Embed Size (px)
Citation preview

Total factor productivity in the French wood sector
Bertrand Koebel Phu Nguyen-Van Frederic Olland
BETA, CNRS & Universite de Strasbourg
ECOFOR, Paris, 22.09.2015
KNO TFP ECOFOR, Paris, 22.09.2015 1 / 21

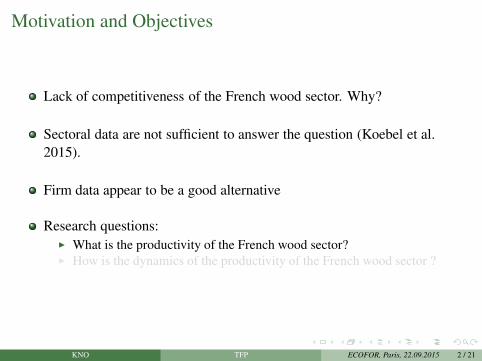
Motivation and Objectives
Lack of competitiveness of the French wood sector. Why?
Sectoral data are not sufficient to answer the question (Koebel et al.
2015).
Firm data appear to be a good alternative
Research questions:
◮ What is the productivity of the French wood sector?◮ How is the dynamics of the productivity of the French wood sector ?
KNO TFP ECOFOR, Paris, 22.09.2015 2 / 21

Findings
The production exhibits decreasing returns to scale
Productivity is improved over the period of study
A catching-up phenomenon for firms with low productivity
Firm productivity converges in the long-run
KNO TFP ECOFOR, Paris, 22.09.2015 3 / 21

Findings
The production exhibits decreasing returns to scale
Productivity is improved over the period of study
A catching-up phenomenon for firms with low productivity
Firm productivity converges in the long-run
KNO TFP ECOFOR, Paris, 22.09.2015 3 / 21

Findings
The production exhibits decreasing returns to scale
Productivity is improved over the period of study
A catching-up phenomenon for firms with low productivity
Firm productivity converges in the long-run
KNO TFP ECOFOR, Paris, 22.09.2015 3 / 21

Findings
The production exhibits decreasing returns to scale
Productivity is improved over the period of study
A catching-up phenomenon for firms with low productivity
Firm productivity converges in the long-run
KNO TFP ECOFOR, Paris, 22.09.2015 3 / 21

Outline
1 Literature
2 Deterministic and stochastic technological changes
3 Data
4 Estimation results (production function, TFP)
5 Dynamics of TFP
6 Concluding remarks
KNO TFP ECOFOR, Paris, 22.09.2015 4 / 21

Literature
Deterministic versus stochastic technological change (Solow 1957)
Production function and productivity (Olley and Pakes 1996, Levinsohn
and Petrin 2003, Ackerberg et al. 2006)
Growth and convergence (Quah 1996, Johnson 2000)
KNO TFP ECOFOR, Paris, 22.09.2015 5 / 21

Literature
Deterministic versus stochastic technological change (Solow 1957)
Production function and productivity (Olley and Pakes 1996, Levinsohn
and Petrin 2003, Ackerberg et al. 2006)
Growth and convergence (Quah 1996, Johnson 2000)
KNO TFP ECOFOR, Paris, 22.09.2015 5 / 21

Literature
Deterministic versus stochastic technological change (Solow 1957)
Production function and productivity (Olley and Pakes 1996, Levinsohn
and Petrin 2003, Ackerberg et al. 2006)
Growth and convergence (Quah 1996, Johnson 2000)
KNO TFP ECOFOR, Paris, 22.09.2015 5 / 21

Deterministic and stochastic technological changes
Consider the production function
Yit = AitKβk
it Lβl
it Mβm
it eεit Ait = A0eαt+ωit
Kit capital stock
Lit employment
Mit intermediate inputs
Ait productivity (TFP)
t time trend (autonomous technological change)
ωit unobserved productivity shocks (stochastic T.C.)
Objective: consistent estimation of elasticities of capital (βk), labor (βl),
intermediate inputs (βm), and two components of TFP (α, and ωit).
KNO TFP ECOFOR, Paris, 22.09.2015 6 / 21

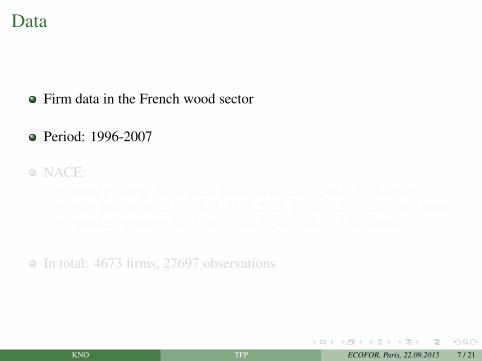
Data
Firm data in the French wood sector
Period: 1996-2007
NACE:
◮ woodworking: 2010, 2020, 2030, 2040, 2051, 2052 (2378 firms)◮ pulp and paper: 2111, 2112, 2121, 2122, 2123, 2124, 2125 (1022 firms)◮ wooden furniture: 3611, 3612, 3613, 3614, 3615 (1302 firms)
In total: 4673 firms, 27697 observations
KNO TFP ECOFOR, Paris, 22.09.2015 7 / 21
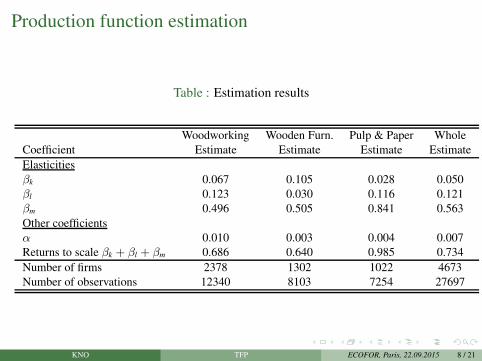
Production function estimation
Table : Estimation results
Woodworking Wooden Furn. Pulp & Paper Whole
Coefficient Estimate Estimate Estimate Estimate
Elasticities
βk 0.067 0.105 0.028 0.050
βl 0.123 0.030 0.116 0.121
βm 0.496 0.505 0.841 0.563
Other coefficients
α 0.010 0.003 0.004 0.007
Returns to scale βk + βl + βm 0.686 0.640 0.985 0.734
Number of firms 2378 1302 1022 4673
Number of observations 12340 8103 7254 27697
KNO TFP ECOFOR, Paris, 22.09.2015 8 / 21

Stochastic TFP estimation (1/2)
5.0 5.5 6.0 6.5 7.0 7.5 8.0
0.0
0.5
1.0
1.5
TFP
Den
sity
199720022007
(a) whole sector
6 7 8 9
0.0
0.5
1.0
1.5
TFPD
ensi
ty
199720022007
(b) woodworking products
Figure : Distribution of stochastic total factor productivity in 1997, 2002, and 2007.
KNO TFP ECOFOR, Paris, 22.09.2015 9 / 21

Stochastic TFP estimation (2/2)
5.0 5.5 6.0 6.5 7.0 7.5 8.0
0.0
0.5
1.0
1.5
TFP
Den
sity
199720022007
(a) wooden furniture
2 3 4 5 6
02
46
810
TFPD
ensi
ty
199720022007
(b) pulp and paper products
Figure : Distribution of stochastic total factor productivity in 1997, 2002, and 2007.
KNO TFP ECOFOR, Paris, 22.09.2015 10 / 21

Growth rate of TFP (1/3)
Ait is composed of two parts, a deterministic part (αt) and a stochastic
part (ωit).
The growth rate of Ait is
Ait
Ait
= α+ ωit.
KNO TFP ECOFOR, Paris, 22.09.2015 11 / 21

Growth rate of TFP (1/3)
Ait is composed of two parts, a deterministic part (αt) and a stochastic
part (ωit).
The growth rate of Ait is
Ait
Ait
= α+ ωit.
KNO TFP ECOFOR, Paris, 22.09.2015 11 / 21
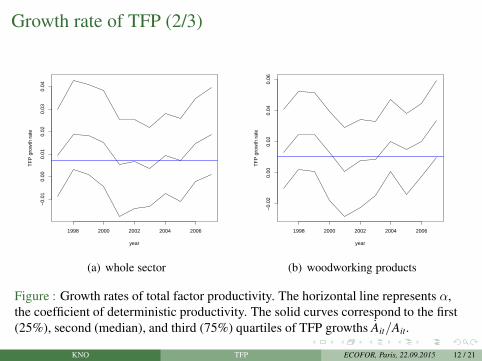
Growth rate of TFP (2/3)
1998 2000 2002 2004 2006
−0.
010.
000.
010.
020.
030.
04
year
TF
P g
row
th r
ate
(a) whole sector
1998 2000 2002 2004 2006
−0.
020.
000.
020.
040.
06
year
TF
P g
row
th r
ate
(b) woodworking products
Figure : Growth rates of total factor productivity. The horizontal line represents α,
the coefficient of deterministic productivity. The solid curves correspond to the first
(25%), second (median), and third (75%) quartiles of TFP growths Ait/Ait.
KNO TFP ECOFOR, Paris, 22.09.2015 12 / 21
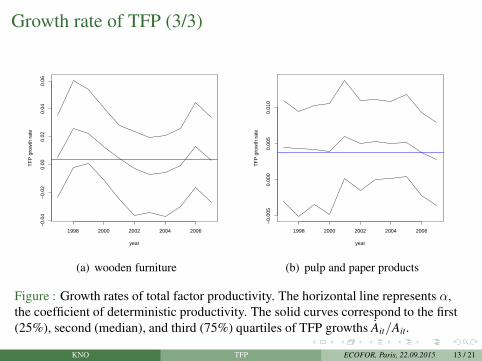
Growth rate of TFP (3/3)
1998 2000 2002 2004 2006
−0.
04−
0.02
0.00
0.02
0.04
0.06
year
TF
P g
row
th r
ate
(a) wooden furniture
1998 2000 2002 2004 2006
−0.
005
0.00
00.
005
0.01
0
year
TF
P g
row
th r
ate
(b) pulp and paper products
Figure : Growth rates of total factor productivity. The horizontal line represents α,
the coefficient of deterministic productivity. The solid curves correspond to the first
(25%), second (median), and third (75%) quartiles of TFP growths Ait/Ait.
KNO TFP ECOFOR, Paris, 22.09.2015 13 / 21

Dynamics of stochastic TFP (1/7)
gτ (y | x) is the conditional density of current TFP given past values of
TFP.
g = transition matrix of TFP between two periods (e.g. between 1997
and 2002, and 2002 and 2007).
We also compute the long-run (ergodic or stationary) distribution of TFP.
Application to 5-year interval data: 1997, 2002, 2007 (to avoid business
cycle effects).
KNO TFP ECOFOR, Paris, 22.09.2015 14 / 21

Dynamics of stochastic TFP (2/7)
past TFP
current TFP
conditional density
(a) surface plot
past TFP
curr
ent T
FP
0.5
0.5
1
1
1.5 1.5
2
2
2.5
2.5
3
3
3
3
3
3.5 4.5
5.5 6.0 6.5 7.0
5.5
6.0
6.5
7.0
(b) contour plot
Figure : Surface and contour plot of conditional density of stochastic TFP
g(current TFP | past TFP), whole sector.
KNO TFP ECOFOR, Paris, 22.09.2015 15 / 21

Dynamics of stochastic TFP (3/7)
past TFP
current TFP
conditional density
(a) surface plot
past TFP
curr
ent T
FP
0.5
0.5
1
1
1.5
1.5
2
2
2.5
2.5
2.5
3
3
6.2 6.4 6.6 6.8 7.0 7.2 7.4
6.5
7.0
7.5
(b) contour plot
Figure : Surface and contour plot of conditional density of stochastic TFP
g(current TFP | past TFP), woodworking products.
KNO TFP ECOFOR, Paris, 22.09.2015 16 / 21

Dynamics of stochastic TFP (4/7)
past TFP
current TFP
conditional density
(a) surface plot
past TFP
curr
ent T
FP
0.5 0.5
1
1
1.5
1.5
2
2
2
2
2
6.0 6.5 7.0 7.5 8.0
6.0
6.5
7.0
7.5
8.0
(b) contour plot
Figure : Surface and contour plot of conditional density of stochastic TFP
g(current TFP | past TFP), wooden furniture.
KNO TFP ECOFOR, Paris, 22.09.2015 17 / 21

Dynamics of stochastic TFP (5/7)
past TFP
current TFP
conditional density
(a) surface plot
past TFP
curr
ent T
FP
2
2
2
2
2
2
2
2
2
2
4
4
4
4
4 4
4
4
4
4
4
4
6
6
6
6
6
6 6
6
6
6
8
8
8
8
10
2.0 2.2 2.4 2.6 2.8 3.0
2.0
2.2
2.4
2.6
2.8
3.0
(b) contour plot
Figure : Surface and contour plot of conditional density of stochastic TFP
g(current TFP | past TFP), pulp and paper products.
KNO TFP ECOFOR, Paris, 22.09.2015 18 / 21

Dynamics of stochastic TFP (6/7)
5.5 6.0 6.5 7.0
0.00
0.01
0.02
0.03
0.04
TFP
ergo
dic
dens
ity
(a) whole sector
6.2 6.4 6.6 6.8 7.0 7.2 7.4
0.00
00.
005
0.01
00.
015
0.02
00.
025
TFPer
godi
c de
nsity
(b) woodworking products
Figure : Ergodic distribution of stochastic TFP.
KNO TFP ECOFOR, Paris, 22.09.2015 19 / 21

Dynamics of stochastic TFP (7/7)
6.0 6.5 7.0 7.5 8.0
0.00
50.
010
0.01
50.
020
0.02
50.
030
TFP
ergo
dic
dens
ity
(a) wooden furniture
2.0 2.2 2.4 2.6 2.8 3.0
0.00
0.02
0.04
0.06
TFPer
godi
c de
nsity
(b) pulp and paper products
Figure : Ergodic distribution of stochastic TFP.
KNO TFP ECOFOR, Paris, 22.09.2015 20 / 21

Concluding remarks
Production in the French wood sector exhibits decreasing returns to scale
Productivity converges
Further developments:
◮ Robustness of the results: other functional forms (CES, etc.)◮ Fixed inputs requirements, fixed costs◮ Trade
KNO TFP ECOFOR, Paris, 22.09.2015 21 / 21

Concluding remarks
Production in the French wood sector exhibits decreasing returns to scale
Productivity converges
Further developments:
◮ Robustness of the results: other functional forms (CES, etc.)◮ Fixed inputs requirements, fixed costs◮ Trade
KNO TFP ECOFOR, Paris, 22.09.2015 21 / 21

Concluding remarks
Production in the French wood sector exhibits decreasing returns to scale
Productivity converges
Further developments:
◮ Robustness of the results: other functional forms (CES, etc.)◮ Fixed inputs requirements, fixed costs◮ Trade
KNO TFP ECOFOR, Paris, 22.09.2015 21 / 21

Concluding remarks
Production in the French wood sector exhibits decreasing returns to scale
Productivity converges
Further developments:
◮ Robustness of the results: other functional forms (CES, etc.)◮ Fixed inputs requirements, fixed costs◮ Trade
KNO TFP ECOFOR, Paris, 22.09.2015 21 / 21

Concluding remarks
Production in the French wood sector exhibits decreasing returns to scale
Productivity converges
Further developments:
◮ Robustness of the results: other functional forms (CES, etc.)◮ Fixed inputs requirements, fixed costs◮ Trade
KNO TFP ECOFOR, Paris, 22.09.2015 21 / 21

Concluding remarks
Production in the French wood sector exhibits decreasing returns to scale
Productivity converges
Further developments:
◮ Robustness of the results: other functional forms (CES, etc.)◮ Fixed inputs requirements, fixed costs◮ Trade
KNO TFP ECOFOR, Paris, 22.09.2015 21 / 21