Embed Size (px)
Citation preview
ASSESSMENT OF THE CHLORIDE MIGRATION COEFFICIENT, INTERNAL FROST RESISTANCE, SALT FROST SCALING AND SULPHATE RESISTANCE OF SELF-COMPACTING CONCRETE - with some interrelated properties Bertil Persson
LUND INSTITUTE OF TECHNOLOGY LUND UNIVERSITY Division of Building Materials
TVBM-3100 Lund 2001

ISRN LUTVDG/TVBM--01/3100--SE(1-86) ISSN 0348-7911 TVBM ISBN 91-631-0855-0 Lund Institute of Technology Telephone: 46-46-2227415 Division of Building Materials Telefax: 46-46-2224427 Box 118 www.byggnadsmaterial.lth.se SE-221 00 Lund, Sweden

LUND INSTITUTE OF TECHNOLOGY
DIVISION OF BUILDING MATERIALS, LUND UNIVERSITY, LUND
ASSESSMENT OF THE CHLORIDE MIGRATION COEFFICIENT, INTERNAL FROST RESISTANCE, SALT FROST SCALING AND SULPHATE RESISTANCE OF SELF-COMPACTING CONCRETE - with some interrelated properties Bertil Persson TVBM-3100 Lund, 2001

ISRN LUTVDG/TVBM—01/3100—SE(1-86) ISSN 0348-7911 TVBM ISBN 91-631-0855-0 Lund Institute of Technology Telephone: +46 46 2227415 Division Building Materials Telefax: +46 46 2224427 P O Box 118 www.bygnadsmaterial.lth.se SE-221 00 Lund, Sweden
PREFACE Concrete that does not require any en-ergy for compacting in order to cover the reinforcement or fill out the mould has attracted a great deal of interest. Swedish experience now exists from 19 full-scale bridges and other full-scale projects with Self-Compacting Con-crete, SCC. The technique has also been introduced for dwelling houses and office buildings. Regarding concrete under severe cir-cumstances for construction of bridges, dams, tunnels and so forth, the re-quirements of durability are greater. Therefore a higher level of documenta-tion is required for concrete under se-vere conditions than for concrete that is used for dwelling houses or office buildings. The primary durability prop-erties are salt frost scaling, internal frost resistance, sulphate resistance and chlo-ride ingress for concrete under severe situations. In this project the objectives were to investigate the chloride migration coef-ficient, D, defined by Tang, to deter-mine the salt frost scaling, the internal frost resistance and the sulphate resis-tance of SCC that contains increased amount of filler, different types of cast-ing and air content. The objective was also to compare the result of salt frost scaling, internal frost resistance, sul-phate resistance and chloride ingress of SCC with the corresponding properties of normal concrete, NC, with the same water-cement ratio, w/c = 0.39. Finally the objective was to give recommenda-tions how to produce a SCC durable to frost and chlorides.
Financial support from the Develop-ment Fund of the Swedish Construction Industry and from Skanska Sweden Ltd is gratefully acknowledged. Acknowl-edgement is also due to Partek Nord-kalk FoU, Pargas, Finland, for an associated project that studied the mechanism behind the effect of lime-stone filler on strength and structure of SCC. Furthermore gratitude is hereby ex-pressed to Ulf Jönsson, who coordi-nated the project and offered many valuable comments from the practical point of view. Finally, many thanks are due to Professor Göran Fagerlund for his critical review and to Bengt Nils-son, Ingemar Larsson and Stefan Backe who carried out most of the laboratory experiments. Lund, 21 December 2001 Bertil Persson

1
CONTENTS Summary and Recommendations 3 Sammanfattning och rekommendationer 5 1. INTRODUCTION, LIMITATIONS AND OBJECTIVE 7 1.1 Introduction 7 1.2 Limitations 7 1.3 Objectives 7 2. PREVIOUS RESEARCH 8 2.1 Effect of w/c on the chloride migration coefficient, D 8 2.2 Effect of additives on the chloride migration coefficient 8 2.3 Effect of self-desiccation and time on the chloride migration coefficient, D 11 2.4 Salt frost scaling 13 2.5 Sulphate resistance 19 3. MATERIALS, MANUFACTURE AND METHODS 20 3.1 Material 20 3.2 Manufacture of specimen 20 3.3 Methods 21 4. RESULTS ON MECHANICAL PROPERTIES, CHLORIDE MIGRATION CO-EFFICIENT AND SALT FROST SCALING 27 4.1 Mechanical properties 27 4.1.1 Grading curves of all solid particles in the fresh mix and strength 27 4.1.2 Early free shrinkage 28 4.1.3 Long-term shrinkage 30 4.1.4 Creep 30 4.2 Chloride migration coefficient, D 31 4.3 Salt frost scaling 33 5. RESULTS ON INTERNAL FROST AND SULPHATES RESISTANCE AND AIR VOIDS 34 5.1 Internal frost resistance 34 5.2 Sulphate resistance 37 5.3 Air void structure 37 6. DISCUSSION 42 6.1 Chloride migration coefficient, D 42 6.2 Salt frost scaling 45 6.3 Internal frost resistance 46 6.4 Sulphate resistance 47 6.5 Air void structure 47 7. CONCLUSIONS AND RECOMMENDATIONS 48 REFERENCES 50 APPENDICES 53-86

2
3
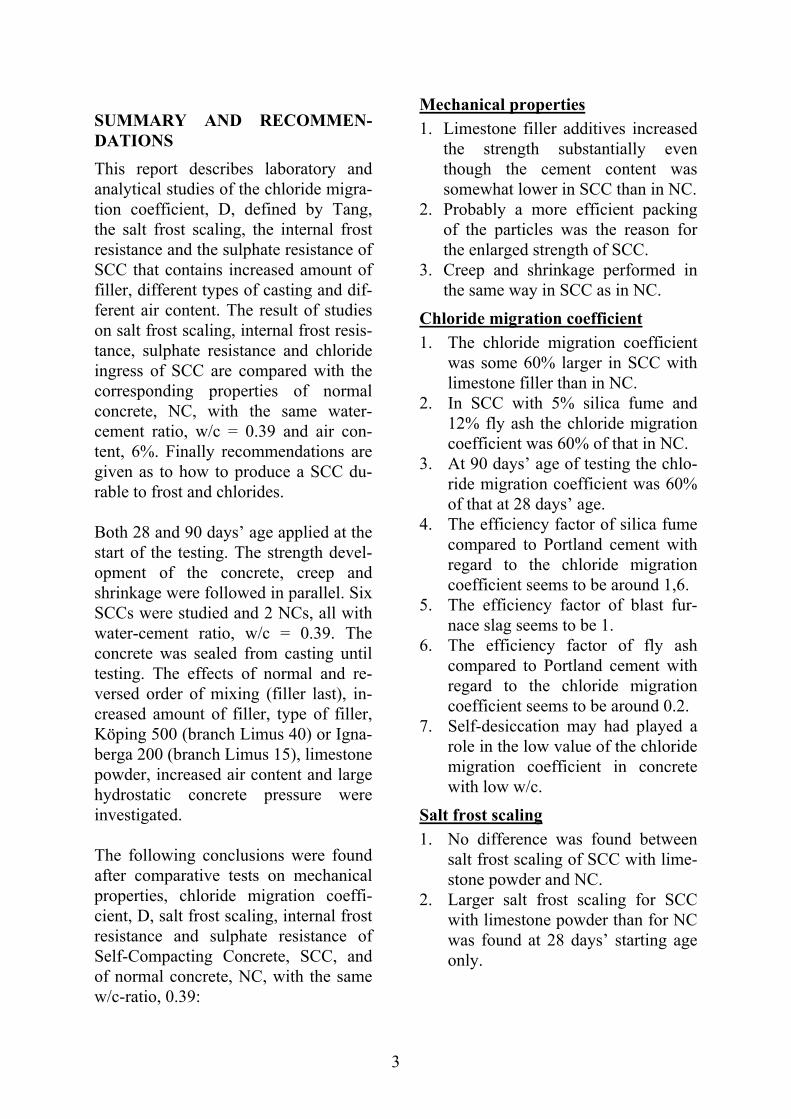
SUMMARY AND RECOMMEN-DATIONS This report describes laboratory and analytical studies of the chloride migra-tion coefficient, D, defined by Tang, the salt frost scaling, the internal frost resistance and the sulphate resistance of SCC that contains increased amount of filler, different types of casting and dif-ferent air content. The result of studies on salt frost scaling, internal frost resis-tance, sulphate resistance and chloride ingress of SCC are compared with the corresponding properties of normal concrete, NC, with the same water-cement ratio, w/c = 0.39 and air con-tent, 6%. Finally recommendations are given as to how to produce a SCC du-rable to frost and chlorides. Both 28 and 90 days’ age applied at the start of the testing. The strength devel-opment of the concrete, creep and shrinkage were followed in parallel. Six SCCs were studied and 2 NCs, all with water-cement ratio, w/c = 0.39. The concrete was sealed from casting until testing. The effects of normal and re-versed order of mixing (filler last), in-creased amount of filler, type of filler, Köping 500 (branch Limus 40) or Igna-berga 200 (branch Limus 15), limestone powder, increased air content and large hydrostatic concrete pressure were investigated. The following conclusions were found after comparative tests on mechanical properties, chloride migration coeffi-cient, D, salt frost scaling, internal frost resistance and sulphate resistance of Self-Compacting Concrete, SCC, and of normal concrete, NC, with the same w/c-ratio, 0.39:
Mechanical properties 1. Limestone filler additives increased
the strength substantially even though the cement content was somewhat lower in SCC than in NC.
2. Probably a more efficient packing of the particles was the reason for the enlarged strength of SCC.
3. Creep and shrinkage performed in the same way in SCC as in NC.
Chloride migration coefficient 1. The chloride migration coefficient
was some 60% larger in SCC with limestone filler than in NC.
2. In SCC with 5% silica fume and 12% fly ash the chloride migration coefficient was 60% of that in NC.
3. At 90 days’ age of testing the chlo-ride migration coefficient was 60% of that at 28 days’ age.
4. The efficiency factor of silica fume compared to Portland cement with regard to the chloride migration coefficient seems to be around 1,6.
5. The efficiency factor of blast fur-nace slag seems to be 1.
6. The efficiency factor of fly ash compared to Portland cement with regard to the chloride migration coefficient seems to be around 0.2.
7. Self-desiccation may had played a role in the low value of the chloride migration coefficient in concrete with low w/c.
Salt frost scaling 1. No difference was found between
salt frost scaling of SCC with lime-stone powder and NC.
2. Larger salt frost scaling for SCC with limestone powder than for NC was found at 28 days’ starting age only.
4
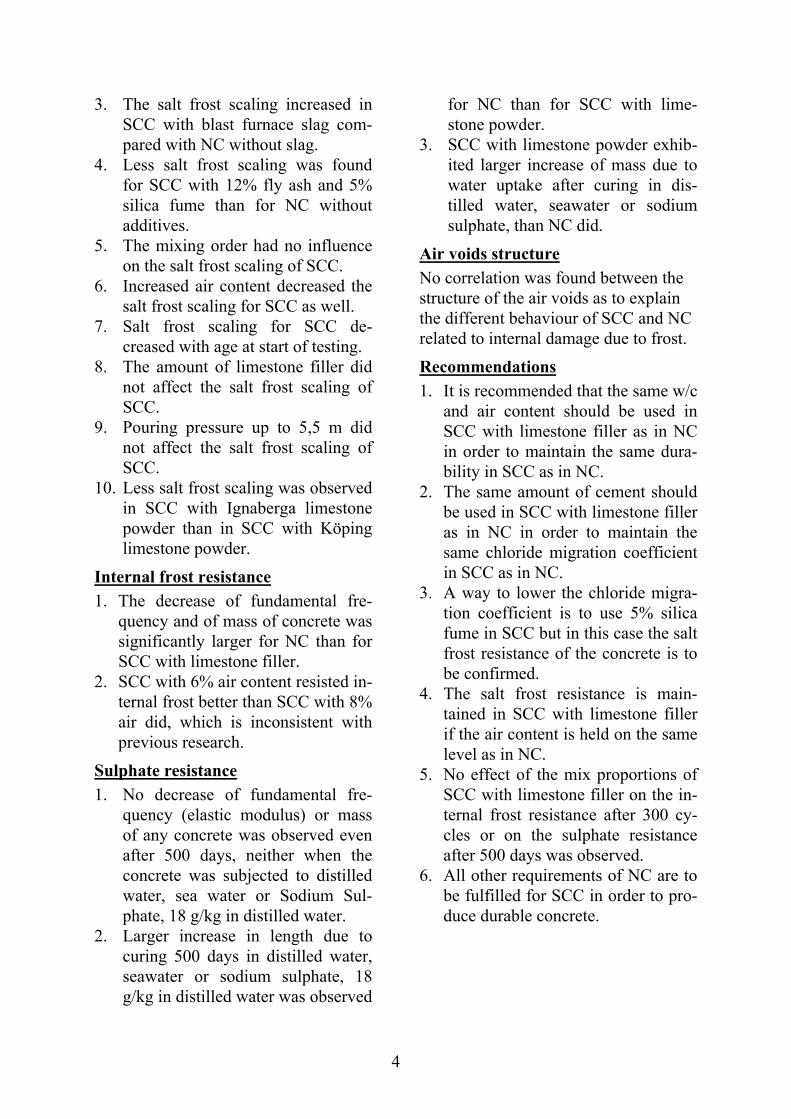
3. The salt frost scaling increased in SCC with blast furnace slag com-pared with NC without slag.
4. Less salt frost scaling was found for SCC with 12% fly ash and 5% silica fume than for NC without additives.
5. The mixing order had no influence on the salt frost scaling of SCC.
6. Increased air content decreased the salt frost scaling for SCC as well.
7. Salt frost scaling for SCC de-creased with age at start of testing.
8. The amount of limestone filler did not affect the salt frost scaling of SCC.
9. Pouring pressure up to 5,5 m did not affect the salt frost scaling of SCC.
10. Less salt frost scaling was observed in SCC with Ignaberga limestone powder than in SCC with Köping limestone powder.
Internal frost resistance 1. The decrease of fundamental fre-
quency and of mass of concrete was significantly larger for NC than for SCC with limestone filler.
2. SCC with 6% air content resisted in-ternal frost better than SCC with 8% air did, which is inconsistent with previous research.
Sulphate resistance 1. No decrease of fundamental fre-
quency (elastic modulus) or mass of any concrete was observed even after 500 days, neither when the concrete was subjected to distilled water, sea water or Sodium Sul-phate, 18 g/kg in distilled water.
2. Larger increase in length due to curing 500 days in distilled water, seawater or sodium sulphate, 18 g/kg in distilled water was observed
for NC than for SCC with lime-stone powder.
3. SCC with limestone powder exhib-ited larger increase of mass due to water uptake after curing in dis-tilled water, seawater or sodium sulphate, than NC did.
Air voids structure No correlation was found between the structure of the air voids as to explain the different behaviour of SCC and NC related to internal damage due to frost.
Recommendations 1. It is recommended that the same w/c
and air content should be used in SCC with limestone filler as in NC in order to maintain the same dura-bility in SCC as in NC.
2. The same amount of cement should be used in SCC with limestone filler as in NC in order to maintain the same chloride migration coefficient in SCC as in NC.
3. A way to lower the chloride migra-tion coefficient is to use 5% silica fume in SCC but in this case the salt frost resistance of the concrete is to be confirmed.
4. The salt frost resistance is main-tained in SCC with limestone filler if the air content is held on the same level as in NC.
5. No effect of the mix proportions of SCC with limestone filler on the in-ternal frost resistance after 300 cy-cles or on the sulphate resistance after 500 days was observed.
6. All other requirements of NC are to be fulfilled for SCC in order to pro-duce durable concrete.
5
SAMMANFATTNING OCH RE-KOMMENDATIONER I denna rapport redovisas laboratorie- och analytiska studier av kloridmigra-tionskoefficienten, D, definierad av Tang, saltfrostavskalningen, den inre frostbeständigheten och sulfatbestän-digheten hos självkompakterande be-tong, SKB, med ökat innehåll av filler, olika typer av filler och gjutmetoder. Resultaten av studierna av saltfrostav-skalning, inre frostbeständigheten, sul-fatresistensen och kloridinträngningen hos SKB jämförs med motsvarande egenskaper hos vibrerad betong, VB, med samma vattencementtal, vct = 0.39, och samma lufthalt, 6%. Slutligen ges rekommendationer hur beständig SKB skall produceras. Såväl 28 som 90 dygns ålder används som starttid för försöken. Hållfasthetsutvecklingen hos betongerna, krypning och krympning följdes parallellt. Sex SKB och två VB studerades, samtliga med vattencement-tal, vct = 0.39. Betongen förseglades från gjutning till provning. Inverkan av normal och omvänd blandningsordning (filler sist), ökad mängd filler, typ av filler, Köping 500 (varumärke Limus 40) eller Ignaberga 200 (varumärke Limus 15) kalkstensmjöl, ökad lufthalt och ökat hydrostatisk tryck vid gjut-ning, undersöktes. Följande slutsatser drogs efter jämfö-rande studier av mekaniska egenskaper, kloridmigrationskoefficienten, D, saltfrostavskalningen, inre frostbestän-dighet och sulfatbeständighet hos själv-kompakterande betong, SKB, och vibrerad betong, VB:
Mekaniska egenskaper 1. Tillsats av kalkstensfiller ökade
hållfastheten avsevärt även om ce-
menthalten var något lägre i SKB än i VB.
2. Troligen var en mer effektiv pack-ningsgrad hos partiklarna i SKB än hos VB orsaken till den ökade håll-fastheten.
3. Krypning och krympning skedde på samma sätt i SKB som i VB.
Kloridmigrationskoefficienten 1. Kloridmigrationskoefficienten var
ungefär 60% större i SKB än i VB. 2. I SKB med 5% silikastoft och 12%
flygaska var kloridmigrationskoeffi-cienten 60% av den som uppmättes i VB.
3. Vid 90 dygns ålder var kloridmigra-tionskoefficienten 60% av den som uppmättes vid 28 dygns ålder.
4. Effektivitetskoefficienten för sili-kastoft jämfört med Portlandcement med avseende på kloridmigrations-koefficienten föreföll ligga kring 1,6.
5. Effektivitetskoefficienten för mas-ugnsslagg jämfört med Portlandce-ment med avseende på kloridmigrationskoefficienten före-föll ligga kring 1.
6. Effektivitetskoefficienten för flygaska jämfört med Portlandce-ment med avseende på kloridmigra-tionskoefficienten föreföll ligga kring 0,2.
7. Självuttorkning kanske spelade en viktig roll för att förklara den låga kloridmigrationskoefficienten vid låga vct.
Saltfrostavskalning 1. Ingen skillnad erhölls mellan salt-
frostavskalning hos SKB med kalk-stensfiller och VB.
2. Vid 28 dygns startålder erhölls dock något större frostavskalning hos SKB än hos VB.
6
3. Saltfrostavskalningen var större i SKB med masugnsslagg än i SKB utan masugnsslagg
4. Saltfrostavskalningen var mindre i SKB med 5% silikastoft och 12% flygaska än i SKB utan dessa till-satsmaterial.
5. Blandningsordningen hade ingen inverkan på saltfrostavskalningen.
6. En ökad lufthalt minskade salt-frostavskalningen även hos SKB.
7. Saltfrostavskalningen för SKB minskade med ökad startålder.
8. Mängden kalkstensfiller i SKB på-verkade ej saltfrostavskalningen
9. Gjuttryck upp till 5,5 m påverkade ej saltfrostavskalningen hos SKB
10. Mindre saltfrostavskalning obser-verades hos SKB med Ingaberga kalkmjöl än hos SKB med Köping kalkmjöl.
Inre frostbeständighet 1. Minskningen av inre egenfrekven-
sen (elasticitetsmodulen) och vikten var signifikant större hos VB än hos SKB med kalkstensfiller.
2. SKB med 6% lufthalt erhöll bättre inre frostbeständighet än SKB med 8% lufthalt.
Sulfatresistens 1. Ingen minskning av inre egenfre-
kvensen (elasticitetsmodulen) eller vikten hos någon betong observera-des efter 500 dygns lagring i endera avjoniserat vatten, havsvatten eller avjoniserat vatten med 18g/l natri-umsulfat.
2. Längdökningen, efter 500 dygns lagring i endera avjoniserat vatten,
havsvatten eller avjoniserat vatten med 18 g/l natriumsulfat, var större hos VB än hos SKB med kalkstens-filler.
3. SKB med kalkstensfiller uppvisade en större viktökning än VB efter lagring 500 dygn i endera avjonise-rat vatten, havsvatten eller avjonise-rat vatten med 18 g/l natriumsulfat.
Luftporstruktur Inget samband återfanns mellan luft-porstruktur och inre förstöring av nor-mal betong till följd frost.
Rekommendationer 1. Det rekommenderas att använda
samma vct och lufthalt i SKB som i VB i syfte att bibehålla samma be-ständighet i SKB som i VB.
2. Samma cementmängd rekommende-ras i SKB som i VB för att erhålla samma kloridmigrationskoefficient i SKB som i VB.
3. Ett sätt att minska kloridmigrations-koefficienten i SKB är att använda 5% silikastoft i SKB men i detta fall skall saltfrostavskalningen bekräf-tas.
4. Saltfrostavskalningen hos SKB med kalkstensfiller bibehålls vid samma lufthalt i SKB som i VB.
5. Efter 500 dygn hade sammansätt-ningen hos SKB ingen inverkan på inre frostbeständigheten eller på sul-fatresistensen.
6. Alla övriga krav på VB skall upp-fyllas för SKB i syfte att erhålla en beständig betong.
7
1. INTRODUCTION, LIMITATIONS AND OBJECTIVE 1.1 Introduction Concrete that does not require any energy for compacting in order to cover the reinforcement or fill out the mould has attracted a great deal of interest in recent years. Swedish experience now exists from 19 full-scale bridges and other full-scale projects with SCC [1]. The technique has also been introduced for dwelling houses and office buildings [2]. Recently SCC has been introduced for the production of poles, piles and pillars [3], Appendix 1. Regarding concrete under severe circumstances for the construction of bridges, dams, tunnels and so forth, the requirements of durability are greater. Therefore a higher level of documentation is required for concrete under severe conditions than for concrete that is used for dwelling houses or office buildings. The primary durability properties are salt frost scaling, internal frost resistance, sulphate resistance and chloride ingress for concrete under severe situations. In this project the objectives were to investigate the chloride migration coefficient, D, defined by Tang, to determine the salt frost scaling, the internal frost resistance and the sulphate resistance of SCC that contains increased amount of filler, different types of casting and air content and to compare the result of salt frost scaling, internal frost resistance, sulphate resistance and chloride ingress of SCC with the corresponding properties of normal concrete, NC, with the same water-cement ratio.
1.2 Limitations The testing of the chloride migration coefficient, D, internal frost resistance, sulphate resistance and salt frost scaling started at both 28 and 90 days’ age. Eight concretes were studied, 2 normal concrete, NC, and 6 self-compacting concrete, SCC, all with water-cement ratio, w/c = 0.39 (c was defined as Portland cement). The concrete was sealed from casting until testing. All the specimens were core-drilled from a larger specimen of concrete. In this way the effects of bleeding, carbonation, concrete skin, crazing, segregation and so forth were avoided. The following parameters were studied: 1. Normal and reversed order of
mixing (filler first or last). 2. Different filler amount (low or
high). 3. Limestone powder of old or young
type from the geological point of view (≈ 200 or 20 million years old).
4. Different air content (normal or increased air-entrainment).
5. Hydrostatic pressure on the fresh concrete mass.
6. Different ambient environment such as fresh water, sea water, salt water, sulphate water, frost cycles or 5°C.
1.3 Objectives The objectives of the project was to investigate the chloride migration coefficient, D, defined by Tang [4], to determine the salt frost scaling, the internal frost resistance and the sulphate resistance of SCC that contains increased amount of filler. The results were to be compared with the corresponding durability resistance components of NC.
8
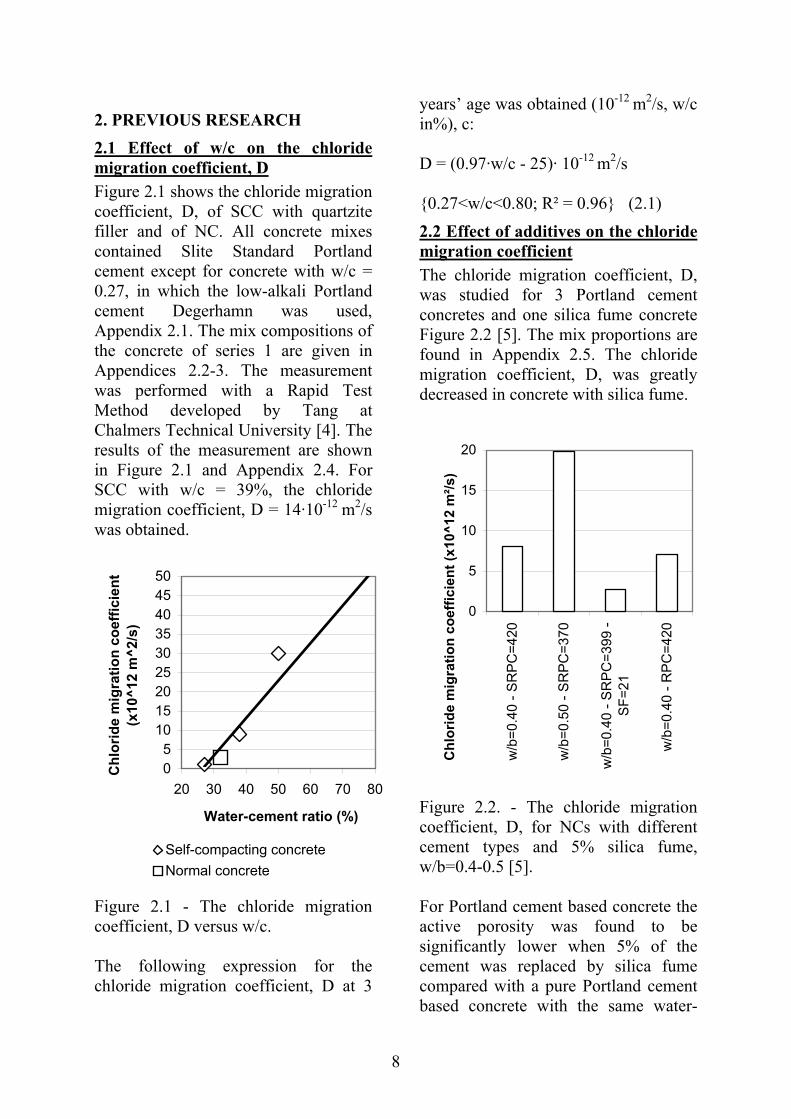
2. PREVIOUS RESEARCH 2.1 Effect of w/c on the chloride migration coefficient, D Figure 2.1 shows the chloride migration coefficient, D, of SCC with quartzite filler and of NC. All concrete mixes contained Slite Standard Portland cement except for concrete with w/c = 0.27, in which the low-alkali Portland cement Degerhamn was used, Appendix 2.1. The mix compositions of the concrete of series 1 are given in Appendices 2.2-3. The measurement was performed with a Rapid Test Method developed by Tang at Chalmers Technical University [4]. The results of the measurement are shown in Figure 2.1 and Appendix 2.4. For SCC with w/c = 39%, the chloride migration coefficient, D = 14·10-12 m2/s was obtained.
05
101520253035404550
20 30 40 50 60 70 80
Water-cement ratio (%)
Chl
orid
e m
igra
tion
coef
ficie
nt
(x10
^12
m^2
/s)
Self-compacting concreteNormal concrete
Figure 2.1 - The chloride migration coefficient, D versus w/c. The following expression for the chloride migration coefficient, D at 3
years’ age was obtained (10-12 m2/s, w/c in%), c: D = (0.97·w/c - 25)· 10-12 m2/s {0.27<w/c<0.80; R² = 0.96} (2.1) 2.2 Effect of additives on the chloride migration coefficient The chloride migration coefficient, D, was studied for 3 Portland cement concretes and one silica fume concrete Figure 2.2 [5]. The mix proportions are found in Appendix 2.5. The chloride migration coefficient, D, was greatly decreased in concrete with silica fume.
0
5
10
15
20
w/b
=0.4
0 - S
RP
C=4
20
w/b
=0.5
0 - S
RP
C=3
70
w/b
=0.4
0 - S
RP
C=3
99 -
SF=
21
w/b
=0.4
0 - R
PC
=420
Chl
orid
e m
igra
tion
coef
ficie
nt (x
10^1
2 m
²/s)
Figure 2.2. - The chloride migration coefficient, D, for NCs with different cement types and 5% silica fume, w/b=0.4-0.5 [5]. For Portland cement based concrete the active porosity was found to be significantly lower when 5% of the cement was replaced by silica fume compared with a pure Portland cement based concrete with the same water-
9
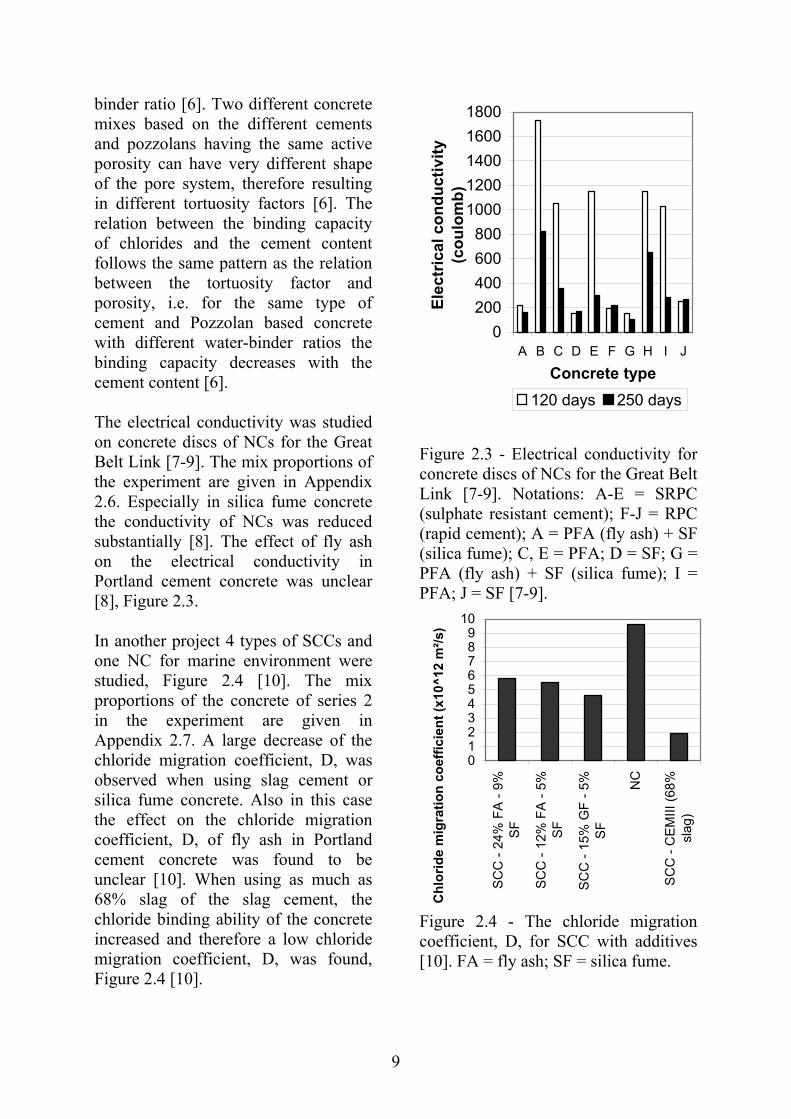
binder ratio [6]. Two different concrete mixes based on the different cements and pozzolans having the same active porosity can have very different shape of the pore system, therefore resulting in different tortuosity factors [6]. The relation between the binding capacity of chlorides and the cement content follows the same pattern as the relation between the tortuosity factor and porosity, i.e. for the same type of cement and Pozzolan based concrete with different water-binder ratios the binding capacity decreases with the cement content [6]. The electrical conductivity was studied on concrete discs of NCs for the Great Belt Link [7-9]. The mix proportions of the experiment are given in Appendix 2.6. Especially in silica fume concrete the conductivity of NCs was reduced substantially [8]. The effect of fly ash on the electrical conductivity in Portland cement concrete was unclear [8], Figure 2.3. In another project 4 types of SCCs and one NC for marine environment were studied, Figure 2.4 [10]. The mix proportions of the concrete of series 2 in the experiment are given in Appendix 2.7. A large decrease of the chloride migration coefficient, D, was observed when using slag cement or silica fume concrete. Also in this case the effect on the chloride migration coefficient, D, of fly ash in Portland cement concrete was found to be unclear [10]. When using as much as 68% slag of the slag cement, the chloride binding ability of the concrete increased and therefore a low chloride migration coefficient, D, was found, Figure 2.4 [10].
0200400600800
10001200140016001800
A B C D E F G H I J
Concrete type
Elec
tric
al c
ondu
ctiv
ity
(cou
lom
b)
120 days 250 days
Figure 2.3 - Electrical conductivity for concrete discs of NCs for the Great Belt Link [7-9]. Notations: A-E = SRPC (sulphate resistant cement); F-J = RPC (rapid cement); A = PFA (fly ash) + SF (silica fume); C, E = PFA; D = SF; G = PFA (fly ash) + SF (silica fume); I = PFA; J = SF [7-9].
0123456789
10
SC
C -
24%
FA
- 9%
SF
SC
C -
12%
FA
- 5%
SF
SC
C -
15%
GF
- 5%
SF
NC
SC
C -
CE
MIII
(68%
slag
)
Chl
orid
e m
igra
tion
coef
ficie
nt (x
10^1
2 m
²/s)
Figure 2.4 - The chloride migration coefficient, D, for SCC with additives [10]. FA = fly ash; SF = silica fume.
10
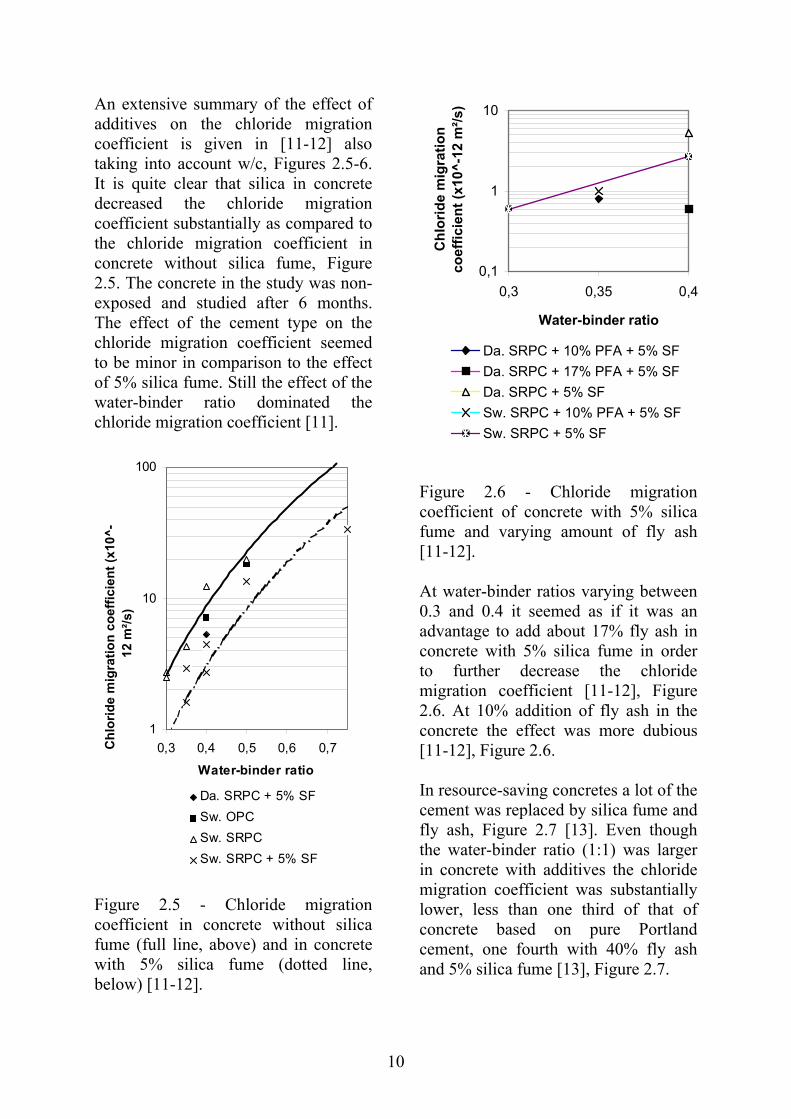
An extensive summary of the effect of additives on the chloride migration coefficient is given in [11-12] also taking into account w/c, Figures 2.5-6. It is quite clear that silica in concrete decreased the chloride migration coefficient substantially as compared to the chloride migration coefficient in concrete without silica fume, Figure 2.5. The concrete in the study was non-exposed and studied after 6 months. The effect of the cement type on the chloride migration coefficient seemed to be minor in comparison to the effect of 5% silica fume. Still the effect of the water-binder ratio dominated the chloride migration coefficient [11].
1
10
100
0,3 0,4 0,5 0,6 0,7
Water-binder ratio
Chl
orid
e m
igra
tion
coef
ficie
nt (x
10^-
12 m
²/s)
Da. SRPC + 5% SFSw. OPCSw. SRPCSw. SRPC + 5% SF
Figure 2.5 - Chloride migration coefficient in concrete without silica fume (full line, above) and in concrete with 5% silica fume (dotted line, below) [11-12].
0,1
1
10
0,3 0,35 0,4
Water-binder ratio
Chl
orid
e m
igra
tion
coef
ficie
nt (x
10^-
12 m
²/s)
Da. SRPC + 10% PFA + 5% SFDa. SRPC + 17% PFA + 5% SFDa. SRPC + 5% SFSw. SRPC + 10% PFA + 5% SFSw. SRPC + 5% SF
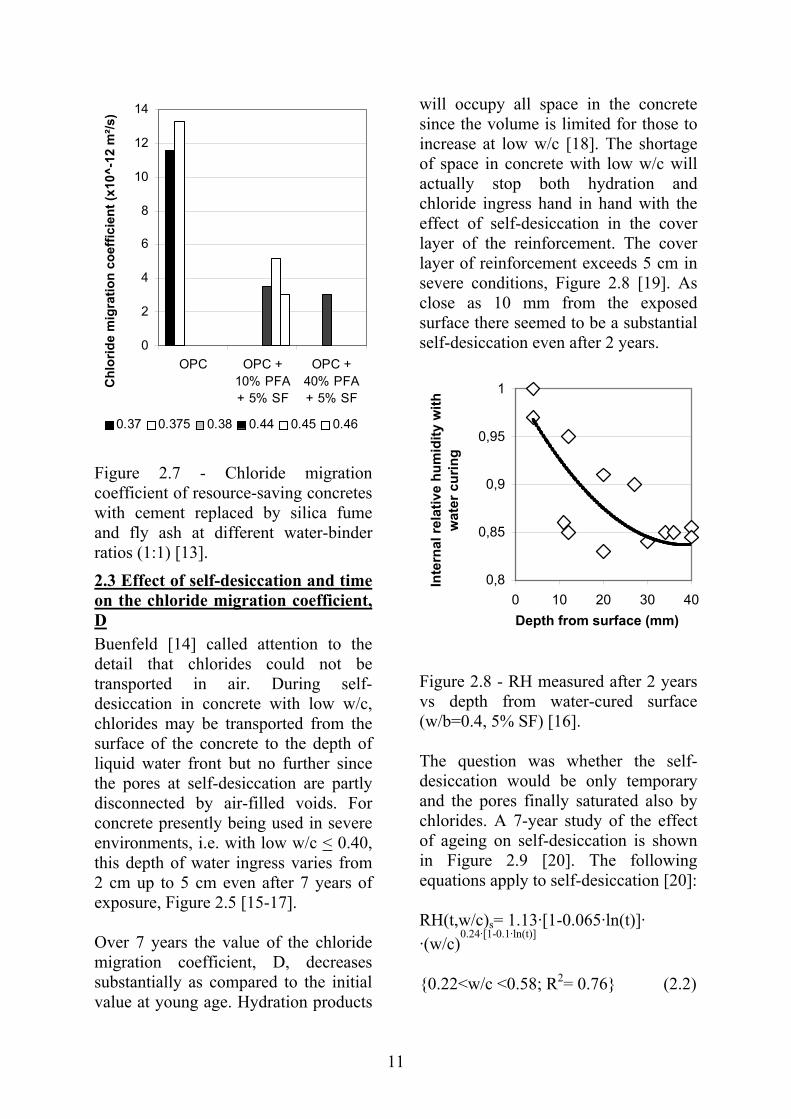
Figure 2.6 - Chloride migration coefficient of concrete with 5% silica fume and varying amount of fly ash [11-12]. At water-binder ratios varying between 0.3 and 0.4 it seemed as if it was an advantage to add about 17% fly ash in concrete with 5% silica fume in order to further decrease the chloride migration coefficient [11-12], Figure 2.6. At 10% addition of fly ash in the concrete the effect was more dubious [11-12], Figure 2.6. In resource-saving concretes a lot of the cement was replaced by silica fume and fly ash, Figure 2.7 [13]. Even though the water-binder ratio (1:1) was larger in concrete with additives the chloride migration coefficient was substantially lower, less than one third of that of concrete based on pure Portland cement, one fourth with 40% fly ash and 5% silica fume [13], Figure 2.7.
11
0
2
4
6
8
10
12
14
OPC OPC +10% PFA+ 5% SF
OPC +40% PFA+ 5% SF
Chl
orid
e m
igra
tion
coef
ficie
nt (x
10^-
12 m
²/s)
0.37 0.375 0.38 0.44 0.45 0.46
Figure 2.7 - Chloride migration coefficient of resource-saving concretes with cement replaced by silica fume and fly ash at different water-binder ratios (1:1) [13]. 2.3 Effect of self-desiccation and time on the chloride migration coefficient, D Buenfeld [14] called attention to the detail that chlorides could not be transported in air. During self-desiccation in concrete with low w/c, chlorides may be transported from the surface of the concrete to the depth of liquid water front but no further since the pores at self-desiccation are partly disconnected by air-filled voids. For concrete presently being used in severe environments, i.e. with low w/c < 0.40, this depth of water ingress varies from 2 cm up to 5 cm even after 7 years of exposure, Figure 2.5 [15-17]. Over 7 years the value of the chloride migration coefficient, D, decreases substantially as compared to the initial value at young age. Hydration products
will occupy all space in the concrete since the volume is limited for those to increase at low w/c [18]. The shortage of space in concrete with low w/c will actually stop both hydration and chloride ingress hand in hand with the effect of self-desiccation in the cover layer of the reinforcement. The cover layer of reinforcement exceeds 5 cm in severe conditions, Figure 2.8 [19]. As close as 10 mm from the exposed surface there seemed to be a substantial self-desiccation even after 2 years.
0,8
0,85
0,9
0,95
1
0 10 20 30 40Depth from surface (mm)
Inte
rnal
rela
tive
hum
idity
with
w
ater
cur
ing
Figure 2.8 - RH measured after 2 years vs depth from water-cured surface (w/b=0.4, 5% SF) [16]. The question was whether the self-desiccation would be only temporary and the pores finally saturated also by chlorides. A 7-year study of the effect of ageing on self-desiccation is shown in Figure 2.9 [20]. The following equations apply to self-desiccation [20]: RH(t,w/c)s= 1.13·[1-0.065·ln(t)]· ·(w/c)
0.24·[1-0.1·ln(t)] {0.22<w/c <0.58; R2= 0.76} (2.2)
12
0,75
0,8
0,85
0,9
0,95
1
1 10 100Age (months)
RH
50
mm
from
wat
er c
ured
sur
face
22S 24 24S 3336S 47 48S 58
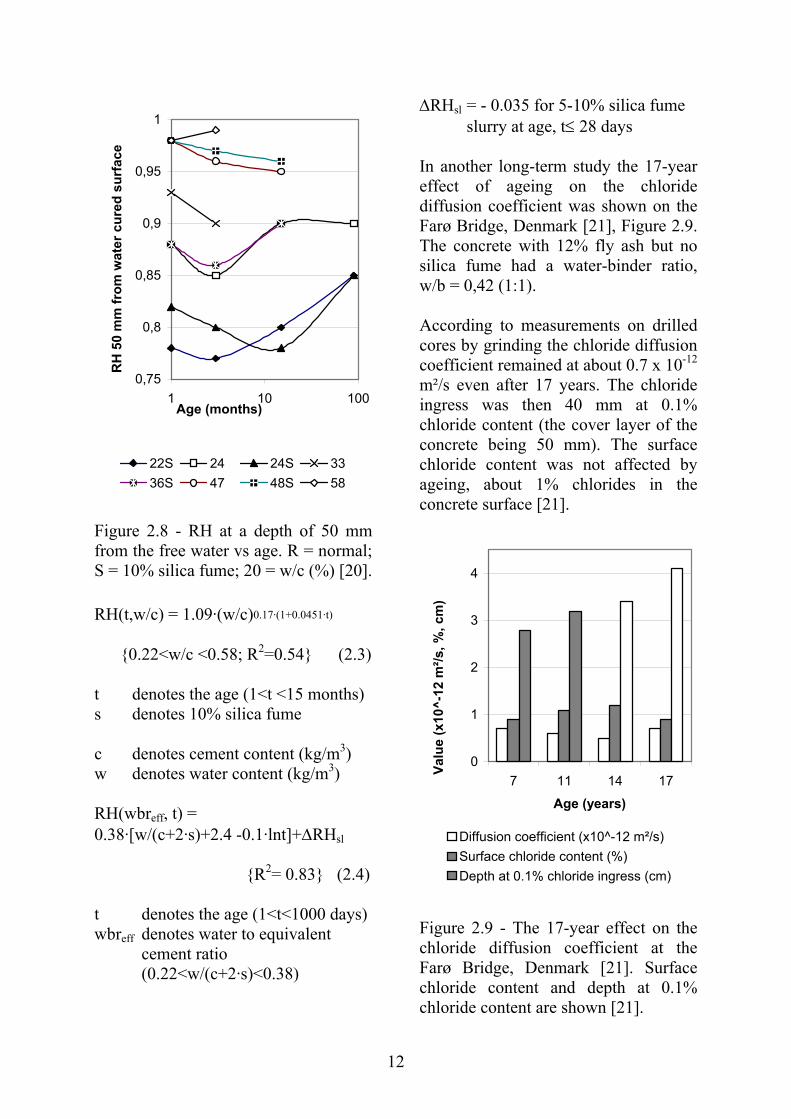
Figure 2.8 - RH at a depth of 50 mm from the free water vs age. R = normal; S = 10% silica fume; 20 = w/c (%) [20]. RH(t,w/c) = 1.09·(w/c)0.17·(1+0.0451·t) {0.22<w/c <0.58; R2=0.54} (2.3) t denotes the age (1<t <15 months) s denotes 10% silica fume c denotes cement content (kg/m3) w denotes water content (kg/m3) RH(wbreff, t) = 0.38·[w/(c+2·s)+2.4 -0.1·lnt]+∆RHsl {R2= 0.83} (2.4) t denotes the age (1<t<1000 days) wbreff denotes water to equivalent
cement ratio (0.22<w/(c+2·s)<0.38)
∆RHsl = - 0.035 for 5-10% silica fume slurry at age, t≤ 28 days
In another long-term study the 17-year effect of ageing on the chloride diffusion coefficient was shown on the Farø Bridge, Denmark [21], Figure 2.9. The concrete with 12% fly ash but no silica fume had a water-binder ratio, w/b = 0,42 (1:1). According to measurements on drilled cores by grinding the chloride diffusion coefficient remained at about 0.7 x 10⁻¹² m²/s even after 17 years. The chloride ingress was then 40 mm at 0.1% chloride content (the cover layer of the concrete being 50 mm). The surface chloride content was not affected by ageing, about 1% chlorides in the concrete surface [21].
0
1
2
3
4
7 11 14 17
Age (years)
Valu
e (x
10^-
12 m
²/s, %
, cm
)
Diffusion coefficient (x10^-12 m²/s)Surface chloride content (%)Depth at 0.1% chloride ingress (cm)
Figure 2.9 - The 17-year effect on the chloride diffusion coefficient at the Farø Bridge, Denmark [21]. Surface chloride content and depth at 0.1% chloride content are shown [21].
13
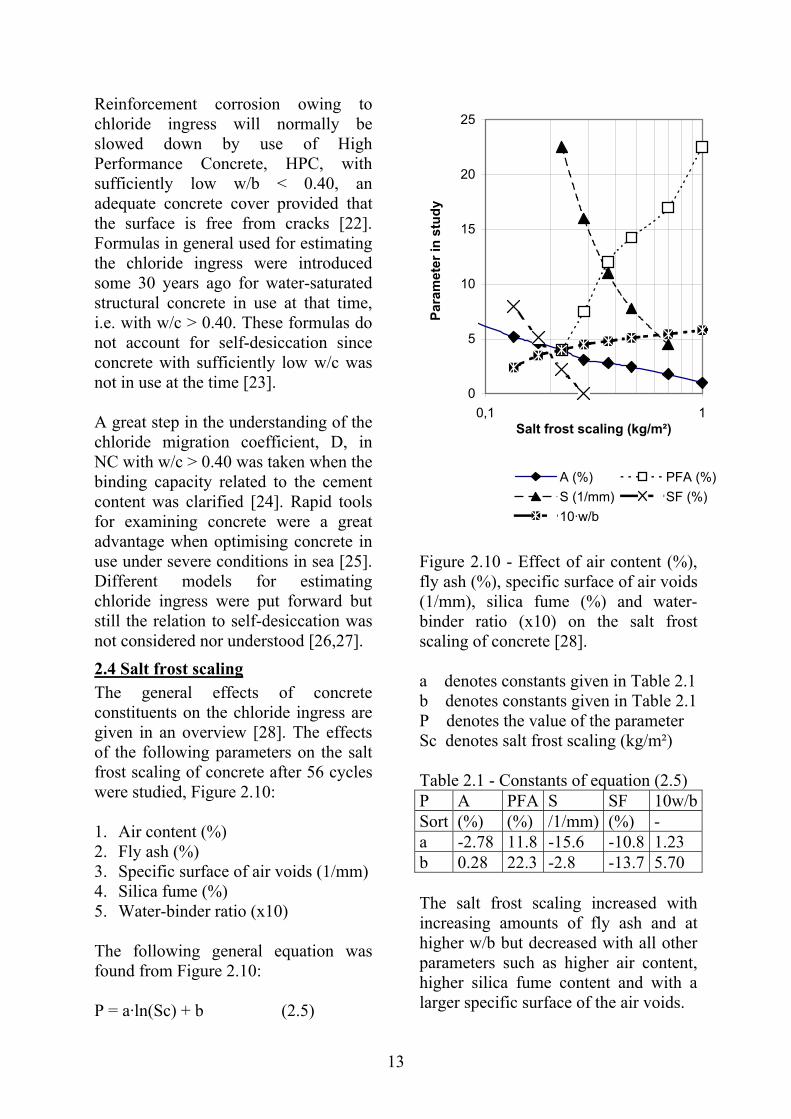
Reinforcement corrosion owing to chloride ingress will normally be slowed down by use of High Performance Concrete, HPC, with sufficiently low w/b < 0.40, an adequate concrete cover provided that the surface is free from cracks [22]. Formulas in general used for estimating the chloride ingress were introduced some 30 years ago for water-saturated structural concrete in use at that time, i.e. with w/c > 0.40. These formulas do not account for self-desiccation since concrete with sufficiently low w/c was not in use at the time [23]. A great step in the understanding of the chloride migration coefficient, D, in NC with w/c > 0.40 was taken when the binding capacity related to the cement content was clarified [24]. Rapid tools for examining concrete were a great advantage when optimising concrete in use under severe conditions in sea [25]. Different models for estimating chloride ingress were put forward but still the relation to self-desiccation was not considered nor understood [26,27]. 2.4 Salt frost scaling The general effects of concrete constituents on the chloride ingress are given in an overview [28]. The effects of the following parameters on the salt frost scaling of concrete after 56 cycles were studied, Figure 2.10: 1. Air content (%) 2. Fly ash (%) 3. Specific surface of air voids (1/mm) 4. Silica fume (%) 5. Water-binder ratio (x10) The following general equation was found from Figure 2.10: P = a·ln(Sc) + b (2.5)
0
5
10
15
20
25
0,1 1Salt frost scaling (kg/m²)
Para
met
er in
stu
dy
A (%) PFA (%)S (1/mm) SF (%)10·w/b
Figure 2.10 - Effect of air content (%), fly ash (%), specific surface of air voids (1/mm), silica fume (%) and water-binder ratio (x10) on the salt frost scaling of concrete [28]. a denotes constants given in Table 2.1 b denotes constants given in Table 2.1 P denotes the value of the parameter Sc denotes salt frost scaling (kg/m²) Table 2.1 - Constants of equation (2.5) P A PFA S SF 10w/bSort (%) (%) /1/mm) (%) - a -2.78 11.8 -15.6 -10.8 1.23 b 0.28 22.3 -2.8 -13.7 5.70 The salt frost scaling increased with increasing amounts of fly ash and at higher w/b but decreased with all other parameters such as higher air content, higher silica fume content and with a larger specific surface of the air voids.
14
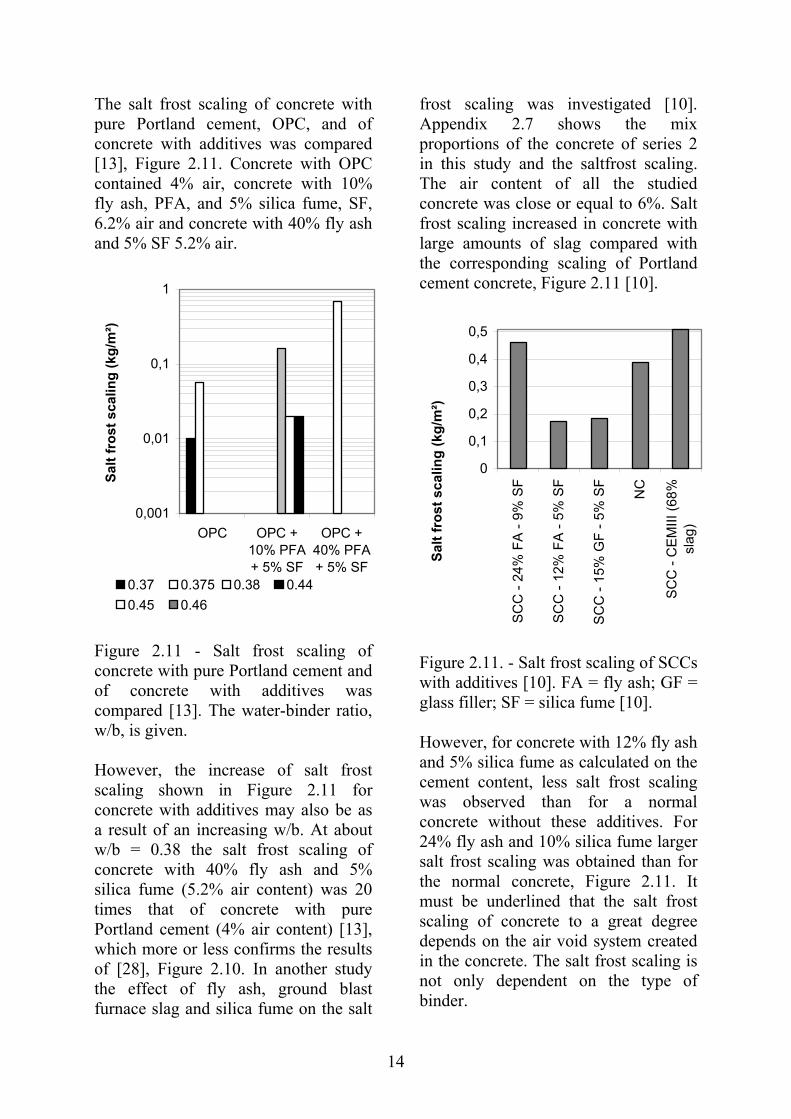
The salt frost scaling of concrete with pure Portland cement, OPC, and of concrete with additives was compared [13], Figure 2.11. Concrete with OPC contained 4% air, concrete with 10% fly ash, PFA, and 5% silica fume, SF, 6.2% air and concrete with 40% fly ash and 5% SF 5.2% air.
0,001
0,01
0,1
1
OPC OPC +10% PFA+ 5% SF
OPC +40% PFA+ 5% SF
Salt
fros
t sca
ling
(kg/
m²)
0.37 0.375 0.38 0.440.45 0.46
Figure 2.11 - Salt frost scaling of concrete with pure Portland cement and of concrete with additives was compared [13]. The water-binder ratio, w/b, is given. However, the increase of salt frost scaling shown in Figure 2.11 for concrete with additives may also be as a result of an increasing w/b. At about w/b = 0.38 the salt frost scaling of concrete with 40% fly ash and 5% silica fume (5.2% air content) was 20 times that of concrete with pure Portland cement (4% air content) [13], which more or less confirms the results of [28], Figure 2.10. In another study the effect of fly ash, ground blast furnace slag and silica fume on the salt
frost scaling was investigated [10]. Appendix 2.7 shows the mix proportions of the concrete of series 2 in this study and the saltfrost scaling. The air content of all the studied concrete was close or equal to 6%. Salt frost scaling increased in concrete with large amounts of slag compared with the corresponding scaling of Portland cement concrete, Figure 2.11 [10].
0
0,1
0,2
0,3
0,4
0,5
SC
C -
24%
FA
- 9%
SF
SC
C -
12%
FA
- 5%
SF
SC
C -
15%
GF
- 5%
SF
NC
SC
C -
CE
MIII
(68%
slag
)
Salt
fros
t sca
ling
(kg/
m²)
Figure 2.11. - Salt frost scaling of SCCs with additives [10]. FA = fly ash; GF = glass filler; SF = silica fume [10]. However, for concrete with 12% fly ash and 5% silica fume as calculated on the cement content, less salt frost scaling was observed than for a normal concrete without these additives. For 24% fly ash and 10% silica fume larger salt frost scaling was obtained than for the normal concrete, Figure 2.11. It must be underlined that the salt frost scaling of concrete to a great degree depends on the air void system created in the concrete. The salt frost scaling is not only dependent on the type of binder.
15
Salt frost scaling and internal frost resistance of SCC and NC were also studied by Rougeau, Maillard and Mary-Dippe [29]. Mix composition, properties, salt frost scaling and fundamental transversal frequency from this investigation are shown in Appendix 2.8. The fundamental transversal frequency gives a measurement of dynamic elastic modulus, which in turn is a measurement of the internal damage caused by frost, Appendix 2.8. The following conclusion were drawn by Rougeau, Maillard and Mary-Dippe [29]: 1. The salt frost scaling and the loss of
fundamental transversal frequency were much larger for NC than for SCC [29].
2. The salt frost scaling increased with time for NC but remained constant for SCC at 0.9 kg/m², which was obtained after just 28 cycles [29].
3. NC exhibited a total loss of the internal solidity after 150 frost cycles while SCC lost only 7% of the cohesion (elastic modulus) during the corresponding period of time [29].
4. After 300 frost cycles the decline of the elastic modulus was only 12% of SCC [29].
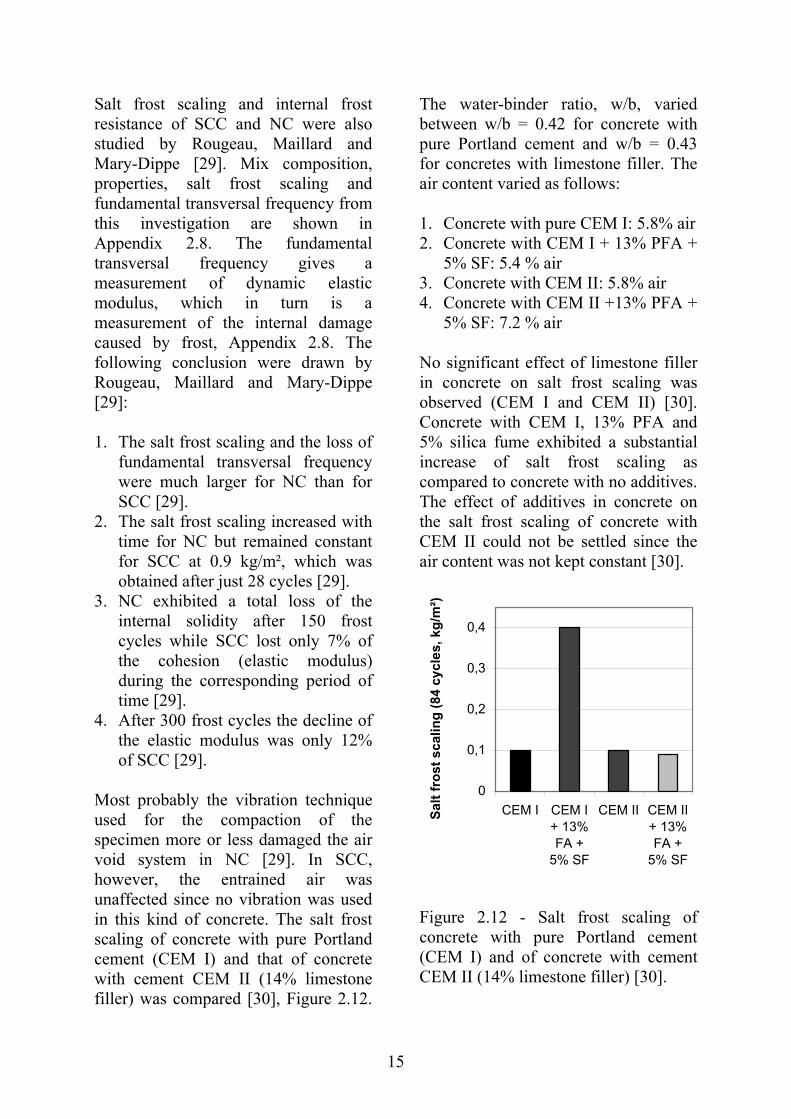
Most probably the vibration technique used for the compaction of the specimen more or less damaged the air void system in NC [29]. In SCC, however, the entrained air was unaffected since no vibration was used in this kind of concrete. The salt frost scaling of concrete with pure Portland cement (CEM I) and that of concrete with cement CEM II (14% limestone filler) was compared [30], Figure 2.12.
The water-binder ratio, w/b, varied between w/b = 0.42 for concrete with pure Portland cement and w/b = 0.43 for concretes with limestone filler. The air content varied as follows: 1. Concrete with pure CEM I: 5.8% air 2. Concrete with CEM I + 13% PFA +
5% SF: 5.4 % air 3. Concrete with CEM II: 5.8% air 4. Concrete with CEM II +13% PFA +
5% SF: 7.2 % air No significant effect of limestone filler in concrete on salt frost scaling was observed (CEM I and CEM II) [30]. Concrete with CEM I, 13% PFA and 5% silica fume exhibited a substantial increase of salt frost scaling as compared to concrete with no additives. The effect of additives in concrete on the salt frost scaling of concrete with CEM II could not be settled since the air content was not kept constant [30].
0
0,1
0,2
0,3
0,4
CEM I CEM I+ 13%FA +
5% SF
CEM II CEM II+ 13%FA +
5% SF
Salt
fros
t sca
ling
(84
cycl
es, k
g/m
²)
Figure 2.12 - Salt frost scaling of concrete with pure Portland cement (CEM I) and of concrete with cement CEM II (14% limestone filler) [30].
16
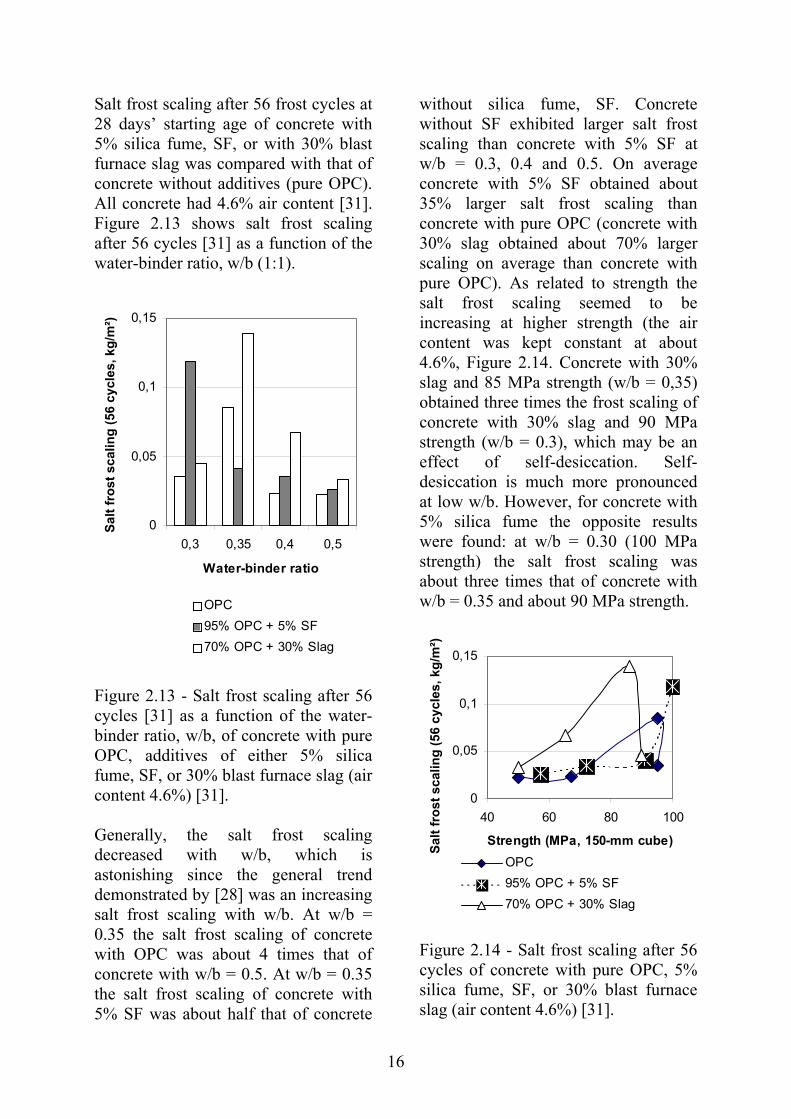
Salt frost scaling after 56 frost cycles at 28 days’ starting age of concrete with 5% silica fume, SF, or with 30% blast furnace slag was compared with that of concrete without additives (pure OPC). All concrete had 4.6% air content [31]. Figure 2.13 shows salt frost scaling after 56 cycles [31] as a function of the water-binder ratio, w/b (1:1).
0
0,05
0,1
0,15
0,3 0,35 0,4 0,5
Water-binder ratio
Salt
fros
t sca
ling
(56
cycl
es, k
g/m
²)
OPC95% OPC + 5% SF70% OPC + 30% Slag
Figure 2.13 - Salt frost scaling after 56 cycles [31] as a function of the water-binder ratio, w/b, of concrete with pure OPC, additives of either 5% silica fume, SF, or 30% blast furnace slag (air content 4.6%) [31]. Generally, the salt frost scaling decreased with w/b, which is astonishing since the general trend demonstrated by [28] was an increasing salt frost scaling with w/b. At w/b = 0.35 the salt frost scaling of concrete with OPC was about 4 times that of concrete with w/b = 0.5. At w/b = 0.35 the salt frost scaling of concrete with 5% SF was about half that of concrete
without silica fume, SF. Concrete without SF exhibited larger salt frost scaling than concrete with 5% SF at w/b = 0.3, 0.4 and 0.5. On average concrete with 5% SF obtained about 35% larger salt frost scaling than concrete with pure OPC (concrete with 30% slag obtained about 70% larger scaling on average than concrete with pure OPC). As related to strength the salt frost scaling seemed to be increasing at higher strength (the air content was kept constant at about 4.6%, Figure 2.14. Concrete with 30% slag and 85 MPa strength (w/b = 0,35) obtained three times the frost scaling of concrete with 30% slag and 90 MPa strength (w/b = 0.3), which may be an effect of self-desiccation. Self-desiccation is much more pronounced at low w/b. However, for concrete with 5% silica fume the opposite results were found: at w/b = 0.30 (100 MPa strength) the salt frost scaling was about three times that of concrete with w/b = 0.35 and about 90 MPa strength.
0
0,05
0,1
0,15
40 60 80 100
Strength (MPa, 150-mm cube)Salt
fros
t sca
ling
(56
cycl
es, k
g/m
²)
OPC95% OPC + 5% SF70% OPC + 30% Slag
Figure 2.14 - Salt frost scaling after 56 cycles of concrete with pure OPC, 5% silica fume, SF, or 30% blast furnace slag (air content 4.6%) [31].
17
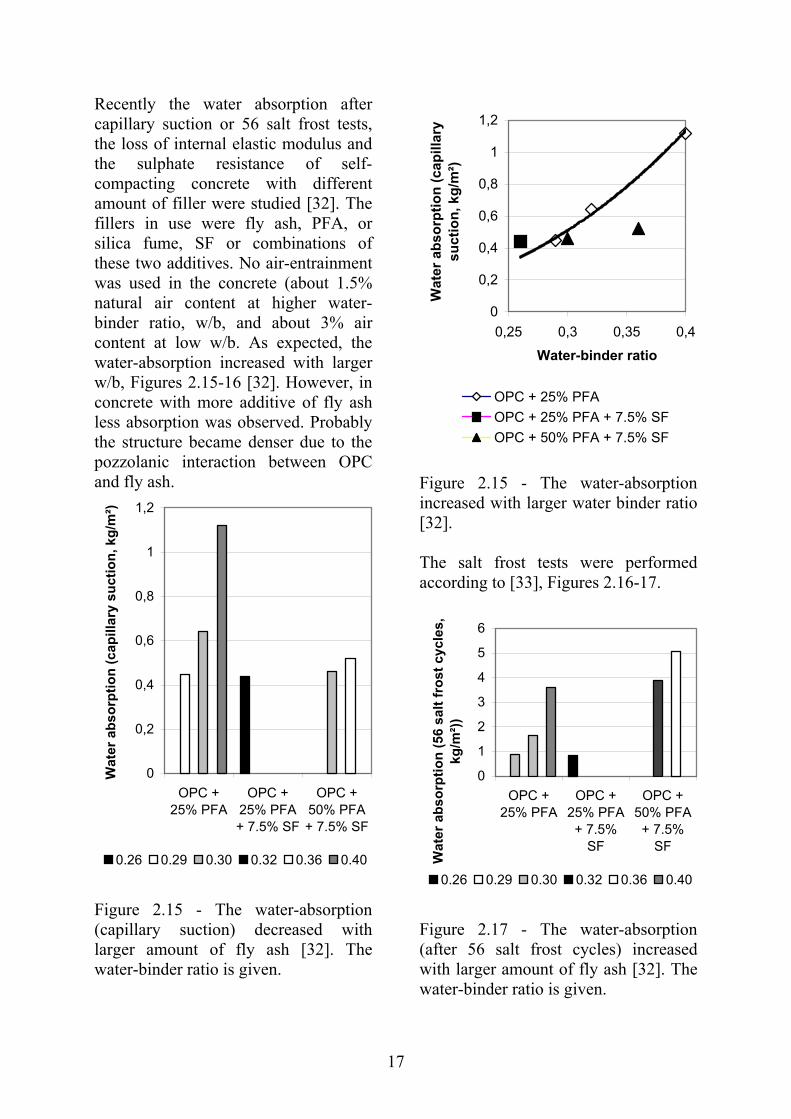
Recently the water absorption after capillary suction or 56 salt frost tests, the loss of internal elastic modulus and the sulphate resistance of self-compacting concrete with different amount of filler were studied [32]. The fillers in use were fly ash, PFA, or silica fume, SF or combinations of these two additives. No air-entrainment was used in the concrete (about 1.5% natural air content at higher water-binder ratio, w/b, and about 3% air content at low w/b. As expected, the water-absorption increased with larger w/b, Figures 2.15-16 [32]. However, in concrete with more additive of fly ash less absorption was observed. Probably the structure became denser due to the pozzolanic interaction between OPC and fly ash.
0
0,2
0,4
0,6
0,8
1
1,2
OPC +25% PFA
OPC +25% PFA+ 7.5% SF
OPC +50% PFA+ 7.5% SF
Wat
er a
bsor
ptio
n (c
apill
ary
suct
ion,
kg/
m²)
0.26 0.29 0.30 0.32 0.36 0.40
Figure 2.15 - The water-absorption (capillary suction) decreased with larger amount of fly ash [32]. The water-binder ratio is given.
0
0,2
0,4
0,6
0,8
1
1,2
0,25 0,3 0,35 0,4
Water-binder ratio
Wat
er a
bsor
ptio
n (c
apill
ary
suct
ion,
kg/
m²)
OPC + 25% PFAOPC + 25% PFA + 7.5% SFOPC + 50% PFA + 7.5% SF
Figure 2.15 - The water-absorption increased with larger water binder ratio [32]. The salt frost tests were performed according to [33], Figures 2.16-17.
0
1
2
3
4
5
6
OPC +25% PFA
OPC +25% PFA+ 7.5%
SF
OPC +50% PFA+ 7.5%
SF
Wat
er a
bsor
ptio
n (5
6 sa
lt fr
ost c
ycle
s,
kg/m
²))
0.26 0.29 0.30 0.32 0.36 0.40
Figure 2.17 - The water-absorption (after 56 salt frost cycles) increased with larger amount of fly ash [32]. The water-binder ratio is given.
18
0
0,2
0,4
0,6
0,8
1
1,2
0,25 0,30 0,35 0,40
Water-binder ratio
Wat
er a
bsor
ptio
n (c
apill
ary
suct
ion,
kg/
m²)
OPC + 25% PFAOPC + 25% PFA + 7.5% SFOPC + 50% PFA + 7.5% SF
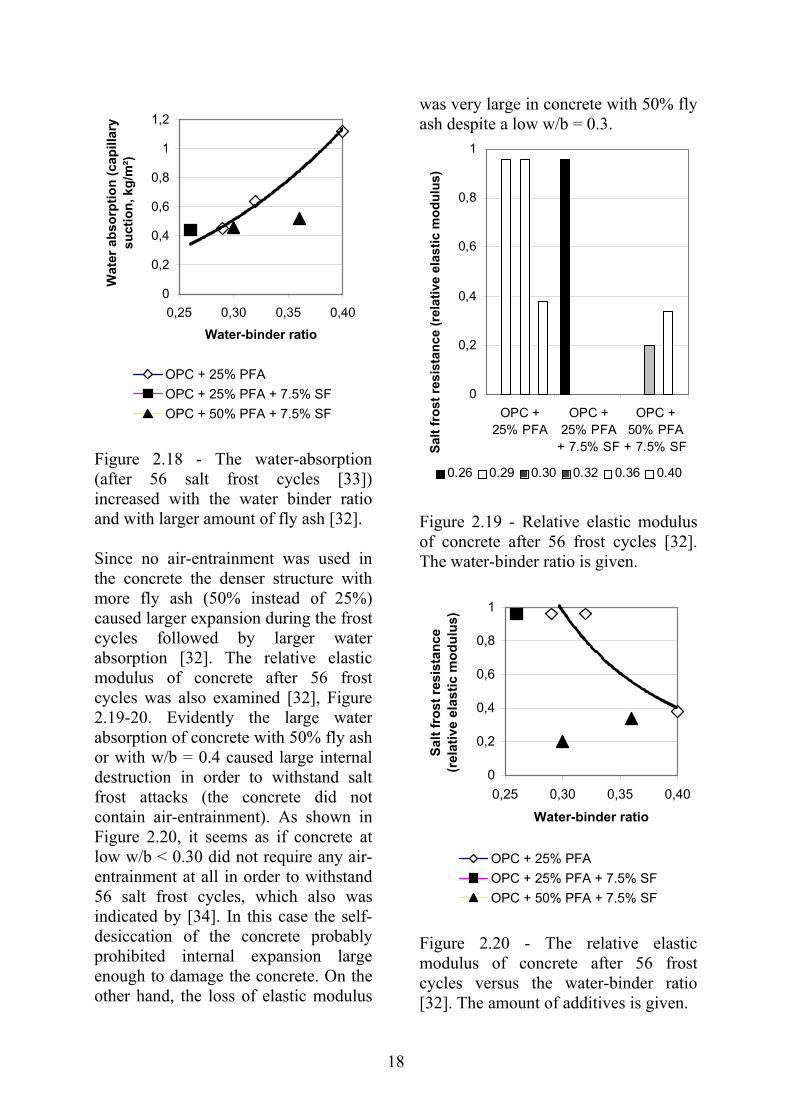
Figure 2.18 - The water-absorption (after 56 salt frost cycles [33]) increased with the water binder ratio and with larger amount of fly ash [32]. Since no air-entrainment was used in the concrete the denser structure with more fly ash (50% instead of 25%) caused larger expansion during the frost cycles followed by larger water absorption [32]. The relative elastic modulus of concrete after 56 frost cycles was also examined [32], Figure 2.19-20. Evidently the large water absorption of concrete with 50% fly ash or with w/b = 0.4 caused large internal destruction in order to withstand salt frost attacks (the concrete did not contain air-entrainment). As shown in Figure 2.20, it seems as if concrete at low w/b < 0.30 did not require any air-entrainment at all in order to withstand 56 salt frost cycles, which also was indicated by [34]. In this case the self-desiccation of the concrete probably prohibited internal expansion large enough to damage the concrete. On the other hand, the loss of elastic modulus
was very large in concrete with 50% fly ash despite a low w/b = 0.3.
0
0,2
0,4
0,6
0,8
1
OPC +25% PFA
OPC +25% PFA
+ 7.5% SF
OPC +50% PFA
+ 7.5% SFSalt
fros
t res
ista
nce
(rel
ativ
e el
astic
mod
ulus
)
0.26 0.29 0.30 0.32 0.36 0.40
Figure 2.19 - Relative elastic modulus of concrete after 56 frost cycles [32]. The water-binder ratio is given.
0
0,2
0,4
0,6
0,8
1
0,25 0,30 0,35 0,40
Water-binder ratio
Salt
fros
t res
ista
nce
(rel
ativ
e el
astic
mod
ulus
)
OPC + 25% PFAOPC + 25% PFA + 7.5% SFOPC + 50% PFA + 7.5% SF
Figure 2.20 - The relative elastic modulus of concrete after 56 frost cycles versus the water-binder ratio [32]. The amount of additives is given.
19
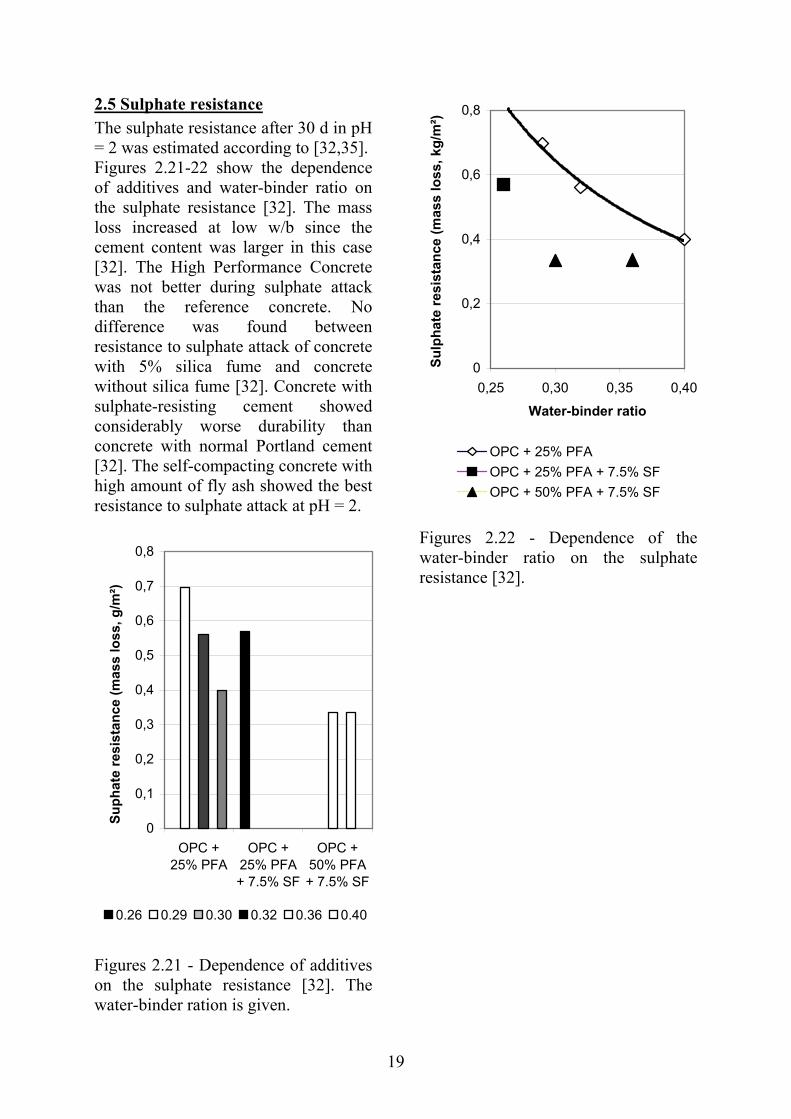
2.5 Sulphate resistance The sulphate resistance after 30 d in pH = 2 was estimated according to [32,35]. Figures 2.21-22 show the dependence of additives and water-binder ratio on the sulphate resistance [32]. The mass loss increased at low w/b since the cement content was larger in this case [32]. The High Performance Concrete was not better during sulphate attack than the reference concrete. No difference was found between resistance to sulphate attack of concrete with 5% silica fume and concrete without silica fume [32]. Concrete with sulphate-resisting cement showed considerably worse durability than concrete with normal Portland cement [32]. The self-compacting concrete with high amount of fly ash showed the best resistance to sulphate attack at pH = 2.
0
0,1
0,2
0,3
0,4
0,5
0,6
0,7
0,8
OPC +25% PFA
OPC +25% PFA+ 7.5% SF
OPC +50% PFA+ 7.5% SF
Suph
ate
resi
stan
ce (m
ass
loss
, g/m
²)
0.26 0.29 0.30 0.32 0.36 0.40
Figures 2.21 - Dependence of additives on the sulphate resistance [32]. The water-binder ration is given.
0
0,2
0,4
0,6
0,8
0,25 0,30 0,35 0,40
Water-binder ratio
Sulp
hate
resi
stan
ce (m
ass
loss
, kg/
m²)
OPC + 25% PFAOPC + 25% PFA + 7.5% SFOPC + 50% PFA + 7.5% SF
Figures 2.22 - Dependence of the water-binder ratio on the sulphate resistance [32].
20
3. MATERIALS, MANUFACTURE AND METHODS 3.1 Material Crushed gneiss (E-modulus 61 GPa and strength 230 MPa), natural sand, limestone filler Köping 500 (branch Limus 40) or Ignaberga 200 (branch Limus 15) and Degerhamn cement were used in the mix compositions, Appendices 2.1 and 3.1. Melamine-based superplasticiser was used for NC (branch Flyt 97M), polycarboxyl ether for SCC (branch Glenium 51) and air-entertainment agent based on fir oil and fatty acids (branch Microair). 3.2 Manufacture of specimen 3.2.1 Durability properties Manufacturing and curing of the large specimen of concrete (until the test specimen were core drilled) were performed in the following way: 1. New mixing order (N) with material
except for filler mixed for ½ min. with water and air-entertainment.
2. Then half the amount of superplasticiser mixed for ½ min.
3. Finally the remaining superplasticiser with filler mixed for 2 min. [36].
4. Ordinary mixing order (O) with all dry material at the start mixed for ½ min. with water and air-entertainment.
5. Then all the material with the superplasticiser mixed for 2½ min.
6. Casting of large specimen in steel mould with 0.23 m in diameter and 0.3 m or 6 m in height filled with concrete.
7. NC vibrated 10 + 10 + 10 s. 8. SCC was not vibrated.
9. Sealed curing at 20 °C until the specimens were core-drilled from the large specimen.
From the pour the following specimens were cored at 28 and 90 days’ age: 1. For determination of the chloride
migration coefficient, D: 3 discs 100 mm in diameter and 50 mm in height [4].
2. For salt frost scaling: 3 discs 94 mm in diameter and 40 mm in height
3. For determination of the internal frost resistance, sulphate resistance and performance in sea water or fresh water, 3 cylinders 50 mm in diameter and 150 mm in height
4. When testing the effect of hydrostatic pressure the specimen was cored 0.5 m from the bottom of the 6 m long specimen
5. Between drilling and testing the cylinders were stored in water saturated by adding limestone powder.
3.2.2 Mechanical properties Specimens for mechanical tests were obtained in the following way: 1. Ordinary mixing order (O) with dry
material at the start mixed for ½ min. with water and air-entertainment
2. Then all the material with the superplasticiser mixed for 2½ min.
3. Casting of cubes 100 mm and cylinder specimen 100 mm in diameter and 500 mm in length in steel mould with concrete.
4. NC vibrated 10 + 10 + 10 s. 5. SC was not vibrated. 6. Sealed curing or air curing at an
ambient relative humidity, RH = 60% until testing of strength, creep and shrinkage.
21
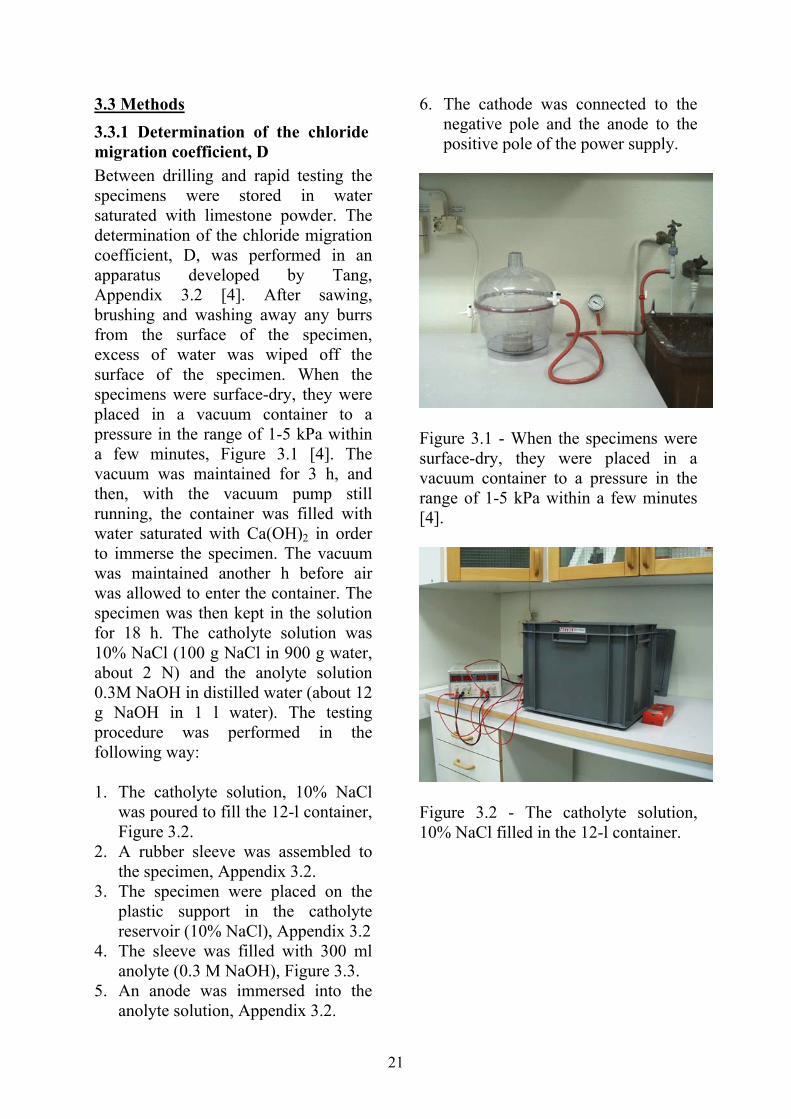
3.3 Methods 3.3.1 Determination of the chloride migration coefficient, D Between drilling and rapid testing the specimens were stored in water saturated with limestone powder. The determination of the chloride migration coefficient, D, was performed in an apparatus developed by Tang, Appendix 3.2 [4]. After sawing, brushing and washing away any burrs from the surface of the specimen, excess of water was wiped off the surface of the specimen. When the specimens were surface-dry, they were placed in a vacuum container to a pressure in the range of 1-5 kPa within a few minutes, Figure 3.1 [4]. The vacuum was maintained for 3 h, and then, with the vacuum pump still running, the container was filled with water saturated with Ca(OH)2 in order to immerse the specimen. The vacuum was maintained another h before air was allowed to enter the container. The specimen was then kept in the solution for 18 h. The catholyte solution was 10% NaCl (100 g NaCl in 900 g water, about 2 N) and the anolyte solution 0.3M NaOH in distilled water (about 12 g NaOH in 1 l water). The testing procedure was performed in the following way: 1. The catholyte solution, 10% NaCl
was poured to fill the 12-l container, Figure 3.2.
2. A rubber sleeve was assembled to the specimen, Appendix 3.2.
3. The specimen were placed on the plastic support in the catholyte reservoir (10% NaCl), Appendix 3.2
4. The sleeve was filled with 300 ml anolyte (0.3 M NaOH), Figure 3.3.
5. An anode was immersed into the anolyte solution, Appendix 3.2.
6. The cathode was connected to the negative pole and the anode to the positive pole of the power supply.
Figure 3.1 - When the specimens were surface-dry, they were placed in a vacuum container to a pressure in the range of 1-5 kPa within a few minutes [4].
Figure 3.2 - The catholyte solution, 10% NaCl filled in the 12-l container.
22
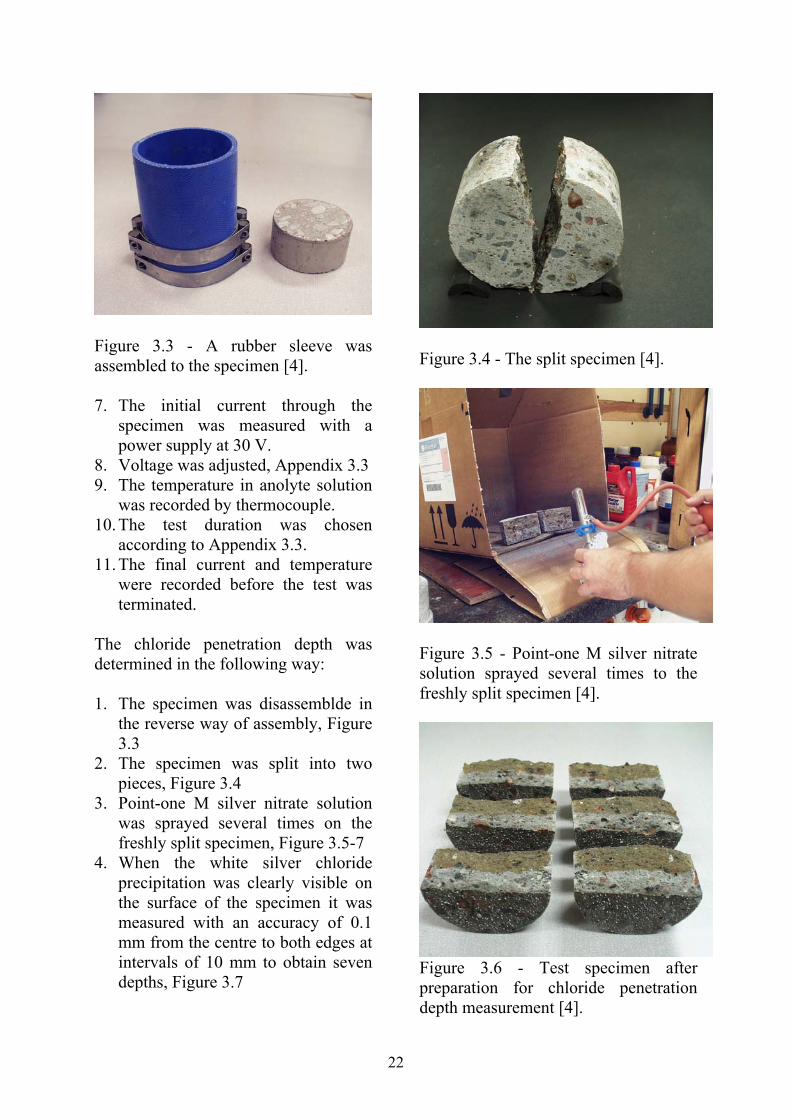
Figure 3.3 - A rubber sleeve was assembled to the specimen [4]. 7. The initial current through the
specimen was measured with a power supply at 30 V.
8. Voltage was adjusted, Appendix 3.3 9. The temperature in anolyte solution
was recorded by thermocouple. 10. The test duration was chosen
according to Appendix 3.3. 11. The final current and temperature
were recorded before the test was terminated.
The chloride penetration depth was determined in the following way: 1. The specimen was disassemblde in
the reverse way of assembly, Figure 3.3
2. The specimen was split into two pieces, Figure 3.4
3. Point-one M silver nitrate solution was sprayed several times on the freshly split specimen, Figure 3.5-7
4. When the white silver chloride precipitation was clearly visible on the surface of the specimen it was measured with an accuracy of 0.1 mm from the centre to both edges at intervals of 10 mm to obtain seven depths, Figure 3.7
Figure 3.4 - The split specimen [4].
Figure 3.5 - Point-one M silver nitrate solution sprayed several times to the freshly split specimen [4].
Figure 3.6 - Test specimen after preparation for chloride penetration depth measurement [4].
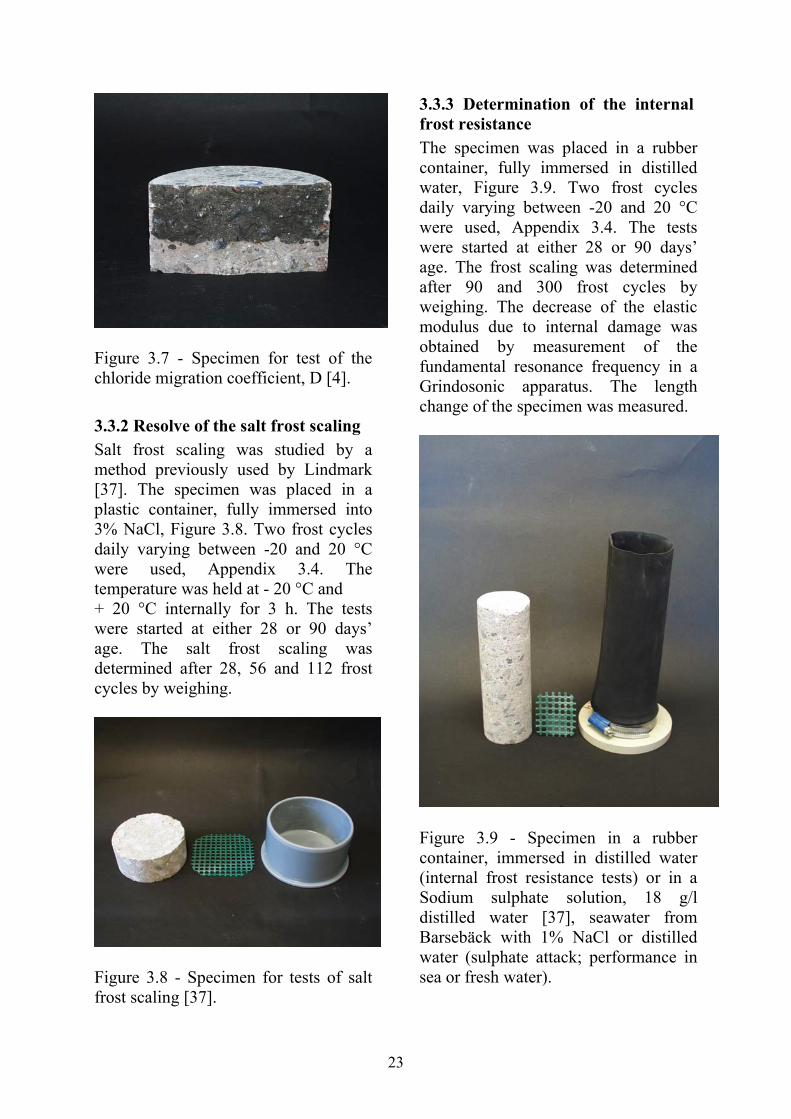
23
Figure 3.7 - Specimen for test of the chloride migration coefficient, D [4]. 3.3.2 Resolve of the salt frost scaling Salt frost scaling was studied by a method previously used by Lindmark [37]. The specimen was placed in a plastic container, fully immersed into 3% NaCl, Figure 3.8. Two frost cycles daily varying between -20 and 20 °C were used, Appendix 3.4. The temperature was held at - 20 °C and + 20 °C internally for 3 h. The tests were started at either 28 or 90 days’ age. The salt frost scaling was determined after 28, 56 and 112 frost cycles by weighing.
Figure 3.8 - Specimen for tests of salt frost scaling [37].
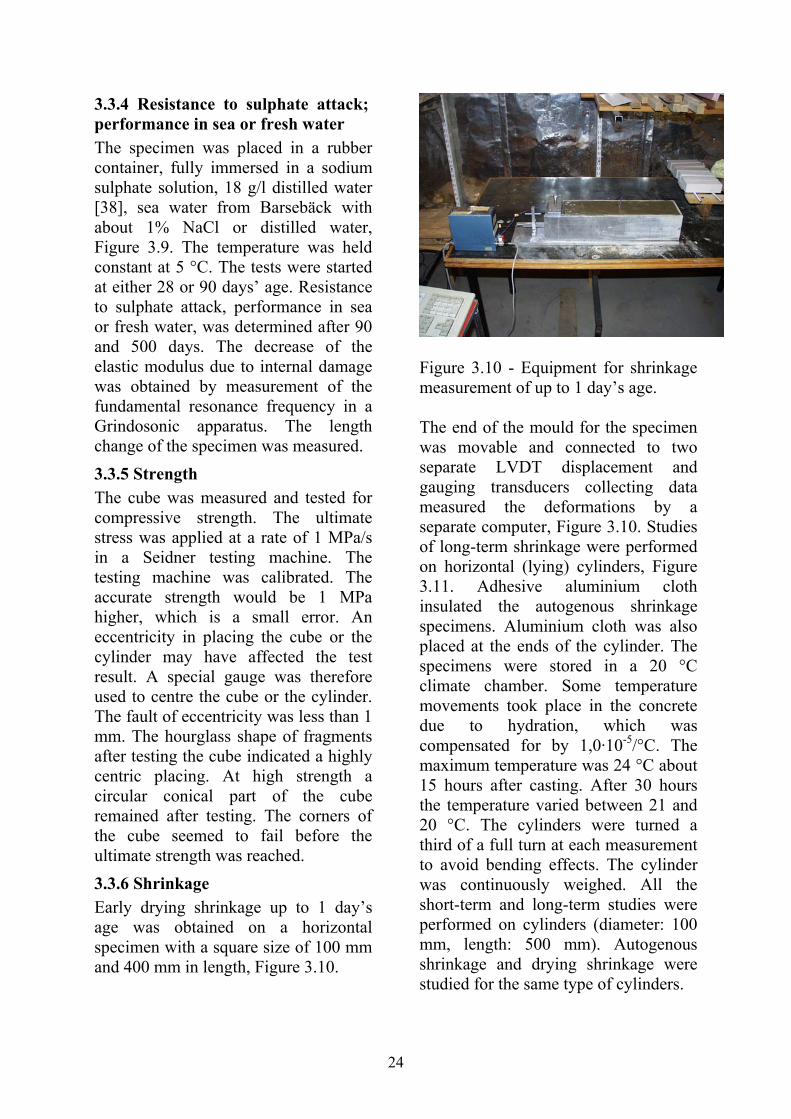
3.3.3 Determination of the internal frost resistance The specimen was placed in a rubber container, fully immersed in distilled water, Figure 3.9. Two frost cycles daily varying between -20 and 20 °C were used, Appendix 3.4. The tests were started at either 28 or 90 days’ age. The frost scaling was determined after 90 and 300 frost cycles by weighing. The decrease of the elastic modulus due to internal damage was obtained by measurement of the fundamental resonance frequency in a Grindosonic apparatus. The length change of the specimen was measured.
Figure 3.9 - Specimen in a rubber container, immersed in distilled water (internal frost resistance tests) or in a Sodium sulphate solution, 18 g/l distilled water [37], seawater from Barsebäck with 1% NaCl or distilled water (sulphate attack; performance in sea or fresh water).
24
3.3.4 Resistance to sulphate attack; performance in sea or fresh water The specimen was placed in a rubber container, fully immersed in a sodium sulphate solution, 18 g/l distilled water [38], sea water from Barsebäck with about 1% NaCl or distilled water, Figure 3.9. The temperature was held constant at 5 °C. The tests were started at either 28 or 90 days’ age. Resistance to sulphate attack, performance in sea or fresh water, was determined after 90 and 500 days. The decrease of the elastic modulus due to internal damage was obtained by measurement of the fundamental resonance frequency in a Grindosonic apparatus. The length change of the specimen was measured. 3.3.5 Strength The cube was measured and tested for compressive strength. The ultimate stress was applied at a rate of 1 MPa/s in a Seidner testing machine. The testing machine was calibrated. The accurate strength would be 1 MPa higher, which is a small error. An eccentricity in placing the cube or the cylinder may have affected the test result. A special gauge was therefore used to centre the cube or the cylinder. The fault of eccentricity was less than 1 mm. The hourglass shape of fragments after testing the cube indicated a highly centric placing. At high strength a circular conical part of the cube remained after testing. The corners of the cube seemed to fail before the ultimate strength was reached. 3.3.6 Shrinkage Early drying shrinkage up to 1 day’s age was obtained on a horizontal specimen with a square size of 100 mm and 400 mm in length, Figure 3.10.
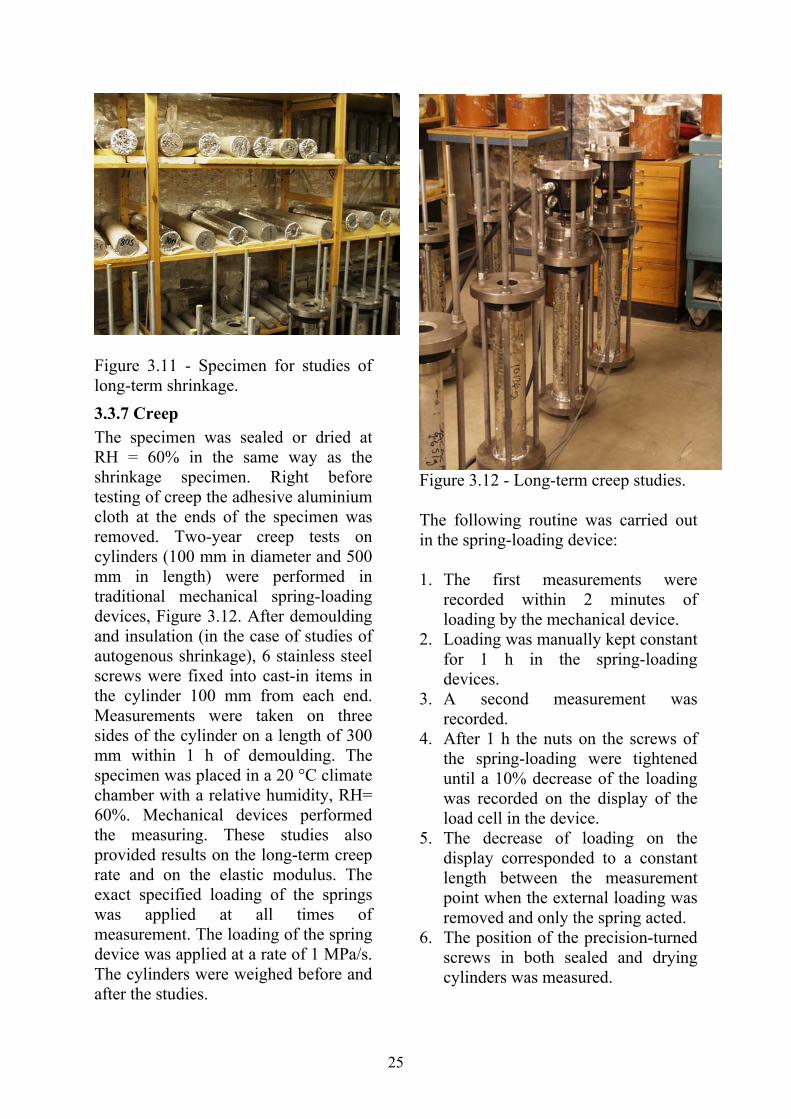
Figure 3.10 - Equipment for shrinkage measurement of up to 1 day’s age. The end of the mould for the specimen was movable and connected to two separate LVDT displacement and gauging transducers collecting data measured the deformations by a separate computer, Figure 3.10. Studies of long-term shrinkage were performed on horizontal (lying) cylinders, Figure 3.11. Adhesive aluminium cloth insulated the autogenous shrinkage specimens. Aluminium cloth was also placed at the ends of the cylinder. The specimens were stored in a 20 °C climate chamber. Some temperature movements took place in the concrete due to hydration, which was compensated for by 1,0·10-5/°C. The maximum temperature was 24 °C about 15 hours after casting. After 30 hours the temperature varied between 21 and 20 °C. The cylinders were turned a third of a full turn at each measurement to avoid bending effects. The cylinder was continuously weighed. All the short-term and long-term studies were performed on cylinders (diameter: 100 mm, length: 500 mm). Autogenous shrinkage and drying shrinkage were studied for the same type of cylinders.
25
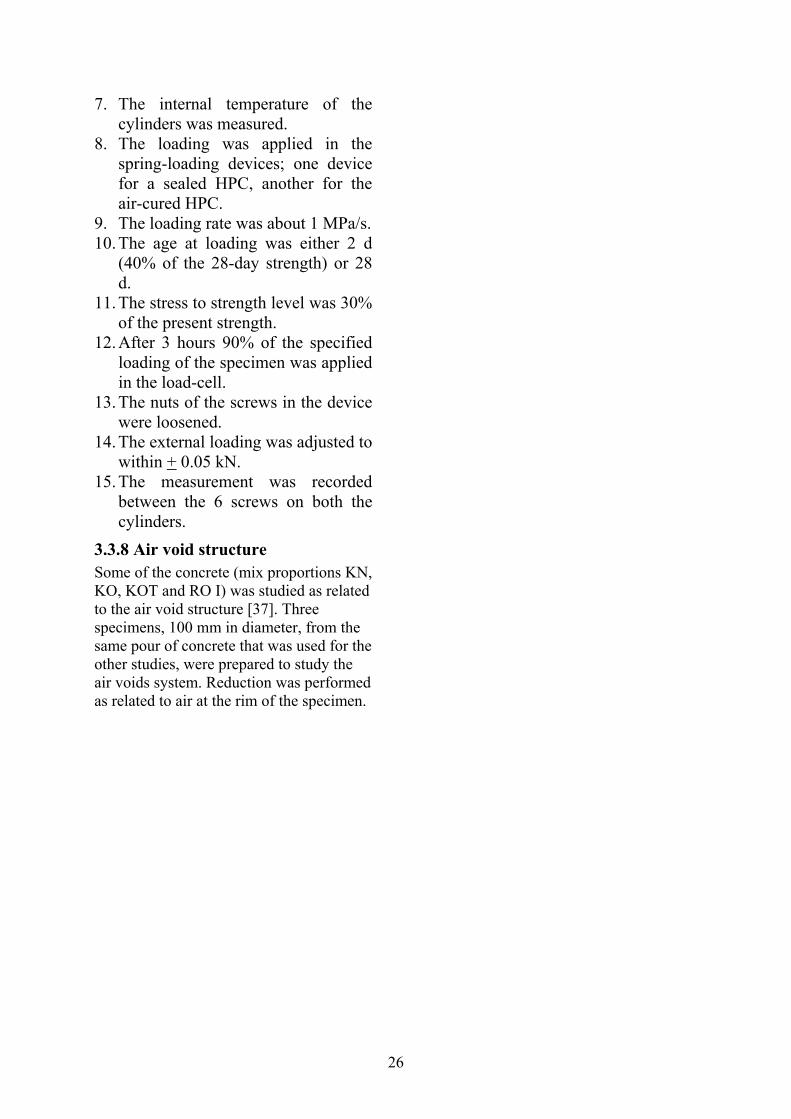
Figure 3.11 - Specimen for studies of long-term shrinkage. 3.3.7 Creep The specimen was sealed or dried at RH = 60% in the same way as the shrinkage specimen. Right before testing of creep the adhesive aluminium cloth at the ends of the specimen was removed. Two-year creep tests on cylinders (100 mm in diameter and 500 mm in length) were performed in traditional mechanical spring-loading devices, Figure 3.12. After demoulding and insulation (in the case of studies of autogenous shrinkage), 6 stainless steel screws were fixed into cast-in items in the cylinder 100 mm from each end. Measurements were taken on three sides of the cylinder on a length of 300 mm within 1 h of demoulding. The specimen was placed in a 20 °C climate chamber with a relative humidity, RH= 60%. Mechanical devices performed the measuring. These studies also provided results on the long-term creep rate and on the elastic modulus. The exact specified loading of the springs was applied at all times of measurement. The loading of the spring device was applied at a rate of 1 MPa/s. The cylinders were weighed before and after the studies.
Figure 3.12 - Long-term creep studies. The following routine was carried out in the spring-loading device: 1. The first measurements were
recorded within 2 minutes of loading by the mechanical device.
2. Loading was manually kept constant for 1 h in the spring-loading devices.
3. A second measurement was recorded.
4. After 1 h the nuts on the screws of the spring-loading were tightened until a 10% decrease of the loading was recorded on the display of the load cell in the device.
5. The decrease of loading on the display corresponded to a constant length between the measurement point when the external loading was removed and only the spring acted.
6. The position of the precision-turned screws in both sealed and drying cylinders was measured.
26
7. The internal temperature of the cylinders was measured.
8. The loading was applied in the spring-loading devices; one device for a sealed HPC, another for the air-cured HPC.
9. The loading rate was about 1 MPa/s. 10. The age at loading was either 2 d
(40% of the 28-day strength) or 28 d.
11. The stress to strength level was 30% of the present strength.
12. After 3 hours 90% of the specified loading of the specimen was applied in the load-cell.
13. The nuts of the screws in the device were loosened.
14. The external loading was adjusted to within + 0.05 kN.
15. The measurement was recorded between the 6 screws on both the cylinders.
3.3.8 Air void structure Some of the concrete (mix proportions KN, KO, KOT and RO I) was studied as related to the air void structure [37]. Three specimens, 100 mm in diameter, from the same pour of concrete that was used for the other studies, were prepared to study the air voids system. Reduction was performed as related to air at the rim of the specimen.
27
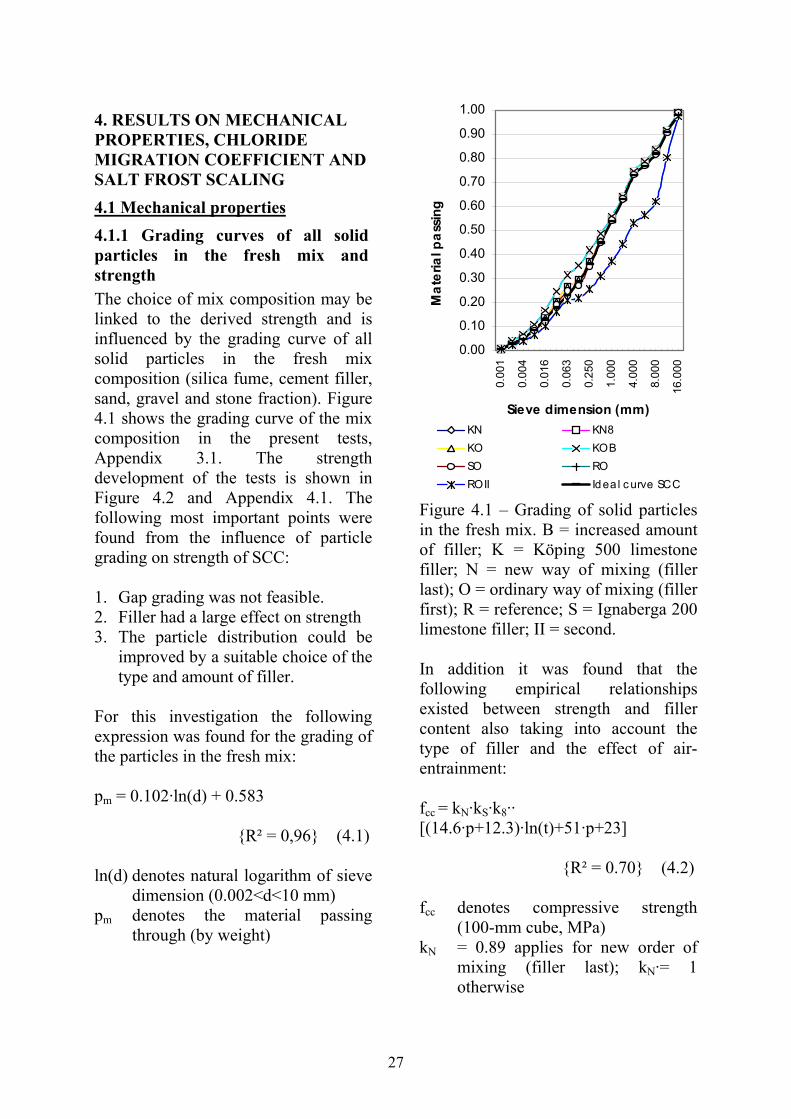
4. RESULTS ON MECHANICAL PROPERTIES, CHLORIDE MIGRATION COEFFICIENT AND SALT FROST SCALING 4.1 Mechanical properties 4.1.1 Grading curves of all solid particles in the fresh mix and strength The choice of mix composition may be linked to the derived strength and is influenced by the grading curve of all solid particles in the fresh mix composition (silica fume, cement filler, sand, gravel and stone fraction). Figure 4.1 shows the grading curve of the mix composition in the present tests, Appendix 3.1. The strength development of the tests is shown in Figure 4.2 and Appendix 4.1. The following most important points were found from the influence of particle grading on strength of SCC: 1. Gap grading was not feasible. 2. Filler had a large effect on strength 3. The particle distribution could be
improved by a suitable choice of the type and amount of filler.
For this investigation the following expression was found for the grading of the particles in the fresh mix: pm = 0.102·ln(d) + 0.583
{R² = 0,96} (4.1) ln(d) denotes natural logarithm of sieve
dimension (0.002<d<10 mm) pm denotes the material passing
through (by weight)
0.00
0.10
0.20
0.30
0.40
0.50
0.60
0.70
0.80
0.90
1.00
16.0
00
8.00
0
4.00
0
1.00
0
0.25
0
0.06
3
0.01
6
0.00
4
0.00
1
Sieve dimension (mm)
Mat
eria
l pas
sing
KN KN8KO KOBSO ROROII Idea l c urve SCC
Figure 4.1 – Grading of solid particles in the fresh mix. B = increased amount of filler; K = Köping 500 limestone filler; N = new way of mixing (filler last); O = ordinary way of mixing (filler first); R = reference; S = Ignaberga 200 limestone filler; II = second. In addition it was found that the following empirical relationships existed between strength and filler content also taking into account the type of filler and the effect of air-entrainment: fcc = kN·kS·k8·· [(14.6·p+12.3)·ln(t)+51·p+23] {R² = 0.70} (4.2) fcc denotes compressive strength
(100-mm cube, MPa) kN = 0.89 applies for new order of
mixing (filler last); kN·= 1 otherwise
28
kS = 0.82 applies for Ignaberga 200 limestone filler in these tests; kS = 1 otherwise
k8 = 0.74 applies for 8% air content; k8 = 1 for 6% air content.
ln(t) denotes the natural logarithm of concrete age (1 < t < 100 days)
p denotes content of limestone powder (0.03 < p < 0.15 by vol.)
10,0
30,0
50,0
70,0
90,0
1 10 100
Age (days)
Stre
ngth
(100
-mm
sea
led
cube
, M
Pa)
KN KOB KN8KO KOT SORO ROII
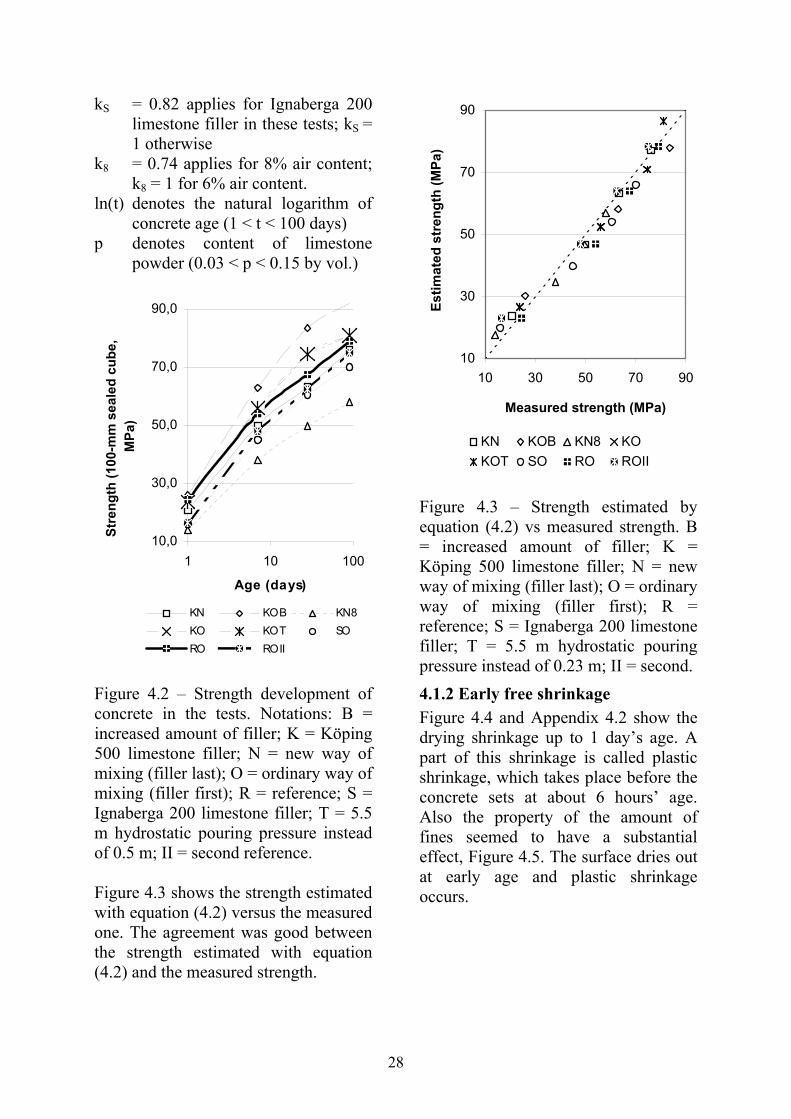
Figure 4.2 – Strength development of concrete in the tests. Notations: B = increased amount of filler; K = Köping 500 limestone filler; N = new way of mixing (filler last); O = ordinary way of mixing (filler first); R = reference; S = Ignaberga 200 limestone filler; T = 5.5 m hydrostatic pouring pressure instead of 0.5 m; II = second reference. Figure 4.3 shows the strength estimated with equation (4.2) versus the measured one. The agreement was good between the strength estimated with equation (4.2) and the measured strength.
10
30
50
70
90
10 30 50 70 90
Measured strength (MPa)
Estim
ated
str
engt
h (M
Pa)
KN KOB KN8 KOKOT SO RO ROII
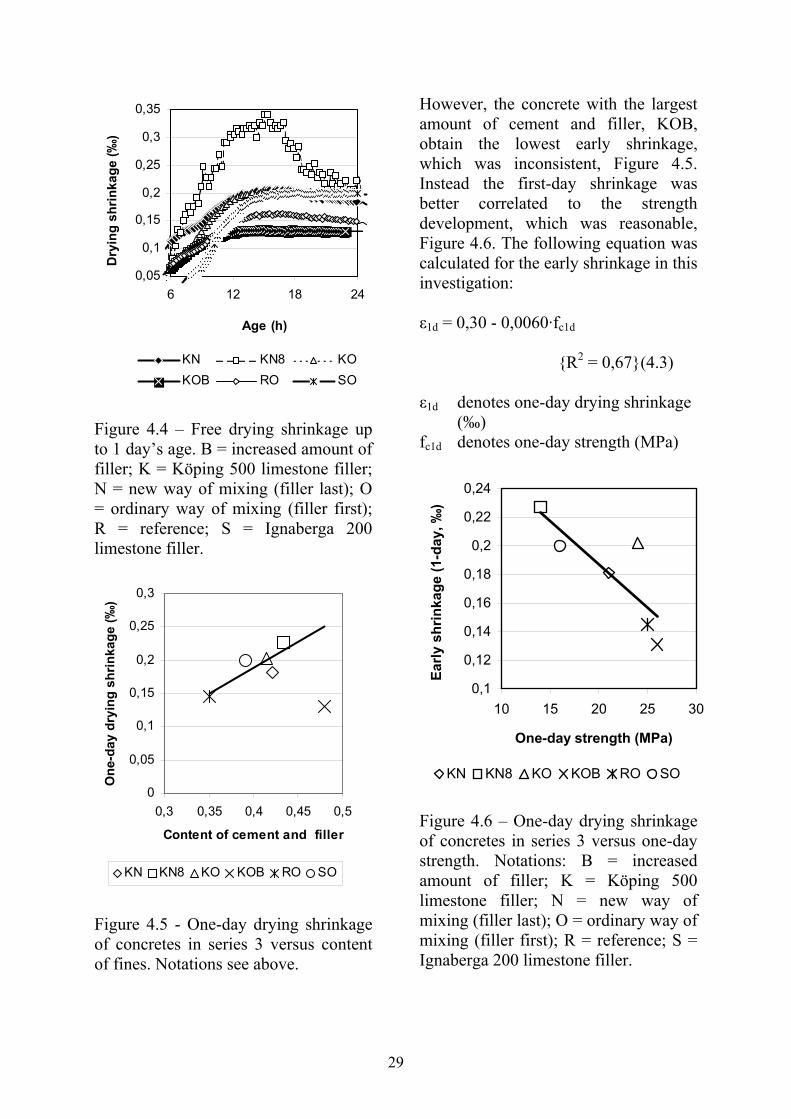
Figure 4.3 – Strength estimated by equation (4.2) vs measured strength. B = increased amount of filler; K = Köping 500 limestone filler; N = new way of mixing (filler last); O = ordinary way of mixing (filler first); R = reference; S = Ignaberga 200 limestone filler; T = 5.5 m hydrostatic pouring pressure instead of 0.23 m; II = second. 4.1.2 Early free shrinkage Figure 4.4 and Appendix 4.2 show the drying shrinkage up to 1 day’s age. A part of this shrinkage is called plastic shrinkage, which takes place before the concrete sets at about 6 hours’ age. Also the property of the amount of fines seemed to have a substantial effect, Figure 4.5. The surface dries out at early age and plastic shrinkage occurs.
29
0,05
0,1
0,15
0,2
0,25
0,3
0,35
6 12 18 24
Age (h)
Dry
ing
shrin
kage
(‰)
KN KN8 KOKOB RO SO
Figure 4.4 – Free drying shrinkage up to 1 day’s age. B = increased amount of filler; K = Köping 500 limestone filler; N = new way of mixing (filler last); O = ordinary way of mixing (filler first); R = reference; S = Ignaberga 200 limestone filler.
0
0,05
0,1
0,15
0,2
0,25
0,3
0,3 0,35 0,4 0,45 0,5
Content of cement and filler
One
-day
dry
ing
shrin
kage
(‰)
KN KN8 KO KOB RO SO
Figure 4.5 - One-day drying shrinkage of concretes in series 3 versus content of fines. Notations see above.
However, the concrete with the largest amount of cement and filler, KOB, obtain the lowest early shrinkage, which was inconsistent, Figure 4.5. Instead the first-day shrinkage was better correlated to the strength development, which was reasonable, Figure 4.6. The following equation was calculated for the early shrinkage in this investigation: ε1d = 0,30 - 0,0060·fc1d
{R2 = 0,67}(4.3) ε1d denotes one-day drying shrinkage
(‰) fc1d denotes one-day strength (MPa)
0,1
0,12
0,14
0,16
0,18
0,2
0,22
0,24
10 15 20 25 30
One-day strength (MPa)
Early
shr
inka
ge (1
-day
, ‰)
KN KN8 KO KOB RO SO
Figure 4.6 – One-day drying shrinkage of concretes in series 3 versus one-day strength. Notations: B = increased amount of filler; K = Köping 500 limestone filler; N = new way of mixing (filler last); O = ordinary way of mixing (filler first); R = reference; S = Ignaberga 200 limestone filler.
30
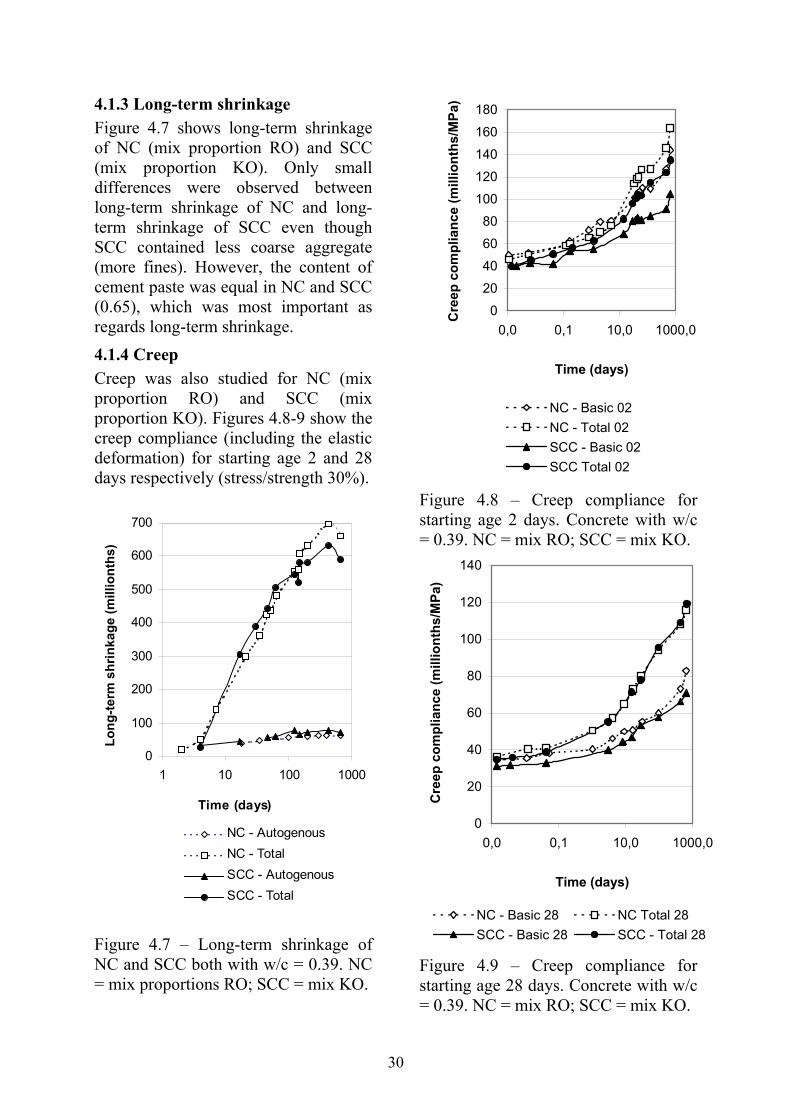
4.1.3 Long-term shrinkage Figure 4.7 shows long-term shrinkage of NC (mix proportion RO) and SCC (mix proportion KO). Only small differences were observed between long-term shrinkage of NC and long-term shrinkage of SCC even though SCC contained less coarse aggregate (more fines). However, the content of cement paste was equal in NC and SCC (0.65), which was most important as regards long-term shrinkage. 4.1.4 Creep Creep was also studied for NC (mix proportion RO) and SCC (mix proportion KO). Figures 4.8-9 show the creep compliance (including the elastic deformation) for starting age 2 and 28 days respectively (stress/strength 30%).
0
100
200
300
400
500
600
700
1 10 100 1000
Time (days)
Long
-term
shr
inka
ge (m
illio
nths
)
NC - AutogenousNC - TotalSCC - AutogenousSCC - Total
Figure 4.7 – Long-term shrinkage of NC and SCC both with w/c = 0.39. NC = mix proportions RO; SCC = mix KO.
0
20
40
60
80
100
120
140
160
180
0,0 0,1 10,0 1000,0
Time (days)
Cre
ep c
ompl
ianc
e (m
illio
nths
/MPa
)
NC - Basic 02NC - Total 02SCC - Basic 02SCC Total 02
Figure 4.8 – Creep compliance for starting age 2 days. Concrete with w/c = 0.39. NC = mix RO; SCC = mix KO.
0
20
40
60
80
100
120
140
0,0 0,1 10,0 1000,0
Time (days)
Cre
ep c
ompl
ianc
e (m
illio
nths
/MPa
)
NC - Basic 28 NC Total 28SCC - Basic 28 SCC - Total 28
Figure 4.9 – Creep compliance for starting age 28 days. Concrete with w/c = 0.39. NC = mix RO; SCC = mix KO.
31
At 2-day starting age creep seemed to be less for SCC than for NC, which may be due to higher early strength of SCC than of NC, see above, Figure 4.8. However, at 28-day starting age creep of NC and SCC performed more or less equal while the other parameters were kept constant, which was also confirmed by other research [39-42], Figure 4.9. 4.2 Chloride migration coefficient, D The following equation was used to calculate the chloride migration coefficient, D [4]: D= 0.0239·(273+T)·L·/[(U-2)·t]· ·{xd-0.0238·[(273+T)·L·xd)/(U-2)]½} (4.4) t denotes the test duration (h) xd denotes the average chloride
penetration depth (mm) D denotes the non-steady-state
migration coefficient, x10 –12 m²/s L denotes the thickness of the
specimen (mm) T denotes the average initial and
final temperatures in the anolyte solution (°C)
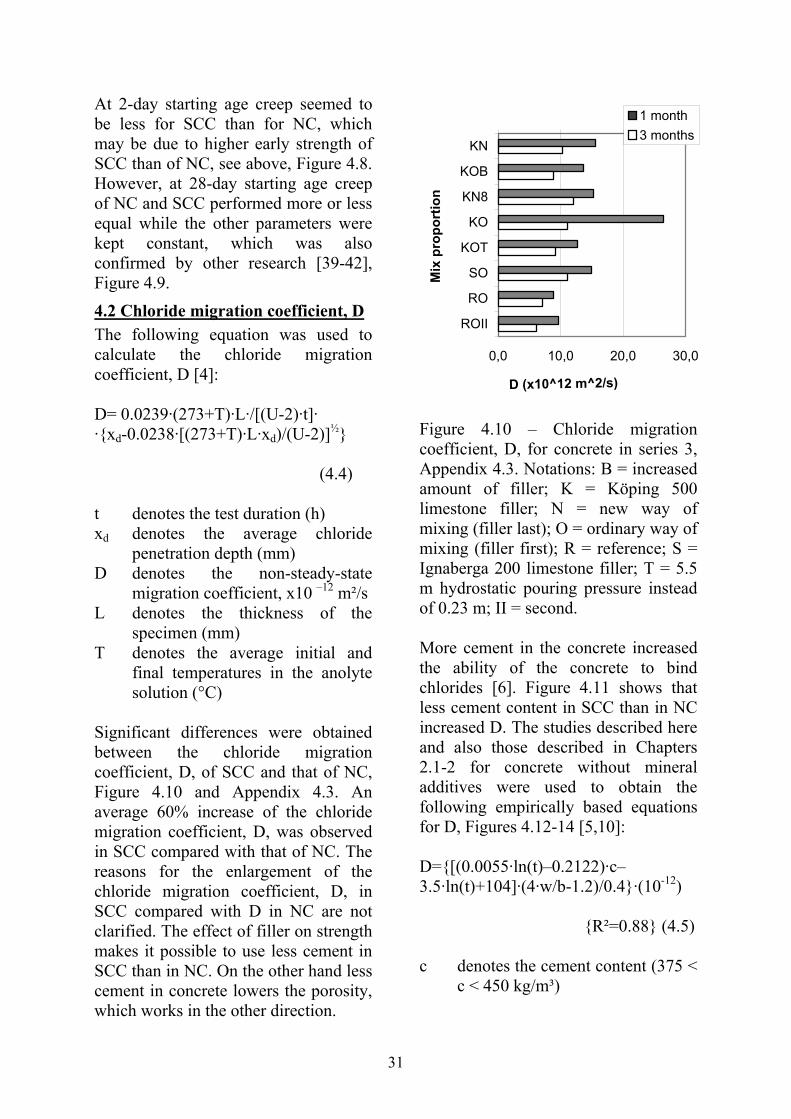
Significant differences were obtained between the chloride migration coefficient, D, of SCC and that of NC, Figure 4.10 and Appendix 4.3. An average 60% increase of the chloride migration coefficient, D, was observed in SCC compared with that of NC. The reasons for the enlargement of the chloride migration coefficient, D, in SCC compared with D in NC are not clarified. The effect of filler on strength makes it possible to use less cement in SCC than in NC. On the other hand less cement in concrete lowers the porosity, which works in the other direction.
0,0 10,0 20,0 30,0
KN
KOB
KN8
KO
KOT
SO
RO
ROII
Mix
pro
port
ion
D (x10^12 m^2/s)
1 month3 months
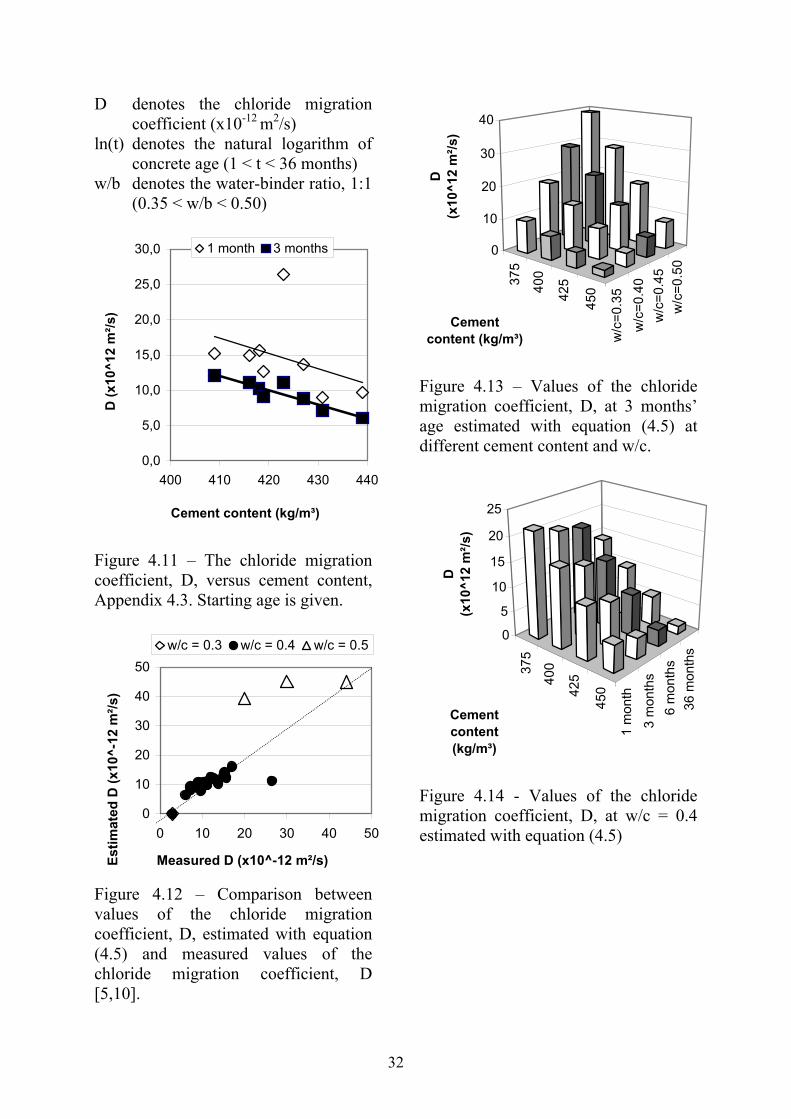
Figure 4.10 – Chloride migration coefficient, D, for concrete in series 3, Appendix 4.3. Notations: B = increased amount of filler; K = Köping 500 limestone filler; N = new way of mixing (filler last); O = ordinary way of mixing (filler first); R = reference; S = Ignaberga 200 limestone filler; T = 5.5 m hydrostatic pouring pressure instead of 0.23 m; II = second. More cement in the concrete increased the ability of the concrete to bind chlorides [6]. Figure 4.11 shows that less cement content in SCC than in NC increased D. The studies described here and also those described in Chapters 2.1-2 for concrete without mineral additives were used to obtain the following empirically based equations for D, Figures 4.12-14 [5,10]: D={[(0.0055·ln(t)–0.2122)·c–3.5·ln(t)+104]·(4·w/b-1.2)/0.4}·(10-12) {R²=0.88} (4.5) c denotes the cement content (375 <
c < 450 kg/m³)
32
D denotes the chloride migration coefficient (x10-12 m2/s)
ln(t) denotes the natural logarithm of concrete age (1 < t < 36 months)
w/b denotes the water-binder ratio, 1:1 (0.35 < w/b < 0.50)
0,0
5,0
10,0
15,0
20,0
25,0
30,0
400 410 420 430 440
Cement content (kg/m³)
D (x
10^1
2 m
²/s)
1 month 3 months
Figure 4.11 – The chloride migration coefficient, D, versus cement content, Appendix 4.3. Starting age is given.
0
10
20
30
40
50
0 10 20 30 40 50
Measured D (x10^-12 m²/s)Estim
ated
D (x
10^-
12 m
²/s)
w/c = 0.3 w/c = 0.4 w/c = 0.5
Figure 4.12 – Comparison between values of the chloride migration coefficient, D, estimated with equation (4.5) and measured values of the chloride migration coefficient, D [5,10].
375
400
425
450
w/c
=0.3
5w
/c=0
.40
w/c
=0.4
5w
/c=0
.50
0
10
20
30
40
D(x
10^1
2 m
²/s)
Cement content (kg/m³)
Figure 4.13 – Values of the chloride migration coefficient, D, at 3 months’ age estimated with equation (4.5) at different cement content and w/c.
375
400
425
450
1 m
onth
3 m
onth
s6
mon
ths
36 m
onth
s
0
5
10
15
20
25
D(x
10^1
2 m
²/s)
Cement content (kg/m³)
Figure 4.14 - Values of the chloride migration coefficient, D, at w/c = 0.4 estimated with equation (4.5)
33
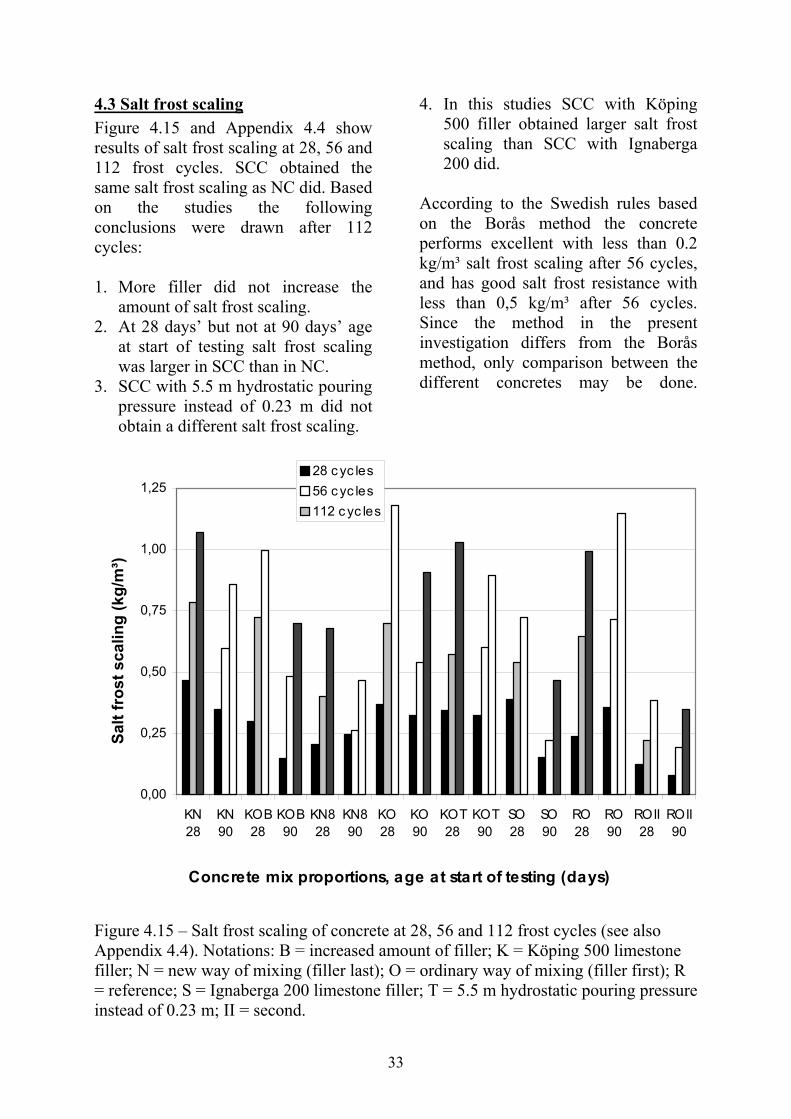
4.3 Salt frost scaling Figure 4.15 and Appendix 4.4 show results of salt frost scaling at 28, 56 and 112 frost cycles. SCC obtained the same salt frost scaling as NC did. Based on the studies the following conclusions were drawn after 112 cycles: 1. More filler did not increase the
amount of salt frost scaling. 2. At 28 days’ but not at 90 days’ age
at start of testing salt frost scaling was larger in SCC than in NC.
3. SCC with 5.5 m hydrostatic pouring pressure instead of 0.23 m did not obtain a different salt frost scaling.
4. In this studies SCC with Köping 500 filler obtained larger salt frost scaling than SCC with Ignaberga 200 did.
According to the Swedish rules based on the Borås method the concrete performs excellent with less than 0.2 kg/m³ salt frost scaling after 56 cycles, and has good salt frost resistance with less than 0,5 kg/m³ after 56 cycles. Since the method in the present investigation differs from the Borås method, only comparison between the different concretes may be done.
0,00
0,25
0,50
0,75
1,00
1,25
KN28
KN90
KOB28
KOB90
KN828
KN890
KO28
KO90
KOT28
KOT90
SO28
SO90
RO28
RO90
ROII28
ROII90
Concrete mix proportions, age at start of testing (days)
Salt
fros
t sca
ling
(kg/
m³)
28 c yc les56 c yc les112 c yc les
Figure 4.15 – Salt frost scaling of concrete at 28, 56 and 112 frost cycles (see also Appendix 4.4). Notations: B = increased amount of filler; K = Köping 500 limestone filler; N = new way of mixing (filler last); O = ordinary way of mixing (filler first); R = reference; S = Ignaberga 200 limestone filler; T = 5.5 m hydrostatic pouring pressure instead of 0.23 m; II = second.
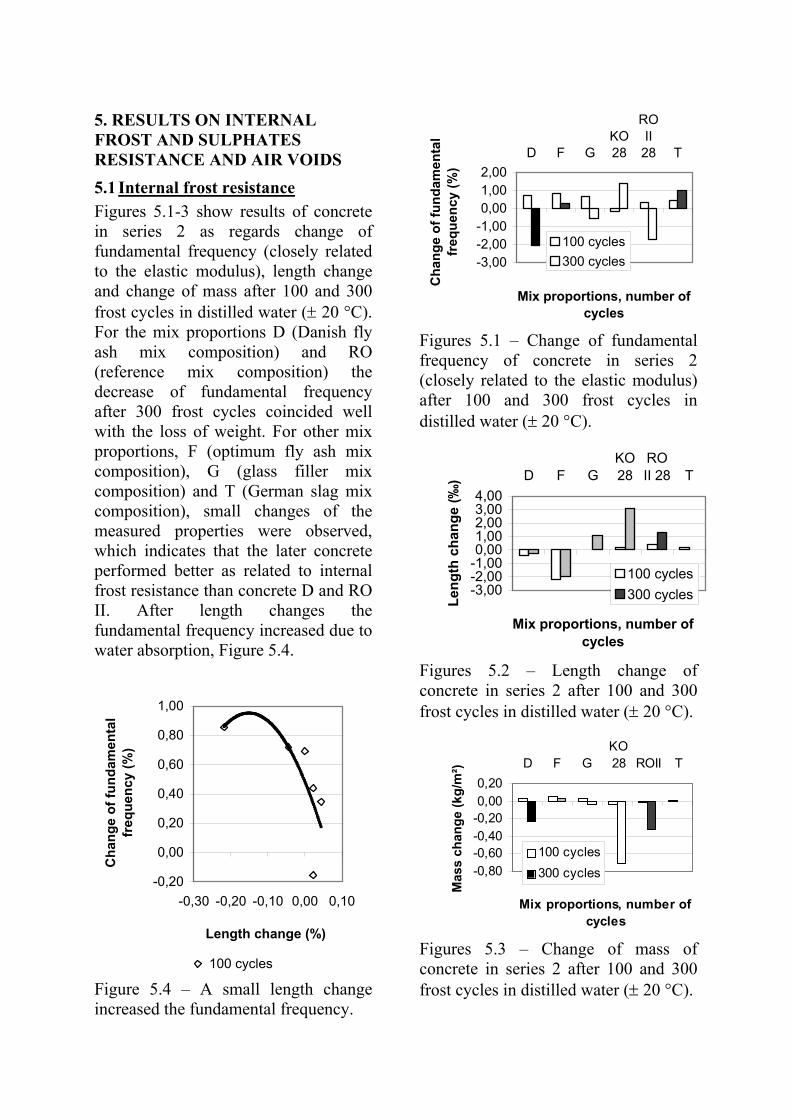
5. RESULTS ON INTERNAL FROST AND SULPHATES RESISTANCE AND AIR VOIDS 5.1 Internal frost resistance Figures 5.1-3 show results of concrete in series 2 as regards change of fundamental frequency (closely related to the elastic modulus), length change and change of mass after 100 and 300 frost cycles in distilled water (± 20 °C). For the mix proportions D (Danish fly ash mix composition) and RO (reference mix composition) the decrease of fundamental frequency after 300 frost cycles coincided well with the loss of weight. For other mix proportions, F (optimum fly ash mix composition), G (glass filler mix composition) and T (German slag mix composition), small changes of the measured properties were observed, which indicates that the later concrete performed better as related to internal frost resistance than concrete D and RO II. After length changes the fundamental frequency increased due to water absorption, Figure 5.4.
-0,20
0,00
0,20
0,40
0,60
0,80
1,00
-0,30 -0,20 -0,10 0,00 0,10
Length change (%)
Cha
nge
of fu
ndam
enta
l fr
eque
ncy
(%)
100 cycles
Figure 5.4 – A small length change increased the fundamental frequency.
-3,00-2,00-1,000,001,002,00
D F GKO28
ROII
28 T
Mix proportions, number of cycles
Cha
nge
of fu
ndam
enta
l fr
eque
ncy
(%)
100 cycles300 cycles
Figures 5.1 – Change of fundamental frequency of concrete in series 2 (closely related to the elastic modulus) after 100 and 300 frost cycles in distilled water (± 20 °C).
-3,00-2,00-1,000,001,002,003,004,00
D F GKO28
ROII 28 T
Mix proportions, number of cycles
Leng
th c
hang
e (‰
)
100 cycles300 cycles
Figures 5.2 – Length change of concrete in series 2 after 100 and 300 frost cycles in distilled water (± 20 °C).
-0,80-0,60-0,40-0,200,000,20
D F GKO28 ROII T
Mix proportions, number of cycles
Mas
s ch
ange
(kg/
m²)
100 cycles300 cycles
Figures 5.3 – Change of mass of concrete in series 2 after 100 and 300 frost cycles in distilled water (± 20 °C).
35
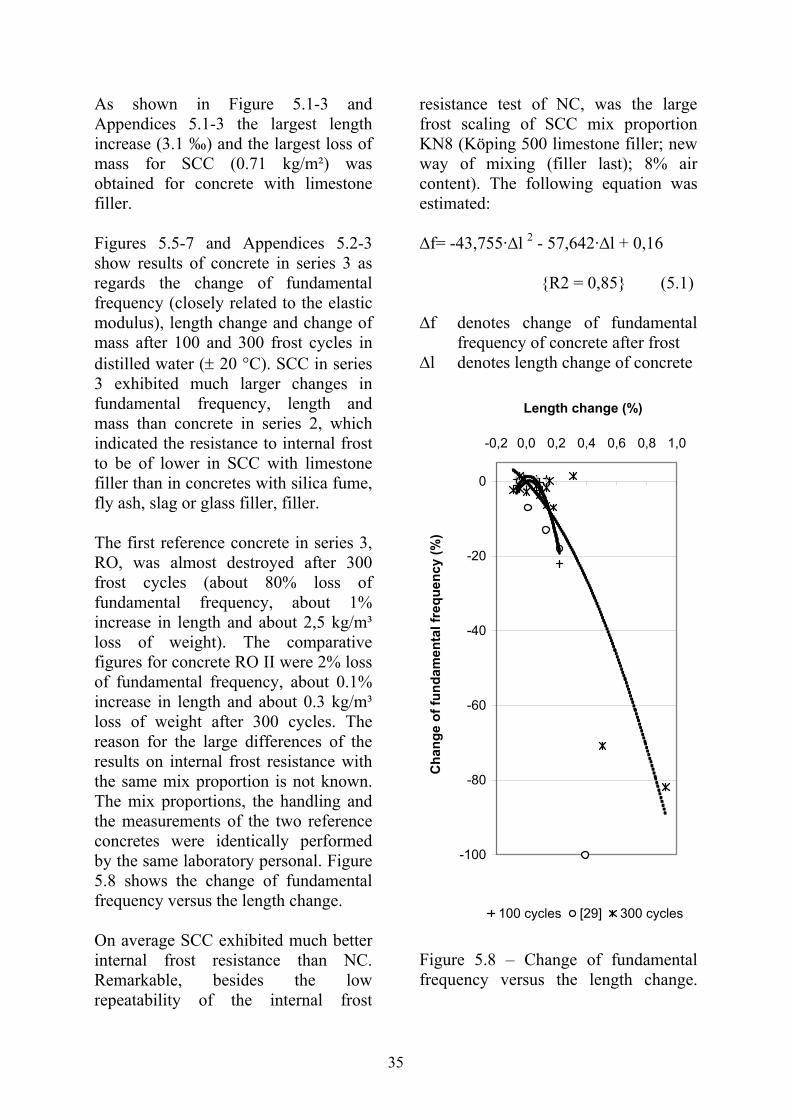
As shown in Figure 5.1-3 and Appendices 5.1-3 the largest length increase (3.1 ‰) and the largest loss of mass for SCC (0.71 kg/m²) was obtained for concrete with limestone filler. Figures 5.5-7 and Appendices 5.2-3 show results of concrete in series 3 as regards the change of fundamental frequency (closely related to the elastic modulus), length change and change of mass after 100 and 300 frost cycles in distilled water (± 20 °C). SCC in series 3 exhibited much larger changes in fundamental frequency, length and mass than concrete in series 2, which indicated the resistance to internal frost to be of lower in SCC with limestone filler than in concretes with silica fume, fly ash, slag or glass filler, filler. The first reference concrete in series 3, RO, was almost destroyed after 300 frost cycles (about 80% loss of fundamental frequency, about 1% increase in length and about 2,5 kg/m³ loss of weight). The comparative figures for concrete RO II were 2% loss of fundamental frequency, about 0.1% increase in length and about 0.3 kg/m³ loss of weight after 300 cycles. The reason for the large differences of the results on internal frost resistance with the same mix proportion is not known. The mix proportions, the handling and the measurements of the two reference concretes were identically performed by the same laboratory personal. Figure 5.8 shows the change of fundamental frequency versus the length change. On average SCC exhibited much better internal frost resistance than NC. Remarkable, besides the low repeatability of the internal frost
resistance test of NC, was the large frost scaling of SCC mix proportion KN8 (Köping 500 limestone filler; new way of mixing (filler last); 8% air content). The following equation was estimated: ∆f= -43,755·∆l 2 - 57,642·∆l + 0,16
{R2 = 0,85} (5.1) ∆f denotes change of fundamental
frequency of concrete after frost ∆l denotes length change of concrete
-100
-80
-60
-40
-20
0
-0,2 0,0 0,2 0,4 0,6 0,8 1,0
Length change (%)
Cha
nge
of fu
ndam
enta
l fre
quen
cy (%
)
100 cycles [29] 300 cycles
Figure 5.8 – Change of fundamental frequency versus the length change.
36
-100,00
-80,00
-60,00
-40,00
-20,00
0,00KN
28
KN 9
0
KOB
28
KOB
90
KN8
28
KN8
90
KO 2
8
KO 9
0
KOT
28
KOT
90
SO 2
8
SO 9
0
RO
28
RO
90
RO
II 2
8
RO
II 90
Mix proportions, age at start of testing (days)
Cha
nge
of in
tern
al
fund
amen
tal f
requ
ency
(%)
100 cycles300 cycles
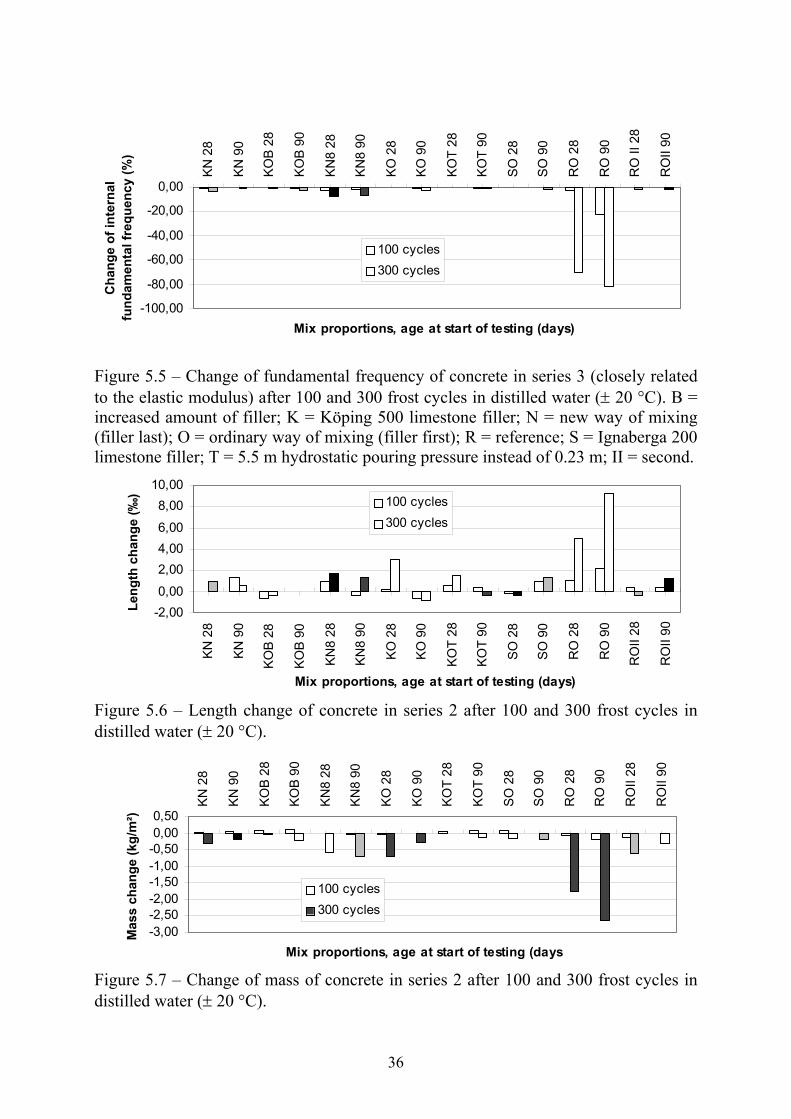
Figure 5.5 – Change of fundamental frequency of concrete in series 3 (closely related to the elastic modulus) after 100 and 300 frost cycles in distilled water (± 20 °C). B = increased amount of filler; K = Köping 500 limestone filler; N = new way of mixing (filler last); O = ordinary way of mixing (filler first); R = reference; S = Ignaberga 200 limestone filler; T = 5.5 m hydrostatic pouring pressure instead of 0.23 m; II = second.
-2,000,00
2,004,006,00
8,0010,00
KN 2
8
KN 9
0
KOB
28
KOB
90
KN8
28
KN8
90
KO 2
8
KO 9
0
KOT
28
KOT
90
SO 2
8
SO 9
0
RO
28
RO
90
RO
II 28
RO
II 90
Mix proportions, age at start of testing (days)
Leng
th c
hang
e (‰
) 100 cycles300 cycles
Figure 5.6 – Length change of concrete in series 2 after 100 and 300 frost cycles in distilled water (± 20 °C).
-3,00-2,50-2,00-1,50-1,00-0,500,000,50
KN 2
8
KN 9
0
KOB
28
KOB
90
KN8
28
KN8
90
KO 2
8
KO 9
0
KOT
28
KOT
90
SO 2
8
SO 9
0
RO
28
RO
90
RO
II 28
RO
II 90
Mix proportions, age at start of testing (days
Mas
s ch
ange
(kg/
m²)
100 cycles300 cycles
Figure 5.7 – Change of mass of concrete in series 2 after 100 and 300 frost cycles in distilled water (± 20 °C).
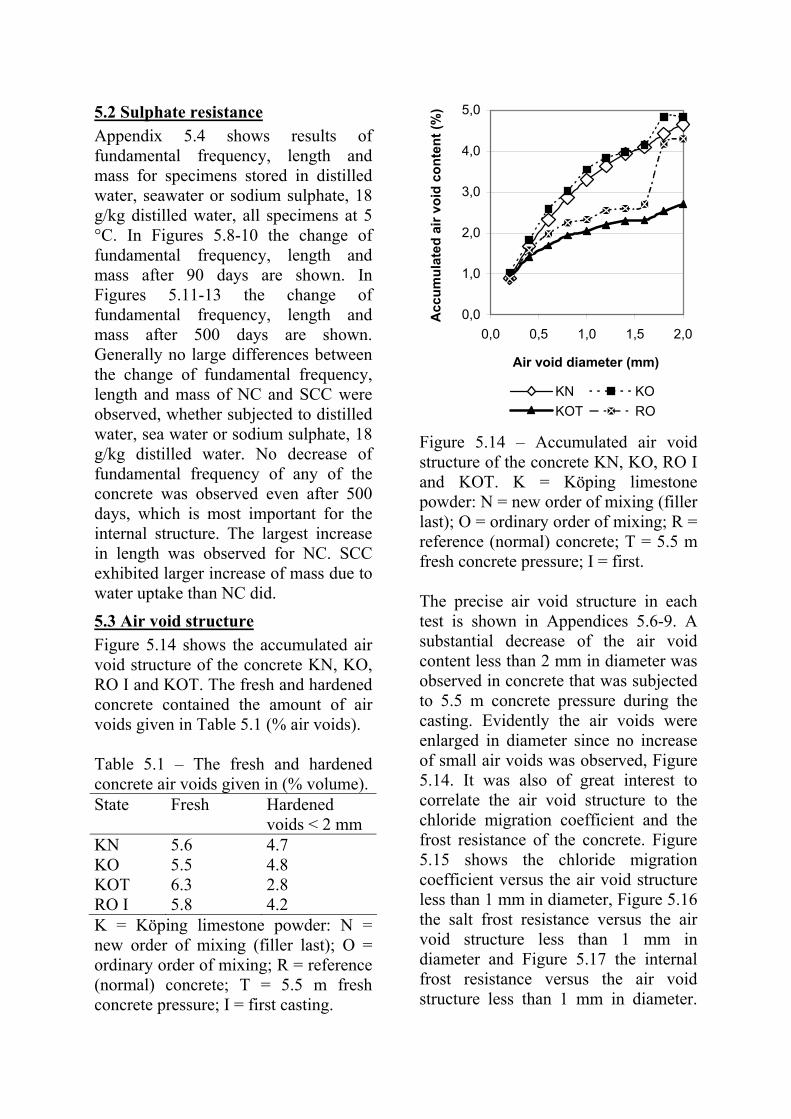
5.2 Sulphate resistance Appendix 5.4 shows results of fundamental frequency, length and mass for specimens stored in distilled water, seawater or sodium sulphate, 18 g/kg distilled water, all specimens at 5 °C. In Figures 5.8-10 the change of fundamental frequency, length and mass after 90 days are shown. In Figures 5.11-13 the change of fundamental frequency, length and mass after 500 days are shown. Generally no large differences between the change of fundamental frequency, length and mass of NC and SCC were observed, whether subjected to distilled water, sea water or sodium sulphate, 18 g/kg distilled water. No decrease of fundamental frequency of any of the concrete was observed even after 500 days, which is most important for the internal structure. The largest increase in length was observed for NC. SCC exhibited larger increase of mass due to water uptake than NC did. 5.3 Air void structure Figure 5.14 shows the accumulated air void structure of the concrete KN, KO, RO I and KOT. The fresh and hardened concrete contained the amount of air voids given in Table 5.1 (% air voids). Table 5.1 – The fresh and hardened concrete air voids given in (% volume). State Fresh Hardened
voids < 2 mm KN 5.6 4.7 KO 5.5 4.8 KOT 6.3 2.8 RO I 5.8 4.2 K = Köping limestone powder: N = new order of mixing (filler last); O = ordinary order of mixing; R = reference (normal) concrete; T = 5.5 m fresh concrete pressure; I = first casting.
0,0
1,0
2,0
3,0
4,0
5,0
0,0 0,5 1,0 1,5 2,0
Air void diameter (mm)
Acc
umul
ated
air
void
con
tent
(%)
KN KOKOT RO
Figure 5.14 – Accumulated air void structure of the concrete KN, KO, RO I and KOT. K = Köping limestone powder: N = new order of mixing (filler last); O = ordinary order of mixing; R = reference (normal) concrete; T = 5.5 m fresh concrete pressure; I = first. The precise air void structure in each test is shown in Appendices 5.6-9. A substantial decrease of the air void content less than 2 mm in diameter was observed in concrete that was subjected to 5.5 m concrete pressure during the casting. Evidently the air voids were enlarged in diameter since no increase of small air voids was observed, Figure 5.14. It was also of great interest to correlate the air void structure to the chloride migration coefficient and the frost resistance of the concrete. Figure 5.15 shows the chloride migration coefficient versus the air void structure less than 1 mm in diameter, Figure 5.16 the salt frost resistance versus the air void structure less than 1 mm in diameter and Figure 5.17 the internal frost resistance versus the air void structure less than 1 mm in diameter.
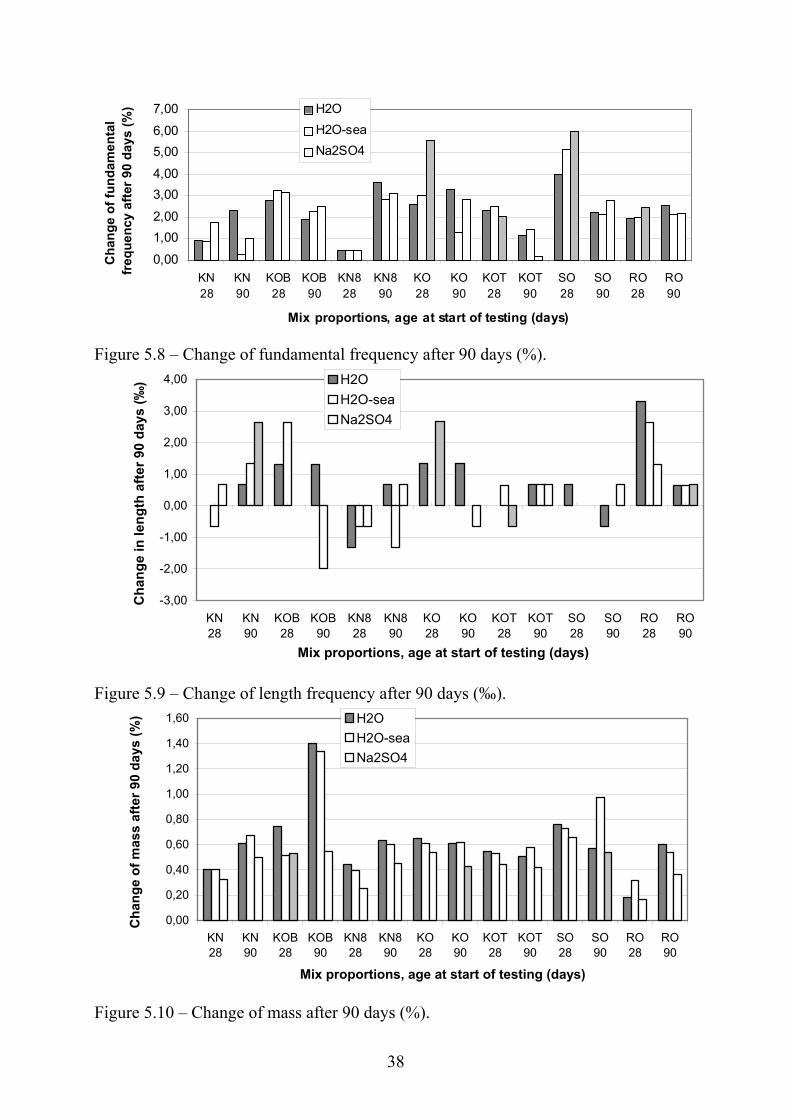
38
0,00
1,002,00
3,004,00
5,006,00
7,00
KN28
KN90
KOB28
KOB90
KN828
KN890
KO28
KO90
KOT28
KOT90
SO28
SO90
RO28
RO90
Mix proportions, age at start of testing (days)
Cha
nge
of fu
ndam
enta
l fr
eque
ncy
afte
r 90
days
(%) H2O
H2O-seaNa2SO4
Figure 5.8 – Change of fundamental frequency after 90 days (%).
-3,00
-2,00
-1,00
0,00
1,00
2,00
3,00
4,00
KN28
KN90
KOB28
KOB90
KN828
KN890
KO28
KO90
KOT28
KOT90
SO28
SO90
RO28
RO90
Mix proportions, age at start of testing (days)
Cha
nge
in le
ngth
afte
r 90
days
(‰) H2O
H2O-seaNa2SO4
Figure 5.9 – Change of length frequency after 90 days (‰).
0,00
0,20
0,40
0,60
0,80
1,00
1,20
1,40
1,60
KN28
KN90
KOB28
KOB90
KN828
KN890
KO28
KO90
KOT28
KOT90
SO28
SO90
RO28
RO90
Mix proportions, age at start of testing (days)
Cha
nge
of m
ass
afte
r 90
days
(%) H2O
H2O-seaNa2SO4
Figure 5.10 – Change of mass after 90 days (%).
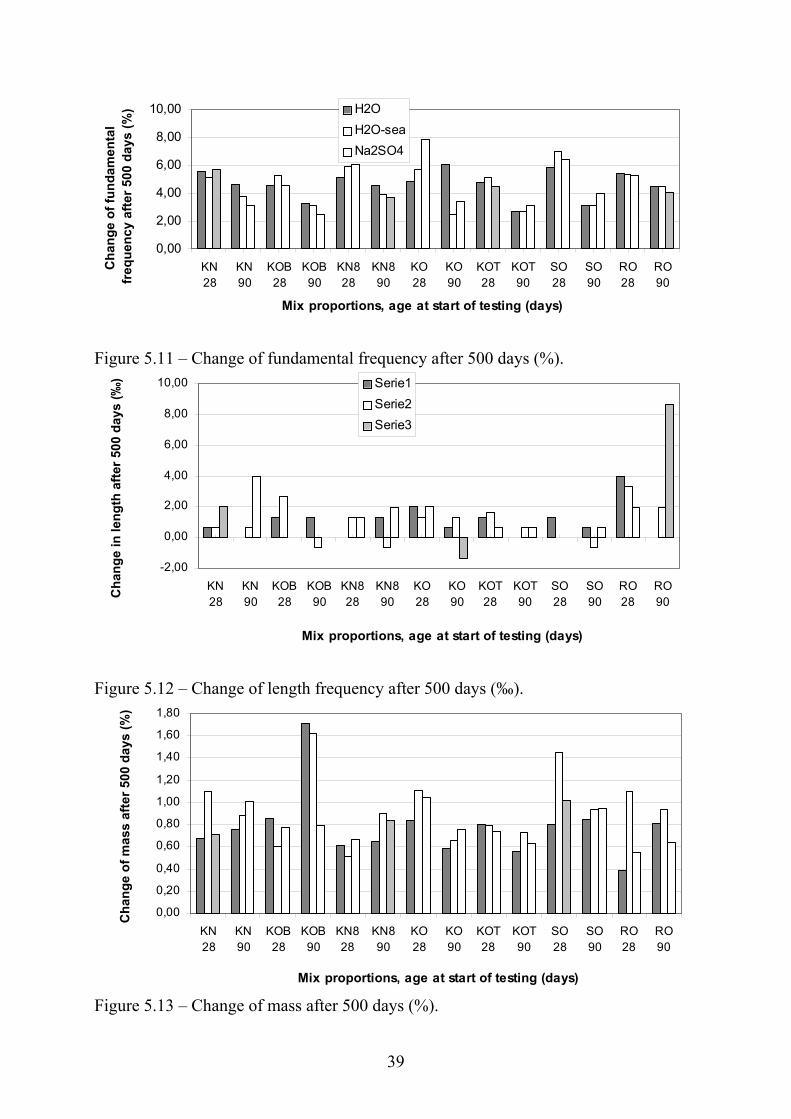
39
0,00
2,00
4,00
6,00
8,00
10,00
KN28
KN90
KOB28
KOB90
KN828
KN890
KO28
KO90
KOT28
KOT90
SO28
SO90
RO28
RO90
Mix proportions, age at start of testing (days)
Cha
nge
of fu
ndam
enta
l fr
eque
ncy
afte
r 500
day
s (%
) H2OH2O-seaNa2SO4
Figure 5.11 – Change of fundamental frequency after 500 days (%).
-2,00
0,00
2,00
4,00
6,00
8,00
10,00
KN28
KN90
KOB28
KOB90
KN828
KN890
KO28
KO90
KOT28
KOT90
SO28
SO90
RO28
RO90
Mix proportions, age at start of testing (days)
Cha
nge
in le
ngth
afte
r 500
day
s (‰
) Serie1Serie2Serie3
Figure 5.12 – Change of length frequency after 500 days (‰).
0,00
0,20
0,40
0,60
0,80
1,00
1,20
1,40
1,60
1,80
KN28
KN90
KOB28
KOB90
KN828
KN890
KO28
KO90
KOT28
KOT90
SO28
SO90
RO28
RO90
Mix proportions, age at start of testing (days)
Cha
nge
of m
ass
afte
r 500
day
s (%
)
Figure 5.13 – Change of mass after 500 days (%).
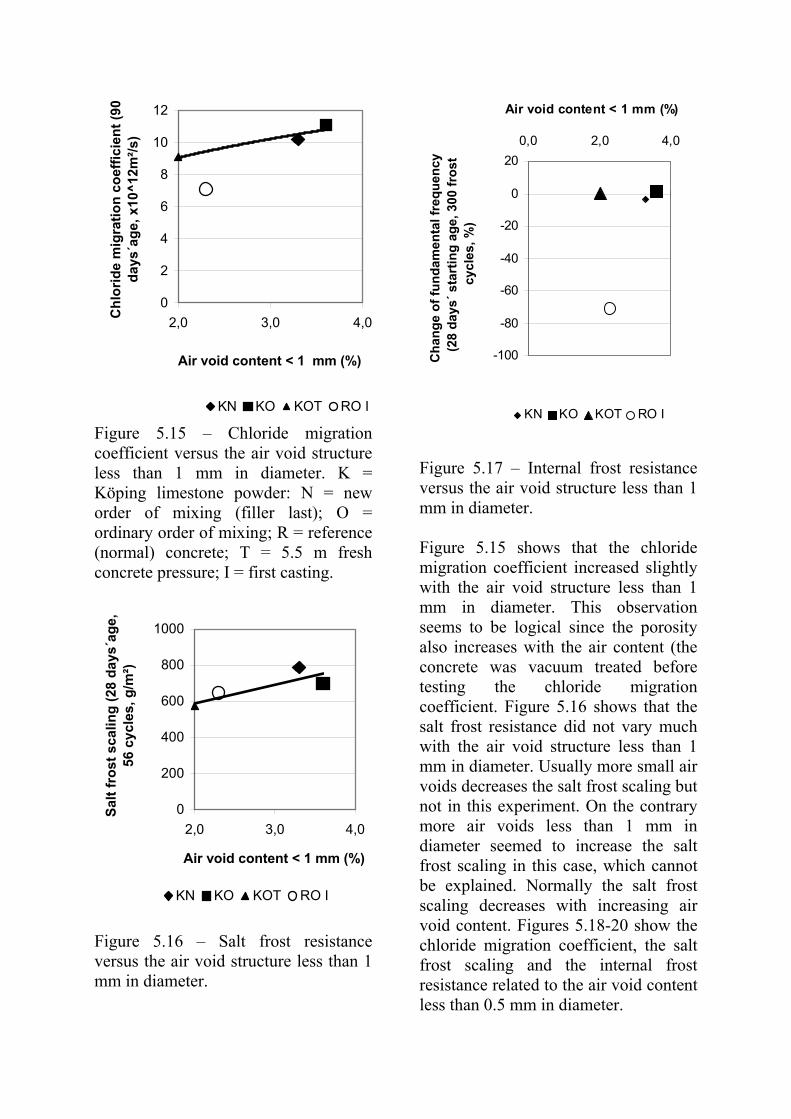
0
2
4
6
8
10
12
2,0 3,0 4,0
Air void content < 1 mm (%)
Chl
orid
e m
igra
tion
coef
ficie
nt (9
0 da
ys´a
ge, x
10^1
2m²/s
)
KN KO KOT RO I
Figure 5.15 – Chloride migration coefficient versus the air void structure less than 1 mm in diameter. K = Köping limestone powder: N = new order of mixing (filler last); O = ordinary order of mixing; R = reference (normal) concrete; T = 5.5 m fresh concrete pressure; I = first casting.
0
200
400
600
800
1000
2,0 3,0 4,0
Air void content < 1 mm (%)
Salt
fros
t sca
ling
(28
days
´age
, 56
cyc
les,
g/m
²)
KN KO KOT RO I
Figure 5.16 – Salt frost resistance versus the air void structure less than 1 mm in diameter.
-100
-80
-60
-40
-20
0
200,0 2,0 4,0
Air void content < 1 mm (%)
Cha
nge
of fu
ndam
enta
l fre
quen
cy
(28
days
´ sta
rtin
g ag
e, 3
00 fr
ost
cycl
es, %
)
KN KO KOT RO I Figure 5.17 – Internal frost resistance versus the air void structure less than 1 mm in diameter. Figure 5.15 shows that the chloride migration coefficient increased slightly with the air void structure less than 1 mm in diameter. This observation seems to be logical since the porosity also increases with the air content (the concrete was vacuum treated before testing the chloride migration coefficient. Figure 5.16 shows that the salt frost resistance did not vary much with the air void structure less than 1 mm in diameter. Usually more small air voids decreases the salt frost scaling but not in this experiment. On the contrary more air voids less than 1 mm in diameter seemed to increase the salt frost scaling in this case, which cannot be explained. Normally the salt frost scaling decreases with increasing air void content. Figures 5.18-20 show the chloride migration coefficient, the salt frost scaling and the internal frost resistance related to the air void content less than 0.5 mm in diameter.
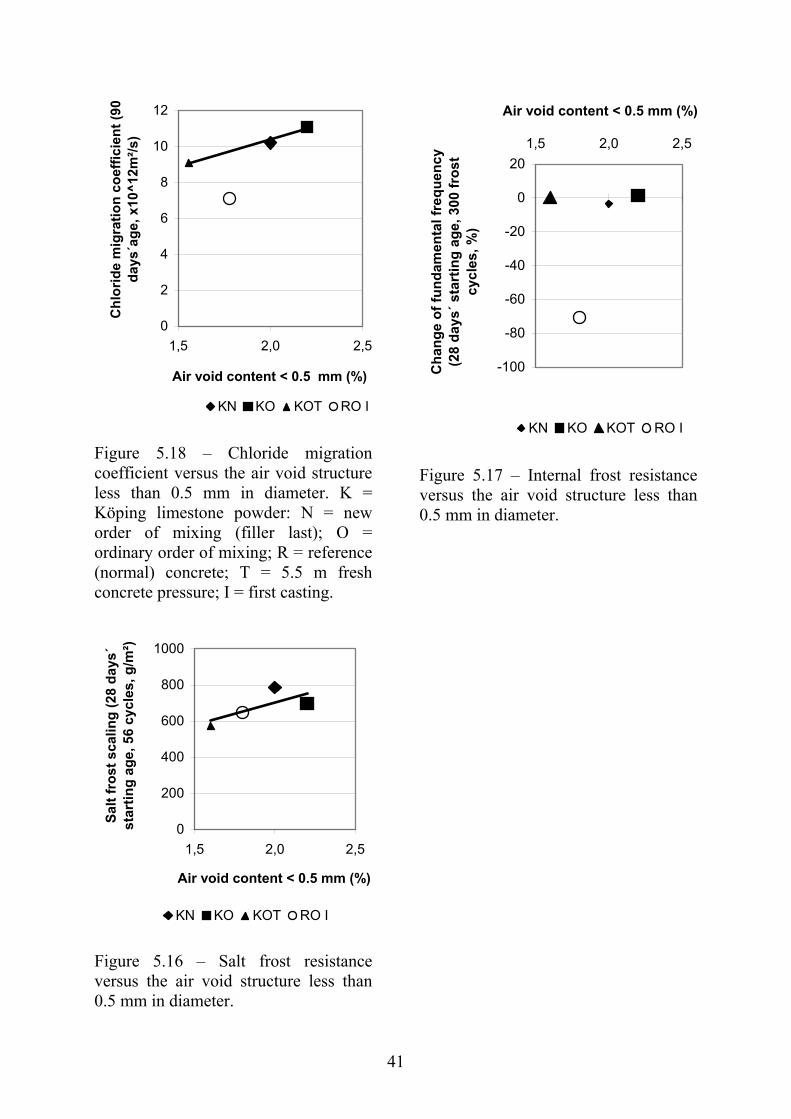
41
0
2
4
6
8
10
12
1,5 2,0 2,5
Air void content < 0.5 mm (%)
Chl
orid
e m
igra
tion
coef
ficie
nt (9
0 da
ys´a
ge, x
10^1
2m²/s
)
KN KO KOT RO I
Figure 5.18 – Chloride migration coefficient versus the air void structure less than 0.5 mm in diameter. K = Köping limestone powder: N = new order of mixing (filler last); O = ordinary order of mixing; R = reference (normal) concrete; T = 5.5 m fresh concrete pressure; I = first casting.
0
200
400
600
800
1000
1,5 2,0 2,5
Air void content < 0.5 mm (%)
Salt
fros
t sca
ling
(28
days
´ st
artin
g ag
e, 5
6 cy
cles
, g/m
²)
KN KO KOT RO I
Figure 5.16 – Salt frost resistance versus the air void structure less than 0.5 mm in diameter.
-100
-80
-60
-40
-20
0
201,5 2,0 2,5
Air void content < 0.5 mm (%)
Cha
nge
of fu
ndam
enta
l fre
quen
cy
(28
days
´ sta
rtin
g ag
e, 3
00 fr
ost
cycl
es, %
)
KN KO KOT RO I
Figure 5.17 – Internal frost resistance versus the air void structure less than 0.5 mm in diameter.
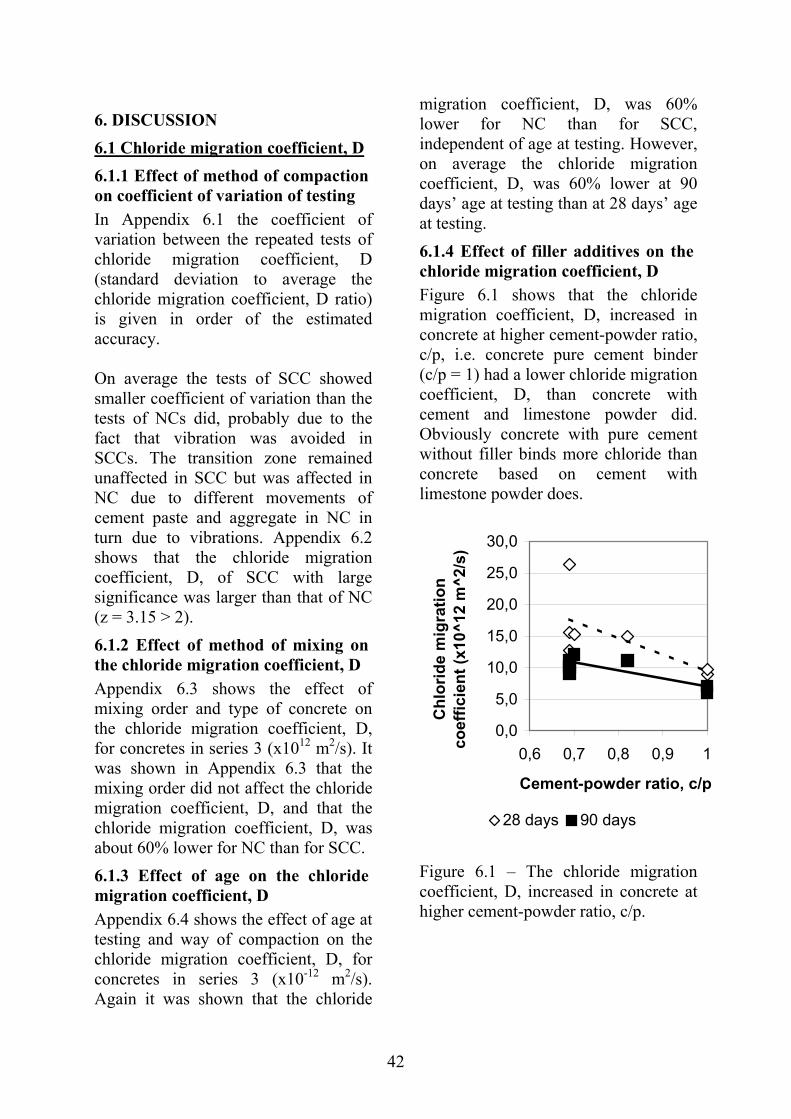
42
6. DISCUSSION 6.1 Chloride migration coefficient, D 6.1.1 Effect of method of compaction on coefficient of variation of testing In Appendix 6.1 the coefficient of variation between the repeated tests of chloride migration coefficient, D (standard deviation to average the chloride migration coefficient, D ratio) is given in order of the estimated accuracy. On average the tests of SCC showed smaller coefficient of variation than the tests of NCs did, probably due to the fact that vibration was avoided in SCCs. The transition zone remained unaffected in SCC but was affected in NC due to different movements of cement paste and aggregate in NC in turn due to vibrations. Appendix 6.2 shows that the chloride migration coefficient, D, of SCC with large significance was larger than that of NC (z = 3.15 > 2). 6.1.2 Effect of method of mixing on the chloride migration coefficient, D Appendix 6.3 shows the effect of mixing order and type of concrete on the chloride migration coefficient, D, for concretes in series 3 (x1012 m2/s). It was shown in Appendix 6.3 that the mixing order did not affect the chloride migration coefficient, D, and that the chloride migration coefficient, D, was about 60% lower for NC than for SCC. 6.1.3 Effect of age on the chloride migration coefficient, D Appendix 6.4 shows the effect of age at testing and way of compaction on the chloride migration coefficient, D, for concretes in series 3 (x10-12 m2/s). Again it was shown that the chloride
migration coefficient, D, was 60% lower for NC than for SCC, independent of age at testing. However, on average the chloride migration coefficient, D, was 60% lower at 90 days’ age at testing than at 28 days’ age at testing. 6.1.4 Effect of filler additives on the chloride migration coefficient, D Figure 6.1 shows that the chloride migration coefficient, D, increased in concrete at higher cement-powder ratio, c/p, i.e. concrete pure cement binder (c/p = 1) had a lower chloride migration coefficient, D, than concrete with cement and limestone powder did. Obviously concrete with pure cement without filler binds more chloride than concrete based on cement with limestone powder does.
0,0
5,0
10,0
15,0
20,0
25,0
30,0
0,6 0,7 0,8 0,9 1
Cement-powder ratio, c/p
Chl
orid
e m
igra
tion
coef
ficie
nt (x
10^1
2 m
^2/s
)
28 days 90 days
Figure 6.1 – The chloride migration coefficient, D, increased in concrete at higher cement-powder ratio, c/p.
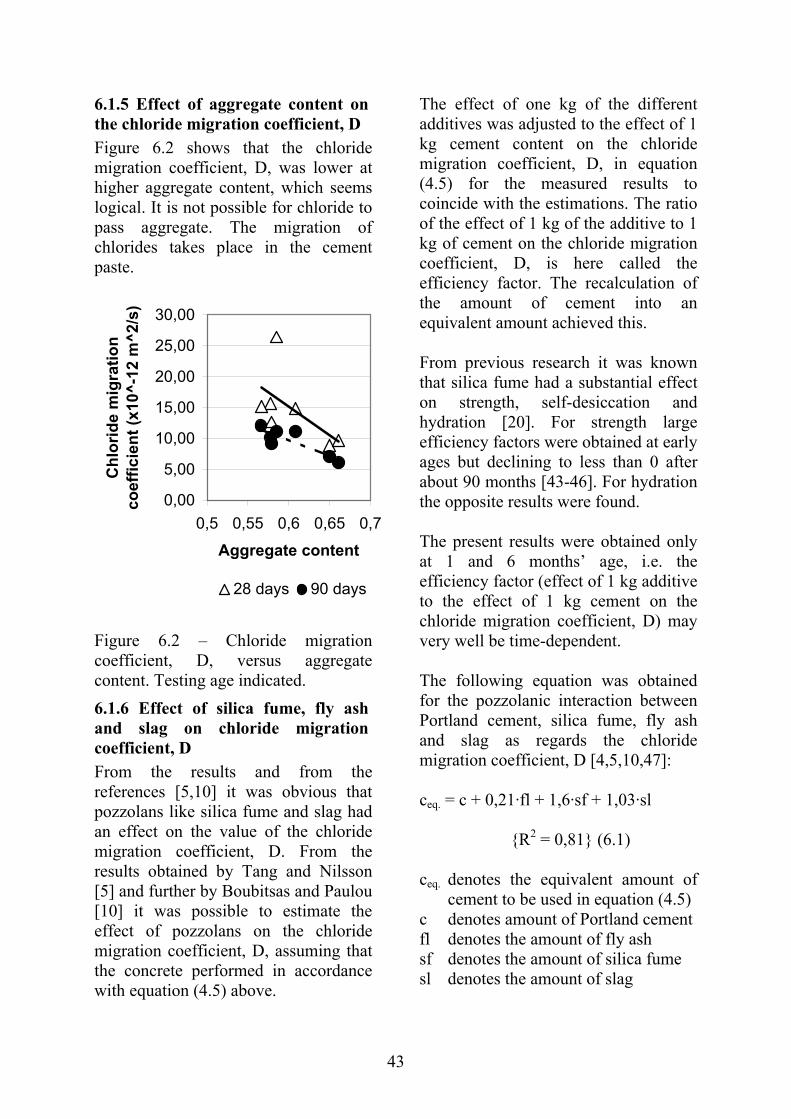
43
6.1.5 Effect of aggregate content on the chloride migration coefficient, D Figure 6.2 shows that the chloride migration coefficient, D, was lower at higher aggregate content, which seems logical. It is not possible for chloride to pass aggregate. The migration of chlorides takes place in the cement paste.
0,00
5,00
10,00
15,00
20,00
25,00
30,00
0,5 0,55 0,6 0,65 0,7
Aggregate content
Chl
orid
e m
igra
tion
coef
ficie
nt (x
10^-
12 m
^2/s
)
28 days 90 days
Figure 6.2 – Chloride migration coefficient, D, versus aggregate content. Testing age indicated. 6.1.6 Effect of silica fume, fly ash and slag on chloride migration coefficient, D From the results and from the references [5,10] it was obvious that pozzolans like silica fume and slag had an effect on the value of the chloride migration coefficient, D. From the results obtained by Tang and Nilsson [5] and further by Boubitsas and Paulou [10] it was possible to estimate the effect of pozzolans on the chloride migration coefficient, D, assuming that the concrete performed in accordance with equation (4.5) above.
The effect of one kg of the different additives was adjusted to the effect of 1 kg cement content on the chloride migration coefficient, D, in equation (4.5) for the measured results to coincide with the estimations. The ratio of the effect of 1 kg of the additive to 1 kg of cement on the chloride migration coefficient, D, is here called the efficiency factor. The recalculation of the amount of cement into an equivalent amount achieved this. From previous research it was known that silica fume had a substantial effect on strength, self-desiccation and hydration [20]. For strength large efficiency factors were obtained at early ages but declining to less than 0 after about 90 months [43-46]. For hydration the opposite results were found. The present results were obtained only at 1 and 6 months’ age, i.e. the efficiency factor (effect of 1 kg additive to the effect of 1 kg cement on the chloride migration coefficient, D) may very well be time-dependent. The following equation was obtained for the pozzolanic interaction between Portland cement, silica fume, fly ash and slag as regards the chloride migration coefficient, D [4,5,10,47]: ceq. = c + 0,21·fl + 1,6·sf + 1,03·sl {R2 = 0,81} (6.1) ceq. denotes the equivalent amount of
cement to be used in equation (4.5) c denotes amount of Portland cement fl denotes the amount of fly ash sf denotes the amount of silica fume sl denotes the amount of slag
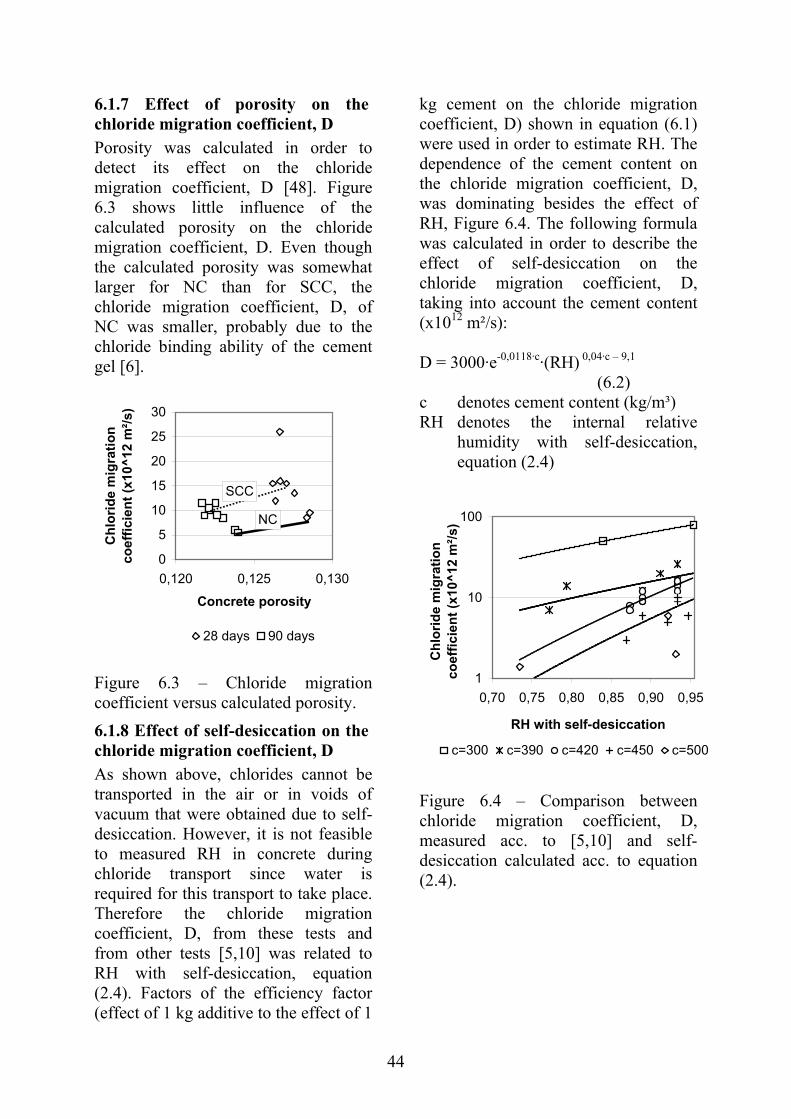
44
6.1.7 Effect of porosity on the chloride migration coefficient, D Porosity was calculated in order to detect its effect on the chloride migration coefficient, D [48]. Figure 6.3 shows little influence of the calculated porosity on the chloride migration coefficient, D. Even though the calculated porosity was somewhat larger for NC than for SCC, the chloride migration coefficient, D, of NC was smaller, probably due to the chloride binding ability of the cement gel [6].
0
5
10
15
20
25
30
0,120 0,125 0,130
Concrete porosity
Chl
orid
e m
igra
tion
coef
ficie
nt (x
10^1
2 m
²/s)
28 days 90 days
NC
SCC
Figure 6.3 – Chloride migration coefficient versus calculated porosity. 6.1.8 Effect of self-desiccation on the chloride migration coefficient, D As shown above, chlorides cannot be transported in the air or in voids of vacuum that were obtained due to self-desiccation. However, it is not feasible to measured RH in concrete during chloride transport since water is required for this transport to take place. Therefore the chloride migration coefficient, D, from these tests and from other tests [5,10] was related to RH with self-desiccation, equation (2.4). Factors of the efficiency factor (effect of 1 kg additive to the effect of 1
kg cement on the chloride migration coefficient, D) shown in equation (6.1) were used in order to estimate RH. The dependence of the cement content on the chloride migration coefficient, D, was dominating besides the effect of RH, Figure 6.4. The following formula was calculated in order to describe the effect of self-desiccation on the chloride migration coefficient, D, taking into account the cement content (x1012 m²/s): D = 3000·e-0,0118·c·(RH) 0,04·c – 9,1 (6.2) c denotes cement content (kg/m³) RH denotes the internal relative
humidity with self-desiccation, equation (2.4)
1
10
100
0,70 0,75 0,80 0,85 0,90 0,95
RH with self-desiccation
Chl
orid
e m
igra
tion
coef
ficie
nt (x
10^1
2 m
²/s)
c=300 c=390 c=420 c=450 c=500
Figure 6.4 – Comparison between chloride migration coefficient, D, measured acc. to [5,10] and self-desiccation calculated acc. to equation (2.4).
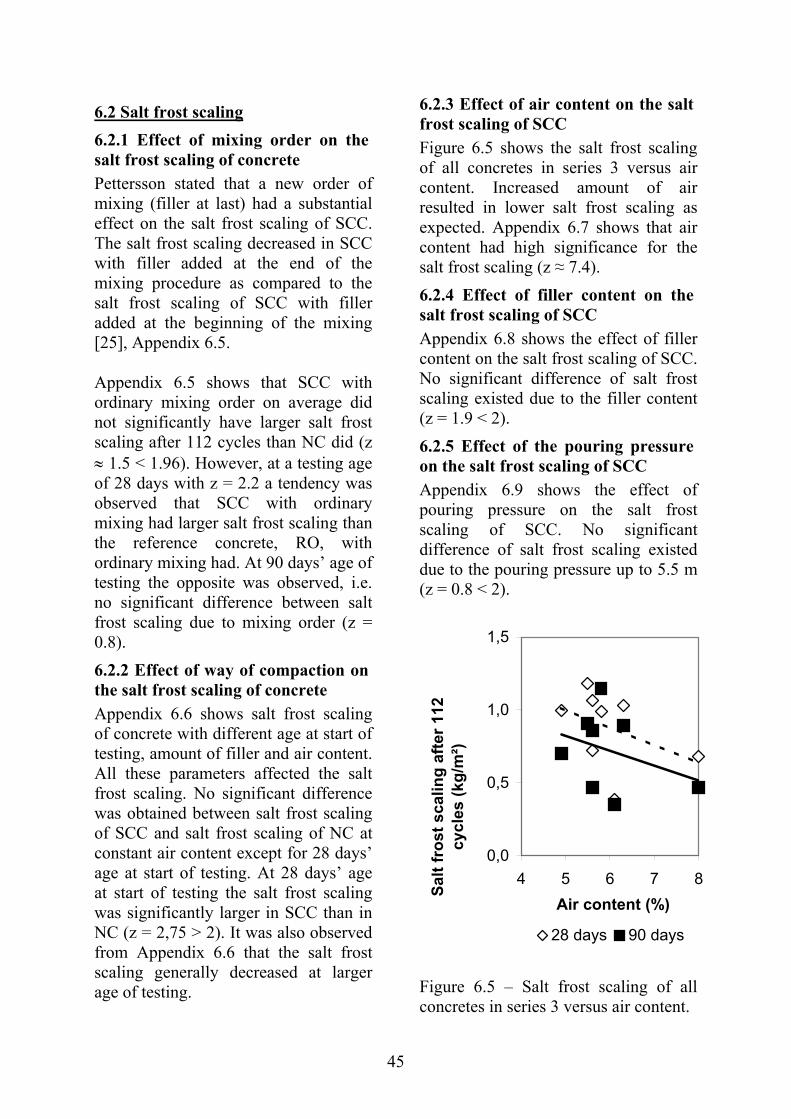
45
6.2 Salt frost scaling 6.2.1 Effect of mixing order on the salt frost scaling of concrete Pettersson stated that a new order of mixing (filler at last) had a substantial effect on the salt frost scaling of SCC. The salt frost scaling decreased in SCC with filler added at the end of the mixing procedure as compared to the salt frost scaling of SCC with filler added at the beginning of the mixing [25], Appendix 6.5. Appendix 6.5 shows that SCC with ordinary mixing order on average did not significantly have larger salt frost scaling after 112 cycles than NC did (z ≈ 1.5 < 1.96). However, at a testing age of 28 days with z = 2.2 a tendency was observed that SCC with ordinary mixing had larger salt frost scaling than the reference concrete, RO, with ordinary mixing had. At 90 days’ age of testing the opposite was observed, i.e. no significant difference between salt frost scaling due to mixing order (z = 0.8). 6.2.2 Effect of way of compaction on the salt frost scaling of concrete Appendix 6.6 shows salt frost scaling of concrete with different age at start of testing, amount of filler and air content. All these parameters affected the salt frost scaling. No significant difference was obtained between salt frost scaling of SCC and salt frost scaling of NC at constant air content except for 28 days’ age at start of testing. At 28 days’ age at start of testing the salt frost scaling was significantly larger in SCC than in NC (z = 2,75 > 2). It was also observed from Appendix 6.6 that the salt frost scaling generally decreased at larger age of testing.
6.2.3 Effect of air content on the salt frost scaling of SCC Figure 6.5 shows the salt frost scaling of all concretes in series 3 versus air content. Increased amount of air resulted in lower salt frost scaling as expected. Appendix 6.7 shows that air content had high significance for the salt frost scaling (z ≈ 7.4). 6.2.4 Effect of filler content on the salt frost scaling of SCC Appendix 6.8 shows the effect of filler content on the salt frost scaling of SCC. No significant difference of salt frost scaling existed due to the filler content (z = 1.9 < 2). 6.2.5 Effect of the pouring pressure on the salt frost scaling of SCC Appendix 6.9 shows the effect of pouring pressure on the salt frost scaling of SCC. No significant difference of salt frost scaling existed due to the pouring pressure up to 5.5 m (z = 0.8 < 2).
0,0
0,5
1,0
1,5
4 5 6 7 8Air content (%)
Salt
fros
t sca
ling
afte
r 112
cy
cles
(kg/
m²)
28 days 90 days
Figure 6.5 – Salt frost scaling of all concretes in series 3 versus air content.
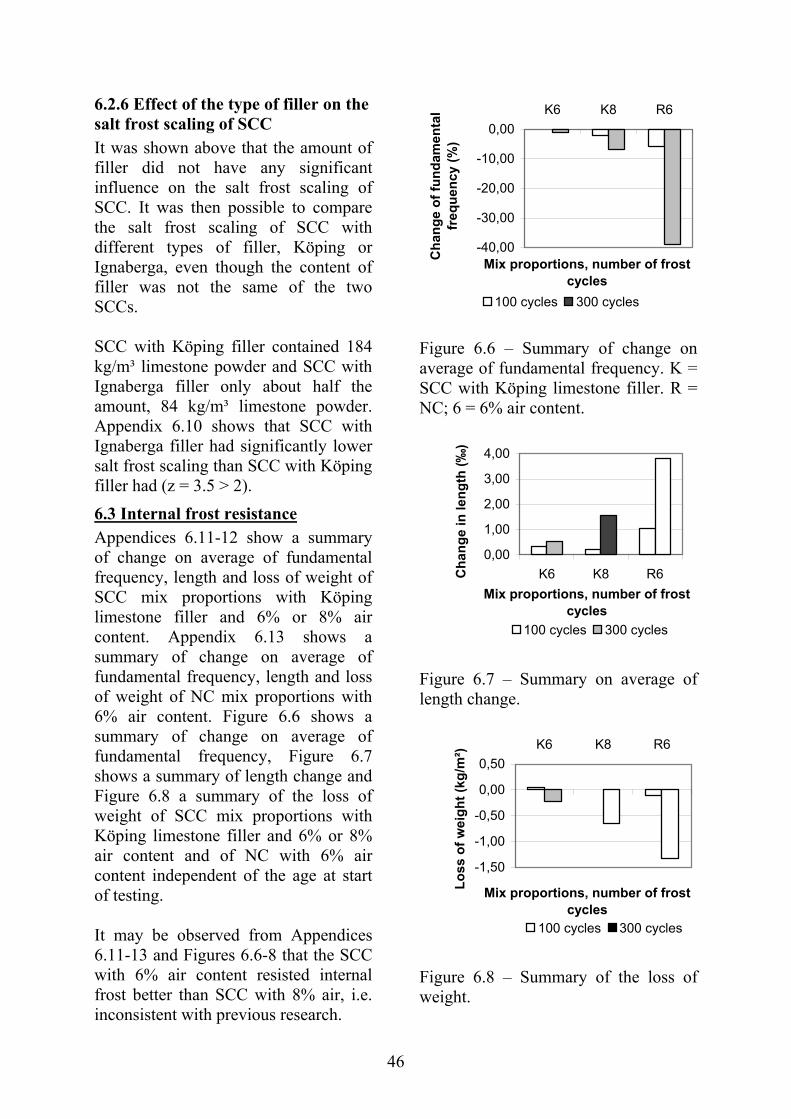
46
6.2.6 Effect of the type of filler on the salt frost scaling of SCC It was shown above that the amount of filler did not have any significant influence on the salt frost scaling of SCC. It was then possible to compare the salt frost scaling of SCC with different types of filler, Köping or Ignaberga, even though the content of filler was not the same of the two SCCs. SCC with Köping filler contained 184 kg/m³ limestone powder and SCC with Ignaberga filler only about half the amount, 84 kg/m³ limestone powder. Appendix 6.10 shows that SCC with Ignaberga filler had significantly lower salt frost scaling than SCC with Köping filler had (z = 3.5 > 2). 6.3 Internal frost resistance Appendices 6.11-12 show a summary of change on average of fundamental frequency, length and loss of weight of SCC mix proportions with Köping limestone filler and 6% or 8% air content. Appendix 6.13 shows a summary of change on average of fundamental frequency, length and loss of weight of NC mix proportions with 6% air content. Figure 6.6 shows a summary of change on average of fundamental frequency, Figure 6.7 shows a summary of length change and Figure 6.8 a summary of the loss of weight of SCC mix proportions with Köping limestone filler and 6% or 8% air content and of NC with 6% air content independent of the age at start of testing. It may be observed from Appendices 6.11-13 and Figures 6.6-8 that the SCC with 6% air content resisted internal frost better than SCC with 8% air, i.e. inconsistent with previous research.
-40,00
-30,00
-20,00
-10,00
0,00K6 K8 R6
Mix proportions, number of frost cycles
Cha
nge
of fu
ndam
enta
l fr
eque
ncy
(%)
100 cycles 300 cycles
Figure 6.6 – Summary of change on average of fundamental frequency. K = SCC with Köping limestone filler. R = NC; 6 = 6% air content.
0,00
1,00
2,00
3,00
4,00
K6 K8 R6Mix proportions, number of frost
cycles
Cha
nge
in le
ngth
(‰)
100 cycles 300 cycles
Figure 6.7 – Summary on average of length change.
-1,50
-1,00
-0,50
0,00
0,50K6 K8 R6
Mix proportions, number of frost cycles
Loss
of w
eigh
t (kg
/m²)
100 cycles 300 cycles
Figure 6.8 – Summary of the loss of weight.
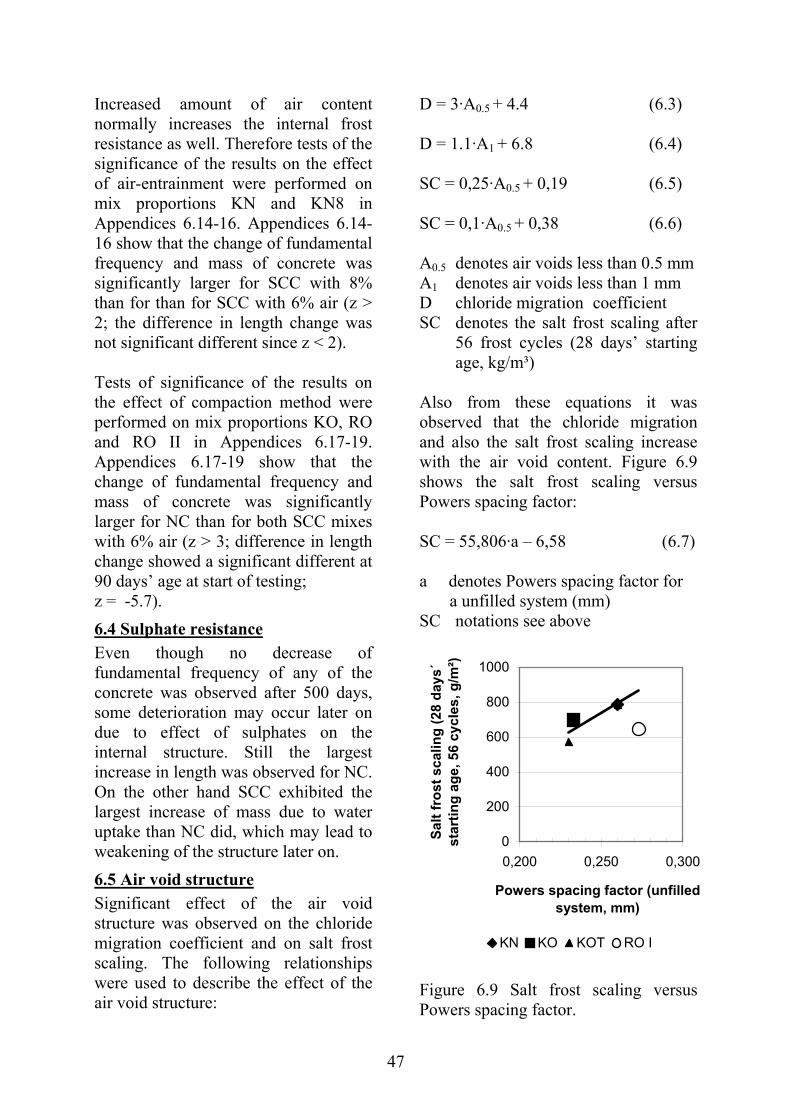
47
Increased amount of air content normally increases the internal frost resistance as well. Therefore tests of the significance of the results on the effect of air-entrainment were performed on mix proportions KN and KN8 in Appendices 6.14-16. Appendices 6.14-16 show that the change of fundamental frequency and mass of concrete was significantly larger for SCC with 8% than for than for SCC with 6% air (z > 2; the difference in length change was not significant different since z < 2). Tests of significance of the results on the effect of compaction method were performed on mix proportions KO, RO and RO II in Appendices 6.17-19. Appendices 6.17-19 show that the change of fundamental frequency and mass of concrete was significantly larger for NC than for both SCC mixes with 6% air (z > 3; difference in length change showed a significant different at 90 days’ age at start of testing; z = -5.7). 6.4 Sulphate resistance Even though no decrease of fundamental frequency of any of the concrete was observed after 500 days, some deterioration may occur later on due to effect of sulphates on the internal structure. Still the largest increase in length was observed for NC. On the other hand SCC exhibited the largest increase of mass due to water uptake than NC did, which may lead to weakening of the structure later on. 6.5 Air void structure Significant effect of the air void structure was observed on the chloride migration coefficient and on salt frost scaling. The following relationships were used to describe the effect of the air void structure:
D = 3·A0.5 + 4.4 (6.3) D = 1.1·A1 + 6.8 (6.4) SC = 0,25·A0.5 + 0,19 (6.5) SC = 0,1·A0.5 + 0,38 (6.6) A0.5 denotes air voids less than 0.5 mm A1 denotes air voids less than 1 mm D chloride migration coefficient SC denotes the salt frost scaling after
56 frost cycles (28 days’ starting age, kg/m³)
Also from these equations it was observed that the chloride migration and also the salt frost scaling increase with the air void content. Figure 6.9 shows the salt frost scaling versus Powers spacing factor: SC = 55,806·a – 6,58 (6.7) a denotes Powers spacing factor for a unfilled system (mm) SC notations see above
0
200
400
600
800
1000
0,200 0,250 0,300
Powers spacing factor (unfilled system, mm)
Salt
fros
t sca
ling
(28
days
´ st
artin
g ag
e, 5
6 cy
cles
, g/m
²)
KN KO KOT RO I
Figure 6.9 Salt frost scaling versus Powers spacing factor.
48
7. CONCLUSIONS AND RECOMMENDATIONS The following conclusions were drawn and recommendations given: Mechanical properties 1. Limestone filler additives increased
the strength substantially even though the cement content was somewhat lower in SCC than in NC.
2. Probably a more efficient packing of the particles was the reason for the enlarged strength of SCC.
3. Creep and shrinkage performed in the same way in NC as in SCC.
Chloride migration coefficient 1. The chloride migration coefficient
was some 60% larger in SCC with limestone filler than in NC.
2. In SCC with 5% silica fume and 12% fly ash the chloride migration coefficient was 60% of that in NC.
3. At 90 days’ age of testing the chloride migration coefficient was 60% of that at 28 days’ age
4. The efficiency factor of silica fume compared to Portland cement with regard to the chloride migration coefficient seems to be around 1.6.
5. The efficiency factor of blast furnace slag seems to be 1.
6. The efficiency factor of fly ash compared to Portland cement with regard to the chloride migration coefficient seems to be around 0.2.
7. Self-desiccation probably played a vital roll to explain the low value of the chloride migration coefficient in concrete with low w/c.
Salt frost scaling 1. No difference was found between
salt frost scaling of SCC and NC.
2. Larger salt frost scaling for SCC than for NC was found at 28 days’ starting age only.
3. The salt frost scaling increased in SCC with blast furnace slag compared with NC without slag.
4. Less salt frost scaling was found for SCC with 12% fly ash and 5% silica fume than for NC without additives.
5. The mixing order had no influence on the salt frost scaling of SCC.
6. Increased air content decreased the salt frost scaling for SCC as well.
7. Salt frost scaling for SCC decreased with age at start of testing.
8. The amount of filler did not affect the salt frost scaling of SCC.
9. Pouring pressure up to 5.5 m did not affect the salt frost scaling of SCC.
10. Less salt frost scaling was observed of SCC with Ignaberga limestone powder than of SCC with Köping limestone powder.
Internal frost resistance 1. The decrease of fundamental
frequency and of mass of concrete was significantly larger for NC than for SCC.
2. SCC with 6% air content resisted internal frost better than SCC with 8% air did, which is inconsistent with previous research.
Sulphate resistance 1. No decrease of fundamental
frequency (elastic modulus) or mass of any concrete was observed even after 500 days, whether the concrete was subjected to distilled water, sea water or sodium sulphate, 18 g/kg in distilled water.
2. The largest increase in length due to curing to distilled water, seawater or sodium sulphate, 18 g/kg in distilled water was observed for NC.
49
3. SCC exhibited larger increase of mass due to water uptake after curing in distilled water, seawater or sodium sulphate, than NC did.
Recommendations 1. It is recommended to use the same
amount of cement in SCC with limestone filler as in NC in order to maintain the same chloride migration coefficient in SCC as in NC.
2. A way to lower the chloride migration coefficient is to use 5% silica fume in SCC but in that case the salt frost resistance must be confirmed by measurements.
3. The salt frost resistance is maintained in SCC if the air content is held on the same level as in NC.
4. No effect of the mix proportions of SCC with limestone filler on the internal frost resistance after 300 cycles or on the sulphate resistance after 450 days was observed.
50
REFERENCES 1. M. Nilsson, Ö. Petersson. The First
Bridge Made of Self-compacting Concrete. Väg- och Vattenbyggaren 2/98 (1998) 28-31.
2. L. Söderlind. Full-scale Tests of Self-compacting Concrete for Dwelling Houses. RILEM Symposium on Self Compacting Concrete. Ed.: Skarendahl and Petersson (1999) 723-728.
3. B. Persson. Mix Proportions and Strength of Self-compacting Concrete for Production of High Strength Poles, Piles and Pillars. Contribution to “1. Münchener Baustoffseminar Selbstverdicht-ender Beton” 9 Oktober 2001. Ed.: Peter Schiessl (2001) 31-39.
4. CTH Rapid Test for Determination of the Chloride Migration Coefficient, D, in Concrete. NT BUILD 492 (2000).
5. L. Tang, L.-O. Nilsson, Modelling of chloride penetration into concrete – Tracing five years’ field exposure. Concrete Science Engineering. 2 (2000) 170-175.
6. B. Johannesson. Transport and Sorption Phenomena in Concrete and Other Porous Media. TVBM-1019. LTH Byggnadsmaterial. Lund (2000) 491 pp.
7. AASHTO T 271-831. Rapid Determination of Chloride Permeability of Concrete.
8. M. Geiker, N. Thaulow, P. J. Andersen, Assessment of Rapid Test of Concrete Permeability Test of Concrete with and without Mineral Admixtures. Durability of Concrete and Components. Brighton. Chapman & Hall (1990) 52-61.
9. B. Persson. A Background for the Choice of Mix Design of the Concrete for the Great Belt Link. Report U91.02 Div. Building Materials (1991) 102 pp.
10. D. Boubitsas, K. Paulou. Self Compacting Concrete for Marine Environment. TVBM-5048. Lund Institute of Technology. Lund University. Lund (2000) 55 pp.
11. Lindvall, L.-O. Nilsson. Studies on the Effect of Secondary Cementitious Materials on Chloride Ingress. Nordic Seminar on Durability of Exposed Concrete Containing Secondary Cementitious Materials. Hirtshals. Ed.: D. Bager (2001) 18 pp.
12. L. Tang. Chloride Penetration Profiles and Diffusivity in Concrete under Different Exposure Conditions. Report E-97:3. Building Materials. Chalmers University of Technology. Gothenburg (1997).
13. M. T. Jepsen, D. Mathiesen, C. Munch-Petersen, D. Bager. Durability of Resource Saving “Green” Types of Concrete. Durability of Exposed Concrete Containing Secondary Cementitious Materials. Hirtshals. Ed.: D. Bager (2001) 10 pp.
14. N. Buenfeld. Personal information. Imperial College. London (2001).
15. Persson. Moisture in Concrete Subjected to Different Kinds of Curing. Materials and Structures 30 (1997) 533-544.
16. Persson. Self-desiccation and Its Importance in Concrete Technology. Nordic Concrete Research 20 (1998) 120-129.
17. B. Persson. Shrinkage of High Performance Concrete. Proceedings of an International RILEM Conference on Early Age Cracking
51
in Concrete. Haifa. 2001. Ed. by A Bentur (2001) 301-311.
18. T.G. Powers, T.L. Brownyard. Studies of the Physical Properties of Hardened Portland Cement Paste. PCA 22 (1948) 473-488, 845-864.
19. L.-O. Nilsson, G. Hedenblad, K. Norling-Mjörnell. Suction after Long Time, HPC Handbook, Svensk Byggtjänst. 2000, 209-226.
20. B. Persson. Seven-year Study of the Effect of Silica Fume. ABCM 7 (1998) 139-155.
21. E. Stoltzer, B. Buhr, S. Engelund. The Faroe Bridges – Chloride Penetration Rate Estimated on a Basis of Measurements from 1988 to 1997. Durability of Exposed Concrete Containing Secondary Cementitious Materials. Hirtshals. Ed.: D. Bager (2001) 19 pp.
22. R. Castel, G. Francois, A. Arliguie. Clarification of Corrosion of Reinforcement in Concrete Structures Exposed to Chloride Environment. Contribution at the fib Meeting and Nordic Mini Seminar. Gothenbourg (2001) 10 pp.
23. M. Collepardi et al. The Kinetics of Chloride Ions Penetration in Concrete. Il Cemento. 67 (1970) 157-164.
24. K. Tuutti. Corrosion of Steel in Concrete. Report 4:82. CBI. Stockholm (1982).
25. L. Tang, L.-O. Nilsson. Rapid Determination of Chloride Diffusitivity of Concrete by Applying an Electric Field. ACI Material Journal 49/1 (1992) 49-53.
26. M. Maage, S Helland, J. E. Carlsen. Chloride Penetration in HPC Exposed to Marine Environment. RILEM Workshop on Durability. Ed.: H. Sommer (1994) 194-207.
27. Poulsen. Prediction Models. STAR 53. Danish Road Direct. Ed. L.-O. Nilsson (1996).
28. M. T. Jepsen. Predicting Concrete Durability by Using Artificial Neural Network. Nordic Seminar on Durability of Exposed Concrete Containing Secondary Cementitious Materials. Hirtshals. Ed.: D. Bager (2001) 11 pp.
29. P. Rougeau, J. L Maillard, C. Mary-Dippe. Comparative Study on Properties of Self Compacting Concrete and HPC Concrete Used in Precast Construction. RILEM Symposium on Self Compacting Concrete. Stockholm. Ed.: Skarendahl and Petersson (1999) 251-261.
30. D. Bager. Aalborg Portland’s Durability Project – 18-year judgement. Durability of Exposed Concrete Containing Secondary Cementitious Materials. Hirtshals. Ed.: D. Bager (2001) 30 pp.
31. Peter Utgennant, Per-Erik Petersson. Frost Resistance of Concrete Containing Secondary Cementitious Materials – Experience from Three Field Exposure Sites. Durability of Exposed Concrete Containing Secondary Cementitious Materials. Ed.: D. Bager (2001) 17 pp.
32. M. Friebert. Durability of High Performance Concrete Containing Fly Ash and Silica Fume. Durability of Exposed Concrete Containing Secondary Cementitious Materials. Ed.: D. Bager (2001) 11 pp.
33. R. Auberg. Zuverlässige Prüfung des Frost und Frost-Tausalz. Widerstands von Beton mit dem CDF und CIF Test. University of Essen (1998)
34. Effect of Self-desiccation on Internal Frost Resistance of
52
Concrete. Self-Desiccation and Its Importance in Concrete Technology. Ed.: B. Persson, G. Fagerlund. TVBM-3075. Lund University. Lund (1997) 227-238.
35. W. Kaempfer, M. Berndt. Estimation of Service Life of Concrete Pipes in Sewer Networks. Durability of Building Materials and Components 1 (1999) 36-45.
36. Ö. Pettersson. Dispersion and Frost Resistance. Investigation of Four Types of Limestone Filler for Self Compacting Concrete. Report 2000-27. Cement and Concrete Research Institute. Stockholm (2000) 14 pp.
37. S. Lindmark. Mechanisms of Salt Frost Scaling of Portland Cement-bound Materials: Studies and Hypotheses. TVBM-1017. Lund University (1998) 266 pp.
38. K. Moir. Sulphate Resistance Test Method. TG 1. CEN/TC51/WG 12. Düsseldorf. (2000) 13 pp.
39. B. Persson. Deformations of House Construction Concrete – Effect of Production Methods on Elastic Modulus, Creep and Shrinkage. TVBM-3088 Lund University. Lund (1999) 71 pp.
40. B. Persson. A Comparison between Deformations of Self Compacting Concrete and Corresponding Properties of Normal Concrete. Cement and Concrete Research 31 (2001) 193-198.
41. E. Prost, G. Pons. Macroscopic and Microscopic Behavior of Self-compacting Concrete Creep and Shrinkage. Creep, Shrinkage and Durability Mechanics of Concrete and Other Quasi-Brittle Materials. Ed.: F.-J. Ulm; Z. P. Bažant,
Elsevier Science Ltd (2001) 569-574.
42. A.-M. Poppe; G. de Schütter, Creep and Shrinkage of Self-compacting Concrete. Creep, Shrinkage and Durability Mechanics of Concrete and Other Quasi-Brittle Materials. Ed.: F.-J. Ulm; Z. P. Bažant, Elsevier Science Ltd (2001) 563-568.
43. B. Persson. Long-term Shrinkage of High Performance Concrete. 10th Congress on the Chemistry of Cement. 2ii073. Gothenburg (1997) Ed.: Justnes, H., 9 pp.
44. B. Persson. Shrinkage of High Performance Concrete. Proc. RILEM Conference on Early Age Cracking in Concrete. Haifa. 2001. Ed. by A Bentur (2001) 301-311.
45. B. Persson. Long-term Effect of Silica Fume on the Principal Properties of Low-Temperature-Cured Ceramic. Cement and Concrete Research 27 (1997) 1667-1680.
46. B. Persson. B., Pozzolanic Interaction between Portland Cement and Silica Fume in Concrete. Sixth CANMET/ACI Int. Conference. Bangkok (1998) 631-660.
47. B. Persson. Chloride Diffusion Coefficient and Salt Frost Scaling of Self-Compacting Concrete and of Normal Concrete. Nordic Seminar and fib Meeting. Chalmers University of Technology. Gothenburg. Ed. by L.-O Nilsson (2001) 13 pp.
48. A.M. Neville, J. J. Brooks. Concrete Technology. Longman Singapore Publ (1987) 101.

53
APPENDICES

54
APPENDIX 1
Appendix 1.1 – Highway bridge made of Self-compacting Concrete
Appendix 1.1 – Stäket Tunnel made of Self-compacting Concrete
Appendix 1.3 – A pile cap made of Self-compacting Concrete, 60 mm in thickness [3].
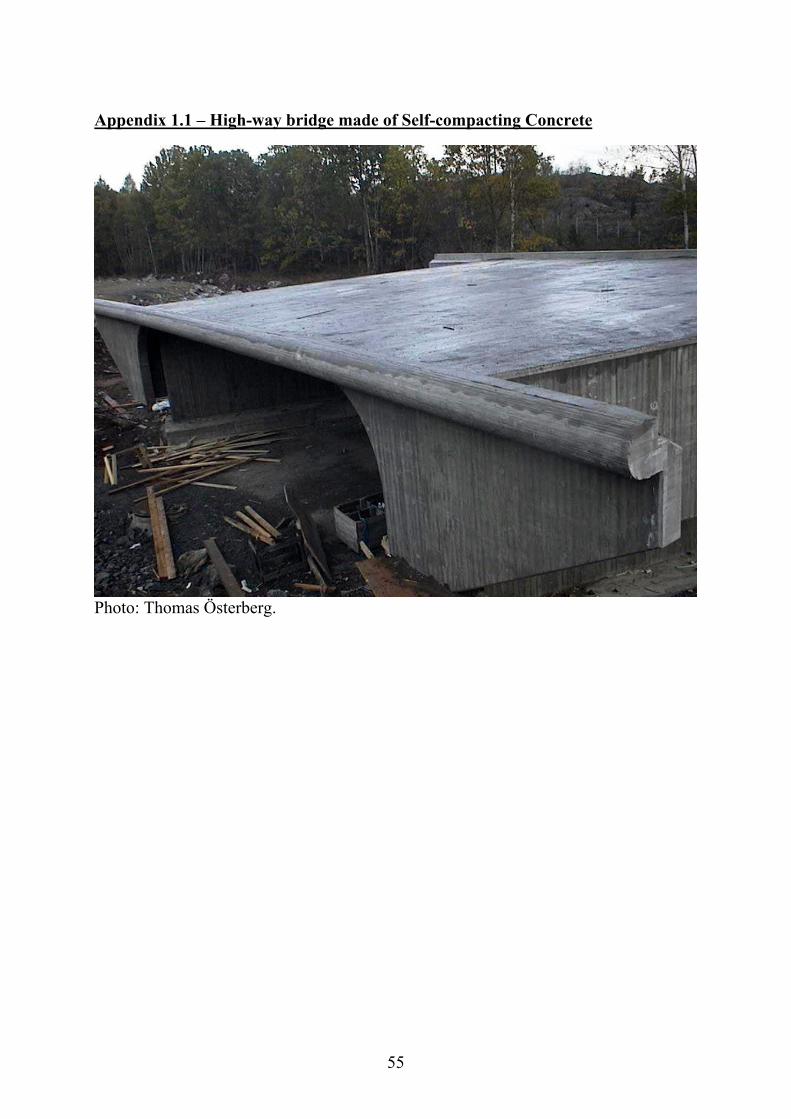
55
Appendix 1.1 – High-way bridge made of Self-compacting Concrete
Photo: Thomas Österberg.
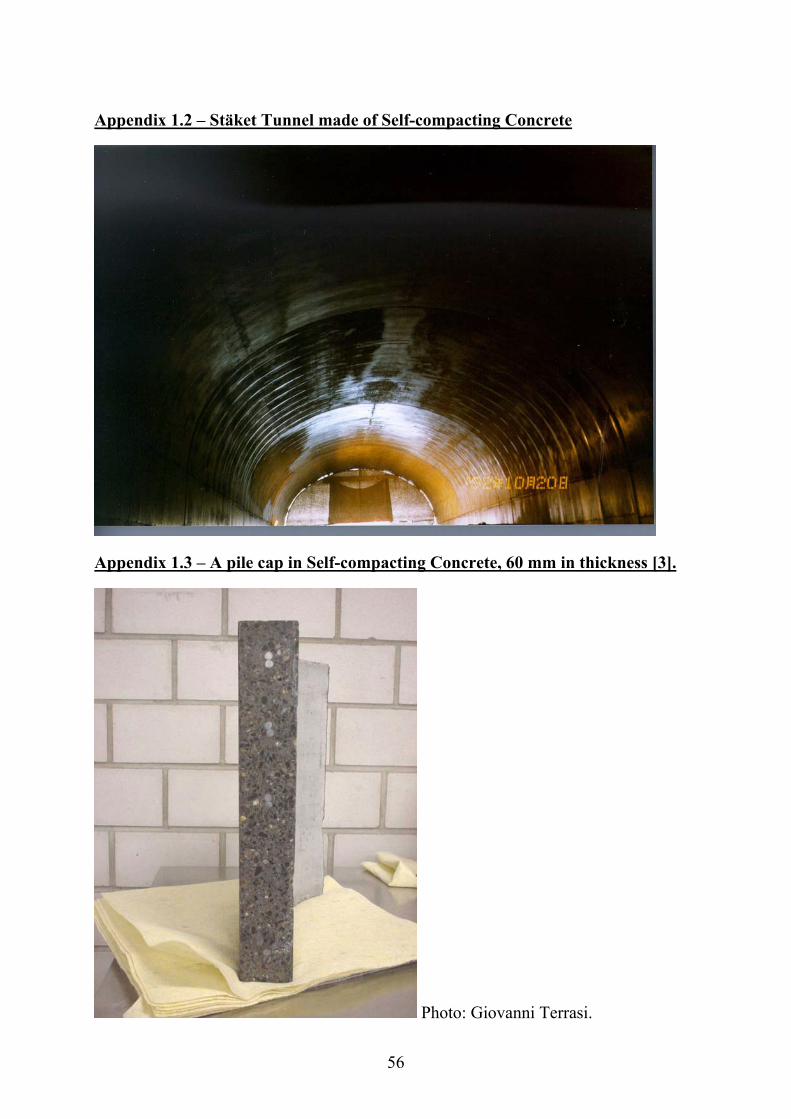
56
Appendix 1.2 – Stäket Tunnel made of Self-compacting Concrete
Appendix 1.3 – A pile cap in Self-compacting Concrete, 60 mm in thickness [3].
Photo: Giovanni Terrasi.
57
APPENDIX 2
Appendix 2.1 – Chemical composition and physical properties of cements (%). Appendix 2.2 – Summary of mix composition (kg/m³) and strength of concrete (series 1) (MPa). Appendix 2.3 – Mix composition (kg/m³ dry); strength of concrete series 1 (MPa) Appendix 2.4 – Chloride migration coefficient, D, for normal (NC) and self-compacting (SCC) concrete series 1 (x1012 m2/s) Appendix 2.5 – Mix composition and chloride migration coefficient, D of NCs [5]. Appendix 2.6 – Mix composition NC mixes tested for use on Great Belt Link [8]. Appendix 2.7 – Mix composition and chloride migration coefficient of SCCs series 2 [10]. Appendix 2.8 – Mix composition and frost resistance of NC and SCC [24].
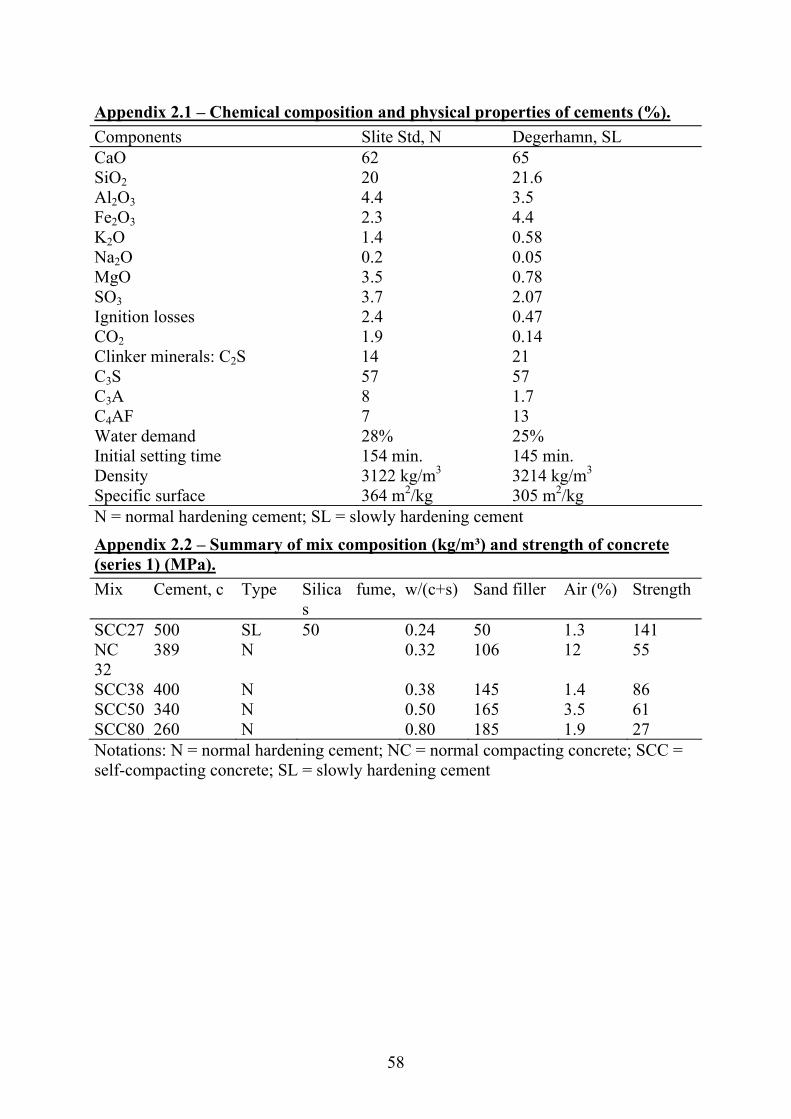
58
Appendix 2.1 – Chemical composition and physical properties of cements (%). Components Slite Std, N Degerhamn, SL CaO 62 65 SiO2 20 21.6 Al2O3 4.4 3.5 Fe2O3 2.3 4.4 K2O 1.4 0.58 Na2O 0.2 0.05 MgO 3.5 0.78 SO3 3.7 2.07 Ignition losses 2.4 0.47 CO2 1.9 0.14 Clinker minerals: C2S 14 21 C3S 57 57 C3A 8 1.7 C4AF 7 13 Water demand 28% 25% Initial setting time 154 min. 145 min. Density 3122 kg/m3 3214 kg/m3 Specific surface 364 m2/kg 305 m2/kg N = normal hardening cement; SL = slowly hardening cement Appendix 2.2 – Summary of mix composition (kg/m³) and strength of concrete (series 1) (MPa). Mix Cement, c Type Silica fume,
s w/(c+s) Sand filler Air (%) Strength
SCC27 500 SL 50 0.24 50 1.3 141 NC 32
389 N 0.32 106 12 55
SCC38 400 N 0.38 145 1.4 86 SCC50 340 N 0.50 165 3.5 61 SCC80 260 N 0.80 185 1.9 27 Notations: N = normal hardening cement; NC = normal compacting concrete; SCC = self-compacting concrete; SL = slowly hardening cement
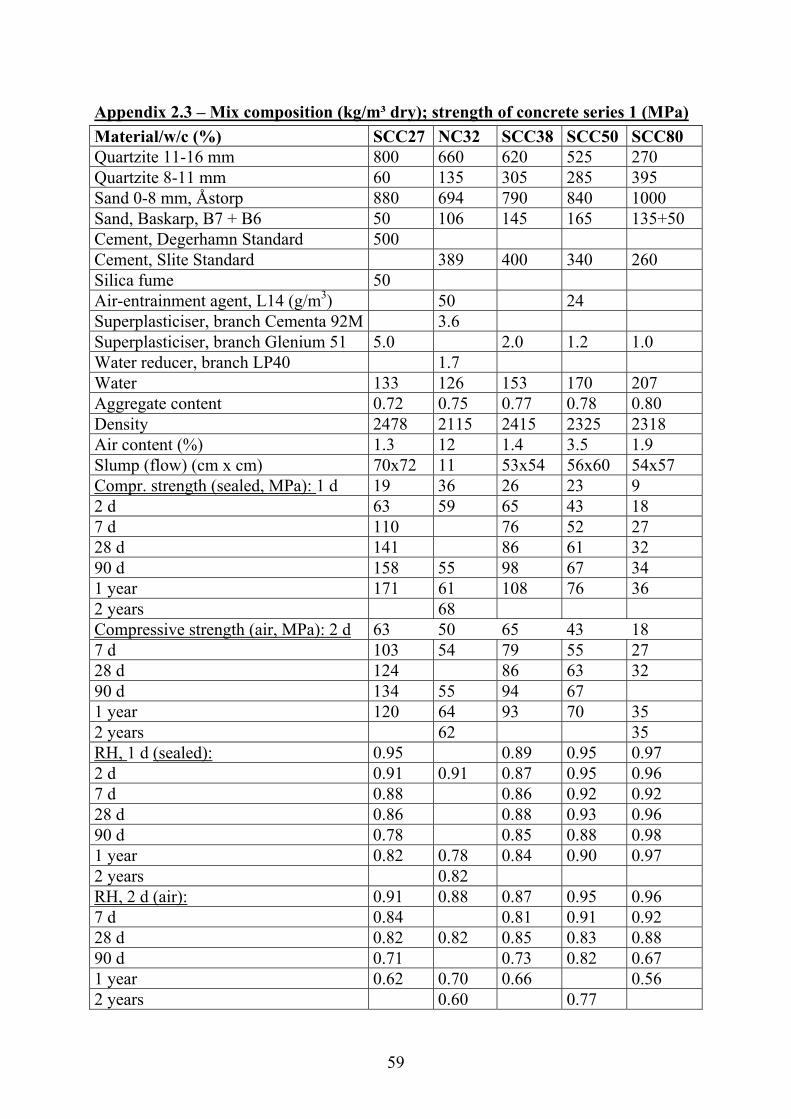
59
Appendix 2.3 – Mix composition (kg/m³ dry); strength of concrete series 1 (MPa) Material/w/c (%) SCC27 NC32 SCC38 SCC50 SCC80 Quartzite 11-16 mm 800 660 620 525 270 Quartzite 8-11 mm 60 135 305 285 395 Sand 0-8 mm, Åstorp 880 694 790 840 1000 Sand, Baskarp, B7 + B6 50 106 145 165 135+50 Cement, Degerhamn Standard 500 Cement, Slite Standard 389 400 340 260 Silica fume 50 Air-entrainment agent, L14 (g/m3) 50 24 Superplasticiser, branch Cementa 92M 3.6 Superplasticiser, branch Glenium 51 5.0 2.0 1.2 1.0 Water reducer, branch LP40 1.7 Water 133 126 153 170 207 Aggregate content 0.72 0.75 0.77 0.78 0.80 Density 2478 2115 2415 2325 2318 Air content (%) 1.3 12 1.4 3.5 1.9 Slump (flow) (cm x cm) 70x72 11 53x54 56x60 54x57 Compr. strength (sealed, MPa): 1 d 19 36 26 23 9 2 d 63 59 65 43 18 7 d 110 76 52 27 28 d 141 86 61 32 90 d 158 55 98 67 34 1 year 171 61 108 76 36 2 years 68 Compressive strength (air, MPa): 2 d 63 50 65 43 18 7 d 103 54 79 55 27 28 d 124 86 63 32 90 d 134 55 94 67 1 year 120 64 93 70 35 2 years 62 35 RH, 1 d (sealed): 0.95 0.89 0.95 0.97 2 d 0.91 0.91 0.87 0.95 0.96 7 d 0.88 0.86 0.92 0.92 28 d 0.86 0.88 0.93 0.96 90 d 0.78 0.85 0.88 0.98 1 year 0.82 0.78 0.84 0.90 0.97 2 years 0.82 RH, 2 d (air): 0.91 0.88 0.87 0.95 0.96 7 d 0.84 0.81 0.91 0.92 28 d 0.82 0.82 0.85 0.83 0.88 90 d 0.71 0.73 0.82 0.67 1 year 0.62 0.70 0.66 0.56 2 years 0.60 0.77
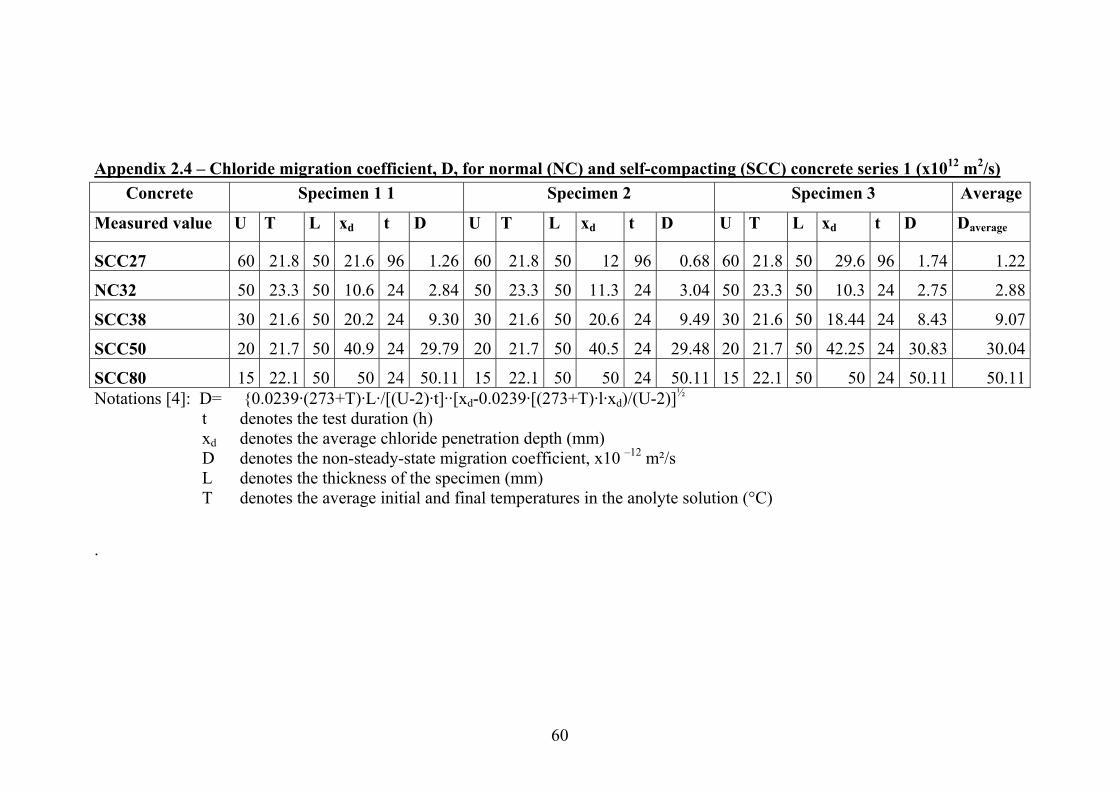
60
Appendix 2.4 – Chloride migration coefficient, D, for normal (NC) and self-compacting (SCC) concrete series 1 (x1012 m2/s)
Concrete Specimen 1 1 Specimen 2 Specimen 3 Average
Measured value U T L xd t D U T L xd t D U T L xd t D Daverage
SCC27 60 21.8 50 21.6 96 1.26 60 21.8 50 12 96 0.68 60 21.8 50 29.6 96 1.74 1.22
NC32 50 23.3 50 10.6 24 2.84 50 23.3 50 11.3 24 3.04 50 23.3 50 10.3 24 2.75 2.88
SCC38 30 21.6 50 20.2 24 9.30 30 21.6 50 20.6 24 9.49 30 21.6 50 18.44 24 8.43 9.07
SCC50 20 21.7 50 40.9 24 29.79 20 21.7 50 40.5 24 29.48 20 21.7 50 42.25 24 30.83 30.04
SCC80 15 22.1 50 50 24 50.11 15 22.1 50 50 24 50.11 15 22.1 50 50 24 50.11 50.11 Notations [4]: D= {0.0239·(273+T)·L·/[(U-2)·t]··[xd-0.0239·[(273+T)·l·xd)/(U-2)]½
t denotes the test duration (h) xd denotes the average chloride penetration depth (mm) D denotes the non-steady-state migration coefficient, x10 –12 m²/s L denotes the thickness of the specimen (mm) T denotes the average initial and final temperatures in the anolyte solution (°C)
.
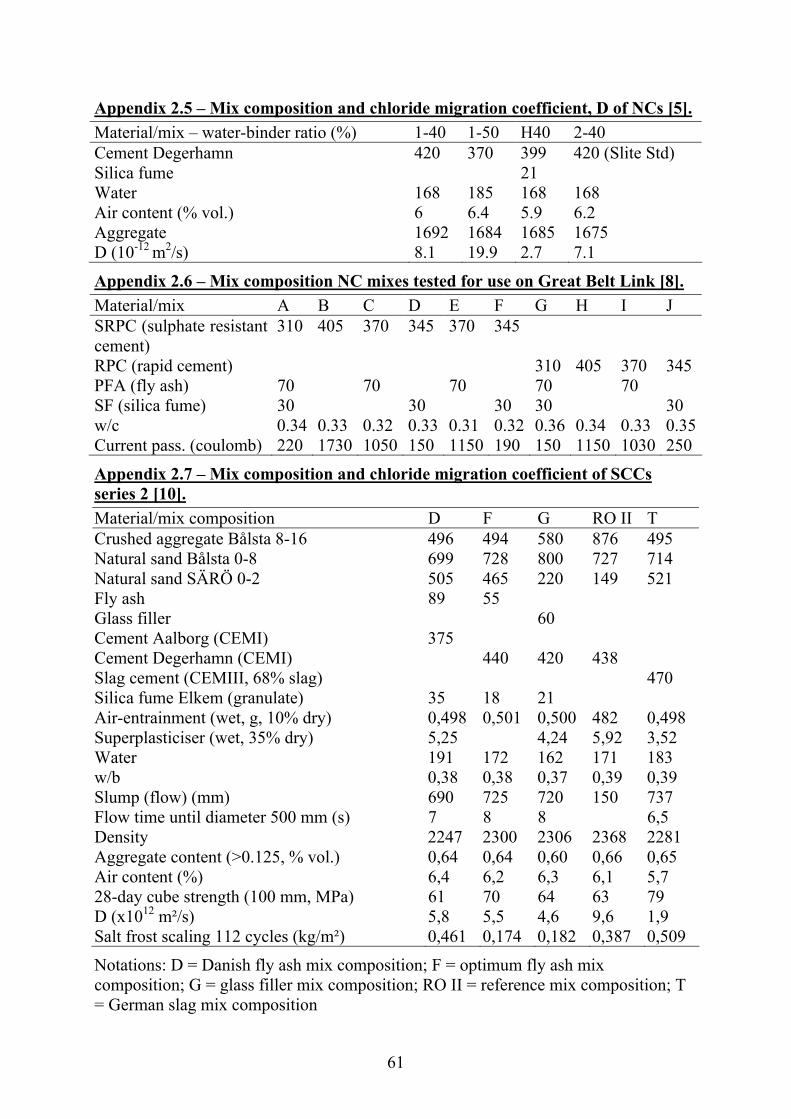
61
Appendix 2.5 – Mix composition and chloride migration coefficient, D of NCs [5]. Material/mix – water-binder ratio (%) 1-40 1-50 H40 2-40 Cement Degerhamn 420 370 399 420 (Slite Std) Silica fume 21 Water 168 185 168 168 Air content (% vol.) 6 6.4 5.9 6.2 Aggregate 1692 1684 1685 1675 D (10-12 m2/s) 8.1 19.9 2.7 7.1
Appendix 2.6 – Mix composition NC mixes tested for use on Great Belt Link [8]. Material/mix A B C D E F G H I J SRPC (sulphate resistant cement)
310 405 370 345 370 345
RPC (rapid cement) 310 405 370 345 PFA (fly ash) 70 70 70 70 70 SF (silica fume) 30 30 30 30 30 w/c 0.34 0.33 0.32 0.33 0.31 0.32 0.36 0.34 0.33 0.35Current pass. (coulomb) 220 1730 1050 150 1150 190 150 1150 1030 250
Appendix 2.7 – Mix composition and chloride migration coefficient of SCCs series 2 [10]. Material/mix composition D F G RO II T Crushed aggregate Bålsta 8-16 496 494 580 876 495 Natural sand Bålsta 0-8 699 728 800 727 714 Natural sand SÄRÖ 0-2 505 465 220 149 521 Fly ash 89 55 Glass filler 60 Cement Aalborg (CEMI) 375 Cement Degerhamn (CEMI) 440 420 438 Slag cement (CEMIII, 68% slag) 470 Silica fume Elkem (granulate) 35 18 21 Air-entrainment (wet, g, 10% dry) 0,498 0,501 0,500 482 0,498 Superplasticiser (wet, 35% dry) 5,25 4,24 5,92 3,52 Water 191 172 162 171 183 w/b 0,38 0,38 0,37 0,39 0,39 Slump (flow) (mm) 690 725 720 150 737 Flow time until diameter 500 mm (s) 7 8 8 6,5 Density 2247 2300 2306 2368 2281 Aggregate content (>0.125, % vol.) 0,64 0,64 0,60 0,66 0,65 Air content (%) 6,4 6,2 6,3 6,1 5,7 28-day cube strength (100 mm, MPa) 61 70 64 63 79 D (x1012 m²/s) 5,8 5,5 4,6 9,6 1,9 Salt frost scaling 112 cycles (kg/m²) 0,461 0,174 0,182 0,387 0,509
Notations: D = Danish fly ash mix composition; F = optimum fly ash mix composition; G = glass filler mix composition; RO II = reference mix composition; T = German slag mix composition
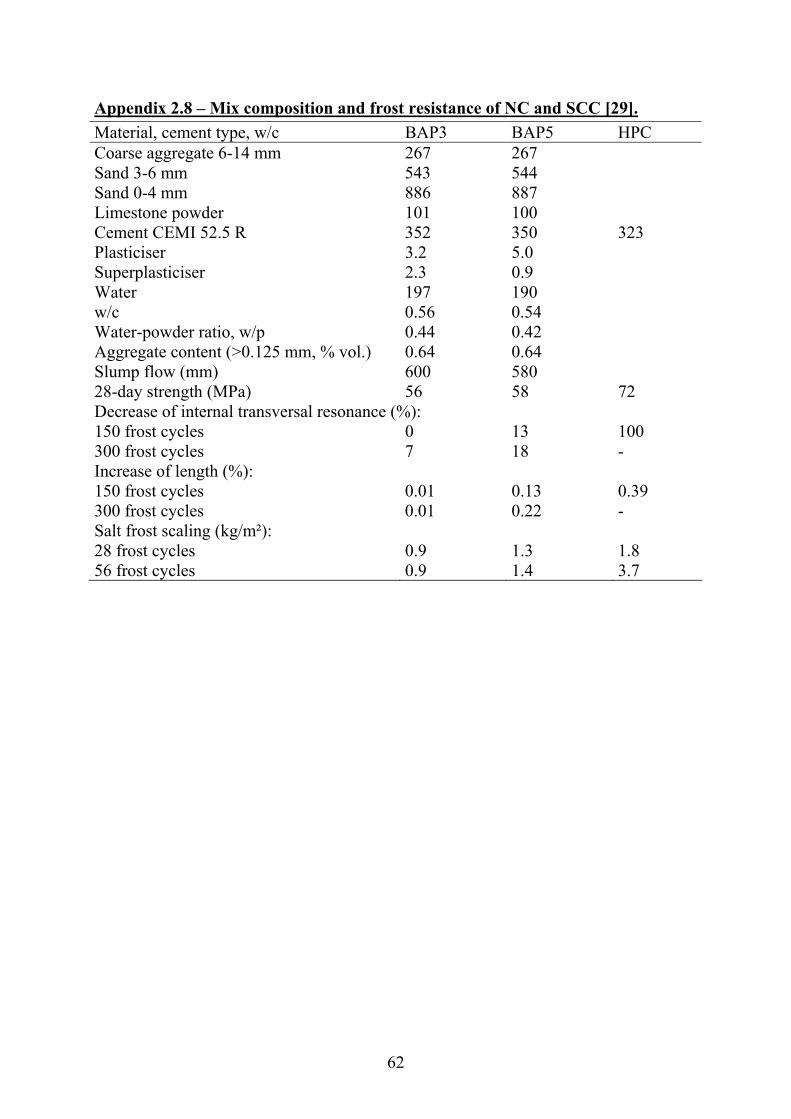
62
Appendix 2.8 – Mix composition and frost resistance of NC and SCC [29]. Material, cement type, w/c BAP3 BAP5 HPC Coarse aggregate 6-14 mm 267 267 Sand 3-6 mm 543 544 Sand 0-4 mm 886 887 Limestone powder 101 100 Cement CEMI 52.5 R 352 350 323 Plasticiser 3.2 5.0 Superplasticiser 2.3 0.9 Water 197 190 w/c 0.56 0.54 Water-powder ratio, w/p 0.44 0.42 Aggregate content (>0.125 mm, % vol.) 0.64 0.64 Slump flow (mm) 600 580 28-day strength (MPa) 56 58 72 Decrease of internal transversal resonance (%): 150 frost cycles 0 13 100 300 frost cycles 7 18 - Increase of length (%): 150 frost cycles 0.01 0.13 0.39 300 frost cycles 0.01 0.22 - Salt frost scaling (kg/m²): 28 frost cycles 0.9 1.3 1.8 56 frost cycles 0.9 1.4 3.7

63
APPENDIX 3
Appendix 3.1 – Mix composition and properties of NC and SCC in series 3. Appendix 3.2 – The determination of the chloride migration coefficient, D, in an apparatus developed by Tang [4]. Appendix 3.3 – Test voltage and duration for concrete with normal binder content during determination of the chloride migration coefficient, D, in an apparatus developed by Tang [4]. Appendix 3.4 – Two frost cycles daily varying between – 20 and 20 °C during the frost tests.
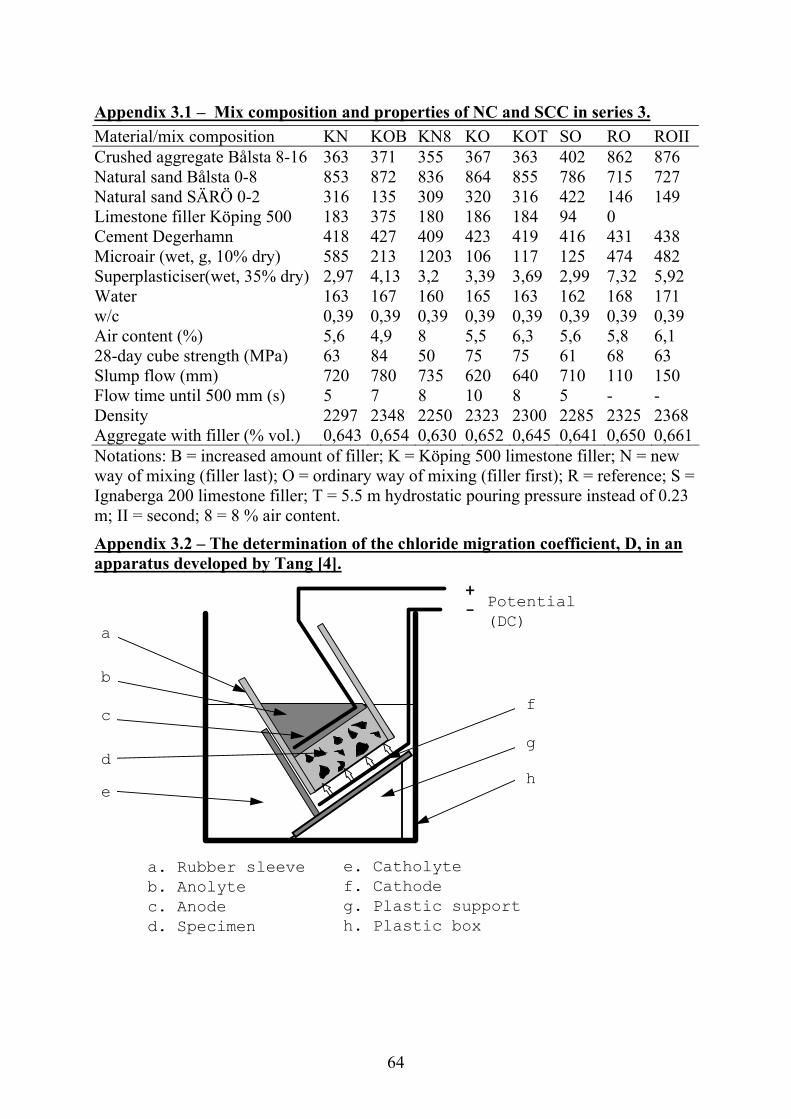
64
Appendix 3.1 – Mix composition and properties of NC and SCC in series 3. Material/mix composition KN KOB KN8 KO KOT SO RO ROII Crushed aggregate Bålsta 8-16 363 371 355 367 363 402 862 876 Natural sand Bålsta 0-8 853 872 836 864 855 786 715 727 Natural sand SÄRÖ 0-2 316 135 309 320 316 422 146 149 Limestone filler Köping 500 183 375 180 186 184 94 0 Cement Degerhamn 418 427 409 423 419 416 431 438 Microair (wet, g, 10% dry) 585 213 1203 106 117 125 474 482 Superplasticiser(wet, 35% dry) 2,97 4,13 3,2 3,39 3,69 2,99 7,32 5,92 Water 163 167 160 165 163 162 168 171 w/c 0,39 0,39 0,39 0,39 0,39 0,39 0,39 0,39 Air content (%) 5,6 4,9 8 5,5 6,3 5,6 5,8 6,1 28-day cube strength (MPa) 63 84 50 75 75 61 68 63 Slump flow (mm) 720 780 735 620 640 710 110 150 Flow time until 500 mm (s) 5 7 8 10 8 5 - - Density 2297 2348 2250 2323 2300 2285 2325 2368 Aggregate with filler (% vol.) 0,643 0,654 0,630 0,652 0,645 0,641 0,650 0,661Notations: B = increased amount of filler; K = Köping 500 limestone filler; N = new way of mixing (filler last); O = ordinary way of mixing (filler first); R = reference; S = Ignaberga 200 limestone filler; T = 5.5 m hydrostatic pouring pressure instead of 0.23 m; II = second; 8 = 8 % air content. Appendix 3.2 – The determination of the chloride migration coefficient, D, in an apparatus developed by Tang [4].
+- Potential
(DC)
a. Rubber sleeveb. Anolytec. Anoded. Specimen
e. Catholytef. Cathodeg. Plastic support h. Plastic box
a
b
c
de
f
g
h
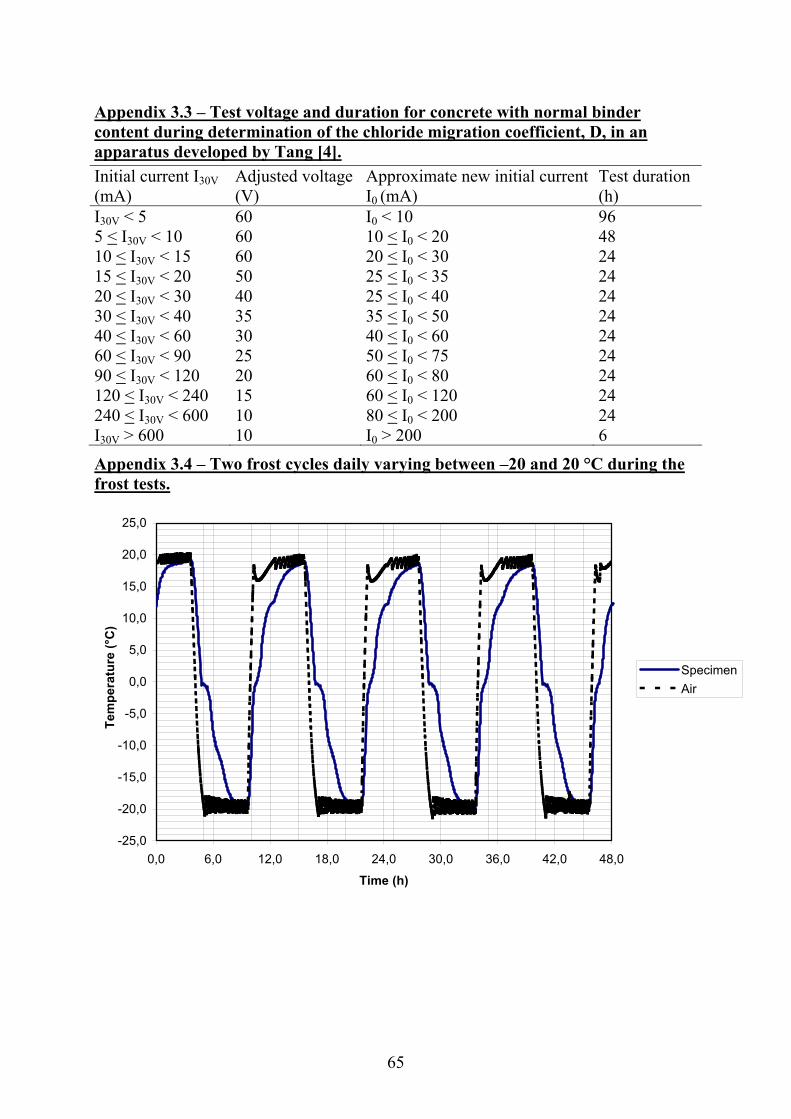
65
Appendix 3.3 – Test voltage and duration for concrete with normal binder content during determination of the chloride migration coefficient, D, in an apparatus developed by Tang [4]. Initial current I30V (mA)
Adjusted voltage (V)
Approximate new initial current I0 (mA)
Test duration (h)
I30V < 5 60 I0 < 10 96 5 < I30V < 10 60 10 < I0 < 20 48 10 < I30V < 15 60 20 < I0 < 30 24 15 < I30V < 20 50 25 < I0 < 35 24 20 < I30V < 30 40 25 < I0 < 40 24 30 < I30V < 40 35 35 < I0 < 50 24 40 < I30V < 60 30 40 < I0 < 60 24 60 < I30V < 90 25 50 < I0 < 75 24 90 < I30V < 120 20 60 < I0 < 80 24 120 < I30V < 240 15 60 < I0 < 120 24 240 < I30V < 600 10 80 < I0 < 200 24 I30V > 600 10 I0 > 200 6
Appendix 3.4 – Two frost cycles daily varying between –20 and 20 °C during the frost tests.
-25,0
-20,0
-15,0
-10,0
-5,0
0,0
5,0
10,0
15,0
20,0
25,0
0,0 6,0 12,0 18,0 24,0 30,0 36,0 42,0 48,0
Time (h)
Tem
pera
ture
(°C
)
SpecimenAir

66
APPENDIX 4
Appendix 4.1 – Strength development of concrete in series 3. Appendix 4.2 – Shrinkage of concrete in series 3 up to 1 day’s age Appendix 4.3 – Chloride migration coefficient, D, for concretes in series 3 (x1012 m2/s) Appendix 4.4 – Salt frost scaling for concrete in series 3 (g/sample)
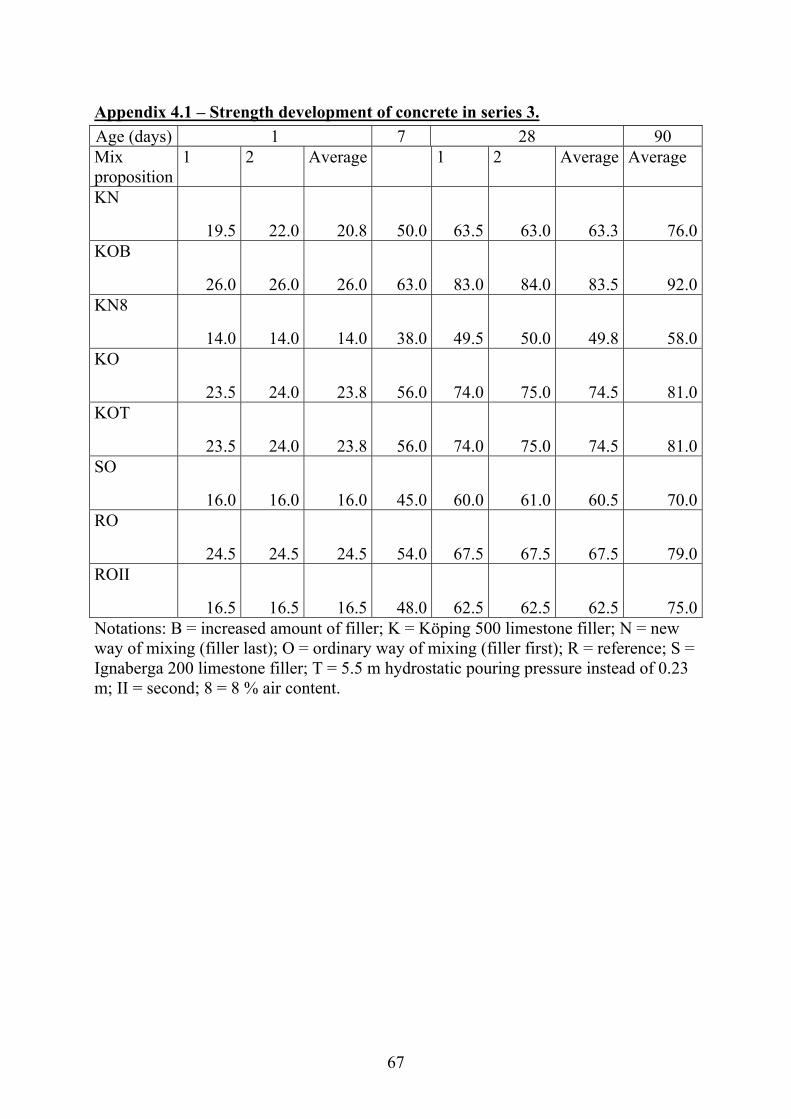
67
Appendix 4.1 – Strength development of concrete in series 3. Age (days) 1 7 28 90 Mix proposition
1 2 Average 1 2 Average Average
KN
19.5 22.0 20.8 50.0 63.5 63.0 63.3 76.0KOB
26.0 26.0 26.0 63.0 83.0 84.0 83.5 92.0KN8
14.0 14.0 14.0 38.0 49.5 50.0 49.8 58.0KO
23.5 24.0 23.8 56.0 74.0 75.0 74.5 81.0KOT
23.5 24.0 23.8 56.0 74.0 75.0 74.5 81.0SO
16.0 16.0 16.0 45.0 60.0 61.0 60.5 70.0RO
24.5 24.5 24.5 54.0 67.5 67.5 67.5 79.0ROII
16.5 16.5 16.5 48.0 62.5 62.5 62.5 75.0Notations: B = increased amount of filler; K = Köping 500 limestone filler; N = new way of mixing (filler last); O = ordinary way of mixing (filler first); R = reference; S = Ignaberga 200 limestone filler; T = 5.5 m hydrostatic pouring pressure instead of 0.23 m; II = second; 8 = 8 % air content.
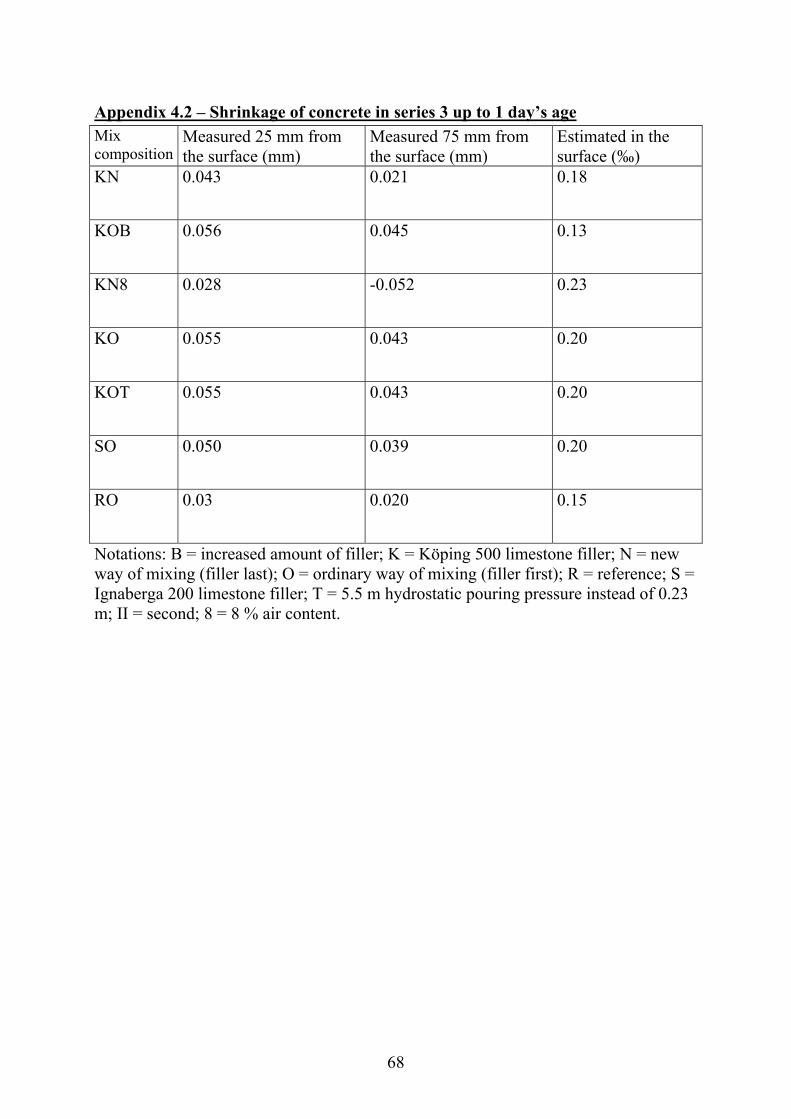
68
Appendix 4.2 – Shrinkage of concrete in series 3 up to 1 day’s age Mix composition
Measured 25 mm from the surface (mm)
Measured 75 mm from the surface (mm)
Estimated in the surface (‰)
KN 0.043 0.021 0.18
KOB 0.056 0.045 0.13
KN8 0.028 -0.052 0.23
KO 0.055 0.043 0.20
KOT 0.055 0.043 0.20
SO 0.050 0.039 0.20
RO 0.03 0.020 0.15
Notations: B = increased amount of filler; K = Köping 500 limestone filler; N = new way of mixing (filler last); O = ordinary way of mixing (filler first); R = reference; S = Ignaberga 200 limestone filler; T = 5.5 m hydrostatic pouring pressure instead of 0.23 m; II = second; 8 = 8 % air content.
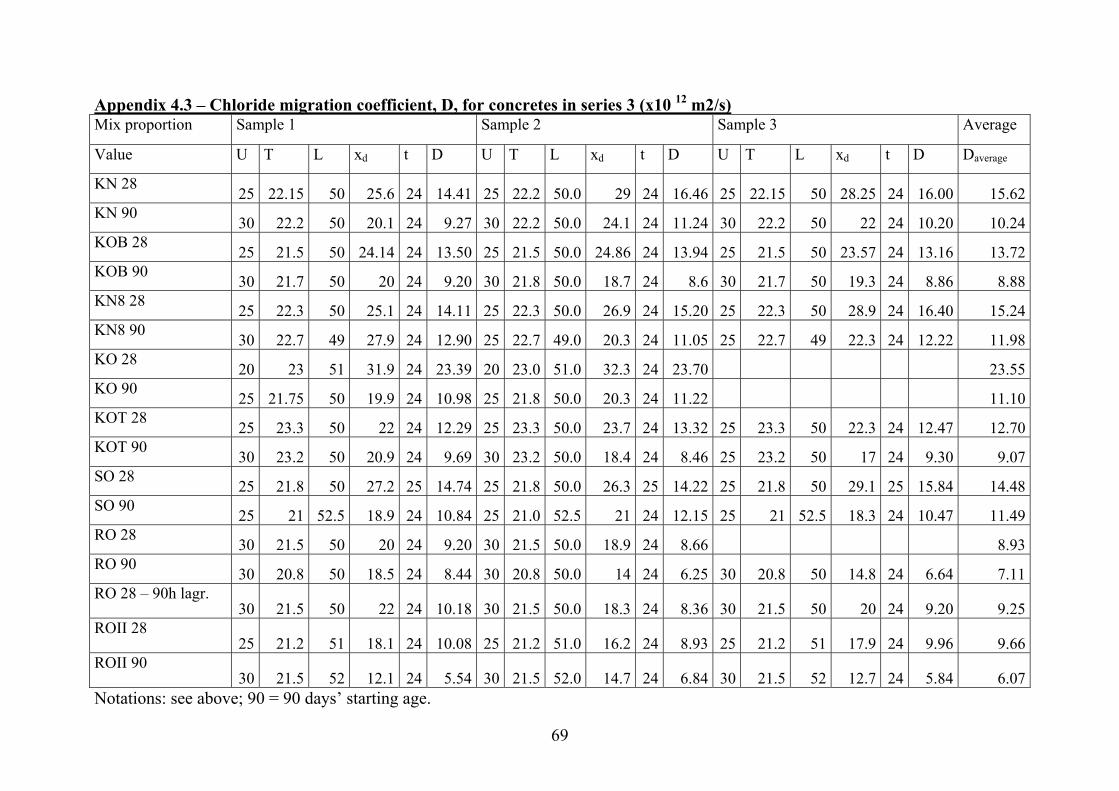
69
Appendix 4.3 – Chloride migration coefficient, D, for concretes in series 3 (x10 12 m2/s) Mix proportion Sample 1 Sample 2 Sample 3 Average
Value U T L xd t D U T L xd t D U T L xd t D Daverage
KN 28 25 22.15 50 25.6 24 14.41 25 22.2 50.0 29 24 16.46 25 22.15 50 28.25 24 16.00 15.62 KN 90 30 22.2 50 20.1 24 9.27 30 22.2 50.0 24.1 24 11.24 30 22.2 50 22 24 10.20 10.24 KOB 28 25 21.5 50 24.14 24 13.50 25 21.5 50.0 24.86 24 13.94 25 21.5 50 23.57 24 13.16 13.72 KOB 90 30 21.7 50 20 24 9.20 30 21.8 50.0 18.7 24 8.6 30 21.7 50 19.3 24 8.86 8.88 KN8 28 25 22.3 50 25.1 24 14.11 25 22.3 50.0 26.9 24 15.20 25 22.3 50 28.9 24 16.40 15.24 KN8 90 30 22.7 49 27.9 24 12.90 25 22.7 49.0 20.3 24 11.05 25 22.7 49 22.3 24 12.22 11.98 KO 28 20 23 51 31.9 24 23.39 20 23.0 51.0 32.3 24 23.70 23.55 KO 90 25 21.75 50 19.9 24 10.98 25 21.8 50.0 20.3 24 11.22 11.10 KOT 28 25 23.3 50 22 24 12.29 25 23.3 50.0 23.7 24 13.32 25 23.3 50 22.3 24 12.47 12.70 KOT 90 30 23.2 50 20.9 24 9.69 30 23.2 50.0 18.4 24 8.46 25 23.2 50 17 24 9.30 9.07 SO 28 25 21.8 50 27.2 25 14.74 25 21.8 50.0 26.3 25 14.22 25 21.8 50 29.1 25 15.84 14.48 SO 90 25 21 52.5 18.9 24 10.84 25 21.0 52.5 21 24 12.15 25 21 52.5 18.3 24 10.47 11.49 RO 28 30 21.5 50 20 24 9.20 30 21.5 50.0 18.9 24 8.66 8.93 RO 90 30 20.8 50 18.5 24 8.44 30 20.8 50.0 14 24 6.25 30 20.8 50 14.8 24 6.64 7.11 RO 28 – 90h lagr.
30 21.5 50 22 24 10.18 30 21.5 50.0 18.3 24 8.36 30 21.5 50 20 24 9.20 9.25 ROII 28
25 21.2 51 18.1 24 10.08 25 21.2 51.0 16.2 24 8.93 25 21.2 51 17.9 24 9.96 9.66 ROII 90
30 21.5 52 12.1 24 5.54 30 21.5 52.0 14.7 24 6.84 30 21.5 52 12.7 24 5.84 6.07 Notations: see above; 90 = 90 days’ starting age.
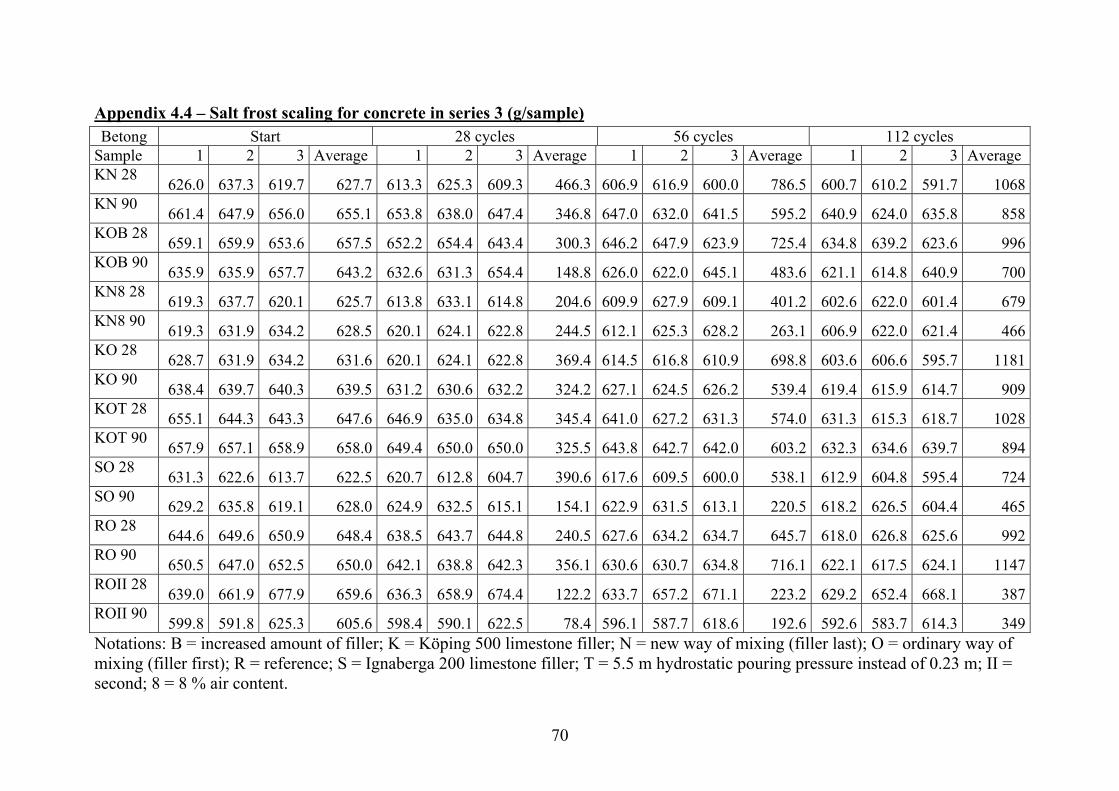
70
Appendix 4.4 – Salt frost scaling for concrete in series 3 (g/sample) Betong Start 28 cycles 56 cycles 112 cycles
Sample 1 2 3 Average 1 2 3 Average 1 2 3 Average 1 2 3 Average KN 28 626.0 637.3 619.7 627.7 613.3 625.3 609.3 466.3 606.9 616.9 600.0 786.5 600.7 610.2 591.7 1068 KN 90 661.4 647.9 656.0 655.1 653.8 638.0 647.4 346.8 647.0 632.0 641.5 595.2 640.9 624.0 635.8 858 KOB 28 659.1 659.9 653.6 657.5 652.2 654.4 643.4 300.3 646.2 647.9 623.9 725.4 634.8 639.2 623.6 996 KOB 90 635.9 635.9 657.7 643.2 632.6 631.3 654.4 148.8 626.0 622.0 645.1 483.6 621.1 614.8 640.9 700 KN8 28 619.3 637.7 620.1 625.7 613.8 633.1 614.8 204.6 609.9 627.9 609.1 401.2 602.6 622.0 601.4 679 KN8 90 619.3 631.9 634.2 628.5 620.1 624.1 622.8 244.5 612.1 625.3 628.2 263.1 606.9 622.0 621.4 466 KO 28 628.7 631.9 634.2 631.6 620.1 624.1 622.8 369.4 614.5 616.8 610.9 698.8 603.6 606.6 595.7 1181 KO 90 638.4 639.7 640.3 639.5 631.2 630.6 632.2 324.2 627.1 624.5 626.2 539.4 619.4 615.9 614.7 909 KOT 28 655.1 644.3 643.3 647.6 646.9 635.0 634.8 345.4 641.0 627.2 631.3 574.0 631.3 615.3 618.7 1028 KOT 90 657.9 657.1 658.9 658.0 649.4 650.0 650.0 325.5 643.8 642.7 642.0 603.2 632.3 634.6 639.7 894 SO 28 631.3 622.6 613.7 622.5 620.7 612.8 604.7 390.6 617.6 609.5 600.0 538.1 612.9 604.8 595.4 724 SO 90 629.2 635.8 619.1 628.0 624.9 632.5 615.1 154.1 622.9 631.5 613.1 220.5 618.2 626.5 604.4 465 RO 28 644.6 649.6 650.9 648.4 638.5 643.7 644.8 240.5 627.6 634.2 634.7 645.7 618.0 626.8 625.6 992 RO 90 650.5 647.0 652.5 650.0 642.1 638.8 642.3 356.1 630.6 630.7 634.8 716.1 622.1 617.5 624.1 1147 ROII 28 639.0 661.9 677.9 659.6 636.3 658.9 674.4 122.2 633.7 657.2 671.1 223.2 629.2 652.4 668.1 387 ROII 90 599.8 591.8 625.3 605.6 598.4 590.1 622.5 78.4 596.1 587.7 618.6 192.6 592.6 583.7 614.3 349 Notations: B = increased amount of filler; K = Köping 500 limestone filler; N = new way of mixing (filler last); O = ordinary way of mixing (filler first); R = reference; S = Ignaberga 200 limestone filler; T = 5.5 m hydrostatic pouring pressure instead of 0.23 m; II = second; 8 = 8 % air content.
71
APPENDIX 5
Appendix 5.1 – Internal frost resistance of mix proportions D, F, G, RO II and T in series 2 Appendix 5.2 – Internal frost resistance of mix proportions KN, KOB, KN8 and KO in series 3 Appendix 5.3 – Internal frost resistance of mix proportions KOT, SO, RO and ROII in series 3 Appendix 5.4 – Resistance to sulphates (5 °C, internal fundamental frequency, Hz) Appendix 5.5 – Resistance to sulphates – Estimation of change of fundamental frequency (%), length (‰) and mass loss (kg/m³). Appendix 5.6 – Air void structure of concrete KN Appendix 5.7 – Air void structure concrete KO Appendix 5.8 – Air void distribution for concrete KOT Appendix 5.9 – Air void structure of concrete RO I
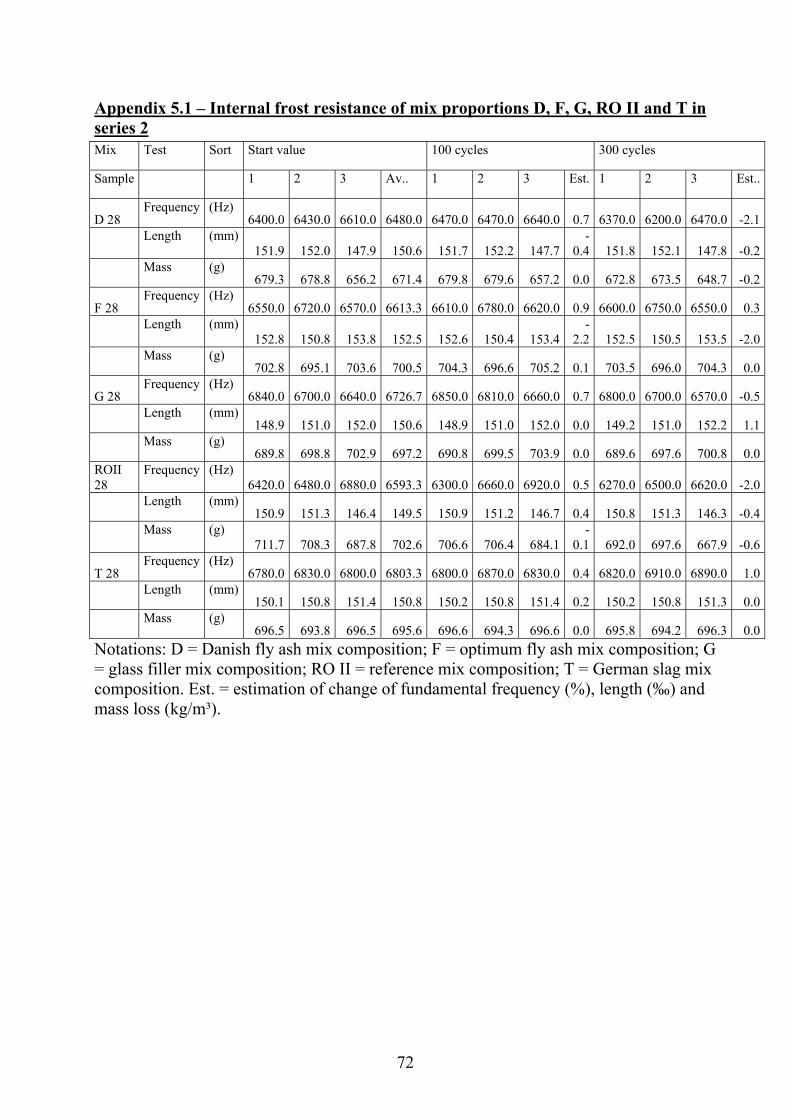
72
Appendix 5.1 – Internal frost resistance of mix proportions D, F, G, RO II and T in series 2 Mix Test Sort Start value 100 cycles 300 cycles
Sample 1 2 3 Av.. 1 2 3 Est. 1 2 3 Est..
D 28 Frequency (Hz)
6400.0 6430.0 6610.0 6480.0 6470.0 6470.0 6640.0 0.7 6370.0 6200.0 6470.0 -2.1
Length (mm)
151.9 152.0 147.9 150.6 151.7 152.2 147.7 -
0.4 151.8 152.1 147.8 -0.2
Mass (g)
679.3 678.8 656.2 671.4 679.8 679.6 657.2 0.0 672.8 673.5 648.7 -0.2
F 28 Frequency (Hz)
6550.0 6720.0 6570.0 6613.3 6610.0 6780.0 6620.0 0.9 6600.0 6750.0 6550.0 0.3
Length (mm)
152.8 150.8 153.8 152.5 152.6 150.4 153.4 -
2.2 152.5 150.5 153.5 -2.0
Mass (g)
702.8 695.1 703.6 700.5 704.3 696.6 705.2 0.1 703.5 696.0 704.3 0.0
G 28 Frequency (Hz)
6840.0 6700.0 6640.0 6726.7 6850.0 6810.0 6660.0 0.7 6800.0 6700.0 6570.0 -0.5
Length (mm)
148.9 151.0 152.0 150.6 148.9 151.0 152.0 0.0 149.2 151.0 152.2 1.1
Mass (g)
689.8 698.8 702.9 697.2 690.8 699.5 703.9 0.0 689.6 697.6 700.8 0.0ROII 28
Frequency (Hz) 6420.0 6480.0 6880.0 6593.3 6300.0 6660.0 6920.0 0.5 6270.0 6500.0 6620.0 -2.0
Length (mm)
150.9 151.3 146.4 149.5 150.9 151.2 146.7 0.4 150.8 151.3 146.3 -0.4
Mass (g)
711.7 708.3 687.8 702.6 706.6 706.4 684.1 -
0.1 692.0 697.6 667.9 -0.6
T 28 Frequency (Hz)
6780.0 6830.0 6800.0 6803.3 6800.0 6870.0 6830.0 0.4 6820.0 6910.0 6890.0 1.0
Length (mm)
150.1 150.8 151.4 150.8 150.2 150.8 151.4 0.2 150.2 150.8 151.3 0.0
Mass (g)
696.5 693.8 696.5 695.6 696.6 694.3 696.6 0.0 695.8 694.2 696.3 0.0Notations: D = Danish fly ash mix composition; F = optimum fly ash mix composition; G = glass filler mix composition; RO II = reference mix composition; T = German slag mix composition. Est. = estimation of change of fundamental frequency (%), length (‰) and mass loss (kg/m³).
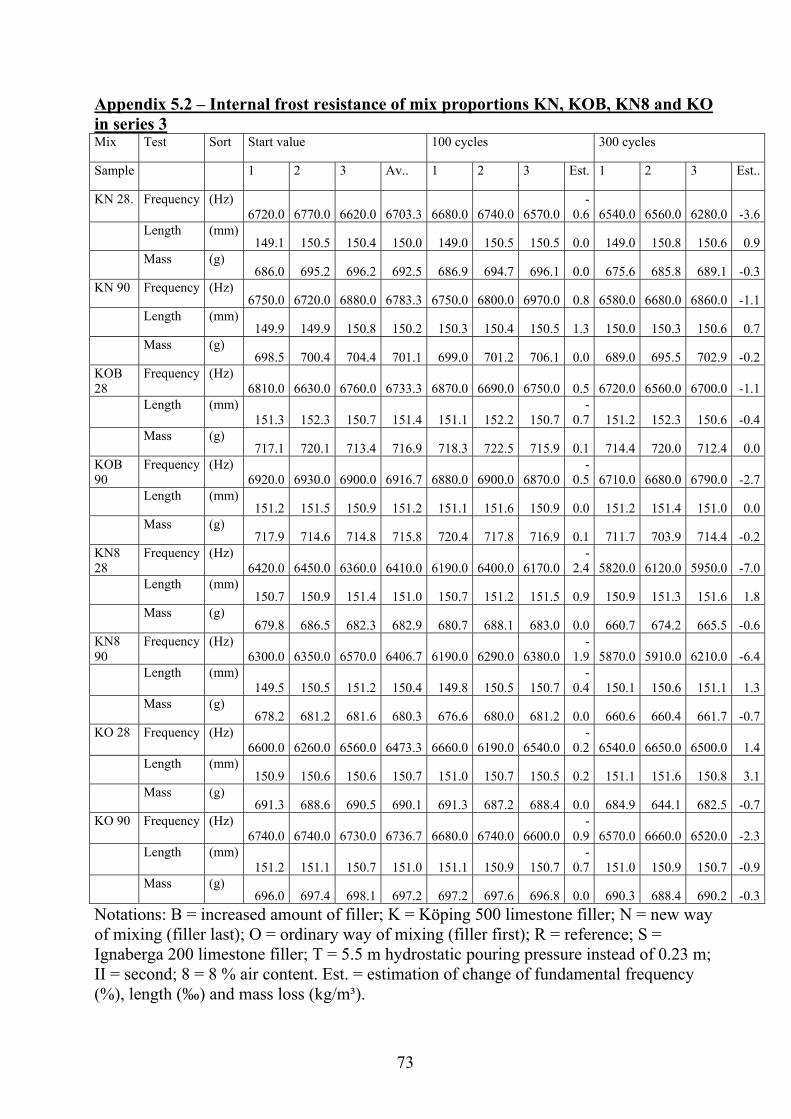
73
Appendix 5.2 – Internal frost resistance of mix proportions KN, KOB, KN8 and KO in series 3 Mix Test Sort Start value 100 cycles 300 cycles
Sample 1 2 3 Av.. 1 2 3 Est. 1 2 3 Est..
KN 28. Frequency (Hz) 6720.0 6770.0 6620.0 6703.3 6680.0 6740.0 6570.0
-0.6 6540.0 6560.0 6280.0 -3.6
Length (mm)149.1 150.5 150.4 150.0 149.0 150.5 150.5 0.0 149.0 150.8 150.6 0.9
Mass (g) 686.0 695.2 696.2 692.5 686.9 694.7 696.1 0.0 675.6 685.8 689.1 -0.3
KN 90 Frequency (Hz) 6750.0 6720.0 6880.0 6783.3 6750.0 6800.0 6970.0 0.8 6580.0 6680.0 6860.0 -1.1
Length (mm)149.9 149.9 150.8 150.2 150.3 150.4 150.5 1.3 150.0 150.3 150.6 0.7
Mass (g) 698.5 700.4 704.4 701.1 699.0 701.2 706.1 0.0 689.0 695.5 702.9 -0.2
KOB 28
Frequency (Hz) 6810.0 6630.0 6760.0 6733.3 6870.0 6690.0 6750.0 0.5 6720.0 6560.0 6700.0 -1.1
Length (mm)151.3 152.3 150.7 151.4 151.1 152.2 150.7
-0.7 151.2 152.3 150.6 -0.4
Mass (g) 717.1 720.1 713.4 716.9 718.3 722.5 715.9 0.1 714.4 720.0 712.4 0.0
KOB 90
Frequency (Hz) 6920.0 6930.0 6900.0 6916.7 6880.0 6900.0 6870.0
-0.5 6710.0 6680.0 6790.0 -2.7
Length (mm)151.2 151.5 150.9 151.2 151.1 151.6 150.9 0.0 151.2 151.4 151.0 0.0
Mass (g) 717.9 714.6 714.8 715.8 720.4 717.8 716.9 0.1 711.7 703.9 714.4 -0.2
KN8 28
Frequency (Hz) 6420.0 6450.0 6360.0 6410.0 6190.0 6400.0 6170.0
-2.4 5820.0 6120.0 5950.0 -7.0
Length (mm)150.7 150.9 151.4 151.0 150.7 151.2 151.5 0.9 150.9 151.3 151.6 1.8
Mass (g) 679.8 686.5 682.3 682.9 680.7 688.1 683.0 0.0 660.7 674.2 665.5 -0.6
KN8 90
Frequency (Hz) 6300.0 6350.0 6570.0 6406.7 6190.0 6290.0 6380.0
-1.9 5870.0 5910.0 6210.0 -6.4
Length (mm)149.5 150.5 151.2 150.4 149.8 150.5 150.7
-0.4 150.1 150.6 151.1 1.3
Mass (g) 678.2 681.2 681.6 680.3 676.6 680.0 681.2 0.0 660.6 660.4 661.7 -0.7
KO 28 Frequency (Hz) 6600.0 6260.0 6560.0 6473.3 6660.0 6190.0 6540.0
-0.2 6540.0 6650.0 6500.0 1.4
Length (mm)150.9 150.6 150.6 150.7 151.0 150.7 150.5 0.2 151.1 151.6 150.8 3.1
Mass (g) 691.3 688.6 690.5 690.1 691.3 687.2 688.4 0.0 684.9 644.1 682.5 -0.7
KO 90 Frequency (Hz) 6740.0 6740.0 6730.0 6736.7 6680.0 6740.0 6600.0
-0.9 6570.0 6660.0 6520.0 -2.3
Length (mm)151.2 151.1 150.7 151.0 151.1 150.9 150.7
-0.7 151.0 150.9 150.7 -0.9
Mass (g) 696.0 697.4 698.1 697.2 697.2 697.6 696.8 0.0 690.3 688.4 690.2 -0.3
Notations: B = increased amount of filler; K = Köping 500 limestone filler; N = new way of mixing (filler last); O = ordinary way of mixing (filler first); R = reference; S = Ignaberga 200 limestone filler; T = 5.5 m hydrostatic pouring pressure instead of 0.23 m; II = second; 8 = 8 % air content. Est. = estimation of change of fundamental frequency (%), length (‰) and mass loss (kg/m³).
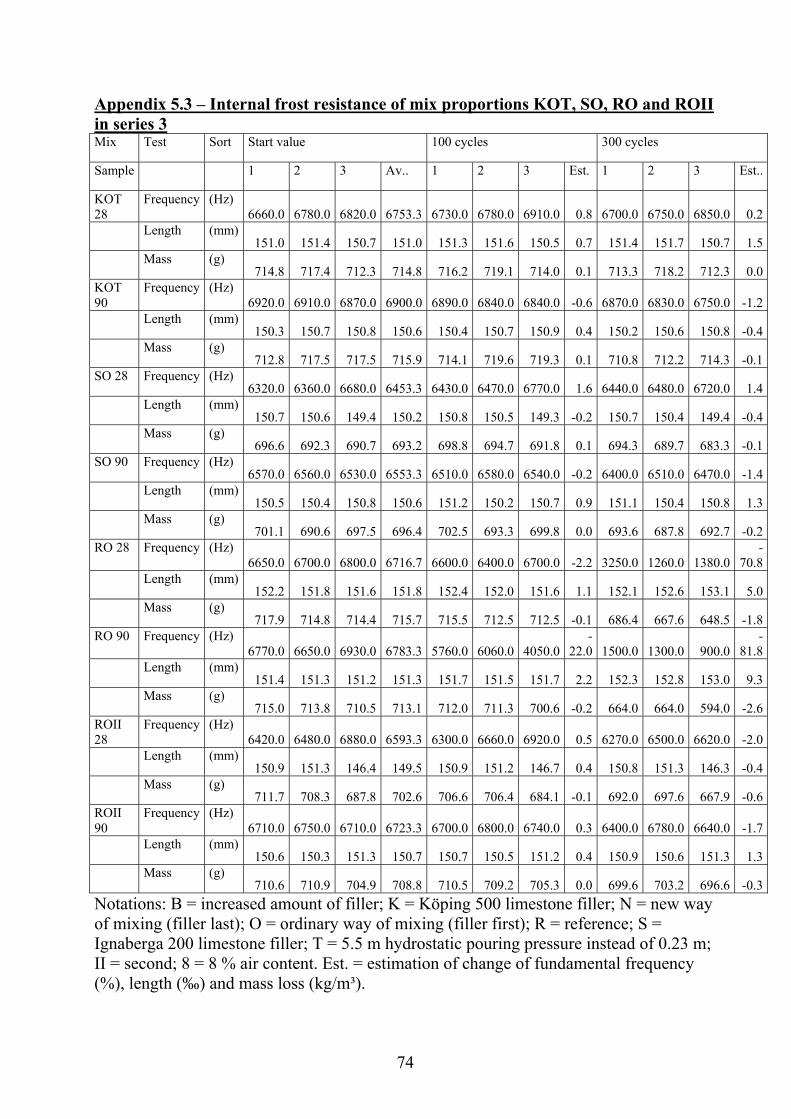
74
Appendix 5.3 – Internal frost resistance of mix proportions KOT, SO, RO and ROII in series 3 Mix Test Sort Start value 100 cycles 300 cycles
Sample 1 2 3 Av.. 1 2 3 Est. 1 2 3 Est..
KOT 28
Frequency (Hz) 6660.0 6780.0 6820.0 6753.3 6730.0 6780.0 6910.0 0.8 6700.0 6750.0 6850.0 0.2
Length (mm)151.0 151.4 150.7 151.0 151.3 151.6 150.5 0.7 151.4 151.7 150.7 1.5
Mass (g) 714.8 717.4 712.3 714.8 716.2 719.1 714.0 0.1 713.3 718.2 712.3 0.0
KOT 90
Frequency (Hz) 6920.0 6910.0 6870.0 6900.0 6890.0 6840.0 6840.0 -0.6 6870.0 6830.0 6750.0 -1.2
Length (mm)150.3 150.7 150.8 150.6 150.4 150.7 150.9 0.4 150.2 150.6 150.8 -0.4
Mass (g) 712.8 717.5 717.5 715.9 714.1 719.6 719.3 0.1 710.8 712.2 714.3 -0.1
SO 28 Frequency (Hz) 6320.0 6360.0 6680.0 6453.3 6430.0 6470.0 6770.0 1.6 6440.0 6480.0 6720.0 1.4
Length (mm)150.7 150.6 149.4 150.2 150.8 150.5 149.3 -0.2 150.7 150.4 149.4 -0.4
Mass (g) 696.6 692.3 690.7 693.2 698.8 694.7 691.8 0.1 694.3 689.7 683.3 -0.1
SO 90 Frequency (Hz) 6570.0 6560.0 6530.0 6553.3 6510.0 6580.0 6540.0 -0.2 6400.0 6510.0 6470.0 -1.4
Length (mm)150.5 150.4 150.8 150.6 151.2 150.2 150.7 0.9 151.1 150.4 150.8 1.3
Mass (g) 701.1 690.6 697.5 696.4 702.5 693.3 699.8 0.0 693.6 687.8 692.7 -0.2
RO 28 Frequency (Hz) 6650.0 6700.0 6800.0 6716.7 6600.0 6400.0 6700.0 -2.2 3250.0 1260.0 1380.0
-70.8
Length (mm)152.2 151.8 151.6 151.8 152.4 152.0 151.6 1.1 152.1 152.6 153.1 5.0
Mass (g) 717.9 714.8 714.4 715.7 715.5 712.5 712.5 -0.1 686.4 667.6 648.5 -1.8
RO 90 Frequency (Hz) 6770.0 6650.0 6930.0 6783.3 5760.0 6060.0 4050.0
-22.0 1500.0 1300.0 900.0
-81.8
Length (mm)151.4 151.3 151.2 151.3 151.7 151.5 151.7 2.2 152.3 152.8 153.0 9.3
Mass (g) 715.0 713.8 710.5 713.1 712.0 711.3 700.6 -0.2 664.0 664.0 594.0 -2.6
ROII 28
Frequency (Hz) 6420.0 6480.0 6880.0 6593.3 6300.0 6660.0 6920.0 0.5 6270.0 6500.0 6620.0 -2.0
Length (mm)150.9 151.3 146.4 149.5 150.9 151.2 146.7 0.4 150.8 151.3 146.3 -0.4
Mass (g) 711.7 708.3 687.8 702.6 706.6 706.4 684.1 -0.1 692.0 697.6 667.9 -0.6
ROII 90
Frequency (Hz) 6710.0 6750.0 6710.0 6723.3 6700.0 6800.0 6740.0 0.3 6400.0 6780.0 6640.0 -1.7
Length (mm)150.6 150.3 151.3 150.7 150.7 150.5 151.2 0.4 150.9 150.6 151.3 1.3
Mass (g) 710.6 710.9 704.9 708.8 710.5 709.2 705.3 0.0 699.6 703.2 696.6 -0.3
Notations: B = increased amount of filler; K = Köping 500 limestone filler; N = new way of mixing (filler last); O = ordinary way of mixing (filler first); R = reference; S = Ignaberga 200 limestone filler; T = 5.5 m hydrostatic pouring pressure instead of 0.23 m; II = second; 8 = 8 % air content. Est. = estimation of change of fundamental frequency (%), length (‰) and mass loss (kg/m³).
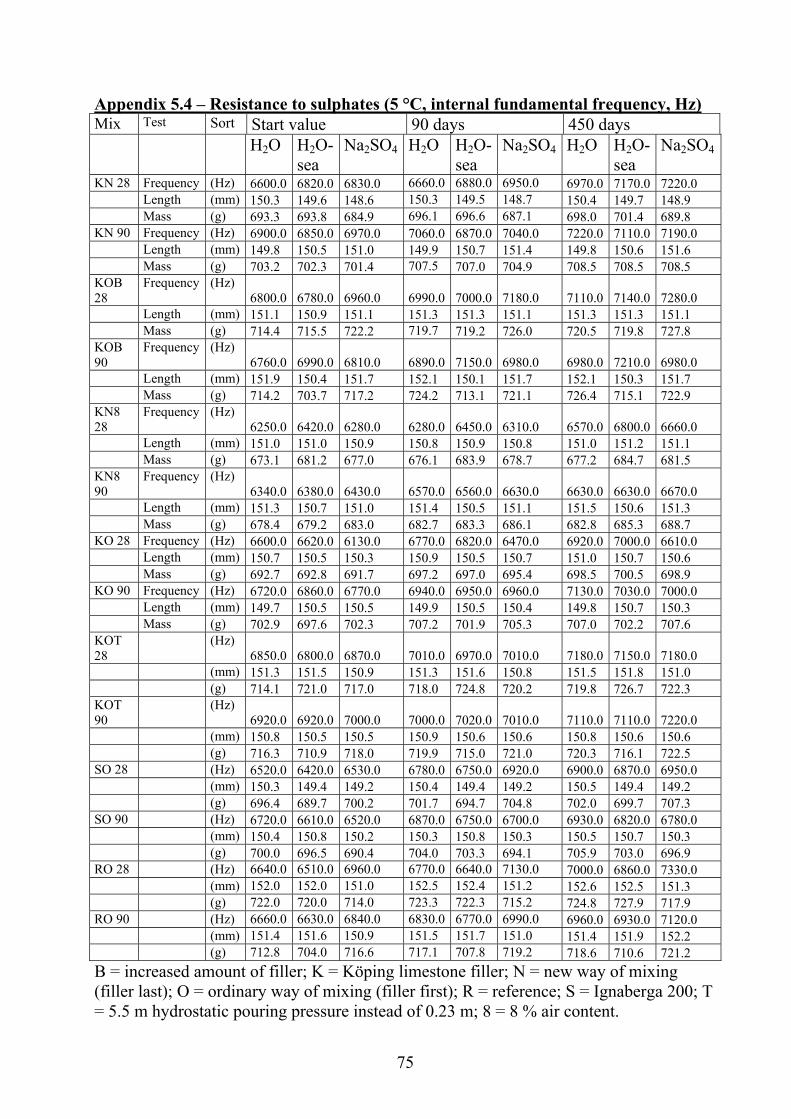
75
Appendix 5.4 – Resistance to sulphates (5 °C, internal fundamental frequency, Hz) Mix Test Sort Start value 90 days 450 days H2O H2O-
sea Na2SO4 H2O H2O-
sea Na2SO4 H2O H2O-
sea Na2SO4
KN 28 Frequency (Hz) 6600.0 6820.0 6830.0 6660.0 6880.0 6950.0 6970.0 7170.0 7220.0 Length (mm) 150.3 149.6 148.6 150.3 149.5 148.7 150.4 149.7 148.9 Mass (g) 693.3 693.8 684.9 696.1 696.6 687.1 698.0 701.4 689.8 KN 90 Frequency (Hz) 6900.0 6850.0 6970.0 7060.0 6870.0 7040.0 7220.0 7110.0 7190.0 Length (mm) 149.8 150.5 151.0 149.9 150.7 151.4 149.8 150.6 151.6 Mass (g) 703.2 702.3 701.4 707.5 707.0 704.9 708.5 708.5 708.5 KOB 28
Frequency (Hz) 6800.0 6780.0 6960.0 6990.0 7000.0 7180.0 7110.0 7140.0 7280.0
Length (mm) 151.1 150.9 151.1 151.3 151.3 151.1 151.3 151.3 151.1 Mass (g) 714.4 715.5 722.2 719.7 719.2 726.0 720.5 719.8 727.8 KOB 90
Frequency (Hz) 6760.0 6990.0 6810.0 6890.0 7150.0 6980.0 6980.0 7210.0 6980.0
Length (mm) 151.9 150.4 151.7 152.1 150.1 151.7 152.1 150.3 151.7 Mass (g) 714.2 703.7 717.2 724.2 713.1 721.1 726.4 715.1 722.9 KN8 28
Frequency (Hz) 6250.0 6420.0 6280.0 6280.0 6450.0 6310.0 6570.0 6800.0 6660.0
Length (mm) 151.0 151.0 150.9 150.8 150.9 150.8 151.0 151.2 151.1 Mass (g) 673.1 681.2 677.0 676.1 683.9 678.7 677.2 684.7 681.5 KN8 90
Frequency (Hz) 6340.0 6380.0 6430.0 6570.0 6560.0 6630.0 6630.0 6630.0 6670.0
Length (mm) 151.3 150.7 151.0 151.4 150.5 151.1 151.5 150.6 151.3 Mass (g) 678.4 679.2 683.0 682.7 683.3 686.1 682.8 685.3 688.7 KO 28 Frequency (Hz) 6600.0 6620.0 6130.0 6770.0 6820.0 6470.0 6920.0 7000.0 6610.0 Length (mm) 150.7 150.5 150.3 150.9 150.5 150.7 151.0 150.7 150.6 Mass (g) 692.7 692.8 691.7 697.2 697.0 695.4 698.5 700.5 698.9 KO 90 Frequency (Hz) 6720.0 6860.0 6770.0 6940.0 6950.0 6960.0 7130.0 7030.0 7000.0 Length (mm) 149.7 150.5 150.5 149.9 150.5 150.4 149.8 150.7 150.3 Mass (g) 702.9 697.6 702.3 707.2 701.9 705.3 707.0 702.2 707.6 KOT 28
(Hz) 6850.0 6800.0 6870.0 7010.0 6970.0 7010.0 7180.0 7150.0 7180.0
(mm) 151.3 151.5 150.9 151.3 151.6 150.8 151.5 151.8 151.0 (g) 714.1 721.0 717.0 718.0 724.8 720.2 719.8 726.7 722.3 KOT 90
(Hz) 6920.0 6920.0 7000.0 7000.0 7020.0 7010.0 7110.0 7110.0 7220.0
(mm) 150.8 150.5 150.5 150.9 150.6 150.6 150.8 150.6 150.6 (g) 716.3 710.9 718.0 719.9 715.0 721.0 720.3 716.1 722.5 SO 28 (Hz) 6520.0 6420.0 6530.0 6780.0 6750.0 6920.0 6900.0 6870.0 6950.0 (mm) 150.3 149.4 149.2 150.4 149.4 149.2 150.5 149.4 149.2 (g) 696.4 689.7 700.2 701.7 694.7 704.8 702.0 699.7 707.3 SO 90 (Hz) 6720.0 6610.0 6520.0 6870.0 6750.0 6700.0 6930.0 6820.0 6780.0 (mm) 150.4 150.8 150.2 150.3 150.8 150.3 150.5 150.7 150.3 (g) 700.0 696.5 690.4 704.0 703.3 694.1 705.9 703.0 696.9 RO 28 (Hz) 6640.0 6510.0 6960.0 6770.0 6640.0 7130.0 7000.0 6860.0 7330.0 (mm) 152.0 152.0 151.0 152.5 152.4 151.2 152.6 152.5 151.3 (g) 722.0 720.0 714.0 723.3 722.3 715.2 724.8 727.9 717.9 RO 90 (Hz) 6660.0 6630.0 6840.0 6830.0 6770.0 6990.0 6960.0 6930.0 7120.0 (mm) 151.4 151.6 150.9 151.5 151.7 151.0 151.4 151.9 152.2 (g) 712.8 704.0 716.6 717.1 707.8 719.2 718.6 710.6 721.2 B = increased amount of filler; K = Köping limestone filler; N = new way of mixing (filler last); O = ordinary way of mixing (filler first); R = reference; S = Ignaberga 200; T = 5.5 m hydrostatic pouring pressure instead of 0.23 m; 8 = 8 % air content.
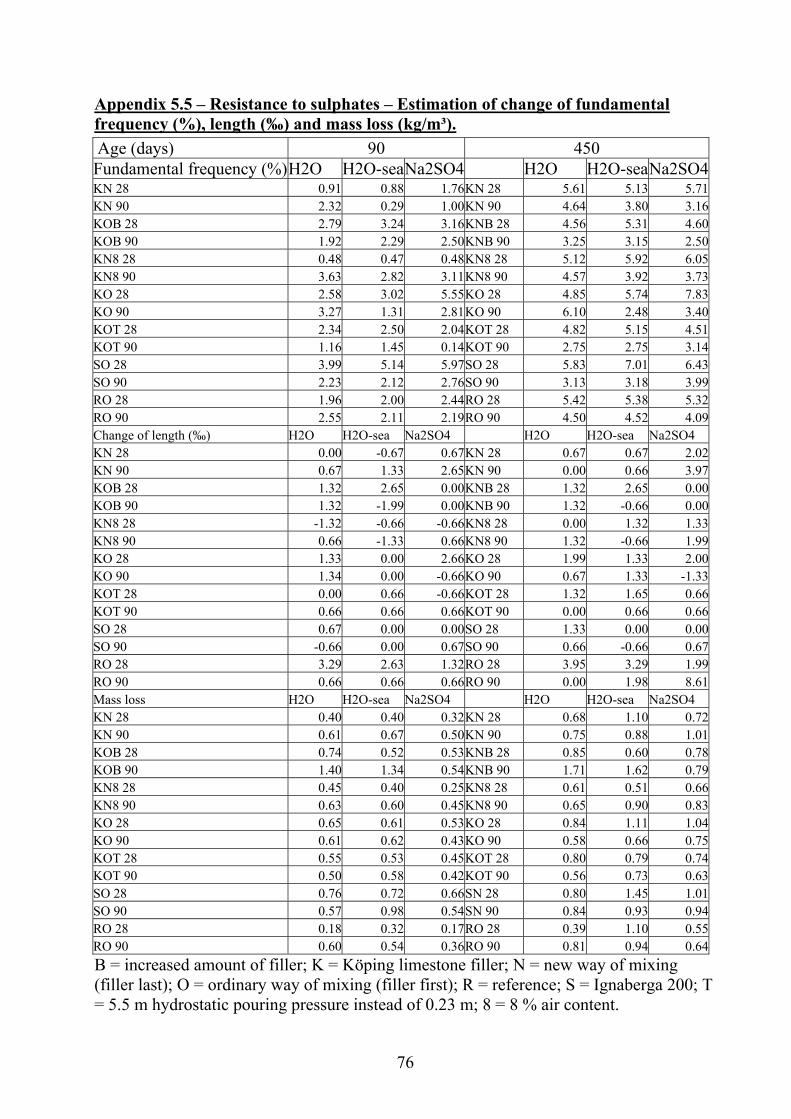
76
Appendix 5.5 – Resistance to sulphates – Estimation of change of fundamental frequency (%), length (‰) and mass loss (kg/m³). Age (days) 90 450 Fundamental frequency (%) H2O H2O-seaNa2SO4 H2O H2O-sea Na2SO4KN 28 0.91 0.88 1.76KN 28 5.61 5.13 5.71KN 90 2.32 0.29 1.00KN 90 4.64 3.80 3.16KOB 28 2.79 3.24 3.16KNB 28 4.56 5.31 4.60KOB 90 1.92 2.29 2.50KNB 90 3.25 3.15 2.50KN8 28 0.48 0.47 0.48KN8 28 5.12 5.92 6.05KN8 90 3.63 2.82 3.11KN8 90 4.57 3.92 3.73KO 28 2.58 3.02 5.55KO 28 4.85 5.74 7.83KO 90 3.27 1.31 2.81KO 90 6.10 2.48 3.40KOT 28 2.34 2.50 2.04KOT 28 4.82 5.15 4.51KOT 90 1.16 1.45 0.14KOT 90 2.75 2.75 3.14SO 28 3.99 5.14 5.97SO 28 5.83 7.01 6.43SO 90 2.23 2.12 2.76SO 90 3.13 3.18 3.99RO 28 1.96 2.00 2.44RO 28 5.42 5.38 5.32RO 90 2.55 2.11 2.19RO 90 4.50 4.52 4.09Change of length (‰) H2O H2O-sea Na2SO4 H2O H2O-sea Na2SO4 KN 28 0.00 -0.67 0.67KN 28 0.67 0.67 2.02KN 90 0.67 1.33 2.65KN 90 0.00 0.66 3.97KOB 28 1.32 2.65 0.00KNB 28 1.32 2.65 0.00KOB 90 1.32 -1.99 0.00KNB 90 1.32 -0.66 0.00KN8 28 -1.32 -0.66 -0.66KN8 28 0.00 1.32 1.33KN8 90 0.66 -1.33 0.66KN8 90 1.32 -0.66 1.99KO 28 1.33 0.00 2.66KO 28 1.99 1.33 2.00KO 90 1.34 0.00 -0.66KO 90 0.67 1.33 -1.33KOT 28 0.00 0.66 -0.66KOT 28 1.32 1.65 0.66KOT 90 0.66 0.66 0.66KOT 90 0.00 0.66 0.66SO 28 0.67 0.00 0.00SO 28 1.33 0.00 0.00SO 90 -0.66 0.00 0.67SO 90 0.66 -0.66 0.67RO 28 3.29 2.63 1.32RO 28 3.95 3.29 1.99RO 90 0.66 0.66 0.66RO 90 0.00 1.98 8.61Mass loss H2O H2O-sea Na2SO4 H2O H2O-sea Na2SO4 KN 28 0.40 0.40 0.32KN 28 0.68 1.10 0.72KN 90 0.61 0.67 0.50KN 90 0.75 0.88 1.01KOB 28 0.74 0.52 0.53KNB 28 0.85 0.60 0.78KOB 90 1.40 1.34 0.54KNB 90 1.71 1.62 0.79KN8 28 0.45 0.40 0.25KN8 28 0.61 0.51 0.66KN8 90 0.63 0.60 0.45KN8 90 0.65 0.90 0.83KO 28 0.65 0.61 0.53KO 28 0.84 1.11 1.04KO 90 0.61 0.62 0.43KO 90 0.58 0.66 0.75KOT 28 0.55 0.53 0.45KOT 28 0.80 0.79 0.74KOT 90 0.50 0.58 0.42KOT 90 0.56 0.73 0.63SO 28 0.76 0.72 0.66SN 28 0.80 1.45 1.01SO 90 0.57 0.98 0.54SN 90 0.84 0.93 0.94RO 28 0.18 0.32 0.17RO 28 0.39 1.10 0.55RO 90 0.60 0.54 0.36RO 90 0.81 0.94 0.64B = increased amount of filler; K = Köping limestone filler; N = new way of mixing (filler last); O = ordinary way of mixing (filler first); R = reference; S = Ignaberga 200; T = 5.5 m hydrostatic pouring pressure instead of 0.23 m; 8 = 8 % air content.
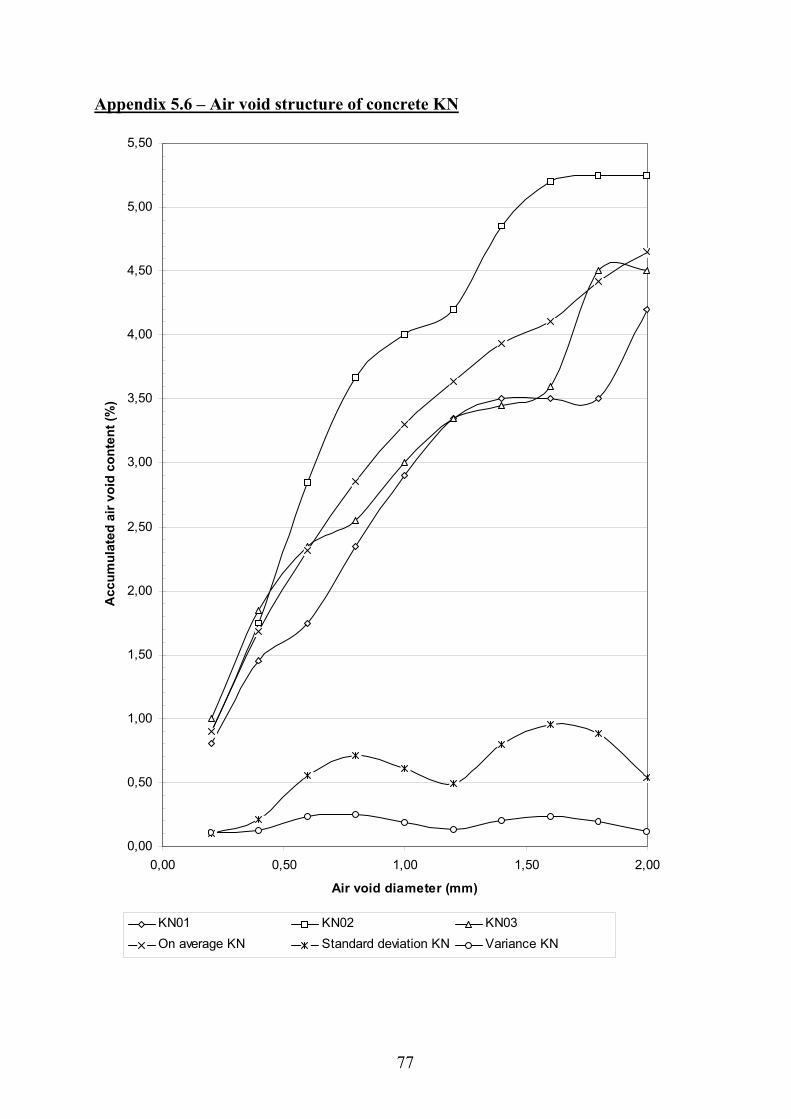
77
Appendix 5.6 – Air void structure of concrete KN
0,00
0,50
1,00
1,50
2,00
2,50
3,00
3,50
4,00
4,50
5,00
5,50
0,00 0,50 1,00 1,50 2,00
Air void diameter (mm)
Acc
umul
ated
air
void
con
tent
(%)
KN01 KN02 KN03On average KN Standard deviation KN Variance KN
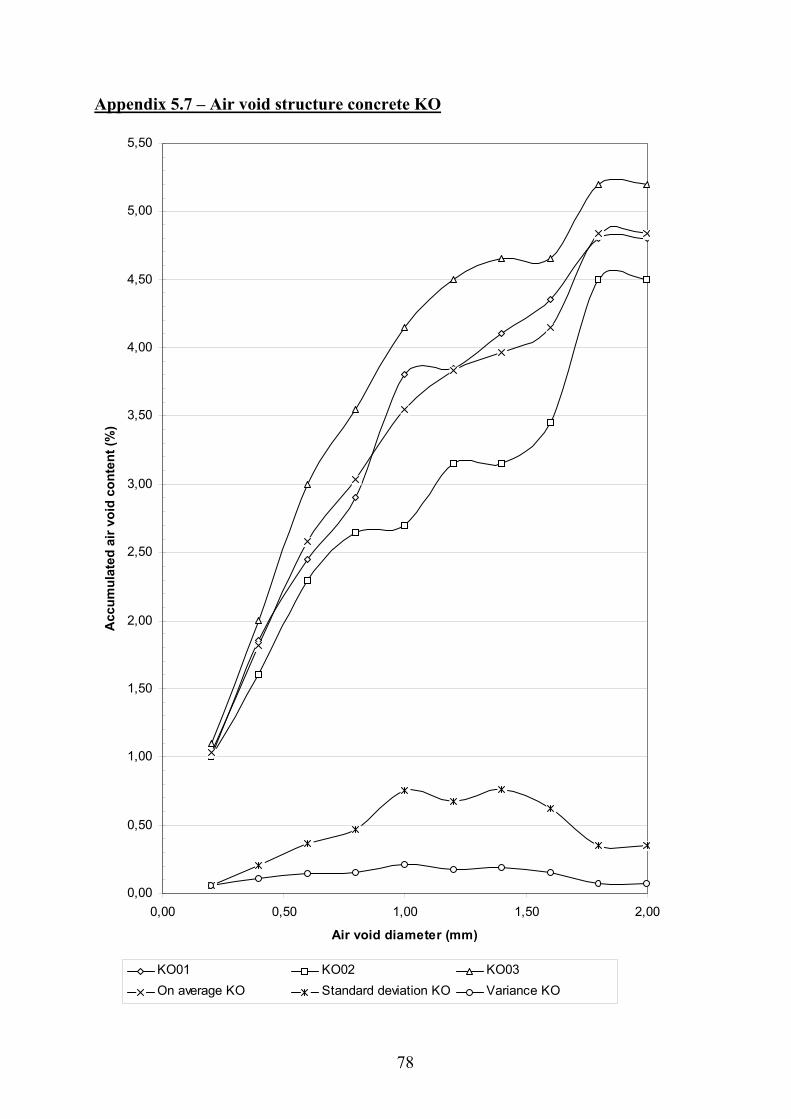
78
Appendix 5.7 – Air void structure concrete KO
0,00
0,50
1,00
1,50
2,00
2,50
3,00
3,50
4,00
4,50
5,00
5,50
0,00 0,50 1,00 1,50 2,00
Air void diameter (mm)
Acc
umul
ated
air
void
con
tent
(%)
KO01 KO02 KO03On average KO Standard deviation KO Variance KO
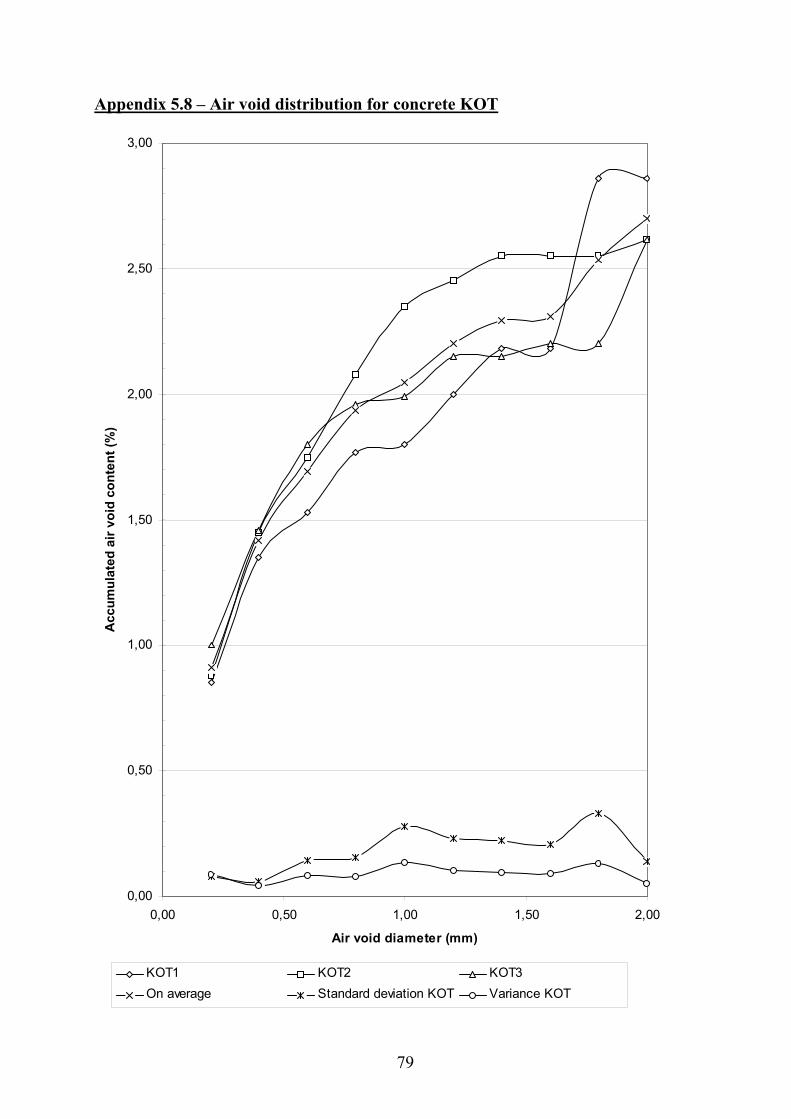
79
Appendix 5.8 – Air void distribution for concrete KOT
0,00
0,50
1,00
1,50
2,00
2,50
3,00
0,00 0,50 1,00 1,50 2,00
Air void diameter (mm)
Acc
umul
ated
air
void
con
tent
(%)
KOT1 KOT2 KOT3On average Standard deviation KOT Variance KOT
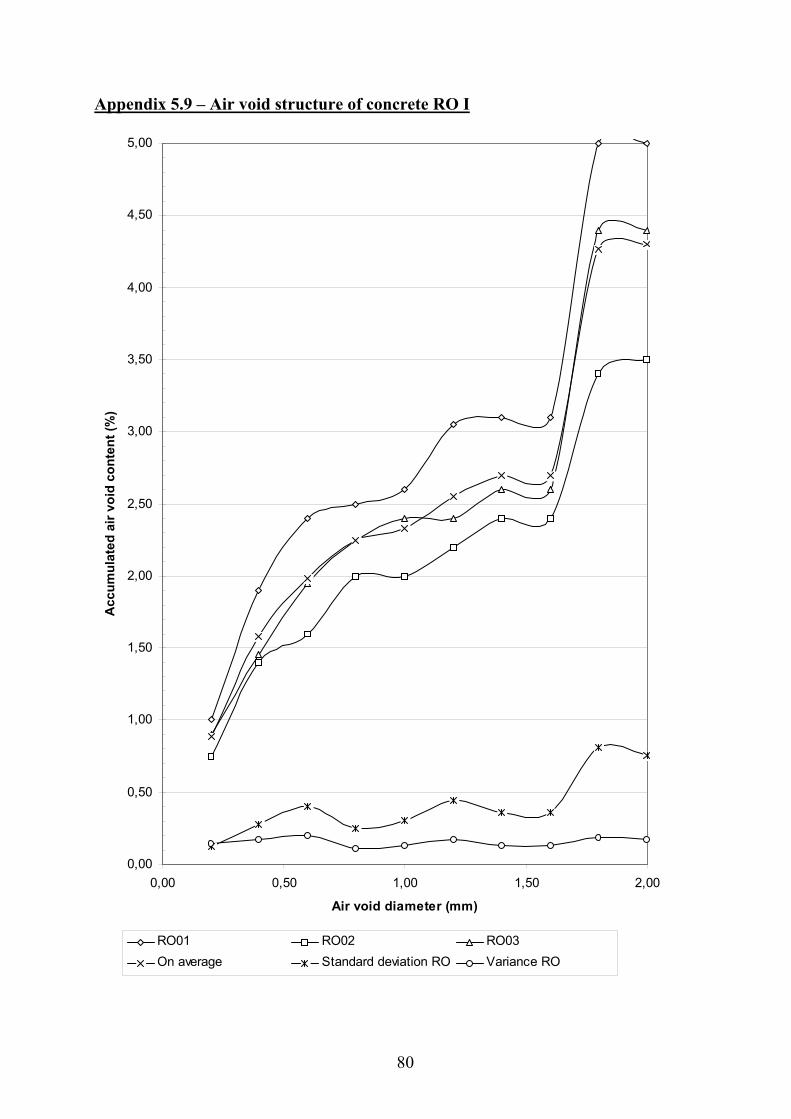
80
Appendix 5.9 – Air void structure of concrete RO I
0,00
0,50
1,00
1,50
2,00
2,50
3,00
3,50
4,00
4,50
5,00
0,00 0,50 1,00 1,50 2,00
Air void diameter (mm)
Acc
umul
ated
air
void
con
tent
(%)
RO01 RO02 RO03On average Standard deviation RO Variance RO
81
APPENDIX 6 Appendix 6.1 – Coefficient of variation of repeated tests of chloride migration coefficient, D, for concretes in series 3. Appendix 6.2 – Significance test for the chloride migration coefficient, D, for concretes in series 3 (x10 -12 m2/s) – Effect of way of compaction (x1012 m2/s). Appendix 6.3 – Chloride migration coefficient, D, for concretes in series 3 (x1012 m2/s) – Effect of mixing order and type of compaction. Appendix 6.4 – Chloride migration coefficient, D, for concretes in series 3 (x10 -12 m2/s) – Effect of age at testing and way of compaction. Appendix 6.5 – Significance test for the hypothesis that SCC with ordinary mixing order had larger salt frost scaling after 112 cycles than NC had (g/m²). Appendix 6.6 – Significance test for salt frost scaling of NC and SCC at different age of start of testing (kg/m²). Appendix 6.7 – Significance test for the hypothesis that SCC with 6% air content had larger salt frost scaling after 112 cycles than SCC with 8% had (g/m²). Appendix 6.8 – Significance test for the hypothesis that SCC with more filler had larger frost scaling after 112 cycles than SCC with normal filler content had (g/m²). Appendix 6.9 – Significance test for the hypothesis that large pouring pressure caused larger frost scaling after 112 cycles than normal pouring pressure did (g/m²). Appendix 6.10 – Significance test for the hypothesis that SCC with Köping filler had larger frost scaling after 112 cycles than SCC with Ingaberga filler had (g/m²). Appendix 6.11 –Change on average of fundamental frequency, length and loss of weight of SCC mix proportions with Köping limestone filler and 6% air content Appendix 6.12 –Change on average of fundamental frequency, length and loss of weight of SCC mix proportions with Köping limestone filler and 8% air content Appendix 6.13 –Change on average of fundamental frequency, length and loss of weight of NC mix proportions with 6% air content Appendix 6.14 – Significance test for a hypothesis that SCC with 6% air content had smaller change of fundamental frequency after 300 cycles than with 8% air (Hz) Appendix 6.15 – Significance test for the hypothesis that SCC with 6% air content had smaller length change after 300 cycles than SCC with 8% air content (mm) Appendix 6.16 – Significance test for the hypothesis that SCC with 6% air content had smaller mass change after 300 cycles than SCC with 8% had (g) Appendix 6.17 – Significance test for the hypothesis that SCC had smaller change of fundamental frequency after 300 cycles than NC had, both with 6% air (Hz). Appendix 6.18 – Significance test for the hypothesis that SCC had a smaller length change after 300 cycles than NC had, both with 8% air content (mm). Appendix 6.19 – Significance test for the hypothesis that SCC had smaller mass change after 300 cycles than NC had, both concretes with 6% air content (g)
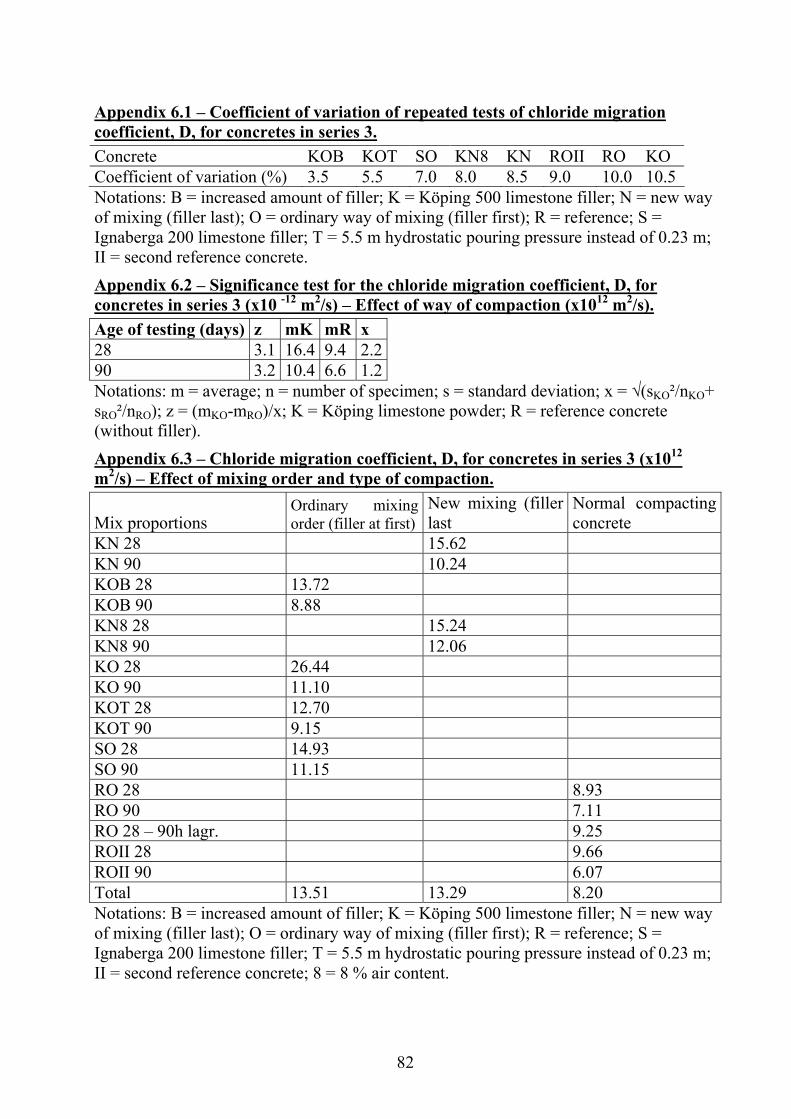
82
Appendix 6.1 – Coefficient of variation of repeated tests of chloride migration coefficient, D, for concretes in series 3. Concrete KOB KOT SO KN8 KN ROII RO KO Coefficient of variation (%) 3.5 5.5 7.0 8.0 8.5 9.0 10.0 10.5 Notations: B = increased amount of filler; K = Köping 500 limestone filler; N = new way of mixing (filler last); O = ordinary way of mixing (filler first); R = reference; S = Ignaberga 200 limestone filler; T = 5.5 m hydrostatic pouring pressure instead of 0.23 m; II = second reference concrete. Appendix 6.2 – Significance test for the chloride migration coefficient, D, for concretes in series 3 (x10 -12 m2/s) – Effect of way of compaction (x1012 m2/s). Age of testing (days) z mK mR x 28 3.1 16.4 9.4 2.290 3.2 10.4 6.6 1.2Notations: m = average; n = number of specimen; s = standard deviation; x = √(sKO²/nKO+ sRO²/nRO); z = (mKO-mRO)/x; K = Köping limestone powder; R = reference concrete (without filler). Appendix 6.3 – Chloride migration coefficient, D, for concretes in series 3 (x1012 m2/s) – Effect of mixing order and type of compaction.
Mix proportions Ordinary mixing order (filler at first)
New mixing (filler last
Normal compacting concrete
KN 28 15.62 KN 90 10.24 KOB 28 13.72 KOB 90 8.88 KN8 28 15.24 KN8 90 12.06 KO 28 26.44 KO 90 11.10 KOT 28 12.70 KOT 90 9.15 SO 28 14.93 SO 90 11.15 RO 28 8.93 RO 90 7.11 RO 28 – 90h lagr. 9.25 ROII 28 9.66 ROII 90 6.07 Total 13.51 13.29 8.20 Notations: B = increased amount of filler; K = Köping 500 limestone filler; N = new way of mixing (filler last); O = ordinary way of mixing (filler first); R = reference; S = Ignaberga 200 limestone filler; T = 5.5 m hydrostatic pouring pressure instead of 0.23 m; II = second reference concrete; 8 = 8 % air content.
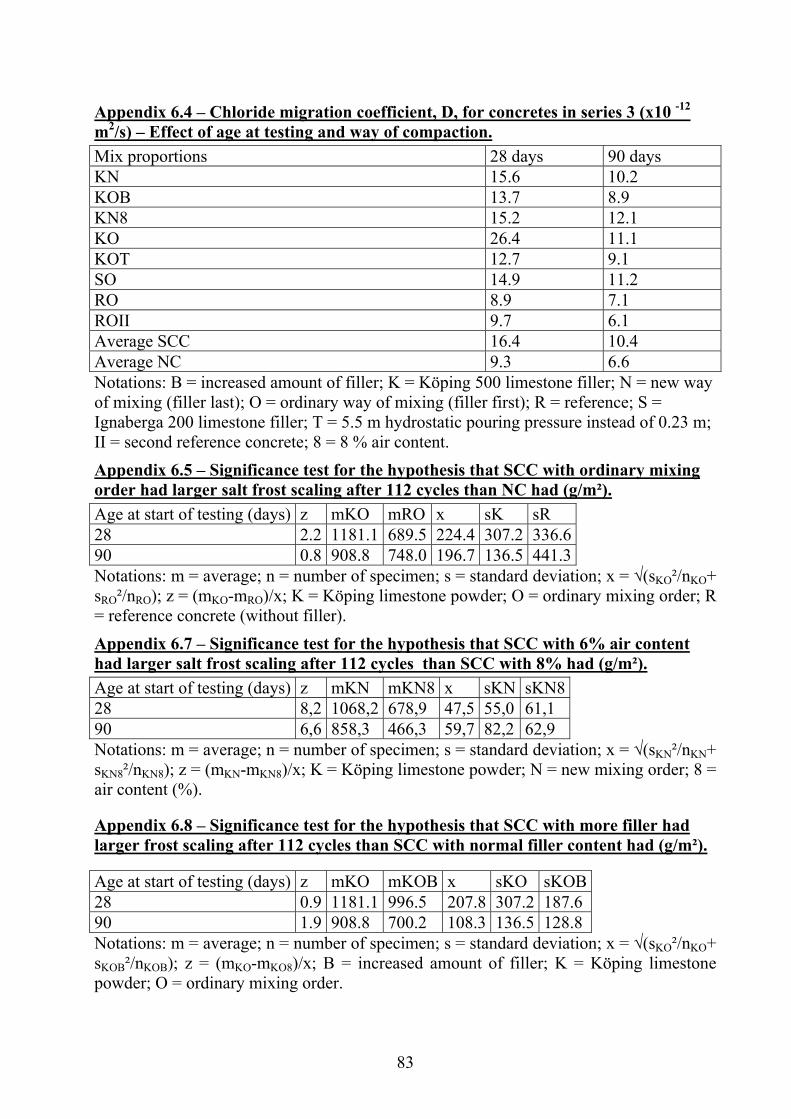
83
Appendix 6.4 – Chloride migration coefficient, D, for concretes in series 3 (x10 -12 m2/s) – Effect of age at testing and way of compaction. Mix proportions 28 days 90 days KN 15.6 10.2 KOB 13.7 8.9 KN8 15.2 12.1 KO 26.4 11.1 KOT 12.7 9.1 SO 14.9 11.2 RO 8.9 7.1 ROII 9.7 6.1 Average SCC 16.4 10.4 Average NC 9.3 6.6 Notations: B = increased amount of filler; K = Köping 500 limestone filler; N = new way of mixing (filler last); O = ordinary way of mixing (filler first); R = reference; S = Ignaberga 200 limestone filler; T = 5.5 m hydrostatic pouring pressure instead of 0.23 m; II = second reference concrete; 8 = 8 % air content. Appendix 6.5 – Significance test for the hypothesis that SCC with ordinary mixing order had larger salt frost scaling after 112 cycles than NC had (g/m²). Age at start of testing (days) z mKO mRO x sK sR 28 2.2 1181.1 689.5 224.4 307.2 336.6 90 0.8 908.8 748.0 196.7 136.5 441.3 Notations: m = average; n = number of specimen; s = standard deviation; x = √(sKO²/nKO+ sRO²/nRO); z = (mKO-mRO)/x; K = Köping limestone powder; O = ordinary mixing order; R = reference concrete (without filler). Appendix 6.7 – Significance test for the hypothesis that SCC with 6% air content had larger salt frost scaling after 112 cycles than SCC with 8% had (g/m²). Age at start of testing (days) z mKN mKN8 x sKN sKN8 28 8,2 1068,2 678,9 47,5 55,0 61,1 90 6,6 858,3 466,3 59,7 82,2 62,9 Notations: m = average; n = number of specimen; s = standard deviation; x = √(sKN²/nKN+ sKN8²/nKN8); z = (mKN-mKN8)/x; K = Köping limestone powder; N = new mixing order; 8 = air content (%).
Appendix 6.8 – Significance test for the hypothesis that SCC with more filler had larger frost scaling after 112 cycles than SCC with normal filler content had (g/m²).
Age at start of testing (days) z mKO mKOB x sKO sKOB 28 0.9 1181.1 996.5 207.8 307.2 187.6 90 1.9 908.8 700.2 108.3 136.5 128.8 Notations: m = average; n = number of specimen; s = standard deviation; x = √(sKO²/nKO+ sKOB²/nKOB); z = (mKO-mKO8)/x; B = increased amount of filler; K = Köping limestone powder; O = ordinary mixing order.
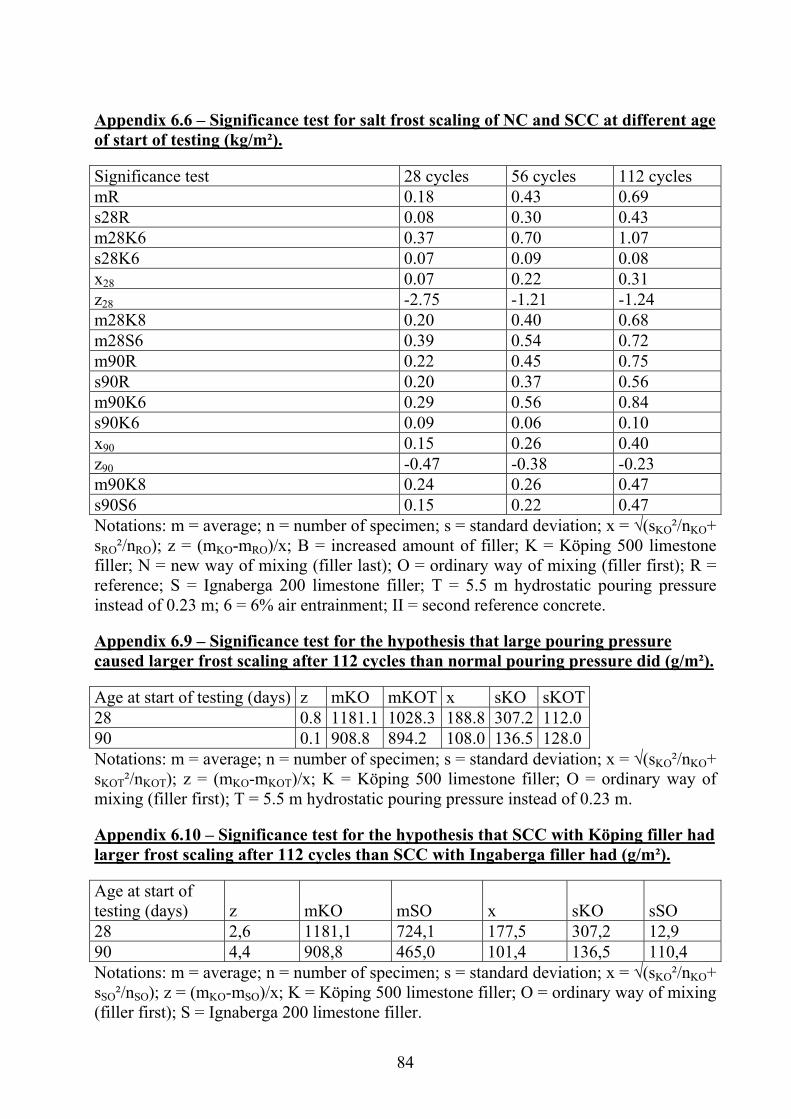
84
Appendix 6.6 – Significance test for salt frost scaling of NC and SCC at different age of start of testing (kg/m²).
Significance test 28 cycles 56 cycles 112 cycles mR 0.18 0.43 0.69 s28R 0.08 0.30 0.43 m28K6 0.37 0.70 1.07 s28K6 0.07 0.09 0.08 x28 0.07 0.22 0.31 z28 -2.75 -1.21 -1.24 m28K8 0.20 0.40 0.68 m28S6 0.39 0.54 0.72 m90R 0.22 0.45 0.75 s90R 0.20 0.37 0.56 m90K6 0.29 0.56 0.84 s90K6 0.09 0.06 0.10 x90 0.15 0.26 0.40 z90 -0.47 -0.38 -0.23 m90K8 0.24 0.26 0.47 s90S6 0.15 0.22 0.47 Notations: m = average; n = number of specimen; s = standard deviation; x = √(sKO²/nKO+ sRO²/nRO); z = (mKO-mRO)/x; B = increased amount of filler; K = Köping 500 limestone filler; N = new way of mixing (filler last); O = ordinary way of mixing (filler first); R = reference; S = Ignaberga 200 limestone filler; T = 5.5 m hydrostatic pouring pressure instead of 0.23 m; 6 = 6% air entrainment; II = second reference concrete.
Appendix 6.9 – Significance test for the hypothesis that large pouring pressure caused larger frost scaling after 112 cycles than normal pouring pressure did (g/m²).
Age at start of testing (days) z mKO mKOT x sKO sKOT 28 0.8 1181.1 1028.3 188.8 307.2 112.0 90 0.1 908.8 894.2 108.0 136.5 128.0 Notations: m = average; n = number of specimen; s = standard deviation; x = √(sKO²/nKO+ sKOT²/nKOT); z = (mKO-mKOT)/x; K = Köping 500 limestone filler; O = ordinary way of mixing (filler first); T = 5.5 m hydrostatic pouring pressure instead of 0.23 m.
Appendix 6.10 – Significance test for the hypothesis that SCC with Köping filler had larger frost scaling after 112 cycles than SCC with Ingaberga filler had (g/m²).
Age at start of testing (days) z mKO mSO x sKO sSO 28 2,6 1181,1 724,1 177,5 307,2 12,9 90 4,4 908,8 465,0 101,4 136,5 110,4 Notations: m = average; n = number of specimen; s = standard deviation; x = √(sKO²/nKO+ sSO²/nSO); z = (mKO-mSO)/x; K = Köping 500 limestone filler; O = ordinary way of mixing (filler first); S = Ignaberga 200 limestone filler.
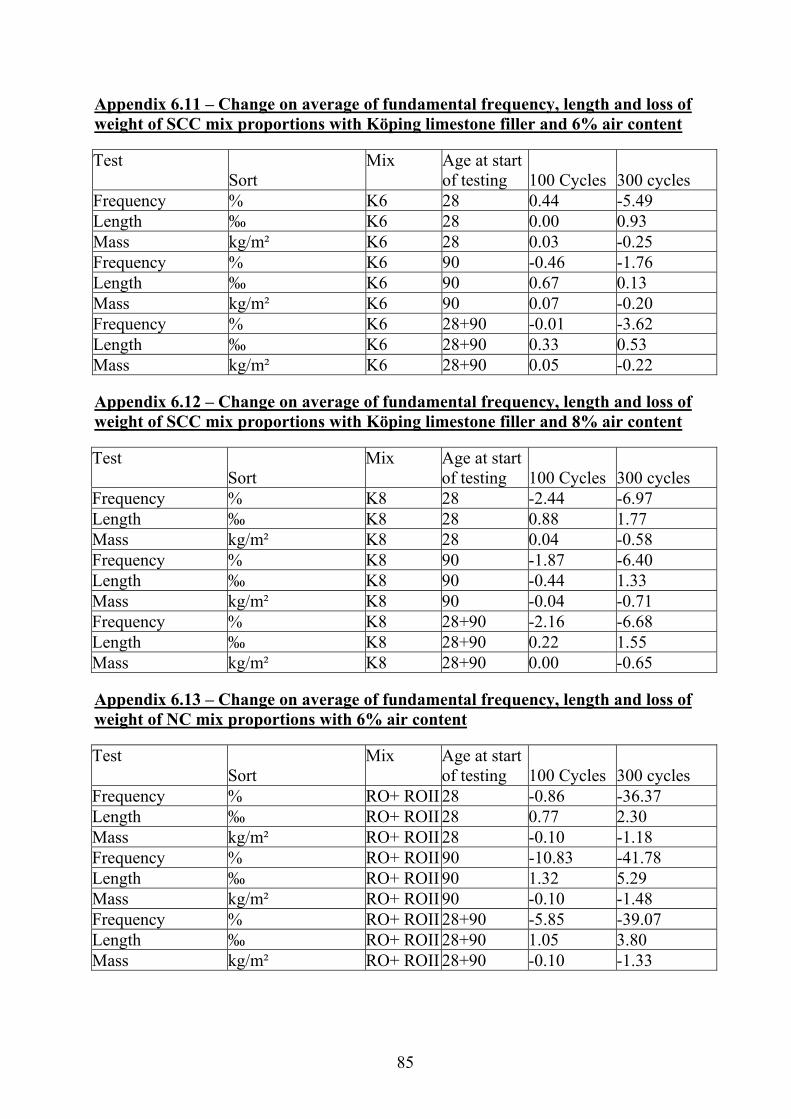
85
Appendix 6.11 – Change on average of fundamental frequency, length and loss of weight of SCC mix proportions with Köping limestone filler and 6% air content
Test Sort
Mix Age at start of testing 100 Cycles 300 cycles
Frequency % K6 28 0.44 -5.49 Length ‰ K6 28 0.00 0.93 Mass kg/m² K6 28 0.03 -0.25 Frequency % K6 90 -0.46 -1.76 Length ‰ K6 90 0.67 0.13 Mass kg/m² K6 90 0.07 -0.20 Frequency % K6 28+90 -0.01 -3.62 Length ‰ K6 28+90 0.33 0.53 Mass kg/m² K6 28+90 0.05 -0.22
Appendix 6.12 – Change on average of fundamental frequency, length and loss of weight of SCC mix proportions with Köping limestone filler and 8% air content
Test Sort
Mix Age at start of testing 100 Cycles 300 cycles
Frequency % K8 28 -2.44 -6.97 Length ‰ K8 28 0.88 1.77 Mass kg/m² K8 28 0.04 -0.58 Frequency % K8 90 -1.87 -6.40 Length ‰ K8 90 -0.44 1.33 Mass kg/m² K8 90 -0.04 -0.71 Frequency % K8 28+90 -2.16 -6.68 Length ‰ K8 28+90 0.22 1.55 Mass kg/m² K8 28+90 0.00 -0.65
Appendix 6.13 – Change on average of fundamental frequency, length and loss of weight of NC mix proportions with 6% air content
Test Sort
Mix Age at start of testing 100 Cycles 300 cycles
Frequency % RO+ ROII 28 -0.86 -36.37 Length ‰ RO+ ROII 28 0.77 2.30 Mass kg/m² RO+ ROII 28 -0.10 -1.18 Frequency % RO+ ROII 90 -10.83 -41.78 Length ‰ RO+ ROII 90 1.32 5.29 Mass kg/m² RO+ ROII 90 -0.10 -1.48 Frequency % RO+ ROII 28+90 -5.85 -39.07 Length ‰ RO+ ROII 28+90 1.05 3.80 Mass kg/m² RO+ ROII 28+90 -0.10 -1.33
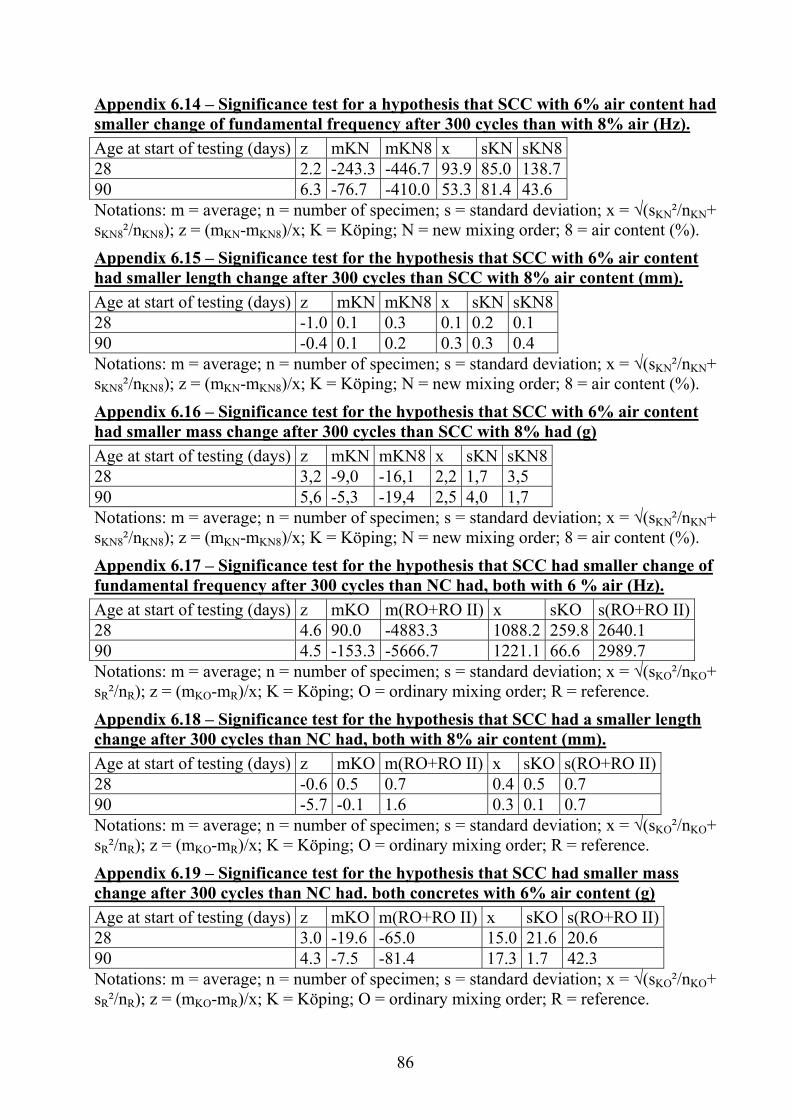
86
Appendix 6.14 – Significance test for a hypothesis that SCC with 6% air content had smaller change of fundamental frequency after 300 cycles than with 8% air (Hz). Age at start of testing (days) z mKN mKN8 x sKN sKN8 28 2.2 -243.3 -446.7 93.9 85.0 138.7 90 6.3 -76.7 -410.0 53.3 81.4 43.6 Notations: m = average; n = number of specimen; s = standard deviation; x = √(sKN²/nKN+ sKN8²/nKN8); z = (mKN-mKN8)/x; K = Köping; N = new mixing order; 8 = air content (%). Appendix 6.15 – Significance test for the hypothesis that SCC with 6% air content had smaller length change after 300 cycles than SCC with 8% air content (mm). Age at start of testing (days) z mKN mKN8 x sKN sKN828 -1.0 0.1 0.3 0.1 0.2 0.1 90 -0.4 0.1 0.2 0.3 0.3 0.4 Notations: m = average; n = number of specimen; s = standard deviation; x = √(sKN²/nKN+ sKN8²/nKN8); z = (mKN-mKN8)/x; K = Köping; N = new mixing order; 8 = air content (%). Appendix 6.16 – Significance test for the hypothesis that SCC with 6% air content had smaller mass change after 300 cycles than SCC with 8% had (g) Age at start of testing (days) z mKN mKN8 x sKN sKN828 3,2 -9,0 -16,1 2,2 1,7 3,5 90 5,6 -5,3 -19,4 2,5 4,0 1,7 Notations: m = average; n = number of specimen; s = standard deviation; x = √(sKN²/nKN+ sKN8²/nKN8); z = (mKN-mKN8)/x; K = Köping; N = new mixing order; 8 = air content (%). Appendix 6.17 – Significance test for the hypothesis that SCC had smaller change of fundamental frequency after 300 cycles than NC had, both with 6 % air (Hz). Age at start of testing (days) z mKO m(RO+RO II) x sKO s(RO+RO II)28 4.6 90.0 -4883.3 1088.2 259.8 2640.1 90 4.5 -153.3 -5666.7 1221.1 66.6 2989.7 Notations: m = average; n = number of specimen; s = standard deviation; x = √(sKO²/nKO+ sR²/nR); z = (mKO-mR)/x; K = Köping; O = ordinary mixing order; R = reference. Appendix 6.18 – Significance test for the hypothesis that SCC had a smaller length change after 300 cycles than NC had, both with 8% air content (mm). Age at start of testing (days) z mKO m(RO+RO II) x sKO s(RO+RO II)28 -0.6 0.5 0.7 0.4 0.5 0.7 90 -5.7 -0.1 1.6 0.3 0.1 0.7 Notations: m = average; n = number of specimen; s = standard deviation; x = √(sKO²/nKO+ sR²/nR); z = (mKO-mR)/x; K = Köping; O = ordinary mixing order; R = reference. Appendix 6.19 – Significance test for the hypothesis that SCC had smaller mass change after 300 cycles than NC had. both concretes with 6% air content (g) Age at start of testing (days) z mKO m(RO+RO II) x sKO s(RO+RO II)28 3.0 -19.6 -65.0 15.0 21.6 20.6 90 4.3 -7.5 -81.4 17.3 1.7 42.3 Notations: m = average; n = number of specimen; s = standard deviation; x = √(sKO²/nKO+ sR²/nR); z = (mKO-mR)/x; K = Köping; O = ordinary mixing order; R = reference.


![Bertil Tungodden - Nordic Journal of Political Economy · Bertil Tungodden * Poverty and Justice: A Rawlsian Framework The World Bank has recently argued that " [n] o tad shodd commanda](https://img.pdfslide.us/doc/110x75/5bc044ad09d3f216668dca8d/bertil-tungodden-nordic-journal-of-political-bertil-tungodden-poverty-and.jpg)