Embed Size (px)
Citation preview
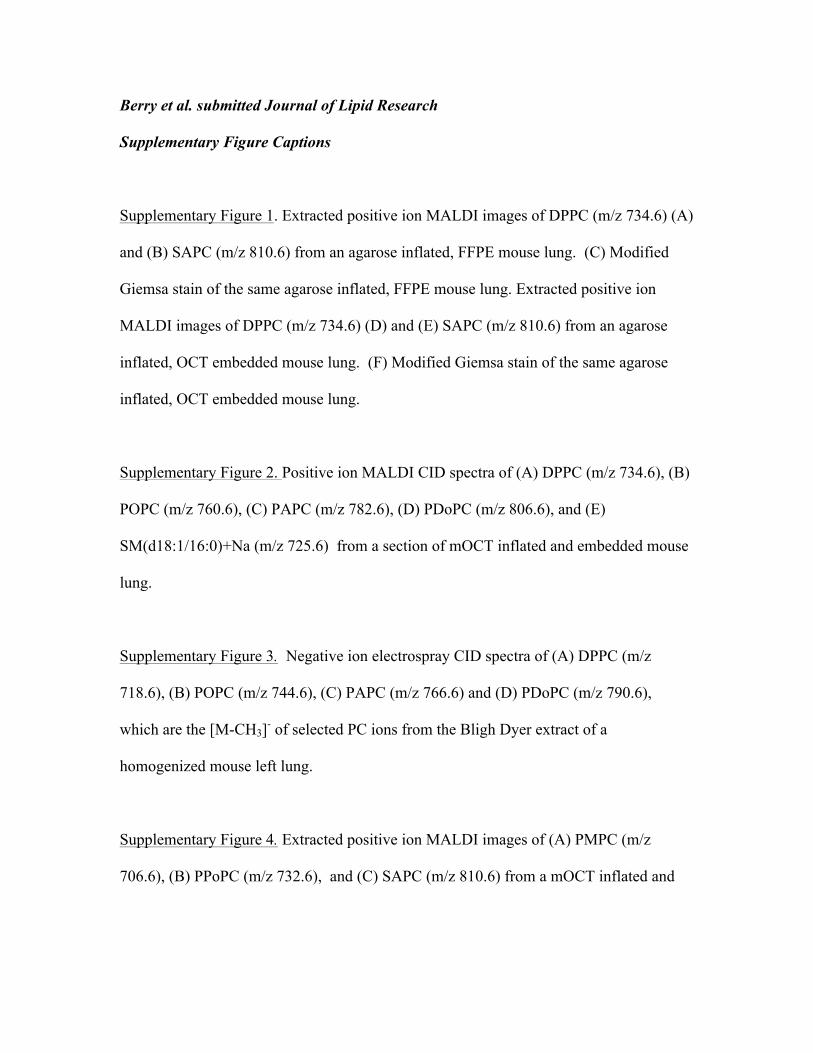
Berry et al. submitted Journal of Lipid Research
Supplementary Figure Captions
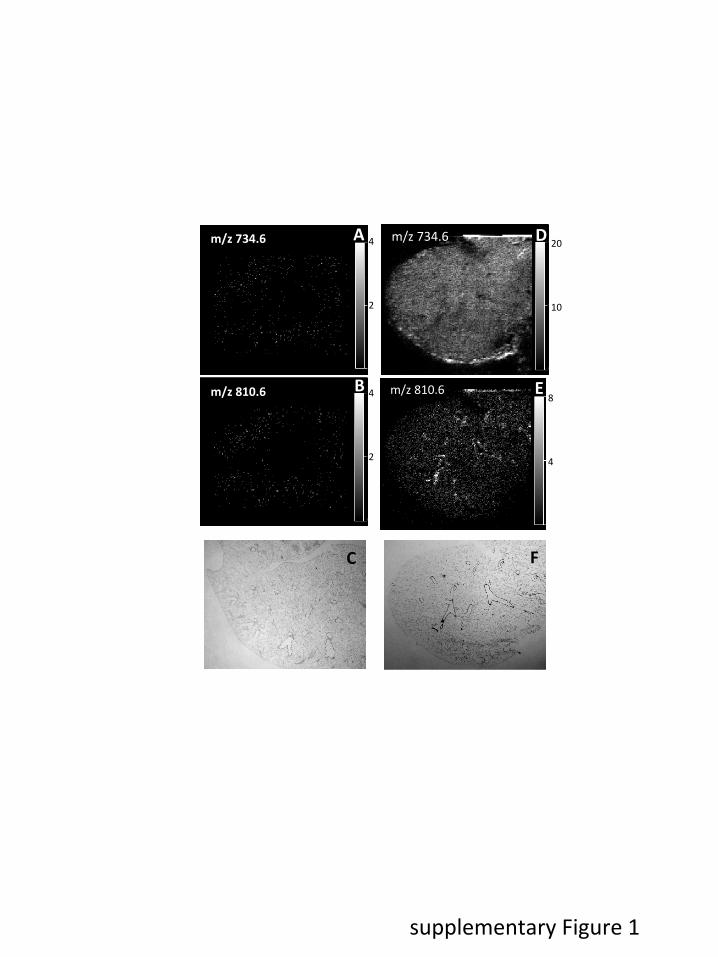
Supplementary Figure 1. Extracted positive ion MALDI images of DPPC (m/z 734.6) (A)
and (B) SAPC (m/z 810.6) from an agarose inflated, FFPE mouse lung. (C) Modified
Giemsa stain of the same agarose inflated, FFPE mouse lung. Extracted positive ion
MALDI images of DPPC (m/z 734.6) (D) and (E) SAPC (m/z 810.6) from an agarose
inflated, OCT embedded mouse lung. (F) Modified Giemsa stain of the same agarose
inflated, OCT embedded mouse lung.
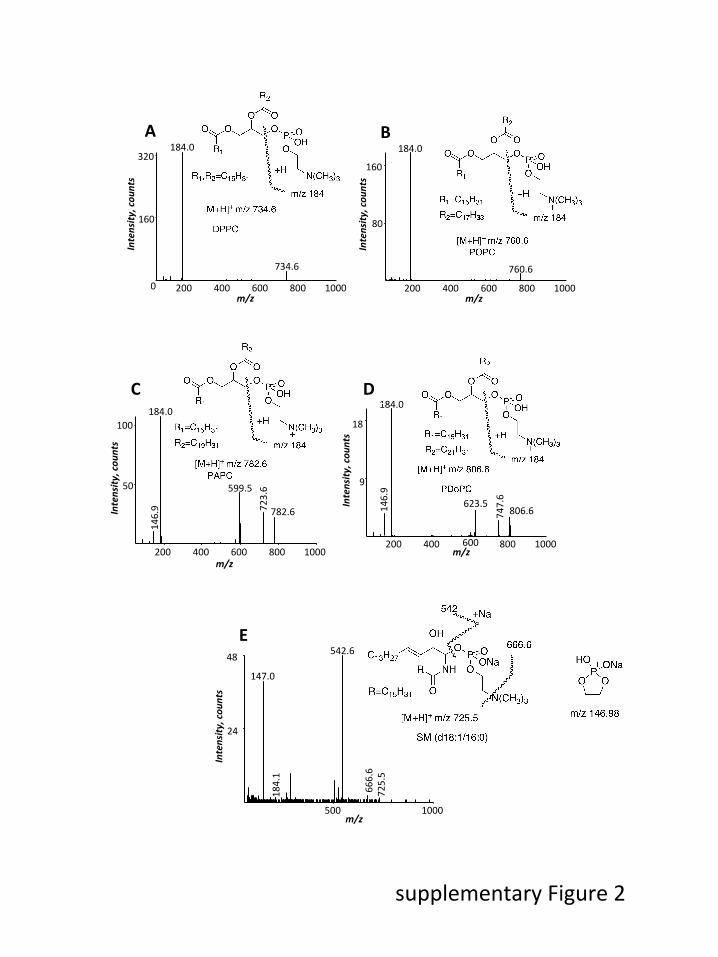
Supplementary Figure 2. Positive ion MALDI CID spectra of (A) DPPC (m/z 734.6), (B)
POPC (m/z 760.6), (C) PAPC (m/z 782.6), (D) PDoPC (m/z 806.6), and (E)
SM(d18:1/16:0)+Na (m/z 725.6) from a section of mOCT inflated and embedded mouse
lung.
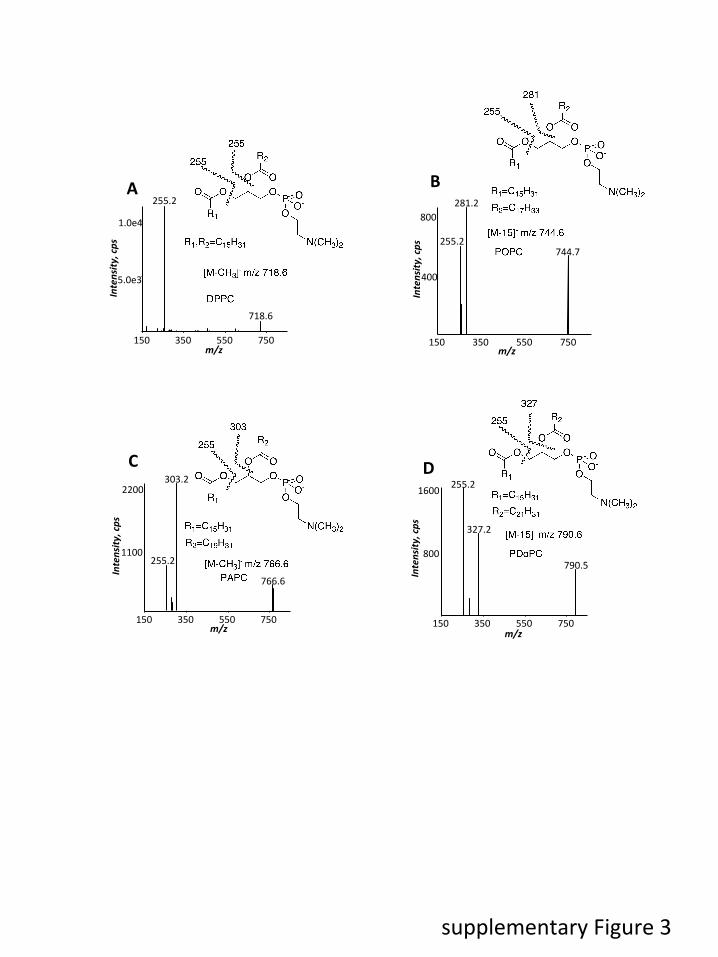
Supplementary Figure 3. Negative ion electrospray CID spectra of (A) DPPC (m/z
718.6), (B) POPC (m/z 744.6), (C) PAPC (m/z 766.6) and (D) PDoPC (m/z 790.6),
which are the [M-CH3]- of selected PC ions from the Bligh Dyer extract of a
homogenized mouse left lung.
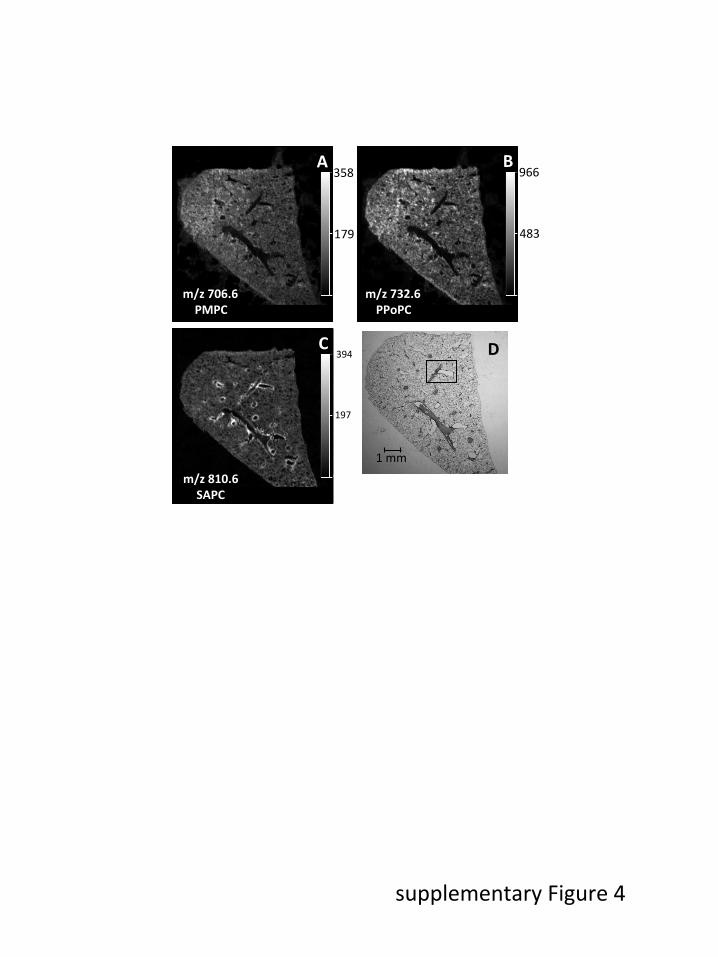
Supplementary Figure 4. Extracted positive ion MALDI images of (A) PMPC (m/z
706.6), (B) PPoPC (m/z 732.6), and (C) SAPC (m/z 810.6) from a mOCT inflated and
embedded mouse lung section. (D) Modified Giemsa stain of the same lung after MALDI
imaging.
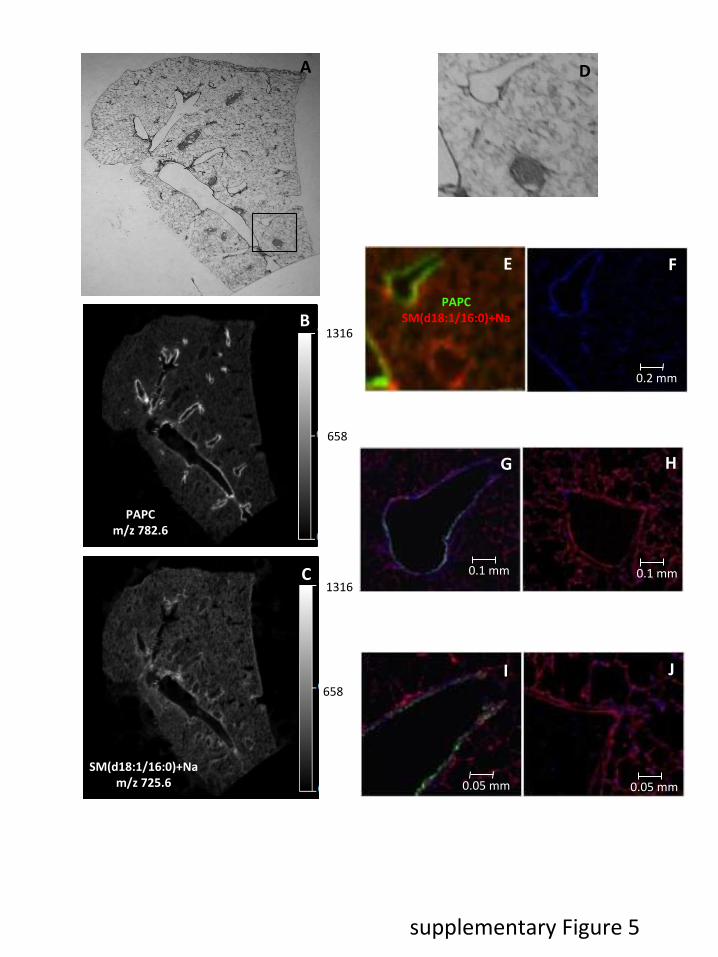
Supplementary Figure 5. (A) Modified Giemsa stain of a section of a mOCT inflated and
embedded mouse lung. Positive ion MALDI image of PAPC (m/z 782.6) (B) and
sodiated SM(d18:1/16:0) (m/z 725.6) (C). (D) Enlargement of the boxed part of the
modified Giemsa stain in panel A. (E) Merged positive ion MALDI image of PAPC
(green) and SM(d18:1/16:0)+Na (red) from the boxed in area in panel A. (F-J)
Increasingly magnified images of an adjacent tissue section illustrating the localization of
airways by acetylated tubulin (ACT, green), blood vessels by thrombomodulin (TM, red)
and cell nuclei by DAPI (blue).
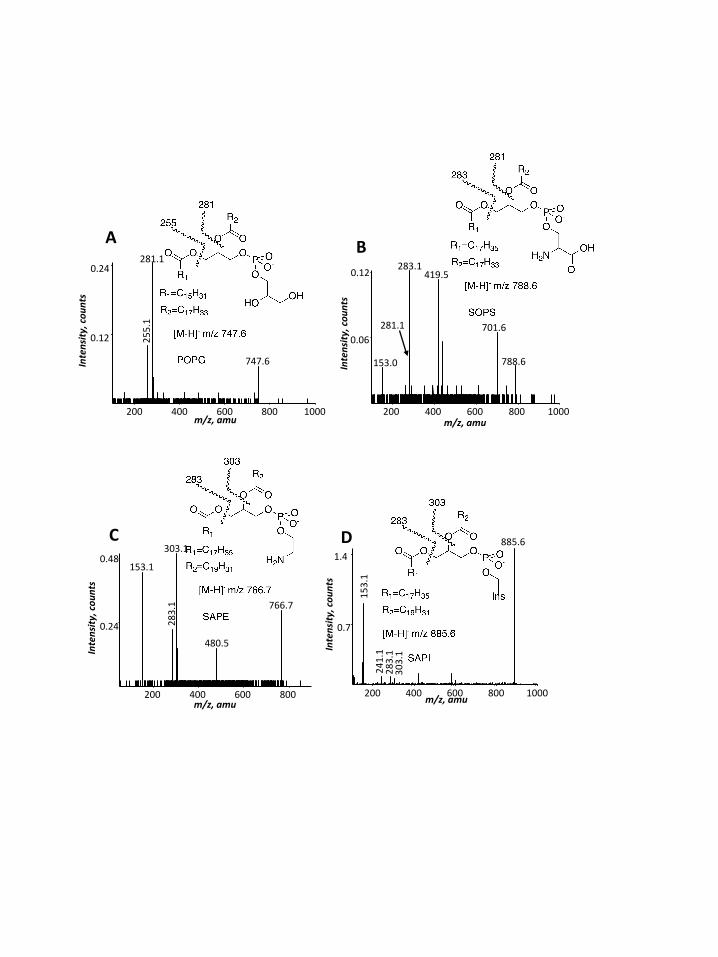
Supplementary Figure 6. Negative ion MALDI CID spectra of (A) POPG (m/z 747.6),
(B) SOPS (m/z 788.6), (C) SAPE (m/z 766.6), and (D) SAPI (m/z 885.6) from a section
of a mOCT inflated and embedded mouse lung.
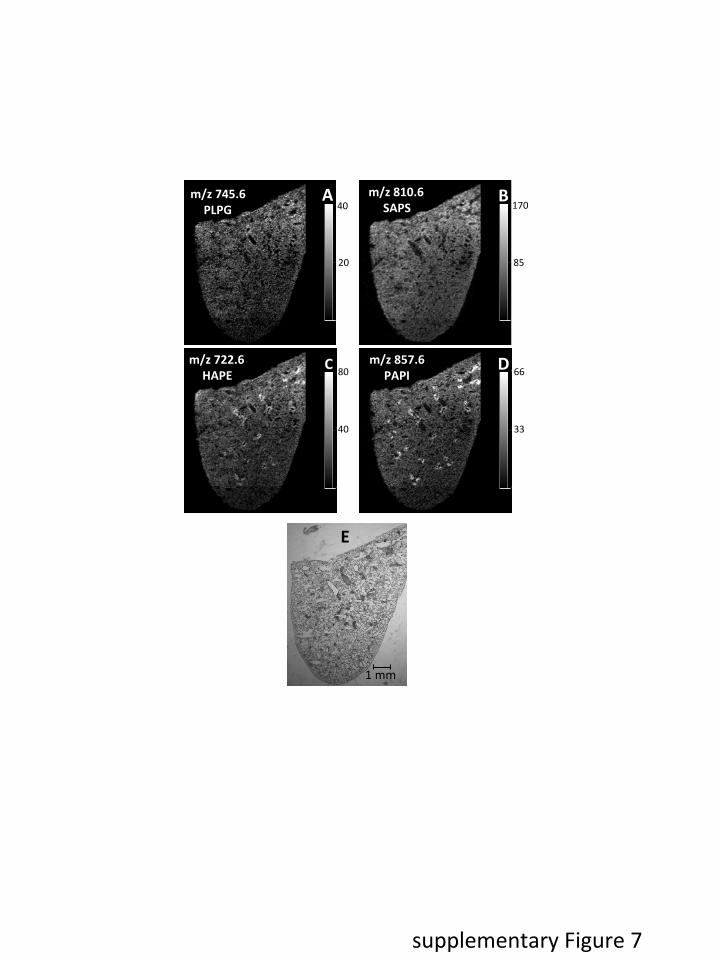
Supplementary Figure 7. Extracted negative ion MALDI images of (A) PLPC (m/z
745.6), (B) SAPS (m/z 810.6), (C) HAPE (m/z 722.6), and (D) PAPI (m/z 857.6) from a
mOCT inflated and embedded mouse lung section. (E) Modified Giemsa stain of the
same lung after MALDI imaging.

supplementary Figure 1
m/z 810.6
4
2
4
2
A
B
C F
D
E
m/z 734.6
m/z 810.6
m/z 734.6 20
10
8
4
supplementary Figure 2
200 400 600 800 1000 m/z
0
160
320
Intensity
, cou
nts
184.0
734.6
A
200 400 600 800 1000 m/z
80
160
Intensity
, cou
nts
184.0
760.6
B
200 400 600 800 1000 m/z
50
100
Intensity
, cou
nts
184.0
599.5
723.6
782.6
146.9
C
500 1000 m/z
24
48
Intensity
, cou
nts
542.6
147.0
666.6
184.1
725.5
E
200 400 600 800 1000 m/z
9
18
Intensity
, cou
nts
184.0
623.5 806.6 74
7.6
D 146.9
supplementary Figure 3
150 350 550 750
400
800
Intensity
, cps
281.2
255.2 744.7
150 350 550 750 m/z
5.0e3
1.0e4
Intensity
, cps
255.2
718.6
A B
150 350 550 750 m/z
1100
2200
Intensity
, cps
303.2
766.6
255.2
C
m/z
150 350 550 750 m/z
800
1600
Intensity
, cps
255.2
327.2
790.5
D
358
179
966
483
A
m/z 706.6 PMPC
B
m/z 732.6 PPoPC
394
197
C
m/z 810.6 SAPC
D
1 mm
supplementary Figure 4
1316
658
1316
658
A
B
C
D
E F
G H
I J
PAPC m/z 782.6
SM(d18:1/16:0)+Na m/z 725.6
PAPC SM(d18:1/16:0)+Na
0.1 mm 0.1 mm
0.05 mm 0.05 mm
0.2 mm
supplementary Figure 5
200 400 600 800 1000 m/z, amu
0.12
0.24
Intensity
, cou
nts
281.1
255.1
747.6
A
200 400 600 800 1000 m/z, amu
0.06
0.12
Intensity
, cou
nts
283.1 419.5
701.6
153.0 788.6
281.1
B
200 400 600 800 1000 m/z, amu
0.7
1.4
Intensity
, cou
nts
885.6
153.1
283.1
303.1
241.1
D
supplementary Figure 6
200 400 600 800 m/z, amu
0.24
0.48
Intensity
, cou
nts
303.1
153.1
766.7
283.1
480.5
C
supplementary Figure 7
1 mm
40
20
A m/z 745.6 PLPG 170
85
B m/z 810.6 SAPS
80
40
C m/z 722.6 HAPE 66
33
D m/z 857.6 PAPI
E