Embed Size (px)
DESCRIPTION
project on Paint industry
Citation preview

www.hemonline.com
BROKING | DEPOSITORY | DISTRIBUTION | FINANCIAL ADVISORY
Company Report
Berger Paints India Ltd 18th
June, 2012
For Private Circulation Only 1 Hem Research
CMP Rs.144.05
Target Price Rs.190.00
BSE Code 509480
NSE Code BERGEPAINT
Market Cap (Rs. Cr.) 4986.34
52 Week High/Low 153.30/78.15
Industry Paints
Face Value Rs.2.00
Shares O/S 346153264
EPS 5.20
Book Value 22.87
P/E 27.70
P/B 6.30
Shareholding Pattern
Research Analyst: Vineeta Mahnot [email protected]
� Berger Paints India Ltd. (BPIL) is one of the India’s foremost
paint companies, currently ranked as second largest on the basis
of consolidated sales turnover in Indian paint industry. It enjoys
about 19 percent share of the over Rs.21,000 crore of the Indian
paint industry.
� The company has registered smart numbers for the quarter
ending March 2012. Revenues from operations stood at Rs. 746.50
crore as against Rs.592.50 crore in the corresponding quarter of
the last year representing an increase of about 26%. Improved
sales performance by subsidiaries and joint ventures boosted
revenue for the quarter together with strong domestic
performance. Operating profit too surged 29.45% in Q4FY12 at
Rs.73.40 crore from Rs.56.70 crore in the like quarter last year. A
comparatively sharp net profit growth of about 32% to Rs.44.60
crores was clocked for the Q4FY12 compared to Rs.33.90 crore of
same quarter previous year. The increase in net profit is due to
improved performance in the emulsion business and growing
presence in the western part of the country. EPS stood at Rs.1.29
compared to Rs.0.98 in the same quarter last year.
� Material cost to sales(%) jumped at 64.3% in quarter ended March
2012 as compared to 62.2% in the corresponding quarter last year.
This increase is attributable to consistent rise in raw material
prices and impact of depreciating rupee on imported raw
materials. Further, there is sustained increase in advertisement
and sales promotion spends in decorative business.
Valuation
With stronger market share, wide distribution network, huge
capacity expansion on stream, better product mix and higher A&SP
spends; Berger Paints India Ltd. growth prospects look promising.
We believe BPIL is trading at an attractive valuation at 22.9x and
19.79x of FY13EPS of Rs.6.29 and FY14EPS of Rs.7.28. We initiate a
‘BUY’ on the stock with a target price of Rs.190 (appreciation of about
32%) with the medium to long term investment horizon.

www.hemonline.com
For Private Circulation Only 2 Hem Research
Business Details
Established in 17th December, 1923, the company then known as Hadfiled's (India) Limited; was a small paint
company based in Kolkata having its only manufacturing facility at Howrah, West Bengal to produce ready mixed
stiff paints, varnishes and distempers. Post independence, towards the end of 1947, British Paints (Holdings) Limited,
U.K acquired Hadfield's (India) Limited and thus British Paints (India) Limited was incorporated. From a production
capacity of 150 tonnes and sales turnover of around Rs. 25 lakhs in 1947, the company has come a long way to become
at one point of time; a part of the worldwide BERGER group in 1983 and thereby acquiring its present name Berger
Paints India Limited to having subsequently gone through further ups & downs as well as ownership changes to gain
its present status wherein the majority stake is with Delhi based Dhingra brothers and business revenue more than Rs
2400 crs.
Today Berger Paints India Limited, having
solely used and developed the name and
trademark BERGER and all its variants in India,
is a household name in paint. It is the third
largest paint manufacturer and second largest
manufacturer in decorative paints. With Head
Office in Kolkata the company manufactures
and markets a range of decorative & industrial
paint products under various product brands
and has it operations spread throughout the
length & breath of the country; with seven
manufacturing facilities in India and more than
85 depots, several regional & area offices,
besides four facilities overseas. It has a
workforce of over 2500 employees and a countrywide distribution network of 15000 plus dealers. The company's
manufacturing facilities are located in West Bengal, Uttar Pradesh, Pondicherry, Goa, and Jammu and Kashmir. The
company has its presence mainly in the Tier II and Tier III cities.
Its subsidiaries are Beepee Coatings, Berger Jenson & Nicholson (Nepal), Berger Paints (Cyprus) and Berger Paints
Overseas. It also acquired 100% stake of Motor and Industrial paints business of ICI India. The company has a joint
venture with Nippon Bee Chemical for manufacturing of coatings for plastic substrates used in automobiles and
mobile phones. It has wide range of colour bank with over 5000 shades. Lewis Berger ColorBank offers computerised
paint technology through its outlets which mixes different shades to create desired paint. It has a network of 2500 such
counters.

www.hemonline.com
For Private Circulation Only 3 Hem Research
Strong Industry growth
The industry size for paints is estimated at over Rs. 21,000 crores wherein the organized sector accounts for 70% while
the remaining is with the unorganized sector comprising of around two thousand small scale paint units. The paint
market is dominated by decorative paints, which accounts for nearly 70% of the total demand. The balance 30%
belongs to industrial paints - comprising automotive and industrial, protective, powder, coil and marine coatings. As
per the data published by the Central Statistical Organisation (CSO), paints production fell in four months and
remained subdued in six months for 2011-12. Paints industry’s aggregate production for 2011-12 rose by a mere 0.5 per
cent. However, the industry’s sales rose by a sharp 29.6 per cent during the year.
Paint production to remain healthy in 2012-14
Units 2008-09 2009-10 2010-11 2011-12(E) 2012-13(E) 2013-14(E)
Capacity Tonnes 12,72,151 14,14,607 15,46,459 17,15,014 23,67,014 27,38,514 Production Tonnes 10,07,606.1 11,85,195.6 13,52,465.8 15,11,275.3 17,12,274.9 19,69,116.1 Sales Tonnes 11,15,159.2 12,85,816.4 14,85,665.2 16,78,624.2 19,06,917.1 22,01,535.8 Export Rs.crore 147.6 216.0 223.5 251.2 291.4 312.1 Import Rs. crore 837.7 816.0 992.4 1,151.5 1,420.2 1,623.4 Realisation Rs./tonne 1,00,514.7 98,911.2 99,636.1 1,07,407.7 1,15,355.9 1,21,700.5 Sales Rs. crore 11,209.0 12,718.2 14,802.6 18,029.7 21,997.4 26,792.8 Domestic market value
Rs.crore 11,899.1 13,318.2 15,571.5 18,930.0 23,126.2 28,104.1
Source: CMIE
CMIE expects the production to grow by 13.3 per cent in 2012-13. The production is further expected to increase by 15
per cent in 2013-14 to around 19.6 lakh tonnes. Sales volumes are likely to remain higher than the production volumes
as some companies undertake trading alongwith manufacturing. The sales volumes are expected to grow by 14-15 per
cent per annum during 2012-14 period and are likely to cross 20 lakh tonnes by March 2014.
This healthy rise in volumes will be owing to an expected increase in the demand for both decorative and industrial
paints. Of the total demand for paints, 70 per cent comes from the decorative segment. Of this, demand for
refurbishment (repainting of existing houses) accounts for around 65 per cent. Taking into account the rising consumer
demand and diversified needs, the paint companies are coming out with new variants of paints. Also, the companies
are spending more on advertisement to tap these consumers. These initiatives are expected to increase the demand
from refurbishment.

www.hemonline.com
For Private Circulation Only 4 Hem Research
Additionally, the number of projects scheduled for completion in the real estate segment is increasing. Projects worth
around Rs.67,000 crore are expected to be completed in the real estate sector in 2012-14 as compared to Rs.31,500 crore
invested during 2010-12. This will lead to an increase in the demand for fresh painting as well.
Demand for industrial paints is derived mainly from the automobile sector. The demand remained subdued in the
previous year but the automobile production is expected to gain pace in the coming two years. Volumes for passenger
cars are likely to increase by 11-14 per cent during 2012-14. Commercial vehicles production is expected to grow by
around 8-13 per cent per annum during this period. This will increase the demand for industrial paints. Further, the
demand for protective coatings, high performance coatings and other industrial coatings from various user industries
is also expected to rise aiding the growth for industrial paints.
The paints industry is set for huge capacity expansion during
the year 2012-13. Around 6.5 lakh tonnes capacity is expected
to be added during the year. The overall cost for this
expansion is estimated to be Rs.1,700 crore spread over eight
projects. Further in 2013-14, five projects with investment of
Rs.1,253 crore are slated for completion. This will increase
the industry’s capacity by 3.7 lakh tonnes.
The industry’s sales rose by a robust 29.6 per cent in the year
2011-12. This growth is a combination of higher volumes as
well as improved realisations. Raw material expense
remained on the higher side owing to the increase in the
prices of crude oil and titanium dioxide during the year. This faster 32 per cent rise in the raw material costs as
compared to sales resulted into an 150 basis points contraction in the operating profit from core operations. The
operating margin stood at 13.5 per cent. The PAT margin shrunk by 80 basis points to 9.6 per cent during the year.
CMIE expects the industry’s sales to grow by a healthy 22.1 per cent in the year 2012-13. This growth will be a result of
both higher volumes and improved realisations. Volumes are expected to increase by 14-15 per cent and the
realizations are likely to rise by around 6-7 per cent during the year. Realisations are expected to rise as the paint
companies have taken price hikes to pass on the rising input costs. Raw material-to-sales ratio is expected to expand
by 70 basis points. This will be on account of rising input prices and depreciation of rupee against the USD as around
25 per cent of the industry’s raw materials are imported. Thus, the industry’s profit margins are likely to contract by
30-40 basis points. The core operating profit margin is expected to be at 13.2 per cent and the net margin at 9.2 per cent
during the year.
www.hemonline.com
For Private Circulation Only 5 Hem Research
Strong Capacity expansion plans
BPIL has large capacity expansion plans and is well on track to
complete those projects. The 60000 MT Brownfield capacity
expansion in Decorative paints at Rishra, West Bengal is
progressing well, with first phase of 22000 MT already
completed. Its Tamil Nadu Paints project is scheduled for
completion in June 2012. The 60000 MT brown field expansions
at Goa is also progressing well, with first phase of 21600 MT
capacity already added. Greenfield project at Hindupur in AP
with an investment of Rs.200 crore would add new capacity of
320000 MT in decorative paints. All necessary approvals are in
place and the commercial production is expected to start in
FY13. The company plans to double the production capacity
from the present 2.5 million tonnes by 2013. The company
expects the Russian operations to breakeven in FY13 instead of
the projections of FY12 earlier. Company’s construction chemical
business is poised to grow well in coming years and is expected
to reach the sales target of Rs.100 crore in next three years time.
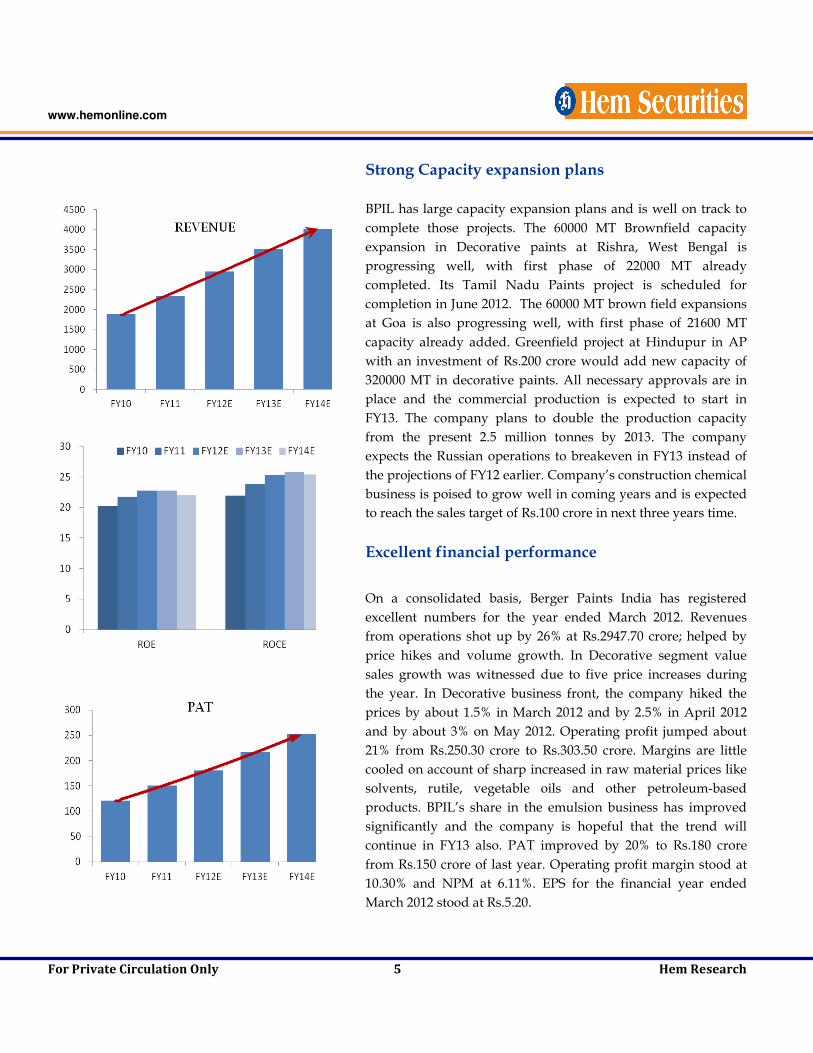
Excellent financial performance
On a consolidated basis, Berger Paints India has registered
excellent numbers for the year ended March 2012. Revenues
from operations shot up by 26% at Rs.2947.70 crore; helped by
price hikes and volume growth. In Decorative segment value
sales growth was witnessed due to five price increases during
the year. In Decorative business front, the company hiked the
prices by about 1.5% in March 2012 and by 2.5% in April 2012
and by about 3% on May 2012. Operating profit jumped about
21% from Rs.250.30 crore to Rs.303.50 crore. Margins are little
cooled on account of sharp increased in raw material prices like
solvents, rutile, vegetable oils and other petroleum-based
products. BPIL’s share in the emulsion business has improved
significantly and the company is hopeful that the trend will
continue in FY13 also. PAT improved by 20% to Rs.180 crore
from Rs.150 crore of last year. Operating profit margin stood at
10.30% and NPM at 6.11%. EPS for the financial year ended
March 2012 stood at Rs.5.20.

www.hemonline.com
For Private Circulation Only 6 Hem Research
Consolidated Profit & Loss Account Rs. Crore
Particulars FY10 FY11 FY12 FY13E FY14E
Net sales 1891.30 2340.70 2947.70 3507.76 4016.39
Growth 23.76% 25.93% 19.00% 14.50%
Expenditure 1692.17 2090.40 2644.20 3139.45 3590.65
EBITDA 199.14 250.30 303.50 368.32 425.74
Growth 25.69% 21.25% 21.36% 15.59%
EBITDA margin 10.53% 10.69% 10.30% 10.50% 10.60%
Other income 25.89 30.20 30.50 34.38 38.16
Depreciation & Amortization 35.82 40.10 47.20 54.04 62.36
EBIT 189.21 240.40 286.80 348.65 401.53
EBIT margin 10.00% 10.27% 9.73% 9.94% 10.00%
Interest 17.20 24.30 32.30 37.87 41.47
PBT 172.01 216.10 254.50 310.78 360.06
Tax 51.62 66.00 74.40 93.23 108.02
PAT 120.39 150.10 180.10 217.55 252.04
Minority interest/Share of JV/Associates 0.00 0.00 0.00 0.00 0.00
Adjusted PAT 120.39 150.10 180.10 217.55 252.04
Growth 24.68 19.99 20.79 15.86
Net Profit margins 6.37 6.41 6.11 6.20 6.28
Extraordinary item 0.00 0.00 0.00 0.00 0.00
Reported PAT 120.39 150.10 180.10 217.55 252.04
Equity Capital 69.21 69.20 69.20 69.20 69.20
Res. & Surplus 527.25 620.30 722.30 887.94 1,077.69
Equity Shares 34.61 34.61 34.61 34.61 34.61
EPS 3.48 4.34 5.20 6.29 7.28
Ratios
Particulars FY10 FY11 FY12 FY13E FY14E
Return on Equity 20.18 21.77 22.75 22.73 21.98
Return on Capital employed 21.90 23.88 25.32 25.72 25.36
Debt/Equity 0.45 0.46 0.43 0.42 0.38
Current Ratio 1.84 2.05 1.92 1.97 2.08
Cash per share 1.19 3.62 5.27 6.44 8.30
Book value per share 17.24 19.92 22.87 27.66 33.14

www.hemonline.com
For Private Circulation Only 7 Hem Research
Balance Sheet
Rs. Crore
Particulars FY10 FY11 FY12 FY13E FY14E
Share Capital 69.21 69.20 69.20 69.20 69.20
Reserves & Surplus 527.25 620.30 722.30 887.94 1,077.69
Shareholders’ funds 596.47 689.50 791.50 957.14 1146.89
Borrowings 267.37 317.30 341.00 398.61 436.56
Foreign Currency Translation Diff acc 0.02 0.00 0.00 0.00 0.00
Deferred tax Liability 26.42 26.30 31.20 31.20 31.20
Sources of funds 890.28 1033.10 1163.70 1386.95 1614.65
Gross block 675.66 721.59 818.13 948.04 1056.94
Accumulated Depreciation 246.19 286.29 333.49 387.53 449.89
Net block 429.47 435.30 484.64 560.51 607.05
Capital work in progress 32.60 81.80 98.16 122.22 145.86
Goodwill 0.00 0.00 0.00 0.00 0.00
Investments 128.16 55.80 9.90 18.01 33.05
Projects in progress 0.00 0.00 0.00 0.00 0.00
Inventories 329.86 443.80 554.40 627.13 718.19
Sundry debtors 242.32 272.80 358.60 418.09 446.88
Cash and bank balance 41.26 125.30 182.40 222.98 287.28
Other current assets 0.00 0.00 0.00 0.00 0.00
Loans and advances 43.23 55.30 98.70 125.43 143.64
Total current assets 656.67 897.20 1,194.10 1,393.62 1,595.99
Deferred tax asset 0.00 0.00 0.00 0.00 0.00
Current liabilities and provisions 356.61 437.00 623.10 707.42 767.30
Net current assets 300.05 460.20 571.00 686.20 828.69
Misc exp 0.00 0.00 0.00 0.00 0.00
Uses of funds 890.28 1,033.10 1,163.70 1,386.95 1,614.65

www.hemonline.com
For Private Circulation Only 8 Hem Research
Cash Flow Statement
Rs. Crore
Particulars FY11 FY12 FY13E FY14E
PAT 150.10 180.10 217.55 252.04
Depreciation 40.10 47.20 54.04 62.36
Interest 24.30 32.30 37.87 41.47
Direct Taxes Paid 66.00 74.40 93.23 108.02
Change in WC (76.11) (53.70) (74.62) (78.19)
Other Operating Activities 0.00 0.00 0.00 0.00
CF from Operations (a) 138.39 205.90 234.84 277.69
Capital expenditure (95.14) (112.90) (153.97) (132.54)
Chg in investments 72.36 45.90 (8.11) (15.04)
Other investing activities 0.00 0.00 0.00 0.00
CF from investing (b) (22.77) (67.00) (162.09) (147.58)
Free Cash flow (a+b) 115.62 138.90 72.75 130.11
Equity raised/(repaid) -0.01 0.00 0.00 0.00
Debt raised/(repaid) 49.79 28.60 57.61 37.95
Interest paid (24.30) (32.30) (37.87) (41.47)
Dividend(inctax) (44.99) (48.45) (51.91) (62.29)
other financing activities (12.06) (29.65) 0.00 (0.00)
CF from financing © (31.58) (81.80) (32.17) (65.81)
Net chg in cash (a+b+c) 84.04 57.10 40.58 64.30
www.hemonline.com
For Private Circulation Only 9 Hem Research
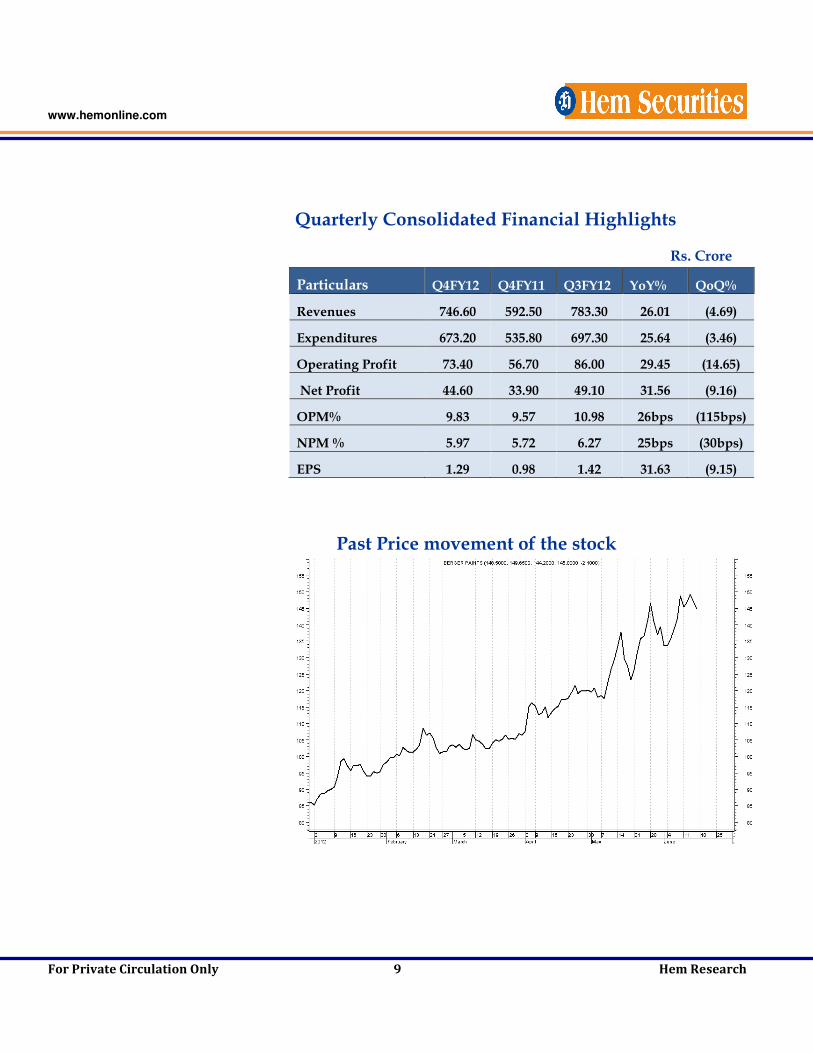
Quarterly Consolidated Financial Highlights
Rs. Crore
Particulars Q4FY12 Q4FY11 Q3FY12 YoY% QoQ%
Revenues 746.60 592.50 783.30 26.01 (4.69)
Expenditures 673.20 535.80 697.30 25.64 (3.46)
Operating Profit 73.40 56.70 86.00 29.45 (14.65)
Net Profit 44.60 33.90 49.10 31.56 (9.16)
OPM% 9.83 9.57 10.98 26bps (115bps)
NPM % 5.97 5.72 6.27 25bps (30bps)
EPS 1.29 0.98 1.42 31.63 (9.15)
Past Price movement of the stock

www.hemonline.com
For Private Circulation Only 10 Hem Research
www.hemonline.com
HEM SECURITIES LIMITED
MEMBER-BSE,CDSL, SEBI REGISTERED CATEGORY I MERCHANT BANKER
MUMBAI OFFICE: 14/15, KHATAU BLDG., IST FLOOR, 40, BANK STREET, FORT, MUMBAI-400001
PHONE- 0091 22 2267 1000 FAX- 0091 22 2262 5991
JAIPUR OFFICE: 203-204, JAIPUR TOWERS, M I ROAD, JAIPUR-302001
PHONE- 0091 141 405 1000 FAX- 0091 141 510 1757
GROUP COMPANIES
HEM FINLEASE PRIVATE LIMITED MEMBER-NSE
HEM MULTI COMMODITIES PRIVATE LIMITED MEMBER-NCDEX, MCX
HEM FINANCIAL SERVICES LIMITED
NBFC REGISTERED WITH RBI

www.hemonline.com
For Private Circulation Only 11 Hem Research
Disclaimer & Disclosure: This document is prepared for our clients only, on the basis of publicly available information
and other sources believed to be reliable. Whilst we are not soliciting any action based on this information, all care
has been taken to ensure that the facts are accurate, fair and reasonable. This information is not intended as an offer
or solicitation for the purchase or sell of any financial instrument and at any point should not be considered as an
investment advise. Reader is requested to rely on his own decision and may take independent professional advise
before investing. Hem Securities Limited, Hem Finlease Private Limited, Hem Multi Commodities Pvt. Limited,
Directors and any of its employees shall not be responsible for the content. The person accessing this information
specifically agrees to exempt Hem Securities Limited, Hem Finlease Private Limited, Hem Multi Commodities Pvt.
Limited or any of its affiliates or employees from, any and all responsibility/liability arising from such misuse and
further agrees to hold Hem Securities Limited, Hem Finlease Private Limited, Hem Multi Commodities Pvt. Limited or
any of its affiliates or employees free and harmless from all losses, costs, damages, expenses that may be suffered by
the person accessing this information due to any errors and delays. The companies and its affiliates, officers, directors,
and employees, including persons involved in the preparation or issuance of this material may from time to time, have
long or short positions in, and buy or sell the securities there of, company (ies) mentioned here in and the same have
acted upon or used the information prior to, or immediately following the publication.
Analyst Certification
The views expressed in this research report accurately reflect the personal views of the analyst(s) about the subject
securities or issues, and no part of the compensation of the research analyst(s) was, is, or will be directly or indirectly
related to the specific recommendations and views expressed by research analyst(s) in this report.
Disclosure of Interest Statement Company Name
1. Analyst Ownership of the Stock No
2. Hem & its Group Company Ownership of the Stock No
3. Hem & its Group Companies’ Director Ownership of the Stock No
4. Broking relationship with company covered No


