Embed Size (px)
Citation preview
SEMMELWEIS UNIVERSITY DOCTORAL SCHOOL OF PHARMACEUTICAL SCIENCES
INFLUENCE OF DIABETES ON CYTOCHROME P450 ENZYME
MEDIATED DRUG METABOLISM – CASE STUDIES ON
DICLOFENAC AND K-48
Ph.D. Thesis
BERNADETT BENKŐ
Gedeon Richter Plc. Division of Drug Safety and Pharmacology
In Vitro Metabolism Laboratory
Supervisor: Dr. Károly Tihanyi, C.Sc., Ph.D.
Reviewers: Dr. Zsuzsanna Veres, Ph.D., D.Sc Dr. Pál Perjési, C.Sc., Ph.D., habil
Final exam Committee: Dr. Krisztina Takács-Novák, D.Sc. (Chair) Dr. Imre Klebovich, D.Sc. Dr. Katalin Monostory, Ph.D.
Budapest 2008
2
TABLE OF CONTENTS
ABBREVIATIONS ....................................................................................................................................4 1. INTRODUCTION ............................................................................................................................6
1.1. DRUG METABOLISM ............................................................................................................6 1.2. THE CYTOCHROME P450 ENZYME SYSTEM....................................................................8
1.2.1. Regulation of the cytochrome P450 enzyme system............................................................12 1.2.2. Intestinal cytochrome P450 enzyme system........................................................................15
1.3. FLAVIN-CONTAINING MONOOXYGENASE ENZYMES ...............................................18 1.4. IN VITRO STUDIES TO ASSESS THE FUNCTION OF CYPS ............................................20 1.5. CHANGES OF CYTOCHROME P450 FUNCTION IN DIABETES.....................................21
1.5.1. Streptozotocin induced diabetes model...............................................................................21 1.5.2. Effect of streptozotocin induced diabetes and insulin treatment on the hepatic
monooxygenase enzymes ....................................................................................................23 1.5.3. Effect of streptozotocin induced diabetes and insulin treatment on the intestinal
cytochrome P450s...............................................................................................................26 1.6. OVERVIEW OF THE SUBSTRATES STUDIED..................................................................27
1.6.1. Metabolism of NSAID drug, Diclofenac .............................................................................27 1.5.2. The organophosphate antidote, K-48 .................................................................................29
2. RESEARCH OBJECTIVES ..........................................................................................................32 3. MATERIALS AND METHODS ...................................................................................................34
3.1. MATERIALS..........................................................................................................................34 3.2. ANIMALS AND INDUCTION OF DIABETES.....................................................................35
3.2.1. Model for intestinal metabolism studies .............................................................................35 3.2.2. Model for hepatic metabolism studies ................................................................................35
3.3. PREPARATION OF INTESTINAL AND HEPATIC MICROSOMES..................................36 3.4. ENZYMATIC ASSAYS .........................................................................................................37
3.4.1. CYP1A index reaction: Phenacetin O-dealkylation ...........................................................37 3.4.2. CYP2B/3A index reaction: Aminopyrine N-demethylation.................................................38 3.4.3. CYP2C index reactions: Tolbutamide and mephenytoin 4’-hydroxylation ........................38 3.4.4. CYP2D index reaction: Bufuralol 1’-hydroxylation...........................................................39 3.4.5. CYP2E1 index reaction: Chlorzoxazone 6-hydroxylation ..................................................40 3.4.6. CYP3A index reaction: Testosterone 6ß-hydroxylation......................................................40 3.4.7. FMO index reaction: Benzydamine N-oxygenation............................................................41
3.5. DETERMINATION OF MRNA EXPRESSION .....................................................................41 3.6. WESTERN BLOT ANALYSIS OF CYP2C11 PROTEIN LEVEL.........................................43 3.7. INCUBATION CONDITIONS FOR THE DETERMINATION OF DICLOFENAC 4’-
HYDROXYLASE ENZYME KINETIC PARAMETERS......................................................43 3.8. IN SILICO, IN VITRO AND IN VIVO STUDIES OF K-48 ...................................................44
3.8.1. In silico prediction of K-48 metabolism .............................................................................44 3.8.2. Incubation conditions of in vitro microsomal metabolism study ........................................44 3.8.3. In vivo animal studies .........................................................................................................45 3.8.4. HPLC analysis....................................................................................................................46
3.9. DATA ANALYSIS .................................................................................................................47 4. RESULTS ........................................................................................................................................48
4.1. EFFECT OF DIABETES AND INSULIN TREATMENT ON INTESTINAL P450S ............48 4.1.1. Physical and biochemical characteristics ..........................................................................48 4.1.2. Intestinal total cytochrome P450 content and CYP3A catalytic activity ............................49
4.2. EFFECT OF DIABETES AND INSULIN TREATMENT ON HEPATIC CYTOCHROME P450S.......................................................................................................................................50
4.2.1. Physical and biochemical characteristics ..........................................................................50 4.2.2. Results of mRNA expression studies ...................................................................................51 4.2.3. Results of Western blot analysis .........................................................................................56

3
4.2.4. Total P450 content and catalytic activities of hepatic CYP and FMO isoenzymes ............56 4.3. METABOLISM OF DICLOFENAC IN EXPERIMENTAL DIABETES ..............................59 4.4. RESULTS OF K-48 METABOLISM STUDY........................................................................60
4.4.1. In silico prediction..............................................................................................................60 4.4.2. In vitro microsomal metabolism assessment ......................................................................60 4.4.3. Results of in vivo study .......................................................................................................62
5. DISCUSSION..................................................................................................................................64 5.1. EXPERIMENTAL DIABETIC MODEL ................................................................................64 5.2. CHANGED INTESTINAL TOTAL CYP CONTENT AND CYP3A ACTIVITY IN
DIABETES..............................................................................................................................65 5.3. CHANGES IN HEPATIC CYTOCHROME P450S IN DIABETES .......................................67 5.4. CYP2C SUBFAMILY AND DICLOFENAC METABOLISM IN DIABETES .....................69 5.5. METABOLISM, DISPOSITION AND ELIMINATION OF K-48 .........................................72
6. CONCLUSION ...............................................................................................................................75 7. SUMMARY .....................................................................................................................................78 8. ÖSSZEFOGLALÁS........................................................................................................................79 9. PUBLICATIONS............................................................................................................................80 10. ACKNOWLEDGEMENT.........................................................................................................82 11. REFERENCES...........................................................................................................................83

4
ABBREVIATIONS ADME adsorption, distribution, metabolism, elimination ADP adenosine diphosphate AGGTCA adenine-guanine-guanine-thymine-cytosine-adenine AhR aryl hydrocarbon receptor Ala alanine (amino acid) Amu atomic mass unit Arg arginine (amino acid) Arnt aryl hydrocarbon receptor nuclear translocator Asn asparagine (amino acid) ATP adenosine triphosphate AUC area under the plasma concentration-time curve BBB blood brain barrier BZY benzydamine BZYNO benzidamine N-oxide Ca2+ calcium ion cAMP cyclic adenosine monophosphate CAR constitutive androstane receptor cDNA complementary deoxyribonucleic acid CL clearance CLint intrinsic clearance CLnr nonrenal clearance CLr renal clearance CSF cerebrospinal fluide Ct threshold cycle CYP cytochrome P450 D55 55 mg/kg streptozotocin treated diabetic rats D70 70 mg/kg streptozotocin treated diabetic rats DAB 3,3'-diaminobenzidine DNA deoxyribonucleic acid EDTA ethylenediamine-tetraacetic acid FAD flavin adenine dinucleotide FMO flavin-containing monooxygenase FXRα farnesoid x receptor GADPH glyceraldehyde-3-phosphate dehydrogenase Gly glycine (amino acid) GR glucocorticoid receptor GRE glucocorticoid response element HNF-1α hepatic nuclear factor – 1α HNF-4α hepatic nuclear factor – 4α HPLC high performance liquid chromatography HPLC-ECD high performance liquid chromatography with electrochemical
detector HPLC-MS high performance liquid chromatography with mass spectrometry i.m. intramuscular i.p. intraperitoneal ID55 insulin treated 55 mg/kg streptozotocin induced diabetic rats

5
ID70 insulin treated 70 mg/kg streptozotocin induced diabetic rats IDDM insulin-dependent diabetes mellitus KM Michaelis constant LXRα liver X receptor α Lys lysine (amino acid) MGB minor groove binder mRNA messenger ribonucleic acid NADPH nicotinamide adenine dinucleotide phosphate, reduced NIDDM non-insulin-dependent diabetes mellitus NSAID non-steroidal anti-inflammatory drug OP organophosphonates p.o. per os P450 cytochrome P450 PACER pyridinium aldoxime cholinesterase reactivator PAH polycyclic aromatic hydrocarbon PCN pregnenolon 16-carbonitrile PKA cAMP dependent protein kinase A PMSF phenylmethanesulphonyl fluoride PPARα peroxisome proliferator activated receptor α PXR pregnane X receptor RAR retinoic acid receptor RNA ribonucleic acid RQ relative quantitation RT retention time RXRα retinoid X receptor α S.D. standard deviation SIM single ion monitoring STZ streptozotocin TBS Tris buffer solution TCA trichloroacetic acid TCDD 2,3,7,8-tetrachlorodibenzo –p-dioxin TRIS tris hydroxymethyl aminomethane Tyr tyrosine (amino acid) VDR vitamin D receptor Vmax maximum velocity Vss volume of distribution at steady state YY1 zinc finger protein

6
1. INTRODUCTION
In the process of drug candidate screening and development in vitro drug
metabolism studies are aimed at the evaluation of the potential for metabolism based
drug interactions. The bioavailability of orally administered drugs is determined mainly
by the first pass effect of the liver; however, the barrier function of the small intestine is
also essential. Any alteration in the metabolising capacity of the liver and intestine may
increase the incidence of altered biotransformation of drugs. Sex, age, nutrition,
endogenous compounds (e.g., hormones), genetic polymorphism and other xenobiotics
have effects on the metabolism. Furthermore, the adverse effect of drugs can also be
caused by altered hepatic or intestinal P450 mediated drug metabolism in pathological
conditions.1 Diabetes mellitus is a complex metabolic disorder which produces serious
complications during the course of the disease and also changes in the drug
metabolising enzyme expression and activity of the intestine and the liver.2,3,4,5,6,7,8,9,10
The altered biotransformation capacity of diabetic intestine or liver due to inhibition,
inactivation or induction of the enzymes can result in altered drug exposures. Therefore,
studying both intestinal and hepatic drug metabolising systems in diabetes is of great
importance.
The altered biotransformation and pharmacokinetic of drugs in diabetes have not
been investigated in dept. Nowadays, when the drug therapy endeavours to adjust to the
individual needs, addressing the genetic polymorphism and phenotypical differences, it
is surprising that the potential effect of diabetes on drug bioavailability is somewhat
neglected, especially given the fact that such individuals often receive multiple and
lifelong therapies. This study concentrates on the metabolism of diclofenac which is a
clinically used NSAID drug and on K-48 which is a promising antidote on the basis of
preclinical studies in organophosphate intoxication.
1.1. DRUG METABOLISM
Xenobiotics entering into the living organism are usually lipophilic. This
property facilitates their transport through the membranes of high lipid content.
Lipophilicity, however, is not an advantage from the aspect of elimination; therefore,
7
the organism transforms foreign compounds by enzymatic reactions to increase their
polarity, and water solubility. The pharmacological activity of the drugs is usually
changed as a consequence of biotransformation, although this does not necessarily mean
a reduced efficacy. Metabolism may potentially lead to either drug activation, or
inactivation, and it may also be responsible for the development of toxic side effects.
Irrespective of the pharmacological outcome, metabolism makes drugs usually more
hydrophilic.11,12,13,14
Metabolic enzymes can be classified in two main groups: the enzymes catalysing
phase I reactions generally participate in oxidative transformations, mostly
hydroxylation and dealkylation, however, they may catalyse reduction and hydrolysis,
too. The pharmacological activity of compounds usually decreases but it can also
increase or remain unchanged in phase I reactions. Phase II enzymes catalyse
conjugation reactions characterized by the coupling of an endogenous, polar small
molecule (glucuronic acid, sulphate, glutathione, etc.) to the functional groups or
moieties already present in the parent compound or created in phase I reactions. The
majority of phase II reactions lead to reduced pharmacological activity.12,14 It may also
happen that the parent drug is eliminated, without being metabolised, via excretion in an
unchanged form.
In addition to the classical phase I and II reactions, phase III processes can also
be mentioned. These are transport processes with the involvement of carrier proteins
transporting both endogenous and exogenous compounds and playing a decisive role in
the ADME profile of drugs. Although in the sense of the classical definition transport
processes do not qualify as metabolic reactions, yet on account of their importance
comparable to those of the other two phases, they are often referred to as phase III
processes in the literature.13
The drugs entering the human organism are primarily metabolised in the liver.
The greatest variety and amount of metabolic enzymes are localised here. Nevertheless,
metabolising enzymes can be found in other organs, as well. The organs to be
mentioned in this respect are mainly those through which xenobiotics may enter the
organism („gate organs”): the gastrointestinal tract, the lungs and the skin and mucous
membranes. Certain other organs such as the kidneys, the brain, the pancreas, the
spleen, the adrenals, the testis and the ovary are also known to contain drug

8
metabolising enzymes; even the placenta has the means needed for the
biotransformations of xenobiotics.15 It is common for orally administered drugs to
undergo biotransformation in the gastrointestinal tract and in the liver before they can
reach the systemic circulation. This phenomenon is termed first-pass effect, and it may
play a decisive role with respect to the systemic bioavailability of orally applied
medicinal products.13 The most obvious evidence for the extrahepatic metabolism of a
drug is the systemic clearance value exceeding the hepatic blood flow.16
1.2. THE CYTOCHROME P450 ENZYME SYSTEM The first report on cytochrome P450 was published in 1958.17 It was not referred
to as such name, however, until 1962, when Omura and Sato made the observation that
following reduction and binding of carbon-monoxide to the CYP pigment result in a
complex displaying an absorption maximum at 450 nm.18 At that time cytochrome P450
was regarded as a single enzyme, however, it has become clear by now that cytochrome
P450 is a superfamily of enzymes with more than 200 family members.
Structure of cytochrome P450s
Cytochrome P450 enzymes are hemoproteins, more accurately, they belong to
the family of hemothiolate enzymes. They can be found in every kingdom of the living
world, in bacteria, in fungi, in plants and in animals. P450 occurs in a great variety of
mammalian tissues and cells, specifically, in the subcellular membranes including the
endoplasmic reticulum, the nuclear membrane and the inner membrane of mitochondria.
CYP enzymes are membrane-bound proteins. Solubilisation of these enzymes
(e.g. by surfactants) destabilizes the protein and may lead to complete inactivation. High
glycerol concentrations can protect cytochrome P450 enzymes against the effects of
surfactants.19
Concerning their structure, CYP enzymes are built from a heme moiety and a
globular protein. The binding of these enzymes to the membrane is ensured by a
sequence from 20-25 amino acids at the N-terminal of the protein. Heme is located
between two long α-helices in the inner part of the protein lined with hydrophobic
amino acids. This highly hydrophobic inner pocket is appropriate to receive

9
hydrophobic substrates. The 5th ligand of the heme is a thiolate anion originating from
cysteine and absorption maximum of the CO-reduced P450 complex at 450 nm is
associated with this anion. Structural derangement in the P450 enzymes, e.g. the
replacement of the thiolate by an imidazole group from histidine, or changes in heme
vicinity leads to a shift in the absorption maximum to 420 nm.20,21 These alterations are
associated with the inactivation of P450 enzymes.
Classification, polymorphism and contribution
Cytochrome P450 enzymes are classified on the basis of the isoenzyme
homology. Enzymes with higher than 40 % homology in their amino acid sequence
belong to the same family (arabic numerals), in the case of higher than 55 % homology
they belong to the same subfamily (capital letter). The isoenzymes of the same
subfamily are again distinguished by arabic numeral (e.g. CYP1A1).14,22
The first three families of cytochrome P450 contribute to the biotransformation
of xenobiotics (CYP1, CYP2, and CYP3). There are 18 isoenzymes that may play a role
in the pharmacokinetics and interactions of drugs in humans. There are, however, just a
few among them, which are of particular importance (CYP1A2, CYP2C8, CYP2C9,
CYP2C19, CYP2D6, CYP2E1 and CYP3A4).14,15,22 The enzymes of the other families
are primarily involved in the transformation of endogenous substrates (steroid and bile
acid biosynthesis, fatty acid and arachidonic acid metabolism). CYPs are generally
sensitive to homeostatic changes (e.g. sexual maturation, age, pathological,
pathophysiological changes) and adapt their function to the actual needs of the
organism.1,22
Cytochrome P450 isoenzymes are characterized by inter-species, inter-
individual and tissue specificity. The variations in the enzyme activity are often related
to enzyme polymorphism. Certain enzymes with a minor overall contribution to drug
metabolism may assume greater importance on account of enzyme polymorphism (e.g.
the amount of CYP2D6 is less than 2.5 % in the human liver, but its contribution to
drug metabolism is almost 20 %).15 The contribution of various isoenzymes to drug
metabolism is demonstrated in Table 1.

10
CYP
Relative amount of cytochrome P450 in the
liver (%)
Contribution to drug metabolism
(%)
1A1 <1 2.5 1A2 ~13 8.2 1B1 <1 n.d. 2A6 ~4 2.5 2B6 <1 3.4 2C8, 2C9 ~18 15.8 2C18, 2C19 ~1 8.3 2D6 ≤2,5 18.8 2E1 ≤7 4.1 2F1 ≤1 ~1.3 3A4, 3A5 ≤28 34.1 4A11 ~14 n.d.
Table 1. Relative amount of the isoenzymes in human liver and their percentile contribution to
the metabolism of drugs (approximate values); n.d. = no data.15
The main isoenzymes contributing to the drug metabolism in human liver are the
members of CYP3A and CYP2C subfamilies. The role of these two enzyme subfamilies
in drug biotransformation is more than 50 %. The extrahepatic expression level of CYPs
is different -usually lower - than that of the liver, moreover certain isoenzymes are
dominantly expressed in certain tissues but may not or only hardly detectable in
others.16 For instance, CYP2C is the dominant rat liver isoform while it is hardly
detectable in rat small intestine. In human liver and intestine the CYP3A is mainly
expressed and it is also presenting in rat intestine.23
Function of cytochrome P450
The cytochrome P450 enzyme system is responsible for the metabolism of a
wide range of endogenous and exogenous substrates. The isoenzymes have overlapping
substrate specificity. The members of certain CYP families are specific to chemical
structures. Hence, the structurally similar drugs can metabolise on the same isoenzyme
leading to drug-drug interactions in many cases.14,15

11
The most important function of the cytochrome P450 enzymes is
monooxygenation that requires molecular oxygen and a reducing agent (NADPH,
NADH). Eukaryotic cytochrome P450 enzymes (either mitochondrial or microsomal)
use NADPH as an electron donor. In the microsomal metabolising system there are two
standard components: the membrane-bound cytochrome P450 and the NADPH-
cytochrome P450 reductase. The catalytic cycle of P450 is presented in Figure 1.
Figure 1.
Catalytic cycle of cytochrome P450.15
The first step of the catalytic cycle is the binding of the substrate. The Fe3+ form
of the heme is then reduced to Fe2+ form by the electron received from NADPH (Step
2.). The electron transport is performed by NADPH-cytochrome P450 reductase. The
reduced iron in the heme can bind molecular oxygen (Step 3.) that is transformed into
an activated state through the uptake of another electron (Step 4.) and one proton. The
activated oxygen can then oxidise the substrate. Only one oxygen atom reacts with the
substrate, the other oxygen atom leaves the cycle as water following the uptake of
another proton (Step 5.). The oxidized substrate will then dissociate from the enzyme,
which returns to its initial state and becomes ready to bind another substrate
molecule.15,19
In the course of the cycle, reactive oxygen radicals such as superoxide anion and
hydrogen peroxide are formed. In a complete cycle these free radicals facilitate the
12
transformation of the substrate, however, if the cycle is interrupted at any stage, the
reactive oxygen species may accumulate and may lead to cyto- and genotoxicity.14,15,19
More than half of the drugs used in clinical practice is metabolised by the
cytochrome P450 enzyme system24, therefore it is important to be aware of the factors
that influence the functions of this enzyme system.
1.2.1. Regulation of the cytochrome P450 enzyme system
Many CYP isoforms are regulated by endogenous (e.g. gonadal hormones,
pituitary hormones, transcription factors) and exogenous molecules (xenobiotics).25
P450s can be regulated at transcriptional, posttranscriptional, translational or
posttranslational levels. Transcriptional regulation by nuclear receptors,
posttranscriptional regulation by mRNA stabilization and posttranslational regulation by
enzyme stabilization or phosphorylation of the isoenzymes are common.24,25 Regulation
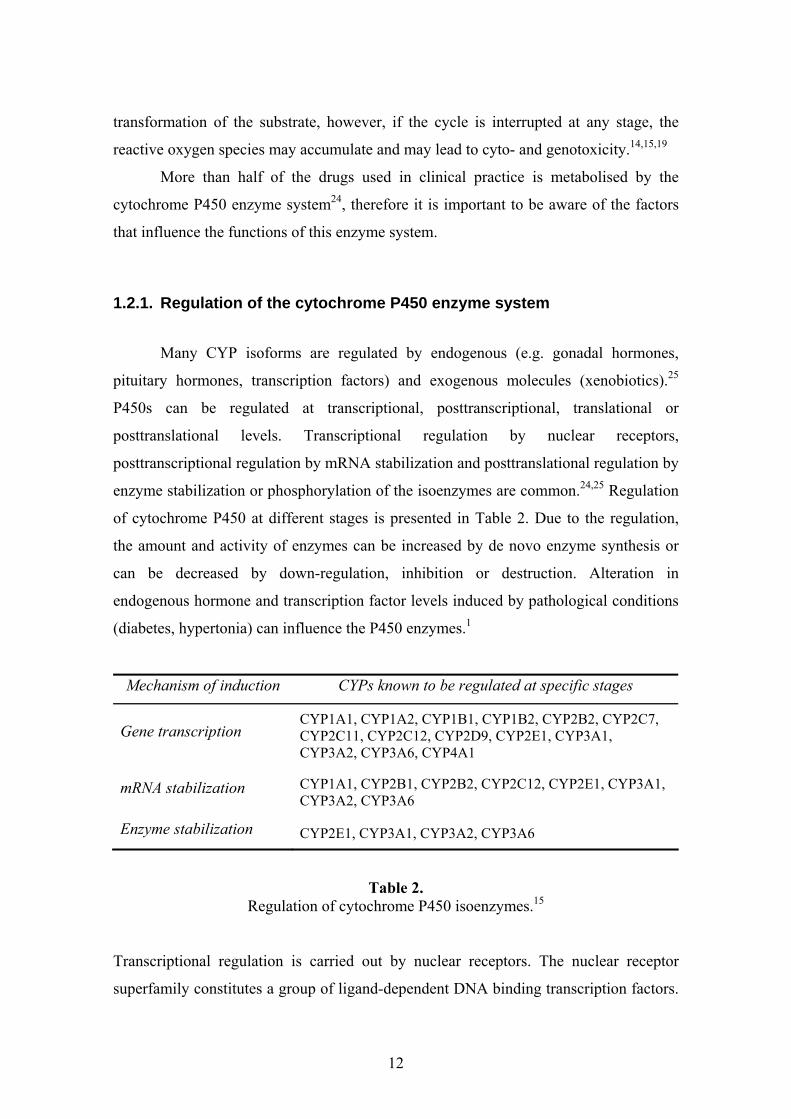
of cytochrome P450 at different stages is presented in Table 2. Due to the regulation,
the amount and activity of enzymes can be increased by de novo enzyme synthesis or
can be decreased by down-regulation, inhibition or destruction. Alteration in
endogenous hormone and transcription factor levels induced by pathological conditions
(diabetes, hypertonia) can influence the P450 enzymes.1
Mechanism of induction CYPs known to be regulated at specific stages
Gene transcription CYP1A1, CYP1A2, CYP1B1, CYP1B2, CYP2B2, CYP2C7, CYP2C11, CYP2C12, CYP2D9, CYP2E1, CYP3A1, CYP3A2, CYP3A6, CYP4A1
mRNA stabilization CYP1A1, CYP2B1, CYP2B2, CYP2C12, CYP2E1, CYP3A1, CYP3A2, CYP3A6
Enzyme stabilization CYP2E1, CYP3A1, CYP3A2, CYP3A6
Table 2. Regulation of cytochrome P450 isoenzymes.15
Transcriptional regulation is carried out by nuclear receptors. The nuclear receptor
superfamily constitutes a group of ligand-dependent DNA binding transcription factors.

13
They have at least four specific functions: ligand binding, nuclear translocation, DNA
binding and activation or repression of gene transcription.26 They all have a similar
modular structure in which various domains are involved in the receptor function: the
ligand-independent AF-1 transactivation domain is located in the N-terminal part of the
protein, the DNA binding domain consists of two highly conserved zinc finger motifs,
the dimerization domain and finally the AF-2 ligand-dependent transactivation
domain.26 The nuclear receptors regulating P450s are active either as homodimers (GR)
or as heterodimers (CAR, PXR). The inducing agents can bind to the receptors directly
(PXR, AhR) or indirectly, by signal transduction (CAR).27,28 The nuclear receptors are
originally found in cytoplasm, translocate to the nucleus following ligand activation and
bind to the AGGTCA sequence in the promoter of the DNA inducing gene
transcription.28 The dominant receptors involved in the xenobiotics metabolising CYP
regulation and their targets are summarized in Table 3.
Nuclear Receptors
Functional structure Regulated P450 enzymes Inducers/ prototypes
AhR AhR-Arnt heterodimer
CYP1A1, CYP1A2, CYP1B1 PAH, TCDD
CAR CAR-RXRα heterodimer
CYP2B6, CYP3A4, CYP2C9, CYP2C19 phenobarbital
RAR CYP2C retinoic acid
PXR PXR-RXRα heterodimer
CYP3A4, CYP3A7 CYP2B6, CYP2C9
PCN (rat), dexamethasone (rat), rifampicin (human),Hyperforin
HNF-4α homodimer CYP2A, CYP2C, CYP2D phenobarbital (CYP2A), not known (CYP2D)
PPARα PPARα-RXRα heterodimer
CYP 4A, peroxisomal acetyl-CoA
oxidase fatty acids,
fibrates
LXRα LXRα-RXRα heterodimer CYP 7A oxisterols
(in except for cholesterol)
FXRα FXRα-RXRα heterodimer CYP 7A bile acids,
xenobiotics
GR GR-GR homodimer
CYP 2C, CYP 3A, CYP 2B glucocorticoids
VDR VDR-RXRα heterodimer CYP 3A, CYP 2B6, CYP 2C9 D-vitamin,bile acids
Table 3. Nuclear receptors involved in the regulation of cytochrome P450 enzyme system and
their main targets and inducers.14,26,27,28,29

14
Besides the long-term regulation of foreign compound metabolising enzymes by
induction, a short-term regulation by posttranslational modifications of the proteins also
exists.24,25,30,31,32 The posttranslational modifications can occur via the processes of
phosphorylation, acetylation, glycosylation or deamidation.25 The regulation of
cytochrome P450 by phosphorylation is supported by the fact that CYPs are substrates
for protein kinases. In addition, the cytochrome P450 and cAMP dependent protein
kinase A (PKA) are localized in the same subcellular fraction (microsomes) in intact
cells.33 Generally the PKA phosphorylates the adequate amino acid (serine, threonin or
tyrosine), but the protein kinase C and the Ca2+/Calmodulin dependent protein kinase II
are also suitable for their modulation.25,31 The PKA recognizes the Arg-Arg-X-Ser
sequence where the serine is usually at 128 or at 129 positions.34 The recognition
sequence is conserved in CYP2 enzyme family members as in CYP2B1/2, CYP2A1,
CYP2C11, CYP2D1/2, and CYP2E1 in rats; 25,35 and e.g. CYP2B6, CYP2E1 in
humans33 and CYP2B4 in rabbits.34 The presence of this recognition sequence is also
not always sufficient for phosphorylation to occur (e.g. CYP2C11) and isoenzymes
involving threonin, in spite of serine (e.g. CYP2A2, CYP2C6, CYP2C7, CYP2C13 and
CYP2C12 in rats) can not be phosphorylated by PKA.25,32,35 However, it also has been
published that the mutation of Ser129 in rat CYP2E1 to Ala or Gly brings about the
PKA-mediated phosphorylation at another site of CYP2E1 (Lys-Lys-Ser209-Tyr and
Lys-Lys-Ser449-Ala) or in another cooperating molecule and that leads to an opposite
effect (increase in catalytic activity) as compared with its effect on wild-type
CYP2E1.33,36
The activity of PKA depends on the level of cellular cAMP. This in turn
depends on the concentration of hormones (e.g. glucagon, insulin, adrenalin, pituitary
hormones and thyroid hormones), on diseases (e.g. diabetes, hypertonia) and on the
presence and concentration of some drugs (e.g. adenylate cyclase stimulators,
phosphodiesterase inhibitors).25,31
The CYP2E1 isoenzyme is mostly regulated at the posttranscriptional level.
Inducing agents (ethanol, isoniazid, pyridine, pyrazole, imidazole etc.), starvation,
chronic alcohol consumption or diabetes can increase the enzyme activity without
enhanced gene transcription.24 The CYP2E1 protein level increases but mRNA remains
unchanged.37 The enzyme stabilization is also based on a phosphorylational mechanism.

15
The phosphorylation of CYP2B and CYP2E1 results in a decrease of their catalytic
activities.30,32,35 The phosphorylation of CYP2E1 at the Ser129 position but not CYP2B1
is followed by heme loss and degradation by proteases.24,38 However, Oesch-
Bartolomowich and co-workers show that the cAMP-mediated phosphorylation of
CYP2E1 leads to loss of activity without enzyme protein degradation.39
1.2.2. Intestinal cytochrome P450 enzyme system
The physiological conditions of the gastrointestinal tract (the presence or
absence of food, biliary excretion etc.), the pathological alterations of the small intestine
and the first-pass metabolism can all lead to the poor bioavailability of an orally
administered drug.40 Owing to its huge surface area and very good blood supply, the
small intestine is the primary organ of drug absorption. Nevertheless, the small intestine
may have an important role in the first pass metabolism of certain orally administered
drugs,41 including midazolam,42 nifedipine,43 tacrolimus,44 sirolimus,45 cyclosporine,46
verapamil,47 etc. and resulting in a reduced oral bioavailability. Furthermore, many
prodrugs require the action of these metabolising enzymes pointing out to a substantial
role of intestinal drug metabolism. Although the clinical importance of intestinal
metabolism is a matter of debate nowadays, it is unquestionable that the small intestine
can also be responsible for the inter- and intra-individual variation in the bioavailability
of intensively metabolising drugs. It is worth mentioning that such variations may arise
from the variations in the metabolic processes and from the variations in the function of
the efflux transport proteins (e.g. p-glycoprotein) located in the intestinal wall, or from
the combination of both. Owing to these two mechanisms, the small intestine forms not
only the organ of absorption but it is also endowed with some barrier properties.40
The intestinal metabolism depends on the intracellular residence time of the drug
molecule and on the catalytic activity of the enzymes present in the cell. Nevertheless,
due to the anatomical structure of the capillary network of intestinal villi, it is also true,
that the drugs entering into the systemic circulation directly and not through absorption,
do not always reach the drug metabolising enzymes in the intestinal villi. The
underlying mechanism is the free diffusion of drug molecules between the ascending

16
and descending capillaries, the so-called counter-current exchange that allows the free
exchange of small molecules between the two branches of the capillaries.48
Distribution of intestinal P450s
The enzymes within the gut lumen come from two sources: mammalian (gastric,
pancreatic and intestinal enzymes) and bacteria-associated enzymes, the latter of which
are concentrated in the ileum and the colon.16 Phase I and phase II drug metabolising
enzymes and phase III transport proteins are expressed in the intestinal mucous
membrane. The amount of drug metabolising enzymes is highest in the upper part of the
small intestine i.e. in the duodenum and jejunum; however, cytochrome P450 activities
do vary also along the longitudinal axis of intestinal villi. The cells in the apex of the
villi are mature, that they are fully differentiated epithelial cells, while the crypt cells at
the base are immature. The enzyme activity in the intestinal crypt cells is hardly
measurable or completely absent.49 On the other hand, maximum enzyme activities can
be detected in the apex of the intestinal villi. The epithelial cells are densely covered by
the intestinal microvilli. The turnover of the microvilli is 2 to 6 days in humans (2 days
in rats); the cells detached from the surface leave the body by the means of the
stools.48,50 Presumably, the continuous renewal of cytochrome P450-containing cells
plays an important role in protection against toxins.50
Nearly all hepatic drug metabolising enzymes can be found in the intestinal
epithelium, too. As in the liver, the biotransformation of drugs is primarily catalysed by
the cytochrome P450 enzymes in the small intestine. The expression level of
cytochrome P450 enzymes is much lower in the extrahepatic organs than in the liver.
For instance, the expression level of CYP3A isoenzymes which are the most abundant
enzymes in the human small intestine is roughly 30 times lower than that in the human
liver.48 The isoenzymes of other CYP families are also present, though they are much
less abundant.16 The distribution of cytochrome P450 isoenzymes in human small
intestine is shown in Figure 2.

17
Figure 2. Relative abundance of cytochrome P450 isoenzymes in human small intestine.51
Induction of intestinal P450s
The cytochrome P450 enzymes of the small intestine are also inducible;
however, their induction differs from that of the liver enzymes.48 The well-known
inducers such as 3-methylcholantrane, ß-naphtoflavone, phenobarbital and
dexamethasone also increase the activity and mRNA expression of the CYP1A1
(phenacetin- O-deethylation), CYP2B1/2 (7-ethoxycoumarin O-deethylation) and
CYP3A1/2 (erythromycin N-demethylation) in rat intestine, respectively. 50,52,53,54 In the
case of low oral doses the induction is significantly higher in the small intestine than in
the liver.55 The intestinal metabolism enhanced via induction relieves the liver to some
extent from the burden of too many drugs as it prevents a portion of the drug molecules
from reaching the liver. In the case of higher doses, the enzyme induction is much more
pronounced in the liver than in the intestine. Furthermore, recent studies show that
intestinal CYP3A cannot be regulated by PXR agonists; however, PXR is the main
nuclear receptor regulating the CYP3A isoenzymes in the liver.56 These facts can be
taken as evidence for the independent regulation of the cytochrome P450 enzyme
system in the liver and that in the small intestine.48,56,57
At low inducer doses the induction does not only depend on the dosage but also
on the route of the administration. While high doses of intravenously administered
inducer does not only induce the cytochrome P450 enzymes system in the liver but also
in the small intestine. In other words, in the case of high enough doses, the induction of
intestinal metabolising enzymes is independent of the route of administration.48
18
Although the consensus on the importance of intestinal metabolism is yet to
come, the aforementioned processes clearly indicate that the epithelium of the small
intestine can undoubtedly serve as the site of drug interactions. In addition to the
classical induction- or inhibition-based drug interactions, gastrointestinal diseases,
alterations of gastrointestinal motility and food supplements can all influence the
efficacy of orally administered drugs.49 Moreover, through compensating for the
reduced hepatic metabolism, intestinal metabolism may assume a special role in
diseases.16,41
1.3. FLAVIN-CONTAINING MONOOXYGENASE ENZYMES
Flavin-containing monooxygenase (FMO) family is a non-heme containing
enzyme system involved in drug metabolism. FMO enzymes catalyse the oxygenation
of numerous nucleophilic heteroatom-containing (i.e. nitrogen, sulphur, selenium,
phosphorus) xenobiotics.58 Flavin monooxygenase and cytochrome P450 have similar
tissue, cellular and organelle expression.59 They have overlapping substrate specificity
and both FMO and CYP require NADPH and O2 as cofactors to their function.60,61
However, the mechanism of reactions catalysed by FMO is different from that of CYP-
mediated metabolism. In contrast to CYP, FMO binds the substrate only when its FAD
component has been already reduced by the two electrons received from NADPH and
the reduced flavin reacted with molecular oxygen to form 4α-hydroxyperoxyflavin. The
FMO oxygenates soft nucleophilic xenobiotics which shape, size and charge permit its
access to the well-protected substrate binding channel. Oxygenation proceeds with the
attack of nucleophilic heteroatom on the terminal hydroperoxy flavin oxygen atom to
produce the product.60,62
The FMO class of monooxygenases has unique properties such as relative thermal
lability,60 pH dependency (the optimal pH for FMO enzyme function varies among
species, but it is between pH 8-10),63 detergent dependency (sodium cholate and fatty
acids inhibit FMO)64and they generate relatively stabile hydroperoxy flavin
intermediates.60,65
There are currently eleven FMO genes, but only the first five are functionally
active the others are pseudogenes.66,67 The FMO1 and FMO3 are currently thought to
19
play an important role in drug metabolism. Both have broad substrate specificity and
high expression levels in most tissues. In one hand, the FMO takes part in the
detoxication of xenobiotics such as synthetic therapeutic drugs and natural products in
the diet like alkaloids. The other hand, FMO enzyme family has been implicated in the
bioactivation of several xenobiotics resulted in metabolites with greater electrophilicity.
FMOs play also important role in the biotransformation of numerous endogenous
substrates. The nitrogen-containing biogen amines (e.g. phenethylamine, tyramine), the
trimethylamine, the sulphur-containing cysteamine, disulfide lipoic acid, methionine, S-
farnezylcysteine etc. can transform into their N- or S-oxides by FMO.62,63,65
FMO isoforms exhibit tissue-, species-, gender-, age- and substrate-specificity.
Regarding to species differences FMO1 is the major hepatic isoenzyme in experimental
animals while FMO3 is mainly expressed in human livers.59 It is also shown that the
expression of FMO3 is affected by the gender. In mice and rats a much greater FMO3
activity was observed with females than with males since testosterone repress and
oestradiol increase the expression of FMO1 and FMO3 in mouse. Moreover, no gender
effect was observed for humans, dogs and rabbits.68,69
FMO is regulated at transcriptional and posttranscriptional level. HNF-1α, HNF-
4α and YY1 regulatory domains are found in the promoter of rabbit FMO1. HNF-1α
and HNF-4α were demonstrated to enhance while YY1 suppressed the FMO1 promoter
activity. These regulatory elements are also conserved in human FMO1. The
posttranscriptional regulatory effect could be the N-glycolisation of FMO1 on Asn
(asparagine) amino acid at the 120 position. It is also shown that NO appears to modify
FMO3. The number of mechanisms to regulate CYP including enhancement of mRNA
stability, enzyme phosphorylation and protein-protein interactions either do not occur
for FMO or have not been reported.70 Nevertheless FMO are under dietary-,
developmental-, hormonal- (steroids, growth hormones) and genetic control and their
expression and activity alter in pathophysiological status such as pregnancy, starvation,
ascorbic acid deficiency, gonadectomy and diabetes.71,72,73,74,75
Our study primarily focused on the changes of cytochrome P450 enzyme system
in streptozotocin induced diabetes. The expression and activity of FMO enzymes were
determined to gain an overall picture about the metabolic changes in diabetes.

20
1.4. IN VITRO STUDIES TO ASSESS THE FUNCTION OF CYPs
The application of in vitro methods for the prediction of the pharmacokinetic
and metabolic properties of drugs is a widely used approach in the pharmaceutical
industry. The needs of industry concerning the development of the safest possible drugs
at the lowest possible cost represented a great impetus to the development of such
techniques. The use of in vitro methods is a cost-effective approach particularly in the
early stages of research and development.
The use of biological models has a long established tradition in pharmacology;
however, the models used for the elucidation of the ADME profile of drug candidates
have a more recent history. Nevertheless, owing to the numerous advantages they offer
over in vivo experimentation, in vitro methods became wide-spread rapidly.14 In vitro
techniques are much less demanding in terms of the amount of test substance and
human resources than in vivo studies. The reduction of the utilization of experimental
animals by in vitro methods is not only cost-saving but it is advantageous also from an
ethical point of view. In vitro methods provide a possibility for the use of human cells
and subcellular fractions in the early phases of research and development.76,77 In view of
the known inter-species differences in drug metabolism, the use of human tissues in in
vitro experiments is of special importance. The in vitro models are also supplying pools
of subcellular fractions from several animals or individuals which give a chance to
circumvent the problem of inter-individual variations and to obtain a population mean
directly.
There are a great number of in vitro techniques that can be used to elucidate the
metabolism of a drug. In metabolism studies, the biological sample can be microsomes,
S9 fraction, hepatocytes, precision-cut organ slices, recombinant enzyme systems, or
perfused liver.14 Microsomal fractions are frequently used systems. Microsomes are
subcellular fraction consisting of spherical particles generated from disrupted,
ultracentrifuged and resuspended endoplasmic reticulum.78 Easy preparation and the
possibility of long-term storage at –80°C without a significant loss of enzyme activity
make microsomes especially advantageous. Owing to the role of endoplasmic reticulum
in protein synthesis, the microsomal fraction contains a great variety of proteins, even
metabolising enzymes. Both phase I and some phase II enzymes are present in this

21
subcellular fraction, nevertheless microsomes are most suitable for the investigation of
cytochrome P450 enzyme system. Liver microsomal fraction characterized by
containing the highest level of metabolising enzymes is the most frequently used
biological sample in microsomal metabolism studies. As a prerequisite in the in vitro
study of metabolism, optimal physiological conditions (ionic strength, pH, NADPH as
an electron donor for CYPs, FMOs etc., oxygen of the air) have to be provided for the
functioning of microsomal enzymes.
Microsomal fractions can be used to explore the metabolic pathways and profile
of a drug candidate, to determine the first-pass metabolism and metabolic stability of
new chemicals or to study the underlying mechanisms of drug-drug interactions through
the elucidation of inhibition and induction processes. In vitro metabolism studies with
probe substrates can successfully be used in the determination of the enzyme kinetic
parameters (CL, Vmax, KM). Probe substrate reactions offer a means of investigating the
overall picture of the metabolising properties of different tissues both under
physiological and pathological conditions.
In in vitro metabolism studies, certain ADME parameters are usually neglected;
therefore, one always has to keep the limitations of the model system in mind in order to
avoid the over-interpretation of the results.14
1.5. CHANGES OF CYTOCHROME P450 FUNCTION IN DIABETES
1.5.1. Streptozotocin induced diabetes model
Hormonal changes associated with certain types of diseases such as diabetes or
hypertension can have an effect on the amount and the activity of drug metabolising
system.79 There are a great number of publications concerning the effects of type I
diabetes (insulin dependent diabetes mellitus, IDDM) on CYP enzymes,2,3,4,5,6,7,8,9,10
nevertheless, and in spite of the similarity of reported results, little is known about the
drug interactions that maybe induced by the pathological state.
In the experimental modelling of diabetes there are several chemicals known to
provoke diabetic symptoms. Alloxan and streptozotocin (STZ) are the most frequently
used and most suitable to elicit diabetes and to create an experimental model of the

22
disease.80 Despite of the great number of results obtained with the alloxan model of
diabetes and considering the low specificity of alloxan, STZ-induced diabetes as the
model in our experiments was selected. The results obtained in the two models cannot
be compared, since alloxan and STZ have different effects on the cytochrome P450
enzyme system, presumably due to the less specific effect of the former one.6
Streptozotocin (MW = 265 g/mol) is an N-nitroso derivative of D-glucoseamine.
The chemical structure of streptozotocin can be seen in Figure 3.
NH
O
NN
O
O
OH
OH OH
CH3
OH
Figure 3. Chemical structure of streptozotocin
(2-deoxi-2-(3-(methyl-3-nitrosoureido)-D-glucopyranose)) (Merck Index).
A single administration of streptozotocin damages the β-cells of the pancreatic
Langerhans’ islets specifically.81 STZ enters the β-cells with the help of GLUT-2
transporter and it causes cell necrosis through DNA-alkylation. STZ is a nitrogen-
monoxide donor, which represents another cytotoxic mechanism. Its cytotoxic effects
equally prevail in rats, mice, rabbits, dogs, monkeys and humans.82 STZ elicits
hyperglycaemia due to insulin deficiency i.e. it provokes insulin dependent, type I
diabetes mellitus (IDDM). It increases the activity of mitochondrial xanthine-oxidase,
the enzyme catalysing the formation of superoxide anion, thus, those of hydrogen-
peroxide and hydroxyl radicals, which in turn facilitate cellular necrosis. STZ is an
inhibitor of the Krebs’ cycle, whereby it reduces mitochondrial oxygen utilisation, thus,
restricts ATP-production up to the complete depletion of ATP in the β-cells. As an
additional mechanism, the DNA damage by STZ activates the poly-(ADP-ribosylase)
enzyme that reduces the cellular NAD+ content, which contributes to the depletion of
23
ATP.81 Because of the effect of STZ, insulin production and secretion cease with a
parallel increase of the hepatic glucose production, reduction of glucose utilisation, and
decrease of the activity of enzymes involved in lipogenesis and gluconeogenesis.5
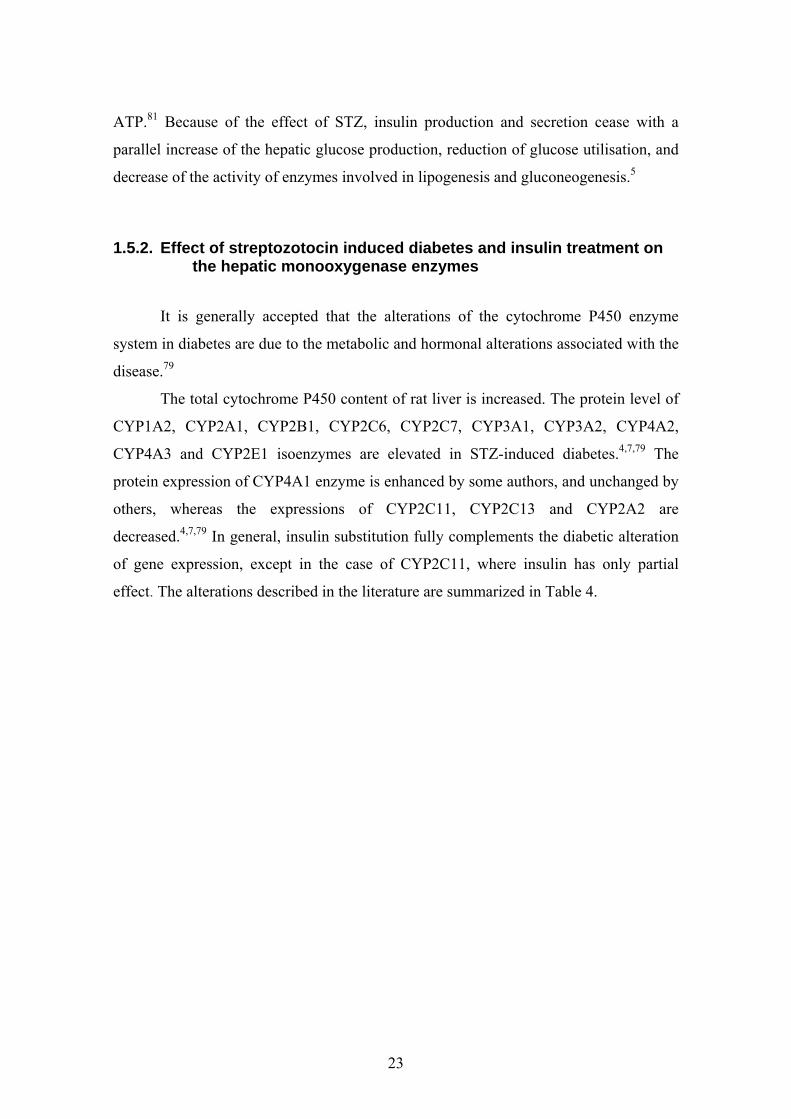
1.5.2. Effect of streptozotocin induced diabetes and insulin treatment on the hepatic monooxygenase enzymes
It is generally accepted that the alterations of the cytochrome P450 enzyme
system in diabetes are due to the metabolic and hormonal alterations associated with the
disease.79
The total cytochrome P450 content of rat liver is increased. The protein level of
CYP1A2, CYP2A1, CYP2B1, CYP2C6, CYP2C7, CYP3A1, CYP3A2, CYP4A2,
CYP4A3 and CYP2E1 isoenzymes are elevated in STZ-induced diabetes.4,7,79 The
protein expression of CYP4A1 enzyme is enhanced by some authors, and unchanged by
others, whereas the expressions of CYP2C11, CYP2C13 and CYP2A2 are
decreased.4,7,79 In general, insulin substitution fully complements the diabetic alteration
of gene expression, except in the case of CYP2C11, where insulin has only partial
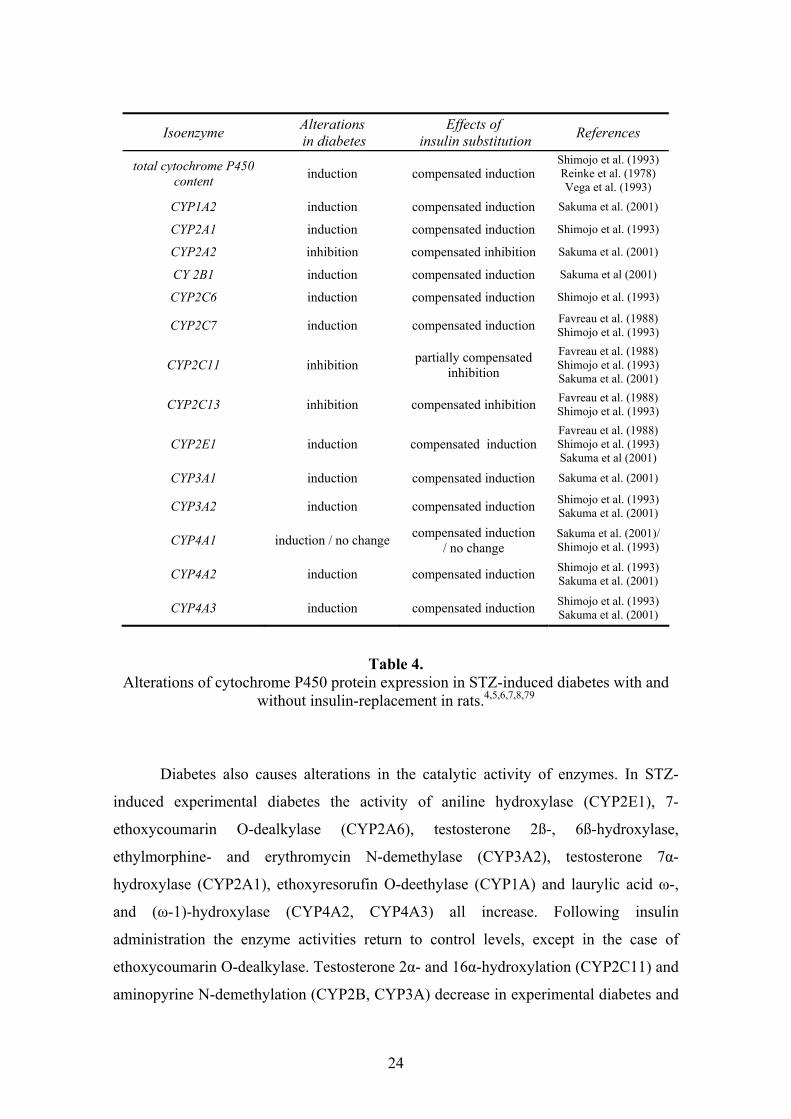
effect. The alterations described in the literature are summarized in Table 4.
24
Isoenzyme Alterations in diabetes
Effects of insulin substitution References
total cytochrome P450 content induction compensated induction
Shimojo et al. (1993) Reinke et al. (1978) Vega et al. (1993)
CYP1A2 induction compensated induction Sakuma et al. (2001)
CYP2A1 induction compensated induction Shimojo et al. (1993)
CYP2A2 inhibition compensated inhibition Sakuma et al. (2001)
CY 2B1 induction compensated induction Sakuma et al (2001)
CYP2C6 induction compensated induction Shimojo et al. (1993)
CYP2C7 induction compensated induction Favreau et al. (1988) Shimojo et al. (1993)
CYP2C11 inhibition partially compensated inhibition
Favreau et al. (1988) Shimojo et al. (1993) Sakuma et al. (2001)
CYP2C13 inhibition compensated inhibition Favreau et al. (1988) Shimojo et al. (1993)
CYP2E1 induction compensated induction Favreau et al. (1988) Shimojo et al. (1993) Sakuma et al (2001)
CYP3A1 induction compensated induction Sakuma et al. (2001)
CYP3A2 induction compensated induction Shimojo et al. (1993) Sakuma et al. (2001)
CYP4A1 induction / no change compensated induction / no change
Sakuma et al. (2001)/ Shimojo et al. (1993)
CYP4A2 induction compensated induction Shimojo et al. (1993) Sakuma et al. (2001)
CYP4A3 induction compensated induction Shimojo et al. (1993) Sakuma et al. (2001)
Table 4. Alterations of cytochrome P450 protein expression in STZ-induced diabetes with and
without insulin-replacement in rats.4,5,6,7,8,79
Diabetes also causes alterations in the catalytic activity of enzymes. In STZ-
induced experimental diabetes the activity of aniline hydroxylase (CYP2E1), 7-
ethoxycoumarin O-dealkylase (CYP2A6), testosterone 2ß-, 6ß-hydroxylase,
ethylmorphine- and erythromycin N-demethylase (CYP3A2), testosterone 7α-
hydroxylase (CYP2A1), ethoxyresorufin O-deethylase (CYP1A) and laurylic acid ω-,
and (ω-1)-hydroxylase (CYP4A2, CYP4A3) all increase. Following insulin
administration the enzyme activities return to control levels, except in the case of
ethoxycoumarin O-dealkylase. Testosterone 2α- and 16α-hydroxylation (CYP2C11) and
aminopyrine N-demethylation (CYP2B, CYP3A) decrease in experimental diabetes and

25
insulin substitution restores the enzyme activities.4,5,8,9,80,83 No significant alteration
with respect to p-nitrophenol hydroxylase activity (CYP2E1) was published by Barnett
et al. (1994) and Ackermann and Leibman (1977).9,80 Although in other studies the most
marked increase in CYP2E1 catalytic activity was described by 3-8-fold.4,5,8,9 The
alterations in the catalytic activity of the enzymes are summarized in Table 5.
Table 5. Alterations of the catalytic activity of cytochrome P450 isoenzymes in insulin-treated
and untreated rats with STZ-induced diabetes.4,5,6,8,9,80,83
Isoenzyme Alteration of catalytic activity in diabetes
Effects of insulin substitution Reference
ethoxyresorufin O-deethylase (CYP1A) increased compensated Yamazoe et al. (1989)
testosterone 7α- hydroxylase (CYP2A1) increased compensated Shimojo et al. (1993)
7-ethoxycoumarin O-dealkylase (CYP2A6)
increased no change Shimojo et al. (1993)
aminopyrine N-demethylase (CYP2B1) decreased compensated Reinke et al. (1978)
testosterone 2α-hydroxylase (CYP2C11) decreased compensated Shimojo et al. (1993)
Vega et al. (1993)
testosterone 16α-hydroxylase (CYP2C11) decreased compensated Shimojo et al. (1993)
aniline 4-hydroxylase (CYP2E1) increased compensated Reinke et al. (1978)
Shimojo et al. (1993)
p-nitrophenol hydroxylase (CYP2E1) increased/ no change no change
Ackermann et al. (1977) Barnett et al. (1994) / Reinke et al. (1978)
Shimojo et al. (1993) testosterone 2ß-hydroxylase
(CYP3A2) increased compensated Shimojo et al. (1993)
testosterone 6ß-hydroxylase (CYP3A2) increased compensated Yamazoe et al. (1989)
Shimojo et al. (1993)
ethylmorphine N-demethylase (CYP3A2) increased no data Shimojo et al. (1994)
erythromycin N-demethylase (CYP3A2) increased no data Shimojo et al. (1994)
laurilic acid ω-hydroxylase (CYP4A2) increased compensated Shimojo et al. (1993)
laurilic acid (ω-1)-hydroxylase (CYP4A3) increased compensated Shimojo et al. (1993)
26
The alteration of xenobiotic metabolism in diabetes has long been recognised.
The regulation mechanisms behind this phenomenon are, however, still the subject of
investigations. The altered protein expression may be related to the decreased levels of
pituitary growth hormones (e.g. at CYP1A2, CYP2B, CYP2E1, CYP2C11 isoenzymes),
to decreased testosterone (e.g. at CYP2A1, CYP2C12 isoenzymes) or thyroid hormone
levels (e.g. in the case of CYP2A1, CYP2B enzymes).79 In addition, the growth
hormone levels are decreased in diabetes, and the increase of CYP3A1 expression and
the decrease in CYP2C11 enzyme are presumably related to these changes.84,85
It is also known that the marked elevation in the activity of CYP2E1 isoenzyme
in diabetes can be attributed to the increase of the enzyme stability by phosphorylation
rather than to transcriptional regulation.37 Diabetes leads to an increased level of ketone
bodies which may also involved in the regulation of CYP2E1, however, pancreatic
insulin has been shown to be a direct regulator in the posttranslational modification of
rat CYP2E1 and CYP2B expression.7,86
The alteration of FMO activities was also observed in modified physiological
states of animals such as diabetes.71 An increased N-oxidation of imipramine was
shown in diabetic mouse liver and elevated hepatic FMO activity accompanied by
enhanced FMO mRNA level was demonstrated in diabetic rats.87,88 In our previous
short-term diabetic study (Borbás et al., 2006) it was observed that FMO activity
increased in diabetic rats in a streptozotocin dose-dependent manner. Insulin restored
the FMO activity to the control level, while insulin had no effect on non-diabetic
animals. Based on these results, it was indicated that insulin is involved in the
regulation of hepatic FMOs.
1.5.3. Effect of streptozotocin induced diabetes and insulin treatment on the intestinal cytochrome P450s
The effects of diabetes on the intestinal metabolism are much less represented in
the literature than that of hepatic metabolism. In spite of the overall body weight loss,
the animals’ intestinal epithelium becomes thicker in diabetes. The increase of mucous
membrane mass is particularly substantial in the proximal regions. In spite of this
increase, however, no increase could be demonstrated in the mass of epithelial cells.89

27
Al-Turk and associates observed an increase in intestinal 7-ethoxycoumarin O-
deethylase (CYP2A) and aromatic hydrocarbon hydroxylase (CYP1A) activity in male
and female diabetic rats.2,3 It was shown by the same authors that both ovariectomy and
castration lead to alterations in the catalytic activity of both hepatic and intestinal
cytochrome P450 enzyme systems. Regarding the small intestine, 7-ethoxycoumarin O-
deethylase activity did not differ in castrated diabetic animals from those of sham-
operated, diabetic control animals, indicating that hormonal regulation had no effect on
P450 activity in this case. Aromatic hydrocarbon hydroxylase activity was found
induced in both sexes of gonadectomised diabetic rats. Based on the results above, it
appears that the catalytic activity of aromatic hydrocarbon hydroxylase is regulated by
both the sex and the pancreatic hormones.3
1.6. OVERVIEW OF THE SUBSTRATES STUDIED
1.6.1. Metabolism of NSAID drug, Diclofenac
Diclofenac sodium is the sodium salt of o-[(2,6-dichlorophenyl) amino]
phenylacetic acid (structure see below in Figure 4.).90 Diclofenac, the nonsteroidal anti-
inflammatory drug (NSAID) is widely used for the treatment of rheumatoid arthritis,
osteoarthritis, ankylosing spondylitis and acute muscular pain conditions.91 It can rarely
cause severe hepatic injury. Although the mechanism of hepatotoxicity is still not clear,
extensive studies have focused on biotransformation of diclofenac into chemically
reactive metabolites produced by cytochrome P450 mediated metabolism.92 Diclofenac
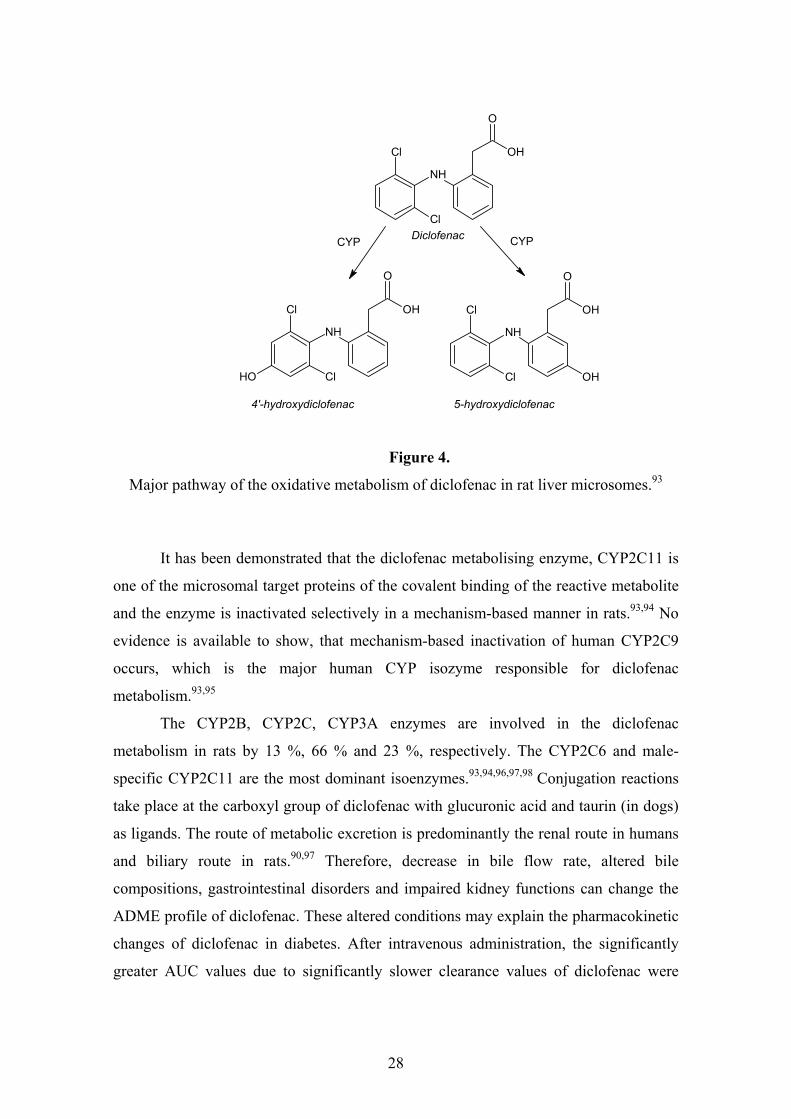
is metabolised mainly into two phenolic metabolites, 4’-hydroxy diclofenac and 5-
hydroxy diclofenac. The latter one is a reactive metabolite.93 The main metabolic
pathway of diclofenac is shown in Figure 4.
28
Cl
NH
O
OH
ClOH
Cl
NH
O
OH
Cl OH
Cl
NH
O
OH
Cl
CYP CYPDiclofenac
4'-hydroxydiclofenac 5-hydroxydiclofenac
Figure 4.
Major pathway of the oxidative metabolism of diclofenac in rat liver microsomes.93
It has been demonstrated that the diclofenac metabolising enzyme, CYP2C11 is
one of the microsomal target proteins of the covalent binding of the reactive metabolite
and the enzyme is inactivated selectively in a mechanism-based manner in rats.93,94 No
evidence is available to show, that mechanism-based inactivation of human CYP2C9
occurs, which is the major human CYP isozyme responsible for diclofenac
metabolism.93,95
The CYP2B, CYP2C, CYP3A enzymes are involved in the diclofenac
metabolism in rats by 13 %, 66 % and 23 %, respectively. The CYP2C6 and male-
specific CYP2C11 are the most dominant isoenzymes.93,94,96,97,98 Conjugation reactions
take place at the carboxyl group of diclofenac with glucuronic acid and taurin (in dogs)
as ligands. The route of metabolic excretion is predominantly the renal route in humans
and biliary route in rats.90,97 Therefore, decrease in bile flow rate, altered bile
compositions, gastrointestinal disorders and impaired kidney functions can change the
ADME profile of diclofenac. These altered conditions may explain the pharmacokinetic
changes of diclofenac in diabetes. After intravenous administration, the significantly
greater AUC values due to significantly slower clearance values of diclofenac were

29
determined in the rat model of diabetes. However, after oral administration the
significant change which was found between diabetic and control rats may be due to
decreased absorption of diclofenac.97 The smaller CL values after intravenous
administration were due to the slower nonrenal clearance. Hence, the reduced catalytic
activity of CYP2C11 may explain the altered pharmacokinetic parameters of
diclofenac.97
1.5.2. The organophosphate antidote, K-48
Organophosphorus compounds (organophosphates and organophosphonates) are
serine esterase and protease inhibitors. Organophosphates are widely used in agriculture
as insecticides, in industry and technology as softening agents and lubricants.99
Poisoning occurs as a result of accidental exposure or by the means of suicide or rarely
homicide.100,101 Organophosphonates (OP) are declared as chemical warfare agents used
as “nerve gases” in terrorist attacks.99
The OPs are inhibitors of the butyrilcholine- and acetylcholine esterases, which
mostly can be found in nerve tissues and erythrocytes. They react covalently with the
active centre serine of cholinesterases by phosphorylation.99,100,102 The inhibition of
cholinesterase activity leads to accumulation of cholines in synapses, causing
overstimulation of neurotransmission in both central and peripheral nervous systems.100
Oximes are believed to be effective, and be especially useful in treating moderate or
severe OP poisoning. The major pharmacological action of oximes is to reactivate the
cholinesterase by removal of the phosphate group bound to the esteratic site.101 Oximes
are commonly used in combination with atropine.99,103,104 Atropin relieves muscarinic
signs and symptoms of the peripheral nervous system and the oximes are supposed to
ameliorate the effect on CNS (e.g. respiratory muscle paralysis).99 Pralidoxime salts
have been used in many years for the treatment of OP poisoning; however, the clinical
experiences are disappointing.99,102 Over the years new potential reactivators have been
developed. From the chemical point of view, the oximes can be separated into different
groups: monopyridinium compounds (e.g. pralidoxime), bisquaternery symmetric (e.g.
obidoxime, methoxime) and bisquaternery asymmetric compounds (e.g. HI-6, BI-6, K-
48).99 All the molecules are quaternary amino compounds with alkyl substituents on the
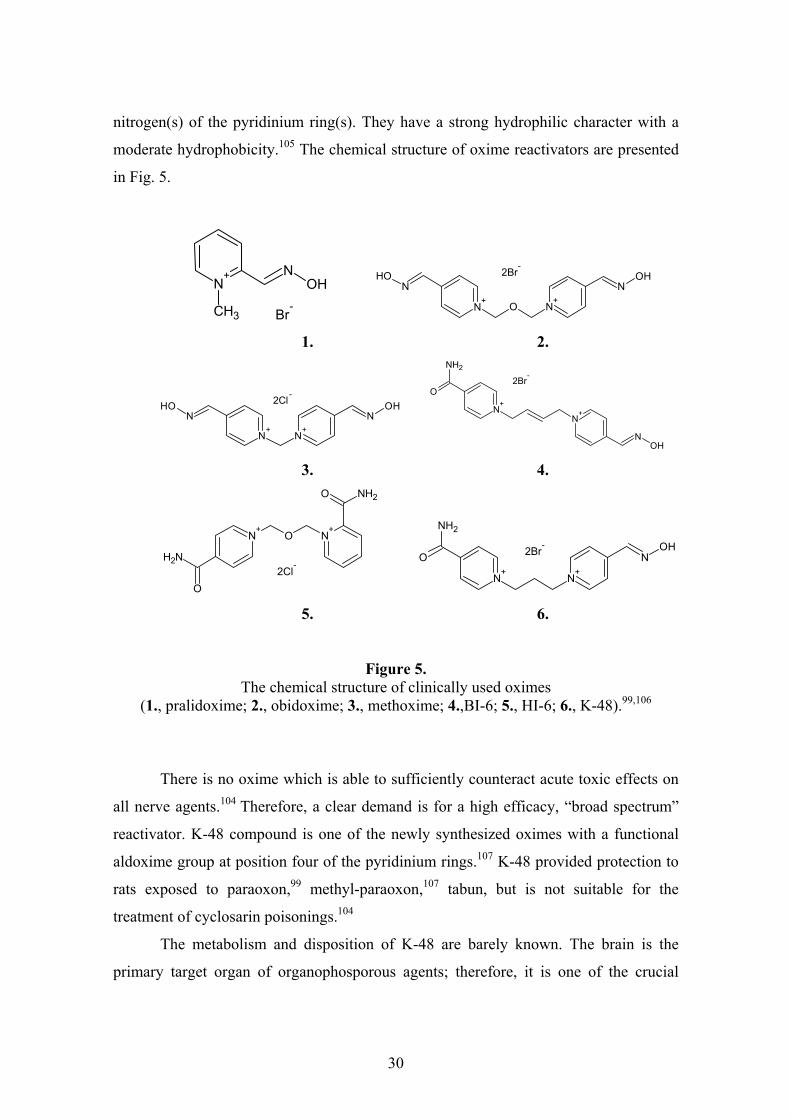
30
nitrogen(s) of the pyridinium ring(s). They have a strong hydrophilic character with a
moderate hydrophobicity.105 The chemical structure of oxime reactivators are presented
in Fig. 5.
CH3
N+ N
OH
Br-
N
+N
OH
O N+
NOH2Br
-
1. 2.
N+
NOH
N+
NOH2Cl
-
N+
NH2
O
N+
NOH
2Br-
3. 4.
2Cl-
N+
ON+
NH2
O
NH2O
N
+N
OH
N+
NH2
O 2Br-
5. 6.
Figure 5. The chemical structure of clinically used oximes
(1., pralidoxime; 2., obidoxime; 3., methoxime; 4.,BI-6; 5., HI-6; 6., K-48).99,106
There is no oxime which is able to sufficiently counteract acute toxic effects on
all nerve agents.104 Therefore, a clear demand is for a high efficacy, “broad spectrum”
reactivator. K-48 compound is one of the newly synthesized oximes with a functional
aldoxime group at position four of the pyridinium rings.107 K-48 provided protection to
rats exposed to paraoxon,99 methyl-paraoxon,107 tabun, but is not suitable for the
treatment of cyclosarin poisonings.104
The metabolism and disposition of K-48 are barely known. The brain is the
primary target organ of organophosporous agents; therefore, it is one of the crucial

31
points of the newly synthesized oximes to be able to cross the blood-brain barrier and
reactivate the brain cholinesterase enzymes.104 Poor penetration of K-48 molecule
through the BBB is observed which is related to its hydrophilic properties. Its entry is
not similar to or even far less than that of pralidoxime and obidoxime.108 K-48 shows
relatively high dose-normalized plasma AUC value compared to pralidoxime which
might be beneficial as an antidote. Following i.m. and i.p. administration of K-48, a
rapid rise in its blood concentration was found. The t1/2 after i.m. administration is 83
minutes, the elimination of parent compound followed zero-order kinetics. The
pharmacokinetics of the K-48 compound seems to be favourable in comparison to
pralidoxime.109 An important contribution to understand the mechanism of action of K-
48 and other oximes is to investigate their disposition, metabolism and elimination.

32
2. RESEARCH OBJECTIVES Determination of the effect of streptozotocin induced diabetes and insulin
treatment on the rat intestinal metabolism. It is little known whether experimental
diabetes influences the metabolising capacity of the small intestine. The study focused
on the changes in total CYP content and CYP3A - a predominant isoenzyme in human
and also highly expressed in rat intestine - catalytic activity in insulin treated and
untreated diabetes in comparison to control. The questions were as follows:
How does the diabetic state influence the intestinal P450 mediated metabolism?
Is there any correlation between intestinal CYP3A catalytic activity and blood
glucose concentration (an inverse indicator of insulin level)?
Study of the predominant hepatic isoenzymes in insulin treated and untreated
long-term diabetes mellitus. The aim of this study was to observe the changes in
mRNA expression of the CYP1A2, CYP2B1/2, CYP2C11, CYP2C13, CYP2C22,
CYP2C23, CYP2D2, CYP2E1, CYP3A1, CYP3A2 and FMOs. The activity of
phenacetin, aminopyrine, mephenytoin, tolbutamide, bufuralol, chlorzoxazone,
testosterone and benzydamine metabolising enzymes were determined. Our inquiries
were as follows:
How does long-term diabetes affect the cytochrome P450 mRNA expression and
catalytic activity?
Is the altered cytochrome P450 mediated metabolism sensitive for a nine day
period insulin treatment?
Is the mRNA expression of CYP2C11 also reflected in the protein expression
and catalytic activity in treated and untreated diabetes?
Have diabetes and insulin treatment any effect on other CYP2C isoenzymes?
Metabolism of diclofenac in streptozotocin induced diabetes. Our experiments were
focused on the determination of enzyme kinetic parameters of diclofenac 4’-
hydroxylase with control, diabetic and insulin treated rat liver microsomes. The
questions were as follows:
33
Does long-term diabetes modify the enzyme kinetic parameter of diclofenac 4’-
hydroxylase?
Does the metabolism of diclofenac change in diabetic state according to in vitro prediction?
In vitro and in vivo ADME parameters of the organophosphate antidote, K-48. The
distribution, metabolism and elimination of PACERs are essential to understand their
mechanism. In silico, in vitro and in vivo experiments were used for the assessment of
K-48 metabolism, its distribution in serum, CSF and in the brain and its elimination by
means of urine was investigated. The questions were as follows:
Has diabetes an effect on the metabolism of K-48?
Do the in silico predicted metabolites also appear in microsomal metabolism
studies?
Can K-48 or its metabolite be found in rat serum, CSF and urine following i.m.
injection?
Is it possible for K-48 or its metabolite to enter the brain?

34
3. MATERIALS AND METHODS
3.1. MATERIALS
All biochemicals used were of the highest purity available from commercial
sources. Streptozotocin, diclofenac sodium, sodium dithionite, glucose-6-phosphate,
glucose-6-phosphate dehydrogenase, EDTA, dithiotreitol, dimethyl sulfoxide, sodium
citrate, 6ß-hydroxy testosterone, aminopyrine, acetaminophen, benzydamine, bufuralol,
chlorzoxazone, 6-hydroxy chlorzoxazone, tolbutamide, 1-octane sulfonic acid sodium
salt, phosphoric acid and trifluoroacetic acid were purchased from Sigma-Aldrich Corp.
(St. Louis, MO, USA). 1’-hydroxy bufuralol, S-mephenytoin, 4’-hydroxy S-
mephenytoin, 4’-hydroxy tolbutamide were obtained from Ultrafine (Manchester, UK).
Testosterone, phenacetin, PMSF and 70 % perchloric acid were supplied by Fluka
(Buchs, Switzerland). Potassium chloride, Tris, sodium pyrophosphate, NADPH,
magnesium chloride and glycerin were acquired from Reanal (Budapest, Hungary).
Heparin (Heparibene®) was obtained from Ratiopharma GmbH (Ulm, Germany). 4’-
hydroxy diclofenac was purchased from BD Bioscience (Woburn, MA, USA). K-48
was synthesized in the Laboratory of Kamil Kuca (Department of Toxicology, Faculty
of Military Health Sciences, Hradec Kralove, Czech Republic) by a method published
earlier.106 Benzydamine N-oxide metabolite was synthesized in the Chemistry Faculty
of Gedeon Richter Plc. (Budapest, Hungary). Methanol gradient grade, acetonitril
gradient grade, ammonium acetate, disodium hydrogen phosphate dehydrate and citric
acid monohydrate from Merck (Darmstadt, Germany) were used for HPLC analysis.
For insulin treatment two different protocols were used. Insulin (Ultratard)
purchased from Novo Nordisk (Novo Allé, Denmark) was used in intestinal metabolism
studies. The protocol for the long-term diabetes prescribed Humulin N insulin obtained
from Eli Lilly and Company (Indianapolis, IN, USA) and Insulatard acquired from
Novo Nordisk (Novo Allé, Denmark). The blood glucose level was measured by an
AccuCheck® Active Glucotrend kit supplied by Roche Diagnostic Ltd. (Mannheim,
Germany).

35
3.2. ANIMALS AND INDUCTION OF DIABETES
3.2.1. Model for intestinal metabolism studies
The study was carried out in accordance with the Declaration of Helsinki. Male
Sprague-Dawley rats (160-170 g) were purchased from Harlan (Holland). Rats were
maintained at 20-25 °C on a 12-h light/12-h dark cycle, with access to water and food
ad libitum. Diabetes was induced by a single intraperitoneal injection of buffered
solution (0.1 mol/L citrate, pH 6.0) of streptozotocin at doses of 70 mg/kg. The animals
were considered diabetic if their blood glucose concentrations rose above 350 mg/dL on
the 4th day following streptozotocin treatment. The animals were separated in 3 groups:
control (n=8); diabetic rats treated with streptozotocin at 70 mg/kg dose (n=8), D70;
diabetic rats treated with streptozotocin at 70 mg/kg dose and from the 5th day insulin
treatment was initiated with gradually increased doses (on day 1: 20, day 6: 40, day 7:
50 and from the day 8: 2x75 IU/kg/day) (n=8), ID70. During insulin treatment the blood
glucose level was checked twice daily by Glucotrend kit (Mannheim, Germany).
Animals were sacrificed by cervical dislocation 2 weeks after the streptozotocin
treatment in a short interval so as to avoid circadian variation. Approximately the first
30 centimetres of duodenum and jejunum were removed and intestinal microsomes
were prepared.
3.2.2. Model for hepatic metabolism studies
Male Sprague-Dawley rats (200-250 g) were purchased from ToxiCoop (Budapest,
Hungary). Rats were maintained at 20-25 °C on a 12-h light/ 12-h dark cycle, with
access to water and food ad libitum. Diabetes was induced by a single injection of a
buffered solution (0.1 mol/L citrate, pH 6.0) of streptozotocin at dosage of 55 mg/kg
intravenously (on day 0). The control animals (n=5) were treated by a single
intravenous injection of 0.1 mol/L citrate buffer solution (pH 6.0) without
streptozotocin at the same time. The animals were considered diabetic if their blood
glucose concentrations increased above 350 mg/dL on the 20th day following

36
streptozotocin treatment. At that time the streptozotocin treated rats were further
separated into two groups: diabetic rats (D55; n=12) and insulin treated diabetic rats
(ID55; n=14). Insulin was administered subcutan twice daily from the twentieth day at a
dosage of 20 IU/kg at 8.30 a.m. (Humulin N) and again 30 IU/kg at 4.30 p.m.
(Insulatard) for duration of a nine day period. All animals were starved for two hours
before measuring their blood glucose levels and carrying out of insulin treatment.
During insulin administration, the blood glucose concentrations were checked daily on
diabetic rats and twice a day on insulin treated diabetic rats. Animals were sacrificed 28
days after streptozotocin treatment, the liver was isolated from the animals and hepatic
microsomes were prepared.
3.3. PREPARATION OF INTESTINAL AND HEPATIC MICROSOMES
The livers were homogenized in 1.15 % KCl containing Tris-HCl buffer (0.1 M,
pH 7.4) with the volume/mass ratio of 2:1 buffer (mL) and liver (g) or intestine (g).110
The buffer also contained 0.2 mM EDTA, 0.1 mM dithiotreitol, 0.1 M Tris, 1.15 % KCl
and 10 % glycerin. The pH was adjusted with HCl to 7.4.
The intestinal microsomes were prepared according to the method of Stohs and
co-workers.110 The proximal part of the intestine was removed, perfused by ice-cold,
isotonic, buffered saline, gently scraped with a glass microscope slide and suspended in
the same buffer as described above but it contained PMSF and heparin additionally.
Individual rat liver and intestinal microsomes were prepared by differential
centrifugation (the homogenate was centrifuged for 15 min at 9000 x g, the supernatant
was ultracentrifuged for 60 min at 105 000 x g). The microsomal pellets obtained were
resuspended in the same buffer.
The microsomal protein content was measured with alkaline Folin phenol
reagent by the method described by Lowry et al. (1951) with bovine serum albumin as
standard.111 2 mL mixture of three reagents (A: 10 mL 0.2 N NaOH + 4 % Na2CO3, B:
0.2 mL 2 % K-Na-tartrate, C: 0.2 mL 1 % CuSO4) were added to equal volume of
microsomal suspension (0.25 %). After 10 minutes, 0.2 mL of Folin-Ciocalteu phenol
reagent was added to it. Following 30 minutes of exposure the absorbance of violet Cu-

37
complex in the samples was determined at 750 nm by Beckman DU-30
spectrophotometer (Beckman Instruments Inc., Fullerton, CA, USA).
Total cytochrome P450 content was essentially determined with a Hitachi U-3300
spectrophotometer (Nissei Sangyo Co. Ltd., Tokyo, Japan) by the method established
by Greim.112 1.2 mL of microsomal suspension was bubbled by carbon monoxide for
15-20 seconds (20-30 bubbles) and divided into two aliquots (i.e. sample and reference
cell). The aliquot in the sample cell was reduced by a few crystals of solid dithiotreitol
and the differential spectrum was recorded. P450 concentrations (nmol/mg protein)
were calculated from the difference of absorbancies measured at 450 and 490 nm using
ε=91 mM-1cm-1.
3.4. ENZYMATIC ASSAYS
3.4.1. CYP1A index reaction: Phenacetin O-dealkylation
CYP1A2 specific activity was measured by the deethylation of phenacetin.
Incubations were carried out in incubation mixtures containing 6.25 mM sodium
pyrophosphate, 5 mM MgCl2, 5 mM glucose 6-phosphate, 1 U/mL glucose 6-phosphate
dehydrogenase in a final volume of 0.5 mL, 0.1 mM Tris-HCl buffer, pH 7.4. The
hepatic microsomal protein content was 0.25 mg/mL, the substrate concentration was
400 μM. The reactions were initiated by adding 0.5 mM NADPH. The incubation was
carried out for 20 minutes in a shaking water bath at 37 °C. After the indicated time the
reaction was stopped by 500 μL of ice-cold methanol. Samples were placed at -20 °C
for ten minutes. Then the samples were centrifuged for 10 minutes at 10000 x g, at 4 °C.
The supernatant was injected onto HPLC. The analytical measurement was performed
on a Merck-Hitachi LaChrom HPLC system equipped with a UV detector. Purospher
STAR RP-18e 125 x 2 mm (5 μm) column (Merck, Darmstadt, Germany) operated at
0.2 mL/min flow rate, maintained at 40 °C. Acetaminophen (RT: 5.98 minutes) was
determined by using mobile phases of the mixture of 35 mL methanol and 265 mL 25
mM ammonium-acetate (A) and methanol (B) with a gradient (A of 100 % (0 min), 60
% (15 min), and 100 % (20-35 min)). UV detection was at 244 nm.
38
3.4.2. CYP2B/3A index reaction: Aminopyrine N-demethylation
Aminopyrine N-demethylation was determined by measuring formaldehyde
formation by the method of Nash.113 The substrate concentration was 4 mM; the
microsomal protein concentration used was 1 mg/mL in a final volume of 2 mL. The
reaction was initiated by the addition of NADPH. The incubation was carried out for 15
minutes in a shaking water bath at 37 °C. After the indicated time the reaction was
stopped by an equivalent amount of 20 % TCA. Then the samples were centrifuged for
20 minutes at 3000 x g, at 4 °C. In order to develop the colour reaction 2 mL of Nash
reagent was added to 1.5 mL of supernatant and left in a water bath at 37 °C, without
shaking. After 30 minutes, the samples were measured at 410 nm by spectrophotometer
(Beckman DU-30, Beckman Instruments Inc., Fullerton, CA, USA). The produced
formaldehyde concentration was determined.
3.4.3. CYP2C index reactions: Tolbutamide and mephenytoin 4’-hydroxylation
CYP2C specific activity was measured by the hydroxylation of tolbutamide and
mephenytoin. Incubations were carried out in incubation mixtures containing 6.25 mM
sodium pyrophosphate, 5 mM MgCl2, 5 mM glucose 6-phosphate, 1 U/mL glucose 6-
phosphate dehydrogenase in a final volume of 0.5 mL, 0.1 mM Tris-HCl buffer, pH 7.4.
The hepatic microsomal protein content was 0.25 mg/mL and the substrate
concentration was 1.5 mM in the reaction of tolbutamide hydroxylation. 1 mg/mL
hepatic microsomal protein concentration and 600 μM substrate concentration were
used for mephenytoin hydroxylation. The reactions were initiated by adding 0.5 mM
NADPH. The incubation was carried out for 10 minutes in the case of tolbutamide and
30 minutes in the case of mephenytoin, in a shaking water bath at 37 °C. After the
indicated time the reaction was stopped by 500 μL of ice-cold methanol. Samples were
placed at -20 °C for ten minutes. Then the samples were centrifuged for 10 minutes at
10000 x g, at 4 °C. The supernatant was injected onto HPLC. The analytical
measurement was performed on a Merck-Hitachi LaChrom HPLC system equipped
with a UV detector.

39
4’-hydroxy tolbutamide (RT: 6.93 minutes) was determined by using Purospher
STAR RP18e 125 x 4 mm (5 μm) column (Merck, Darmstadt, Germany) operated at 0.8
mL/min flow rate, maintained at 40 °C. Elution was applied to the mixture of 23 %
methanol and 77 % 0.1 M ammonium-acetate (A) and methanol (B) with a gradient (A
of 100 % (7.5 min), 60 % (11-13 min), and 100 % (13.5-22 min)). UV detection was at
230 nm.
4’-hydroxy S-mephenytoin (RT: 9.16 minutes) was determined by using
Purospher STAR RP-18e 250 x 3 mm (5 μm) column (Merck, Darmstadt, Germany)
operated at 0.4 mL/min flow rate, maintained at 35 °C. Elution was applied to a mixture
of 165 mL methanol, 300 mL 0.1 % ammonium-acetate and 2 mL 10 % Ammonium
hydroxide. UV detection was at 228 nm.
3.4.4. CYP2D index reaction: Bufuralol 1’-hydroxylation
CYP2D catalytic activity was determined by the production of 1’-hydroxy
bufuralol. Incubations were carried out in incubation mixtures containing 6.25 mM
sodium pyrophosphate, 5 mM MgCl2, 5 mM glucose 6-phosphate, 1 U/mL glucose 6-
phosphate dehydrogenase in a final volume of 0.5 mL, 0.1 mM Tris-HCl buffer, pH 7.4.
The hepatic microsomal protein content was 0.25 mg/mL, the substrate concentration
was 500 μM. The reactions were initiated by adding 0.5 mM NADPH. The incubation
was carried out for 10 minutes in a shaking water bath at 37 °C. After the indicated time
the reaction was stopped by 500 μL of ice-cold methanol. Samples were placed at -20
°C for ten minutes. Then the samples were centrifuged for 10 minutes at 10000 x g, at 4
°C. The supernatant was injected onto HPLC. The analytical measurement was
performed on a Merck-Hitachi LaChrom HPLC system equipped with an UV detector.
Purospher STAR RP-18e 125 x 4 mm (5 μm) column (Merck, Darmstadt, Germany)
operated at 0.8 mL/min flow rate, maintained at 40 °C. 1’-hydroxy bufuralol (RT: 9.55
min) was determined by using mobile phases of 30 % methanol and 70 % 0.1 M
ammonium-acetate (A) and methanol (B) with a gradient (A of 100 % (9 min), 40 %
(15-18 min), and 100 % (20-35 min)). UV detection was at 250 nm.

40
3.4.5. CYP2E1 index reaction: Chlorzoxazone 6-hydroxylation
Chlorzoxazone biotransformation into 6-hydroxy chlorzoxazone was used for
the determination of CYP2E1 activity. Incubations were carried out in incubation
mixtures containing 6.25 mM sodium pyrophosphate, 5 mM MgCl2, 5 mM glucose 6-
phosphate, 1 U/mL glucose 6-phosphate dehydrogenase in a final volume of 0.5 mL, 0.1
mM Tris-HCl buffer, pH 7.4. The hepatic microsomal protein content was 0.2 mg/mL,
the substrate concentration was 80 μM. The reactions were initiated by adding 0.5 mM
NADPH. The incubation was carried out for 15 minutes in a shaking water bath at 37
°C. After the indicated time the reaction was stopped by 500 μL of ice-cold methanol.
Samples were placed at -20 °C for ten minutes. Then the samples were centrifuged for
10 minutes at 10000 x g, at 4 °C. The supernatant was injected onto HPLC. The
analytical measurement was performed on a Merck-Hitachi LaChrom HPLC system
equipped with an UV detector. Purospher STAR RP-18e 125 x 4 mm (5 μm) column
(Merck, Darmstadt, Germany) operated at 0.5 mL/min flow rate, maintained at 40 °C.
6-hydroxy chlorzoxazone (RT: 6.05 min) was determined by using mobile phases of the
mixture of 500 mL methanol, 1250 mL 20 mM ammonium-acetate and 10 mL 10%
TFA. UV detection was at 285 nm.
3.4.6. CYP3A index reaction: Testosterone 6ß-hydroxylation
CYP3A specific activity was measured by the production of 6ß-hydroxy
testosterone. Incubations were carried out in incubation mixtures containing 6.25 mM
sodium pyrophosphate, 5 mM MgCl2, 5 mM glucose 6-phosphate, 1 U/mL glucose 6-
phosphate dehydrogenase in a final volume of 0.5 mL, 0.1 mM Tris-HCl buffer, pH 7.4.
The hepatic and intestinal microsomal protein content was 0.25 and 1.75 mg/mL,
respectively, and the substrate concentration was 500 μM in both cases. The reactions
were initiated by adding 0.5 mM NADPH. The incubation was carried out for 5 or 15
minutes in a shaking water bath at 37 °C. After the indicated time the reaction was
stopped by 500 μL of ice-cold methanol. Samples were placed at -20 °C for ten minutes.
Then the samples were centrifuged for 10 minutes at 10000 x g, at 4 °C. The

41
supernatant was injected onto HPLC. The analytical measurement was performed on a
Merck-Hitachi LaChrom HPLC system equipped with a UV detector according to the
method of Dalmadi et al.114 Purospher STAR RP-18e 125 x 4 mm (5μm) column
(Merck, Darmstadt, Germany) operated at 0.8 mL/min flow rate, maintained at 40 °C.
6β-hydroxy testosterone (RT: 8.3 min) was determined by using mobile phases of
methanol/ 0.1 M ammonium-acetate, 45:55 (A) and methanol (B) with a gradient (A of
100 % (7 min), 40 % (15-18 min), and 100 % (21-26 min)). UV detection was at 254
nm.
3.4.7. FMO index reaction: Benzydamine N-oxygenation
Benzydamine/ benzydamine N-oxide (BZYNO) transformation was used as an
FMO specific index reaction. The incubation medium contained 0.2 mg/mL rat liver
microsomal protein, 0.4 mM NADPH, 0.4 mM glucose 6-phosphate, 0.8 IU/mL glucose
6-phosphate dehydrogenase and 0.2 mM DETAPAC in a final volume of 0.5 mL of 50
mM phosphate buffer (pH 8.5). The final concentration of BZY was 500 μM.
Incubation time and microsomal protein concentration was within the linear range of
metabolite formation. After 30 minutes the reaction was stopped by 500 μL of ice-cold
methanol. Samples were placed at -20 °C for ten minutes. Then the samples were
centrifuged for 10 minutes at 10000 x g, at 4 °C. The supernatant was injected onto
HPLC. The analytical measurement was performed on a Merck-Hitachi LaChrom
HPLC system equipped with a UV detector. Purospher STAR RP-18e 125 x 4 mm
(5μm) column (Merck, Darmstadt, Germany) operated at 0.8 mL/min flow rate,
maintained at 30 °C. BZYNO was monitored at 306 nm. Mobile phase consisted of 58
% methanol in 0.1 M Ammonium acetate with isocratic elution. Under these
chromatographic conditions BZYNO eluted at 6.8 minutes.
3.5. DETERMINATION OF mRNA EXPRESSION
Total RNA isolation was carried out using the RNeasy Mini Kit according to the
instructions of the manufacturer (Qiagen Sciences, Germantown, MD, USA). Hence,

42
30-30 mg of liver samples of each examined animal was placed into 0.5 mL RNA
stabilization reagent. Following homogenization in lysing buffer containing guanidine
isothiocyanate, centrifugation and addition of 0.5 mL of 70 % ethanol to the
supernatant, the sample was applied to an RNeasy mini column to discard from proteins
and DNA. The mRNA was eluted by 50 μL of RNase-free water. The concentration and
integrity of purified RNA were checked by Agilent 2100 bioanalyser using the RNA
6000 Nano Assay kit (Agilent Technologies, Santa Clara, CA, USA). Full-length first
strand cDNA was synthesized using “Superscript III First-Strand Synthesis SuperMix
for qRT PCR” (Invitrogen Corporation, Carlsbad, CA, USA) with a random primer and
the addition of 0.5 μg total RNA. The reaction was carried out at 25 °C and at 50 °C
over a period of 10 and 30 minutes, respectively. The quantitative real-time PCR was
performed using Taqman Universal PCR Master Mix (Applied Biosystems, Foster City,
CA, USA) with standard conditions on the 7900HT Real-Time PCR system (Applied
Biosystem, Foster City, CA, USA). Specific amplifications of cDNA were performed
using TaqMan® Gene Expression Assays (Applied Biosystem, Foster City, CA, USA)
consisting of PCR primers and FAMTM dye-labelled TaqMan® MGB probe. Taqman
assays for rCYP1A2 (Rn00561082_m1), rCYP2B1/2 (Rn01457879_m1), rCYP2C11
(Rn01502201_m1), rCYP2C13 (Rn00593388_g1), rCYP2C22 (Rn00593377_m1),
rCYP2C23 (Rn00582954_m1), rCYP2D2 (Rn00562419_m1), rCYP2E1
(Rn00580624_m1), rCYP3A1 (Rn01412959_g1), rCYP3A2 (Rn00756461_m1),
rFMO1 (Rn00562945_m1), rFMO3 (Rn00584825_m1) and endogenous control
rGAPDH (Rn99999916_s1) were used. The threshold cycle (Ct) was determined and
relative quantitation (RQ) was calculated using the comparative Ct method with
RealTime Statminer (Integromics, Granada, Spain) as follows:
CtGAPDH = average for GAPDH of the sample in question
CtCYP/ FMO = individual value of the sample in question
ΔCt = CtCYP/ FMO-CtGAPDH
ΔΔCtCYP/ FMO treated = ΔCtCYP/ FMO treated-average (ΔCtCYP/ FMO control)
Fold-induction CYP or FMO treated = 2-ΔΔCtCYP/ FMO treated

43
3.6. WESTERN BLOT ANALYSIS OF CYP2C11 PROTEIN LEVEL
For Western blot analysis a 12 % (w/v) Tris-Glycine PAGEr GOLD Precast Gel
(Lonza, Rockland, ME, USA) was used. Microsomes were solubilised in Laemmli
Sample buffer solution (BioRad Laboratories, Hercules, CA, USA) containing 5 % (v/v)
2-mercaptoethanol and heated at 95 °C for 5 minutes. Equal amounts of proteins
(protein concentration was determined by the method of Lowry et al, 1951) were
analyzed. Proteins were transferred onto Immobilion-P PVDF membrane (10 V, 60
min) after the electrophoresis. 30 mM TBS (Tris buffer solution, pH 10.4) anode buffer
and 40 mM TBS containing 40 mM glycine cathode buffer were applied for the protein
transfer. All the solutions included 10 % methanol. Blocking was done with
SuperBlock® Dry Blend (TBS) Blocking Buffer solution (Pierce, Rockford, IL, USA).
Primary labelling was carried out with rabbit polyclonal anti-Cytochrome P450 2C11
(1:1500) purchased from Santa Cruz Biotechnology (Santa Cruz, CA, USA) and goat
Actin C-11 (1:200) antibody obtained from Abcam Plc. (Cambridge, UK). Biotynilated
anti-rabbit IgG (1:2000) and biotynilated anti-goat IgG (1:2000) acquired from Vector
Laboratories (Burlingame, CA, USA) were used as secondary antibodies. Antibodies
were diluted in the 10-fold diluted blocking solution. Washing was done between steps
with Tris Buffer Solution (TBS). After incubating with extravidine peroxidase (Sigma-
Aldrich Corp., St. Louis, MO, USA) in 1:5000 dilutions, DAB Substrate kit (Pierce,
Rockford, IL, USA) was used for development.
3.7. INCUBATION CONDITIONS FOR THE DETERMINATION OF
DICLOFENAC 4’-HYDROXYLASE ENZYME KINETIC
PARAMETERS
Enzyme kinetic parameters KM and Vmax for the formation of 4’-hydroxy diclofenac
from diclofenac were determined. Incubations were carried out in incubation mixtures
containing 6.25 mM sodium pyrophosphate, 5 mM MgCl2, 5 mM glucose 6-phosphate,
1 U/mL glucose 6-phosphate dehydrogenase and 0.25 mg/mL microsomal protein in a
final volume of 0.5 mL, 0.1 mM Tris-HCl buffer, pH 7.4. The reactions were initiated

44
by adding 0.5 mM NADPH. The incubation medium contained 1.5625, 3.125, 6.25,
12.5, 25, 50, 100 μM diclofenac (dissolved in water) and allowed to incubate 20
minutes in a water bath shaker maintained at 37 °C. The reactions were terminated by
adding an equal volume of ice-cold methanol. All incubations were run in triplicate.
Samples were analyzed by a Merck-Hitachi LaChrom Elite HPLC (Darmstadt,
Germany) device following centrifugation (2500 x g, 0 °C, 30 min). The supernatant
was injected onto a Purospher STAR RP18e 125 x 3 mm (5 μm) column (Merck,
Darmstadt, Germany). Isocratic elution was applied by 0.1 M ammonium acetate
containing 45 % methanol and the mobile phase was delivered at 0.45 mL/min flow
rate. 4’-hydoxy diclofenac was detected at 267 nm with the retention time of 7.32
minutes.
The kinetic constants (KM, Vmax) were calculated using Lineweaver-Burk plot by
linear regression. The intrinsic clearance (CLint) for the disappearance of diclofenac was
calculated by dividing the respective Vmax by the respective KM.
3.8. IN SILICO, IN VITRO AND IN VIVO STUDIES OF K-48
3.8.1. In silico prediction of K-48 metabolism
Prediction of metabolic pattern and calculation of lipophilicity (logP) were done
using the Pallas Program of CompuDrug Ltd. (Budapest, Hungary).
3.8.2. Incubation conditions of in vitro microsomal metabolism study
K-48 (50 μM) was incubated with control rat liver or diabetic rat liver
microsomes. Incubation medium contained 6.25 mM sodium pyrophosphate, 5 mM
MgCl2, 5 mM glucose 6-phosphate, 1 U/mL glucose 6-phosphate dehydrogenase in a
final volume of 2 mL, 0.1 mM Tris-HCl buffer, pH 7.4 (37 °C). The microsomal protein
content was 0.5 mg/mL. The reactions were initiated by adding 0.5 mM NADPH.
Control incubation was carried out with microsomal protein and NADPH without K-48

45
for the duration of 30 minutes. The incubation was run in a shaking water bath at 37 °C,
sampling was done at 0 and 30 minutes. After the indicated time the reaction was
stopped by an equal volume of ice-cold methanol or by 70 % ice-cold perchloric acid
(in the case of HPLC-ECD analysis). Samples were placed at -20 °C for ten minutes.
Then the samples were centrifuged for 10 minutes at 10000 x g, at 4 °C. The
supernatant was injected onto HPLC. Tentative metabolites and unchanged compounds
were measured.
3.8.3. In vivo animal studies
Male Wistar rats (Toxicoop, Budapest, Hungary) were kept in an animal house
regulated for temperatures (22–24 °C), humidity (55±6 %), and using a 12-h light–dark
cycle. Five days after arrival, 22.31 mg (50 μM) of K-48 freshly dissolved in distillated
water was injected intramuscularly into the animals (weighing 213.3 ± 1.9 g) in a
volume of 0.2 mL. After treatment, the rats were placed in special individual cages,
where urine was collected. The rats were sacrificed after 60 min of observation. Blood
and cerebrospinal fluid (CSF) were taken. The brain was dissected immediately on an
ice-cold aluminium surface. In parallel experiments urine was collected for four hours.
All samples were kept frozen at −80 °C until analysis. Serum, CSF and urine samples
were mixed with an equal volume of 20 % trichloroacetic acid (TCA) to precipitate the
protein, and centrifuged in an Eppendorf centrifuge (A. Hettich, Tuttlingen, Germany)
at 10,000 × g for 10 min at 4 °C. Whole-brain samples were homogenized in an equal
volume of 20 % trichloroacetic acid (TCA) by an Ultra Turrax T25 Janke & Kunkel
homogenizer (IKA Labortechnik, Staufen, Germany) at 20,000 rpm/min for 10 sec at
room temperature, then 1.0 mL of the homogenate was diluted with an equal volume of
10 % TCA. The supernatant obtained after repeated centrifugation in the Eppendorf
centrifuge at 10000 x g (10 min at 4 °C) was used for HPLC analysis.

46
3.8.4. HPLC analysis
Samples of in vitro metabolism studies of K-48 molecule in STZ diabetes were
analyzed by reversed-phase high-performance liquid chromatography with
electrochemical detection (HPLC-ECD). A Jasco pump (PU1580, Tokyo, Japan) was
used; the samples were injected using a 50 μL loop and the column temperature was 35
°C. The precolumn was Zorbax RX-C18 12.5 x 4.6 mm while the analytical column was
Zorbax RX-18 250 x 4.6 mm (5 μm); both columns were purchased from Agilent
Technologies Inc. (Santa Clara, CA, US). The chromatogram was detected by an Intro
amperometric detector (Antec; Leyden B.V., Zoeterwoude, the Netherlands) at Eox =
0.65 V and a sensitivity of 10 nA, with a 0.1 sec time filter. The mobile phase contained
56.2 mM Na2HPO4, 47.9 mM citric acid, 0.027 mM Na2EDTA, 0.925 mM octane
sulfonic acid, and acetonitrile-phosphate buffer 80:950, v/v; its flow rate was 1mL/min.
The pH was adjusted to 3.7 with 85 % H3PO4. The chromatograms were electronically
stored and evaluated using Borwin 1.21 chromatographic software (JMBS, Le Fontanil,
France).
Samples from in vivo and in vitro metabolism studies with control microsomes were
also analyzed by HPLC-MS. A 1100 HPLC/MSD SL system from Agilent
Technologies (Waldbronn, Germany) which consisted of a binary pump, degasser,
automatic injector, diode array detector, thermostat, and mass-selective detector. An
electrospray was used in positive ionization mode in the range of 100–1000 atomic
mass units (amu). The step size was 0.2 min, while the drying gas flow and the
temperature were 13 L/min and 350 °C, respectively. The nebulizer gas pressure was 35
psig, and a capillary voltage of 3000 V was applied. A 4.6 ×150 mm column containing
5 μm Zorbax Eclipse XDB-C8 (Agilent Technologies Inc., Santa Clara, CA, US) was
used for separation. The mobile phase was methanol–0.1 M ammonium acetate (8:92)
in isocratic mode. Ultraviolet absorbance was detected at 286 nm.
47
3.9. DATA ANALYSIS
Statistical analysis was performed by a GraphPad Prism 4.0 (GraphPad Software
Inc., La Jolla, CA, US). Normality test (Shapiro-Wilk’s test) and homogeneity test
(Bartlett’s test) were run for all datasets in order to determine whether they have
Gaussian distribution and homogeneity in their variances. In the case of parametric
distribution one-way analysis of variance was used which was followed by Tukey
multicomparison test if any significant change was shown, the same was done for all
enzyme activity and mRNA values. In the case of non-parametric distribution (despite
transformations); a Kruskal-Wallis multicomparison test was used. Mean, S.D. and
correlation coefficient were calculated by Confidence interval of 95%.

48
4. RESULTS
4.1. EFFECT OF DIABETES AND INSULIN TREATMENT ON INTESTINAL P450s
4.1.1. Physical and biochemical characteristics
Streptozotocin treated rats became diabetic with symptoms of polydipsia, polyuria,
hyperglycaemia and decreased rate of body weight gain appeared. The changes in the
physiological parameters among control, D70 and ID70 groups are summarized in
Table 6. Control rats consistently had blood glucose levels of approximately 100
mg/dL, while rats receiving 70 mg/kg doses of STZ displayed about a five-fold increase
in blood glucose levels: 536.1 mg/dL. Diabetic rats had a significant reduction in body
weight and wet liver weight compared to the control, at the time of sacrifice. Insulin
treatment of diabetic animals only partially compensated for the rise of blood glucose
level (391.4 mg/dL), but fully for the changes in body weight and wet liver weight,
which resulted in an enhanced relative wet liver weight.
Diabetic animals
70 mg/kg STZ i.m.
70 mg/kg STZ i.m. +
Insulin
Parameters Control animals
D70 ID70 Body wt. at sacrifice (g) 294 ± 13 175 ± 12*** 240 ± 21† Blood glucose (mg/dL) 101.2 ± 4.5 536.1 ± 18.7*** 391.4 ± 51.2
Wet liver weight (g) 12.8 ± 1.2 8.1 ± 0.7*** 14.8 ± 2.5††† Relative wet liver weight (mg liver/ g body wt.) 43.5 ± 3.1 46.2 ± 2.4 61.3 ± 7.3**
Table 6. Effect of streptozotocin induced diabetes and insulin treatment on various physical and biochemical parameters. Mean ± S.D. were calculated (n=5-9). **p ≤ 0.01 vs. control
values, ***p ≤ 0.001 vs. control values, †p≤ 0.05 values of D70 vs. ID70, †††p≤ 0.001 values of D70 vs. ID70
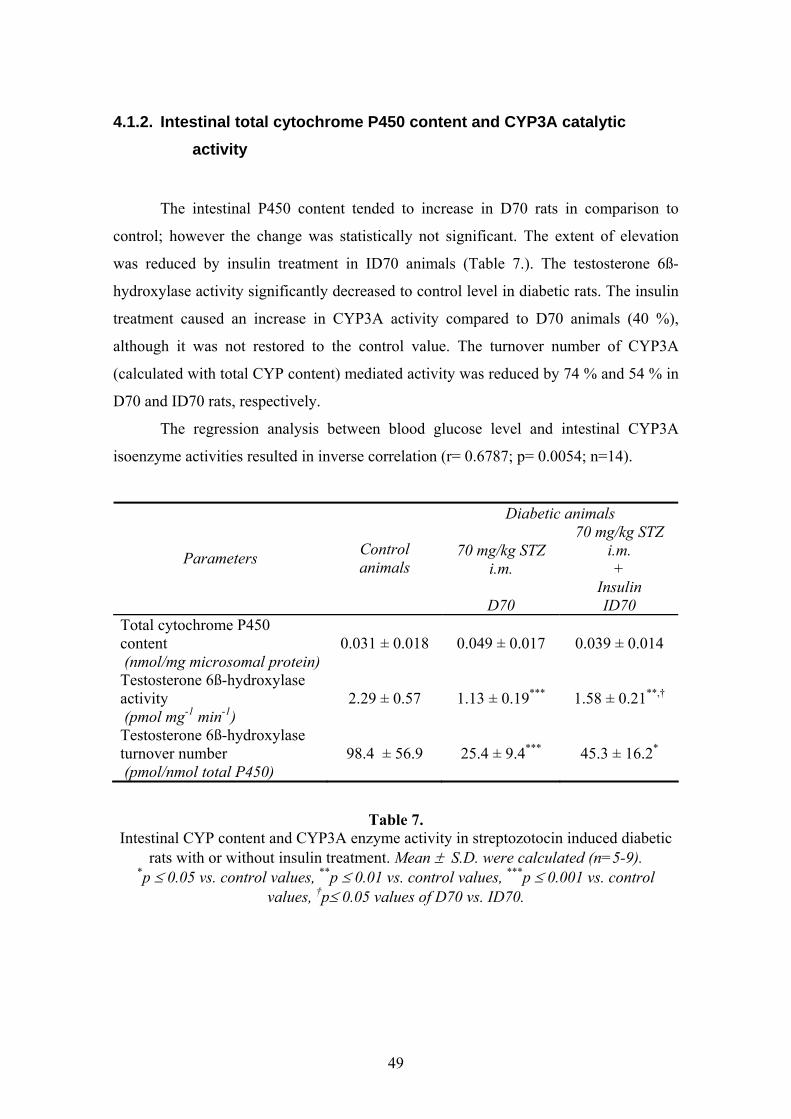
49
4.1.2. Intestinal total cytochrome P450 content and CYP3A catalytic activity
The intestinal P450 content tended to increase in D70 rats in comparison to
control; however the change was statistically not significant. The extent of elevation
was reduced by insulin treatment in ID70 animals (Table 7.). The testosterone 6ß-
hydroxylase activity significantly decreased to control level in diabetic rats. The insulin
treatment caused an increase in CYP3A activity compared to D70 animals (40 %),
although it was not restored to the control value. The turnover number of CYP3A
(calculated with total CYP content) mediated activity was reduced by 74 % and 54 % in
D70 and ID70 rats, respectively.
The regression analysis between blood glucose level and intestinal CYP3A
isoenzyme activities resulted in inverse correlation (r= 0.6787; p= 0.0054; n=14).
Diabetic animals
70 mg/kg STZ i.m.
70 mg/kg STZ i.m. +
Insulin
Parameters Control animals
D70 ID70 Total cytochrome P450 content (nmol/mg microsomal protein)
0.031 ± 0.018 0.049 ± 0.017 0.039 ± 0.014
Testosterone 6ß-hydroxylase activity (pmol mg-1 min-1)
2.29 ± 0.57 1.13 ± 0.19*** 1.58 ± 0.21**,†
Testosterone 6ß-hydroxylase turnover number (pmol/nmol total P450)
98.4 ± 56.9 25.4 ± 9.4*** 45.3 ± 16.2*
Table 7. Intestinal CYP content and CYP3A enzyme activity in streptozotocin induced diabetic
rats with or without insulin treatment. Mean ± S.D. were calculated (n=5-9). *p ≤ 0.05 vs. control values, **p ≤ 0.01 vs. control values, ***p ≤ 0.001 vs. control
values, †p≤ 0.05 values of D70 vs. ID70.

50
4.2. EFFECT OF DIABETES AND INSULIN TREATMENT ON HEPATIC CYTOCHROME P450s
4.2.1. Physical and biochemical characteristics
Streptozotocin treated rats became diabetic with symptoms of polydipsia,
polyuria, hyperglycaemia and decreased rate of body weight gain appeared. The
changes in the physiological parameters among the control, diabetic and insulin treated
diabetic groups are summarized in Table 8. The blood glucose concentration
significantly increased in D55 animals (546.6 mg/dL) in comparison to control (99.8
mg/dL). There was a substantial decrease in the rate of body gain and only a tendentious
decrease in wet liver weight (25 %) in the group of D55 compared to control. Insulin
treatment of diabetic animals significantly but only partially compensated for the rise of
blood glucose level (276.1 mg/dL); and changes in body weight but fully for the
changes in wet liver weight, which resulted in an enhanced relative wet liver weight.
There were no differences in the microsomal protein content among the three groups
investigated (data not shown).
Diabetic animals
55 mg/kg STZ i.v.
55 mg/kg STZ i.v. +
Insulin
Parameters Control animals
D55 ID55 Body wt. at sacrifice (g) 358 ± 4 207 ± 33*** 246 ± 27*† Blood glucose (mg/dL) 99.8 ± 1.6 546.6 ± 28*** 276.1 ± 85†††
Wet liver weight (g) 13.6 ± 0.3 10.2 ± 1.3 16.6 ± 3.7††† Relative wet liver weight (mg liver/g body wt.) 37.8 ± 0.7 50.2 ± 9.9 68.4 ± 15.5***†
Table 8. Effects of streptozotocin-induced diabetes and insulin treatment on various
physiological parameters. Mean ± SD were calculated (n=5-14) *p ≤ 0.05 vs. control; ***p ≤ 0.001 values vs. control; † p ≤ 0.05 values D55 vs. ID55; †††p ≤ 0.001 values D55
vs. ID55.

51
4.2.2. Results of mRNA expression studies
The total RNA was isolated by RNeasy Mini Kit. The RNAs prepared from the
samples analyzed were of high quality.
Gene expression of CYP1A2 isoenzyme
The mRNA level in rats received 55 mg/kg dose of STZ tended to increase by 24
%. Insulin treatment decreased significantly the gene expression of CYP1A2 which is
resulted a non-significant but lower expression (28 %) in comparison to the control
group (Figure 6.).
CYP1A2 mRNA
Control D55 ID550
1
2
†††
Rel
ativ
e am
ount
of C
YP1A
2 m
RN
A( ΔΔ
Ct)
Figure 6. Hepatic CYP1A2 mRNA level in diabetic rats with or without insulin treatment.
Mean ± S.D. were calculated (n=5-14). †††p ≤ 0.001 D55 vs. ID55.
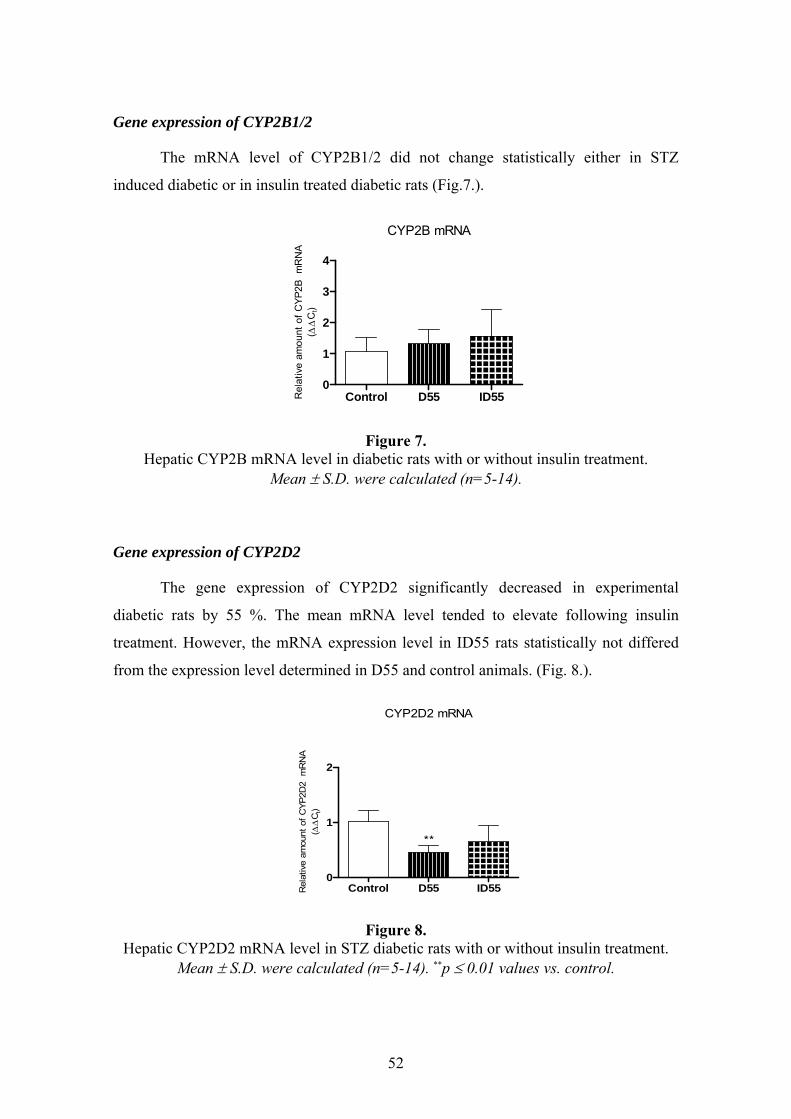
52
Gene expression of CYP2B1/2
The mRNA level of CYP2B1/2 did not change statistically either in STZ
induced diabetic or in insulin treated diabetic rats (Fig.7.).
CYP2B mRNA
Control D55 ID550
1
2
3
4
Rel
ativ
e am
ount
of C
YP2B
mR
NA
( ΔΔ
Ct)
Figure 7. Hepatic CYP2B mRNA level in diabetic rats with or without insulin treatment.
Mean ± S.D. were calculated (n=5-14).
Gene expression of CYP2D2
The gene expression of CYP2D2 significantly decreased in experimental
diabetic rats by 55 %. The mean mRNA level tended to elevate following insulin
treatment. However, the mRNA expression level in ID55 rats statistically not differed
from the expression level determined in D55 and control animals. (Fig. 8.).
CYP2D2 mRNA
Control D55 ID550
1
2
**
Rel
ativ
e am
ount
of C
YP2D
2 m
RN
A( ΔΔ
Ct)
Figure 8. Hepatic CYP2D2 mRNA level in STZ diabetic rats with or without insulin treatment.
Mean ± S.D. were calculated (n=5-14). **p ≤ 0.01 values vs. control.

53
Gene expression of CYP2E1
The gene expression of CYP2E1 elevated in rats which received 55 mg/kg dose
of STZ by 2.2-fold. The insulin treatment restored the gene expression of CYP2E1 to
control level. The decrease was significant when compared to D55 rats (Fig. 9.)
CYP2E1 mRNA
Control D55 ID550
1
2
3
4
††
*
Rel
ativ
e am
ount
of C
YP2E
1 m
RN
A( ΔΔ
Ct)
Figure 9. Hepatic CYP2E1 mRNA level in insulin treated and not treated streptozotocin induced
diabetes. Mean ± S.D. were calculated (n=5-14). *p ≤ 0.05 values vs. control, ††p ≤ 0.01 D55 vs. ID55
Gene expression of CYP3A1 and CYP3A2
The mRNA level of CYP3A1 tended to increase by 2.4 –fold in experimental diabetes;
however, a very high S.D. occurred. There was a significant decrease following insulin
treatment in gene expression level of CYP3A1 which resulted in the expression level of
the control. The gene expression of CYP3A2 changed only tendentiously in untreated
and insulin treated diabetic animals (Fig. 10.).
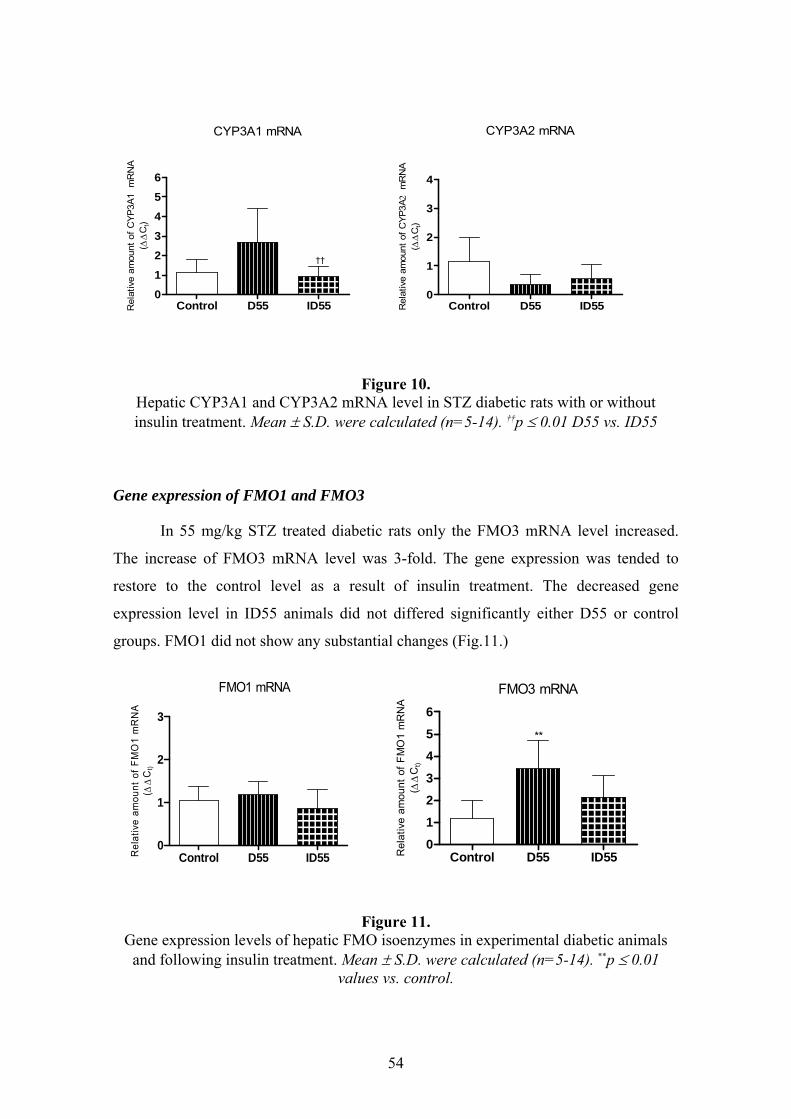
54
CYP3A1 mRNA
Control D55 ID550123
456
Rel
ativ
e am
ount
of C
YP3A
1 m
RN
A( ΔΔ
Ct)
††
CYP3A2 mRNA
Control D55 ID550
1
2
3
4
Rel
ativ
e am
ount
of C
YP3A
2 m
RN
A( ΔΔ
Ct)
Figure 10. Hepatic CYP3A1 and CYP3A2 mRNA level in STZ diabetic rats with or without insulin treatment. Mean ± S.D. were calculated (n=5-14). ††p ≤ 0.01 D55 vs. ID55
Gene expression of FMO1 and FMO3
In 55 mg/kg STZ treated diabetic rats only the FMO3 mRNA level increased.
The increase of FMO3 mRNA level was 3-fold. The gene expression was tended to
restore to the control level as a result of insulin treatment. The decreased gene
expression level in ID55 animals did not differed significantly either D55 or control
groups. FMO1 did not show any substantial changes (Fig.11.)
Control D55 ID550
1
2
3
FMO1 mRNA
Rel
ativ
e am
ount
ofF
MO
1 m
RN
A( Δ
ΔC
t)
FMO3 mRNA
Control D55 ID550123
456
**
Rel
ativ
e am
ount
of F
MO
1 m
RN
A( ΔΔ
Ct)
Figure 11. Gene expression levels of hepatic FMO isoenzymes in experimental diabetic animals
and following insulin treatment. Mean ± S.D. were calculated (n=5-14). **p ≤ 0.01 values vs. control.

55
Focusing on the changes in CYP2C isoenzymes
The mRNA expression of CYP2C11, CYP2C13 and CYP2C22 presented in a
significantly lower level in streptozotocin-induced diabetic rats in comparison to the
related control (Fig. 10.). The most evident decrease was seen at the gene expression of
CYP2C11 (95 %). No substantial loss was noticed at the mRNA expression of
CYP2C23. Insulin treatment only tended to compensate for the decrease of CYP2C11
and CYP2C13 mRNA expression. However, no significant differences could be shown
between insulin treated diabetic and control samples. There was only a slight, if any,
effect of insulin treatment on the gene expression level of CYP2C23 and CYP2C22.
The results show that diabetes does not influence the mRNA expression level of
CYP2C23 isoform (Fig. 12.).
CYP2C11 mRNA
Control D55 ID550
1
2
***
††
Rel
ativ
e am
ount
of C
YP2C
11 m
RN
A( ΔΔ
Ct)
CYP2C13 mRNA
Control D55 ID550
1
2
3
††
*
Rel
ativ
e am
ount
of C
YP2C
13 m
RN
A( ΔΔ
Ct)
CYP2C22 mRNA
Control D55 ID550
1
2
3
*
Rel
ativ
e am
ount
of C
YP2C
22 m
RN
A( ΔΔ
Ct)
CYP2C23 mRNA
Control D55 ID550
1
2
Rel
ativ
e am
ount
of C
YP2C
23 m
RN
A( ΔΔ
Ct)
Figure 12.
Hepatic CYP2C11, CYP2C13, CYP2C22 and CYP2C23 mRNA levels in STZ diabetic rats and insulin treated diabetic rats. Mean± S.D. were calculated (n=5-14). *p ≤ 0.05
values vs. control; ***p ≤ 0.001 values vs. control; ††p ≤ 0.01 D55 vs. ID55
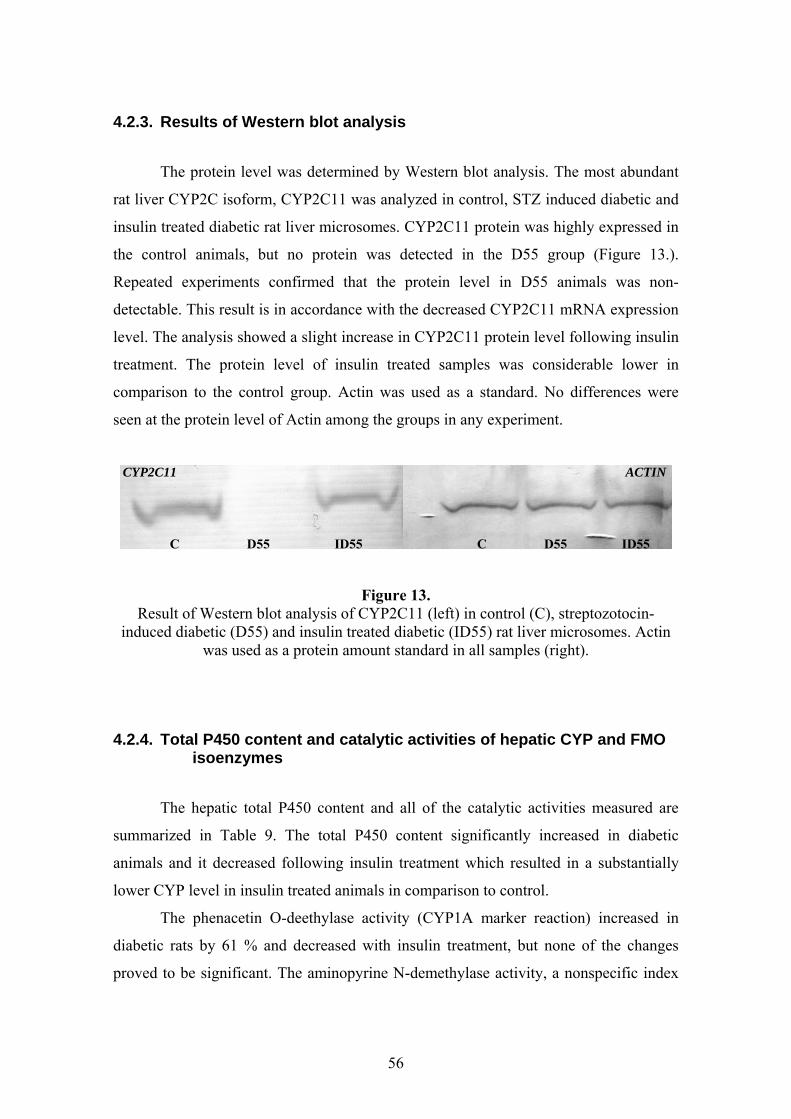
56
4.2.3. Results of Western blot analysis
The protein level was determined by Western blot analysis. The most abundant
rat liver CYP2C isoform, CYP2C11 was analyzed in control, STZ induced diabetic and
insulin treated diabetic rat liver microsomes. CYP2C11 protein was highly expressed in
the control animals, but no protein was detected in the D55 group (Figure 13.).
Repeated experiments confirmed that the protein level in D55 animals was non-
detectable. This result is in accordance with the decreased CYP2C11 mRNA expression
level. The analysis showed a slight increase in CYP2C11 protein level following insulin
treatment. The protein level of insulin treated samples was considerable lower in
comparison to the control group. Actin was used as a standard. No differences were
seen at the protein level of Actin among the groups in any experiment.
Figure 13. Result of Western blot analysis of CYP2C11 (left) in control (C), streptozotocin-
induced diabetic (D55) and insulin treated diabetic (ID55) rat liver microsomes. Actin was used as a protein amount standard in all samples (right).
4.2.4. Total P450 content and catalytic activities of hepatic CYP and FMO isoenzymes
The hepatic total P450 content and all of the catalytic activities measured are
summarized in Table 9. The total P450 content significantly increased in diabetic
animals and it decreased following insulin treatment which resulted in a substantially
lower CYP level in insulin treated animals in comparison to control.
The phenacetin O-deethylase activity (CYP1A marker reaction) increased in
diabetic rats by 61 % and decreased with insulin treatment, but none of the changes
proved to be significant. The aminopyrine N-demethylase activity, a nonspecific index
C D55 ID55 C D55 ID55
CYP2C11 ACTIN

57
reaction of CYP2B and CYP3A isoforms, did not change either in D55 or ID55 animals
in our experiment. The tolbutamide 4’-hydroxlase activity, an index reaction of CYP2C,
also did not change either in ID55 or D55 rats. However, the mephenytoin 4’-
hydroxylase, an alternative probe substrate for CYP2C, tended to increase (33 %) in
diabetes. The insulin treatment resulted in a non-significantly lower mephenytoin
hydroxylase activity in comparison to control. The change in mRNA expression was not
reflected in the CYP2C mediated activity. This observation led us to further studies with
this subfamily. The CYP2D-mediated bufuralol 1’-hydroxylation decreased in D55
animals and increased following insulin treatment; however, these changes were not
significant. The chlorzoxazone 6-hydroxylase considerable enhanced in diabetes by
3.3–fold. The insulin treatment fully compensated for the rise in CYP2E1 activity.
There was no change in CYP3A-mediated testosterone 6ß-hydroxylase catalytic activity
in either diabetic or insulin treated diabetic animals. FMO activity substantially
increased in 55 mg/kg streptozotocin treated diabetic animals by 65 %. In insulin treated
diabetic animals, the FMO completely restored to control level, moreover, FMO activity
resulted in a significantly lower level in comparison to control.

58
Diabetic animals
55 mg/kg STZ
55 mg/kg STZ i.v. +
Insulin
Index reactions Control animals
D55 ID55 Cytochrome P450 protein content (nmol/mg microsomal protein)
0.51 ±0.09 0.64 ±0.07* 0.28 ±0.09***†††
Phenacetin O-deethylase (CYP1A) (pmol mg -1 min-1)
234.3 ± 99.9 377.1 ± 138.3 267.9 ± 64.7
Aminopyrine N-demethylase (CYP2B/3A) (nmol mg -1 min-1)
3.41 ± 0.88 2.93 ± 0.67 2.72 ± 0.52
Tolbutamide 4’-hydroxylase (CYP2C) (pmol mg -1 min-1)
333.8 ± 269 372.2 ± 211 318.9 ± 162
Mephenytoin 4’-hydroxylase (CYP2C) (pmol mg -1 min-1)
72.2 ± 26 95.9 ± 18 55.9 ± 15†††
Bufuralol 1’-hydroxylase (CYP2D2) (pmol mg -1 min-1)
1468 ± 663 998.9 ± 42 1098 ± 456
Chlorzoxazone 6-hydroxylase (CYP2E1) (pmol mg -1 min-1)
1458 ± 794 4787 ± 1680** 1316 ± 514†††
Testosterone 6ß-hydroxylase (CYP3A) (pmol mg -1 min-1)
3201 ± 1239 2874 ± 1402 2208 ± 1221
Benzydamine N-oxygenase (FMO) (pmol mg -1 min-1)
3345 ± 1197 5532 ± 1668** 1714 ± 541*†††
Table 9. Hepatic CYP and FMO isozyme activities in STZ-induced diabetic rats with or without insulin treatment. Mean ± S.D. were calculated (n=5-9). *p ≤ 0.05 values vs. control, **p ≤ 0.01 values vs. control, ***p ≤ 0.001 values vs. control, ††† p ≤ 0.001 ID55 vs.
D55.
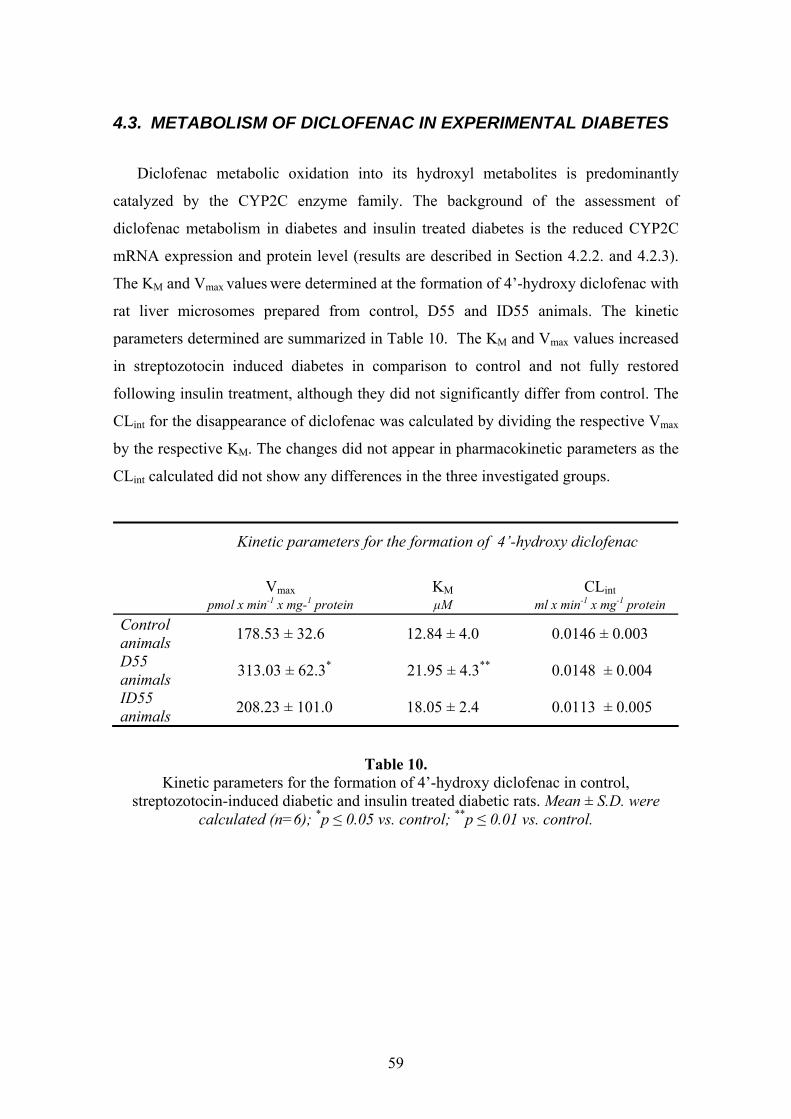
59
4.3. METABOLISM OF DICLOFENAC IN EXPERIMENTAL DIABETES
Diclofenac metabolic oxidation into its hydroxyl metabolites is predominantly
catalyzed by the CYP2C enzyme family. The background of the assessment of
diclofenac metabolism in diabetes and insulin treated diabetes is the reduced CYP2C
mRNA expression and protein level (results are described in Section 4.2.2. and 4.2.3).
The KM and Vmax values were determined at the formation of 4’-hydroxy diclofenac with
rat liver microsomes prepared from control, D55 and ID55 animals. The kinetic
parameters determined are summarized in Table 10. The KM and Vmax values increased
in streptozotocin induced diabetes in comparison to control and not fully restored
following insulin treatment, although they did not significantly differ from control. The
CLint for the disappearance of diclofenac was calculated by dividing the respective Vmax
by the respective KM. The changes did not appear in pharmacokinetic parameters as the
CLint calculated did not show any differences in the three investigated groups.
Kinetic parameters for the formation of 4’-hydroxy diclofenac
Vmax
KM
CLint
pmol x min-1 x mg-1 protein μM ml x min-1 x mg-1 protein Control animals 178.53 ± 32.6 12.84 ± 4.0 0.0146 ± 0.003
D55 animals 313.03 ± 62.3* 21.95 ± 4.3** 0.0148 ± 0.004
ID55 animals 208.23 ± 101.0 18.05 ± 2.4 0.0113 ± 0.005
Table 10. Kinetic parameters for the formation of 4’-hydroxy diclofenac in control,
streptozotocin-induced diabetic and insulin treated diabetic rats. Mean ± S.D. were calculated (n=6); *p ≤ 0.05 vs. control; **p ≤ 0.01 vs. control.

60
4.4. RESULTS OF K-48 METABOLISM STUDY
4.4.1. In silico prediction
Computer simulation of the possible metabolism of K-48 molecule indicated
oxidative deamination of C-NH2, N-demethylation (alkyl bridge splitting), and N-
glucuronidation on the amino group of C-NH2.115 Lipophilicity was also calculated by
Pallas Program. The values of lipophilicity (logP) for the parent compound (K-48), the
hydroxylated K-48, the epoxyde substituted K-48, and the two N-dealkylated fragments
were −2.61, −3.26, −3.10, −0.57 and +0.54, respectively. Both hydroxylation and
epoxidation of K-48 decreases the lipophilicity, so the elimination of K-48 may be
facilitated.
4.4.2. In vitro microsomal metabolism assessment
The biotransformation of K-48 was determined by HPLC-MS and HPLC-ECD
following incubation with control or streptozotocin induced diabetic microsomes. The
metabolic rate of K-48 after 30 minutes microsomal incubation was found to be very
slight, only approximately 15 % decrease and a small fragment with a molecular peak of
122 amu resulted by HPLC-MS analysis. This compound represents either one of the
substituted pyridinium rings present in the parent molecule. Another molecule showed a
sharp signal at 315 amu, suggesting the hydroxylation of K-48. The parent compound
was presented at 299 amu. The suggested in vitro metabolic patterns are shown in
Figure 14.
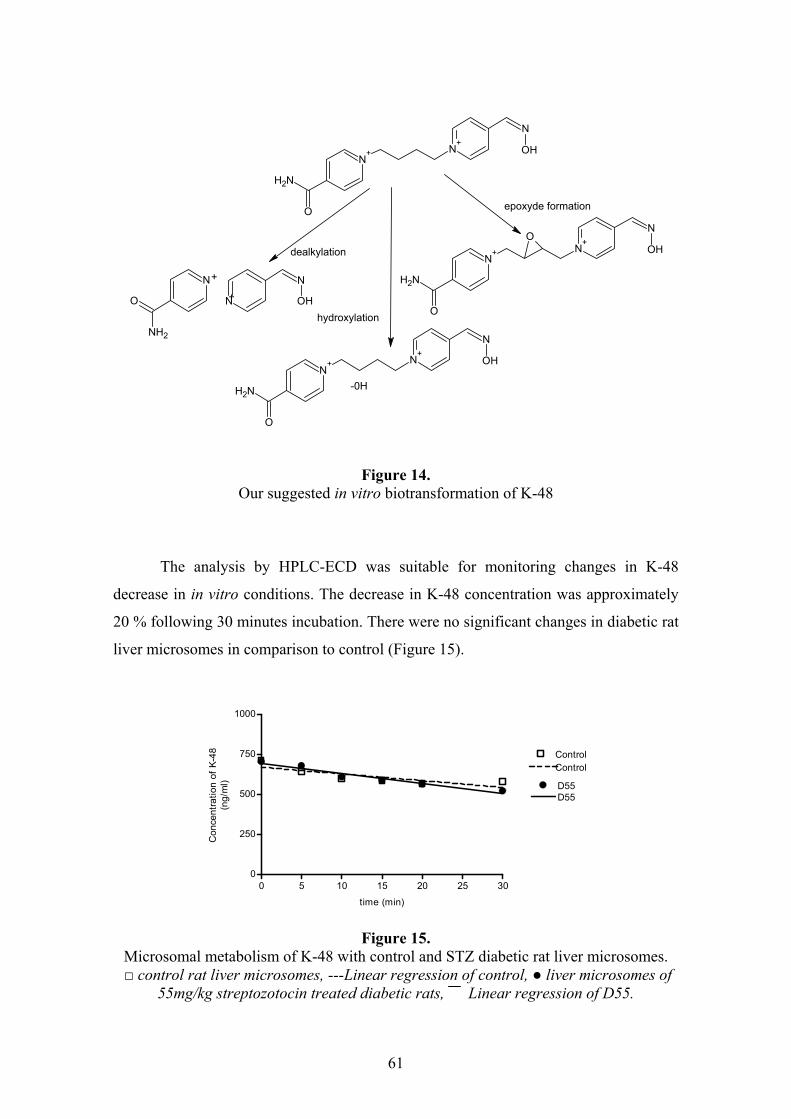
61
N
O
NH2
N
N
OH
+
+
N+ N
+
O
NH2
N
OH
-0H
N+ N
+
O
NH2
N
OHO
epoxyde formation
hydroxylation
dealkylation
N+ N
+
O
NH2
N
OH
Figure 14. Our suggested in vitro biotransformation of K-48
The analysis by HPLC-ECD was suitable for monitoring changes in K-48
decrease in in vitro conditions. The decrease in K-48 concentration was approximately
20 % following 30 minutes incubation. There were no significant changes in diabetic rat
liver microsomes in comparison to control (Figure 15).
0 5 10 15 20 25 300
250
500
750
1000
Control
D55
Control
D55
time (min)
Con
cent
ratio
n of
K-4
8(n
g/m
l)
Figure 15.
Microsomal metabolism of K-48 with control and STZ diabetic rat liver microsomes. □ control rat liver microsomes, ---Linear regression of control, ● liver microsomes of
55mg/kg streptozotocin treated diabetic rats, Linear regression of D55.
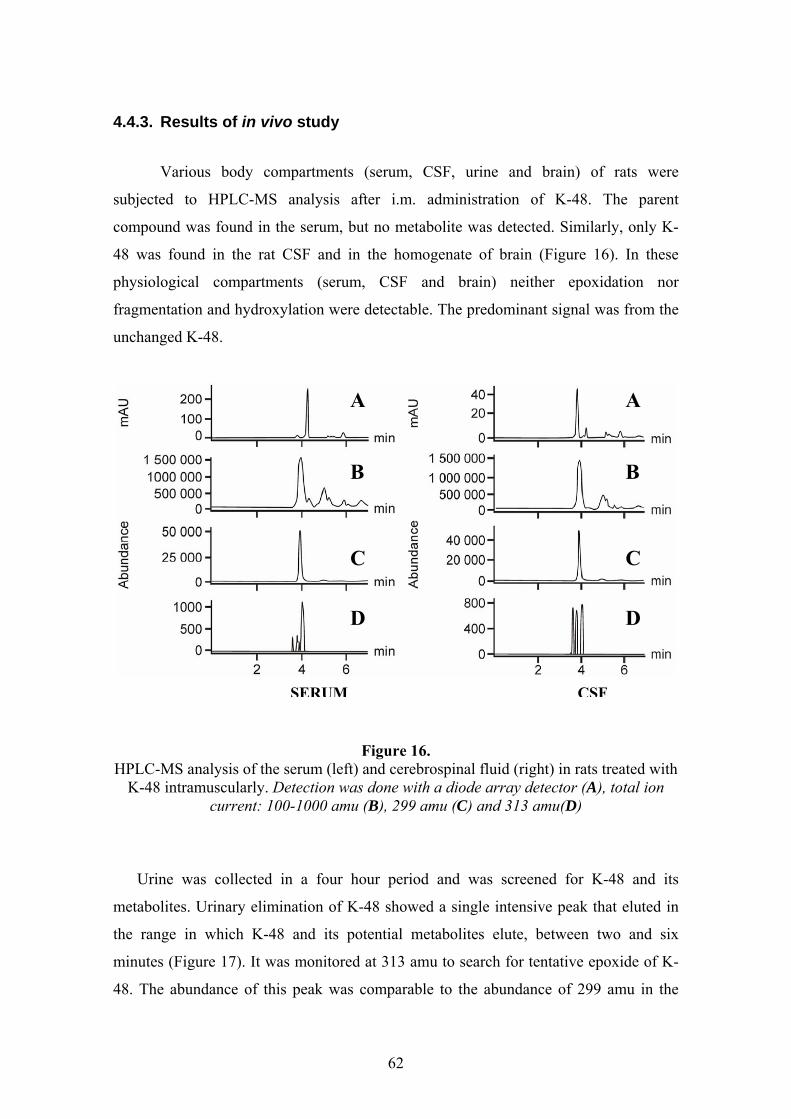
62
4.4.3. Results of in vivo study
Various body compartments (serum, CSF, urine and brain) of rats were
subjected to HPLC-MS analysis after i.m. administration of K-48. The parent
compound was found in the serum, but no metabolite was detected. Similarly, only K-
48 was found in the rat CSF and in the homogenate of brain (Figure 16). In these
physiological compartments (serum, CSF and brain) neither epoxidation nor
fragmentation and hydroxylation were detectable. The predominant signal was from the
unchanged K-48.
Figure 16. HPLC-MS analysis of the serum (left) and cerebrospinal fluid (right) in rats treated with
K-48 intramuscularly. Detection was done with a diode array detector (A), total ion current: 100-1000 amu (B), 299 amu (C) and 313 amu(D)
Urine was collected in a four hour period and was screened for K-48 and its
metabolites. Urinary elimination of K-48 showed a single intensive peak that eluted in
the range in which K-48 and its potential metabolites elute, between two and six
minutes (Figure 17). It was monitored at 313 amu to search for tentative epoxide of K-
48. The abundance of this peak was comparable to the abundance of 299 amu in the
A
B
C
D
A
B
C
D
SERUM CSF
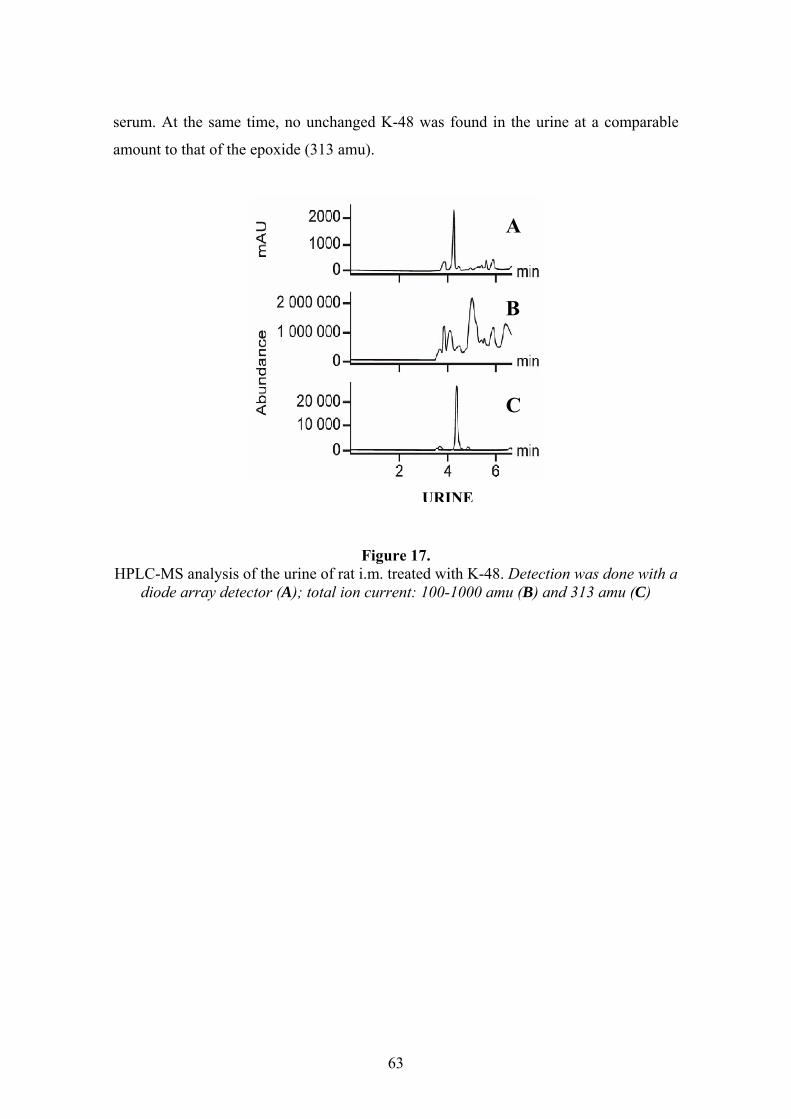
63
serum. At the same time, no unchanged K-48 was found in the urine at a comparable
amount to that of the epoxide (313 amu).
Figure 17. HPLC-MS analysis of the urine of rat i.m. treated with K-48. Detection was done with a
diode array detector (A); total ion current: 100-1000 amu (B) and 313 amu (C)
A
B
C
URINE

64
5. DISCUSSION
5.1. EXPERIMENTAL DIABETIC MODEL
Diabetes occurs when the nutritional system is unable to complete the process of
breaking down and absorbing carbohydrates. Diabetic patients are unable to absorb
glucose because of insulopenia or insulin resistance, therefore, sugar begins to
accumulate in their blood. Diabetes mellitus influences the whole energy use; affects on
the carbohydrate, lipid, protein and drug metabolism. The effect of diabetes mellitus on
various drug metabolising enzyme systems depends on the type of disease. There are
two classes of diabetes mellitus, type I and type II, with type II compromising over 80
% of clinical cases. Type I diabetes (also called juvenile or insulin-dependent diabetes
mellitus – IDDM) is the most severe form which the disease takes and without
treatment it is invariably fatal. It generally develops when patients are in adolescence
and is characterized by the destruction of the β-cells in the islet of Langerhans which are
responsible for the production of insulin. Bacterial infection triggers an immunological
reaction in susceptible persons, which can produce this form. Type II diabetes
(noninsulin dependent diabetes mellitus – NIDDM) generally develops later in life and
is caused by insulin resistance. Obesity and family history are prime risk factors for the
development of this form. Type I diabetes is treated with insulin supplementation, while
type II can often be controlled with diet, exercise and oral hypoglycaemic
agents.116,117,118
STZ diabetes is widely used for modelling type I diabetes mellitus. In our studies
the alterations in physiological and biochemical parameters such as elevated blood
glucose level and relative wet liver weight, the loss in body weight and the other
symptoms (polidypsia, polyuria) indicated the development of the pathological state
following both intraperitoneal and intravenous injection of streptozotocin.
Administration of insulin did not completely restore the blood glucose level with any
protocol we used; however, by varying the injection of Humulin N (8.30 am) and
Insulatard insulin (4.30 pm) the blood glucose level decreased significantly in
comparison to the Ultratard insulin administered twice a day. The insulin we used was
human recombinant isophane insulin which did not seem to have sufficient effect on

65
rats. Due to the incomplete restoration to the physiological conditions of controls; the
incomplete recovery in the parameters we measured may not be surprising. The
different responsiveness of animals to insulin can explain the high S.D. values we
observed. The repeated results excluded the technical failures and confirmed our
hypothesis. The inter-individual variations could be responsible for the differences;
however, we also starved the animals before insulin treatment to minimize the
variations due to different food-uptake.
5.2. CHANGED INTESTINAL TOTAL CYP CONTENT AND CYP3A ACTIVITY IN DIABETES
Although the liver is well-known playing the major role in drug metabolism, the
metabolic capacity of the intestine is increasingly recognized. In vivo studies eventually
pointed out that significant first-pass metabolism by the intestinal wall have
implications for the bioavailability of several compounds. In addition, it can occur that
in severe disease states the extrahepatic pathways such as the small intestinal route
might compensate for the impaired hepatic function. Therefore, it is necessary to clarify
whether the intestinal metabolism altered as a result of a pathological state such as
diabetes.
Decreased intestinal CYP3A activity
The CYP3A constitutes only approximately 30 % of total human hepatic
cytochrome P450 content; it accounts for more than 80 % of the CYP content in human
small intestine.48,51 CYP3A subfamily is also highly expressed in rat intestine and it is
widely studied.119,120,121 Therefore; our investigations firstly focused on the changes in
intestinal CYP3A functions in insulin treated and untreated experimental diabetic rats.
Even though the total cytochrome P450 content was statistically unchanged, the
metabolic capacity of CYP3A enzyme showed a marked decrease possibly due to
inactivation in the diabetic state. The recovery of the enzymatic changes following
insulin administration was also indicated. The reason for the decreased activity in spite
of the unchanged total P450 content could be the outcome of a kind of covalent down-
regulation (e.g. phosphorylation), which is supported by the known posttranslational
66
modification - via phosphorylation catalyzed by PKA - which have an outstanding role
in CYP regulation. Phosphorylation controls the CYP function like a switch by which
the enzymes get into their fully inactivated form, while reduction can not be observed in
enzyme content.31 CYP3A has the property to be regulated by phosphorylation, whereas
it is not common.15
Another reason for the moderate increase in CYP amount in spite of decreased
CYP3A activity could also be a remarkable induction of another isoform such as
CYP2E1 known to be highly induced in diabetic liver.4 This explanation is supported by
the publication of Al-Turk and co-workers (1980) who reported an elevation in 7-
ethoxycoumarin O-deethylase and aromatic hydrocarbon hydroxylase activity (CYP2E1
and CYP2A6, respectively) in the intestine of male and female rats in diabetes.2,3
Parallel to intestinal metabolism study, the hepatic characterization of dominant
CYP isoforms were also determined (data not shown). The CYP3A activity does not
change in the liver in treated and untreated streptozotocin induced diabetes. It suggests
and confirms the literature data, that intestinal and hepatic monooxygenases are
regulated independently.16,119
Difficulties in investigating intestinal metabolism
The microsomal monooxygenase content of the small intestine is much lower than
that of the liver.40 Moreover, the cytochrome P450 of a rat’s small intestine suffers
spontaneous degradation into the inactive cytochrome P420 form during the preparation
of microsomes.110,121 These facts render difficulties for the preparation and investigation
of intestinal metabolism. The rapid preparation and additives (trypsin inhibitor,
glycerin, and heparin) can increase the yield of functionally active intestinal P450s.110
Due to technical reasons (hardly detectable activities, aforementioned degradation,
low expressions of the other isoenzymes abundant in the gut), the scrutinization of the
mechanism of the changes was impossible. Anti-CYP3A2 antibody was used to
determine the protein level of intestinal CYP3A by Western blot. It is known that
CYP3A2 is not expressed in rat small intestine;120 however, the antibody against rat
hepatic CYP3A2 is published to cross react with CYP3A9 expressed in male and female
rat small bowel.119 The antibody did react with the CYP3A very slightly or not at all in
our experiment (data not shown).

67
Correlation between blood glucose concentration and CYP3A activity
In our study the insulin level was altered by insulin administration in diabetic rats
(ID70). Nevertheless, the blood glucose level, an inverse parameter of insulin
concentration, was regularly checked. The determination of glucose concentration is
simple and characteristic of the severity of diabetes mellitus. The regression analyses
showed a significant inverse correlation between CYP3A activity and average blood
glucose concentration in diabetic rats.
The changed CYP3A activity in small bowel and gastrointestinal complications in
diabetes seems to have importance especially when the decreased barrier function of
intestine is considered. It is also suggested that the decrease of functionally active
intestinal CYP3A enzyme in the diabetic state might lead to increased bioavailability of
drugs which are substrates of intestinal CYP3A following p.o. administration.
5.3. CHANGES IN HEPATIC CYTOCHROME P450s IN DIABETES
A long-term diabetic state was investigated in our 28 days study. A group of
diabetic animals received insulin for 9 days length of which was insufficient to restore
the changes developed during the long-term diabetic state. However, regarding our
results the changed cytochrome P450 enzyme content, mRNA expression and catalytic
activity in the liver were mostly in accordance with those described in the literature.
The hypoinsulinaemia and hyperketonuria in diabetes
In the diabetic state total cytochrome P450 content, the gene expression of
CYP1A2, CYP2E1 and CYP3A1 was increased as it was observed by Shimojo et al.
(1993), Sakuma et al. (2001) and Favreau et al. (1988).4,7,79 Following insulin treatment
the hepatic microsomal CYP content was decreased to the control value as published by
Vega et al. (1993).6 The catalytic activity of CYP1A2 (phenacetin O-deethylation) and
CYP2E1 (chlorzoxazone 6-hydroxylation) increased as was expected by the results of
the mRNA expression study. The role of insulin and ketone bodies in the regulation of
P450s (CYP1A2, CYP2B1, CYP2E1) has been proven.122,123 The physiological
functions of CYP2E1 involve lipid metabolism and ketone utilization in starvation,

68
obesity, and diabetes.124 In our study, the induction of the mRNA expression level and
catalytic activity of CYP2E1 due to insulin deficiency, whether or not accompanied by
hyperketonuria, was 2.2-fold and 3.3-fold in diabetes, respectively. The CYP2E1 is
regarded to be regulated mostly by mRNA and protein stabilization following
phosphorylation.24,37,38 Recent data also show that impaired secretion of growth
hormone is also responsible for the induction of CYP2E1 in diabetic rats and starvation
enhances the gene transcription of CYP2E1.125,126 We showed the elevation of the
mRNA expression in diabetes; however, the degree of the increase in catalytic activity
was not fully in accordance with the induction in gene expression. This fact suggests
both the transcriptional and posttranscriptional regulation of CYP2E1. The catalytic
activity and also the gene expression of CYP2E1 restored following insulin treatment,
indicating the suppressive effect of insulin on the CYP2E1 isoenzyme.127
The mRNA expression of CYP2B and the related aminopyrine N-demethylase
activity does not change in insulin treated and untreated animals, although Sakuma and
co-workers (2001) and Reinke et al. (1978) observed a decrease in both.8,79
The regulation of hepatic CYP3A isoforms
The aminopyrine N-demethylation is also catalyzed by the CYP3A isoenzymes. The
gene expression of the CYP3A1 increased, although the changes proved not to be
significant. The CYP3A2 was unaltered in both insulin treated and untreated diabetes
which may be reflected in the unchanged aminopyrine N-demethylation and
testosterone 6ß-hydroxylation. The CYP3A1 isoform decreased significantly following
insulin treatment. Insulin has numerous and varied cellular effects, including increased
glucose transport, promotion of DNA and protein synthesis, cell division and regulation
of gene expression etc. The regulation of insulin is carried out by the insulin signalling
pathway involving several hormones, mediators, enzymes, receptors etc.; therefore, it
can elicit dramatic changes in the absence of any other hormonal alterations.83,127 In
diabetes, the hypoinsulinaemia is accompanied by impaired growth hormone secretion.
Growth hormones are involved in the regulation of CYP3A and also of CYP2E1
isoenzyme; therefore, the increase of the protein content may be the consequence of the
reduced growth hormone secretion.4,122,128,129 The result was confirmed by the
publication of Ackerman and co-workers (1977), that the lack of insulin in the insulin

69
signalling pathway may be responsible for the changes and not hyperglycemia.80 This
hypothesis is also supported by the fact that infusion of glucose and diabetogens has no
effect upon the metabolising activities in vitro as published by the aforementioned
authors.80
Altered CYP2D2 activity and mRNA expression
The CYP2D2 is known to be regulated only at transcriptional level by the
nuclear receptor HNF-4α. It was reflected in the reduced hydroxylation of bufuralol
following decreased CYP2D2 gene expression. The insulin treatment does not restore
either the mRNA expression or the enzyme activity of CYP2D2. It seems insulin may
not regulate the gene expression of CYP2D directly. The decrease of this enzyme
activity in diabetes may result from another regulator.
Regulation of FMO isoenzymes by insulin
In contrast to CYPs, the regulation of FMO enzymes is not well known. The
alteration of FMO activities were observed in modified physiological states of animals:
pregnancy, starvation, ascorbic acid deficiency, gonadectomy and diabetes.71,72,73,74,75
Our previous study indicated that short-term diabetic state elevates the catalytic activity
and the gene expression of FMO1 and FMO3 isoenzymes and both, the activity and the
expression were restored on insulin treatment. The results in long-term diabetic state
also suggested that insulin has a role in the regulation of FMOs and the FMO3 is more
sensitive on insulin-deficiency than FMO1.
5.4. CYP2C SUBFAMILY AND DICLOFENAC METABOLISM IN DIABETES
Regulation of CYP2C isoenzymes
Drug metabolising enzymes can play important roles in serious drug interactions.
Pathophysiological conditions such as diabetes mellitus are known to influence
microsomal metabolism of xenobiotics enhancing the incidence of drug interactions.1
Our results indicate that type I diabetes mellitus model have a remarkable effect on the
expression of CYP2C enzymes. The physiological role of the CYP2C subfamily is the
70
steroid hydroxylation in 2α and 16α position, whereby it contributes to the oxidative
metabolism of testosterone and androstenedione in adult male rats.130 The promoter
region of CYP2C constitutes the GRE and CAR recognition sequences which mediate
the transcriptional regulation of GR/GR, CAR/RXR and PXR/RXR nuclear receptor
dimers.26,27,28 The HNF-4α and PPARα also regulates the expression of CYP2C
isoenzymes, but they seem not to be the major determinant for the liver specific
expression of their genes.131
Our study, which is in agreement with the literature data, resulted in the decrease of
protein expression of the major male-specific isoform, CYP2C11 in diabetes. The
mRNA expressions of the CYP2C11, CYP2C13 and CYP2C22 isoenzymes were also
suppressed in the streptozotocin treated experimental diabetic model used. The
CYP2C11 and CYP2C13 are regulated by the status of pituitary, gonadal and thyroidal
hormone secretion.83,84 The serum glucose and ketone bodies increase and the serum
level of insulin, pituitary growth hormones, androgen and thyroid hormones decrease in
diabetes.83 The reduction of the circulating pituitary hormones may explain the down-
regulation of CYP2C protein level and mRNA expressions in diabetes. Insulin treatment
can reverse many factors such as serum glucose, ketone bodies, and metabolic capacity
of P450s.84 In our study, the reversal of the protein level and mRNA expressions
following insulin treatment was tendentious, but only the pituitary hormone regulated
CYP2C11 and CYP2C13 increased significantly in comparison to the diabetic state.
The CYP2C22 is also involved in the metabolism of steroid hormones and shows
similar sex-specific expression like CYP2C11 and CYP2C13 in rats; however the
regulation of this isoform has not been investigated so far.132 Its mRNA expression also
substantially decreased in diabetes, but the insulin treatment resulted in an insignificant
elevation.
The CYP2C23 was the single isoenzyme which did not alter in both STZ induced
and insulin treated diabetic animals. The CYP2C23 is expressed mainly in kidney and
liver and it is responsible for the metabolism of arachidonic acid into
epoxyeicosatrienoic acids and hydroxyeicosatetraenoic acids.133 It is reported that the
streptozotocin induced diabetes increases the expression of CYP2C23 in rat kidney,134
while Pass and co-workers published that sex and pathophysiological status have no
effect on the expression of CYP2C23 in mice liver.132 Our study confirms the results of
71
the aforementioned author; since no significant change was observed in the gene
expression of rat hepatic CYP2C23 in diabetes. It is also published, that the generally
used chemical inducers of human CYP2C isoenzymes and peroxisome proliferators
(e.g. fibrates) which activate the PPARα that mostly express in rodents, have a contrary,
suppressor effect on rat CYP2C11 and CYP2C23.135,136 In spite of the repressive effect
of exogenous chemicals, the hepatic CYP2C23 remain fairly stable in physiological
conditions and seems not to be regulated by gonadal and pituitary hormones.137 All
these observations support the lack of alteration of CYP2C23 mRNA expression as we
indicated in diabetic state.
Diclofenac metabolism in diabetes
To find evidence for substantially changed metabolism – consequently exposition -
caused by suppressed CYP2C metabolising capacity in diabetes, we used a dominant
CYP2C11 substrate, the anti-inflammatory drug, diclofenac. It is metabolised mainly by
CYP2C11 and by CYP2C9 in rat and human liver, respectively.93,138 Based on the
production of 4’-hydroxy diclofenac we observed a significant change in the enzyme
kinetic parameters of diclofenac in diabetes. It is reported that the disease brings about a
smaller Vss, and a greater AUC values of intravenously administered diclofenac due to
slower CLnr and faster CLr values. It is also published that diabetes has no effect on
these pharmacokinetic parameters after oral administration.97 The changes in clearance
following intravenous administration are explained by the reduced CYP2C11 activity in
streptozotocin induced diabetic rats.97 Our results do not correspond with these results,
since we measured a significant increase in KM, Vmax values in diabetic rat liver
microsomes in comparison to control. The insulin ameliorated the changes in the
enzyme kinetic parameters and did not differ from control. In spite of the enhanced KM
and Vmax, indicating faster and less affinitive enzymes in diabetes, the CLint and
metabolic bioavailability calculated do not show significant differences among the three
groups. Based on these results, the possibility of interactions due to the decreased
metabolising capacity is small. The apparent discrepancy between reduced CYP2C11
enzyme expression and altered enzyme kinetic parameters of diclofenac metabolism
may be explained by a redistribution of the enzyme metabolising capacity or the
differences in the investigated dose in the in vivo and in vitro experiment.
72
The study provided evidence for the alteration in CYP2C isoforms at mRNA and
protein expression levels, however, the changes of enzyme kinetic parameters is not
reflected in altered intrinsic clearance; therefore, the possibility of changed drug
biotransformation in the case of diclofenac is in vitro not confirmed.
5.5. METABOLISM, DISPOSITION AND ELIMINATION OF K-48
Compound K-48 is a promising antidote against organophosphate intoxication. The
pralidoxim and obidoxim used mostly in US and Europe, respectively, have not
sufficient effect on the reactivation of acetylcholine esterase enzymes. Because of the
threat of terrorist attacks it appears urgent to evaluate medical interventions that may be
effective in mass exposures. The antidotes should have a broad spectrum of action
against various OPs along with minimal adverse effects. The CNS efficacy and its
administration by autoinjector intramuscularly would also be essential.139
Structurally K-48 is a bisquaternery asymmetric compound with an intact –C=N-OH
and a -CO=NH2 group. The former mentioned group is essential for the
organophosphate removal; the latterly mentioned group may be suitable for hepatic
first-pass metabolism to occur. Pallas Program was applied for the in silico prediction of
the possible metabolites and logP values. Deamination of C-NH2, N-demethylation
(alkyl bridge splitting) and glucuronyl conjugation on the amino group was noted.115
Liver microsomes from control and diabetic rats were used for in vitro metabolism
study of K-48. Only a moderate, 15-20 % reduction in the concentration of parent
compound could be measured after 30 minutes. The metabolism of K-48 was also tested
by streptozotocin induced diabetic microsomes. No significant differences were found
in vitro between the metabolism with streptozotocin treated and untreated (control)
animals. The NADPH dependent metabolism of K-48 (no reduction of K-48 was seen in
NADPH-free control incubation) refers to the CYP and FMO mediated metabolism. In
spite of the changes in mRNA expression and catalytic activity of both
monooxygenases in diabetic state, the metabolism of K-48 in vitro did not alter which
may suggest the involvement of an unchanged P450 isoform in K-48 metabolism.
HPLC-ECD is suitable for monitoring changes in K-48 concentration in in vitro
conditions. To identify the produced metabolite(s) use of advanced technique such as

73
HPLC with on-line MS detection was indispensable. A small fragment with a molecular
peak of 122 amu resulted following 30 minutes incubation with rat liver microsomes.
This compound is possibly one of the substituted pyridinium rings presented in the
parent molecule. The other molecule was displayed at 315 amu, implying the
hydroxylation of K-48. No other metabolites predicted in silico (N-dealkylation or
epoxide formation) could be seen.
Oximes like pralidoxime are commonly used in combination with atropine. The
most important requirement to oximes would be to cross the BBB and ameliorate the
CNS effects of organophosphate poisoning. Therefore, the brain is the primary target
organ for the newly synthesized oximes like K-48. Several compartments: serum, CSF
and brain were analyzed for K-48 and its metabolites. Poor penetration of K-48 (3-8 %)
through BBB was indicated by Kassa and co-workers (2005).104 In concert with the
above referred study, only K-48 was found in all three compartments in our
experiments. Metabolites were absent in the serum, CSF and brain. It is known that K-
48 has a better protective action than other PACERs.99,104,107 However, this advantage
may be caused by the higher efficacy of K-48 in the peripheral nervous system and not a
better penetration to the CSF and brain.108 The logP for K-48 and hydroxylated and
epoxide substituted metabolite is -2.61, -3.26 and -3.10, respectively. The relatively
high hydrophilic character and only moderate lipophilicity104,105 predict only a moderate
penetration through BBB and a relatively rapid elimination by means of urine. Both
hydroxylation and epoxidation decrease the lipophilicity facilitating the elimination of
compounds. Being aware of this fact, it is not surprising that any of the metabolites
could not be found in the brain, and the elimination through urine is preferred. Single
ion monitoring was used to detect any unchanged K-48 from samples derived from rat
urine. A relatively sharp peak was found in the rat urine when HPLC was monitored at
313 amu which suggests an epoxide metabolite. Epoxide contamination in the treated
substance was excluded; the epoxide metabolite of K-48 is probably due to its
biotransformation.
To summarize our results and compared to the recently used oxime (pralidoxime),
K-48 proved to metabolise to a lower extent which was not altered in experimental
diabetes. Pralidoxime was reported to have an extensive metabolism in vitro.140 The
elimination of pralidoxime due to their polarity is rapid which brings about the
74
unchanged excretion of pralidoxime in vivo.141 The elimination of K-48 by urine was
also observed, but only epoxide metabolite and no unchanged K-48 could be detected
by HPLC-MS. The efficacy of K-48 in the case of some OP poisoning seems to be more
sufficient. Our study confirmed only a low penetration into brain and CSF, which shows
that the better reactivating effect is not the outcome of a higher CNS efficacy.
75
6. CONCLUSION
It was revealed that diabetic state has an effect on the intestinal CYP mediated
metabolism. Reduced CYP3A mediated metabolism in spite of the statistically
unaltered total CYP content was resulted in STZ induced diabetes, which can be
explained either by posttranslational regulation of the enzyme via covalent
down-regulation (e.g. phosphorylation) or by a change in the intestinal CYP
enzyme composition. The intestinal CYP3A activity was sensitive to insulin
administration.
Inverse correlation was found between blood glucose concentrations (regarded
as a marker for insulin level) and CYP3A function suggesting the involvement
of insulin in the intestinal CYP3A regulation.
We demonstrated that long term 28 days diabetes induced the most remarkable
increase in hepatic total CYP content, and in hepatic CYP2E1 and FMO3 gene
expression and function and a significant decrease in CYP2C11 and CYP2D2
mRNA expression. The CYP1A2, CYP2B, CYP3A1, CYP3A2 and FMO1 did
not show statistical alterations either in expression or in function in diabetes.
It was recognized that the hepatic total CYP content and CYP1A2, CYP2E1,
CYP3A1 were significantly decreased while CYP2C11 gene expression
increased following a nine day period insulin administration. The catalytic
activities of FMO and CYP2E1 were the most sensitive to insulin and their
function resulted in a lower activity in comparison to control after insulin
treatment.
Furthermore, it was shown that the CYP2C11 gene expression is not in concert
with the tolbutamide and mephenytoin 4’-hydroxylase activity, although the
decreased gene expression in untreated diabetes was also reflected in reduced
CYP2C11 protein level. The insulin also restored the CYP2C11 mRNA and
protein level.

76
It was further revealed that insulin treated and untreated diabetic state had an
effect on the gene expression of CYP2C13 and CYP2C22, however, the
CYP2C23 isoenzyme did not show any alteration. We suggested that the
different attitude of CYP2C23 gene may be due to its different physiological
function (arachidonic acid metabolism) and regulation.
We concluded that in spite of altered (increased) KM and Vmax values of
diclofenac 4’-hydroxylase in diabetic state the intrinsic clearance calculated
remained unchanged. The altered in vivo pharmacokinetics of diclofenac in
diabetes published might be explained by the differences between the in vivo and
in vitro effective dose.
It was shown that the changes in CYP2C enzymes in diabetes do not bring about
alteration in the biotransformation of diclofenac which may suggest the
redistribution of metabolic pathways.
K-48 showed only a moderate biotransformation (15-20 %) with both diabetic
and control rat liver microsomes which suggests that diabetes does not affect the
metabolism of K-48 molecule.
In in vitro microsomal metabolism studies only a hydroxyl metabolite of the
pyridinium aldoxime cholinesterase reactivator, K-48 was identified. No other
metabolites predicted in silico were seen in vitro.
It was demonstrated that only the parent compound, K-48 was found in serum,
CSF and brain. Metabolites were absent in all three compartments. We did not
find any unchanged K-48 in rat urine; presumably an epoxide metabolite could
be identified by HPLC-MS.
77
We also indicated that K-48 had a very poor penetration through the BBB
because only a low concentration of K-48 was measured in the brain and no
metabolites could be found.
78
7. SUMMARY
Insulin dependent diabetes mellitus (IDDM) is a complex metabolic disorder, which
develops changes in the cytochrome P450 (CYP), mediated metabolism in the liver and
in the small intestine and it may also produce altered bioavailability. The main goal of
this study was to reveal these metabolic changes in experimental diabetic rats and to
evaluate their significance in the drug metabolism.
Decreased intestinal CYP3A mediated metabolism in spite of the statistically
unaltered total CYP content resulted, which suggests either posttranslational regulation
of the enzyme via covalent down-regulation (e.g. phosphorylation) or a change in the
intestinal isoenzyme composition. Insulin may be involved in the intestinal CYP3A
regulation since inverse correlation was found between the blood glucose concentration
(as a marker for insulin level) and the CYP3A function. The hepatic total CYP content
and the hepatic CYP2E1 and FMO3 gene expression and function were seen to change
remarkably in untreated long-term diabetes and following insulin treatment. Our study
concentrated on rat hepatic CYP2C11, CYP2C13, CYP2C22 and CYP2C23 isoforms
and reduced gene expressions with the exception of CYP2C23 were found in diabetes,
which is explained, by its different physiological role and regulation. The mRNA level
of CYP2C11 and CYP2C13 isoforms were sensitive to insulin showing the role of
insulin in their regulation. The study resulted in unaltered CLint of the CYP2C substrate;
diclofenac in either insulin treated or untreated diabetic rats. Similarly, unchanged
biotransformation of the cholinesterase reactivator oxime, K-48 was seen in diabetes.
These results suggest no influence of diabetes and particularly compensated diabetes on
the metabolism of the two drugs investigated. The in vitro and in vivo metabolism
studies of K-48 resulted in a weak metabolism. None of the in silico predicted
metabolites but the K-48 was found in serum, CSF and brain while an epoxide
metabolite was detected in urine. The presence of K-48 in the brain shows a moderate
penetration of K-48 to the CNS.

79
8. ÖSSZEFOGLALÁS
Az inzulinfüggő diabétesz (IDDM) megváltoztatja a máj és a vékonybél
monooxigenáz enzimeinek működését. A megváltozott metabolikus kapacitás
megváltozott gyógyszer-biohasznosulást eredményezhet. Vizsgálataink célja
patkányban streptozotocinnal (STZ) kiváltott IDDM citokróm P450 enzimrendszerre
(CYP) kifejtett hatásának és jelentőségének tanulmányozása volt, egy gyógyszer és egy
fejlesztés alatt álló gyógyszerjelölt metabolizmusában.
Kísérletes diabéteszben csökkent intesztinális CYP3A aktivitást mutattunk ki
változatlan citokróm P450 tartalom mellett, melyet egy lehetséges poszttranszlációs
szabályozással (pl. foszforiláció), illetve az intesztinális CYP izoenzimösszetétel
megváltozásával magyarázhatunk. Fordított korrelációt találtunk az intesztinális
CYP3A aktivitás és az inzulinszint egyik markere, a vércukorszint között, ebből az
inzulin reguláló szerepére következtetünk. 28 napig fennálló diabéteszben és
inzulinadást követően a legjelentősebb változást a máj CYP tartalomban illetve a
hepatikus CYP2E1 és FMO3 génexpresszióban és aktivitásban mértük. Patkány máj
CYP2C11, CYP2C13 és CYP2C22 mRNS szintje csökkent diabéteszben, ez
inzulinkezelésre - a CYP2C22 kivételével - szignifikánsan nőtt. A CYP2C23
génexpresszió nem változott kezelt és kezeletlen diabéteszben, amit ezen izoforma
eltérő fiziológiás szerepével és szabályozásával magyarázunk. A csökkent CYP2C
expresszió ellenére a diclofenac metabolikus klírensze nem változott kísérletes
diabéteszben. Nem volt eltérés a piridinium aldoxim kolinészteráz reaktivátor, a K-48
molekula metabolizmusában sem. Feltételezzük tehát, hogy a kiválasztott molekulák
biotranszformációja nem változik meg jelentősen kezeletlen és inzulinnal kompenzált
cukorbetegségben. A K-48 in vitro és in vivo vizsgálata a vegyület mérsékelt
metabolizmusát mutatta. Patkány szérumban, likvorban és agy homogenátumban csak a
K-48 vegyületet, míg vizeletben annak epoxid metabolitját tudtuk kimutatni. Az
alacsony K-48 koncentráció az agyban a molekula kismértékű vér-agy gát
penetrációjára utal.
80
9. PUBLICATIONS
Publications for the dissertation based on
1. Tímea Borbás, Bernadett Benkő, Imola Szabó, Balázs Dalmadi, Károly Tihanyi:
Insulin in flavin-monooxygenase regulation. Flavin-containin monooxygenase and
cytochrome P450 activities in experimental diabetes. European Journal of
Pharmaceutical Sciences, 28(1-2), 2006
2. Bernadett Benkő, Huba Kalász, Krisztina Ludányi, Georg Petroianu, Kamil Kuca,
Ferenc Darvas, Kornélia Tekes: In vitro and in vivo metabolism of K-48. Analytical
and Bioanalytical Chemistry, 389(4):1243-7, 2007
3. Bernadett Benkő, Rudolf Laufer, Róbert Ohmacht: HPLC Analysis of microsomal
metabolism of K-48. Acta Chromatographica, 19, 61-72, 2007
Other publications
1. Benkő Bernadett, Zelkó Romána: Minőségi rendszerek a gyógyszerészetben I.,
Gyógyszerészet, 46: 264-271, 2002
2. Benkő Bernadett, Zelkó Romána: Minőségi rendszerek a gyógyszerészetben II. -
Minőségi rendszerek áttekintése. Gyógyszerészet, 46: 462-469, 2002
Publication in progress
Bernadett Benkő, Tímea Borbás, István Likó, Zoltán Urbányi, Károly Tihanyi:
Metabolism of Diclofenac in streptozotocin induced diabetes
Oral presentations
1. Benkő Bernadett, Borbás Tímea, Dalmadi Balázs, Szeberényi Szabolcs, Leibinger
János, Tihanyi Károly: Intesztinális gyógyszermetabolizmus jelentősége és stabil
citokróm P450 tartalmú mikroszóma preparálása patkány vékonybélből. Ph.D.
TUDOMÁNYOS NAPOK 2003, 2003. április 10-11., Budapest
2. Borbás Tímea, Benkő Bernadett, Dalmadi Balázs, Szeberényi Szabolcs, Leibinger
János, Beke Gyula, Tihanyi Károly: Koexpresszió CYP és FMO izoformák között
enzimatikus szinten, humán és patkány mikroszómán vizsgálva. Ph.D.
TUDOMÁNYOS NAPOK 2003, 2003. április 10-11., Budapest
81
3. Benkő Bernadett, Borbás Tímea, és Tihanyi Károly: Streptozotocinnal kiváltott
diabétesz hatása az intesztinális gyógyszermetabolizmusra patkányban. Ph.D.
TUDOMÁNYOS NAPOK 2004, 2004. április 8-9., Budapest
4. Borbás Tímea, Benkő Bernadett és Tihanyi Károly: Streptozotocinnal kiváltott
diabétesz hatása a hepatikus gyógyszermetabolizmusra patkányban. Ph.D.
TUDOMÁNYOS NAPOK 2004., 2004 április 8-9., Budapest
5. Benkő Bernadett, Borbás Tímea, Tihanyi Károly: Extrahepatikus metabolizmus.
“Gyógyszer az ezredfordulón” 2004, 2004. március 25-27, Sopron
6. Benkő Bernadett, Borbás Tímea, Győrke Imola: Streptozotocin-indukálta diabétesz
hatása az intesztinális és hepatikus gyógyszermetabolizmusra patkányban. VII.
CLAUDER OTTÓ EMLÉKVERSENY, 2004. október 14-15., Visegrád
Posters
1. Borbás Tímea, Benkő Bernadett, Dalmadi Balázs, Győrke Imola, Vastag Mónika és
Tihanyi Károly: Humán hepatocita citokróm P450 izoenzimek adatainak statisztikai
kiértékelése. GYÓGYSZER AZ EZREDFORDULÓN V. TOVÁBBKÉPZŐ
KONFERENCIA, 2004 március 25-27., Sopron
2. Borbás Tímea, Benkő Bernadett, Galgóczy Kornél, Dalmadi Balázs, Győrke Imola
és Tihanyi Károly: Streptozotocin-indukálta diabétesz hatása a hepatikus és
intesztinális gyógyszermetabolizmusra patkányban. FARMAKOKINETIKAI ÉS
GYÓGYSZERMETABOLIZMUS TOVÁBBKÉPZŐ SZIMPÓZIUM, 2004. április
15-17., Mátraháza - Poszter Díj I. helyezés
3. Borbás Tímea, Benkő Bernadett, Dalmadi Balázs, Győrke Imola, Vastag Mónika és
Tihanyi Károly: Humán hepatocita citokróm P450 izoenzimek adatainak statisztikai
kiértékelése. FARMAKOKINETIKAI ÉS GYÓGYSZERMETABOLIZMUS
TOVÁBBKÉPZŐ SZIMPÓZIUM, 2004. április 15-17., Mátraháza
4. Rudolf Laufer, Bernadett Benkő: Optimization of HPLC Monitoring of Microsomal
Metabolism. BALATON SZIMPÓZIUM, 2007. szeptember 8-10., Siófok

82
10. ACKNOWLEDGEMENT
In the first place, I would like to say thanks to my supervisor, Károly Tihanyi. His
outstanding overall knowledge on drug metabolism and his way of thinking about
scientific issues made a strong impact on my work.
I wish to thank Huba Kalász for tutoring me, without his help and support I could
not have completed this work.
I acknowledge the contribution of the following people to my work and thesis;
Tímea Borbás who never said “no” if I needed somebody to discuss any existing
problems, to István Likó who helped me with determinations done at mRNA level and
Zoltán Urbányi who taught me in the use of Western blot analysis. They really
supported me and gave me lots of encouragement.
I wish to thank Szabolcs Szeberényi and Balázs Dalmadi for helping me with their
valuable advice in the first period of my Ph.D. student years and continue to do so. I
indeed learned a lot from them.
I am very grateful to Kornélia Tekes and Rudolf Laufer. Their work in the K-48
experiments was indispensable to my Ph.D. studies.
I also appreciate a lot my colleagues Erzsébet Farkas Tóth, Judit Szendrei, Imola
Szabó, Attila Halász, Marianna Borsos, Teresa Merkl, Ildikó Bakonyi, Erika Czank,
Andrea Major Tóth, Mónika Bakk, Éva Hellinger and János Leibinger who were helpful
and sympathetic company.
I thank Ottilia Elekes for being cheerful company and also giving me insights in
systematic, intuitive and successful research work in drug development.
I thank Monika Vastag for having me in the In Vitro Metabolism Laboratory and
Gedeon Richter Plc. in giving me the possibility to prepare my work.
I am grateful to Georg Petroianu and again to Huba Kalász for the possibility of
spending 3 weeks in the Pharmacology and Therapeutics Department of United Arab
Emirates University in Al Ain. They gave me fresh encouragement to achieve my work.
I thank The Hungarian Pharmaceutical Society Industrial Organization for the financial
support my study tour in UAE.
Last, but not at least, I thank my parents, my family and my friends for their support,
patience, love and care with which they helped me during these long years.
83
11. REFERENCES
1 Kato R (1977) Drug metabolism under pathological and abnormal physiological states
in animals and man. Xenobiotica 7: 25-92 2 Al-Turk WA, Stohs SJ, Roche EB (1980) Altered metabolism of 7-ethoxycoumarin by
hepatic, pulmonary and intestinal microsomes from streptozotocin-diabetic rats. Drug
Metab Dispos 8: 44-45 3 Al-Turk WA, Stohs SJ, Roche EB (1981) Activities of hepatic and extrahepatic
microsomal mixed function oxidase enzymes in diabetic and gonadectomized-diabetic
rats. Gen Pharmacol 12: 345-350 4 Shimojo N, Ishizaki T, Imaoka S, Funae Y, Fujii S, Okuda K (1993) Changes in
amounts of cytochrome P450 isozymes and levels of catalytic activities in hepatic and
renal microsomes of rats with streptozotocin-induced diabetes. Biochem Pharmacol 46:
621-627 5 Shimojo N (1994) Cytochrome P450 changes in rats with streptozotocin-induced
diabetes. Int J Biochem 26: 1261-1268 6 Vega P, Gaule C, Mancilla J, Del Villar E (1993) Comparison of alloxan and
streptozotocin induced diabetes in rats: differential effects on micrososomal drug
metabolism. Gen Pharmac 24: 489-495
7 Favreau LV, Schenkman JB (1988) Composition changes in hepatic microsomal
cytochrome P450 during onset of streptozotocin-induced diabetes and during insulin
treatment Diabetes 37: 577-584 8 Reinke LA, Stohs SJ, Rosenberg H (1978) Altered activity of hepatic mixed function
monooxygenase enzymes in streptozotocin-induced diabetic rats. Xenobiotica 8: 611-
619
84
9 Barnett CR, Flatt PR, Ioaniddes C (1994) Modulation of the rat hepatic cytochrome
P450 composition by long-term streptozotocin-induced insulin-dependent diabetes. J
Biochem Toxicol 9: 63-69
10 Gwilt PR, Nahhas RR, Tracewell WG (1991) The effects of Diabetes Mellitus on
pharmacokinetics and pharmacodynamics in humans. Clin Pharmacokin 20: 477-490 11 Vereczkey L, Monostory K, Veres Zs (1998) Human gyógyszermetabolizáló
enzimek. I. Oxidációs enzimek. Acta Pharmaceutica Hungarica 68: 276-283 12 Fürst Zs (2001) Farmakológia - Általános Gyógyszertan, Medicina kiadó, Budapest,
p: 97-99 13 Kalant H, Roschlau WHE (1998) Principles of Medical Pharmacology – Drug
Biotransformation, Oxford University Press, New York, p: 38-55 14 Kalász H, Lengyel J (2007) A gyógyszerek szervezetbeni sorsa és vizsgáló
módszerei, Semmelweis kiadó, Budapest, p: 17-37, 97-112 15 Lewis DFV (2001) Guide to Cytochrome P450 – Structure and Function. Taylor &
Francis, New York and London 16 Krishna DR, Klotz U (1994) Extrahepatic metabolism of drugs in humans. Clin
Pharmacokinet 26: 144-160 17 Klingenberg M (1958) Pigments of rat liver microsomes. Arch Biochem Biophys 75:
376-386
18 Omura T, Sato R (1962) A new cytochrome in liver microsomes. J Biol Chem 237:
1375-1376
19 Omura T (1999) Forty years of cytochrome P450. Biochem. Biophys. Res. Commun.
266: 690-698
85
20 Taniguchi H, Pyerin W, Stier A (1985) Conversion of hepatic microsomal
cytochrome P450 to P420 upon phosphorylation by cyclic AMP dependent protein
kinase. Biochem Pharmacol 34: 1835-1837 21 Hong YS, Nonaka Y, Kawata S, Yamano T, Miki N, Miyake Y (1983) A prominent
feature of the conversation of P450 to P420 of cytochrome P450B1 among the
cytochrome P450 isozymes. Biochim Biophys Acta 749: 77-83 22 Nebert DW, Russell DW (2002) Clinical importance of the cytochrome P450. Lancet
360: 1155-1162 23 Mugford Ch A, Kedderis GL (1998) Sex-dependent metabolism of xenobiotics. Drug
Metab Rev 30: 441-498 24 Berthou F (2001) Cytochrome P450 enzyme regulation by induction and inhibition.
Course “Use of mechanistic toxicology in risk assessment of environmental chemicals”,
Facultad de Medicina, Universitad de Chile, Santiago de Chile
25 Koch JA, Waxman DJ (1989) Posttranslational modification of hepatic cytochrome
P450. Phosphorylation of Phenobarbital-inducible P450 forms PB-4 (2B1) and PB-5
(2B2) in isolated hepatocytes and in vivo. Biochemistry 28: 3145-3152 26 Pascussi JM, Gerbal-Chaloin S, Drocourt L, Assénat E, Larrey D, Pichard-Garcia L,
Vilarem M-J, Maurel P (2004) Cross-talk between xenobiotic detoxication and other
signaling pathways: clinical and toxicological consequences. Xenobiotica 34: 633-664 27 Handschin C, Meyer UA (2003) Induction of drug metabolism: The role of nuclear
receptors Pharmacological Reviews 55: 649-673 28 Falus A (2006) Fejezetek a genomléptékű biológiából és orvostudományból-
Citokróm P450 gének és azok variábilitása. A CYP1-4 enzimcsalád. Semmelweis kiadó
és Multimédia Studió, Budapest, p: 42-58

86
29 Willson TM, Kliewer SA (2002) PXR, CAR and drug metabolism. Nature Reviews,
Drug Discovery 1: 259-266 30 Song BJ, Veech RL, Park SS, Gelboin HV, Gonzalez FJ (1989) Induction of rat
hepatic N-nitrosodimethylamine demethylase by acetone is due to protein stabilization.
J Biol Chem 264: 3568-3572 31 Oesch-Bartlomowicz B, Oesch F (2003) Cytochrome P450 phosphorylation as a
functional switch. Arch Biochem Biophys 409: 228-234 32 Oesch-Bartlomowicz B, Oesch F (1990) Phosphorylation of cytochrome P450
isenzymes in intact hepatocytes and its importance for their function in metabolic
processes. Arch Toxicol 64: 257-261 33 Oesch-Bartlomowicz B, Oesch F (2002) Fast regulation of cytochrome P450
activities by phosphorylation and consequences for drug metabolism and toxicity. Biol
Chem 383: 1587-1592 34 Müller R, Schmidt WE, Stier A (1985) The site of cyclic AMP-dependent protein
kinase catalyzed phosphorylation of cytochrome P-450 LM2. FEBS Lett 187: 21-24 35 Jansson I, Curti M, Epstein PM, Patterson JA, Schenkman JB (1990) Relationship
between phosphorylation and cytochrome P450 destruction. Arch Biochem Biophys
283: 285-292 36 Oesch-Bartlomowicz B, Oesch F (2004) Modulation of mutagenicity by
phosphorylation of mutagen-metabolising enzymes. Arch Biochem Biophys 423: 31-36 37 Gonzalez FJ, Ueno T, Umeno M, Song BJ, Veech RL, Gelboin HV (1991)
Microsomal ethanol oxidizing system: transcriptional and posttranscriptional regulation
of cytochrome P450, CYP2E1. Alcohol and Alcoholism Suppl 1: 97-101

87
38 Eliasson E, Mkrtchian S, Ingelman-Sundberg M (1992) Hormone- and substrate-
regulated intracellular degradation of cytochrome P450 (2E1) involving MgATP-
activated rapid proteolysis in the endoplasmic reticulum membranes. J Biol Chem 267:
15765-15769 39 Oesch-Bartlomowicz B, Padma PR, Becker R, Richter B, Hengstler JG, Freeman JE,
Wolf CR, Oesch F (1998) Differential modulation of CYP2E1 activity by cAMP-
dependent protein kinase upon Ser129 replacement. Exp Cell Res 242: 294-302 40 Doherty MM, Charman WN (2002) The mucosa of the small intestine. How clinically
relevant as an organ of drug metabolism? Clin Pharmacokinet 41: 235-253 41 George ChF (1981) Drug metabolism by the gastrointestinal mucosa. Clin
Pharmacokinet 6: 259-274 42 Paine MF, Shen DD, Kunze KL, Perkins JD, Marsh ChL, McVicar JP, Barr DM,
Gillies BS, Thummel KE (1996) First-pass metabolism of midazolam by the human
intestine. Clin Pharmacol Ther 60: 14-24 43 Holtbecker N, Fromm MF, Kroemer HK, Ohnhaus EE, Heidemann H. (1996) The
nifedipine-rifampin interaction. Evidence for induction of gut wall metabolism. Drug
Metab Dispos 24: 1121-1123 44 Floren LC, Bekersky I, Benet LZ, Mekki Q, Dressler D, Lee JW, Roberts JP, Hebert
MF (1997) Tacrolimus oral bioavailability doubles with coadministration of
ketoconazole. Clin Pharmacol Ther 62: 41-49 45 Lampen A, Zhang Y, Hackbarth I, Benet LZ, Sewing KF, Christians U (1998)
Metabolism and transport of the macrolide immunosuppressant sirolimus in the small
intestine. J Pharmacol Exp Ther 285: 1104-1112
88
46 Hebert MF, Roberts JP, Prueksaritanont T, Benet LZ (1992) Bioavailability of
cyclosporine with concomitant rifampin administration is markedly less than predicted
by hepatic enzyme induction. Clin Pharmacol Ther 52: 453-4577 47 Fromm MF, Busse D, Kroemer HK, Eichelbaum M (1996) Differential induction of
prehepatic and hepatic metabolism of verapamil by rifampin. Hepatology 24: 796-801 48 Lin JH, Chiba M, Baillie TA (1999) Is the role of the small intestine in first-pass
metabolism overemphasized? Pharmacol Rev 51: 135-158 49 Schwenk M (1988) Mucosal biotransformation Toxicol Pathology 16:138-146 50 Zhang Q-Y, Wikoff J, Dunbar D, Fasco M, Kaminsky L (1997) Regulation of
cytochrome P450 1A1 expression in rat small intestine. Drug Metab Dispos 25: 21-26 51 Paine MF, Hart HL, Ludington SS, Haining RL, Rettie AE, Zeldin DC (2006) The
human intestinal cytochrome P450 “pie”. Drug Metab Dispos 34: 880-886 52 Bonkovsky HL, Hauri HP, Marti U, Gasser R, Meyer UA (1985) Cytochrome P450
of small intestinal epithelial cells. Immunochemical characterization of the increase in
cytochrome P450 caused by Phenobarbital. Gastroenterology 88: 458-467 53 Sesardic D, Cole KJ, Edwards RJ, Davies DS, Thomas PE, Levin W, Boobis AR
(1990) The inducibility and catalytic activity of cytochrome P450e (CYP1A1) and
P450d (CYP1A2) in rat tissues. Biochem Pharmacol 39: 499-506 54 Watkins PB, Murray SA, Winkelman LG, Heuman DM, Wrighton SA, Guzelian PS
(1989) Erythromycin breath test as an assay of glucocorticoid-inducible liver
cytochromes P-450. J Clin Invest 83: 688-697 55 Lown KS, Kolars JC, Thummel KE, Barnett JL, Kunze KL, Wrighton SA, Watkins
PB (1994) Interpatient heterogeneity in expression of CYP3A4 and CYP3A5 in small

89
bowel: Lack of prediction by the erythromycin breath test. Drug Metab Dispos 22: 947-
955 56 Hartley DP, Dai X, He YD, Carlini EJ, Wang B, Huskey SW, Ulrich RG, Rushmore
TH, Evers R, Evans DC (2004) Activators of the rat Pregnane X Receptor differentially
modulate hepatic and intestinal gene expression. Mol Pharmacol 65: 1159-1171 57 Miranda CL, Chhabra RS (1980) Species differences in stimulation of intestinal and
hepatic microsomal mixed-function oxidase enzymes. Biochem Pharmacol 29: 1161-
1165 58 Ziegler DM (1980) Microsomal flavin-containing monooxygenase oxygenation of
nucleophilic nitrogen and sulphur compounds. Enzymatic Basis of Detoxication,
Academic Press, New York, p: 201-277
59 Rettie AE, Fischer MB (1999) Transformation enzymes: Oxidative, Non-P450.
Handbook of Drug Metabolism. Marcel Dekker, Inc., Ann Arbor, p:132-151
60 Cashman JR (2002) Flavin monooxygenases. Enzymes systems that Metabolise
Drugs and Other Xenobiotics. John Wiley and Sons Ltd, p: 67-93
61 Birkett DJ, MacKenzie PI, Veronese ME, Miners JO (1993) In vitro approaches can
predict human drug metabolism. Trend Pharmacol Sci 14: 291-294
62 Krueger SK, Williams DE (2005) Mammalian flavin-containing monooxygenase:
structure/function, genetic polymorphisms and role in drug metabolism. Pharmacol
Ther 106: 357-387
63 Cashman JR (1995) Structural and catalytic properties of the mammalian flavin-
containing monooxygenase. Chem Res Toxicol 8: 165-181

90
64 Brunelle A, Bi YA, Lin J, Russel B, Luy L, Berkman C, Cashman JR (1997)
Characterization of two human flavin-containing monooxygenase (FORM3) enzymes
expressed in Escherichia coli as a maltose binding protein fusion. Drug Metab Dispos
25: 1001-1007
65 Cashman JR (1999) In vitro metabolism: FMO and related oxygenations. Handbook
of Drug Metabolism. Marcel Dekker, Inc., Ann Arbor, p: 477-506
66 Lawton M, Cashman J, Cresteil T, Dolphin C, Alfarra A (1994) A nomenclature for
the mammalian flavin-containing monooxygenase gene family based on amino acid
sequence identities. Arch Biochem Biophys 308: 254-257
67 Hines RN, Hopp KA, Franco J, Saeian K, Begun FP (2002) Alternative processing of
the human FMO6 gene renders transcripts incapable of encoding a functional flavin-
containing monooxygenase. Mol Pharmacol 62: 320-325
68 Ripp SL, Itagaki K, Philpot RM, Elfarra AA (1999) Species and sex differences in
expression of flavin-containing monooxygenase form 3 in liver and kidney microsomes.
Drug Metab Dispos 27: 46-52
69 Cherrington NJ, Cao Y, Cherrington JW, Rose RL, Hodgson E (1998) Physiological
factors affecting protein expression of flavin-containing monooxygenases 1, 3 and 5.
Xenobiotica 28: 673-682
70 Cashman JR (2005) Some distinctions between flavin-containing and cytochrome
P450 monooxygenases. Biochem Biophys Res Commun 338: 599-604
71 Rouer E, Rouet P, Delpech M, Leroux J-P (1988) Purification and comparison of
liver microsomal flavin-containing monooxygenase from normal and streptozotocin-
diabetic rats. Biochem Pharmacol 37: 3455-3459

91
72 Osimitz TG, Kulkarni AP (1982) Oxidative metabolism of xenobiotics during
pregnancy. Significance of microsomal flavin-containing monooxygenase. Biochem
Biophys Res Commun 109: 1164-1171
73 Dixit A, Roche TE (1984) Spectrophotometric assay of flavin-containning
monooxygenase and changes in its activity in female mouse liver with nutritional and
diurinal conditions. Arch Biochem Biophys 233: 50-63
74 Brodfuehrer JI, Zannoni VG (1986) Ascorbic acid deficiency and the flavin-
containing monooxygenase. Biochem Pharmacol 35: 637-644
75 Dannan GA, Guengerich FP, Waxman DJ (1986) Hormonal Regulation of the rat
liver microsomal enzymes. Drug Metab Dispos 261: 10728-10735
76 Lin JH (2000) Sense and nonsense in the prediction of drug-drug interactions.
Curr Drug Metab 1: 305-331 77 Clark SE, Jeffrey P (2001) Utility of metabolic stability screening: comparison of in
vitro and in vivo clearance. Xenobiotica 31:591-598 78 Obach RS (2001) The prediction of human clearance from hepatic microsomal
metabolism data. Curr Op Drug Disc Develop 4: 36-44 79 Sakuma T, Honma R, Maguchi S, Tamaki H, Nemoto N (2001) Different expression
of hepatic and renal cytochrome P450s between the streptozotocin-induced diabetic
mouse and rat. Xenobiotica 31: 223-237 80 Ackerman DM, Leibman KC (1977) Effect of experimental diabetes on drug
metabolism in rat. Drug Metab Dispos 5: 405-410
81 Szkudelski T (2001) The mechanism of Alloxan and Streptozotocin action in ß cells
of the rat pancreas. Physiol Res 50: 537-546
92
82 Junod A, Lambert AE, Orci L, Pictet R, Gonet AE, Renold AE (1967) Studies of the
diabetogenic action of streptozotocin. Proceed Soc Exp Biol Med 126: 201-205 83 Yamazoe Y, Murayama N, Shimada M, Yamauchi K, Kato R (1989) Cytochrome
P450 in livers of diabetic rats: Regulation by growth hormone and insulin. Arch
Biochem Biophys 268: 567-575 84 Thummel KE, Schenkman JB (1990) Effects of testosterone and growth hormone
treatment on hepatic microsomal P450 expression in the diabetic rat. Mol Pharmacol
37: 119-129 85 Morgan ET, MacGoech C, Gustafsson J-A (1985) Hormonal and developmental
regulation of expression of the hepatic microsomal steroid 16α-hydroxylase cytochrome
P-450 apoprotein in the rat. J Biol Chem 260: 11895-11898 86 De Waziers I, Garlatti M, Bouguet J, Beaune PH, Barouki R (1995) Insulin down-
regulates cytochrome P450 2B and 2E expression at the posttranslational level in the rat
hepatoma cell line. Mol Pharmacol 47: 474-479
87 Rouer E, Lemoine A, Cresteil T, Rouet P, Leroux J-P (1987) Effects of genetic or
chemically induced diabetes on imipramine metabolism. Drug Metab Dispos 15: 524-
528
88 Wang T, Shankar K, Ronis MJJ, Mehendale HM (2000) Potentiation of thioacetamide
liver injury in diabetic rats is due to induced CYP2E1. J Pharmacol Exp Ther 294: 473-
479 89 Ettarh RR, Carr KE (1997) A morphological study of the enteric mucosal epithelium
in the streptozotocin-diabetic mouse. Life Sciences 61: 1851-1858
93
90 Stierlin H, Faigle JW, Sallmann A, Küng W (1979) Biotransformation of Diclofenac
sodium (Voltaren®) in animals and in man. I. Isolation and identification of principal
metabolites. Xenobiotica 9: 601-610 91 Small HE (1989) Diclofenac Sodium. Gastroenterology 8: 59 92 Hargus SJ, Amouzedeh HR, Pumford NR, Myers TG, McCoy SC, Pohl LR (1994)
Metabolic activation and immunochemical localization of liver protein adducts of the
Nonsteroidal Anti-inflammatory drug Diclofenac. Chem Res Toxicol 7: 575-582 93 Masubuchi Y, Ose A, Horie T (2001) Mechanism-based inactivation of CYP2C11 by
Diclofenac. Drug Metab Dispos 29: 1190-1195 94 Shen S, Hargus SJ, Martin BM, Pohl LR (1997) Cytochrome P4502C11 is a target of
Diclofenac covalent binding in rats. Chem Res Toxicol 10: 420-423
95 Leemann T, Transon C, Dayer P (1993) Cytochrome P450TB (CYP2C): A major
monooxygenase catalyzing Diclofenac 4’-hydroxylation in human liver. Life Sci 52: 29-
34
96 Kobayashi K, Urashima K, Shimada N, Chiba K (2002) Substrate specificity for rat
cytochrome P450 (CYP) isoforms: screening with cDNA-expressed systems of the rat.
Biochem Pharmacol 63: 889-896
97 Kim YC, Oh EY, Kim SH, Lee MG (2006) Pharmacokinetics of Diclofenac in rat
model of Diabetes Mellitus induced by alloxan or streptozotocin. Biopharm Drug
Dispos 27: 85-92
98 Chovan JP, Ring SC, Yu E, Baldino JP (2007) Cytochrome P450 probe substrate
metabolism kinetics in Sprague Dawley rats. Xenobiotica 37: 459-473

94
99 Petroianu GA, Nurulain SM, Nagelkerke N, Al-Sultan MAH, Kuca K, Kassa J (2006)
Five oximes (K-27, K-33, K-48, BI-6 and methoxime) in comparison with pralidoxime:
survival in rats exposed to the organophosphate paraoxon. J Appl Toxicol 26: 262-268
100 Namba T, Nolte CT, Jackrel J, Grob D (1971) Poisoning due to organophosphate
insecticides. Acute and chronic manifestations. Am J Med 50: 475-492 101 Sungur M, Güven M (2001) Intensive care management of organophosphate
insecticide poisoning. Critical Care 5: 211-215
102 Utley D (1983) Determination of 2-hidroxiiminometil-1-metilpiridinium
methanesulphonate (pralidoxime mesylate, P2S) and its degradation products in
solution by liquid chromatography. J Chrom 265: 311-322
103 Pohjola J, Harpf M (1994) Determination of atropine and obidoxime in automatic
injection devices used as antidotes against nerve agent intoxication. J Chrom A 686:
350-354
104 Kassa J, Kunesova G (2006) A comparison of the potency of newly developed
oximes (K027, K048) and commonly used oximes (obidoxime, HI-6) to counteract
tabun-induced neurotoxicity in rats. J Appl Toxicol 26: 309-316
105 Csermely T, Petroianu G, Kuca K, Fűrész J, Darvas F, Gulyás Zs, Laufer R, Kalász
H (2007) TLC of quaternary pyridinium aldoximes, antidotes of organophosphorus
esterase inhibitors. J Planar Chrom 20: 39-42
106 Kuca K, Bielavsky J, Cabal J, Kassa J (2003) Synthesis of a new reactivator of
tabun-inhibited acetylcholinesterase. Bioorg Med Chem Lett 13: 3545-3547 107 Petroianu GA, Nurulain SM, Nagelkerke N, Shafiullah M, Kassa J, Kuca K, (2007)
Five oximes (K-27, K-48, obidoxime, HI-6 and trimedoxime) in comparison with
pralidoxime: survival in rats exposed to methyl-paraoxon. J Appl Toxicol 27: 453-457

95
108 Lorke DE, Hasan MY, Nurulain SM, Sheen R, Kuca K, Petroianu GA (2007) Entry
of two new asymmetric byspiridinium oximes (K-27 and K-48) into the rat brain:
comparison with obidoxime. J Appl Toxicol 27: 482-490 109 Kalász H, Hasan MY, Sheen R, Kuca K, Petroianu G, Ludanyi K, Gergely A, Tekes
K (2006) HPLC analysis of K-48 concentration in plasma. Anal Bioanal Chem 385:
1062-1067
110 Stohs SJ, Grafström RC, Burke MD, Moldeus PW, Orrenius SG (1976) The isolation
of rat intestinal microsomes with stable cytochrome P450 and their metabolism of
benzo(α)pyrene. Arch Biochem Biophys 177: 105-116 111 Lowry OH, Rosebrough NJ, Farr AL and Randall RJ (1951) Protein measurement
with the Folin Phenol reagent. J Biol Chem 193: 265-275
112 Greim H (1970) Synthesesteigerung und Abbauhemmung bei der Vermehrung der
mikrosomalen Cytochrome P450 und b-5 durch Phenobarbital. Naunyn Schmiedebergs
Arch Pharmakol 266: 260-75
113 Nash T (1953) The colometric estimation of formaldehyde by means of the Hantzsch
reaction. Biochem J 55: 416-21 114 Dalmadi B, Leibinger J, Szeberényi Sz, Borbás T, Farkas S, Szombathelyi Zs,
Tihanyi K (2003) Identification of metabolic pathways involved in the
biotransformation of tolperisone by human microsomal enzymes. Drug Metab Dispos
31: 631-636
115 Molnár L, Keserű GM, Papp A, Gulyás Zs, Darvas F (2004) A neural network based
prediction of octanol-water partition coefficients using atomic5 fragmental descriptors.
Bioorg Med Chem 14: 851-853
96
116 McGrew RE (1985) Encyclopedia of medical history –Diabetes Mellitus. Macmillan
Press, London, p: 90-93 117 Ádám V, Mandl J (1996) A szénhidrátok anyagcseréje. In Orvosi biokémia. Ed.
Ádám Veronika. Semmelweis Kiadó, Budapest, p:76-120
118 Tímár J (1999) A szénhidrát anyagcsere gyógyszertana In Gyógyszertan. Ed. Fürst
Zsuzsanna, Medicina Könyvkiadó Rt., Budapest, p: 742-757
119 Aiba T, Yoshinaga M, Ishida K, Takehara Y, Hashimoto Y (2005) Intestinal
expression and metabolic activity of the CYP3A subfamily in female rats. Biol Pharm
Bull 28: 311-315
120 Takara K, Ohnishi N, Horibe S, Yokoyama T (2003) Expression profiles of drug-
metabolising enzyme CYP3A and drug efflux transporter multidrug resistance 1
subfamily mRNAs in rat small intestine. Drug Metab Dispos 31: 1235-1239
121 Martignoni M, Groothuis G, de Kanter R (2006) Comparison of mouse and rat
cytochrome P450-mediated metabolism in liver and intestine. Drug Metab Dispos
34:1047-1054 122 Barnett CR, Gibson GG, Wolf CR, Flatt PR, Ioannides C (1990) Induction of
cytochrome P450III and P450IV family proteins in streptozotocin-induced diabetes.
Biochem J 268: 765-769 123 Woodcroft KJ, Novak RF (1999) Insulin differentially affects xenobiotic-enchanced,
cytochrome P450 (CYP)2E1, CYP2B, CYP3A and CYP4A expression in primary
cultured rat hepatocytes. J Pharmacol Exp Ther 289: 1121-1127 124 Lieber CS (1997) Cytochrome P4502E1: its physiological and pathological role.
Physiol Rev 77: 517-544

97
125 Yamazoe Y, Murayama N, Shimada M, Imaoka S, Funae Y, Kato R (1989)
Suppression of hepatic levels of an ethanol-inducible P-450DM/j by growth hormone:
Relationship between increased level of P-450 DM/j and depletion of growth hormone
in diabetes. Molec Pharmac 36: 716-722 126 Johansson I, Lindros KO, Eriksson H, Ingelman-Sundberg M (1990) Transcriptional
control of CYP2E1 in the perivenous liver region and during starvation. Biochem
Biophys Res Commun 173: 331-338 127 Woodcroft KJ, Hafner MS, Novak RF (2002) Insulin signaling in the transcriptional
and posttranscriptional regulation of CYP2E1 expression. Hepatology 35: 263-273 128 Tannenbaum GS (1981) Growth hormone secretory dynamics in streptozotocin
diabetes: evidence of a role for endogenous circulating somatostatin. Endocrinology
108: 76-82 129 Harrison HE, Robinson TE (1980) Impaired growth hormone secretion in
streptozotocin diabetic rats. Horm Metab Res 12: 556-557 130 Waxman DJ (1984) Rat hepatic cytochrome P-450 isoenzyme 2c. J Biol Chem 259:
15481-15490 131 Ström A, Westin S, Eguchi H, Gustafsson J-A, Mode A (1995) Characterization of
orphan nuclear receptor binding elements in sex-differentiated members of the CYP2C
gene family expressed in rat liver. J Biol Chem 270: 11276-11281 132 Pass GJ, Becker W, Kluge R, Linnartz K, Plum L, Giesen K, Joost H-G (2002) Effect
of hyperinsulinaemia and type 2 diabetes-like hyperglycaemia on expression of hepatic
cytochrome P450 and glutathione S-transferase isoforms in a New Zealand Obese-
Derived Mouse Backcross population. J Pharm Exp Ther 302: 442-450

98
133 Imaoka S, Hashizume T, Funae Y (2005) Localization of rat cytochrome P450 in
various tissues and comparison of arachidonic acid metabolism by rat P450 with that by
human P450 orthologs. Drug Metab Pharmacokinet 20: 478-484 134 Imaoka S, Nakamura M, Ishizaki T, Shimojo N, Ohishi N, Fujii S, Funae Y (1993)
Regulation of renal cytochrome P450s by thyreoid hormone in diabetic rats. Biochem
Pharmacol 46: 2197-2200 135 Waxman DJ, Dannan GA, Guengerich FP (1985) Regulation of rat hepatic
cytochrome P-450: age-dependent expression, hormonal imprinting, and xenobiotic
inducibility of sex-specific isoenzymes. Biochemistry 24: 4409-4417 136 Ripp SL, Falkner KC, Pendleton ML, Tamási V, Prough RA (2003) Regulation of
CYP2C11 by Dehydroepiandrosterone and Peroxisome Proliferators: Identification of
the Negative Regulatory Region of the Gene. Mol Pharmacol 64:113–122 137 Marie S, Roussel F, Cresteil T (1993) Age- and tissue-dependent expression of
CYP2C23 in the rat. Biochem Biophys Acta 1172: 124-130 138 Bort R, Mace K, Boobis A, Gomez-Lechon M-J, Pfeifer A, Castell J (1999) Hepatic
metabolism of Diclofenac: Role of human CYP in the minor oxidative pathway.
Biochem Pharmacol 58: 787-796 139 Eyer P, Szinicz L, Thiermann H, Worek F, Zilker T (2007) Testing of antidotes for
organophosphorus compounds: Experimental procedures and clinical reality.
Toxicology 233: 108-119 140 Way JL (1962) The metabolism of C14-Pam in the isolated perfused rat liver. J
Pharmacol Exp Ther 138: 258-263 141 Gibbon SL, Way JL (1967) Rapid method for investigating the in vivo metabolism of
1-methyl-2-aldoximinopyridinium iodide by ion exchange column chromatography. J
Chrom 26: 202-207