Embed Size (px)
DESCRIPTION
yes yes
Citation preview
A DIRECT TEST OF THE THEORY OF COMPARATIVE ADVANTAGE THE CASE OF JAPAN1
Daniel M Bernhofen2 John C Brown
Department of Economics
Clark University USA
May 22 2003
(forthcoming in Journal of Political Economy)
Abstract
We exploit Japanrsquos sudden and complete opening up to international trade in the 1860s to test the empirical validity of one of the oldest and most fundamental propositions in economics the theory of comparative advantage Historical evidence supports the assertion that the characteristics of the Japanese economy at the time were compatible with the key assumptions of the neoclassical trade model Using detailed product-specific data on autarky prices and trade flows we find that the autarky-price value of Japanrsquos trade is negative for each year of the period 1868-1875 This confirms the prediction of the theory
1 We are grateful to Clark University for supporting this project with a faculty research grant and toYukie Okuyama Sumiko Otsuka and Stephen Papadopoulos for excellent research assistance We thank Alan Deardorff Jim Harrigan Yasukichi Yasuba and seminar participants at Clark Harvard Wesleyan the Empirical Investigations in International Trade Conference at Purdue the Midwest International Economics Meetings at Madision and the Japan Economic Seminar at Columbia University for helpful comments The current exposition benefited from the insightful comments of the editor John Cochrane and an anonymous referee Bernhofen is also indebted to his Doktorvater J David Richardson for the inspiration to combine theory with history 2 Address for Correspondence Daniel M Bernhofen Department of Economics Clark University Worcester MA 01610 USA Phone (508)-793-7185 Fax (508)-793-8849 Email dbernhofenclarkuedu
2
I Introduction
This paper provides a direct test of the theory of comparative advantage in its autarky-price
formulation It exploits Japanrsquos dramatic 19th century move from a state of near complete isolation to one
that was fully exposed to the forces of international competition and argues that the case of Japan
provides a natural experiment to explore the empirical validity of the theory
We test the correlation version of the law of comparative advantage developed by Alan
Deardorff (1980) It asserts that an economyrsquos net export vector evaluated at autarky prices is negative3
In a world with just two goods (see figure 1) this is equivalent to the proposition that the economy will
export the good with the lower relative opportunity cost4 Generalizing to the case of more than two
goods it is not possible to predict the import or export patterns of individual commodities However the
correlation version of the law of comparative advantage is robust in higher dimensions The theory
asserts that on average a country will import what is dear and export what is cheap with the valuation
taking place at autarky prices
[figure 1]
An empirical test of this proposition requires only data on a countryrsquos autarky prices and its
international trade flows Autarky prices incorporate all relevant information about a countryrsquos intrinsic
3 Independent of Deardorff Dixit and Norman (1980 pp 94-96) derived the same result However their analysis
wasnrsquot formulated and developed as thoroughly as Deardoffrsquos
4 While under autarky the economyrsquos production point coincides with its consumption point (xa=ca) international
trade allows the production point xf to be distinct from the consumption point cf In Figure 1 the economy has a
comparative advantage in good 2 (or the slope of the production possibility frontier at xf is flatter than at xa) This
implies that the economyrsquos trade vector evaluated at autarky prices is negative or paTlt0
3
supply and demand conditions5 The trading vector contains all the necessary information about its
trading partners Consequently the value of a countryrsquos trade at autarky prices is a sufficient basis for a
comparative advantage proposition6
While several previous studies most notably Huber (1971) but also Williamson (1999) have
drawn upon the Japanese case their primary focus was to make inferences about the welfare and
distributional implications of Japanrsquos opening to trade In order to achieve this they focused on a narrow
range of commodities and prices With its test of the fundamental proposition of comparative advantage
this study breaks new ground Guided by the data requirements of the theory we have constructed a
comprehensive product-specific data set on autarky commodity prices and trade flows It draws on a rich
collection of autarky price data from a variety of historical sources
In contrast to the often complex and sophisticated product characteristics of goods traded
internationally today the commodities that initially entered into Japanese trade after it opened up were
predominantly agricultural or simple manufactured goods They can be reasonably characterized as
homogeneous goods Since the historical evidence suggests that these goods were priced under fairly
competitive market conditions the observed autarky prices appear to be excellent measures of Japanrsquos
relative opportunity costs at the time The time period selected for the natural experiment begins with the
final years of Japanrsquos complete economic and political isolation (1851-1853) Japan actually opened its
markets to trade in mid-1859 and the analysis employs trade data from about one decade later (1868-
1875) when Japanrsquos external trading regime could be reasonably described as ldquofree traderdquo and trade data
5 The insight that prices contain the relevant information about underlying economic fundamentals goes back to the
pioneering work of Hayek (1945)
6 The unavailability of autarky prices has been the key obstacle for conducting a direct test of the theory of
comparative advantage Hence the empirical literature in international trade has almost exclusively focused on
models that point to different measurable sources of comparative advantage Deardorff (1984) Leamer and
Levinsohn (1995) Harrigan (2003) and Davis and Weinstein (2003) provide excellent surveys of this literature
4
of adequate quality and detail are available Our finding that Japanrsquos autarky price value of trade is
negative for each single year of the sample period 1868-1875 provides strong empirical support for the
prediction of the theory of comparative advantage
The paper is organized as follows Section II introduces the theoretical framework Section III
discusses the case of Japan and provides evidence for the claim that Japanrsquos entrance into world
commerce can be perceived as a ldquonatural experimentrdquo that offers an opportunity to test the theory
Section IV specifies the empirical framework describes the data sources discusses measurement issues
and reports the empirical findings Concluding remarks are contained in section V
II Theory
Autarky versus free trade what does it mean
The law of comparative advantage involves a comparison of autarky and free trade The static
trade model implicitly assumes that the economyrsquos production possibilities are the same under both
regimes Empirically it is possible that Japanrsquos production possibilities did change during the countryrsquos
transition from autarky to free trade Following Helpman and Krugman (1985 p39) we view the
comparison as one between two potential histories
ldquoTo the extent that a static trade model is used as a proxy for a dynamic worldhellipthe comparison
of autarky with free trade should be understood as a comparison between two alternative
histories not as a change that takes place over timehellipThe question is not where you are after
trade compared with where you were before but where you are after trade compared with where
you would have been without traderdquo
5
Applying this insight to this study investigating Japanrsquos pattern of trade should involve a
comparison between the observed free trade regime (1870s) and an autarky regime at the same time
period (1870s) that would have prevailed had Japan not opened its doors to world markets Consequently
we will focus on three states in the history of the Japanese economy A is the autarky regime that
prevailed through 1858 (period one) B is the hypothetical autarky regime that would have prevailed
during the early 1870s had Japan remained closed (period two of the comparison) Regime C is the
actual free trade regime of the early 1870s used in the empirical analysis (also period two)
Consider a competitive economy with n goods and denote by pti the n-vector of equilibrium
goods prices xti the n-vector of equilibrium production outputs and ct
i the n-vector of equilibrium
consumption levels The superscript ldquoardquo is used to denote a variable under autarky and the superscript ldquofrdquo
denotes a variable under free trade (ie i=af) The subscript ldquotrdquo pertains to one of the two time periods
(ie t=12) In each period production points are constrained to lie in a technologically feasible
production set Ft (t=12) While the equilibrium prices under autarky pta (t=12) are determined solely by
domestic supply and demand conditions the equilibrium price vector under free trade p2f is exogenous
to the domestic economy The subsequent analysis pertains to three competitive equilibria
(Autarky) regime A (p1ax1
ac1a) x1
a isin F1
(Autarky) regime B (p2ax2
ac2a) x2
a isin F2
(Free trade) regime C (p2fx2
fc2f) x2
f isin F2
The above discussion implies that the law of comparative advantage involves a comparison of
Japanrsquos historical path under free trade with its historical path if it had continued to operate under
autarky (ie regime C versus regime B) The absence of information on the unobservable autarky regime
B will require an assessment of the conditions under which what is observed in autarky under regime A
permits inferences about the validity of the law of comparative advantage The assessment will draw
6
upon the historical evidence available on the Japanese economy of the 1850s and the path taken during
the early years of the open trade regime
[figure 2]
An identification condition
The model is based on three key assumptions 7 First it assumes that competitive producers
maximize the value of production on a production possibility set Ft
ptixt
i ge ptixt for all xtisin Ft (i=aft=12) (1)
Second we assume that aggregate consumer preferences in period 2 are in accord with the weak axiom
of revealed preference ie
p2fc2
f gep2fc2
a =gt p2ac2
fgtp2ac2
a (2)
meaning that if c2f was preferred to c2
a at p2f then c2
f must not have been affordable to the economy at
p2a8 Finally we need to rule out any trade surplus ie
p2fTle0 (3)
where T denotes the net export vector defined as T=x2f-c2
f9 Given these conditions we can state the law
of comparative advantage
7 Our presentation of the theory follows the condensed formulation by Deardorff (1994) In his earlier paper
Deardorff (1980) has shown that as long as export subsidies are ruled out the theory is also valid in the presence of
non-traded goods transportation costs and production distortions
8 A sufficient condition for the weak axiom of revealed preference is the existence of a well-behaved social utility
function for the economy However Shimomura and Wong (1998) have shown that the general law of comparative
advantage can be derived under somewhat weaker conditions that do not require the presence of a social utility
function
9 Hence good i is exported if Tigt0 and imported if Tilt0
7
Lemma (Law of comparative advantage) The value of net exports in period 2 evaluated at the
(unobserved) autarky prices in period 2 is negative p2aTlt0
Proof (1) and (3) imply that p2fc2
f ge p2fx2
f gep2fx2
a=p2fc2
a From (1) and (2) we then obtain
p2ac2
fgtp2ac2
a=p2ax2
agep2ax2
f =gt p2aTlt0
Fundamentally the law is a proposition about the sign of the weighted average of a countryrsquos
vector of traded goods where the weights equal the corresponding opportunity costs (prices) under
autarky The negative sign implies that on average goods with relatively high autarky prices will be
imported and goods with relatively low autarky prices will be exported10
Since the autarky price vector p2a is not observed this lemma cannot be directly implemented
empirically However since we observe the autarky price vector p1a we can investigate a sufficient
condition for the validity of the proposition if we substitute the observed autarky price vector p1a for the
unobserved price vector p2a Recognizing that the counterfactual autarky price vector p2
a can be written as
p2a = p1
a+ε where ε denotes an error term we obtain the following identification condition for the law of
comparative advantage
Proposition As long as εTle0 then p1aTlt0 is a sufficient condition for Japanrsquos trade pattern to
be consistent with the general law of comparative advantage ie p1aTlt0 =gt p2
aTlt0
The identification condition εTle0 states that that the correlation between changes in autarky
prices under a (hypothetical) closed economy growth path and the trading vector would be either zero
(ie εT=0) or that autarky prices would have fallen on average in goods that the economy actually
10 Drabicki and Takayama (1979) and Dixit and Norman (1980 p 95-96) provide examples which illustrate that
with more than two goods opportunity costs do not predict trading patterns good by good
8
exported (ie εTlt0) The identification condition rules out that Japanrsquos ldquo(hypothetical) closed economy
growthrdquo from period 1 to period 2 would have been on average biased towards its importables Given
production conditions in mid-19th century Japan and the obstacles in the economy to rapidly adopting
new western technologies it is unlikely that εTgt0 and the identification condition would most likely
hold
III Japanrsquos Opening Up as a Natural Experiment
In his survey on the empirical literature of international trade Deardorff (1984 p 470) argued
that tests of the theory of comparative advantage remain virtually impossible to carry out because
ldquo[a]lmost all countries have engaged in trade throughout history so that there is no experience with
autarky from which to draw datardquo Japanrsquos economic history offers a remarkable exception As a well-
developed market economy which experienced over two centuries of autarky it generated a rich record
of price data Forced by the western powers to move abruptly to a free trade trading regime in 1859
Japan offers a natural experiment uniquely suited to test the core proposition of the theory of comparative
advantage
Japanrsquos policy of autarky (or seclusion) began formally in 1639 when all contact between the
Japanese and outsiders including trade was forbidden The only exception was a small amount of
regulated trade with the Dutch and the Chinese conducted from a spit of land in the harbor of Nagasaki
This trade had dwindled to insignificance by the end of the 18th century (Meylan 1861 pp 93 and 142)
In the last years of seclusion imports per capita were about 06 cents compared with 9 cents in China
before it was forced to open up in the 1840s and 59 cents during the brief closing of trade in the United
States in 1808-180911 A small amount of trade was conducted through the Ryukyu Islands
11 See Hildreth (1855 p 506) Tilley (1861 p 99) and Irwin (2001 Table 1)
9
Treaty negotiations following the visit of Commodore Perry and his fleet in 1853 delayed the
opening up of Japan until July 1859 The trade treaties designated three (later five) ports for
international trade and established a liberal regime that capped tariffs and export duties at low effective
ad valorem rates12 By the mid-1860s military intervention by the western powers had forced the Shogun
to abandon rearguard efforts to restrict trade (Mathias-Pauer and Pauer 1992 p xvi)
The shift from autarky to free trade was rapid and complete Figure 3 illustrates the steep
increase in trade during the first quarter-century after the opening up13 Good communications well-
developed commercial networks and national markets in many commodities prompted a substantial
penetration of Japanese markets (Howe 1996 pp 93-94 and Nakamura 1990 p 94) By 1873 Japanrsquos
imports per capita were 79 cents or three times the level in China14
[figure 3]
Japanrsquos move from autarky to free trade offers a suitable testing ground for the theory of
comparative advantage if the economy and conditions of trade reasonably conform to four key
assumptions of the neo-classical trade model The first three assumptions ensure that the autarky prices
and net export data used in the analysis convey the necessary information about domestic supply and
demand conditions and opportunities for exchange with trading partners
(1) The vector of autarky prices reflected the outcome of competitive markets
(2) Japanese producers were price-takers in international markets
12 Revisions to trade treaties in 1866 set specific tariffs and export taxes that averaged about 25 to 35 per cent ad
valorem (von Scherzer 1868 pp 381-399) The treaties allowed Japan to continue a long-standing ban on the export
of rice and copper ore and prohibit the import of opium
13 The peak in exports in 1868 reflects exports of Japanese silk and silkworm eggs in response to the spread of a
corpuscular disease in Italian and French silkworms The peak in imports in 1870 reflects high imports of rice in
response to the poor harvests of that year Trade is valued in current Japanese (silver) yen
14 See von Scherzer (1872 p256) and Sugiyama (1988 p46)
10
(3) Exports received no subsidies
The final assumption ensures that the identification condition εTle0 holds so that prices from the autarky
period can be applied to the available data on trade
(4) Changes in production possibilities under a closed economy from the opening up to trade
(1859) to the period when the net export vector is analyzed (1868 through 1875) would not
have been biased towards importables
Assumption (1) addresses competitive conditions in the economy under autarky and free trade
Economic historians have achieved a good understanding of the functioning of the Japanrsquos economy
during the more than 250 years of Tokugawa rule that ended with the restoration of the emperor in
186815 Initially Japan had been organized as a feudal society For the most part manufacturing took
place in small workshops of thirty workers or fewer (Takekoshi 1930 p 270 and Piper 1976 pp 29-
30) Agriculture was carried out on small farms However the feudal system initially included guild
monopolies controlling the trade in many commodities and restrictions on the use of land and labor Over
the century ending in the early 1840s the restrictions on trade were dismantled By then competitive
conditions characterized virtually all output markets The allocation of land and labor responded to
movements in relative output prices16 Spectral analysis of the prices of bills of exchange provides
quantitative support for the conclusions of historians By the period 1822-1843 regional integration and
monetization had disrupted traditional feudal regulation of the economy (Yamamura and Duffy 1971 p
15 From 1603 through 1868 feudal lords of the Tokugawa family ruled Japan as a quasi-military dictatorship from
Edo (Tokyo) Already in decline when international trade opened up in mid-1859 the system survived for only
another nine years A rebellion of other feudal lords brought about the restoration of the central role of the emperor
in 1868
16 See Yasuba (1987) Howe (1996) and Crawcour (1997 pp 8-24) for more detailed English-language discussions
of the Tokugawa economy See Nakamura (1990 pp 90-92) for a discussion of output markets Hanley and
Yamamura (1977 p 86) for labor markets and Totman (2000 p 250) for land markets
11
422) Correlation analysis of the detailed regional data available for rice markets suggest that a unified
market existed even for this bulk commodity in western Japan by the beginning of the 18th century
(Miyamoto 1981) Nakamura (1990 p 94) argues that cotton cloth a high-value commodity was traded
in a national market with regional specialization of production by the early 19th century To ensure that
autarky prices most closely reflect competitive conditions we chose 1851-1853 as the autarky period for
our analysis
[Table 1]
Assumption (2) raises the question of whether Japanese producers were price-takers in
international markets Table 1 provides a summary of the composition of Japanese trade for 1868 through
1875 the period when comprehensive trade data are first available Consider first the markets for
imports One-third were agricultural commodities such as beans sugar vegetable oil and rice Latham
and Neal (1983) document the size of international markets for agricultural commodities such as rice and
wheat in the last third of the nineteenth century the volume traded dwarfed any demand from Japan
Another one-half of imports were cotton and woolen textiles Japanese imports were primarily from
England where the Japanese demand was again a fraction of exports to India and China The remaining
imports of miscellaneous manufactured goods would all have been a fraction of international demand
during the early period of open trade Exports were virtually all of agricultural origin and were produced
by small farms under highly competitive conditions Sugiyama (1988 chs 4 and 5) provides a detailed
account of silk silkworm egg and tea production which accounted for about 80 percent of Japanese
exports Indian and Chinese silks competed with Japanese silks in the three main import markets Britain
France and the United States Japanese silks took up 15 to 20 percent of imports into these markets
during the first two decades after opening up Western governments effectively countered early efforts of
the Japanese authorities to manipulate the supply of silk available for export The United States rapidly
12
became the main market for Japanese green tea It faced competition from Chinese green tea black tea
cocoa and coffee Competitive relationships also prevailed in the merchant community that handled the
import and export trade It included 25 western merchant houses and a growing Chinese merchant
community that offered the Europeans stiff competition (von Scherzer 1872 pp 369-372)
For those familiar with Japan today assumption (3)mdashexports were not subsidizedmdashmay appear
the most untenable In actuality during the twenty or so years after the opening up government efforts to
develop export industries remained modest Treaties held tariffs to a minimum and straitened finances
precluded subsidies The government actually levied modest export taxes of three to four percent ad
valorem on tea and silk17
The final assumption (4) asserts that had it remained closed Japanese growth would not have
been biased towards importables during the nine years from opening up to 1868 when the free trade
regime was fully in place and comprehensive trade data are available Given the impetus of economic
growth up to 1859 a shift away from exportables towards the goods that accounted for three quarters of
imports (rice sugar woolens and cotton cloth and yarn) in the subsequent nine years would have been
unlikely Contemporary commentators offer one assessment of the momentum of growth just prior to
opening up They correctly identified the goods that actually became the leading exports of the 1860s
including tea camphor and copper Only raw silk was excluded because of doubts that production could
be expanded substantially beyond what the Japanese consumed under autarky (Hildreth 1855 p560)
Accounts of the last century of the Tokugawa economy likewise stress the ongoing shift of land and labor
out of rice into tea and raw silk (Howe 1996 pp 40-41) The lack of land with a suitable climate
constrained increased production of another key import sugar and the absence of any sheep in Japan
prior to opening up ruled out the domestic production of woolens The low productivity of the hand
technologies available to the spinning sector constrained any substantial expansion of cotton textile
17 The estimated rates are for the early 1870s see Sugiyama (1988 p 35)
13
production The weaving sector had already achieved the productivity gains possible with the adoption of
the vertical loom and the emergence of specialized weaving and spinning enterprises by the 1840s
(Nakamura 1990)
It is also possible but not likely that the Japanese could have used the available information on
western technology to shift production towards the machine-made products of the west such as cotton
yarn and cloth Even before the 1850s western technologies were being implemented in Japan but only
with great difficulty Information on Dutch agricultural techniques was available to the small numbers of
those who spoke Dutch but there is no evidence of commercial adoption of western technologies in
manufacturing Based upon his reading of the attempts of some feudal lords to manufacture cannon and
build ships according to western plans in the 1850s Pauer (1987) argues that the limited technological
expertise and the skill set available to the Japanese during the Tokugawa period precluded rapid adoption
of western technologies It is notable that it took fifteen years after 1859 before Japanese weavers of
cotton cloth began to use the flying shuttle a technology offering ready productivity gains that had been
in use in England since the 18th century The importation and then adaptation of western technologies to
Japanese conditions that characterized early industrialization only got underway after 1880
IV Empirical implementation
Hypotheses
The methodology of our historical-empirical exercise is based on a simple decision-theoretic
framework As discussed in section II the theory implies a concrete hypothesis about the sign of Japanrsquos
net export vector valued at autarky prices
H0 p1a Tlt0 (4)
14
To evaluate the empirical validity of this claim we need to specify an appropriate counterclaim
Ruling out that the sign of p1a T is random we obtain the following counterclaim
H1 p1aTge0 (5)
Although hypothesis H1 is not the prediction of any alternative theory of international trade the data
could ldquochooserdquo H1 instead of H0 Given that the Japanese economy fulfills the textbook assumptions of a
small neoclassical economy evidence in favor of H1 would require some reconsideration of the theory
If we were in the possession of ldquoperfect datardquo on Japanrsquos trade and autarky price vectors we
would be rather confident in making a correct decision with regard to whether Japanrsquos pattern of trade
after its opening up followed the law of comparative advantage (ie H0 is true) or not However
measurement errors that arise from both the ldquotiming of the experimentrdquo and the incompleteness of
autarky price data could increase the likelihood of making a wrong decision Our decision is based on an
approximation Tp a ~~1 of the true (unknown) inner product p1
aT The ldquoautarkyrdquo and ldquofree traderdquo regimes
of the model correspond to about two decades of historical time The goal of keeping the measurement
errors as small as possible guided the selection of the two periods used for collecting the price and trade
data to construct Tp a ~~1 In addition we used approximations for the missing autarky price data that
would ex ante make the inner product more likely to be positive and consequently weigh the decision
in favor of Hypothesis H1 The aim of this strategy was to reduce the ldquolikelihoodrdquo of erroneously
accepting Hypothesis H0
Although the specification of the alternative hypothesis given in (5) serves as a guide for
approximating missing data points in calculating the inner product it does not lend itself to any
probability statements An alternative counterclaim to the prediction that p1a T is negative is that the sign
of the inner product is a random event It seems reasonable to assume that in the case of randomness the
15
occurrence of a negative sign is as likely as the occurrence of a positive sign This leads us to the second
alternative hypothesis
H2 p1a T is random with Pr(p1
aTlt0)=21
(6)
where Pr() denotes the probability measure Since the alternative hypothesis (6) claims that the sign of
the inner product is determined by the toss of a (balanced) coin the null hypothesis in (4) should now be
interpreted as saying that the inner product is negative with probability 1 Assuming that the annual
estimates are independent and drawn from the same distribution we can calculate the smallest level of
significance for which the given data points would lead us to reject the randomness hypothesis given in
(6)
Data description
For the analysis of autarky prices data from the period 1851-1853 appear to offer the best
representation of the ldquoautarky regimerdquo just prior to opening up Already by the 1840s economic activity
was organized in fairly competitive markets as the economy had time to respond to the easing of the
feudal restrictions that started decades earlier The early 1850s precedes the first treaty between Japan
and the west in 185418 For the ldquofree trade regimerdquo we selected the period of 1868-1875 With this
choice we aimed to strike a balance between the reliability of the trade data which increases with time
after the opening up of Japan and effectively capturing the mix of Japanese imports and exports that best
reflects the production possibilities existing just prior to the end of autarky
18 The first treaty simply secured the Americans access to two ports that would be available as coaling stations and as
safe havens for shipwrecked sailors Debate over whether or not to open trade continued through the treaty of 1858
that opened the country up (Jansen 2000 pp 174-185)
16
For the construction of the autarky price vector we identified three groups of commodities The
first group of commodities includes exportables and importables for which we could identify reasonably
close domestic substitutes and for which we could obtain autarky price information For these
commodities we relied upon the continuous price data that are available from 1851 through the early
1870s from a variety of Japanese-language sources19 These sources draw upon merchant account books
the records of large trading houses such as Mitsui and the records of producers The available price
series cover about 65 commodities In cases where the prices of downstream importables were not
available we used the price of the upstream raw material or intermediate good20 For products with
quality differences such as silk and tea the decision-rule dictates that the estimates err on the side of
using price data for the higher-quality variety21 Contemporary European-language publications and more
recent research provide information on the prices of some additional goods just at or before the opening
of trade22 Overall commodities for which autarky price information is available make up two-thirds of
imports by value in 1868-1875 and about 95 percent of the value of exports
19 The sources include Nakai (1989) Miyamoto(1963) Ono (1979) Kinyu Kenkyukai (1937) and
Yamazaki(1983)
20 We substituted a simple unfinished cloth (siraki) for which a complete description was available for all other
finished cotton cloths This cloth had about the same weight and quality as the chief unfinished cloth import
shirtings Unfinished cloths of a higher quality sold for from 20 percent (bleached) up to 300 percent (velvets) more
Applying the relative prices found in Scherzer(1872 p 394) and Brennwald(1865 pp 27-32) to imports in 1868-
1875 suggests that our approach undervalued the average autarky price of cotton cloth imports by at least 20 percent
21 This approach was most important for the choice of a price for teamdash where the prices available varied on the order
of ten timesmdashand the price of raw silk We used the highest price of ldquofirst qualityrdquo tea and the price for the high
quality fine Maebashi silk (Sugiyama 1988 p 90)
22 About 17 commodities fall in this group They include minor exports such as seaweed gall puffs awabi shells
vermicelli and camphor The sources are Great Britain (1861) for the ports of Nagasaki and Kanagawa in 1859
17
A second group of commodities includes goods (primarily woolens) that were not produced in
Japan under autarky Pricing of woolens must take account of the surge in the relative price of woolens
that began in 1860 with the American Civil War and the drop off in American exports of cotton
James(1857) provides information on the price of Orleans cloth (which was relatively inexpensive) and
middle-quality camlets in 1854 These prices are lower than the prices quoted for similar goods in the
consular reports for Shanghai for 1858 (Great Britain 1861 p 517) Von Scherzer(1872 pp 396-397)
provides information on the relative market price of other woolen imports these price data suggest that
using the camlet prices for middle- and the higher-quality cloths and using the price of Orleans for the
lower quality cloths that appear in the statistics will provide reasonable minimum estimates of the value
of these imports23
Finally the calculation of the inner product required estimating the prices of a third group the
one-twentieth of exports and one-sixth of imports for which there were domestic substitutes but for
which price information could not be found in Japanese or contemporary European sources
Approximating the prices of this group of imports ca 1851-1853 relied upon adjusting the actual unit
values available from the trade data in 1868-1875 for changes in the prices of imports and exports from
the early 1850s Sugiyama(1988) notes that contrary to the practice of many European countries at the
time the valuations of imports and exports reflected actual invoiced values Exports were valued at the
price at the point of export while imports were valued at the price prior to shipment to Japan The
adjustment uses the indices of import and export prices found in Shinbo (1978 Table 5-10)
(June and December) and in 1860 (January) von Scherzer (1872 p 262) for silk worm eggs and Huber(1976) for
the price of cotton yarn
23 The most important import that will be undervalued using this procedure is ldquowoolen clothsrdquo which had a unit
value in the late 1860s that was four times the unit value of camlets
18
The trade data are from the import-export statistics collected by the Meiji customs at the treaty
ports for 1868 through 1875 (Japan Bureau of Revenue 1893) The statistics include over 250 separate
goods Alternative series are available from the reports of the British consuls in the ports but these data
lack consistent recording of quantities and the detail found in the official statistics A check of the British
data from 1869 with the official statistics found only minor discrepancies that would have no material
bearing on the estimates presented here 24
Empirical findings
Figure 4 illustrates the price changes of the key tradable goods after opening up It presents a
scatter diagram of the net exports in 1869 graphed in relation to the change in prices from 1851-1853 to
186925 High inflation after opening up meant that all prices rose substantially so that the graph
expresses price changes adjusted for the increase in the price of nontradeable goods The prices of major
exports such as products of the silk industry (silk and silkworm eggs) and minor exports such as copper
manufactures sake and vegetable wax all increased in some cases they almost doubled The relative
price of key imports such as sugar cotton cloth cotton yarn and iron products displayed substantial
declines The increase in the price of rice and legumes may reflect poor weather conditions and the
increase in the price of cotton may stem from the disruption of cotton markets in the wake of the
American Civil War
[figure 4]
24 See Sugiyama (1988 pp 44-48) for a general discussion of Japanese trade statistics during the first decades after
opening up The British recorded quantities of cotton and woolen cloth in ldquopiecesrdquo instead of yards a practice that
substantially increases the potential error in matching net export data from the consular sources with autarky prices
25 After 1859 Japan experienced substantial price inflation For that reason we have normalized all price changes
using the price index of nontradeables from Shinbo(1978 Table 5-10) Net exports are valued at autarky prices
19
Table 2 contains the empirical results that incorporate all of the price and net export data Each
column evaluates the trading vector of a particular year iT~ (i=1868hellip1875) at the same autarky price
vector ap1~ The rows report the constituent components of i
aTp ~~1 the value of net imports or net exports
for which autarky prices are available (rows 1 and 4) the value of imports of woolens (row 2) and the
value of net imports and net exports for which autarky price data are not available (rows 3 and 5) All
valuations are in terms of the ryō a currency that was replaced by the yen at par in 1871 The autarky-
price prediction of the law of comparative advantage holds in all of the eight trading years Note that the
result holds in the year of a surplus on current account (1868) as well as during a deficit Although
estimates of GDP for the autarky period covered by this study are not available evidence on wages and
the price of rice helps place the estimates of the inner product in perspective For example the (lower-
bound) estimate of 180 thousand ryō based upon the vector of trade in 1868 would have been equivalent
to the annual earnings of about 5000 skilled workers in construction in Tokyo or 5600 workers in
agriculture near Osaka26
[Table 2]
Under the maintained hypothesis that the annual estimates are independent and stem from the
same distribution we can test the hypothesis H0 against the alternative hypothesis H2 that the inner
product is purely random For a probability statement the problem at hand suggests focusing on the p-
value defined as the smallest level of significance for which the given sample observations would lead
us to reject the randomness hypothesis With 8 negative entries in a sample size of 8 the p-value is about
0427
26 Skilled construction workers in the early 1850s earned about 30 ryō per year (Kinyu Kenkyukai 1937 pp 325-
326) Yasuba (1986) notes that workers in agriculture earned about 294 koku of rice annually in the mid-1850s
180000 ryō would buy 16500 koku (2200 metric tons) of rice
27 The p-value is exactly 1256 where 1256 is the probability of obtaining 8 heads in 8 tosses with a balanced coin
20
V Concluding remarks
The last decade has witnessed an increased interest in exploring the empirical content of
neoclassical trade theory In particular the Heckscher-Ohlin modelmdash the ldquobackbone of traditional trade
theoryrdquo (Leamer and Levinsohn (1995 p 1345))mdash has been the primary target of empirical research
The empirical trade literature typically aims at estimating the ldquoaccuracyrdquo of the predictions of the
Heckscher-Ohlin model rather than testing a specific hypothesis
To our knowledge of the literature this paper provides the first direct test of the theory of
comparative advantage in its most general formulation It is ldquodirectrdquo since the underlying hypothesis is
formulated in terms of a countryrsquos relative autarky prices The testable hypothesis derived from this
approach places no restriction on what accounts for comparative advantage whether factor endowments
technologies tastes or a combination of them However as a trade-off the hypothesis provides no
information about the commodity composition of trade which goods will be exported and which will be
imported
One central theme of this paper is that Japanrsquos 19th century trade liberalization provides a
ldquonatural historical experimentrdquo within which to test the autarky-price prediction of comparative
advantage trade theory The historical narrative demonstrates that the Japanese economy during the time
period of our investigation was compatible with the assumptions of the underlying theory
As has been noted elsewhere the domain of economic theory surely encompasses more than the
recent past and there are distinct advantages to exploiting the rich veins of historical experience to test
the validity of theory (McCloskey 1976) The case of Japan provides a natural experiment that occurs in
an environment that is transparent by any reasonable measure External pressure forced a low tariff
structure on Japan and precluded the use of other non-tariff barriers that are part and parcel of
contemporary trading regimes The detail of Japanrsquos trading statistics allowed a clear identification of the
commodities actually entering trade The robustness of our findings suggests that the autarky-price
21
formulation of comparative advantage is a coherent and insightful theory that can also be validated
empirically
22
References
Brennwald C Rapport Geacuteneacuterale sur la Partie Commerciale de la Mission Suisse au Japon Bern JA
Weingart 1865
Crawcour E Sydney ldquoEconomic Change in the Nineteenth Centuryrdquo In The Economic Emergence of
Modern Japan edited by Kozo Yamamura Cambridge Cambridge University Press 1997
Davis Donald R and David E Weinstein ldquoThe Factor Content of Traderdquo In Handbook of International
Trade edited by E Kwan Choi and James Harrigan Malden MA Blackwell Publishing 2003
Deardorff Alan V ldquoThe General Validity of the Law of Comparative Advantagerdquo Journal of Political
Economy 88 (October 1980) 941-57
Deardorff Alan V ldquoTesting Trade Theories and Predicting Trade Flowsrdquo In Handbook of International
Economics volume 1 edited by Ronald W Jones and Peter B Kenen Amsterdam North
Holland 1984
Deardorff Alan V ldquoExploring the Limits of Comparative Advantagerdquo Weltwirtschaftliches Archiv 130
(Spring 1994) 1-19
Dixit Avinash Kand Victor Norman Theory of International Trade Cambridge Cambridge University
Press 1980
Drabicki John Z and Akira Takayama ldquoAn Antinomy in the Theory of Comparative Advantagerdquo
Journal of International Economics 9 (May 1979) 211-23
Great Britain Consular Reports 1859-1860 British Parliamentary Papers 1861 (vol 63)
Hanley Susan and Kozo Yamamura Economic and Demographic Change in Preindustrial Japan 1600-
1868 Princeton NJ Princeton University Press 1977
23
Harrigan James ldquoSpecialization and the Volume of Trade Do the Data obey the Lawsrdquo In Handbook of
International Trade edited by E Kwan Choi and James Harrigan Malden Mass Blackwell
Publishing 2003
Hauser William B ldquoEconomic and Institutional Change in Tokugawa Japan The Osaka Cotton Traderdquo
PhD Dissertation University of California-Berkeley 1969
Hayek Friedrich ldquoThe Use of Knowledge in Societyrdquo American Economic Review 35 (September
1945) 519-530
Helpman Elhanan and Paul R Krugman Market Structure and Foreign Trade Cambridge Mass MIT
Press 1985
Hildreth Richard Japan As It Was and Is Boston Phillips Sampson and Company 1855
Howe Christopher The Origins of Japanese Trade Supremacy London Hurst and Company 1996
Huber J Richard ldquoThe Effect on Prices of Japanrsquos Entry into World Commerce after 1858rdquo Journal of
Political Economy 79 (June 1971) 614-628
Irwin Douglas A ldquoThe Welfare Cost of Autarky Evidence from the Jeffersonian Trade Embargo 1807-
1809rdquo Working Paper no 8692 Cambridge Mass NBER December 2001
Japan Bureau of Revenue Returns of the Foreign Trade of Japan for the twenty-five years 1868 to 1892
inclusive Tokyo Insetsu Kyoku 1893
Jansen Marius The Making of Modern Japan Cambridge Mass Harvard University Press 2000
James John History of the Worsted Manufacture in England London Longman Brown Green
Longmans and Roberts 1857
Kinyu Kenkyukai Wagakuni Shohin Soba Tokeihyo Tokyo Kinkyu Kenkyukai 1937
Latham A J H and Larry Neal ldquoThe International Market in Rice and Wheat 1868-1914rdquo Economic
History Review Second Series 36 (May 1983) 260-280
24
Leamer Edward E and James Levinsohn ldquoInternational Trade Theory The Evidencerdquo In Handbook of
International Economics volume 3 edited by Gene M Grossman and Kenneth Rogoff
Amsterdam North Holland 1995
Mathias-Pauer Regina and Erich Pauer eds Hansastaumldte und Japan 1855-1867 Ausgewaumlhlten
Dokumente Marburg Foumlrdervein Marburger Japan-Reihe 1992
McCloskey Donald ldquoDoes the Past Have Useful Economicsrdquo Journal of Economic
Literature 14 (June 1976) 434-461
Meylan Gustav Geschichte des Handels der Europaumler in Japan Leipzig Voigt and Guumlnther 1861
Miyamoto Mataji chief editor Kensei Osaka no bukka to rishi (Prices and Interest Rates in Osaka
during the Pre-Meiji Period) Osaka Daigaku Kinsei Bukkashi Kenkyukai Tokyo Sobunsha
1963
MiyamotoMataji Yōtarō Sakudō and Yasukichi Yasuba ldquoEconomic Development in Pre-Industrial
Japan 1859-1894rdquo Journal of Economic History 25 (December 1965) 541-564
MiyamotoMatao ldquoRelationships among Local Rice Markets in the Tokugawa Periodrdquo Osaka Economic
Papers 31 (December 1981) 274-307
Nakamura Satoru ldquoThe Development of Rural Industryrdquo In Chie Nakane and Shinzburō Ōishi eds
Tokugawa Japan The Social and Economic Antecedents of Modern Japan Tokyo University of
Tokyo Press 1990
Nakai Nobuhiko ed (Mitsui Bunko) Kinsei koki ni okeru shuyo bukka no dotai Tokyo University of
Tokyo Press 1989
Ohkura Takehiko and Hiroshi Shimbo ldquoThe Tokugawa Monetary Policy in the Eighteenth and
Nineteenth Centuriesrdquo Explorations in Economic History 15 (January 1978) 101-124
Ono Takeo Edo bukka jiten (Dictionary of the Price of Products in Tokyo) Tokyo Tenbosha 1979
25
Pauer Erich ldquoTraditional Technology and Its Impact on Japanrsquos Industry During the Early Period of the
Industrial Revolutionrdquo The Economic Studies Quarterly 38 (December 1987) 354-371
Piper Annelotte Japans Weg von der Feudalgesellschaft zum Industriestaat Cologne Verlag
Wissenschaft und Politik 1976
Scherzer Karl von Fachmaumlnnische Berichte uumlber die oumlsterreichisch-ungarische Expedition nach Siam
China und Japan Stuttgart Julius Maier 1872
Shimomura Koji and Kar-yiu Wong ldquoThe Law of Comparative Advantage without Social Utility
Functionsrdquo Review of International Economics 6 (August 1998) 401-406
Shinbo Hiroshi Kinsei no bukka to keizai hatten zen kōgoyō shakai e no sūryōteki sekkin Tokyo Toyo
Keizai Shinposha 1978
Sugiyama S Japanrsquos Industrialization in the World Economy 1859-1899 Export Trade and Overseas
Competition London Athlone Press 1988
Takekoshi Yosaburo The Economic Aspects of Japanese Civilization vol 3 London Allen and Unwin
Ltd 1930
Toyoda Takeshi A History of Pre-Meiji Commerce in Japan Tokyo Japan Cultural Society 1969
Tilley Edward Arthur Japan the Amoor and the Pacific with notices of other places comprised in a
voyage of circumnavigation in the Russian corvette Rynda in 1858-60 London Smith Elder
and Co 1861
Totman Conrad A History of Japan Malden MA Blackwell Publishers 2000
Williamson Jeffrey ldquoThe Impact of Globalization on Pre-Industrial Technologically Quiescent
Economies Real Wages Relative Factor Prices and Commodity Convergence in the Third
World Before 1940rdquo Working Paper no 7146 Cambridge Mass NBER May 1999
Yamamura Kozo and William Duffy ldquoMonetization and Integration of Markets in Tokugawa Japan A
Spectral Analysisrdquo Explorations in Economic History 8 (Summer 1971) 395-423
26
Yamazaki Ryuzo Kinsei bukkashi kenkyu Tokyo Hanawa Shobo 1983
Yasuba Yasukichi ldquoStandard of Living in Japan Before Industrialization From What Level Did Japan
Begin A Commentrdquo Journal of Economic History 46 (March 1986) 217-224
Yasuba Yasukichi ldquoThe Tokugawa Legacy A Surveyrdquo Economics Study Quarterly 38 (December
1987) 290-308
27
Table 1 The Composition of Japanese Trade 1868-1875
Product Percent of Imports Percent of Exports
Agricultural Non-Food
Silk 359
Silkworm Eggs 157
Other (Vegetable Wax and Cotton) 22 27
Agricultural Food
Tea 282
Rice 108
Sugar 99
Other Foods 42 82
Other Raw Materials
Fuel (Coal and Charcoal) 19
Other 31 29
Textiles 02
Cotton Yarn 151
Cotton Cloth 184
Woolens 192
Other textiles 18
Other manufactures 43
Weapons and ammunition 27
Machinery and instruments 14
Miscellaneous manufactures 112 Notes The trade shares of each commodity group are based upon total imports and exports for the period 1868-1875 Source Japan Bureau of Revenue (1893)
28
Table 2 The Approximate Inner Product in Various Test Years
(in million Ryō)
Year of Net Export Vector Components 1868 1869 1870 1871 1872 1873 1874 1875
(1) Imports with observed autarky prices
-224 -412 -844 -700 -575 -588 -715 -798
(2) Imports of woolen goods -098 -082 -129 -156 -216 -250 -156 -233
(3) Imports with approximated autarky prices (Shinbo index)
-110 -095 -070 -085 -151 -208 -160 -265
(4) Exports with observed autarky prices
407 340 404 516 499 408 508 480
(5) Exports with approximated autarky prices (Shinbo index)
009 003 007 007 015 007 011 010
Total inner product (sum of ((1)-(5))
-018 -247 -631 -417 -428 -631 -511 -806
Notes All values are expressed in terms of millions of ryō The ryō equaled about $1 in 1873 and was equivalent to the yen when it was introduced in 1871 The estimates are of the approximation of the inner product ( Tp a ~~
1 ) valued at autarky prices prevailing in 1851-1853 For an explanation of the assumptions underlying the approximation please see the text Source For sources of price data see footnotes 17 and 20 For numbers (3) and (5) current silver yen values are converted to values of 1851-1853 by deflating them with the price indices for exports and imports found in Shinbo (1978 Table 5-10)
29
Figure 1 The Law of Comparative Advantage with 2 Goods
x f
x ca a=
p a
c f
Autarky price vectorTrade vector T
Good 1
Good 2
30
Figure 2 Two Comparative Histories of an Economy
A (p1a x1
a c1a)
Japanrsquos putative path under autarky B (p2a x2
a c2a)
Japanrsquos actual path under free trade C (p2f x2
f c2f)
31
Figure 3 The Development of Japanrsquos External Trade 1860-1885
1860 1865 1870 1875 1880 18850
10
20
30
40
50
Exports
Imports
Source Sugiyama (1988 Table 3-4)
32
Figure 4 Net Exports and Price Changes for 1869
Source Japan Bureau of Revenue (1893) for trade data and Nakai (1989) Miyamoto(1963) Ono (1979) Kinyu Kenkyukai (1937) and Yamazaki (1983) for price data
Net Exports in 1869-125 -1 -75 -5 -25 0 25 5 75 1 125
-80
-60
-40
-20
0
20
40
60
80
100
Rice
Cotton Yarn
Brown Sugar
Legumes
Cotton Cloth
White Sugar
Cotton
Iron(Mfc)Candy
Pig Iron
Sake
Fish
Copper(Mfc)
CharcoalTea
Silk
Silkworm Eggs
Wax
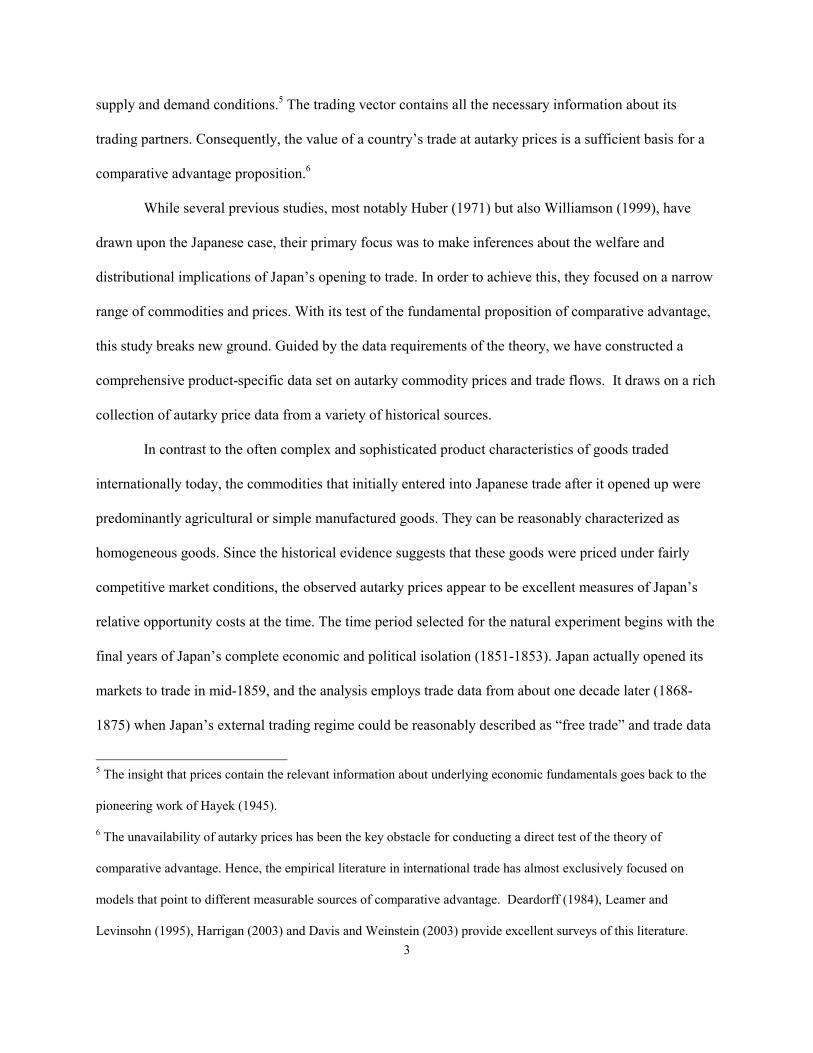
10
(3) Exports received no subsidies
The final assumption ensures that the identification condition εTle0 holds so that prices from the autarky
period can be applied to the available data on trade
(4) Changes in production possibilities under a closed economy from the opening up to trade
(1859) to the period when the net export vector is analyzed (1868 through 1875) would not
have been biased towards importables
Assumption (1) addresses competitive conditions in the economy under autarky and free trade
Economic historians have achieved a good understanding of the functioning of the Japanrsquos economy
during the more than 250 years of Tokugawa rule that ended with the restoration of the emperor in
186815 Initially Japan had been organized as a feudal society For the most part manufacturing took
place in small workshops of thirty workers or fewer (Takekoshi 1930 p 270 and Piper 1976 pp 29-
30) Agriculture was carried out on small farms However the feudal system initially included guild
monopolies controlling the trade in many commodities and restrictions on the use of land and labor Over
the century ending in the early 1840s the restrictions on trade were dismantled By then competitive
conditions characterized virtually all output markets The allocation of land and labor responded to
movements in relative output prices16 Spectral analysis of the prices of bills of exchange provides
quantitative support for the conclusions of historians By the period 1822-1843 regional integration and
monetization had disrupted traditional feudal regulation of the economy (Yamamura and Duffy 1971 p
15 From 1603 through 1868 feudal lords of the Tokugawa family ruled Japan as a quasi-military dictatorship from
Edo (Tokyo) Already in decline when international trade opened up in mid-1859 the system survived for only
another nine years A rebellion of other feudal lords brought about the restoration of the central role of the emperor
in 1868
16 See Yasuba (1987) Howe (1996) and Crawcour (1997 pp 8-24) for more detailed English-language discussions
of the Tokugawa economy See Nakamura (1990 pp 90-92) for a discussion of output markets Hanley and
Yamamura (1977 p 86) for labor markets and Totman (2000 p 250) for land markets
11
422) Correlation analysis of the detailed regional data available for rice markets suggest that a unified
market existed even for this bulk commodity in western Japan by the beginning of the 18th century
(Miyamoto 1981) Nakamura (1990 p 94) argues that cotton cloth a high-value commodity was traded
in a national market with regional specialization of production by the early 19th century To ensure that
autarky prices most closely reflect competitive conditions we chose 1851-1853 as the autarky period for
our analysis
[Table 1]
Assumption (2) raises the question of whether Japanese producers were price-takers in
international markets Table 1 provides a summary of the composition of Japanese trade for 1868 through
1875 the period when comprehensive trade data are first available Consider first the markets for
imports One-third were agricultural commodities such as beans sugar vegetable oil and rice Latham
and Neal (1983) document the size of international markets for agricultural commodities such as rice and
wheat in the last third of the nineteenth century the volume traded dwarfed any demand from Japan
Another one-half of imports were cotton and woolen textiles Japanese imports were primarily from
England where the Japanese demand was again a fraction of exports to India and China The remaining
imports of miscellaneous manufactured goods would all have been a fraction of international demand
during the early period of open trade Exports were virtually all of agricultural origin and were produced
by small farms under highly competitive conditions Sugiyama (1988 chs 4 and 5) provides a detailed
account of silk silkworm egg and tea production which accounted for about 80 percent of Japanese
exports Indian and Chinese silks competed with Japanese silks in the three main import markets Britain
France and the United States Japanese silks took up 15 to 20 percent of imports into these markets
during the first two decades after opening up Western governments effectively countered early efforts of
the Japanese authorities to manipulate the supply of silk available for export The United States rapidly
12
became the main market for Japanese green tea It faced competition from Chinese green tea black tea
cocoa and coffee Competitive relationships also prevailed in the merchant community that handled the
import and export trade It included 25 western merchant houses and a growing Chinese merchant
community that offered the Europeans stiff competition (von Scherzer 1872 pp 369-372)
For those familiar with Japan today assumption (3)mdashexports were not subsidizedmdashmay appear
the most untenable In actuality during the twenty or so years after the opening up government efforts to
develop export industries remained modest Treaties held tariffs to a minimum and straitened finances
precluded subsidies The government actually levied modest export taxes of three to four percent ad
valorem on tea and silk17
The final assumption (4) asserts that had it remained closed Japanese growth would not have
been biased towards importables during the nine years from opening up to 1868 when the free trade
regime was fully in place and comprehensive trade data are available Given the impetus of economic
growth up to 1859 a shift away from exportables towards the goods that accounted for three quarters of
imports (rice sugar woolens and cotton cloth and yarn) in the subsequent nine years would have been
unlikely Contemporary commentators offer one assessment of the momentum of growth just prior to
opening up They correctly identified the goods that actually became the leading exports of the 1860s
including tea camphor and copper Only raw silk was excluded because of doubts that production could
be expanded substantially beyond what the Japanese consumed under autarky (Hildreth 1855 p560)
Accounts of the last century of the Tokugawa economy likewise stress the ongoing shift of land and labor
out of rice into tea and raw silk (Howe 1996 pp 40-41) The lack of land with a suitable climate
constrained increased production of another key import sugar and the absence of any sheep in Japan
prior to opening up ruled out the domestic production of woolens The low productivity of the hand
technologies available to the spinning sector constrained any substantial expansion of cotton textile
17 The estimated rates are for the early 1870s see Sugiyama (1988 p 35)
13
production The weaving sector had already achieved the productivity gains possible with the adoption of
the vertical loom and the emergence of specialized weaving and spinning enterprises by the 1840s
(Nakamura 1990)
It is also possible but not likely that the Japanese could have used the available information on
western technology to shift production towards the machine-made products of the west such as cotton
yarn and cloth Even before the 1850s western technologies were being implemented in Japan but only
with great difficulty Information on Dutch agricultural techniques was available to the small numbers of
those who spoke Dutch but there is no evidence of commercial adoption of western technologies in
manufacturing Based upon his reading of the attempts of some feudal lords to manufacture cannon and
build ships according to western plans in the 1850s Pauer (1987) argues that the limited technological
expertise and the skill set available to the Japanese during the Tokugawa period precluded rapid adoption
of western technologies It is notable that it took fifteen years after 1859 before Japanese weavers of
cotton cloth began to use the flying shuttle a technology offering ready productivity gains that had been
in use in England since the 18th century The importation and then adaptation of western technologies to
Japanese conditions that characterized early industrialization only got underway after 1880
IV Empirical implementation
Hypotheses
The methodology of our historical-empirical exercise is based on a simple decision-theoretic
framework As discussed in section II the theory implies a concrete hypothesis about the sign of Japanrsquos
net export vector valued at autarky prices
H0 p1a Tlt0 (4)
14
To evaluate the empirical validity of this claim we need to specify an appropriate counterclaim
Ruling out that the sign of p1a T is random we obtain the following counterclaim
H1 p1aTge0 (5)
Although hypothesis H1 is not the prediction of any alternative theory of international trade the data
could ldquochooserdquo H1 instead of H0 Given that the Japanese economy fulfills the textbook assumptions of a
small neoclassical economy evidence in favor of H1 would require some reconsideration of the theory
If we were in the possession of ldquoperfect datardquo on Japanrsquos trade and autarky price vectors we
would be rather confident in making a correct decision with regard to whether Japanrsquos pattern of trade
after its opening up followed the law of comparative advantage (ie H0 is true) or not However
measurement errors that arise from both the ldquotiming of the experimentrdquo and the incompleteness of
autarky price data could increase the likelihood of making a wrong decision Our decision is based on an
approximation Tp a ~~1 of the true (unknown) inner product p1
aT The ldquoautarkyrdquo and ldquofree traderdquo regimes
of the model correspond to about two decades of historical time The goal of keeping the measurement
errors as small as possible guided the selection of the two periods used for collecting the price and trade
data to construct Tp a ~~1 In addition we used approximations for the missing autarky price data that
would ex ante make the inner product more likely to be positive and consequently weigh the decision
in favor of Hypothesis H1 The aim of this strategy was to reduce the ldquolikelihoodrdquo of erroneously
accepting Hypothesis H0
Although the specification of the alternative hypothesis given in (5) serves as a guide for
approximating missing data points in calculating the inner product it does not lend itself to any
probability statements An alternative counterclaim to the prediction that p1a T is negative is that the sign
of the inner product is a random event It seems reasonable to assume that in the case of randomness the
15
occurrence of a negative sign is as likely as the occurrence of a positive sign This leads us to the second
alternative hypothesis
H2 p1a T is random with Pr(p1
aTlt0)=21
(6)
where Pr() denotes the probability measure Since the alternative hypothesis (6) claims that the sign of
the inner product is determined by the toss of a (balanced) coin the null hypothesis in (4) should now be
interpreted as saying that the inner product is negative with probability 1 Assuming that the annual
estimates are independent and drawn from the same distribution we can calculate the smallest level of
significance for which the given data points would lead us to reject the randomness hypothesis given in
(6)
Data description
For the analysis of autarky prices data from the period 1851-1853 appear to offer the best
representation of the ldquoautarky regimerdquo just prior to opening up Already by the 1840s economic activity
was organized in fairly competitive markets as the economy had time to respond to the easing of the
feudal restrictions that started decades earlier The early 1850s precedes the first treaty between Japan
and the west in 185418 For the ldquofree trade regimerdquo we selected the period of 1868-1875 With this
choice we aimed to strike a balance between the reliability of the trade data which increases with time
after the opening up of Japan and effectively capturing the mix of Japanese imports and exports that best
reflects the production possibilities existing just prior to the end of autarky
18 The first treaty simply secured the Americans access to two ports that would be available as coaling stations and as
safe havens for shipwrecked sailors Debate over whether or not to open trade continued through the treaty of 1858
that opened the country up (Jansen 2000 pp 174-185)
16
For the construction of the autarky price vector we identified three groups of commodities The
first group of commodities includes exportables and importables for which we could identify reasonably
close domestic substitutes and for which we could obtain autarky price information For these
commodities we relied upon the continuous price data that are available from 1851 through the early
1870s from a variety of Japanese-language sources19 These sources draw upon merchant account books
the records of large trading houses such as Mitsui and the records of producers The available price
series cover about 65 commodities In cases where the prices of downstream importables were not
available we used the price of the upstream raw material or intermediate good20 For products with
quality differences such as silk and tea the decision-rule dictates that the estimates err on the side of
using price data for the higher-quality variety21 Contemporary European-language publications and more
recent research provide information on the prices of some additional goods just at or before the opening
of trade22 Overall commodities for which autarky price information is available make up two-thirds of
imports by value in 1868-1875 and about 95 percent of the value of exports
19 The sources include Nakai (1989) Miyamoto(1963) Ono (1979) Kinyu Kenkyukai (1937) and
Yamazaki(1983)
20 We substituted a simple unfinished cloth (siraki) for which a complete description was available for all other
finished cotton cloths This cloth had about the same weight and quality as the chief unfinished cloth import
shirtings Unfinished cloths of a higher quality sold for from 20 percent (bleached) up to 300 percent (velvets) more
Applying the relative prices found in Scherzer(1872 p 394) and Brennwald(1865 pp 27-32) to imports in 1868-
1875 suggests that our approach undervalued the average autarky price of cotton cloth imports by at least 20 percent
21 This approach was most important for the choice of a price for teamdash where the prices available varied on the order
of ten timesmdashand the price of raw silk We used the highest price of ldquofirst qualityrdquo tea and the price for the high
quality fine Maebashi silk (Sugiyama 1988 p 90)
22 About 17 commodities fall in this group They include minor exports such as seaweed gall puffs awabi shells
vermicelli and camphor The sources are Great Britain (1861) for the ports of Nagasaki and Kanagawa in 1859
17
A second group of commodities includes goods (primarily woolens) that were not produced in
Japan under autarky Pricing of woolens must take account of the surge in the relative price of woolens
that began in 1860 with the American Civil War and the drop off in American exports of cotton
James(1857) provides information on the price of Orleans cloth (which was relatively inexpensive) and
middle-quality camlets in 1854 These prices are lower than the prices quoted for similar goods in the
consular reports for Shanghai for 1858 (Great Britain 1861 p 517) Von Scherzer(1872 pp 396-397)
provides information on the relative market price of other woolen imports these price data suggest that
using the camlet prices for middle- and the higher-quality cloths and using the price of Orleans for the
lower quality cloths that appear in the statistics will provide reasonable minimum estimates of the value
of these imports23
Finally the calculation of the inner product required estimating the prices of a third group the
one-twentieth of exports and one-sixth of imports for which there were domestic substitutes but for
which price information could not be found in Japanese or contemporary European sources
Approximating the prices of this group of imports ca 1851-1853 relied upon adjusting the actual unit
values available from the trade data in 1868-1875 for changes in the prices of imports and exports from
the early 1850s Sugiyama(1988) notes that contrary to the practice of many European countries at the
time the valuations of imports and exports reflected actual invoiced values Exports were valued at the
price at the point of export while imports were valued at the price prior to shipment to Japan The
adjustment uses the indices of import and export prices found in Shinbo (1978 Table 5-10)
(June and December) and in 1860 (January) von Scherzer (1872 p 262) for silk worm eggs and Huber(1976) for
the price of cotton yarn
23 The most important import that will be undervalued using this procedure is ldquowoolen clothsrdquo which had a unit
value in the late 1860s that was four times the unit value of camlets
18
The trade data are from the import-export statistics collected by the Meiji customs at the treaty
ports for 1868 through 1875 (Japan Bureau of Revenue 1893) The statistics include over 250 separate
goods Alternative series are available from the reports of the British consuls in the ports but these data
lack consistent recording of quantities and the detail found in the official statistics A check of the British
data from 1869 with the official statistics found only minor discrepancies that would have no material
bearing on the estimates presented here 24
Empirical findings
Figure 4 illustrates the price changes of the key tradable goods after opening up It presents a
scatter diagram of the net exports in 1869 graphed in relation to the change in prices from 1851-1853 to
186925 High inflation after opening up meant that all prices rose substantially so that the graph
expresses price changes adjusted for the increase in the price of nontradeable goods The prices of major
exports such as products of the silk industry (silk and silkworm eggs) and minor exports such as copper
manufactures sake and vegetable wax all increased in some cases they almost doubled The relative
price of key imports such as sugar cotton cloth cotton yarn and iron products displayed substantial
declines The increase in the price of rice and legumes may reflect poor weather conditions and the
increase in the price of cotton may stem from the disruption of cotton markets in the wake of the
American Civil War
[figure 4]
24 See Sugiyama (1988 pp 44-48) for a general discussion of Japanese trade statistics during the first decades after
opening up The British recorded quantities of cotton and woolen cloth in ldquopiecesrdquo instead of yards a practice that
substantially increases the potential error in matching net export data from the consular sources with autarky prices
25 After 1859 Japan experienced substantial price inflation For that reason we have normalized all price changes
using the price index of nontradeables from Shinbo(1978 Table 5-10) Net exports are valued at autarky prices
19
Table 2 contains the empirical results that incorporate all of the price and net export data Each
column evaluates the trading vector of a particular year iT~ (i=1868hellip1875) at the same autarky price
vector ap1~ The rows report the constituent components of i
aTp ~~1 the value of net imports or net exports
for which autarky prices are available (rows 1 and 4) the value of imports of woolens (row 2) and the
value of net imports and net exports for which autarky price data are not available (rows 3 and 5) All
valuations are in terms of the ryō a currency that was replaced by the yen at par in 1871 The autarky-
price prediction of the law of comparative advantage holds in all of the eight trading years Note that the
result holds in the year of a surplus on current account (1868) as well as during a deficit Although
estimates of GDP for the autarky period covered by this study are not available evidence on wages and
the price of rice helps place the estimates of the inner product in perspective For example the (lower-
bound) estimate of 180 thousand ryō based upon the vector of trade in 1868 would have been equivalent
to the annual earnings of about 5000 skilled workers in construction in Tokyo or 5600 workers in
agriculture near Osaka26
[Table 2]
Under the maintained hypothesis that the annual estimates are independent and stem from the
same distribution we can test the hypothesis H0 against the alternative hypothesis H2 that the inner
product is purely random For a probability statement the problem at hand suggests focusing on the p-
value defined as the smallest level of significance for which the given sample observations would lead
us to reject the randomness hypothesis With 8 negative entries in a sample size of 8 the p-value is about
0427
26 Skilled construction workers in the early 1850s earned about 30 ryō per year (Kinyu Kenkyukai 1937 pp 325-
326) Yasuba (1986) notes that workers in agriculture earned about 294 koku of rice annually in the mid-1850s
180000 ryō would buy 16500 koku (2200 metric tons) of rice
27 The p-value is exactly 1256 where 1256 is the probability of obtaining 8 heads in 8 tosses with a balanced coin
20
V Concluding remarks
The last decade has witnessed an increased interest in exploring the empirical content of
neoclassical trade theory In particular the Heckscher-Ohlin modelmdash the ldquobackbone of traditional trade
theoryrdquo (Leamer and Levinsohn (1995 p 1345))mdash has been the primary target of empirical research
The empirical trade literature typically aims at estimating the ldquoaccuracyrdquo of the predictions of the
Heckscher-Ohlin model rather than testing a specific hypothesis
To our knowledge of the literature this paper provides the first direct test of the theory of
comparative advantage in its most general formulation It is ldquodirectrdquo since the underlying hypothesis is
formulated in terms of a countryrsquos relative autarky prices The testable hypothesis derived from this
approach places no restriction on what accounts for comparative advantage whether factor endowments
technologies tastes or a combination of them However as a trade-off the hypothesis provides no
information about the commodity composition of trade which goods will be exported and which will be
imported
One central theme of this paper is that Japanrsquos 19th century trade liberalization provides a
ldquonatural historical experimentrdquo within which to test the autarky-price prediction of comparative
advantage trade theory The historical narrative demonstrates that the Japanese economy during the time
period of our investigation was compatible with the assumptions of the underlying theory
As has been noted elsewhere the domain of economic theory surely encompasses more than the
recent past and there are distinct advantages to exploiting the rich veins of historical experience to test
the validity of theory (McCloskey 1976) The case of Japan provides a natural experiment that occurs in
an environment that is transparent by any reasonable measure External pressure forced a low tariff
structure on Japan and precluded the use of other non-tariff barriers that are part and parcel of
contemporary trading regimes The detail of Japanrsquos trading statistics allowed a clear identification of the
commodities actually entering trade The robustness of our findings suggests that the autarky-price
21
formulation of comparative advantage is a coherent and insightful theory that can also be validated
empirically
22
References
Brennwald C Rapport Geacuteneacuterale sur la Partie Commerciale de la Mission Suisse au Japon Bern JA
Weingart 1865
Crawcour E Sydney ldquoEconomic Change in the Nineteenth Centuryrdquo In The Economic Emergence of
Modern Japan edited by Kozo Yamamura Cambridge Cambridge University Press 1997
Davis Donald R and David E Weinstein ldquoThe Factor Content of Traderdquo In Handbook of International
Trade edited by E Kwan Choi and James Harrigan Malden MA Blackwell Publishing 2003
Deardorff Alan V ldquoThe General Validity of the Law of Comparative Advantagerdquo Journal of Political
Economy 88 (October 1980) 941-57
Deardorff Alan V ldquoTesting Trade Theories and Predicting Trade Flowsrdquo In Handbook of International
Economics volume 1 edited by Ronald W Jones and Peter B Kenen Amsterdam North
Holland 1984
Deardorff Alan V ldquoExploring the Limits of Comparative Advantagerdquo Weltwirtschaftliches Archiv 130
(Spring 1994) 1-19
Dixit Avinash Kand Victor Norman Theory of International Trade Cambridge Cambridge University
Press 1980
Drabicki John Z and Akira Takayama ldquoAn Antinomy in the Theory of Comparative Advantagerdquo
Journal of International Economics 9 (May 1979) 211-23
Great Britain Consular Reports 1859-1860 British Parliamentary Papers 1861 (vol 63)
Hanley Susan and Kozo Yamamura Economic and Demographic Change in Preindustrial Japan 1600-
1868 Princeton NJ Princeton University Press 1977
23
Harrigan James ldquoSpecialization and the Volume of Trade Do the Data obey the Lawsrdquo In Handbook of
International Trade edited by E Kwan Choi and James Harrigan Malden Mass Blackwell
Publishing 2003
Hauser William B ldquoEconomic and Institutional Change in Tokugawa Japan The Osaka Cotton Traderdquo
PhD Dissertation University of California-Berkeley 1969
Hayek Friedrich ldquoThe Use of Knowledge in Societyrdquo American Economic Review 35 (September
1945) 519-530
Helpman Elhanan and Paul R Krugman Market Structure and Foreign Trade Cambridge Mass MIT
Press 1985
Hildreth Richard Japan As It Was and Is Boston Phillips Sampson and Company 1855
Howe Christopher The Origins of Japanese Trade Supremacy London Hurst and Company 1996
Huber J Richard ldquoThe Effect on Prices of Japanrsquos Entry into World Commerce after 1858rdquo Journal of
Political Economy 79 (June 1971) 614-628
Irwin Douglas A ldquoThe Welfare Cost of Autarky Evidence from the Jeffersonian Trade Embargo 1807-
1809rdquo Working Paper no 8692 Cambridge Mass NBER December 2001
Japan Bureau of Revenue Returns of the Foreign Trade of Japan for the twenty-five years 1868 to 1892
inclusive Tokyo Insetsu Kyoku 1893
Jansen Marius The Making of Modern Japan Cambridge Mass Harvard University Press 2000
James John History of the Worsted Manufacture in England London Longman Brown Green
Longmans and Roberts 1857
Kinyu Kenkyukai Wagakuni Shohin Soba Tokeihyo Tokyo Kinkyu Kenkyukai 1937
Latham A J H and Larry Neal ldquoThe International Market in Rice and Wheat 1868-1914rdquo Economic
History Review Second Series 36 (May 1983) 260-280
24
Leamer Edward E and James Levinsohn ldquoInternational Trade Theory The Evidencerdquo In Handbook of
International Economics volume 3 edited by Gene M Grossman and Kenneth Rogoff
Amsterdam North Holland 1995
Mathias-Pauer Regina and Erich Pauer eds Hansastaumldte und Japan 1855-1867 Ausgewaumlhlten
Dokumente Marburg Foumlrdervein Marburger Japan-Reihe 1992
McCloskey Donald ldquoDoes the Past Have Useful Economicsrdquo Journal of Economic
Literature 14 (June 1976) 434-461
Meylan Gustav Geschichte des Handels der Europaumler in Japan Leipzig Voigt and Guumlnther 1861
Miyamoto Mataji chief editor Kensei Osaka no bukka to rishi (Prices and Interest Rates in Osaka
during the Pre-Meiji Period) Osaka Daigaku Kinsei Bukkashi Kenkyukai Tokyo Sobunsha
1963
MiyamotoMataji Yōtarō Sakudō and Yasukichi Yasuba ldquoEconomic Development in Pre-Industrial
Japan 1859-1894rdquo Journal of Economic History 25 (December 1965) 541-564
MiyamotoMatao ldquoRelationships among Local Rice Markets in the Tokugawa Periodrdquo Osaka Economic
Papers 31 (December 1981) 274-307
Nakamura Satoru ldquoThe Development of Rural Industryrdquo In Chie Nakane and Shinzburō Ōishi eds
Tokugawa Japan The Social and Economic Antecedents of Modern Japan Tokyo University of
Tokyo Press 1990
Nakai Nobuhiko ed (Mitsui Bunko) Kinsei koki ni okeru shuyo bukka no dotai Tokyo University of
Tokyo Press 1989
Ohkura Takehiko and Hiroshi Shimbo ldquoThe Tokugawa Monetary Policy in the Eighteenth and
Nineteenth Centuriesrdquo Explorations in Economic History 15 (January 1978) 101-124
Ono Takeo Edo bukka jiten (Dictionary of the Price of Products in Tokyo) Tokyo Tenbosha 1979
25
Pauer Erich ldquoTraditional Technology and Its Impact on Japanrsquos Industry During the Early Period of the
Industrial Revolutionrdquo The Economic Studies Quarterly 38 (December 1987) 354-371
Piper Annelotte Japans Weg von der Feudalgesellschaft zum Industriestaat Cologne Verlag
Wissenschaft und Politik 1976
Scherzer Karl von Fachmaumlnnische Berichte uumlber die oumlsterreichisch-ungarische Expedition nach Siam
China und Japan Stuttgart Julius Maier 1872
Shimomura Koji and Kar-yiu Wong ldquoThe Law of Comparative Advantage without Social Utility
Functionsrdquo Review of International Economics 6 (August 1998) 401-406
Shinbo Hiroshi Kinsei no bukka to keizai hatten zen kōgoyō shakai e no sūryōteki sekkin Tokyo Toyo
Keizai Shinposha 1978
Sugiyama S Japanrsquos Industrialization in the World Economy 1859-1899 Export Trade and Overseas
Competition London Athlone Press 1988
Takekoshi Yosaburo The Economic Aspects of Japanese Civilization vol 3 London Allen and Unwin
Ltd 1930
Toyoda Takeshi A History of Pre-Meiji Commerce in Japan Tokyo Japan Cultural Society 1969
Tilley Edward Arthur Japan the Amoor and the Pacific with notices of other places comprised in a
voyage of circumnavigation in the Russian corvette Rynda in 1858-60 London Smith Elder
and Co 1861
Totman Conrad A History of Japan Malden MA Blackwell Publishers 2000
Williamson Jeffrey ldquoThe Impact of Globalization on Pre-Industrial Technologically Quiescent
Economies Real Wages Relative Factor Prices and Commodity Convergence in the Third
World Before 1940rdquo Working Paper no 7146 Cambridge Mass NBER May 1999
Yamamura Kozo and William Duffy ldquoMonetization and Integration of Markets in Tokugawa Japan A
Spectral Analysisrdquo Explorations in Economic History 8 (Summer 1971) 395-423
26
Yamazaki Ryuzo Kinsei bukkashi kenkyu Tokyo Hanawa Shobo 1983
Yasuba Yasukichi ldquoStandard of Living in Japan Before Industrialization From What Level Did Japan
Begin A Commentrdquo Journal of Economic History 46 (March 1986) 217-224
Yasuba Yasukichi ldquoThe Tokugawa Legacy A Surveyrdquo Economics Study Quarterly 38 (December
1987) 290-308
27
Table 1 The Composition of Japanese Trade 1868-1875
Product Percent of Imports Percent of Exports
Agricultural Non-Food
Silk 359
Silkworm Eggs 157
Other (Vegetable Wax and Cotton) 22 27
Agricultural Food
Tea 282
Rice 108
Sugar 99
Other Foods 42 82
Other Raw Materials
Fuel (Coal and Charcoal) 19
Other 31 29
Textiles 02
Cotton Yarn 151
Cotton Cloth 184
Woolens 192
Other textiles 18
Other manufactures 43
Weapons and ammunition 27
Machinery and instruments 14
Miscellaneous manufactures 112 Notes The trade shares of each commodity group are based upon total imports and exports for the period 1868-1875 Source Japan Bureau of Revenue (1893)
28
Table 2 The Approximate Inner Product in Various Test Years
(in million Ryō)
Year of Net Export Vector Components 1868 1869 1870 1871 1872 1873 1874 1875
(1) Imports with observed autarky prices
-224 -412 -844 -700 -575 -588 -715 -798
(2) Imports of woolen goods -098 -082 -129 -156 -216 -250 -156 -233
(3) Imports with approximated autarky prices (Shinbo index)
-110 -095 -070 -085 -151 -208 -160 -265
(4) Exports with observed autarky prices
407 340 404 516 499 408 508 480
(5) Exports with approximated autarky prices (Shinbo index)
009 003 007 007 015 007 011 010
Total inner product (sum of ((1)-(5))
-018 -247 -631 -417 -428 -631 -511 -806
Notes All values are expressed in terms of millions of ryō The ryō equaled about $1 in 1873 and was equivalent to the yen when it was introduced in 1871 The estimates are of the approximation of the inner product ( Tp a ~~
1 ) valued at autarky prices prevailing in 1851-1853 For an explanation of the assumptions underlying the approximation please see the text Source For sources of price data see footnotes 17 and 20 For numbers (3) and (5) current silver yen values are converted to values of 1851-1853 by deflating them with the price indices for exports and imports found in Shinbo (1978 Table 5-10)
29
Figure 1 The Law of Comparative Advantage with 2 Goods
x f
x ca a=
p a
c f
Autarky price vectorTrade vector T
Good 1
Good 2
30
Figure 2 Two Comparative Histories of an Economy
A (p1a x1
a c1a)
Japanrsquos putative path under autarky B (p2a x2
a c2a)
Japanrsquos actual path under free trade C (p2f x2
f c2f)
31
Figure 3 The Development of Japanrsquos External Trade 1860-1885
1860 1865 1870 1875 1880 18850
10
20
30
40
50
Exports
Imports
Source Sugiyama (1988 Table 3-4)
32
Figure 4 Net Exports and Price Changes for 1869
Source Japan Bureau of Revenue (1893) for trade data and Nakai (1989) Miyamoto(1963) Ono (1979) Kinyu Kenkyukai (1937) and Yamazaki (1983) for price data
Net Exports in 1869-125 -1 -75 -5 -25 0 25 5 75 1 125
-80
-60
-40
-20
0
20
40
60
80
100
Rice
Cotton Yarn
Brown Sugar
Legumes
Cotton Cloth
White Sugar
Cotton
Iron(Mfc)Candy
Pig Iron
Sake
Fish
Copper(Mfc)
CharcoalTea
Silk
Silkworm Eggs
Wax
20
V Concluding remarks
The last decade has witnessed an increased interest in exploring the empirical content of
neoclassical trade theory In particular the Heckscher-Ohlin modelmdash the ldquobackbone of traditional trade
theoryrdquo (Leamer and Levinsohn (1995 p 1345))mdash has been the primary target of empirical research
The empirical trade literature typically aims at estimating the ldquoaccuracyrdquo of the predictions of the
Heckscher-Ohlin model rather than testing a specific hypothesis
To our knowledge of the literature this paper provides the first direct test of the theory of
comparative advantage in its most general formulation It is ldquodirectrdquo since the underlying hypothesis is
formulated in terms of a countryrsquos relative autarky prices The testable hypothesis derived from this
approach places no restriction on what accounts for comparative advantage whether factor endowments
technologies tastes or a combination of them However as a trade-off the hypothesis provides no
information about the commodity composition of trade which goods will be exported and which will be
imported
One central theme of this paper is that Japanrsquos 19th century trade liberalization provides a
ldquonatural historical experimentrdquo within which to test the autarky-price prediction of comparative
advantage trade theory The historical narrative demonstrates that the Japanese economy during the time
period of our investigation was compatible with the assumptions of the underlying theory
As has been noted elsewhere the domain of economic theory surely encompasses more than the
recent past and there are distinct advantages to exploiting the rich veins of historical experience to test
the validity of theory (McCloskey 1976) The case of Japan provides a natural experiment that occurs in
an environment that is transparent by any reasonable measure External pressure forced a low tariff
structure on Japan and precluded the use of other non-tariff barriers that are part and parcel of
contemporary trading regimes The detail of Japanrsquos trading statistics allowed a clear identification of the
commodities actually entering trade The robustness of our findings suggests that the autarky-price
21
formulation of comparative advantage is a coherent and insightful theory that can also be validated
empirically
22
References
Brennwald C Rapport Geacuteneacuterale sur la Partie Commerciale de la Mission Suisse au Japon Bern JA
Weingart 1865
Crawcour E Sydney ldquoEconomic Change in the Nineteenth Centuryrdquo In The Economic Emergence of
Modern Japan edited by Kozo Yamamura Cambridge Cambridge University Press 1997
Davis Donald R and David E Weinstein ldquoThe Factor Content of Traderdquo In Handbook of International
Trade edited by E Kwan Choi and James Harrigan Malden MA Blackwell Publishing 2003
Deardorff Alan V ldquoThe General Validity of the Law of Comparative Advantagerdquo Journal of Political
Economy 88 (October 1980) 941-57
Deardorff Alan V ldquoTesting Trade Theories and Predicting Trade Flowsrdquo In Handbook of International
Economics volume 1 edited by Ronald W Jones and Peter B Kenen Amsterdam North
Holland 1984
Deardorff Alan V ldquoExploring the Limits of Comparative Advantagerdquo Weltwirtschaftliches Archiv 130
(Spring 1994) 1-19
Dixit Avinash Kand Victor Norman Theory of International Trade Cambridge Cambridge University
Press 1980
Drabicki John Z and Akira Takayama ldquoAn Antinomy in the Theory of Comparative Advantagerdquo
Journal of International Economics 9 (May 1979) 211-23
Great Britain Consular Reports 1859-1860 British Parliamentary Papers 1861 (vol 63)
Hanley Susan and Kozo Yamamura Economic and Demographic Change in Preindustrial Japan 1600-
1868 Princeton NJ Princeton University Press 1977
23
Harrigan James ldquoSpecialization and the Volume of Trade Do the Data obey the Lawsrdquo In Handbook of
International Trade edited by E Kwan Choi and James Harrigan Malden Mass Blackwell
Publishing 2003
Hauser William B ldquoEconomic and Institutional Change in Tokugawa Japan The Osaka Cotton Traderdquo
PhD Dissertation University of California-Berkeley 1969
Hayek Friedrich ldquoThe Use of Knowledge in Societyrdquo American Economic Review 35 (September
1945) 519-530
Helpman Elhanan and Paul R Krugman Market Structure and Foreign Trade Cambridge Mass MIT
Press 1985
Hildreth Richard Japan As It Was and Is Boston Phillips Sampson and Company 1855
Howe Christopher The Origins of Japanese Trade Supremacy London Hurst and Company 1996
Huber J Richard ldquoThe Effect on Prices of Japanrsquos Entry into World Commerce after 1858rdquo Journal of
Political Economy 79 (June 1971) 614-628
Irwin Douglas A ldquoThe Welfare Cost of Autarky Evidence from the Jeffersonian Trade Embargo 1807-
1809rdquo Working Paper no 8692 Cambridge Mass NBER December 2001
Japan Bureau of Revenue Returns of the Foreign Trade of Japan for the twenty-five years 1868 to 1892
inclusive Tokyo Insetsu Kyoku 1893
Jansen Marius The Making of Modern Japan Cambridge Mass Harvard University Press 2000
James John History of the Worsted Manufacture in England London Longman Brown Green
Longmans and Roberts 1857
Kinyu Kenkyukai Wagakuni Shohin Soba Tokeihyo Tokyo Kinkyu Kenkyukai 1937
Latham A J H and Larry Neal ldquoThe International Market in Rice and Wheat 1868-1914rdquo Economic
History Review Second Series 36 (May 1983) 260-280
24
Leamer Edward E and James Levinsohn ldquoInternational Trade Theory The Evidencerdquo In Handbook of
International Economics volume 3 edited by Gene M Grossman and Kenneth Rogoff
Amsterdam North Holland 1995
Mathias-Pauer Regina and Erich Pauer eds Hansastaumldte und Japan 1855-1867 Ausgewaumlhlten
Dokumente Marburg Foumlrdervein Marburger Japan-Reihe 1992
McCloskey Donald ldquoDoes the Past Have Useful Economicsrdquo Journal of Economic
Literature 14 (June 1976) 434-461
Meylan Gustav Geschichte des Handels der Europaumler in Japan Leipzig Voigt and Guumlnther 1861
Miyamoto Mataji chief editor Kensei Osaka no bukka to rishi (Prices and Interest Rates in Osaka
during the Pre-Meiji Period) Osaka Daigaku Kinsei Bukkashi Kenkyukai Tokyo Sobunsha
1963
MiyamotoMataji Yōtarō Sakudō and Yasukichi Yasuba ldquoEconomic Development in Pre-Industrial
Japan 1859-1894rdquo Journal of Economic History 25 (December 1965) 541-564
MiyamotoMatao ldquoRelationships among Local Rice Markets in the Tokugawa Periodrdquo Osaka Economic
Papers 31 (December 1981) 274-307
Nakamura Satoru ldquoThe Development of Rural Industryrdquo In Chie Nakane and Shinzburō Ōishi eds
Tokugawa Japan The Social and Economic Antecedents of Modern Japan Tokyo University of
Tokyo Press 1990
Nakai Nobuhiko ed (Mitsui Bunko) Kinsei koki ni okeru shuyo bukka no dotai Tokyo University of
Tokyo Press 1989
Ohkura Takehiko and Hiroshi Shimbo ldquoThe Tokugawa Monetary Policy in the Eighteenth and
Nineteenth Centuriesrdquo Explorations in Economic History 15 (January 1978) 101-124
Ono Takeo Edo bukka jiten (Dictionary of the Price of Products in Tokyo) Tokyo Tenbosha 1979
25
Pauer Erich ldquoTraditional Technology and Its Impact on Japanrsquos Industry During the Early Period of the
Industrial Revolutionrdquo The Economic Studies Quarterly 38 (December 1987) 354-371
Piper Annelotte Japans Weg von der Feudalgesellschaft zum Industriestaat Cologne Verlag
Wissenschaft und Politik 1976
Scherzer Karl von Fachmaumlnnische Berichte uumlber die oumlsterreichisch-ungarische Expedition nach Siam
China und Japan Stuttgart Julius Maier 1872
Shimomura Koji and Kar-yiu Wong ldquoThe Law of Comparative Advantage without Social Utility
Functionsrdquo Review of International Economics 6 (August 1998) 401-406
Shinbo Hiroshi Kinsei no bukka to keizai hatten zen kōgoyō shakai e no sūryōteki sekkin Tokyo Toyo
Keizai Shinposha 1978
Sugiyama S Japanrsquos Industrialization in the World Economy 1859-1899 Export Trade and Overseas
Competition London Athlone Press 1988
Takekoshi Yosaburo The Economic Aspects of Japanese Civilization vol 3 London Allen and Unwin
Ltd 1930
Toyoda Takeshi A History of Pre-Meiji Commerce in Japan Tokyo Japan Cultural Society 1969
Tilley Edward Arthur Japan the Amoor and the Pacific with notices of other places comprised in a
voyage of circumnavigation in the Russian corvette Rynda in 1858-60 London Smith Elder
and Co 1861
Totman Conrad A History of Japan Malden MA Blackwell Publishers 2000
Williamson Jeffrey ldquoThe Impact of Globalization on Pre-Industrial Technologically Quiescent
Economies Real Wages Relative Factor Prices and Commodity Convergence in the Third
World Before 1940rdquo Working Paper no 7146 Cambridge Mass NBER May 1999
Yamamura Kozo and William Duffy ldquoMonetization and Integration of Markets in Tokugawa Japan A
Spectral Analysisrdquo Explorations in Economic History 8 (Summer 1971) 395-423
26
Yamazaki Ryuzo Kinsei bukkashi kenkyu Tokyo Hanawa Shobo 1983
Yasuba Yasukichi ldquoStandard of Living in Japan Before Industrialization From What Level Did Japan
Begin A Commentrdquo Journal of Economic History 46 (March 1986) 217-224
Yasuba Yasukichi ldquoThe Tokugawa Legacy A Surveyrdquo Economics Study Quarterly 38 (December
1987) 290-308
27
Table 1 The Composition of Japanese Trade 1868-1875
Product Percent of Imports Percent of Exports
Agricultural Non-Food
Silk 359
Silkworm Eggs 157
Other (Vegetable Wax and Cotton) 22 27
Agricultural Food
Tea 282
Rice 108
Sugar 99
Other Foods 42 82
Other Raw Materials
Fuel (Coal and Charcoal) 19
Other 31 29
Textiles 02
Cotton Yarn 151
Cotton Cloth 184
Woolens 192
Other textiles 18
Other manufactures 43
Weapons and ammunition 27
Machinery and instruments 14
Miscellaneous manufactures 112 Notes The trade shares of each commodity group are based upon total imports and exports for the period 1868-1875 Source Japan Bureau of Revenue (1893)
28
Table 2 The Approximate Inner Product in Various Test Years
(in million Ryō)
Year of Net Export Vector Components 1868 1869 1870 1871 1872 1873 1874 1875
(1) Imports with observed autarky prices
-224 -412 -844 -700 -575 -588 -715 -798
(2) Imports of woolen goods -098 -082 -129 -156 -216 -250 -156 -233
(3) Imports with approximated autarky prices (Shinbo index)
-110 -095 -070 -085 -151 -208 -160 -265
(4) Exports with observed autarky prices
407 340 404 516 499 408 508 480
(5) Exports with approximated autarky prices (Shinbo index)
009 003 007 007 015 007 011 010
Total inner product (sum of ((1)-(5))
-018 -247 -631 -417 -428 -631 -511 -806
Notes All values are expressed in terms of millions of ryō The ryō equaled about $1 in 1873 and was equivalent to the yen when it was introduced in 1871 The estimates are of the approximation of the inner product ( Tp a ~~
1 ) valued at autarky prices prevailing in 1851-1853 For an explanation of the assumptions underlying the approximation please see the text Source For sources of price data see footnotes 17 and 20 For numbers (3) and (5) current silver yen values are converted to values of 1851-1853 by deflating them with the price indices for exports and imports found in Shinbo (1978 Table 5-10)
29
Figure 1 The Law of Comparative Advantage with 2 Goods
x f
x ca a=
p a
c f
Autarky price vectorTrade vector T
Good 1
Good 2
30
Figure 2 Two Comparative Histories of an Economy
A (p1a x1
a c1a)
Japanrsquos putative path under autarky B (p2a x2
a c2a)
Japanrsquos actual path under free trade C (p2f x2
f c2f)
31
Figure 3 The Development of Japanrsquos External Trade 1860-1885
1860 1865 1870 1875 1880 18850
10
20
30
40
50
Exports
Imports
Source Sugiyama (1988 Table 3-4)
32
Figure 4 Net Exports and Price Changes for 1869
Source Japan Bureau of Revenue (1893) for trade data and Nakai (1989) Miyamoto(1963) Ono (1979) Kinyu Kenkyukai (1937) and Yamazaki (1983) for price data
Net Exports in 1869-125 -1 -75 -5 -25 0 25 5 75 1 125
-80
-60
-40
-20
0
20
40
60
80
100
Rice
Cotton Yarn
Brown Sugar
Legumes
Cotton Cloth
White Sugar
Cotton
Iron(Mfc)Candy
Pig Iron
Sake
Fish
Copper(Mfc)
CharcoalTea
Silk
Silkworm Eggs
Wax
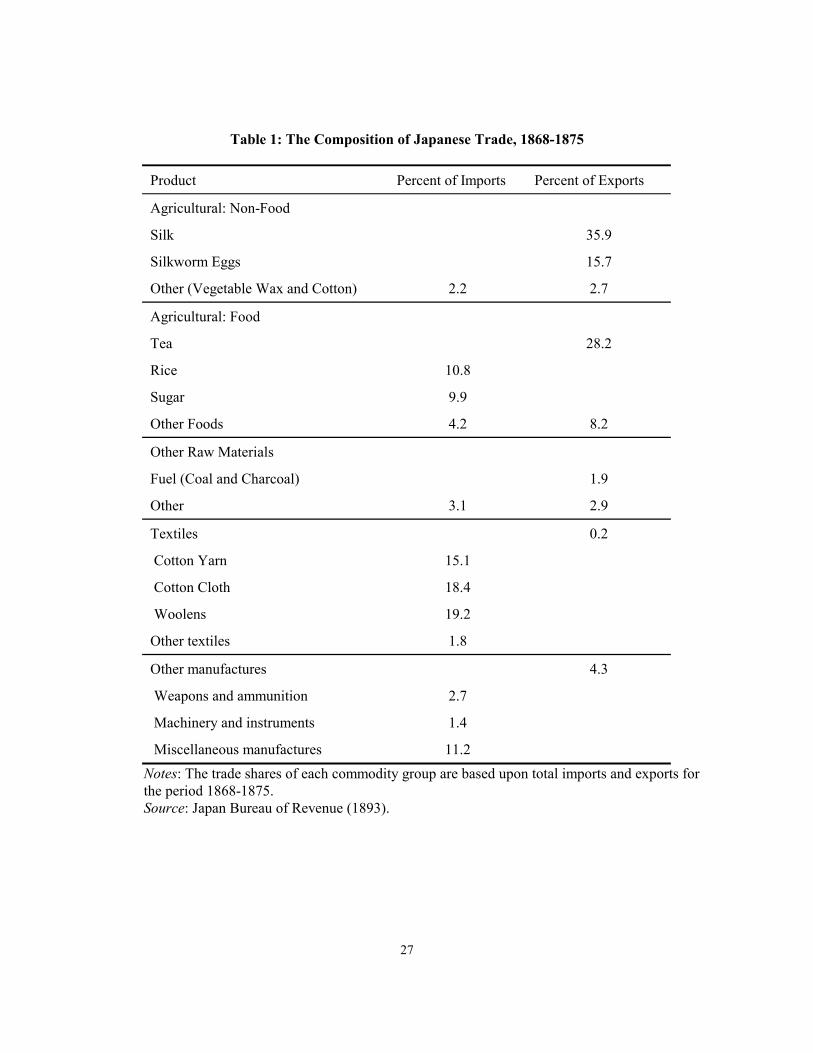
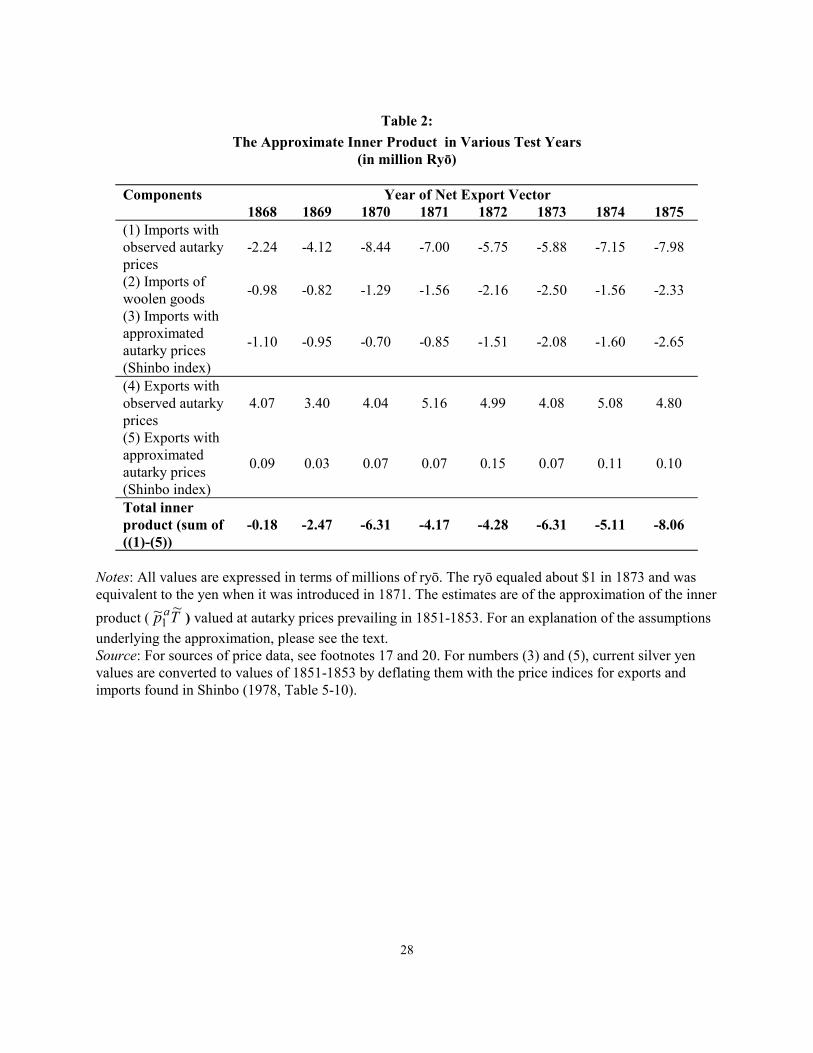
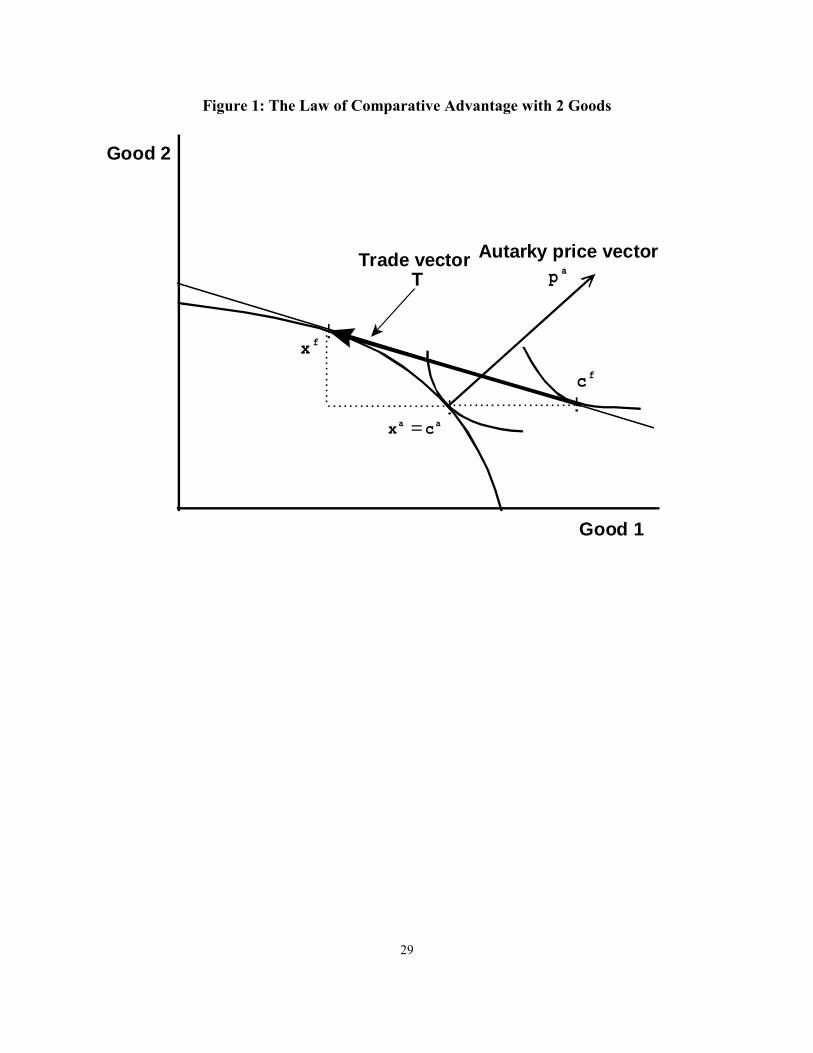
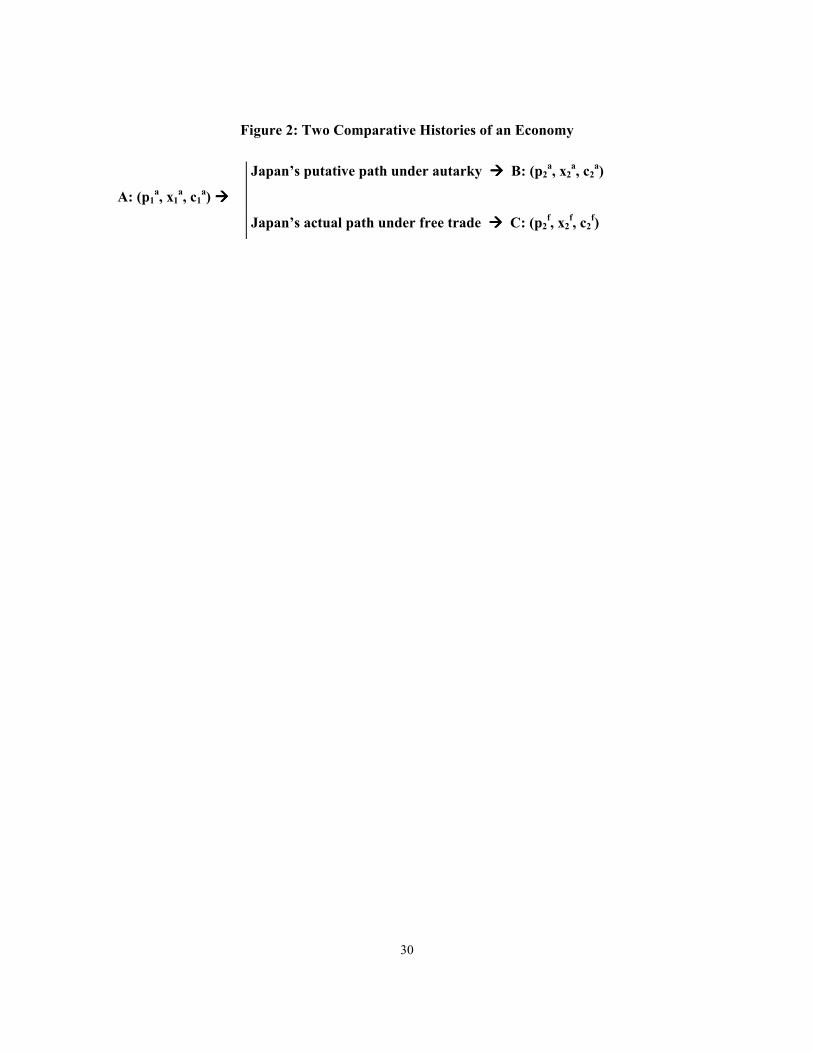
30
Figure 2 Two Comparative Histories of an Economy
A (p1a x1
a c1a)
Japanrsquos putative path under autarky B (p2a x2
a c2a)
Japanrsquos actual path under free trade C (p2f x2
f c2f)
31
Figure 3 The Development of Japanrsquos External Trade 1860-1885
1860 1865 1870 1875 1880 18850
10
20
30
40
50
Exports
Imports
Source Sugiyama (1988 Table 3-4)
32
Figure 4 Net Exports and Price Changes for 1869
Source Japan Bureau of Revenue (1893) for trade data and Nakai (1989) Miyamoto(1963) Ono (1979) Kinyu Kenkyukai (1937) and Yamazaki (1983) for price data
Net Exports in 1869-125 -1 -75 -5 -25 0 25 5 75 1 125
-80
-60
-40
-20
0
20
40
60
80
100
Rice
Cotton Yarn
Brown Sugar
Legumes
Cotton Cloth
White Sugar
Cotton
Iron(Mfc)Candy
Pig Iron
Sake
Fish
Copper(Mfc)
CharcoalTea
Silk
Silkworm Eggs
Wax
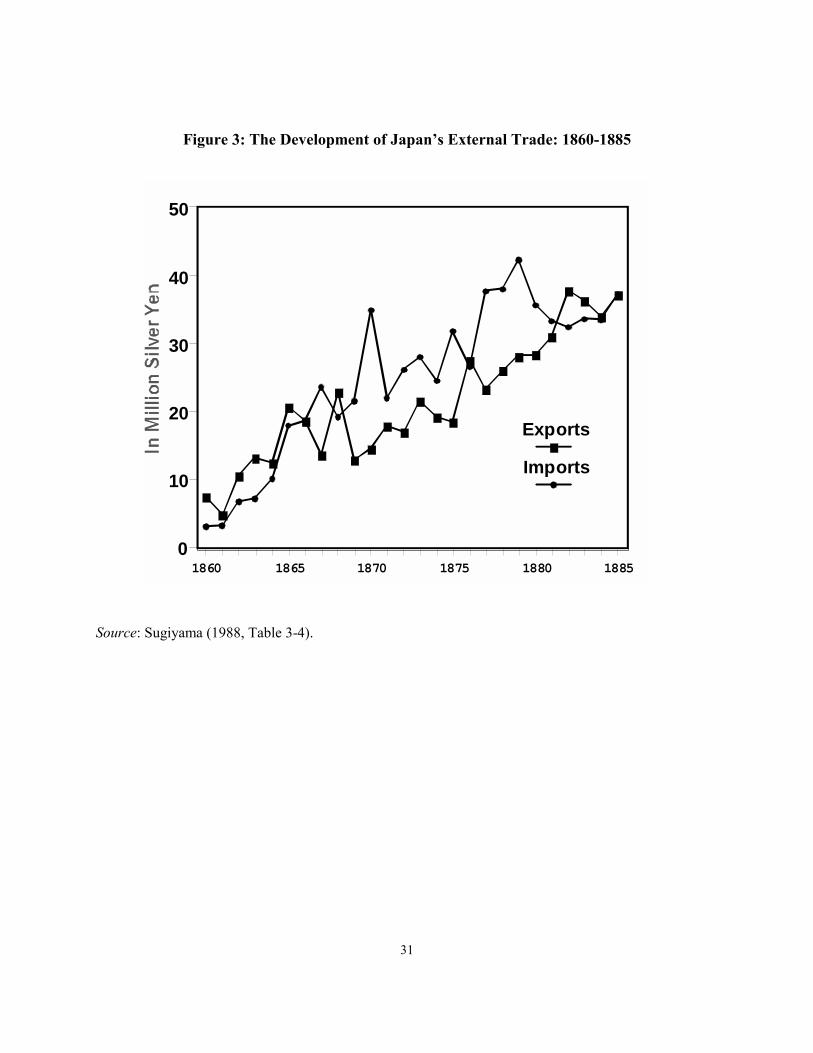
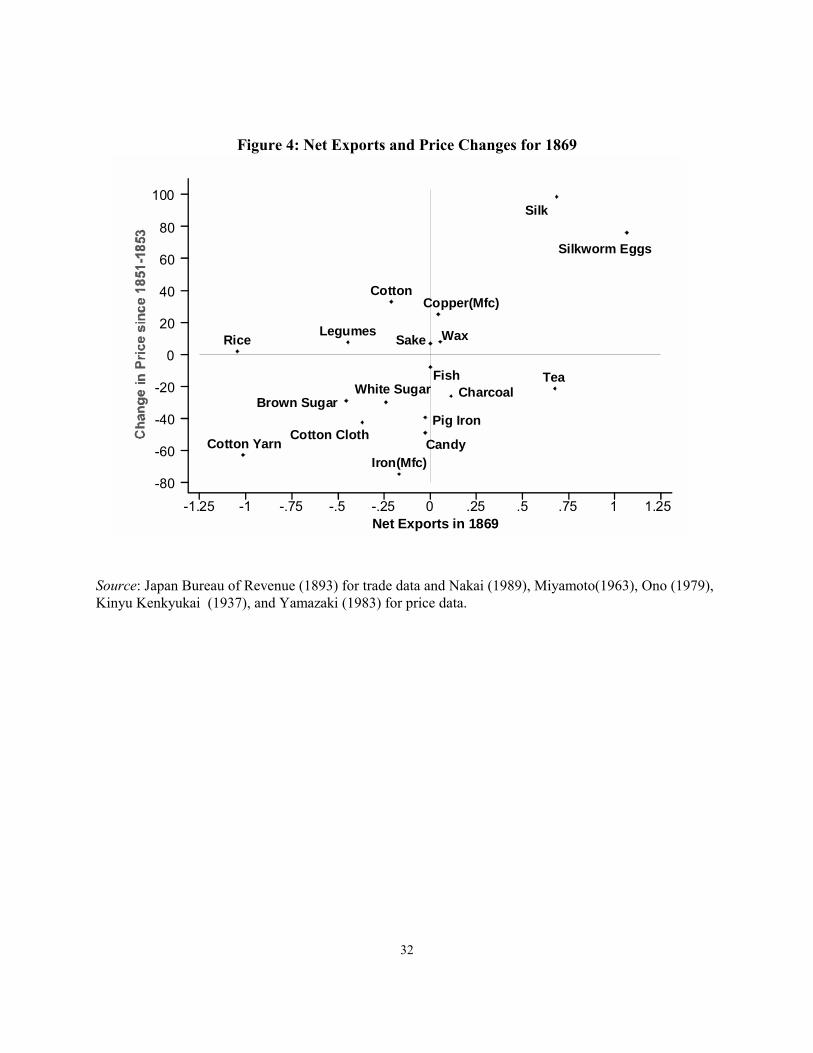