Embed Size (px)
Citation preview

Jason Leung-Wai
March 2013
BERL Regional Rankings 2012
Te Rewa Rewa Bridge in New Plymouth
Credit: Rob Tucker / Venture Taranaki

1 BERL Regional Rankings Report March 2013
BERL Regional Rankings 2012
1 Summary.................................................................................................................... 2
2 Introduction ............................................................................................................... 4
2.1 Economic Indicators ......................................................................................................... 4
2.2 Weighting and ranking ...................................................................................................... 4
2.3 BERL Regional Database ................................................................................................. 4
2.4 Format of the report .......................................................................................................... 5
2.5 Caveats ............................................................................................................................ 5
3 Economic Context .................................................................................................... 6
3.1 International ..................................................................................................................... 6
3.2 National ............................................................................................................................ 6
4 Local Authorities ....................................................................................................... 8
5 Regions .................................................................................................................... 19
6 Cities ........................................................................................................................ 27
7 Appendix - Economic Indicators – what are they? .............................................. 33
8 Appendix – Local authority ranking by measure ................................................. 34
9 Bibliography ............................................................................................................ 43
Tables and Figures
Table 1.1. Regional Rankings (top 10) ........................................................................................................................ 3
Table 3.1. New Zealand KPIs ...................................................................................................................................... 7
Table 4.1. Local authority rankings, 2012 ................................................................................................................... 8
Table 5.1. Regional rankings, 2012 .......................................................................................................................... 19
Table 6.1. City rankings, 2012 ................................................................................................................................... 27
Figure 4.1. 5-year population map, annual average over medium-term................................................................... 16
Figure 4.2. 5-year FTE map, annual average over medium-term ............................................................................ 17
Figure 4.3. 5-year GDP map, annual average over medium-term ........................................................................... 18
Figure 8.1. Short-term measures – Population ......................................................................................................... 34
Figure 8.2. Short-term measure - employment ......................................................................................................... 35
Figure 8.3. Short-term measure – GDP .................................................................................................................... 36
Figure 8.4. Short-term measure – business units ..................................................................................................... 37
Figure 8.5. Medium-term measure – population ....................................................................................................... 38
Figure 8.6. Medium-term measure – employment .................................................................................................... 39
Figure 8.7. Medium-term measure - GDP ................................................................................................................. 40
Figure 8.8. Medium-term measure – business units ................................................................................................. 41
Figure 8.9. Measure – relative openness index ........................................................................................................ 42

2 BERL Regional Rankings Report March 2013
1 Summary
It is our belief at BERL that “regions matter”. And that regional development is absolutely necessary to encourage
economic growth at a national level.
A growing national economy needs strong local economies that are linked through an efficient and effective system
to produce the final output of New Zealand Inc. It is obvious that Auckland cannot survive without the support and
resources generated from the rest of the country. Similarly, urban areas cannot survive without rural areas that
generate the primary resources that are converted into products and utilise services located in these urban areas.
In New Zealand, where our economy is strongly tied to primary production, regions are even more important.
Regions produce the goods, such as fruit, meat, dairy, wood, oil, gas, coal, and steel. Cities facilitate activity and
provide services for further production and people. Transport and communications infrastructure link them all.
Each local area has different endowments and advantages that result in specialisation and unique differences.
Each local area also provides the environment and the infrastructure that supports populations and allows them to
engage in business activity.
Recently in New Zealand, there has been a strong focus on Auckland based on the importance of cities, and rightly
so. Cities provide mechanisms that attract, encourage and enable economic activity to happen. However, there is
still a strong case for the contribution broader local areas can make to economic growth. Changes in technology
and the global economy have actually increased the importance of regions, and local activity. The ability for activity
to be undertaken anywhere; the mobility of the workforce; and the localisation of innovation has put even further
value on the importance of place, which is broader than cities.
To understand and support the national economy we must understand and support the building blocks that enable
it. Local areas are those building blocks. There are ways to support local areas to enable effective allocation of
resources, efficient production, and supportive environments for businesses and people. This is called regional
development.
And to provide effective economic development support to local economies we need to be able to measure their
activity. This is crucial if we are to identify benchmarks and to set an aspirational target. As the saying goes, “you
cannot manage what you cannot measure”.
As such, this analysis provides government, local government and private businesses with a high-level overview on
economic performance at a sub-national level. The analysis compares performance at three sub-national
aggregations:
local authority
regional council
city.
This information can be used to identify areas where support is needed, or where additional focus or effort is
required. It can underpin and allow effective measurement of economic development strategies.
It is important to note that this is a ranking report. It is based on the change in activity in an area relative to changes
in other areas. It is therefore looking at rate of change rather than the actual quantum of activity.

3 BERL Regional Rankings Report March 2013
Rankings
The rankings are based on indicators of economic activity – population, employment, value added (GDP) and
businesses. The rankings also incorporate the level of activity in the productive (export focused) sectors of the
economy.
In 2012, there has been a significant lift in GDP in primary based industries, largely a result of increased export
sales and improved commodity prices. This has supported the performance of rural districts. Similarly, the
reallocation of activity, especially population, in the Canterbury region has seen rapid growth in smaller districts
around Christchurch.
Several of the rankings come as no surprise. Areas with a strong primary sector focus have done well, as have
those with strong population growth. There are some new faces alongside the usual suspects from previous years.
The top ten rankings by local authority, region and city are shown in Table 1.1.
Table 1.1. Regional Rankings (top 10)
Rank Local Authority Region City
1 Selwyn Auckland New Plymouth
2 Ashburton Taranaki Timaru
3 Waimakariri Southland Auckland
4 Queenstown-Lakes Waikato Wellington
5 Waimate Otago Hamilton
6 Hurunui West Coast Tauranga
7 Hauraki Wellington Blenheim
8 Waikato Canterbury Nelson
9 Buller Nelson/Tasman/Marl Invercargill
10 Mackenzie Gisborne Gisborne
Congratulations to those who have made it into the top ten, or who have made strides over the previous year. As
usual we expect robust discussion around the rankings, and whether they were deserved, accurate or even useful.
From our perspective, this is what we hope to occur. We hope this ranking report starts a conversation around the
region’s performance, which is hopefully a precursor to discussion on how to improve. This ultimately leads to
growth in the regions, which is what we want and need as a nation.

4 BERL Regional Rankings Report March 2013
2 Introduction
Economic growth is important for all New Zealanders. Economic growth provides more jobs, more money, and an
opportunity for an improved lifestyle. Understanding what causes economic growth and where this growth is
coming from within New Zealand is especially important to maintain and increase our current standard of living.
The BERL Regional Rankings Report provides a comparative measure of the economic performance of New
Zealand’s 66 local authorities, 14 regions and 20 cities.
The overall ranking provides government, industry and the public with an understanding of the relative performance
of New Zealand’s districts, regions and cities, and provides important information which:
local authorities and regions can use to monitor their performance relative to their peers, and identify
areas of interest.
businesses can use to identify areas of growth and decline.
governments can use to inform national economic policies, and identify where activity is occurring.
2.1 Economic Indicators
The key performance indicators that make up the regional rankings are: population, employment, GDP and
business units (which are calculated in the short and medium-term) and the Relative Openness Index, which
provides a longer term measure of the gearing of the regional economy towards export focused sectors.
The performance of each local authority, region or city is based on the change in key economic indicators over the
last year (short-term) and over the last five years (medium-term). The focus of these indicators is on outcomes –
population growth, employment, GDP growth, and business growth.
By looking at both short and medium-term performance, the final rankings reflect changes in the area’s performance
that are more permanent in nature rather than solely reflecting shifts that may well be one-off shocks, corrections or
even data error.
2.2 Weighting and ranking
All economic indicators are equally weighted in the analysis, i.e. employment growth in the short-term has the same
significance as employment growth over the medium-term (so each indicator accounts for 11.1 percent). The
overall rank is based on the total score. That is, scores for each measure are scaled and then summed to provide a
final ranking. This takes into account the variance within each measure rather than being based on the order.
2.3 BERL Regional Database
Indicators are taken from the BERL Regional Database. This database contains relevant economic indicators at a
local authority level broken down by industry sector.1 It is built from publicly available data including the New
Zealand Business Demography statistics, Household Labour Force Survey, National Accounts, and sub-national
Population Estimates. It forms the basis of much of the regional economic development work we do to support
1 Indicators include population, employment, GDP, Businesses – number and size. These can be used to identify further measures
including GDP per Capita, Labour Productivity, and location quotients. Data can be broken down into industry groupings at the ANZSIC 2006 4-digit level (506 industries).

5 BERL Regional Rankings Report March 2013
businesses, councils and economic development organisations in New Zealand to identify economic activity and
performance in their regions.
There have been revisions to the BERL Regional Database in 2012 that influence the results. In particular, there
have been methodological improvements to remove the distortion of GDP from ownership of owner-occupied
dwellings. This has resulted in less variation from year to year, particularly for small districts, where a slight shift in
employment in property services (the broader grouping within which ownership of owner-occupied dwellings sits)
often resulted in significant changes in GDP.
The other major factor influencing results was the large increase in GDP generated by the primary sector. This is
as a result of improved commodity prices and production levels. This has seen the GDP generated per unit of
activity increase significantly across the primary sector. The result of this is apparent in the performance of smaller
rural districts where the primary sector accounts for a relatively high proportion of economic activity.
2.4 Format of the report
This report is organised into seven chapters. Chapter 3 provides some context on the national and international
economy. The next three chapters then look at the three geographic groupings – local authority, regional council,
and city.
2.5 Caveats
In terms of caveats, we accept that this is mainly a desk-based exercise. Where possible, we have tried to verify
the underlying data where they result in a questionable number. Where appropriate, we have overridden data based
on patterns, and our general knowledge and understanding of regions. However, we have not verified all activity or
gone out of our way to identify why the changes have occurred.
Further, the data is for the March 2012 year. Much has changed since then, for example the current drought
affecting north island farms.
Finally, we stress that this report provides a high-level analysis showing how local authorities, regions and cities
compare relative to each other. For effective interventions and targeted regional economic development activity a
much more detailed level of analysis is required that looks at the absolute values and quantum of change rather
than comparative differences between councils. That is, more detailed information should be obtained and
assessed to inform, identify and support regional economic development activity.

6 BERL Regional Rankings Report March 2013
3 Economic Context
While the rankings report compares the relative performance of sub-national geographic areas, it is useful to assess
their performance within the context of the global and national economy. The world economy is still struggling to
recover from the Global Financial Crisis (GFC), with many developed economies returning to recession. Earlier,
bullish forecasts were based on continued explosive growth in developing countries, which would counter the stalled
growth in the developed countries. However, this overlooked the fact that a large proportion of developing country
growth was from selling goods to developed countries. As a result, developing country growth has also eased and
will only return to the earlier high levels of growth when developed countries start buying goods again.
3.1 International
Global growth and trade has slowed further over 2012. This uncertainty has affected investment decisions and
markets resulting in lower global growth forecasts. In their latest World Economic Situation and Prospects 2013, the
United Nations expects global growth of 2.2 percent in 2012, increasing slightly to 2.4 percent in 2013 and 3.2
percent in 2014.2 These expectations are well below what was forecast a year earlier.
Through 2011 developing economies grew at 5.7 percent, which was a 26 percent decline from the 7.7 percent
growth in 2010. Looking forward, growth is expected to slow even further in 2012 to 4.7 percent before increasing
again in 2013 and 2014 at 5.1 percent and 5.6 percent respectively.
An increasing focus for New Zealand exporters is in the Asian markets. However, their growth, while still
respectable, has also eased significantly from the 9.2 percent GDP growth recorded in 2010. In 2011, East Asia
growth fell by 16 percent to 7.1 percent. Growth in the Asian markets is expected to fall by a further 18 percent in
2012 to 5.8 percent before increasing slightly to 6.2 percent and 6.5 percent in 2013 and 2014.
3.2 National
The national economy continues to be influenced by the global economy. The whole experience around the GFC
has seen a shift in consumer behaviour with increased prudence in relation to investment and spending.
Government continues to pull back its spending in an effort to balance the budget by 2014. The expected spend on
the Christchurch rebuild has not occurred as capacity constraints and squabbles around where and how to spend
continues to delay activity. This has all resulted in a subdued domestic market with the expected recovery being
pushed back until the national and global environments become less volatile.
While our export markets are not as bullish, exports continue to grow, with healthy commodity prices for our main
products. Demand from our key markets, particularly Asia and Australia, remains relatively strong. According to
the ANZ Commodity Price Index, prices for New Zealand commodities fell by 18 percent in the year to March 2012.
However, this follows an increase of 21 percent in the previous year and growth over the last five years of 17
percent. Globally, world commodities dropped by around nine percent in 2012 but are up 43 percent from five years
earlier.3
New Zealand commodity prices have been affected by the high New Zealand dollar, which is currently sitting at
around US$ 0.84. The trade weighted index is sitting at around 76 percent. Both are the highest they have been
2 (Development Policy and Analysis Division, 2013)
3 (ANZ, 2013)

7 BERL Regional Rankings Report March 2013
since the early 80s and have steadily increased since 2001 (with a blip in 2008 due to the GFC). There is a long
held view that the NZ$ is overvalued and hurting exports. Unfortunately, there is nothing to suggest that it will drop
significantly in the short to medium-term, with favourable commodity prices, association to a strong Australian dollar
and the active management of other currencies.
Despite the positive increase in the price of our commodity exports, key performance indicators over the last five
years have been dismal. Economic activity has been subdued since the GFC in 2008 triggered global and national
recessions.
Ultimately, New Zealand’s performance shows signs of an economy that is still trying to regain ground after a global
recession. Key economic indicators in 2012 tend to be better than the five year average but worse than the ten year
average. Slower population and employment growth has seen GDP per capita and labour productivity growth
significantly higher than both the medium and longer term.
Table 3.1. New Zealand KPIs
Employment growth for the year ending March 2012 was 1.0 percent which is close to the halfway between the
medium-term average of 0.5 percent and the long term average of 1.8 percent. Unemployment is currently sitting
around 6.9 percent (December 2012 quarter). In March 2011, where this data relates to, the unemployment rate
was lower at 6.7 percent. Unemployment peaked in the September 2011 quarter at 7.3 percent.
GDP growth was 2.0 percent for the year ending March 2012. Again, this is higher than the medium-term average
of 0.9 percent but lower than the long term average of 2.3 percent.
Population growth slowed even further in 2012, easing to 0.6 percent from 0.9 percent the previous year.
Population growth has averaged 1.0 percent over the last five years and by 1.2 percent over the last ten. In both
2011 and 2012, outward migration was higher than inward migration. The majority of outward migration was to
Australia, with close to 54,000 people moving there compared to only 15,000 coming in to New Zealand.
The rankings reflect the ability of districts, regions and cities, to operate within the national and international
environment. It is apparent from the results that some have operated better than others in the trying environment of
2012 and over the last five years.
2012 5-yr ave 10-yr ave
Resident population grow th 0.6 1.0 1.2
GDP grow th 2.0 0.9 2.3
GDP per capita grow th 1.4 -0.1 1.1
Employment Grow th (FTEs) 1.0 0.5 1.8
Labour productivity grow th 1.0 0.4 0.5
Business units grow th -0.2 0.1 2.1
Business size grow th 1.2 0.4 -0.3
source: BERL Regional Database 2012
%paKey Performance Indicators

8 BERL Regional Rankings Report March 2013
4 Local Authorities
At the most disaggregated regional level we have 66 local authorities. Each of these is tasked with encouraging the
four wellbeings of their community – economic, social, cultural and environmental. We do note that there is a huge
variation in the size, scale and activity of local authorities, which can have an impact on what they can do and also
on their economic performance.
Table 4.1. Local authority rankings, 2012
There were three new entrants into the top ten – Waimate, Hauraki and Mackenzie. Dropping out of the top ten in
2012 were Central Otago, Tauranga City and Western Bay of Plenty.
Several districts jumped significantly in the rankings including Stratford, Central Hawke’s Bay, Gore, and Masterton.
The largest declines were Western Bay of Plenty, Kaikoura, Westland and Ōpōtiki.
The events in Christchurch have impacted on the rankings, with six of the top ten local authorities being in the
Canterbury Region. Whether this continues depends upon the rebuild, and whether changes are permanent or
temporary.
2012 2011 2012 2011
Selw yn District 1 4 ↑3 South Waikato District 34 55 ↑21
Ashburton District 2 9 ↑7 Whakatane District 35 25 ↓10
Waimakariri District 3 3 → Marlborough District 36 44 ↑8
Queenstow n-Lakes District 4 2 ↓2 Tararua District 37 64 ↑27
Waimate District 5 21 ↑16 Nelson City 38 19 ↓19
Hurunui District 6 10 ↑4 Invercargill City 39 36 ↓3
Hauraki District 7 34 ↑27 South Wairarapa District 40 50 ↑10
Waikato District 8 5 ↓3 Gisborne District 41 51 ↑10
Buller District 9 1 ↓8 Porirua City 42 23 ↓19
Mackenzie District 10 15 ↑5 Hastings District 43 30 ↓13
Gore District 11 45 ↑34 Grey District 44 53 ↑9
Carterton District 12 16 ↑4 Whangarei District 45 38 ↓7
Central Otago District 13 7 ↓6 Western Bay of Plenty District 46 6 ↓40
Southland District 14 17 ↑3 Westland District 47 24 ↓23
Waitaki District 15 26 ↑11 Napier City 48 35 ↓13
Waipa District 16 13 ↓3 Rangitikei District 49 65 ↑16
New Plymouth District 17 12 ↓5 Opotiki District 50 28 ↓22
Timaru District 18 22 ↑4 Dunedin City 51 42 ↓9
Central Haw ke's Bay District 19 59 ↑40 Waitomo District 52 54 ↑2
Auckland 20 14 ↓6 Low er Hutt City 53 52 ↓1
Stratford District 21 63 ↑42 Rotorua District 54 37 ↓17
Manaw atu District 22 29 ↑7 Palmerston North City 55 48 ↓7
Wellington City 23 31 ↑8 Kapiti Coast District 56 43 ↓13
Otorohanga District 24 41 ↑17 Thames-Coromandel District 57 47 ↓10
Tasman District 25 11 ↓14 Christchurch City 58 57 ↓1
Clutha District 26 27 ↑1 Kaw erau District 59 61 ↑2
Masterton District 27 58 ↑31 Kaikoura District 60 32 ↓28
Kaipara District 28 40 ↑12 Far North District 61 46 ↓15
Hamilton City 29 20 ↓9 Horow henua District 62 56 ↓6
Matamata-Piako District 30 33 ↑3 Upper Hutt City 63 49 ↓14
South Taranaki District 31 39 ↑8 Wanganui District 64 60 ↓4
Tauranga City 32 8 ↓24 Wairoa District 65 62 ↓3
Taupo District 33 18 ↓15 Ruapehu District 66 66 →
source: BERL Regional Database 2012
BERL Local Authority
Rankings
RANK RANK

9 BERL Regional Rankings Report March 2013
Selwyn District takes top spot in the 2012 rankings,
moving up three spaces from the previous year.
Historically a strong farming community, Selwyn has
seen most of its growth coming from population and
associated sectors such as construction, retail trade and
social services.
Selwyn District is in the centre of the South Island and
south of Christchurch. It has a population of 40,700. It
employs 14,400 FTEs and generates $1.2 billion in GDP
across 5,400 businesses.
In 2012, Selwyn’s population increased by 2.9 percent,
taking it over 40,000 people for the first time. There was
a 9.5 percent increase in FTE employment, around 1,200 jobs. There was a 50 percent increase in employment in
the construction industry and a 40 percent increase in arts and recreation services.
Selwyn’s performance is across the board, ranking in the top eight in eight of the nine indicators, and in the top
three in six of those.
Selwyn District had the highest employment growth in 2012, and has had the second highest employment growth
over the last five years. It had the second fastest rate of population growth in 2012 and has been the fastest
growing local authority over the last five years.
Selwyn District had the third fastest growth in GDP in 2012 and has been the top performer over the last five years.
Ashburton District, located south of Christchurch,
moved up seven spots to place 2nd
in 2012. Its ranking is
due to solid performances across all indicators. While it
was not in the top three in any of the indicators, it placed
fourth in three indicators and was in the top ten on seven
of the nine.
Ashburton has a population of 29,900. It employs 15,700
FTEs and generates $1.4 billion in GDP across 5,400
businesses.
The Ashburton economy is strongly focused on the
primary and manufacturing sectors, which account for
close to 50 percent of employment in the District.
Ashburton has also seen above average population growth, which has resulted in solid growth in the construction
sector. However, in the latest year, the fastest growth has been in wholesale and distribution (up 10.3 percent) and
in business services (up 10.1 percent).
Ashburton has had strong performances over all the medium-term measures. Employment and business unit
growth was strong, supported by a rapidly increasing population.
1
st
2 nd
1 st
3 rd
5 th
36 th
1 st
2 nd
1 th
8 th
4 th
Business units grow th
Previous rank (2011)
Selwyn District
2012
2007-2
012
Resident population grow th
Employment (FTE) grow th
Real Value Added grow th (GDP)
Business units grow th
Relative openness index
Resident population grow th
Employment (FTE) grow th
Real Value Added grow th (GDP)
2
nd
6 th
4 th
9 th
11 th
22 nd
6 th
4 th
8 th
4 th
9 th
Business units grow th
Previous rank (2011)
Ashburton District
2012
2007-2
012
Resident population grow th
Employment (FTE) grow th
Real Value Added grow th (GDP)
Business units grow th
Relative openness index
Resident population grow th
Employment (FTE) grow th
Real Value Added grow th (GDP)

10 BERL Regional Rankings Report March 2013
Waimakariri District held onto its previous year’s
ranking in 3rd place. In fact, three is a popular number in
the Waimakariri. Over the last five years, it has had the
3rd fastest population and GDP growth. It also had the
3rd fastest employment growth in 2012.
Waimakariri also had three placings that were in
multiples of three. It had the ninth fastest business unit
growth in 2012. Employment growth was the sixth
fastest and business growth was the ninth fastest over
the 2007 to 2012 period.
Waimakariri has a population of 47,800. It employs
12,100 FTEs and generates $1.1 billion in GDP across
5,800 businesses.
In 2012, Waimakariri saw a 27 percent increase in construction employment, with an extra 450 jobs created. With
2,100 FTEs, the construction sector is now the second largest sector behind retail trade and services (2,500 FTEs)
and social services (2,080 FTEs).
Queenstown-Lakes District continues to appear at or
near the top of the BERL regional rankings. In 2012, the
district ranked 4th, down two spots from 2011.
In the past, the District has had a lock on the fastest
population growth. However, it only ranked 5th in 2012
and it is now second over the medium-term for
population growth.
Queenstown-Lakes has a population of 27,800. It
employs 15,200 FTEs and generates $1.1 billion in GDP
across 6,300 businesses.
In 2012, while the District still performed well in employment and business unit growth, it was let down by GDP
growth. Similarly, it has dropped down to 18th and 19
th in medium-term rankings for employment and GDP growth.
Interestingly, Queenstown-Lakes strongest growth in 2012 came from the manufacturing sector, with a 13.8 percent
increase in employment and a 15.3 percent increase in GDP. However, manufacturing only accounts for around 3.5
percent of employment. Employment growth in 2012 in construction was negative and subdued in retail trade and
services. These are relevant facts as a) construction has been a significant driver of economic activity in the District
and b) retail trade and services accounts for over 40 percent of employment in the District.
3
rd
8 th
3 rd
19 th
9 th
53 rd
3 rd
6 th
3 rd
9 th
3 rd
Business units grow th
Previous rank (2011)
Waimakariri District
2012
2007-2
012
Resident population grow th
Employment (FTE) grow th
Real Value Added grow th (GDP)
Business units grow th
Relative openness index
Resident population grow th
Employment (FTE) grow th
Real Value Added grow th (GDP)
4
th
5 th
7 th
25 th
4 th
61 st
2 nd
18 th
19 th
1 st
2 nd
Business units grow th
Previous rank (2011)
Queenstown-Lakes
District
2012
2007-2
012
Resident population grow th
Employment (FTE) grow th
Real Value Added grow th (GDP)
Business units grow th
Relative openness index
Resident population grow th
Employment (FTE) grow th
Real Value Added grow th (GDP)

11 BERL Regional Rankings Report March 2013
Waimate District jumped 21 spots to 5th place in the
regional rankings in 2012. Specifically, Waimate had the
fastest GDP growth in 2012. This was a result of the
primary sector, where a 33 percent increase in primary
sector GDP resulted in a 17 percent increase in the
District’s total GDP.
Waimate has a population of 7,500. It employs 2,600
FTEs and generates $200 million in GDP across 1,200
businesses.
The primary sector accounts for close to 55 percent of
Waimate’s employment and 53 percent of its GDP. This
is a major factor in its 5th placing on the Relative
Openness Index.
Waimate also had a 4.2 percent increase in employment in 2012, driven by a 15 percent increase in construction
and a 12 percent increase in wholesale and distribution.
The strong employment and GDP growth in 2012 has translated through to the medium-term, where it ranked 5th
and 4th respectively.
Hurunui District moved up four places in 2012 to 6th
place. Hurunui’s performance was driven by excellent
2012 performances in population and GDP growth and
strong performances across all medium-term indicators.
Again, as with all Canterbury districts, Hurunui had
strong resident employment growth. This was anchored
by the 6th fastest GDP growth, driven by strong primary
sector returns.
Hurunui has a population of 11,200. It employs 4,400
FTEs and generates $370 million in GDP across 2,500
businesses.
Hurunui District’s 12.7 percent growth in GDP was underpinned by a 26 percent increase in primary sector GDP.
Just over 47 percent of Hurunui District’s employment is in the primary sector, with an increasing proportion of that
being dairy cattle farming.
Also supporting the strength of the economy was a 27 percent increase in employment in the construction sector,
driven by the growing population base.
5
th
26 th
8 th
1 st
6 th
5 th
28 th
5 th
4 th
29 th
21 st
Business units grow th
Previous rank (2011)
Waimate District
2012
2007-2
012
Resident population grow th
Employment (FTE) grow th
Real Value Added grow th (GDP)
Business units grow th
Relative openness index
Resident population grow th
Employment (FTE) grow th
Real Value Added grow th (GDP)
6
th
4 th
14 th
6 th
24 th
10 th
9 th
9 th
10 th
11 th
10 th
Business units grow th
Previous rank (2011)
Hurunui District
2012
2007-2
012
Resident population grow th
Employment (FTE) grow th
Real Value Added grow th (GDP)
Business units grow th
Relative openness index
Resident population grow th
Employment (FTE) grow th
Real Value Added grow th (GDP)

12 BERL Regional Rankings Report March 2013
Hauraki District, east of Auckland and Hamilton,
catapulted 27 places to take the 7th ranking in 2012. This
position, however, may be short lived.
The major reason for the increase was the absorption of
the southwest coast of the Firth of Thames with the
abolition of the Franklin District.
As a consequence, Hauraki had the fastest population
growth in 2012 at 3.9 percent. It also had the 6th fastest
employment growth (4.8 percent) and the 7th fastest GDP
growth (12 percent) in the country.
Hauraki has a population of 18,300. It employs 6,200
FTEs and generates $500 million in GDP across 2,600 businesses.
The one-off boundary change also bumped up its medium-term rankings. Hauraki has the 7th fastest employment
growth and the 11th fastest population growth over the last five years.
Employment growth in 2012 was driven by the manufacturing industry, which increased by 48 percent in 2012, and
the arts and recreation services industry, where employment grew by 43 percent, albeit of a low base.
Manufacturing growth was the result of an additional 220 FTEs in the meat processing industry.
Waikato was another district that benefited from the
formation of the Auckland supercity and the carving up of
Franklin District.
Because of the large population increase (32 percent in
2012) we have estimated their population growth
excluding the absorption. Regardless, the subsequent
increase in employment and GDP in 2012, and the
medium-term performance has seen Waikato remain in
the top 10.
Waikato District has a population of 62,700. It employs
17,200 FTEs and generates $1.6 billion in GDP across
8,000 businesses.
A third of the Waikato District’s employment is in the primary sector, with a further 14 percent in manufacturing,
largely processing. In 2012, the Waikato District added 200 FTEs in dairy manufacturing, 35 FTEs in meat
processing, and 41 FTEs in other food product manufacturing. As well, there were significant gains in dairy cattle
farming (135 FTEs) and other agriculture and fishing support services (600 FTEs). As a result, the Waikato District
experienced employment growth of eight percent and GDP growth of close to 11 percent in 2012.
7
th
1 th
6 th
7 th
17 th
35 th
11 th
7 th
14 th
50 th
34 th
Business units grow th
Previous rank (2011)
Hauraki District
2012
2007-2
012
Resident population grow th
Employment (FTE) grow th
Real Value Added grow th (GDP)
Business units grow th
Relative openness index
Resident population grow th
Employment (FTE) grow th
Real Value Added grow th (GDP)
8
th
7 th
2 nd
10 th
44 th
26 th
5 th
3 rd
6 th
46 th
5 th
Business units grow th
Previous rank (2011)
Waikato District
2012
2007-2
012
Resident population grow th
Employment (FTE) grow th
Real Value Added grow th (GDP)
Business units grow th
Relative openness index
Resident population grow th
Employment (FTE) grow th
Real Value Added grow th (GDP)

13 BERL Regional Rankings Report March 2013
With a difficult year on the West Coast, Buller District
relinquished its hold on the top spot. However, Buller
has managed to stay in the top ten, claiming 9th place in
2012 and is still the strongest performer on the West
Coast
Buller has a population of 9,900. It employs 5,100 FTEs
and generates $400 million in GDP across 1,200
businesses.
Business unit growth has been a strong indicator for the
district, ranking 3rd in 2012 and 7
th over the five year
period.
Over the five year period, Buller has had the strongest employment growth of all districts. However, in 2012,
employment growth was 3.2 percent, enough to give Buller the 11th fastest rate of growth.
GDP growth has definitely suffered, falling by 0.1 percent in 2012, ranking Buller 49th. Over the five year period,
GDP growth has been relatively solid, with the 12th fastest rate of growth.
Interestingly, the strongest growth in 2012 has been in business services, with a 10.6 percent increase in
employment. This has been supported by seven percent employment increases in manufacturing and construction.
On the down side, there has been an 18 percent drop in employment in arts and recreation services, although this is
of a lower base.
We return to the Canterbury region for the 10th placed
district, which is Mackenzie. The district has broken into
the top 10, rising five places from the previous year.
Mackenzie had the 8th fastest GDP growth in 2012, and
the 2nd
fastest GDP growth over the last five years.
Mackenzie has also benefited from population growth,
being the 11th fastest growing region in 2012.
Mackenzie has a population of 4,000. It employs 1,900
FTEs and generates $190 million in GDP across 850
businesses.
A relatively small economy, activity is focused on the primary and retail sectors. However, the greatest growth has
come from the manufacturing sector, albeit of a very small base.
Within the primary sector there has been a shift from sheep farming to beef and dairy cattle farming. There has also
been growth in onshore aquaculture, with an aligned increase in seafood processing.
9
th
24 th
11 th
49 th
3 rd
20 th
38 th
1 st
12 th
7 th
1 st
Business units grow th
Previous rank (2011)
Buller District
2012
2007-2
012
Resident population grow th
Employment (FTE) grow th
Real Value Added grow th (GDP)
Business units grow th
Relative openness index
Resident population grow th
Employment (FTE) grow th
Real Value Added grow th (GDP)
10
th
11 th
28 th
8 th
25 th
28 th
20 th
13 th
2 th
10 th
15 th
Business units grow th
Previous rank (2011)
Mackenzie District
2012
2007-2
012
Resident population grow th
Employment (FTE) grow th
Real Value Added grow th (GDP)
Business units grow th
Relative openness index
Resident population grow th
Employment (FTE) grow th
Real Value Added grow th (GDP)

14 BERL Regional Rankings Report March 2013
Heading further south, the much maligned Gore placed
just outside the top ten. Driving its performance has
been business unit growth, where it ranked second in
2012 and over the last five years.
Gore has a population of 12,000. It employs 6,800 FTEs
and generates $620 million in GDP across 2,000
businesses.
In a year where there was a decline in businesses in
New Zealand, Gore added over 40 businesses, an
increase of 2.4 percent. It also showed strong
employment and GDP growth of 7.9 percent and 8.3
percent respectively.
Growth appeared to come from the arts and recreation and social services sectors, along with strong growth in the
primary sector. In 2012, Gore had GDP growth of over 30 percent in the primary and arts and recreation services
sectors. In terms of employment, the greatest absolute growth was in business services, where Gore added 67
FTE jobs.
Carterton is the highest ranking district in the lower north
island. It has moved up four spots from 2011 to 12th
place.
Carterton has a population of 7,600. It employs 2,900
FTEs and generates $290 million in GDP across 1,200
businesses.
Carterton District’s rankings could be considered “solid”.
Carterton’s highest ranking indicator was its relative
openness, where it ranked 6th. However, it also had a
strong medium-term GDP ranking (9th) and recent
population growth (10th in 2012 and 13
th over the
medium-term). Interestingly, Carterton also ranked 9th in
medium-term GDP growth.
Over 50 percent of Carterton’s economy is in the primary and manufacturing sectors. GDP in the primary sector in
Carterton increased by 38 percent in 2012. Within the primary sector, there were employment increases in nursery
production, beef cattle farming, other grain growing, dairy cattle farming and beekeeping.
11
th
51 st
10 th
18 th
2 nd
21 st
56 th
21 st
24 th
2 nd
45 th
Business units grow th
Previous rank (2011)
Gore District
2012
2007-2
012
Resident population grow th
Employment (FTE) grow th
Real Value Added grow th (GDP)
Business units grow th
Relative openness index
Resident population grow th
Employment (FTE) grow th
Real Value Added grow th (GDP)
12
th
10 th
18 th
24 th
51 st
6 th
13 rd
14 th
9 th
13 th
16 th
Business units grow th
Previous rank (2011)
Carterton District
2012
2007-2
012
Resident population grow th
Employment (FTE) grow th
Real Value Added grow th (GDP)
Business units grow th
Relative openness index
Resident population grow th
Employment (FTE) grow th
Real Value Added grow th (GDP)

15 BERL Regional Rankings Report March 2013
Central Otago was the 13th ranked economy in New
Zealand in 2012. Its ranking was anchored by strong
medium-term business unit (3rd
) and population growth
(10th). However, short-term indicators have dipped
slightly, resulting in a drop of six places from 2011.
Central Otago has a population of 18,100. It employs
10,100 FTEs and generates $810 million in GDP across
3,300 businesses.
GDP growth in 2012 of nine percent was well above the
national average. Its highest ranking was for medium-
term business unit growth, where it was the 3rd fastest.
The District also had consistently high population growth and now has over 18,000 residents. Central Otago had
the 15th fastest growing population in 2012 and the 10
th fastest growing population over the last five years.
Primary sector GDP increased by over 40 percent in 2012. With over 30 percent of the District’s GDP coming from
the primary sector, Central Otago posted a solid GDP performance.
Primary sector industries where employment increased in 2012 included apple and pear, stone fruit growing, sheep
farming, and dairy cattle farming. There were also employment increases in wine manufacturing, construction and
accommodation.
The 14th highest ranking district was from the Deep
South. Southland District improved three spots from
2011, anchored by its top ranking in relative openness. It
also had strong GDP growth in 2012 and has had
relatively strong medium-term employment and GDP
growth.
Southland District has a population of 29,000. It employs
17,100 FTEs and generates $1.7 billion in GDP across
6,800 businesses.
Although employment dropped by 0.3 percent, GDP
growth increased by 10 percent. The strong GDP
performance of the primary sector nationally assisted
Southland’s ranking, particularly as 40 percent of activity in Southland associated to the primary sector.
For a rural area, Southland District has done well in retaining population. After declining steadily to 2007,
population is estimated to be back over 29,000 again. Over the decade, population growth was estimated at 0.2
percent per annum although it has been running at around 0.6 percent per annum for the last four years.
13
th
15 th
25 th
14 th
34 th
39 th
10 th
17 th
16 th
3 rd
7 th
Business units grow th
Previous rank (2011)
Central Otago District
2012
2007-2
012
Resident population grow th
Employment (FTE) grow th
Real Value Added grow th (GDP)
Business units grow th
Relative openness index
Resident population grow th
Employment (FTE) grow th
Real Value Added grow th (GDP)
14
th
17 th
37 th
12 th
27 th
1 st
35 th
15 th
18 th
33 rd
17 th
Business units grow th
Previous rank (2011)
Southland District
2012
2007-2
012
Resident population grow th
Employment (FTE) grow th
Real Value Added grow th (GDP)
Business units grow th
Relative openness index
Resident population grow th
Employment (FTE) grow th
Real Value Added grow th (GDP)

16 BERL Regional Rankings Report March 2013
Figure 4.1. 5-year population map, annual average over medium-term

17 BERL Regional Rankings Report March 2013
Figure 4.2. 5-year FTE map, annual average over medium-term

18 BERL Regional Rankings Report March 2013
Figure 4.3. 5-year GDP map, annual average over medium-term

19 BERL Regional Rankings Report March 2013
5 Regions
The 66 local authorities were grouped into their regional council areas to allow ranking across the 14 regional
council areas. The performance of each region is shown in Table 5.1.
Table 5.1. Regional rankings, 2012
The Auckland supercity retains its crown as the number one region in New Zealand. Taranaki has crept up one
spot to finish in second place, while Southland has made the largest climb of all regions, up five spots to claim third.
The Waikato region, on the back of a strong dairy season climbs three spots to fourth, while Otago region retains its
position and rounds out the top five.
The big fall has been the Bay of Plenty, which has dropped nine places to 11th, an unfamiliar position outside the top
ten. The Wellington region has surprised by climbing three spots, as has Gisborne. Otherwise there have been
slight movements up and down for the remaining regions. The Manawatu-Wanganui region has cemented its
position, finishing 14th for the second year in a row.
2012 2011
Auckland 1 1 →
Taranaki 2 3 ↑1
Southland 3 8 ↑5
Waikato 4 7 ↑3
Otago 5 5 →
West Coast 6 4 ↓2
Wellington 7 10 ↑3
Canterbury 8 9 ↑1
Nelson/Tasman/Marlborough 9 6 ↓3
Gisborne 10 13 ↑3
Bay of Plenty 11 2 ↓9
Haw ke's Bay 12 11 ↓1
Northland 13 12 ↓1
Manaw atu-Wanganui 14 14 →
source: BERL Regional Database 2012
BERL Region RankingsRank

20 BERL Regional Rankings Report March 2013
While only ranked 20th against local authorities, the
Auckland supercity put up impressive rankings in
2012 when compared to other regions. Out of the 14
regions, Auckland had the fastest employment
growth and the third fastest growth in business units
in 2012. Boundary changes has seen its resident
population ranking drop to sixth, while its GDP growth
was around the mid-point of all regions.
In 2012, Auckland recorded population growth of 0.4
percent, GDP growth of 2.7 percent, and employment
growth of 2.6 percent.
Auckland reported 4.8 percent growth in employment in business services, adding 7,100 jobs, and 3.2 percent
employment growth in social services adding 4,200 jobs. The most interesting statistic is that 15,600 of the 18,500
net increase in FTE jobs nationally were from Auckland.
However, it is the medium-term indicators where the City of Sails really shines. Auckland has the highest ranking
for medium-term population growth (1.3 percent per annum) and business unit growth (0.5 percent per annum).
Auckland’s lowest medium-term rankings were in employment and GDP, where it still claimed the fourth fastest
growth amongst the 14 regions.
Taranaki is made up of New Plymouth, Stratford and South Taranaki. Individually, these local authorities ranked
17th, 21
st and 31
st respectively. Together, their performance was enough to make Taranaki the second best
performing region in the country.
With a strong focus on oil and gas, dairy and meat processing, Taranaki’s economic performance is tied to fuel and
commodity prices. Out of the 14 regions, Taranaki has the highest ratio of export related businesses and has the
fastest growth in GDP over the last five years. Over the medium-term, Taranaki has also had the third fastest
employment and business unit growth.
In 2012, employment in Taranaki increased by 1.1 percent. However, GDP declined by 2.4 percent, largely a result
of a decline in employment in the oil and gas sector where GDP estimates dropped from $1.3 billion in 2011 to $1
billion in 2012.
Over the last five years, Taranaki GDP has increased by 2.2 percent per annum, enough to make it the region with
the strongest GDP growth over the medium-term. Taranaki
employment has increased by 1.1 percent per annum over
the last five years, the third fastest of all regions and more
than twice the 0.5 percent per annum national employment
growth rate. Taranaki has also had consistent growth in new
businesses, ranking third over the medium-term.
1
st
Resident population grow th 6 th
Employment (FTE) grow th 1 st
Real Value Added grow th (GDP) 7 th
Business units grow th 3 rd
Relative openness index 9 th
Resident population grow th 1 st
Employment (FTE) grow th 4 th
Real Value Added grow th (GDP) 4 th
Business units grow th 1 st
Previous rank (2011) 1 st
2012
2007-2
012
Auckland City
2
nd
Resident population grow th 5 th
Employment (FTE) grow th 4 th
Real Value Added grow th (GDP) 14 th
Business units grow th 4 th
Relative openness index 1 st
Resident population grow th 8 th
Employment (FTE) grow th 3 rd
Real Value Added grow th (GDP) 1 st
Business units grow th 3 rd
Previous rank (2011) 3 rd
2012
2007-2
012
Taranaki

21 BERL Regional Rankings Report March 2013
Southland improves five places from last year to squeeze
into the top three. Buoyed by strong performances in GDP
(1st in 2012 and third over the medium-term) and its second
ranking in terms of openness, Southland has taken
advantage of strong returns in the primary sector,
particularly dairy.
The Southland region is made up of Gore, Southland and
Invercargill. These three local authorities ranked individually
11th, 14th and 39
th. Around 47 percent of the region's GDP
is from the primary (20 percent) and manufacturing (27
percent) sectors.
Over the last five years, employment in dairy cattle farming has increased from 2,200 to close to 3,600, a 61 percent
increase. Similarly, employment in cheese and other dairy product manufacturing has increased from 330 FTEs to
570 FTEs, a 71 percent increase.
In 2012, Southland had employment growth of 0.9 percent and GDP growth of 6.4 percent. GDP growth was
anchored by a 28 percent increase in primary sector GDP, which added almost $200 million to the region’s GDP
growth of $267 million.
The region has performed well in employment and GDP over the medium-term, with the 2nd
and 3rd highest growth
rates respectively. The Southland region averaged 1.1 percent employment growth and 1.5 percent GDP growth
over each of the last five years.
The Waikato region has also improved, rising three spots to sit just outside the top three in fourth place. Waikato
has had the fastest population growth in 2012 and the second fastest population growth over the last five years. To
an extent, the short-term result has been inflated through the absorption of part of Franklin District. However,
Hamilton has experienced relatively high levels of population growth in its own right.
The Waikato region is made up of ten districts – Thames-Coromandel, Hauraki, Waikato, Matamata-Piako, Hamilton
City, Waipa, Otorohanga, South Waikato, Waitomo and Taupō. The region has a strong primary sector focus,
particularly in dairy and forestry.
The Waikato region had strong employment and GDP growth, ranking third in both indicators in 2012. Employment
increased by 1.4 percent and GDP increased by 3.4 percent. The region increased employment in the primary
sector by 1,124 FTEs, which resulted in an increase in
primary sector GDP of $429 million.
Over the medium-term, GDP and employment growth has
not been as stellar, with average annual GDP growth of 0.7
percent and average annual employment growth of 0.4
percent. Both of these rates were less than that achieved
nationally.
3
rd
Resident population grow th 9 th
Employment (FTE) grow th 5 th
Real Value Added grow th (GDP) 1 st
Business units grow th 5 th
Relative openness index 2 nd
Resident population grow th 10 th
Employment (FTE) grow th 2 nd
Real Value Added grow th (GDP) 3 rd
Business units grow th 6 th
Previous rank (2011) 8 th
2012
2007-2
012
Southland
4
th
Resident population grow th 1 st
Employment (FTE) grow th 3 rd
Real Value Added grow th (GDP) 3 rd
Business units grow th 7 th
Relative openness index 7 th
Resident population grow th 2 nd
Employment (FTE) grow th 6 th
Real Value Added grow th (GDP) 8 th
Business units grow th 9 th
Previous rank (2011) 7 th
2012
2007-2
012
Waikato

22 BERL Regional Rankings Report March 2013
The Otago region held steady in 5th place in 2012. The
region has done well in terms of population growth, placing
2nd
in 2012 and 3rd over the medium-term. Otago has also
had strong business unit growth, placing 2nd
in 2012 and
over the medium-term.
The Otago region is made up of Queenstown-Lakes, Central
Otago, Clutha and Dunedin City. We also include Waitaki,
although it straddles both the Otago and Canterbury regions.
Three of these districts placed in the top 15 local authority
rankings.
In 2012, the Otago region had a population of 206,000, employed 37,200 FTEs and contributed $7.7 billion in GDP
to the New Zealand economy. The region’s economic activity is spread across primary, manufacturing and tourism
related sectors.
In 2012, the Otago region had population growth of 0.6 percent, GDP growth of 3.1 percent and employment growth
of 0.7 percent.
Over the medium-term, the region still performs well in relation to population and business unit growth. However,
both employment and GDP have grown slower than the national average at 0.2 percent and 0.3 percent
respectively.
The West Coast region dropped two places to 6th in the 2012 rankings, driven by a relatively poor performance in
2012. However, its medium-term performance remains strong, ranking 1st in employment growth and 2
nd in GDP
growth over the last five years.
The West Coast is made up of Buller, Grey and Westland. In 2012, the region had a population of 32,100,
employment of 15,560 FTEs and generated GDP of $1.26 billion. The economy is based around coal mining, dairy
and tourism.
While the dairy sector has performed well, both mining and tourism have dragged the economic performance in
2012 down. Employment increased by 0.6 percent while GDP declined by 0.2 percent.
Over the medium-term, however, the West Coast region has achieved employment growth of 2.4 percent per
annum and GDP growth of 1.5 percent per annum, both well above the national average.
With a falling population, and issues around the mining
sector, it will be interesting to see whether these growth rates
are sustained. Significant declines in employment in arts
and recreation services, retail trade services and
construction may be reflective of the state of the region.
However, with the reliance on mining, dairy and tourism, life
on the Coast has always been cyclical and ‘coasters’ have
built in resilience to ride those cycles.
5
th
Resident population grow th 2 nd
Employment (FTE) grow th 6 th
Real Value Added grow th (GDP) 5 th
Business units grow th 2 nd
Relative openness index 12 th
Resident population grow th 3 rd
Employment (FTE) grow th 8 th
Real Value Added grow th (GDP) 10 th
Business units grow th 2 nd
Previous rank (2011) 5 th
2012
2007-2
012
Otago
6
th
Resident population grow th 12 nd
Employment (FTE) grow th 7 th
Real Value Added grow th (GDP) 12 nd
Business units grow th 6 th
Relative openness index 5 th
Resident population grow th 11 th
Employment (FTE) grow th 1 st
Real Value Added grow th (GDP) 2 nd
Business units grow th 8 th
Previous rank (2011) 4 th
2012
2007-2
012
West Coast

23 BERL Regional Rankings Report March 2013
8
th
Resident population grow th 14 th
Employment (FTE) grow th 2 nd
Real Value Added grow th (GDP) 6 th
Business units grow th 10 th
Relative openness index 8 th
Resident population grow th 9 th
Employment (FTE) grow th 5 th
Real Value Added grow th (GDP) 5 th
Business units grow th 7 th
Previous rank (2011) 9 th
2012
2007-2
012
Canterbury
The Wellington region will surprise many with its
improvement to 7th place in the 2012 rankings. However,
strong business unit growth in 2012 and solid population
growth has helped it move up three places.
The Wellington region is relatively diverse, including Kapiti
Coast, Porirua City, Wellington City, Lower and Upper Hutt.
It then goes over the Rimutaka ranges to include Masterton,
Carterton and South Wairarapa.
This side of the Rimutaka Ranges, Wellington City
dominates, providing a large part of the employment for the
Hutt Valley and up the coast to Porirua and even Kapiti.
The Wellington region has a combined population of around 472,000, employs 226,000 FTEs and generates around
$22.5 billion to New Zealand GDP. In 2012, the Wellington region had 0.5 percent employment growth. However,
employment declined by 0.2 percent and GDP actually declined by 0.7 percent. The positives in the 2012 year
were business unit growth (0.7 percent) and population growth, where it ranked 4th.
Over the medium-term, the region has fared in the top half across most of the indicators. In particular, the region
has consistently created new businesses (4th) and had good population growth (5
th). Its worst ranking over the
medium-term was for GDP growth, where it ranked 9th of the 14 regional councils.
The only caveat around business unit growth was that most of it occurred in the business services sector. This is
not necessarily a bad thing. However, it does suggest that many of the businesses created were contractors
operating as companies in areas such as film production and IT services.
Canterbury region has improved by one placing to 8th in 2012. At a wider regional level, the population growth
cancels itself out. The 14th placing suggests the level of displacement and the movement of people outside of the
Canterbury region. The other short-term indicator to suffer has been business unit growth, where the region ranked
10th.
On a very positive note, Canterbury had the second fastest employment growth in 2012 and strong GDP growth,
where it ranked sixth. In relation to the medium-term, the Canterbury region placed in the top ten in all four
indicators.
In 2012, it is estimated that the Canterbury region population
declined by three percent, dropping back to 535,000 people.
Employment, however, increased by 2.5 percent to 251,400
FTEs and GDP increased by 2.9 percent to $23.6 billion.
Much of the recent growth has been in the construction
sector, with Canterbury one of the few regions that registered
an increase in employment in 2012. Employment in
construction increased by over 5,000 FTEs, or 22 percent, in
2012. This growth is expected to continue as the rebuild
gains momentum.
7
th
Resident population grow th 4 th
Employment (FTE) grow th 8 th
Real Value Added grow th (GDP) 13 th
Business units grow th 1 st
Relative openness index 13 th
Resident population grow th 5 th
Employment (FTE) grow th 7 th
Real Value Added grow th (GDP) 9 th
Business units grow th 4 th
Previous rank (2011) 10 th
2012
2007-2
012
Wellington

24 BERL Regional Rankings Report March 2013
The ‘top of the south’, consisting of Nelson, Tasman and
Marlborough placed 9th in 2012, down three from their 6
th
placing in 2011. Despite having the worst employment
growth of all the regions, the ‘top of the south’ is still
considered one of the best places to live. The
Nelson/Tasman/Marlborough region had the third fastest
population growth in 2012 and has had the 4th fastest rate of
population growth over the last five years.
The region has a population of 137,000 people. It
contributed 44,000 FTE jobs and generated GDP of $6
billion through 18,800 businesses in 2012. The economy
has a strong export focus around horticulture – pipfruit and grapes, forestry, and seafood/aquaculture. There is also
a growing manufacturing sector, particularly around further processing of primary products. This export focus is
complemented by solid population growth, which has supported population based sectors such as arts and
recreation and social services.
In 2012, the region had population growth of 0.6 percent and GDP growth of 1.0 percent. FTE jobs declined by 2.4
percent, which is a large retrenchment in economic activity. The decline in employment was in all industries apart
from manufacturing. In particular, close to 1,000 jobs were lost in the primary sector and a further 540 jobs were
lost in the construction sector.
Over the medium-term there has been solid growth in both population and business units. However, the region is in
the bottom four in employment (10th) and GDP (13
th).
The Gisborne region improved three places to rank 10th in 2012. The Gisborne region is made up of Gisborne and
Wairoa. In 2012, the region had the second fastest GDP growth of all regions. It also had the 7th fastest population
growth and ranked 4th on the relative openness index.
One of the smallest regional economies in New Zealand, Gisborne had a population of 53,100, employed 21,700
FTEs and generated $1.9 billion in GDP through 5,900 businesses in 2012. The primary sector accounted for
around a quarter of employment and a third of all businesses.
In 2012, the region’s population is estimated to have declined by 0.2 percent and employment fell by 2.5 percent.
On the other hand, GDP increased by 2.9 percent, driven by a 23 percent increase in primary sector GDP. The
Region lost 190 jobs in the primary sector, 150 jobs in the social services sector and 120 in both the manufacturing
and wholesale/distribution sector. It was one of the few
sectors with an increase in construction employment, which
was specifically in the heavy and civil engineering area.
Over the medium-term GDP has been the Gisborne region’s
best indicator, where it ranked 7th, in the middle of the field.
However, it was in the bottom four in the other three
medium-term measures. The Gisborne region has had the
second slowest employment growth and the third slowest
population growth out of the 14 regions.
9
th
Resident population grow th 3 rd
Employment (FTE) grow th 14 th
Real Value Added grow th (GDP) 10 th
Business units grow th 8 th
Relative openness index 3 rd
Resident population grow th 4 th
Employment (FTE) grow th 10 th
Real Value Added grow th (GDP) 13 th
Business units grow th 5 th
Previous rank (2011) 6 th
Nelson/Tasman/
Marlborough
2012
2007-2
012
10
th
Resident population grow th 7 th
Employment (FTE) grow th 11 th
Real Value Added grow th (GDP) 2 nd
Business units grow th 14 th
Relative openness index 4 th
Resident population grow th 12 th
Employment (FTE) grow th 13 th
Real Value Added grow th (GDP) 7 th
Business units grow th 11 th
Previous rank (2011) 13 th
2012
2007-2
012
Gisborne

25 BERL Regional Rankings Report March 2013
The Bay of Plenty placed 11th in 2012 and had the largest
decline of all regions, dropping from 2nd
in 2011. This large
drop is worrying considering the inclusion of medium-term
indicators in the methodology. The region struggled across
all indicators in 2012, even population, where the growth in
Tauranga and Western Bay of Plenty tends to dominate.
The Bay of Plenty region is made up of six local authorities,
Tauranga, Western Bay of Plenty, Rotorua, Whakatāne,
Kawerau and Ōpōtiki. It has a population of 272,000,
employs 108,000 FTEs and generates $9.7 billion in GDP
through 33,600 businesses. There were declines in rankings
across all local authorities apart from Kawerau, which improved by two places.
In 2012, population growth was stagnant at 0.01 percent and employment declined by 1.8 percent. On a positive,
GDP increased by 1.3 percent. Especially hard hit was the primary sector, where employment declined by close to
1,700 FTEs; and construction, where there were 570 FTE jobs lost. There was a positive in that an additional 751
jobs were added in the wholesale and distribution sector.
We expect that the turnaround from last year is the impact of the PSA virus on the Kiwifruit industry. The Western
Bay of Plenty district fell 40 places in the local authority rankings and registered a loss of over 1,000 FTE jobs in the
agriculture and agriculture support services.
The medium-term performance is better, with top six placings in population and GDP. However, the fall in
employment growth to 9th, and the slow business unit growth at 12
th, are concerning.
The Hawke’s Bay region ranked 12th in 2012, one place lower than in 2011. The region has the second slowest
rate of population growth in the latest year and over the medium-term. It also ranks low in medium-term
employment and GDP (both 12th) and medium-term business units growth (10
th).
The Hawke’s Bay region is made up of Hastings, Napier and Central Hawkes Bay. It has a population of 142,000,
employs 66,400 FTEs and generates $5.8 billion through 17,000 businesses. The region has a relatively strong
export focus, ranking 6th on the relative openness index. Around 30 percent of employment and close to 40 percent
of GDP is in the primary and manufacturing sectors.
In 2012, the region had a 0.1 percent decline in population and a 0.2 percent decline in employment. This was
contrasted by a 3.7 percent increase in GDP. While employment in the primary sector fell by 950 FTEs and
construction by 290 FTEs, there was an increase of 680
FTEs in manufacturing and 395 in business services, both
high value-add sectors. Much of the manufacturing increase
was in food product manufacturing.
Over the medium-term, the Hawke’s Bay has struggled
relative to the rest of the regions in New Zealand. Hawke’s
Bay had the second slowest rate of population growth and
the third slowest rate of employment and GDP growth.
11
th
Resident population grow th 11 th
Employment (FTE) grow th 12 th
Real Value Added grow th (GDP) 9 th
Business units grow th 11 th
Relative openness index 10 th
Resident population grow th 6 th
Employment (FTE) grow th 9 th
Real Value Added grow th (GDP) 6 th
Business units grow th 12 th
Previous rank (2011) 2 nd
2012
2007-2
012
Bay of Plenty
12
th
Resident population grow th 13 th
Employment (FTE) grow th 9 th
Real Value Added grow th (GDP) 4 th
Business units grow th 9 th
Relative openness index 6 th
Resident population grow th 13 th
Employment (FTE) grow th 12 th
Real Value Added grow th (GDP) 12 th
Business units grow th 10 th
Previous rank (2011) 11 th
2012
2007-2
012
Hawke's Bay

26 BERL Regional Rankings Report March 2013
Northland ranked 13th out of the 14 regions in 2012, down
one from 2011, when it ranked 12th. The positive indicator
has been population growth, where it ranks 8th in 2012 and
7th over the last five years.
Northland is made up of three local authorities, Far North,
Kaipara and Whangarei. The region has a population of
154,000. It employs 52,800 FTEs and generates $4.8 billion
through 19,800 businesses.
In 2012, the Northland region had population growth of 0.1
percent, and GDP growth of 1.9 percent. Employment fell by
1.4 percent. Interestingly, the employment losses were in retail trade and services (455 FTEs), business services
(270 FTEs), social services (229 FTEs) and, probably more expected, construction (219 FTEs). There is a strong
social services sector in the region, accounting for 27 percent of employment.
Over the medium-term, population growth stood out. We expect that this is related to strong growth in Auckland,
with growth likely along the southern boundary. Population in Kaipara and the Far North has been relatively slow
over the last few years.
The Manawatu-Wanganui region remains in 14th place in 2012. The latest year rankings suggest some positive
movement, albeit slight. The region ranked 10th in resident population growth, 11
th in GDP growth, 12
th in business
unit growth and 12th in employment growth. This is in contrast to its medium-term performance, where it ranks 14
th
on all measures apart from business unit growth, where it is 13th.
The Manawatu-Wanganui region is made up of seven local authorities – Ruapehu, Wanganui and Rangitikei in the
north; and Manawatu, Palmerston North and Horowhenua in the south. Across the Rangitikei ranges is the Tararua
District.
The Manawatu-Wanganui region has a population of 225,000, employs, 94,600 FTEs, and generates $8 billion
through 25,000 businesses.
In 2012, the Manawatu-Wanganui region had a very slight increase in population, and a 0.6 percent increase in
GDP. Employment declined by 2.0 percent. The region’s construction and social services sectors were particularly
hard hit, with 880 FTE job losses in construction and 840 FTE job losses in social services.
As noted earlier, over the medium-term, there is not much
on a positive note to relate. The region has the slowest
population, employment and GDP growth and the second
slowest business unit growth of all the regions.
Employment has declined, on average by 0.6 percent. GDP
has been stagnant over the last five years. Population has
averaged 0.2 percent growth.
13
th
Resident population grow th 8 th
Employment (FTE) grow th 10 th
Real Value Added grow th (GDP) 8 th
Business units grow th 13 th
Relative openness index 11 th
Resident population grow th 7 th
Employment (FTE) grow th 11 th
Real Value Added grow th (GDP) 11 th
Business units grow th 14 th
Previous rank (2011) 12 th
2012
2007-2
012
Northland
14
th
Resident population grow th 10 th
Employment (FTE) grow th 13 th
Real Value Added grow th (GDP) 11 th
Business units grow th 12 th
Relative openness index 14 th
Resident population grow th 14 th
Employment (FTE) grow th 14 th
Real Value Added grow th (GDP) 14 th
Business units grow th 13 th
Previous rank (2011) 14 th
2012
2007-2
012
Manawatu-Wanganui

27 BERL Regional Rankings Report March 2013
6 Cities
The importance of cities to economic growth and cultural, environmental and social wellbeing is well documented.
In general, cities concentrate infrastructure and activity, resulting in reduced prices, accessible markets, improved
networks, diversity, technology transfer, innovation, and the “buzz” that attracts ambitious people. Well-functioning
cities will result in improved economic growth outcomes.
Of the 66 local authorities, we have included 20 into our city rankings. These differ from the ‘official’ defined cities in
New Zealand to include what we consider the 20 largest settlements in New Zealand. Unfortunately, data is not
available at the city level. Auckland, for example, has four unique settlements that would be included as separate
cities were they not combined into a single ‘supercity’.
Table 6.1. City rankings, 2012
Smaller cities, New Plymouth and Timaru, sit at the top of the city rankings in 2012. New Plymouth has made the
giant leap into first from second, while Timaru has climbed four spots to take second.
Auckland and Hamilton retain their third and fifth places from last year, while Wellington jumps five spots to take
fourth.
There have been strong improvements from Blenheim and Gisborne, both improving by eight positions. The largest
declines were in Tauranga and Rotorua, who both dropped five places.
2012 2011
New Plymouth 1 2 ↑1
Timaru 2 6 ↑4
Auckland 3 3 →
Wellington 4 9 ↑5
Hamilton 5 5 →
Tauranga 6 1 ↓5
Blenheim 7 15 ↑8
Nelson 8 4 ↓4
Invercargill 9 11 ↑2
Gisborne 10 18 ↑8
Porirua 11 7 ↓4
Hastings 12 8 ↓4
Whangarei 13 13 →
Napier 14 10 ↓4
Dunedin 15 14 ↓1
Low er Hutt 16 19 ↑3
Rotorua 17 12 ↓5
Palmerston North 18 16 ↓2
Christchurch 19 20 ↑1
Upper Hutt 20 17 ↓3
rankBERL City Rankings

28 BERL Regional Rankings Report March 2013
New Plymouth, the main settlement for the Taranaki region
has taken the important step from bridesmaid to bride, taking
first in 2012. This has been a long time coming, with strong
medium-term performances in employment, GDP and
business unit growth.
New Plymouth has a population of 72,000. It employs
34,500 FTEs and generates GDP of $3.8 billion through
8,800 businesses.
With strong oil and gas, dairy and food manufacturing
employment in its own right, the City provides key services to these industries throughout the region. In particular,
there is a focused engineering group that supports both the energy and the dairy sectors. The city has a strong
export focus ranking 3rd on the relative openness index. Port Taranaki is a key asset based in the city, which
supports the oil and gas industry alongside other bulk commodity goods.
In 2012, New Plymouth had population growth of 0.5 percent, and employment growth of 0.3 percent. New
Plymouth's GDP declined by 3.9 percent, although this can be put down to a lower return on oil activity and exports
following stellar growth in that industry in 2011. In particular, New Plymouth added 200 FTE jobs in manufacturing,
and a further 160 FTE jobs in the primary sector.
Over the medium-term, New Plymouth has been the strongest performer of all the cities, ranking first in employment
and second in GDP and business unit growth. New Plymouth has averaged employment growth of 1.6 percent per
annum over the last five years, which is twice the rate nationally.
The area where New Plymouth has struggled is population growth where its medium-term ranking is 10th out of the
20 cities. However, its 2012 ranking of 8th suggests that there is likely to be improvement there. This improvement
is being driven by the availability of high paying jobs as well as improving awareness, nationally and internationally,
of the liveability of the city and region.
Timaru jumps four spots to take second ranking in 2012. Timaru has a similar ranking profile to Taranaki in that it is
export focused and has strong medium-term employment and GDP growth. However, it has had a much better
short game than Taranaki, ranking 2nd
and 3rd in 2012 in employment and GDP respectively.
Timaru is the smallest city in the top five, with a population of 44,000. It employs 21,000 FTEs and generates $2.1
billion in GDP through 5,300 businesses. Timaru is the main service centre for the South Canterbury region. There
has been an improvement in short-term population growth, where Timaru ranks 9th compared to its 15
th ranking in
the medium-term. As with most population improvements in the central south island, this is likely at the expense of
Christchurch.
In 2012, Timaru had strong GDP growth of 3.5 percent, and
employment growth of 1.6 percent. This was alongside
population growth of 0.5 percent.
Averaging a solid 3.3 percent per annum over the last five
years, Timaru has the fastest GDP growth of all twenty cities
ranked.
1
st
Resident population grow th 8 th
Employment (FTE) grow th 7 th
Real Value Added grow th (GDP) 18 th
Business units grow th 3 rd
Relative openness index 3 rd
Resident population grow th 10 th
Employment (FTE) grow th 1 st
Real Value Added grow th (GDP) 2 nd
Business units grow th 2 nd
Previous rank (2011) 2 nd
New Plymouth District
2007-2
012
2012
2
nd
Resident population grow th 9 th
Employment (FTE) grow th 2 nd
Real Value Added grow th (GDP) 3 rd
Business units grow th 12 th
Relative openness index 2 nd
Resident population grow th 15 th
Employment (FTE) grow th 2 nd
Real Value Added grow th (GDP) 1 st
Business units grow th 7 th
Previous rank (2011) 6 th
Timaru District
2007-2
012
2012

29 BERL Regional Rankings Report March 2013
Auckland City retains its third placing from 2011. The
supercity had the fastest employment growth rate of the 20
cities ranked. Its medium-term performance was also top
shelf ranking second for population growth, 4th for
employment and GDP growth, and 5th for business unit
growth. Were it not for its 11th placing in population growth,
we may have seen Auckland place higher.
Auckland City has a population of 1.43 million, making it the
largest city in New Zealand by far. It employs 619,000 FTEs
and generates close to $63 billion in GDP through 161,000 businesses.
In 2012, Auckland City had population growth of 0.4 percent, employment growth of 2.6 percent, and GDP growth of
2.7 percent. Population growth was down due to the City losing a portion of its southern constituency, Franklin, with
the formation of the supercity. Notwithstanding that, Auckland City has the second fastest medium-term population
growth, adding close to 100,000 people over the last five years. To put this into context, the new residents added
over the last five years in Auckland is equivalent to 1.5 times the total current population of New Plymouth and more
than twice the current population of Timaru.
Over the medium-term, Auckland City had population growth of 1.4 percent per annum, employment growth of 1.2
percent per annum and GDP growth of 1.8 percent per annum. This was enough to rank it 2nd
, 4th and 4
th against
the other 19 cities on those indicators.
Wellington City had defied the public sector cutbacks and bulldozed its way to 4th, an improvement of five places
from 2011. In 2012, Wellington City, the “coolest little capital
in the world” had the second fastest population growth and
business unit growth and the 4th fastest employment growth
of all the cities. Over the medium-term it placed 3rd on
employment and GDP growth, 4th on population growth and
6th on business unit growth.
Wellington City has a population of 193,000. It employs
134,000 FTEs and generates $14.6 billion in GDP through
25,000 businesses. The high FTE to population ratio is a
result of a large proportion of employees coming from the
wider Wellington region. This is supported by excellent (relative) public transport and road links into and out of the
capital.
In 2012, Wellington City had population growth of 1.0 percent, and employment growth of 1.5 percent. GDP
declined by 0.3 percent. With only 0.3 percent of employment related to the primary sector, the City missed out on
the GDP surge associated with the primary sector’s performance.
Contrary to all the discussion around public sector cutbacks, the construction sector was where most jobs were lost
with a decline of 350 FTEs. The numbers suggest that the central government administration actually added 590
employees in 2012.
Over the medium-term, Wellington City’s population has grown by 1.2 percent per annum. Employment has
increased by 1.1 percent per annum and GDP has averaged 1.3 percent growth.
3
rd
Resident population grow th 11 th
Employment (FTE) grow th 1 st
Real Value Added grow th (GDP) 5 th
Business units grow th 5 th
Relative openness index 8 th
Resident population grow th 2 nd
Employment (FTE) grow th 4 th
Real Value Added grow th (GDP) 4 th
Business units grow th 5 th
Previous rank (2011) 3 rd
Auckland City
2007-2
012
2012
4
th
Resident population grow th 2 nd
Employment (FTE) grow th 4 th
Real Value Added grow th (GDP) 13 th
Business units grow th 2 nd
Relative openness index 9 th
Resident population grow th 4 th
Employment (FTE) grow th 3 rd
Real Value Added grow th (GDP) 3 rd
Business units grow th 6 th
Previous rank (2011) 9 th
Wellington City
2007-2
012
2012

30 BERL Regional Rankings Report March 2013
Hamilton City held on to its 5th ranking, despite poor short-
term results for GDP and business unit growth. Its 1st
placing in both short and medium-term population growth
was helped in the short-term by a re-zoning of the Franklin
District and over the medium-term by its proximity and
improved links into Auckland.
Hamilton City has a population approaching 143,000,
employs 72,500 FTEs and generates $6.6 billion through
13,100 businesses.
In 2012, Hamilton City had population growth of 2.0 percent, employment growth of 1.2 percent and no growth in
GDP. The fact that much of its relationship to the agriculture sector is related to supporting services rather than
production means the high GDP return experienced by the primary sector did not flow through into the Hamilton City
numbers.
Over the medium-term, Hamilton City had population growth of 1.6 percent. However, GDP declined by 0.4 percent
per annum and employment by 0.2 percent per annum. Thus much of the employment growth has been related to
population rather than industry.
Tauranga City tumbled from top spot down to 6th in 2012. This was largely the result of poor 2012 performances in
employment, GDP and business unit growth.
Tauranga City has a population approaching 113,000. It
employs 48,500 FTEs and generates $4.3 billion through
13,400 businesses.
In 2012, Tauranga City had population growth of 0.9 percent
and GDP growth of 0.5 percent, while employment dropped
by 0.1 percent.
Over 600 jobs were shed in the primary sector, with a further
220 jobs lost in manufacturing. On a positive note, 540
wholesale and distribution jobs and 450 social services jobs were created.
Over the last five years, Tauranga City’s population has increased by 1.3 percent per annum. Employment has
increased by 0.5 percent and GDP by 1.0 percent per annum.
5
th
Resident population grow th 1 st
Employment (FTE) grow th 5 th
Real Value Added grow th (GDP) 12 th
Business units grow th 9 th
Relative openness index 15 th
Resident population grow th 1 st
Employment (FTE) grow th 10 th
Real Value Added grow th (GDP) 14 th
Business units grow th 8 th
Previous rank (2011) 5 th
Hamilton City
2007-2
012
2012
6
th
Resident population grow th 4 th
Employment (FTE) grow th 9 th
Real Value Added grow th (GDP) 10 th
Business units grow th 11 th
Relative openness index 14 th
Resident population grow th 3 rd
Employment (FTE) grow th 6 th
Real Value Added grow th (GDP) 7 th
Business units grow th 13 th
Previous rank (2011) 1 st
Tauranga City
2007-2
012
2012

31 BERL Regional Rankings Report March 2013
Marlborough jumped eight places to rank 7th in 2012. This
was largely around strong growth in short-term GDP and
being the most open city in terms of the relative openness
index.
Marlborough has a population approaching 45,000. It
employs 20,600 FTEs and generates $2 billion through 6,800
businesses.
In 2012, Marlborough had population growth of 0.2 percent
and GDP growth of 2.7 percent. Employment, however,
declined by 3.4 percent, mainly in the primary and construction sectors.
Over the medium-term, Marlborough had population growth of 0.8 percent per annum. However, both employment
and GDP have been declining, averaging -1.1 percent and -0.4 percent per annum respectively.
Nelson dropped four places to rank 8th in 2012. The city had
strong population growth and scored well on the openness
index. However, poor short-term employment and GDP
performance resulted in its slide.
Nelson has a population of 45,000. It employs 23,400 FTEs,
generates GDP of $2.3 billion through 5,600 businesses.
In 2012, Nelson’s population grew by 0.9 percent.
Employment declined by 1.7 percent and GDP declined by
3.1 percent. Employment declined by 405 FTEs. In
particular, employment in wholesale and distribution declined by close to 300 FTEs, social services fell by 255 FTEs
and construction fell by 206 FTEs. This was offset by 280 additional FTEs in manufacturing and 90 in the retail
trade and services sector.
Invercargill climbed two places to rank 9th in 2012. This
was driven by strong growth in employment and GDP over
the short and medium-term. If they could attract more
people they would rank much higher up the list.
Invercargill has a population of 51,600. It employs 24,900
FTEs and generates $2.2 billion in GDP through 4,800
businesses.
In 2012, population fell by 0.2 percent. Employment and
GDP increased by 1.0 and 3.4 percent respectively. There
was a significant increase in employment in the wholesale and distribution sector of 225 FTEs.
7
th
Resident population grow th 13 th
Employment (FTE) grow th 18 th
Real Value Added grow th (GDP) 6 th
Business units grow th 10 th
Relative openness index 1 st
Resident population grow th 11 th
Employment (FTE) grow th 19 th
Real Value Added grow th (GDP) 13 th
Business units grow th 14 th
Previous rank (2011) 15 th
Marlborough District
2007-2
012
2012
8
th
Resident population grow th 5 th
Employment (FTE) grow th 16 th
Real Value Added grow th (GDP) 17 th
Business units grow th 15 th
Relative openness index 6 th
Resident population grow th 6 th
Employment (FTE) grow th 7 th
Real Value Added grow th (GDP) 18 th
Business units grow th 4 th
Previous rank (2011) 4 th
Nelson City
2007-2
012
2012
9
th
Resident population grow th 17 th
Employment (FTE) grow th 6 th
Real Value Added grow th (GDP) 4 th
Business units grow th 16 th
Relative openness index 13 th
Resident population grow th 14 th
Employment (FTE) grow th 5 th
Real Value Added grow th (GDP) 6 th
Business units grow th 11 th
Previous rank (2011) 11 th
Invercargill City
2007-2
012
2012

32 BERL Regional Rankings Report March 2013
Gisborne was the 10th ranked city in 2012, up eight spots
from 2011. The City had the strongest growth in GDP in
2012 and ranked 4th out of all cities on the openness index.
Also supporting Gisborne’s position was strong medium-term
GDP growth.
Gisborne has a population of 45,000. It employs 18,700
FTEs and generates $1.7 billion in GDP through 4,900
businesses.
In 2012, Gisborne’s population increased by 0.2 percent, its
GDP increased by a stellar 4.1 percent, whereas employment declined by 1.5 percent.
Porirua City chimed in at 11th in 2012, down from its 7
th
placing in 2011. Porirua had the fastest business unit growth
in 2012 and over the last five years. However, its
employment and GDP growth performance is near the bottom
on both employment and GDP.
Porirua City has a population approaching 51,000. It employs
13,400 FTEs and generates GDP of $1.1 billion through 4,000
businesses.
In 2012, Porirua had population growth of 0.6 percent.
However, employment declined by 6.2 percent and GDP fell by 4.9 percent.
Hastings dropped four places to rank 12th in 2012. Hastings
had the second fastest GDP growth and the 8th fastest
employment growth, in 2012. However, it performs poorly in
relation to population and business unit growth. Further, its
medium-term performance has been less than average.
Hastings has a population of 73,000. It employs 37,200
FTEs and generates $3.2 billion in GDP across 8,900
businesses.
In 2012, Hastings population and employment did not
change. However, it had a 3.8 percent increase in GDP.
.
10
th
Resident population grow th 14 th
Employment (FTE) grow th 14 th
Real Value Added grow th (GDP) 1 st
Business units grow th 17 th
Relative openness index 4 th
Resident population grow th 16 th
Employment (FTE) grow th 15 th
Real Value Added grow th (GDP) 8 th
Business units grow th 16 th
Previous rank (2011) 18 th
Gisborne District
2007-2
012
2012
11
th
Resident population grow th 7 th
Employment (FTE) grow th 20 th
Real Value Added grow th (GDP) 19 th
Business units grow th 1 st
Relative openness index 20 th
Resident population grow th 7 th
Employment (FTE) grow th 18 th
Real Value Added grow th (GDP) 17 th
Business units grow th 1 st
Previous rank (2011) 7 th
Porirua City
2007-2
012
2012
12
th
Resident population grow th 15 th
Employment (FTE) grow th 8 th
Real Value Added grow th (GDP) 2 nd
Business units grow th 18 th
Relative openness index 5 th
Resident population grow th 13 th
Employment (FTE) grow th 11 th
Real Value Added grow th (GDP) 12 th
Business units grow th 18 th
Previous rank (2011) 8 th
Hastings District
2007-2
012
2012

33 BERL Regional Rankings Report March 2013
7 Appendix - Economic Indicators – what are they?
As outlined before there are five indicators measured over the short and medium-term. The definitions are given in
the table below.
Economic Indicator Definition
Resident population Population living in a particular area. Areas are based on Statistics New Zealand Census
Area Unit Boundaries.
GDP GDP stands for Gross Domestic Product, and measures the total value contributed by the
activities of all businesses and organisations in the region. In theory it is equal to the
value of the output of business (i.e. sales or turnover) less purchases from other
businesses of goods and services used in production. In practice, GDP is akin to the
sum of wages, salaries, profits and operating surplus arising from all economic activity in
the industry and/or region.
Business unit A business unit is a separate operating unit engaged in New Zealand in one, or
predominantly one, kind of economic activity from a single physical location or base.
FTE Employment Measured as the number of employed persons – but in terms of full-time equivalents
(FTEs), such that two part-time employed persons is counted as one full-time person.
Relative Openness Index The BERL Relative Openness Index reflects the composition of the economic activity in a
district/region. It measures the proportion of an area’s GDP that is accounted for by
sectors open to competition from abroad, compared with that proportion nationally.
Sectors in the index include all of the primary and manufacturing industries, as well as
accommodation, transport, communications and business services activities.
A higher rank on this measure indicates an area whose economy is more oriented
towards internationally competitive activities, relative to areas with a domestic market
focus.
Each of these indicators reflects the economic performance of a geographic area. In particular, they reflect the
attractiveness of a place to live (population), its ability to sustain its population (GDP, business units and
employment), and the size of its non population based activity (Relative Openness Index).

34 BERL Regional Rankings Report February 2013
8 Appendix – Local authority ranking by measure
Figure 8.1. Short-term measures – Population
-4.0 -3.0 -2.0 -1.0 0.0 1.0 2.0 3.0 4.0 5.0
Hauraki District
Selwyn District
Hamilton City
Hurunui District
Queenstown-Lakes District
Ashburton District
Waikato District
Waimakariri District
Wellington City
Carterton District
Mackenzie District
Palmerston North City
Tauranga City
Nelson City
Central Otago District
Dunedin City
Southland District
Stratford District
Total New Zealand (Region)
Tasman District
Manawatu District
Taupo District
Porirua City
New Plymouth District
Buller District
Timaru District
Waimate District
Whangarei District
Auckland
Horowhenua District
Otorohanga District
Upper Hutt City
Waipa District
Marlborough District
Gisborne District
Kapiti Coast District
Waitaki District
Hastings District
Thames-Coromandel District
Matamata-Piako District
Napier City
South Taranaki District
Masterton District
Far North District
Invercargill City
Kaipara District
Rotorua District
Lower Hutt City
Whakatane District
South Wairarapa District
Grey District
Gore District
South Waikato District
Kawerau District
Westland District
Wanganui District
Tararua District
Western Bay of Plenty District
Waitomo District
Central Hawke's Bay District
Clutha District
Christchurch City
Rangitikei District
Kaikoura District
Ruapehu District
Wairoa District
Opotiki District
Resident population growth
source: BERL Regional Database 2012
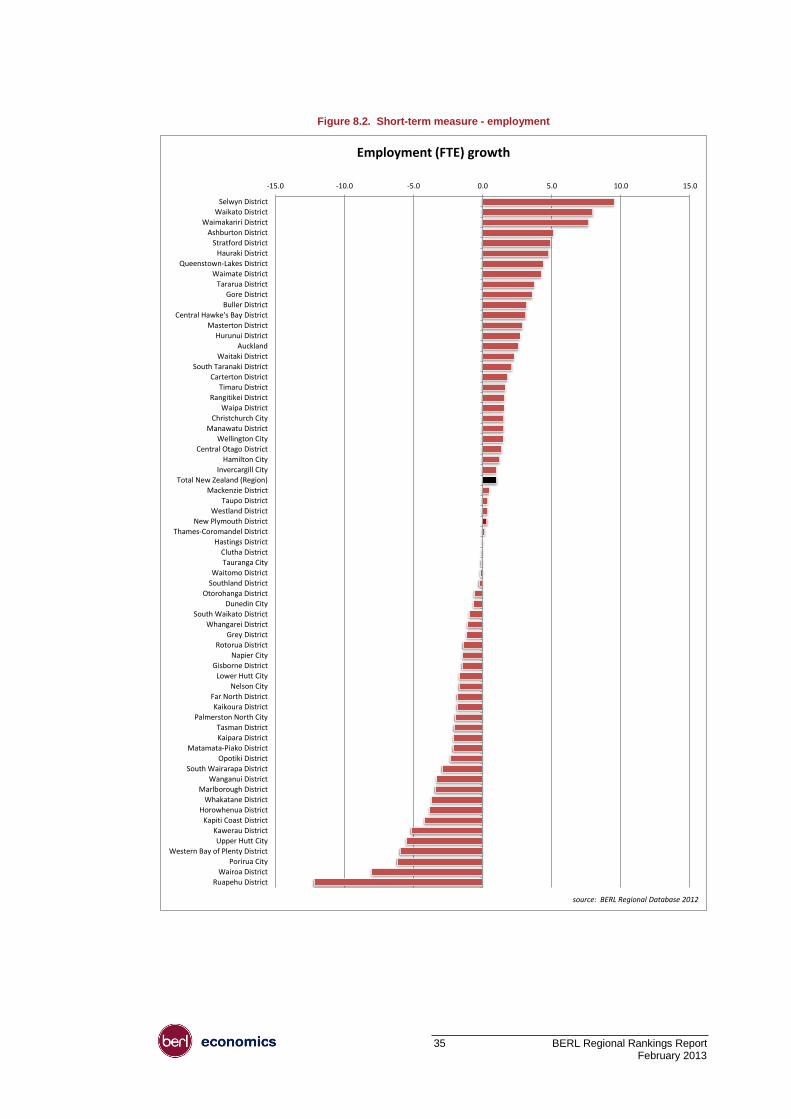
35 BERL Regional Rankings Report February 2013
Figure 8.2. Short-term measure - employment
-15.0 -10.0 -5.0 0.0 5.0 10.0 15.0
Selwyn District
Waikato District
Waimakariri District
Ashburton District
Stratford District
Hauraki District
Queenstown-Lakes District
Waimate District
Tararua District
Gore District
Buller District
Central Hawke's Bay District
Masterton District
Hurunui District
Auckland
Waitaki District
South Taranaki District
Carterton District
Timaru District
Rangitikei District
Waipa District
Christchurch City
Manawatu District
Wellington City
Central Otago District
Hamilton City
Invercargill City
Total New Zealand (Region)
Mackenzie District
Taupo District
Westland District
New Plymouth District
Thames-Coromandel District
Hastings District
Clutha District
Tauranga City
Waitomo District
Southland District
Otorohanga District
Dunedin City
South Waikato District
Whangarei District
Grey District
Rotorua District
Napier City
Gisborne District
Lower Hutt City
Nelson City
Far North District
Kaikoura District
Palmerston North City
Tasman District
Kaipara District
Matamata-Piako District
Opotiki District
South Wairarapa District
Wanganui District
Marlborough District
Whakatane District
Horowhenua District
Kapiti Coast District
Kawerau District
Upper Hutt City
Western Bay of Plenty District
Porirua City
Wairoa District
Ruapehu District
Employment (FTE) growth
source: BERL Regional Database 2012

36 BERL Regional Rankings Report February 2013
Figure 8.3. Short-term measure – GDP
-10.0 -5.0 0.0 5.0 10.0 15.0 20.0
Waimate District
Central Hawke's Bay District
Selwyn District
Tararua District
Stratford District
Hurunui District
Hauraki District
Mackenzie District
Ashburton District
Waikato District
Rangitikei District
Southland District
Otorohanga District
Central Otago District
Waipa District
Clutha District
Waitaki District
Gore District
Waimakariri District
Manawatu District
South Wairarapa District
South Waikato District
Masterton District
Carterton District
Queenstown-Lakes District
Opotiki District
Tasman District
Western Bay of Plenty District
Gisborne District
Kaipara District
Hastings District
Taupo District
Timaru District
Waitomo District
Invercargill City
Kaikoura District
Auckland
Marlborough District
Matamata-Piako District
Total New Zealand (Region)
Whangarei District
Rotorua District
Westland District
Far North District
Christchurch City
Tauranga City
Napier City
Hamilton City
Thames-Coromandel District
Buller District
Horowhenua District
Wellington City
Whakatane District
Dunedin City
Grey District
Wanganui District
Lower Hutt City
South Taranaki District
Kawerau District
Kapiti Coast District
Palmerston North City
Nelson City
Wairoa District
New Plymouth District
Porirua City
Upper Hutt City
Ruapehu District
Real Value Added growth (GDP)
source: BERL Regional Database 2012

37 BERL Regional Rankings Report February 2013
Figure 8.4. Short-term measure – business units
-4.0 -3.0 -2.0 -1.0 0.0 1.0 2.0 3.0
Porirua City
Gore District
Buller District
Queenstown-Lakes District
Selwyn District
Waimate District
Whakatane District
Otorohanga District
Waimakariri District
Masterton District
Ashburton District
Waitaki District
Wellington City
New Plymouth District
Lower Hutt City
Kaipara District
Hauraki District
Auckland
Upper Hutt City
Dunedin City
Clutha District
Kapiti Coast District
Napier City
Hurunui District
Mackenzie District
Hamilton City
Southland District
Marlborough District
Total New Zealand (Region)
Tauranga City
Waipa District
Tasman District
Thames-Coromandel District
Stratford District
Central Otago District
Timaru District
Palmerston North City
Matamata-Piako District
Tararua District
Central Hawke's Bay District
South Waikato District
South Taranaki District
Rotorua District
Grey District
Waikato District
Nelson City
South Wairarapa District
Taupo District
Invercargill City
Kaikoura District
Gisborne District
Carterton District
Hastings District
Opotiki District
Rangitikei District
Whangarei District
Wairoa District
Horowhenua District
Wanganui District
Manawatu District
Far North District
Waitomo District
Westland District
Ruapehu District
Christchurch City
Kawerau District
Western Bay of Plenty District
Business units growth
source: BERL Regional Database 2012

38 BERL Regional Rankings Report February 2013
Figure 8.5. Medium-term measure – population
-1.5 -1.0 -0.5 0.0 0.5 1.0 1.5 2.0 2.5 3.0 3.5
Selwyn District
Queenstown-Lakes District
Waimakariri District
Hamilton City
Waikato District
Ashburton District
Auckland
Tauranga City
Hurunui District
Central Otago District
Hauraki District
Wellington City
Carterton District
Palmerston North City
Tasman District
Nelson City
Total New Zealand (Region)
Western Bay of Plenty District
Porirua City
Waipa District
Mackenzie District
Whangarei District
Upper Hutt City
Kapiti Coast District
New Plymouth District
Marlborough District
Manawatu District
Dunedin City
Waimate District
South Wairarapa District
Kaipara District
Hastings District
Matamata-Piako District
Invercargill City
Westland District
Southland District
Taupo District
Timaru District
Buller District
Grey District
Gisborne District
Masterton District
Napier City
Stratford District
Lower Hutt City
Otorohanga District
Kaikoura District
Far North District
Rotorua District
Waitaki District
Clutha District
Thames-Coromandel District
Central Hawke's Bay District
Horowhenua District
South Taranaki District
Whakatane District
Gore District
Waitomo District
Christchurch City
South Waikato District
Wanganui District
Tararua District
Kawerau District
Rangitikei District
Opotiki District
Ruapehu District
Wairoa District
Resident population growth, 2006-2011
source: BERL Regional Database 2012

39 BERL Regional Rankings Report February 2013
Figure 8.6. Medium-term measure – employment
-6.0 -4.0 -2.0 0.0 2.0 4.0 6.0
Buller District
Selwyn District
Waikato District
Ashburton District
Waimate District
Waimakariri District
Hauraki District
Waipa District
Hurunui District
Waitaki District
Manawatu District
Grey District
Mackenzie District
Carterton District
Southland District
Central Hawke's Bay District
Central Otago District
Queenstown-Lakes District
New Plymouth District
Timaru District
Gore District
Wellington City
Opotiki District
Auckland
Invercargill City
South Taranaki District
Clutha District
Whakatane District
Matamata-Piako District
Tauranga City
Total New Zealand (Region)
South Waikato District
Nelson City
Stratford District
Kaipara District
Christchurch City
Tasman District
Waitomo District
Western Bay of Plenty District
Whangarei District
Otorohanga District
Westland District
Masterton District
Hamilton City
Hastings District
Taupo District
Rotorua District
Palmerston North City
Upper Hutt City
Gisborne District
Dunedin City
Lower Hutt City
Kapiti Coast District
Kaikoura District
South Wairarapa District
Porirua City
Wanganui District
Marlborough District
Horowhenua District
Rangitikei District
Far North District
Kawerau District
Napier City
Thames-Coromandel District
Tararua District
Wairoa District
Ruapehu District
Employment (FTE) growth, 2006-2011
source: BERL Regional Database 2012

40 BERL Regional Rankings Report February 2013
Figure 8.7. Medium-term measure - GDP
-4.0 -3.0 -2.0 -1.0 0.0 1.0 2.0 3.0 4.0 5.0
Selwyn District
Mackenzie District
Waimakariri District
Waimate District
Timaru District
Waikato District
Waipa District
Ashburton District
Carterton District
Hurunui District
Waitaki District
Buller District
New Plymouth District
Hauraki District
Manawatu District
Central Otago District
Opotiki District
Southland District
Queenstown-Lakes District
Central Hawke's Bay District
Stratford District
Whakatane District
Grey District
Gore District
Kawerau District
Clutha District
Western Bay of Plenty District
Wellington City
Auckland
Matamata-Piako District
Tasman District
Taupo District
Whangarei District
Invercargill City
Kaipara District
South Waikato District
Tauranga City
Total New Zealand (Region)
Otorohanga District
Gisborne District
Waitomo District
Rotorua District
South Taranaki District
Masterton District
Palmerston North City
Christchurch City
Hastings District
Westland District
Wanganui District
South Wairarapa District
Marlborough District
Hamilton City
Kapiti Coast District
Napier City
Horowhenua District
Lower Hutt City
Porirua City
Nelson City
Rangitikei District
Dunedin City
Far North District
Tararua District
Thames-Coromandel District
Wairoa District
Kaikoura District
Upper Hutt City
Ruapehu District
Real Value Added growth (GDP), 2006-2011
source: BERL Regional Database 2012

41 BERL Regional Rankings Report February 2013
Figure 8.8. Medium-term measure – business units
-3.0 -2.5 -2.0 -1.5 -1.0 -0.5 0.0 0.5 1.0 1.5 2.0 2.5
Queenstown-Lakes District
Gore District
Central Otago District
Ashburton District
Porirua City
New Plymouth District
Buller District
Selwyn District
Waimakariri District
Mackenzie District
Hurunui District
Upper Hutt City
Carterton District
Nelson City
Auckland
Wellington City
Timaru District
Tasman District
Waipa District
Hamilton City
Lower Hutt City
Napier City
Total New Zealand (Region)
Kapiti Coast District
Waitaki District
Invercargill City
Masterton District
Dunedin City
Taupo District
Waimate District
Tauranga City
Marlborough District
Westland District
Southland District
Manawatu District
Whakatane District
South Taranaki District
Palmerston North City
Otorohanga District
Gisborne District
Wanganui District
Christchurch City
Stratford District
Hastings District
Kaipara District
South Wairarapa District
Waikato District
Matamata-Piako District
Wairoa District
Thames-Coromandel District
Hauraki District
Western Bay of Plenty District
Kawerau District
Kaikoura District
Clutha District
Opotiki District
South Waikato District
Rangitikei District
Whangarei District
Tararua District
Far North District
Grey District
Central Hawke's Bay District
Rotorua District
Horowhenua District
Waitomo District
Ruapehu District
Business units growth, 2006-2011
source: BERL Regional Database 2012

42 BERL Regional Rankings Report February 2013
Figure 8.9. Measure – relative openness index
-20.0 -15.0 -10.0 -5.0 0.0 5.0 10.0 15.0 20.0 25.0 30.0
Southland District
South Taranaki District
Clutha District
Central Hawke's Bay District
Waimate District
Carterton District
Kawerau District
South Waikato District
Rangitikei District
Hurunui District
Western Bay of Plenty District
Matamata-Piako District
Tasman District
South Wairarapa District
Waitomo District
Wairoa District
Tararua District
Kaipara District
Waitaki District
Buller District
Gore District
Ashburton District
Otorohanga District
Marlborough District
Opotiki District
Waikato District
Kaikoura District
Mackenzie District
Timaru District
Manawatu District
Westland District
New Plymouth District
Gisborne District
Waipa District
Hauraki District
Selwyn District
Taupo District
Hastings District
Central Otago District
Nelson City
Rotorua District
Total New Zealand (Region)
Thames-Coromandel District
Auckland
Stratford District
Far North District
Grey District
Ruapehu District
Wellington City
Christchurch City
Horowhenua District
Napier City
Wanganui District
Waimakariri District
Whakatane District
Whangarei District
Masterton District
Invercargill City
Tauranga City
Hamilton City
Lower Hutt City
Queenstown-Lakes District
Upper Hutt City
Dunedin City
Kapiti Coast District
Palmerston North City
Porirua City
Relative openness index
source: BERL Regional Database 2012

43 BERL Regional Rankings Report February 2013
9 Bibliography
ANZ. (2013). Commodity Price Index. Retrieved February 7, 2013, from ANZ: http://www.anz.co.nz/commercial-
institutional/economic-markets-research/commodity-price-index/
BERL (2013). BERL Regional Database 2012. Wellington
Development Policy and Analysis Division. (2013). World Economic Situation and Prospects 2013. New York:
United Nations.
Neither BERL nor any of its employees accepts any responsibility on any grounds whatsoever, including negligence,
to any other person.
While every effort is made by BERL to ensure that the information, opinions and forecasts are accurate and reliable,
BERL shall not be liable for any adverse consequences of decisions made in reliance of any report provided by
BERL, nor shall BERL be held to have given or implied any warranty as to whether any report provided by BERL will
assist in the performance of functions.