Embed Size (px)
Citation preview

REPORT OF THE
BerkeleyPlastics Task Force
April 8, 1996

CONTENTSEXECUTIVE SUMMARY .. . . . . . . . . . . . . . . . . . . . . . . . . . . . . . . . . . . . . . . . . . . . . . . . . .i
INTRODUCTION .. . . . . . . . . . . . . . . . . . . . . . . . . . . . . . . . . . . . . . . . . . . . . . . . . . . . . . . . . . .1
1 . WHAT PLASTICS ARE MADE OF AND HOW THEY AREMADE .. . . . . . . . . . . . . . . . . . . . . . . . . . . . . . . . . . . . . . . . . . . . . . . . . . . . . . . . . . . . . . . . . . . . . . . . .2
Plastic resin productionEnergy use compared – PET plastic vs. virgin and recycledglassSize of the virgin resin market
2. THE PLASTICS INDUSTRY.. . . . . . . . . . . . . . . . . . . . . . . . . . . . . . . . . . . . . . . . .5Resin production and concentration of industryRecycled contentChasing arrows and the resin code
3 . OVERALL IMPACT OF PLASTICS ON THE ENVIRONMENT,WITH AN EMPHASIS ON CONTAINERS .. . . . . . . . . . . . . . . . . . . . . . .7
Pollution and hazards from manufacturingNegative health effects – toxic additives, migration into foodDiverting solid waste
4. REUSING PLASTIC CONTAINERS.. . . . . . . . . . . . . . . . . . . . . . . . . . . . . . . .9
5. REPROCESSING PLASTICS.. . . . . . . . . . . . . . . . . . . . . . . . . . . . . . . . . . . . . . . . .10Recycled plastic products – a hierarchy of usesPrimary reprocessingSecondary reprocessingTertiary reprocessingMarketing recovered plasticsDomestic and international destinations of recovered materials
6 . PLASTICS IN THE DISCARD STREAM.. . . . . . . . . . . . . . . . . . . . . . . . . .14National discard stream composition estimatesBerkeley, CA discard composition estimates
7 . COMPARATIVE COLLECTION COSTS AND BENEFITS. . . . . .16Estimated amounts available for collection in BerkeleyHow we projected the costs of adding plastic containers to the curbside program .......................................................Incremental and allocated costs of adding plastic bottles to Berkeley recycling programsProjected Revenues

Summary of incremental costs for adding plastic bottles to Berkeley recycling programsLinks between plastic reprocessing and landfilling
8 . HOW SOME OTHER COMMUNITIES HAVE HANDLED PLASTICS.. . . . . . . . . . . . . . . . . . . . . . . . . . . . . . . . . . . . . . . . . . . . . . . . . . . . . . . . . . . . . . .24
St. Paul, MinnesotaPhiladelphia, PennsylvaniaEl Cerrito, CaliforniaSonoma County, CaliforniaGermanyTaiwanSome common elements
9 . SEVEN COMMON MISCONCEPTIONS ABOUT PLASTICS ..27Plastics that go into a curbside recycling bin get recycled.Curbside collection will reduce the amount of plasticlandfilled.A chasing arrows symbol means a plastic container isrecyclable.Packaging resins are made from petroleum refineries’ waste.Plastics recyclers pay to promote plastics’ recyclability.Using plastic containers conserves energy.Our choice is limited to recycling or wasting.
10. ALTERNATIVES.. . . . . . . . . . . . . . . . . . . . . . . . . . . . . . . . . . . . . . . . . . . . . . . . . . . . . . .30Reduce the use – source reduction.Reuse containers.Require producers to take back resins.Legislatively require recycled content.Standardize labeling and inform the public.
11. CONCLUSIONS.. . . . . . . . . . . . . . . . . . . . . . . . . . . . . . . . . . . . . . . . . . . . . . . . . . . . . . . .31
Tables and FiguresTable 1: Plastic Packaging; Resin Market Share; Uses ................... 3Table 2: Composition of the US Municipal Discard Stream, 1993.. 15Table 3: Composition of Berkeley’s Municipal Waste Stream, 199115Table 4: First Estimate of Plastic Bottles Capturable in Berkeley .. 17Table 5: Plastic Bottle Generation Rates ........................................ 19Table 6: Second Estimate of Plastic Bottles Capturable in Berkeley20Table 7: Average Daily Volume Capturable in Berkeley Using APC Assumptions ................................................................................ 21Table 8: Annual Revenue Expected from Sale of PET..................... 22
Table 9: Summary of Incremental Costs for Adding Plastic Bottles to Commercial and Curbside Collection in Berkeley ......... 23
Figure 1: Comparison of Material Flows with Alternative Disposal Schemes......................................................................... 11Figure 2: Plastic Produced and Recycled, 1990-1993 ..................... 13Figure 3: Waste Composition After Diversion, Berkeley, CA, 1991 16

INTRODUCTIONThe Ecology Center convened the Berkeley Plastics Task Force in
February of 1995. This report summarizes the findings of the Task Forceas of April 8, 1996. While our task was to provide an in-depth look at theissues surrounding consideration of plastics recycling, there is more workto be done. The issue remains complex, and this report suggests thedegree of analysis necessary to inform a sound decision about plasticsrecycling in the long term. We welcome questions and comments as wecontinue our research.
The increasing substitution of plastics for other types of packaging,such as glass and paper, has brought plastics disposal to the fore for thepublic, for recycling programs, and for elected officials concerned withsolid waste management. The Berkeley Plastics Task Force conducted aninvestigation of the waste issue in the larger context of the full life-cycleof plastic – from production to use and through a number of disposaloptions. Our research included plastic manufacturing, the recyclability ofvarious types of plastic packaging, the feasibility of picking up plastics ina curbside recycling program, and issues surrounding plastics in thewaste stream.
Our goal was to produce a comprehensive report for decision-makers and the public. The Task Force will make the report available toall interested parties in Berkeley and elsewhere. We hope this report will:
• Illuminate the economic, health, and environmental costs andbenefits of plastic packaging, including its production, use, anddisposal by reuse, recycling, landfilling, and burning;
• Discuss the long-term and systematic impacts of existing andproposed plastic packaging practices, programs, and policies;
• Clearly and fairly compare the costs and benefits of alternativeoptions for handling plastic packaging; and
• Stimulate public participation in deciding what to do about plasticpackaging and how best to reach the City’s goal of recycling 50% ofits discards, mandated at the state and local levels.
Ecology Center staff and Board members were joined on the TaskForce by representatives of Berkeley's recycling programs, the academiccommunity, and other experts on environmental issues. The Task Forcehas consulted with environmental organizations, plastics industry experts,

Report of the Berkeley Plastics Task Force April 5, 1996 2
recycling program operators, solid waste management companies, andpublic agencies for information and comments on its findings.
To address your comments to the Task Force, please contact us atAttn: Plastics Task Force, Ecology Center, 2530 San Pablo Ave., Berkeley,CA 94702; 510-548-2220.
__________________________________________________

AuthorsRichard Lindsay Stover, chemical engineerKathy Evans, recycling consultantKaren Pickett, Ecology Center
ContributorsCharles Gary, Ecology CenterMark Gorrell, architect
Copy editorsDaniel Knapp, Urban OreMary Lou Van Deventer, Urban Ore
Task force membersPam Belchamber, Community Conservation CentersLeona Benten, Ecology CenterKathy Evans, recycling consultantCharles Gary, Ecology CenterEmma Gilbride, Ecology CenterMark Gorrell, architectJudy Johnson, environmental educatorDaniel Knapp, Urban OreNick Morgan, environmental engineerKaren Pickett, Ecology CenterCoy Smith, Materials for the Future FoundationRichard Stover, University of California, BerkeleyMichael Warburton, Public Trust Legal FundDavid Williamson, Urban Ore

Report of the Berkeley Plastics Task Force 4
REPORT OF THEBERKELEY PLASTICS TASK FORCE
April 8, 1996
1 . WHAT PLASTICS ARE MADE OF AND HOW THEY AREMADE
Plastic resin production
The raw material for all packaging plastics is ethylene. Ethylene is a gasderived from natural gas or from a fraction of crude oil that has acomposition similar to natural gas. Both natural gas and crude oil areproducts of fossils and are therefore not renewable.
Producing and refining ethylene uses a lot of energy, requiringcombustion to achieve high reaction temperatures and refrigeration toachieve extremely low temperatures to condense and separate gases(reaching about -260 degrees Fahrenheit). Largely because refrigeration isinherently mechanically inefficient, producing ethylene consumes at least20 megajoules (MJ) per kilogram of ethylene produced.1,2 Twenty MJwould run a 100-watt light bulb for 56 hours. Much of this energy isgenerated at the production site by burning some of the feedstock ofnatural gas or crude oil. Therefore, producing plastics for packaging usesnonrenewable resources to heat and refrigerate as well as feedstock. Thisis a resource use choice, because if the resource were not dedicated tomaking plastic packaging, it could be either conserved or used for otherapplications such as generating electricity.
Once ethylene has been produced, it is combined with solvents, co-monomers, additives, and other chemicals that will participate in theplanned chemical reactions. The mixture is then subjected to a chemicalreaction called “polymerization” that creates long-chain molecules.(“Mono” means “one” and “poly” means “many,” so a “monomer” is asingle molecule — like ethylene — that can be bound with other moleculesinto a “polymer.”) The new polymer is extruded, pelletized, or flaked; the
1 A megajoule is one million joules, or 1 billion BTUs.2 Kirk Othmer Encyclopedia of Chemical Technology, Wiley, 1992.

Report of the Berkeley Plastics Task Force 5
product is called a “resin.” Resin is sold, re-extruded, and made intocontainers, films, and other products.
Energy use compared – PET plastic vs. virgin and recycled glass
Since resin manufacturing consumes so much energy, making containerswith plastic requires almost the same energy input as making containerswith glass despite transportation savings that stem from plastic’s lightweight. The total energy required to produce, package, and transport a 16oz. PET container is 32 MJ compared to 34 MJ for a 16 oz. glass container- virtually the same.3 Producing a pound of plastic resin, however, usesnearly nine times the energy of producing a pound of glass.4 Thesecomparisons assume the use of virgin glass.
If the glass container uses recycled glass cullet in its feedstock, the energyrequired to produce it falls to less than 26 MJ for a 16-ounce glasscontainer. That is 6 MJ less than what is needed for a new PET container.5Making the glass container with recycled cullet uses only 81% of theenergy needed to make a plastic container.
Size of the virgin resin market
In 1995, about 32 million tons of plastic resin were produced in the US;about 39% of this amount, or 12.6 million tons, was used for packaging.6Only six resin types were used to make more than 92% of plasticpackages.7 Their names and common uses are shown in the followingtable:
3 Franklin Associates, Comparative Energy and Environmental Impacts of Soft Drink
Delivery Systems, for the National Association for Plastic Container Recovery,March 1989.
4 CSG/Tellus Packaging Study : “Assessing the Impacts of Production and Disposal ofPackaging and Public Policy Measures to Alter its Mix : Volumes I and II,” preparedfor the Council of State Governments, US Environmental Protection Agency, andthe New Jersey Department of Environmental Protection and Energy, Boston, MA,May 1992.
5 Henry S. Cole and Kenneth A. Brown, “Advantage Glass!” prepared for the GlassPackaging Institute, Washington D.C., September 15, 1993, pp.124-126.
6 Modern Plastics International, January 1996, pp.70-72.7 Chemical and Engineering News, July 4, 1994.

Report of the Berkeley Plastics Task Force 6
Table 1: Plastic Packaging; Resin Market Share; Uses
Chemicalname
Abbr. Resin
code
1995production
(millionlbs)
1995(millio
ntons)
% ofplastic
packaging
Typicalproducts
polyethyleneterephthalate
PET 1 3,920 1.96 15.6 soda and waterbottles
high-densitypolyethylene
HDPE 2 5,410 2.71 21.5 milk and waterjugs, laundrydetergentbottles
polyvinylchloride
PVC 3 520 .26 2.1 meat wrap
[linear] low-den-sitypolyethylene
LLDPE/LDPE
4 7,030 3.52 27.9 grocery andtrash bags
polypropylene
PP 5 1,610 .81 6.4 rigid containers
polystyrene PS 6 4,620 2.31 18.3 fast foodcontainers,meat andbakery trays
Total 23,110 11.56 91.7
A number 7 on a plastic container indicates “other,” which typicallymeans a combination of two or more of the six main resin types.
The use of plastics is increasing in almost all sectors of the economy, butthe most rapid growth is in packaging. Globally, improved economicconditions tend to promote increased consumption and a correspondingincrease in packaging. Analysts predict steady increases in the sales ofmost packaging plastics, particularly PET, for the foreseeable future.8
The advertisement of recyclability may contribute to increases in plasticpackaging sales. Modern Plastics International’s January 1995 resin reportexplained that double-digit growth rates in PET consumption were due, inpart, to “PET’s perceived environmental benefit in regards to recycling.”9
8 Robert D. Leaversuch, “Resins ‘96,” Modern Plastics International, January 1996,
pp.50-51.9 Patrick A. Toensmeier, “Resins 1995,” Modern Plastics International, January 1995,
p. 47.

Report of the Berkeley Plastics Task Force 7
New plastic packaging materials also contribute to plastics’ marketgrowth. The compositions of these new materials are varied and tailoredto provide performance characteristics for specific applications.10
Container shapes and sizes are becoming less standard and morenumerous. But standardized container compositions and shapes facilitatesorting and reprocessing. Thus, the unlimited use of new materials,mixtures of materials, and a diversity of container shapes work againstplastic reprocessing by making it more difficult and more expensive forcollectors and processors to match their output to available markets.
2. THE PLASTICS INDUSTRY
The questions and issues surrounding plastics are influenced not only bythe materials, but also by the structure and behavior of the industry thatproduces them. The plastics industry is powerful and prominent, and nodiscussion of plastics would be complete without considering its culturaland economic impacts as well as its technical characteristics.
Resin production and industrial concentration
Virgin plastic resin is produced by a small number of corporations. In1995, for example, three corporations produced 94% of all PET resin.11
Resin factories are large and streamlined to create a one-way flow ofuniform product because of economy of scale. Because of their large size,these corporate producers control the choices available to manufacturesand consumers.
Plastic resin factories are also concentrated geographically, mainly on theGulf Coast, because the raw material ethylene is supplied mainly bypipeline. Resin customers, on the other hand, are widely dispersed. Thisgeographic separation requires large amounts of energy fortransportation, contributing to the intensive use of natural resources.
Recycled content
To increase the domestic market for post-consumer resources of all kinds,many governments have required manufacturers to use a certain
10 Doug Smock, “BASF Unveils New Styrenes for Computers, Packaging Films,”
Plastics World, Vol. 53, August 1995, p. 26. Also Robert D. Leaversuch, “BASF ReadiesPolymers Slate for Diverse End-Use Markets,” Modern Plastics International, Vol.72, August 1995, p. 69.
11 Ibid., p.63.
Report of the Berkeley Plastics Task Force 8
percentage of reclaimed material in their feedstock. Plastics are noexception to this trend. Oregon, for example, produced a flurry ofresearch and development in plastics when its legislature required 25%recycled content in plastic containers. Such legislation recognizes thatalthough recycling does not reduce energy use or emissions to the degreethat reuse does, mandating recycled content sets forces in motion thatwill replace virgin material with reclaimed resources, so long as therecycled content comes from post-consumer bottles or packaging and notfrom in-house manufacturing scrap.
In general, recycled-content laws partially close the materials-flow loopand help foster consideration of the full life-cycle of products. Byrecycling, plastic manufacturers take some degree of responsibility for thefate of the materials they produce. California's SB235 and SB2092 areexamples of mandatory content legislation that require, respectively, 25%and 30% reprocessed post-consumer plastic contents in a narrow class ofplastic containers and trash bags.12
The direct effect of recycled-content legislation is on manufacturers ofcontainers and plastic film, not on resin producers. However, for recycled-content containers to perform adequately, the virgin and recycledmaterials must be compatible. The technical interchange required toassure compatibility requires virgin-resin manufacturers to makemanufacturing decisions that benefit the makers of recycled-contentcontainers.
The virgin-plastics industry has resisted such cooperation by stronglyopposing recycled-content legislation, and has defeated or weakenedefforts to institute stronger laws in Oregon and California. According toSenior Editor Victor Wigotsky of Plastics Engineering magazine, the twolargest plastic technology consortiums — the American Plastics Counciland The Society of the Plastics Industry — have made a concerted effortto “assure a measure of restraint and reason in the drafting of packaginglegislation” and to “oppose the passage of some 180 restrictive legislativeproposals in 32 states.”13
This behavior suggests that the bigger their share of the packagingmarket, the more forcefully virgin-plastic manufacturers will opposerecycled content laws.
12 California Public Resources Code, Title 14, Division 7, Ch. 14, Sections 17942-49 and
17975-85.13 V. Wigotsky, “To Market To Market,” Plastics Engineering, June 1995, p. 16.
Report of the Berkeley Plastics Task Force 9
Chasing arrows and the resin code
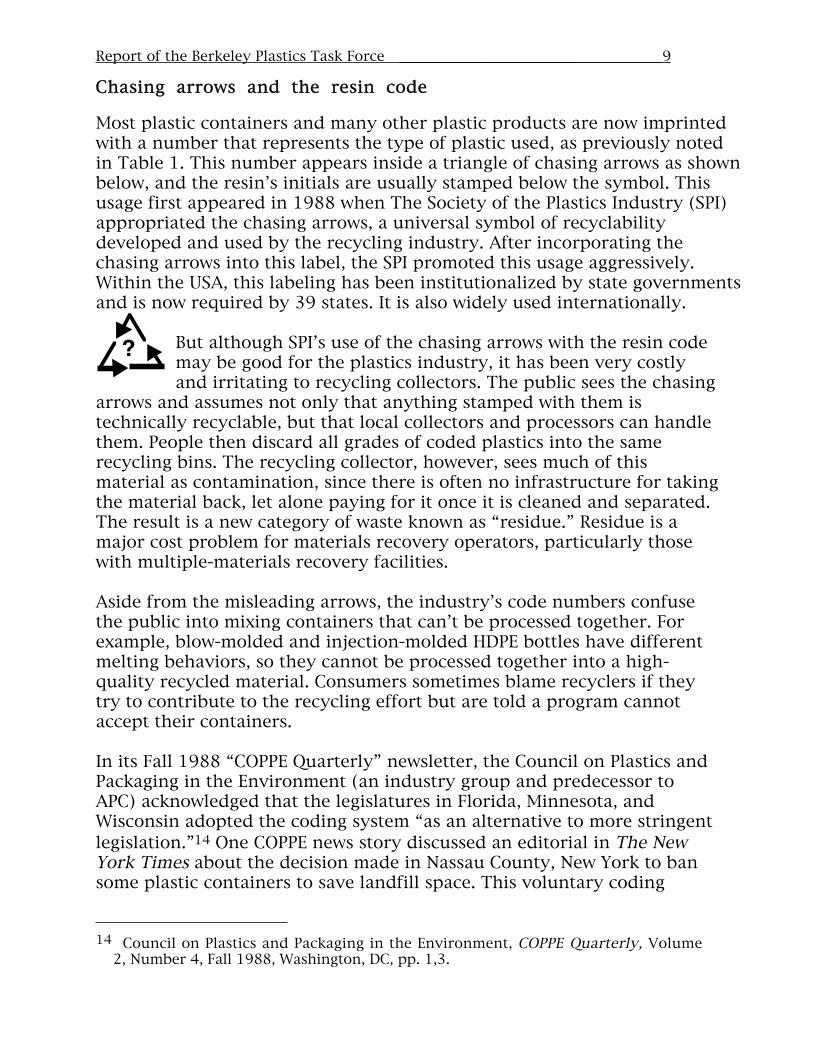
Most plastic containers and many other plastic products are now imprintedwith a number that represents the type of plastic used, as previously notedin Table 1. This number appears inside a triangle of chasing arrows as shownbelow, and the resin’s initials are usually stamped below the symbol. Thisusage first appeared in 1988 when The Society of the Plastics Industry (SPI)appropriated the chasing arrows, a universal symbol of recyclabilitydeveloped and used by the recycling industry. After incorporating thechasing arrows into this label, the SPI promoted this usage aggressively.Within the USA, this labeling has been institutionalized by state governmentsand is now required by 39 states. It is also widely used internationally.
But although SPI’s use of the chasing arrows with the resin codemay be good for the plastics industry, it has been very costlyand irritating to recycling collectors. The public sees the chasing
arrows and assumes not only that anything stamped with them istechnically recyclable, but that local collectors and processors can handlethem. People then discard all grades of coded plastics into the samerecycling bins. The recycling collector, however, sees much of thismaterial as contamination, since there is often no infrastructure for takingthe material back, let alone paying for it once it is cleaned and separated.The result is a new category of waste known as “residue.” Residue is amajor cost problem for materials recovery operators, particularly thosewith multiple-materials recovery facilities.
Aside from the misleading arrows, the industry’s code numbers confusethe public into mixing containers that can’t be processed together. Forexample, blow-molded and injection-molded HDPE bottles have differentmelting behaviors, so they cannot be processed together into a high-quality recycled material. Consumers sometimes blame recyclers if theytry to contribute to the recycling effort but are told a program cannotaccept their containers.
In its Fall 1988 “COPPE Quarterly” newsletter, the Council on Plastics andPackaging in the Environment (an industry group and predecessor toAPC) acknowledged that the legislatures in Florida, Minnesota, andWisconsin adopted the coding system “as an alternative to more stringentlegislation.”14 One COPPE news story discussed an editorial in The NewYork Times about the decision made in Nassau County, New York to bansome plastic containers to save landfill space. This voluntary coding
14 Council on Plastics and Packaging in the Environment, COPPE Quarterly, Volume
2, Number 4, Fall 1988, Washington, DC, pp. 1,3.
?

Report of the Berkeley Plastics Task Force 10
system for resin identification was an alternative that seemed acceptableat the time.
Since the code is unclear and misleading, recycling trade groups and evengovernments have made attempts to modify the symbol, starting in thefall of 1988. The plastics industry’s continuing resistance to changing thecode suggests that the symbol’s lack of clarity benefits plastic sales.Attempts to modify the code in California, the state of Washington, andColorado were defeated by the campaigns and lobbying efforts of APC andits industrial allies.15 Negotiations in 1993 between SPI and the NationalRecycling Coalition intended to resolve the coding issues ended with noaction to clarify the misleading labeling.
On the other hand, the plastics industry and the APC in particular haveput big money into a public relations campaign to convince the publicthat plastics recycling is easy, economical, and a big success. BetweenNovember 1992 and July 1993, the APC spent $18 million in a nationaladvertising campaign to “Take Another Look at Plastics.” Whiletrumpeting large numbers of pounds of plastic recycled, they neglected topoint out that in the year cited, 1993, 15 billion pounds were producedbut only 1 billion pounds recycled. The Environmental Defense Fund,which released these figures, found that the small increases in recycling“did not even come close to keeping up with increased production ofvirgin plastic over the same period.”16 (See Figure 2) The plasticsindustry promotes recycling to breed public support in the market forplastic products and packaging.
3 . OVERALL IMPACT OF PLASTICS ON THEENVIRONMENT, WITH AN EMPHASIS ONCONTAINERS
Pollution and hazards from manufacturing
The most obvious form of pollution associated with plastic packaging iswasted plastic sent to landfills. Plastics are very stable and therefore stayin the environment a long time after they are discarded, especially if theyare shielded from direct sunlight by being buried in landfills.Decomposition rates are further decreased by anti-oxidants that
15 Wigotsky, op. cit.16 Environmental Defense Fund, “Yet Another Look at Plastics Recycling,”
September 12, 1994.
Report of the Berkeley Plastics Task Force 11
manufacturers commonly add to enhance a container’s resistance toattack by acidic contents.
Plastics also put a big chemical burden on the environment. The OaklandRecycling Association commissioned an analysis of the toxic chemicalburden that relied heavily on information from EPA data, especially theToxics Release Inventory.17 These data were limited becausemanufacturers within the “miscellaneous plastics sector” did not filereports. Nevertheless, the information available showed that most toxicreleases went into the air, and the plastics industry contributed 14% ofthe national total. Of the top ten manufacturers ranked by total releases,seven made plastic foam products. Significant releases of toxic chemicalsincluded :
• trichloroethane • acetone• methylene chloride • methyl ethyl ketone• styrene • toluene• benzene • 1,1,1 trichloroethane
Other major emissions from plastic production processes include sulfuroxides, nitrous oxides, methanol, ethylene oxide, and volatile organiccompounds.18
Less visible but very serious is the pollution generated by producingplastic resin. As ethylene is polymerized, the reactive mixture is scrubbedwith dilute aqueous caustic solutions19 that become high-volumepollutants. The refining process uses waste-minimization methods, butpoint-source air emissions are still high because of inherent difficulties inhandling large flows of pressurized gases. Manufacturing PET resingenerates more toxic emissions (nickel, ethylbenzene, ethylene oxide,benzene) than manufacturing glass. Producing a 16 oz. PET bottlegenerates more than 100 times the toxic emissions to air and water thanmaking the same size bottle out of glass.20
Producing plastics can be hazardous to workers, too. Serious accidentshave included explosions, chemical fires, chemical spills, and clouds oftoxic vapor. These kinds of occurrences have caused deaths, injuries,
17 Developing Local Markets for Post-Consumer Rigid PET and HDPE Containers in the
East Bay, Oakland Recycling Assn., Oakland, CA, 1995.18 CSG/Tellus Packaging Study, op.cit.19 Kirk Othmer Encyclopedia of Chemical Technology, Wiley, 1992.20 CSG/Tellus Packaging Study , op.cit.

Report of the Berkeley Plastics Task Force 12
evacuations and major property damage.21 A review of the US EPA’s database of 10,000 accidents and spills from 1980-87 shows that nearly 1,600(16%) of industrial accidents were associated with producing plastics orplastic constituents.22
Negative health effects – toxic additives, migration into food
In addition to creating safety problems during production, many chemicaladditives that give plastic products desirable performance properties alsohave negative environmental and human health effects. These effectsinclude direct toxicity, as in the cases of lead, cadmium, and mercury; orcarcinogens, as in the case of diethyl hexylphosphate (DEHP). Problemchemicals are used as plasticizers, antioxidants, colorants, flameretardants, heat stabilizers, and barrier resins. A single resin type mightbe mixed with many such additives, adding complexity to the chemicalcomposition and possibly generating new classes of incompatible resinswithin the grossly simplified SPI resin code. An example of internalincompatibility is resin type 2, noted earlier as a recycling problembecause the blow-mold resin grades and injection-mold grades must beseparated for most primary recycling applications.
People are exposed to these chemicals not only during manufacturing, butalso by using plastic packages, because some chemicals diffuse (migrate)from the packaging polymer to the foods they contain. Migrationpotential exists for traces of monomers, oligomers, additives, stabilizers,plasticizers, lubricants, anti-static nucleating agents, and reactionproducts of the polymer or its additives. Such substances may be toxic.
Examples of plastics contaminating food have been reported with mostpolymers, including styrene from polystyrene, plasticizers from PVC,antioxidants from polyethylene, and acetaldehyde from PET.23 Among thefactors controlling migration are the chemical structure of the migrantsand the nature of the packaged food.24 In studies cited in Food Additivesand Contaminants,25 LDPE, HDPE, and polypropylene bottles released 21 Henry S. Cole, op.cit., pp.74-7.22 US EPA, Final Report, Acute Hazardous Events Data Base, 1989. 23 “Male Reproductive Health and Environmental Chemicals with Estrogenic
Effects,” Danish Environmental Protection Agency, Copenhagen, Denmark, April18, 1995.
24 Alexandre Feigenbaum, Anne-Marie Riquet, and Violett Ducruet, “Safety andQuality of Foodstuffs in Contact with Plastic Materials,”Journal of ChemicalEducation, November 1993.
25 Piringer, O.G., “Evaluation of Plastics for Food Packaging,” Food Additives andContaminants, Vol. II, No. 2, 1994.

Report of the Berkeley Plastics Task Force 13
measurable levels of BHT, Chimassorb 81, Irganox PS 800, Irganix 1076,and Irganox 1010 into their contents of vegetable oil and ethanol.Evidence was also found that acetaldehyde migrated out of PET and intowater.
Diverting solid waste
Curbside plastic collection programs are driven in part by a wish tominimize municipal solid waste. Indeed, most legislation dealing withdiscarded containers has focused on creating mechanisms that woulddivert municipal plastic waste from incinerators or landfills. Theseinitiatives include container deposit laws and landfill use-reduction laws.Although important, such measures do not solve the problem of over-packaging or reduce the production of plastic packaging. Only sourcereduction can do this. As discussed in section 8, Germany recognized theneed to implement aggressive source reduction and passed a lawrequiring all manufacturers to arrange to pick up discarded packaging,usually at the point of sale, such as the supermarket. This requirementhas encouraged industry to reduce packaging.
In addition, as noted earlier, providing recycling for plastic containersmay actually encourage their use and increased production. But as plasticpackages become less standardized and more complex, recycling becomesmore difficult. Already, many plastic packages that consumers haveexpected to be recycled must be landfilled. Therefore the diversion maynot be as effective as proponents intend. (See misconceptions 1 and 2 insection 10 below.)
4. REUSING PLASTIC CONTAINERS
Reusing containers is one of the most effective and inexpensive ways toreduce the environmental impact of packaging. Some plastic containerscan be made durable enough to be refilled and reused about 25 timesbefore becoming too damaged for reuse.26 Refilling and reusing plasticcontainers directly reduces the demand for disposable plastic.Accordingly, lowering demand for single-use containers reduces wasteand energy consumption. Based on 1990 data, if glass and PET bottleswere refilled and reused 25–35 times, the overall weight of beer and softdrink container waste would be reduced by 73.6%.27 Significantreductions in waste and energy consumption can be achieved with just7–8 reuses of a single bottle. 26 Saphire, David, Case Reopened: Reassessing Refillable Bottles, INFORM, NY, 1994.27 Ibid.

Report of the Berkeley Plastics Task Force 14
One toxicity study investigating the use of PET for refillable bottles testedvarious toxic substances to see if they would be absorbed into the PETplastic during one use, then released in the next use. After test substanceswere removed and the plastic washed, the bottles were filled with food,and the contents were analyzed. The analysis showed that none of the testsubstances was absorbed into the PET. This study concluded that PETcould be considered as a practical candidate for refillable containers.28 Asdiscussed above, migration of additives from the PET itself is still aproblem.
Reusing glass containers was standard procedure in this country throughabout the 1950s, and there are still a few products distributed in reusablecontainers. For example, milk is sold in both plastic and glass containersthat have been washed and refilled. However, with a long history ofproven performance, glass remains the most practical candidate forreusable containers.
5. REPROCESSING PLASTICS
Recycled plastic products – a hierarchy of uses
Materials collected and processed as recyclables rarely come back frommanufacturers as the same product. Some uses seem superior to others, asentiment expressed by the phrase “highest and best use,” which used torefer primarily to energy conservation but now is used more broadly.Referring to resources, some uses directly reduce demand for virginmaterials, whereas others essentially create unneeded products that donothing to reduce the consumption of virgin materials. Many recycled-content products are themselves essentially unrecyclable. Based on thesekinds of considerations, at least three different product outcomes can beobserved, namely, primary, secondary, and tertiary reprocessing.
As applied to plastic packaging, primary reprocessing produces newpackaging; secondary reprocessing produces new items that are usuallynot practically recyclable themselves because of reduced polymer purityand the lack of collection infrastructure; tertiary reprocessing uses highheat or industrial chemicals to break plastic products into their chemicalcomponents, some of which can then, in theory, be made into newproducts.
28 Feron, V.J., et.al., “Polyethylene Terephthalate Bottles: a Health and Safely
Assessment”, Food Additives and Contaminants, Vol. II, No. 5, 1994.

Report of the Berkeley Plastics Task Force 15
Primary reprocessing
This entails remanufacturing the recovered product back into the sameproduct. An example is recovered aluminum cans made into newaluminum cans, or a recovered clear glass bottle made into a new clearglass bottle.
In theory, all six of the six resin types used to make packaging plastics arecandidates for primary reprocessing. In reality, however, primaryreprocessing is rare.
Two chemical properties make it difficult. One is plastic’s sensitivity toheat and handling. Plastic molecules are long and flexible, and theychange structurally when subjected to thermal and mechanical stressduring melting and extrusion. The molecules interconnect and stiffen, andthe plastic becomes weak and brittle. This type of degradation is called“heat history” in the plastics recycling trade. The deteriorationaccumulates with each reprocessing and is irreversible. In contrast, glassand aluminum, composed of short, robust molecules, are not as sensitiveto heat and handling and therefore can be reprocessed many times.
The second chemical property that makes primary reprocessing difficultis that plastics are very susceptible to contamination. If sorting isimperfect, resins may mix with other kinds of organic debris when melted.Mixing leads to defects and disruptions in the molecular structure which,in turn, leads to degraded properties. In some cases, contamination leadsto the total breakdown of the polymer. For example, even trace amountsof polyvinyl chloride (PVC) destroy polyethylene when the two are meltedtogether.29
An analogous problem is found with glass, which is highly sensitive toceramic contamination. With plastics, however, potential contaminantsare more plentiful and much more difficult to control. Separating plasticsis particularly problematic because there is little variation in physicalproperties (such as density and solubility) to use in sorting. Also, the sixbasic types of plastic resin include multiple grades and colors within eachresin type, and often several resin types are used to make a singlecontainer.
Primary plastics reprocessing is therefore strongly limited by the chemicalproperties of the material. Reprocessors that make plastic containers out 29 Giannotta, Giorgio, et.al., Processing Effects on Poly(Ethylene Terephthalate)
from Bottle Scraps, Polymer Engineering and Science, v34, August 1994, pp. 1219-23.

Report of the Berkeley Plastics Task Force 16
of other plastic containers typically blend virgin resin with the recycledresin to boost the product’s performance. One study reported that it ispossible to make containers with recycled contents of up to 50%, if thereclaimed containers used are themselves made of pure virgin resin.30 Atleast one blow-molder was also able to produce a 100%-recycled contentbottle with the desired properties using a particular blend of post-consumer resins.31 However, large-scale reprocessors have found thatusing more than 15% to 25% of post-consumer feedstock reduced thestrength of their containers.32
Secondary reprocessing
This is the most common type of plastic reprocessing in the USA. It usesrecovered plastics to produce new items that are usually not recyclablethemselves. Secondary reprocessing reduces the quality of the polymer ifit reduces its purity. Accordingly (and largely theoretically, since theindustry is very new), feedstock does not have to be as pure as forprimary reprocessing. Principal products made by secondary reprocessinginclude textiles, panels, pallets, and plastic lumber.
Secondary reprocessing sometimes diverts material from landfill andsometimes decreases the use of virgin material. For example, if there is amarket for a jacket filled with polyester fiber, and that jacket’s filling ismade from post-consumer bottles, then the bottles are diverted fromlandfill and the virgin resources that otherwise would have been used tomake the fiber are conserved.
In plastics recycling, secondary reprocessing differs from primary in thefollowing respects:
• It reprocesses materials in such a way as to render them lessrecyclable or unrecyclable;
• It is less likely to be the highest and best use; and• It does not usually reduce the production of plastic packaging
from virgin resources.
A comparison of the material flows for alternative plastic disposalschemes (reuse, primary, secondary reprocessing) is shown below.
30 Brewer, Gretchen, Plastic Remanufacturing Company Profiles, Oakland Recycling
Association, Oakland, CA, 1995. pp.11-13.31 “Plastics Manufacturing Process Assessments”, ReTAP Technology Brief, Clean
Washington Center, Seattle, WA, 1994.32 “Toughing Out the Plastics Crunch,” World Wastes, February 1995.
Report of the Berkeley Plastics Task Force 17
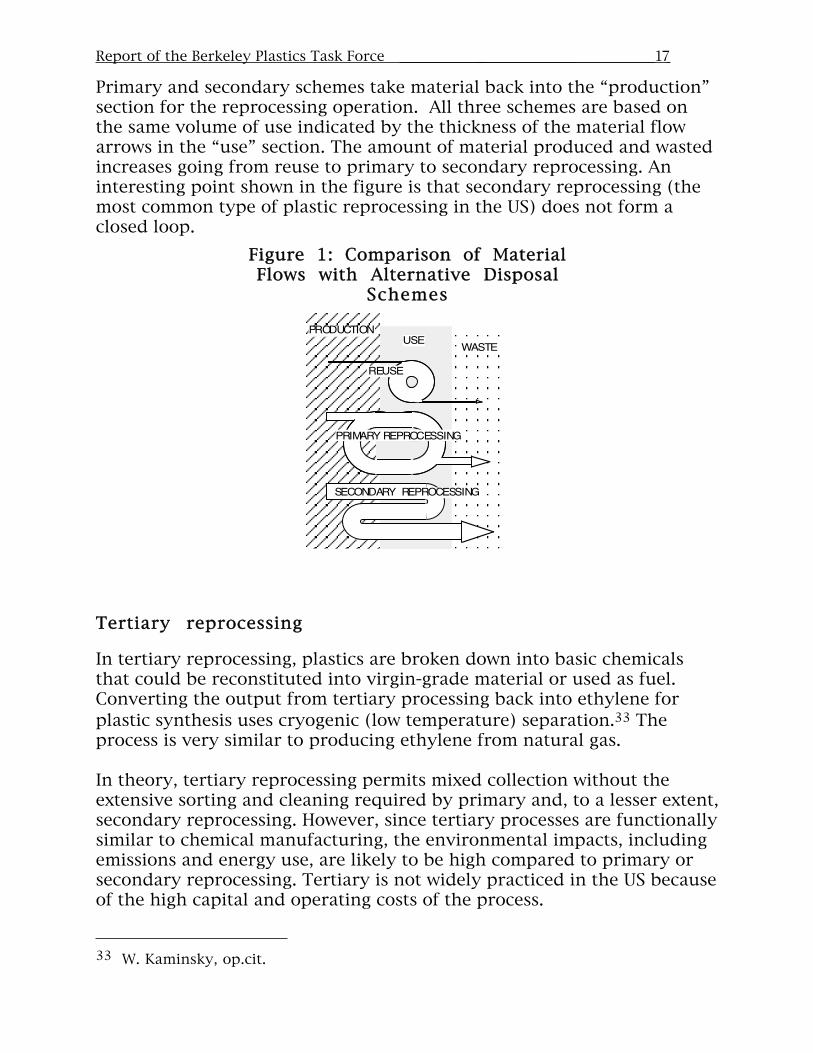
Primary and secondary schemes take material back into the “production”section for the reprocessing operation. All three schemes are based onthe same volume of use indicated by the thickness of the material flowarrows in the “use” section. The amount of material produced and wastedincreases going from reuse to primary to secondary reprocessing. Aninteresting point shown in the figure is that secondary reprocessing (themost common type of plastic reprocessing in the US) does not form aclosed loop.
Figure 1: Comparison of MaterialFlows with Alternative Disposal
Schemes
WASTEUSE
PRIMARY REPROCESSING
PRODUCTION
REUSE
SECONDARY REPROCESSING
Tertiary reprocessing
In tertiary reprocessing, plastics are broken down into basic chemicalsthat could be reconstituted into virgin-grade material or used as fuel.Converting the output from tertiary processing back into ethylene forplastic synthesis uses cryogenic (low temperature) separation.33 Theprocess is very similar to producing ethylene from natural gas.
In theory, tertiary reprocessing permits mixed collection without theextensive sorting and cleaning required by primary and, to a lesser extent,secondary reprocessing. However, since tertiary processes are functionallysimilar to chemical manufacturing, the environmental impacts, includingemissions and energy use, are likely to be high compared to primary orsecondary reprocessing. Tertiary is not widely practiced in the US becauseof the high capital and operating costs of the process.
33 W. Kaminsky, op.cit.

Report of the Berkeley Plastics Task Force 18
Tertiary reprocessing of plastics has been done using thermal andchemical methods. Chemical processes, including glycolysis, methanolysis,and hydrolysis, decompose plastic by unzipping the polymer chains.Thermal processes, primarily pyrolysis, use heat and catalysts to breakplastic down into gases such as ethane and methane. Current thinking isthat thermal processing is the only commercially viable type of tertiaryreprocessing, since only PET among the packaging resin types can beprocessed by chemical methods.34
The pyrolysis process requires using a large stream of purified inert gas,typically nitrogen, to prevent the plastic from completely decomposingthrough combustion into carbon dioxide and water. The process requiressubstantial energy input, since plastics are poor thermal conductors.When clean, pure polymer feed streams are processed under laboratoryconditions, pyrolysis generates up to 10% waste material, including cokeand often hazardous inorganic compounds.35 This result suggests thatunder production conditions, with grossly mixed and contaminatedfeedstocks, the residue may be substantially higher. On the other hand,some tertiary reprocessors in Germany have claimed they have reducedresidual material to 5% of what came in. This level is commendably lowby conventional refining or remanufacturing operation standards. Theresidues of existing tertiary processes are landfilled.36
Marketing recovered plastics
While recycling proportions are high for some container types in the US,so far plastic recovery has had only a minor impact on the total amountwasted. The EPA estimates that in 1993, 22% of all discards wererecovered. Recovery rates were more than 30% for paper and 60% formetal. But only 3.5% of discarded plastic was recovered.37
Most of the plastic packaging that is recovered and reprocessed comesfrom PET and HDPE bottles. Other plastic resin types are reprocessed atrates that hover around 1%. In 1995 reprocessed resin consumption
34 Suzanne Shelley, “Plastics Reborn”, Chemical Engineering, v99, July 1992, pg.30.35 W. Kaminsky and H. Rossler, “Olefins from Wastes,” Chemtech, February 1992,
p.108.36 The purpose is to remove H2S and CO2 to reduce acid gas emissions. See Philip
Goldsmith, “Cracking the Plastic Poser,” Process Engineering, v75, April 1994,pg.29.
37 US Environmental Protection Agency, Characterization of Municipal Solid Wastein the United States : 1994 Update, Executive Summary, November 1994, p.30.

Report of the Berkeley Plastics Task Force 19
totaled 1,525 million pounds, or about 2% of the total plastic resinused.38
Figure 2 below shows the dramatic disparity between the growth inproduction of virgin resins and production of recycled resins.39 UsingAPC data, the Environmental Defense Fund found that the virgin marketgrew more than 6 times faster than the recycled market.40
Figure 2: Plastic Packaging Produced and Recycled, 1990-1993
The market for products of secondary processing has been limited bothby product performance problems and high material costs. Plastic lumber,for example, is heavy compared to wood, cannot be used to bear loads instructures, is subject to warping, and begins to degrade when exposed tosunlight. Recycled HDPE pellets cost $0.34/lb, almost as much as the$0.38/lb price for virgin HDPE. Recycled PET pellets cost about $0.58/lb
38 Modern Plastics International, January 1996, pp.70-72.39 US Environmental Protection Agency, op.cit., p.30.40 Environmental Defense Fund, “Yet Another Look at Plastics Recycling,”
September 12, 1994.
y e a r
Bill
ion
Poun
ds
0
2
4
6
8
10
12
14
16
1990 1991 1992 1993

Report of the Berkeley Plastics Task Force 20
compared to $0.76/lb for virgin material.41 Economic return is reducedby the high price of recycled resin and the practical requirement to use atleast 50% virgin resin to achieve desired performance.
Domestic and international destinations of recovered materials
After plastic containers are collected (those economic considerations willbe discussed later), they must be sold, reprocessed, and made into newproducts.
The market in post-consumer resin is dominated by a few large plastic-reprocessing facilities in the US and by Pacific Rim countries. Both canpay high prices for the post-consumer resource, the first because ofautomation42 and the second because of low labor costs for sorting.43
Nationally the amount of post-consumer plastics exported is at least 20%to 30%. The state of Oregon, for example, exports about 35% of its plasticscrap.44 In California, all recovered PET goes to the Plastic RecyclingCorporation of California (PRCC). In 1995 the PRCC sold nearly all ofCalifornia’s recovered PET overseas.45
This market structure creates several impacts worth noting. First,California businesses that use recycled PET resin must purchase it out ofstate.46 Therefore, the development of local businesses using recycledplastic resin is inhibited,47,48 and this new round of transportation usesmore energy and generates more pollution.
In addition, plastics are a major component of an international trade indiscarded resources that has become a source of serious problems.Discarded materials that are collected in industrialized countries andshipped to third-world countries as recyclables are sometimes badlycontaminated. Occasionally the contamination is hazardous waste. Thecountries that ship the materials rely on the often-weak regulatoryclimates, huge reservoirs of cheap labor, and desperate economies of the
41 Plastics News, January 1996.42 Plastics News, April 1995.43 Developing Local Markets for Post-Consumer Rigid PET and HDPE Containers in the
East Bay, Oakland Recycling Association, Oakland, CA, 1995.44 “Plastics Recycling Update,” Resource Recycling, v8, No.11, November 1995.45 Developing Local Markets ..., op.cit.46 Secondary Materials Market Assessment Study, California Integrated Waste
Management Board, Sacramento, CA, 1994.47 Jack Migrom, Trends in Plastic Recycling, Resource Recycling, p.75, May 1994.48 Developing Local Markets ..., op.cit.

Report of the Berkeley Plastics Task Force 21
receiving countries. Greenpeace and other organizations havedocumented conditions at recycling facilities in countries that import thismaterial and have found conditions to be hazardous and exploitive. Inaddition, Greenpeace found that exported plastics were very poorlysorted. In a seven-country survey, up to 50% of the discards shippedoverseas were contaminated and had to be dumped, often in unlined,unmanaged sites.49 Little or no documentation has been found regardingthe market stability or soundness of the products that these countriesproduce with plastic scrap. The “cradle to grave” approach to wastemanagement does not apply if the “grave” is in another country.
6 . PLASTICS IN THE DISCARD STREAM
National discard stream composition estimates
With the increase in plastic production and use, more plastics arediscarded. A 1994 EPA study of the national supply of discards50 saysthat in 1970, plastics composed less than 3% by weight of the municipalsupply. By 1986, they had risen to 6%.
For 1993, the EPA estimates that the US burned or buried 207 million tonsof discards or 1,600 pounds per person.51 Their composition estimate forthe discard stream is represented in the following table52 :
Table 2: Composition of the USMunicipal Discard Stream, 1993
Material Type Discarded(million
tons)
Percentof Total
Paper andPaperboard
77.8 38
Food and Yard Trimmings
49.7 24
49 Greenpeace research cited in “Plundering the Planet: Full Speed Ahead,”
Multinational Monitor, p.8, September 1994.50 EPA, op.cit., p.31.51 1993 estimated U.S. population of 257,783,000 people from the Statistical Abstract of
the U.S., U.S. Bureau of Census, 1995.52 Some believe that the EPA’s methodology, as applied by perennial contractor The
Franklin Institute, systematically overstates wasting because it pays moreattention to production than actual landfilling, excludes certain kinds and classesof recycling from measurement, and defines as wastes many things that areactually recovered for recycling.

Report of the Berkeley Plastics Task Force 22
Plastics 19.3 9Metals 17.1 8Wood 13.7 7Glass 13.7 7Other 15.7 7
Total 207.0 100
Of the estimated 19.3 million tons of plastics burned or buried inlandfills, 8.1 million tons, or 63 pounds per person per year, was plasticpackaging materials.
In states where beverage containers have redemption or deposit value, theproportion of these containers in the garbage has dropped significantly.For example, an estimated 28% of all PET bottles sold in the US isrecovered,53 and 90% of those came from states with bottle bills ormandated deposits.54 Nevertheless, even as plastic reprocessing rateshave increased, the amount of virgin resins produced has risen muchfaster.
Berkeley, CA discard stream composition estimates
A study of Berkeley, California’s waste stream, which totaled 100.4thousand tons after diversion in 1991, showed the following majorcomponents:55
53 R.W. Beck and Associates, 1993 National Post-Consumer Plastics Recycling Rate
Study, Seattle, June 1994.54 Plastics Recycling - Problems and Possibilities, Hearing before the Subcommittee
on Environment and Employment of the Committee on Small Business, US House ofRepresentatives, 102nd Congress, no.57, 1992.
55 Cal Recovery Systems study for the City of Berkeley, Berkeley, California, 1991.

Report of the Berkeley Plastics Task Force 23
Table 3: Composition of Berkeley’sMunicipal Waste Stream, 1991
Material Type AmountWasted
(thousandtons)
Percent of
Total
Paper andPaperboard
35.2 35.0
Yard Trimmings,Food
23.2 23.1
Wood 8.4 8.4Plastics 6.5 6.5Metals 4.9 4.9Glass 3.1 3.1Other 19.1 19.0
Total 100.4 100.0
The quantity of plastic in the Berkeley waste supply is compared with thequantities of other materials in the pie chart below.
Figure 3: Waste Composition After Diversion,Berkeley, CA, 1991
F i g u r e 3 -
Paper 35%
Yard debris23.1%
Wood 8.4% Plastic 6.5%Metal 4.9%
Glass 3.1%
Other 19%
Of the plastics discarded in Berkeley in 1991, almost 47% was film plasticssuch as bags and wrapping, and 43% was mixed plastics includingpolystyrene foam. Seventy tons was PET, and 582 tons was HDPE. SincePET and HDPE are the only plastic resins that have accessible markets, this

Report of the Berkeley Plastics Task Force 24
means that only 10% of plastic discards or less than 1% of Berkeley’s totalwaste stream would be targeted for recycling. As will be discussed in thefollowing section, a curbside collection program could capture only afraction of this target material.
7 . COMPARATIVE COLLECTION COSTS AND BENEFITSIN BERKELEY, CALIFORNIA
Now that a context of industrial considerations and the projected supplyin Berkeley has been set, finances and collection mechanics can beconsidered. Adding plastic containers to the curbside collection programin Berkeley would necessarily add costs in operations and in other areas,including a public education program to tell residents about the change.Operational costs may be incurred for new collection equipment,expanding processing facilities and storage capacity, added labor, andother increased operating expenses.
Possible benefits could include income, diverting more material fromlandfill, conserving more resources and energy, providing an opportunityfor local economic development, and increasing customer service andsatisfaction.
The balance of costs and benefits is the subject of the following analysis,which examines the question of beginning curbside recycling collection ofplastic bottles made of PET (soda and custom), and natural HDPE (milkand water jugs) in Berkeley.
Estimated amounts available for collection in Berkeley
To assess costs and benefits, we must project how much material curbsidecollection could divert from landfill. As previously noted, researchconducted for a 1991 study showed that Berkeley landfilled more than650 tons of PET and HDPE.56 This figure provides only a point ofreference because plastic packaging use and disposal has increasedsignificantly since 1991. Also, the study gives no information on thesources of the material or the types of articles included in the categories.For example, the common five-gallon plastic pail used for commercialquantities of food and construction products would be included in thecomposition study as HDPE, but is not a target material in this analysis.
56 Ibid.

Report of the Berkeley Plastics Task Force 25
To respond to the Berkeley City Council’s January 1995 request for aplastics recycling plan, staff of the City’s Refuse and Recycling Division,the Ecology Center, and Community Conservation Centers developedestimates of the quantities of plastic bottles that could be collected forrecycling. The organizations used several sources of information,including a 1995 report from the American Plastic Council, the PlasticsRecycling Plan for San Diego County, and information from other cities.The tonnage projections the three groups developed varied only slightlyand can be fairly represented as follows:
Table 4: First Estimate of Plastic BottlesAvailable in Berkeley
Program PET(tons/year)
HDPE(tons/yr.)
Dropoff 6 32BuyBack 12Curbside 26 134Commercial
6 34
Totals 50 200
The estimated quantity of plastic bottles that could reasonably becaptured for reprocessing represents less than one-half of 1% of themunicipal waste stream.
How we projected the costs of adding plastic containers to thecurbside program
The costs for adding any material to the recycling system in Berkeleyshould be considered in terms of both incremental and allocated costs.Incremental costs are all the extra expenses necessary to collect, process,and market the new material. Examples of incremental costs are specialequipment such as compactors, additional collection trucks and crews,new educational materials, and publicity. Analyzing incremental costs ishelpful in deciding what the budgetary effect will be of adding a newmaterial to the collection service.
Allocated costs are the ongoing operational costs of collection, sorting,baling, etc., assigned to each material handled by the program. Allocatedcosts are usually expressed in dollars per ton, even though allocationsmay be based on various complicated factors such as time required forcollection or percent of volume occupied in the collection truck.Allocated-cost analysis provides a basis for comparing the costs ofcollecting plastic containers with the costs of collecting other materials.

Report of the Berkeley Plastics Task Force 26
The difference between incremental and allocated costs can be illustratedthis way: if adding a material requires buying a new baler and adding oneperson to the payroll, the purchase and added staff are incremental costs.But when the baler is up and running, if it processes three existingmaterials in addition to the new one, allocating the costs would divide theoperating costs among both new and existing materials according to howmuch cost they incurred in baler time and maintenance. Similarly, addinga new staff person may be an incremental cost. But once he or she is onthe payroll, the total staffing costs can be allocated among the new andexisting materials according to the labor they require.
Incremental and allocated costs of adding plastic bottles toBerkeley recycling programs
Community Conservation Centers (CCC) accepts PET and natural HDPEbottles at both its recycling centers and purchases California redemptionvalue PET at The BuyBack. Although some capital costs must be incurredto increase storage capacity and security, CCC found that market prices inearly 1995 were high enough to cover the costs of processing andmarketing the bottles.
The City of Berkeley’s commercial collection program has been collectingplastic bottles from 45 bars and restaurants for several months. Theprogram collects several hundred pounds of plastic each week, mostlyHDPE. (Note: most of this report calculates materials in tons, not pounds.)In 1995 City staff estimated that the only additional cost to add plastics toall commercial collection accounts would be one-half fulltime-equivalent(FTE) collection worker. City staff has recently revised estimated tonnagefrom the commercial program to include service to 9,000 apartmenthouseholds in large buildings, more than a hundred food serviceestablishments, and 500 other buildings. Estimates for the expandedprogram are 21 tons of PET and 50 tons of HDPE annually.
Processing costs must also be considered. CCC processes materials fromthe City and the Ecology Center, and to expand commercial collection orbegin residential curbside collection of plastic bottles, CCC’s currentsorting system for glass and cans must be improved. CCC estimates thecapital costs for these improvements at $64,100. CCC also estimates thatone additional sorter will be needed to sort the tonnage projected forboth the commercial and curbside programs. Additional costs must bealso be considered for handling, perhaps baling, and transporting bales orunbaled containers to local buyers. CCC has estimated the incrementalcosts for adding sorting personnel, baling time and supplies, shipping,

Report of the Berkeley Plastics Task Force 27
and overhead to be more than $200 per ton. The estimate was based onsorting 194 tons annually of two types of plastic from loads of mixedbottles and cans.
Accurately forecasting the volume of plastic expected to be set out forcollection is critically important for the curbside collection program.Enough truck capacity must be provided to handle the new material aswell as the increase in participation that normally occurs after a freshpublic education program. The anticipated weight and volume depend ona number of factors such as the market share of plastic compared to othercontainer types, whether they have deposit or redemption value, anddemographic profiles of the neighborhoods served.
The American Plastics Council (APC) conducted extensive research onplastic-bottle recycling from 1992 to 1994 and published their results in a1995 report, How to Collect Plastic for Recycling.57 The APC studiedcurbside and dropoff programs across the country and collected extensivedata on how many plastic bottles were available and set out for recycling.Three of the programs studied were in states with beverage containerredemption or deposit legislation (“bottle-bill” states): San Francisco,California; West Linn, Oregon; and Springfield, Massachusetts. This reportwill use the results from San Francisco and the average for the threebottle-bill states to model a collection program for Berkeley.
The APC study found the following “generation rates,” which includeamounts found in household recycling bins and garbage cans but excludebottles discarded away from home or taken to recycling or redemptioncenters.
Table 5: Plastic Bottle Generation RatesSan Francisco(lbs/househo
ld/yr)
Bottle BillStates
(lbs/household/yr)
PET sodacustom
1.32.8
1.12.4
Total PET 4.1 3.5
57 American Plastics Council, How to Collect Plastic for Recycling, 1995.

Report of the Berkeley Plastics Task Force 28
NaturalHDPE*
5.7 12.6
Total,PET andHDPE
9.8 16.1
*Milk and sodajugs.
San Francisco had significantly less natural HDPE than any other city inthe study. The APC suggests that this might be due to the nature of thesampled routes, and that perhaps fewer families had small children.
A rough estimate of the tonnage available for collection can be obtainedby applying the following calculation:
tonnage available = (the number of households served by theprogram) x (the generation rate in lbs/yr) x (the participation rate)x (the capture rate) / (2000 lbs/ton).
The participation rate is the percentage of households that participate inthe program at least once a month. The capture rate is the percentage ofthe materials that are actually set out for curbside recycling and nottossed in the trash or taken to a recycling center. Of course, generation,participation, and capture rates vary due to a great number of factorsincluding family size, education and promotion campaigns, and collectionmethods.
The APC study recorded an average participation rate of 71% in the sixstudy programs, and capture rates for HDPE and PET were about 65%. TheEcology Center’s curbside recycling program serves about 35,000households residing in single-family and multi-family buildings up to nineunits. Using the generation and participation rates found by the APCstudy, the calculations are:
San Francisco used as basis (35,000 households) x (9.8 lbs/yr) x (71% participation) x (65%capture) / 2000 lbs/ton = 79 tons/year capturable in Berkeley
Bottle Bill States Average used as basis (35,000 households) x (16 lbs/yr) x (71% participation) x (65%capture) / 2000 lbs/ton
= 129 tons/year capturable in Berkeley
These calculations can be further refined by using the capture rates foreach bottle type. These are: 48% for custom PET, 60% for soda PET, and

Report of the Berkeley Plastics Task Force 29
70% for natural HDPE. The resulting tonnages are shown in the followingchart:
Table 6: Second Estimate of Plastic BottlesCapturable in Berkeley
Basis:San
Francisco(tons/yr)
Basis:Bottle-Bill
StatesAverage
(tons/yr)PET soda
custom9.7
16.78.2
14.3Total PET 26.4 22.5Natural HDPE 49.6 109.6Total,PET andHDPE
76.0 132.1
The PET tonnage is lower than the estimate of 50 tons made in 1995 bythe Ecology Center, CCC, and City staff. The HDPE tonnage isconsiderably lower than the 200 annual tons first estimated. Until a betterestimate is available, the bottle-bill states’ average of 132.1 tons will beassumed to approximate the tonnage of plastic bottles available forcollection in Berkeley.
To gain a fuller understanding for good program planning, however, weneed not just an average tonnage, but an anticipated range for bothtonnage and volume. For reference, we will set the anticipatedHDPE tonnage range at a low of 76 tons per year and a high of160, with an average of 132. Now the volume of the materials mustbe found.
The APC study found the average density of materials set out for curbsidecollection to be 32 pounds per cubic yard for PET (soda and custom) and20 pounds per cubic yard for natural HDPE. For the anticipated annualtonnage, the collection program would be expected to pick up a low of25.5 cubic yards, a high of 58 cubic yards, and an average of 47 cubicyards every day, five days a week, 52 weeks per year.
The APC uses another method to calculate truck requirements for bottlesand cans. It recommends using data they collected on average set-outvolumes and set-out rates.58 This method results in somewhat higher 58 Ibid., Table VIII, p. 19.

Report of the Berkeley Plastics Task Force 30
capacity requirements but is perhaps more accurate since it is derived bymeasuring actual set-outs in the study areas.
The APC’s data reflects an assumed set-out rate of 48% and 1,000households per route. In Berkeley, an average of 7,000 households areserved per day. With those assumptions, the APC’s calculation can beapplied to Berkeley with the following results:
Table 7: Average Daily Volume Capturablein Berkeley Using APC Assumptions
Material Average DailyVolume
Cu.yds/route
(1,000household
s)
Cu. yds/day
(7,000household
s)Cans 4.6 32.2Glass 5.6 39.2Plastic 8.2 57.4
Total 18.4 128.8
Therefore, average daily volume can be estimated at 129 cubic yards perday for all container types, with plastic bottles accounting for 57.4 cubicyards per day.
The Ecology Center has five high-capacity trucks, each with a capacity of30 – 35 cubic yards; two 1990 bin trucks at 17 cubic yards; and two olderbin trucks for backup. The seven trucks in regular use have a combinedcapacity for glass and cans of just over 60 cubic yards. Thus, if each truckcould make two full trips every day and every route were average, only afew yards of extra capacity would be required and could probably beaccommodated with the backup trucks. This calculation also assumes thatplastic could be collected commingled with both cans and glass.Commingling adds processing costs but avoids the additional costsassociated with supplying and collecting an additional curbside tote box.
In Berkeley, demographics, terrain, and the existing refuse collection daysrequire curbside recycling collection routes that vary widely from thestatistical average. The routes with highest participation are often theleast efficient to collect because they are far from the recycling yard, thestops are far apart, and narrow and dead-end streets require extra timefor maneuvering. Therefore, it is not always possible to collect two fulltrucks in an eight-hour shift from routes on the eastern side of Berkeley.

Report of the Berkeley Plastics Task Force 31
Also, in high-participation areas, one route cannot serve a thousandhouses per day, so more and smaller routes are necessary.
Replacing the two bin trucks with high-capacity trucks would add about 9cubic yards for glass, cans, and plastics (increasing capacity to 70 cubicyards ) without requiring additional staff. If the bin trucks were also usedon heavy days, total capacity would be over 80 cubic yards for one trip,with an additional 40 – 50 cubic yards available for second trips and theremaining 30 – 40 cubic yards available for overtime collection on heavydays.
One option is to add plastic compactors to all seven trucks to increasecollection capacity. The APC study did extensive testing of severaldifferent makes and models of on-board compactors. They increaseloading time on the route but also increase collection capacity somewhat.Overall, however, the study found on-board compaction to be of marginaluse in bottle-bill states using commingled collection. Adding compactorsin the space behind the cab of the Lodal trucks (two bin trucks and threehigh-capacity trucks) and under the frame of the other two high-capacitytrucks might provide necessary overflow capacity to prevent thecontainer compartments from filling up before the paper sections. Thisinstallation would require the collectors to manually sort plastic at thecurb, adding considerable time to the collection.
Also, all the compactors tested in the APC study had features that madethem either inconvenient or difficult to load and unload. One of the testroutes, in West Linn, Oregon, used a compactor for commingled cans andplastic. The test showed that there was no problem with interlocking thematerials, which could be routinely processed at the sorting facility. Theparticular compactor tested in the study is too small to be of use on theEcology Center’s trucks, but the idea might be expanded into somethinguseful locally. If a compactor could be fed from the overhead troughs andfitted to use the entire can compartment for storage of compacted cansand plastic, collection capacity would be added with very little increase incollection time.Clearly, the alternatives for collection should be analyzed beforeinvestment is made in new equipment. However, a range of costs can bedetermined for the scenarios suggested above.
1. Overflow compactors for plastic only, 7 trucks $ 70,0002. Overflow (2) and commingled (5) compactors 95,0003. One new collection truck 130,0004. One new truck, commingled compactors 6 trucks220,000

Report of the Berkeley Plastics Task Force 32
5. One new truck, commingled (6) and overflow (2) compactors240,000
6. Two new collection trucks 260,0007. Two new trucks, commingled compactors 7 trucks365,0008. Two new trucks, commingled (7) and overflow (2) compactors
385,000Additional routes would have to be added and more trips made, so therewould be an increase in labor and operating expenses, such as fuel andmaintenance. Test or pilot routes could be done in various areas of theCity to provide data on participation, collection time, and volumes. Thesedata could be used to predict closely the additional operating costsnecessary to add plastic bottles to the curbside collection program. In theabsence of real data, an example can be modeled on the APC study andknowledge of the local conditions and program.
We have calculated incremental operating costs for adding plastic bottlesbased on the following assumptions:
1. Three new routes are required, an increase of 10%.2. All routes require two or three trips, for a total of 70 trips per
week, an increase of 30%.3. An average of 0.6 extra hours per route would needed to collect
plastic; half of this increase can be accommodated in the regularshifts, and half results in overtime.
Those assumptions would add these approximate additional costs:1. Three driver-days per week = .6 full-time equivalent driver
$23,0002. Thirty percent increase in fuel and maintenance costs 8,5003. Overtime pay for 0.6 hours @ half of 33 routes /week
@ 1.3 crew per route 14,270 Estimated Annual Incremental Operating Expenses
$45,770
These figures are indicative but not complete. Other factors may increaseor decrease incremental expenses. For example, adding a new truck wouldincrease insurance expense, while replacing the bin trucks wouldeliminate the cost for forklift operation, fuel, and maintenance. Apotential savings from re-routing might be used to offset some of theadditional operating costs.
Projected revenues
Market prices for plastic bottles in 1996 have dropped dramatically fromthe high experienced during 1995. In California, however, PET prices are

Report of the Berkeley Plastics Task Force 33
subsidized by the plastics industry and should therefore remain high aslong as container redemption legislation is in effect. The following tableindicates the revenue expected at today’s market prices.
Table 8: Annual Revenue Expected from Sale of Collected PETand HDPE
Program PET
tons
Sales PET crv*
HDPE
tons
Sales Tota l
Tons
TotalSales
Dropoff 6 $4,620
$2,520 32 $4,480
38 $11,620
BuyBack 12 9,240 12 9,240Curbside
23 17,710
7,820 110 15,400
133 40,930
Commercial
21 16,170
6,720 50 7,000
71 29,890
Totals: 62 $47,740
$17,060
192 $26,880
254 $91,680
*California redemption value; not included for BuyBack since it is paid tocustomers.
Summary of costs for adding plastic bottles to Berkeleyrecycling programs
Adding plastic bottles to the recycling system in Berkeley could be donethrough some or all of the existing programs. PET and HDPE are alreadyaccepted at the dropoffs, and the BuyBack began purchasing PET on April2, 1996. The cost for these additions is expected to be covered by therevenue from sales. Advertising the program would boost tonnage.
Adding plastic bottles to the residential curbside and commercialcollection programs would increase the tonnage collected, but at a netcost per ton. To make the addition, the sorting system must be expandedto process plastic commingled with other containers from either thecurbside or commercial programs. So it would make economic sense toadd plastics to both household and commercial programs if the expansionis done.
Table 9 shows the costs and revenues for adding plastic bottles to boththe commercial and curbside programs. The table includes revenue from71 tons from commercial collection and 133 from curbside collection. Thecosts include a good public education program and capital costs from

Report of the Berkeley Plastics Task Force 34
scenario 5 above. The net incremental cost for this scenario is $826 perton averaged over the first four years of the program.
If the other capital-cost scenarios are substituted in the table, a range ofnet costs may be obtained. The low end of the range would be $580 perton for scenario #1 and the high would be $1,033 for scenario #8.

Report of the Berkeley Plastics Task Force 35
Table 9: Summary of Costs for Adding Plastic Bottles toCommercial and Curbside Collection in Berkeley
1stYear
2ndYear
3rdYear
4thYear
Total
ProcessingEquipment
$64,100
$64,100
CommercialCollection Public education
10,000 10,000 10,000 10,000 40,000
0.5 FTE collector 27,710 27,710 27,710 27,710 110,840
Processing costs @ $250/ton
17,750 17,750 17,750 17,750 71,000
Curbside Collection Public education 40,000 20,000 20,000 20,000 100,00
0 One truck andcompactors $240,000 loan withinterest @ 40 months
84,444 84,444 84,444 28,148 281,480
Operating costs 45,700 45,770 45,770 45,770 183,080
Processing costs @ $200/ton
26,600 26,600 26,600 26,600 106,400
Total IncrementalCosts
$316,374
$232,274
$232,274
$175,978
$956,900
Revenue Commercial 29,890 29,890 29,890 29,890 119,56
0 Curbside 40,930 40,930 40,930 40,930 163,72
0Total Revenues $70,8
20$70,8
20$70,8
20$70,8
20$283,
280
Net Incremental Cost $245,554
$161,454
$161,454
$105,158
$673,620
Net Cost per Ton $1,204
$791 $791 $515 $826
Links between plastic reprocessing and landfilling

Report of the Berkeley Plastics Task Force 36
The calculations above assume that curbside collection would have noimpact on plastic packaging use. However, it is likely that establishingplastics collection would increase consumption by making plastic appearmore ecologically friendly both to consumers and retailers. By makingplastics seem ecologically friendly, collecting plastics at curbside wouldlegitimize the production and marketing of packaging made from virginplastic. But much of this packaging is in fact unrecyclable, so the effectcould be a net increase in the amount of plastic discarded, collected asgarbage at City expense, and sent to the landfill.
This is our reasoning: curbside collection would divert only about 8.4% ofthe available discarded plastic from waste, so even a small increase inplastic packaging sales would increase the plastic landfilled. Ifconsumption of plastic packaging (all resin types) increased by only 9.2%,the amount of discarded plastic going to landfill would increase the totalweight of solid waste by 0.3%. This is about the same amount that wouldbe saved by collecting plastics at the curb. Thus, if collecting plasticscontributed to any increase more than 9.2% or more in plastic packagingconsumption, initiating a curbside pickup program would actually lead toan increase in the amount of plastic sent to the landfill.
The degree of contamination affects the net cost of operation, because ofthe cost of sorting out unacceptable materials and landfilling thecontaminants, and because any impossible-to-remove residualcontamination lowers the value of the product. It is reasonable to expectcostly rejection of entire loads if exacting specifications are not reached,as recyclers have experienced with other materials. In mixed-plasticcollection schemes, the contamination problem is amplified.
Two basic strategies have emerged: one is to accept only certain types ofplastic as indicated by the code number on the bottom of each container.While this approach lowers processing costs by providing some degree ofseparation at the source, the public must be educated and the curbsidehandlers must be trained. Truck drivers must invest considerable time insorting at the curb and in providing educational feedback to theresidents. The other strategy is to collect all types of plastic bottles andsort them at the processing location.
8. HOW SOME OTHER COMMUNITIES HAVE HANDLEDPLASTICS
As we have seen in the previous section, even when we use figures fromindustry sources, we are still left with major questions unanswered.

Report of the Berkeley Plastics Task Force 37
Ideally, someday all discards will be reused or recycled and none will bewasted. But what should be done today necessarily comes down to howscarce resources and funds can be used most effectively.
Published studies and phone conversations with discard handlers in othercommunities can provide valuable perspective. What we find is widevariation in programs. Major variables include the type of sorting thatoccurs; the degree to which plastic container manufacturers participate;and how much plastic handling is integrated into the rest of the discardmanagement system.
St. Paul, Minnesota
The Saint Paul Neighborhood Energy Consortium (NEC) studied whetherto add plastic bottles to the City of Saint Paul’s existing curbside recyclingprogram.59 They estimated that curbside collection of PET and HDPE (#1and 2) could cost $334 per ton for labor and equipment. Sorting wouldadd $110 per ton. Collecting only PET at curbside would cost between$245 and $325 per ton. These figures compare favorably with those fromother midwestern and eastern cities, which ranged from $300 to $1400per ton.60
In all the cases they studied, taxpayers pay the costs of collection andsorting. While PET and HDPE plastic bottles would have made up onlyabout 3% of the recyclables collected, they would account for 12% of thecollection budget. Based on their study, the NEC concluded that it wouldnot be in the interest of the Saint Paul taxpayers or the city’s naturalenvironment to add plastics to the recycling program unless it were donethrough additional dropoff sites. They noted that the public was notasking for collection of plastics when the study was done in April 1994.Rather, a plastics industry organization had initiated the discussion. Noother packaging industry had come forward to ask that their materials beadded to the Saint Paul program.
The Saint Paul researchers concluded that while curbside collection ofplastics might serve the interests of the plastics industry, it was notbeneficial to the residents of Saint Paul and, in fact, could jeopardize theexisting recycling program.
59 Saint Paul Neighborhood Energy Consortium, “Residential Collection of Plastics in
Saint Paul: A Report on the Economics of Collection, End Markets, and ProgramFeasibility”, April 1994.
60 Chaz Miller, “HDPE: High-Density Polyethylene Bottles and Containers”, WasteAge, August, 1995, p.85.

Report of the Berkeley Plastics Task Force 38
Philadelphia, Pennsylvania
The City of Philadelphia provides curbside recycling services to 560,000households. Budgetary limitations forced the recycling office to stopcollecting plastics. Plastics were dropped instead of other materialsbecause of their low density. Plastic took up about 45% of the collectionvolume but contributed only 6% of the weight.61
El Cerrito, California
The City of El Cerrito picks up PET containers at curbside. The manager ofthe collection program estimates that 1/4 to 1/3 of all the plasticscollected are incompatible or unrecyclable and must be sent to a landfill.Plastics collected at curbside are less contaminated than the plasticscollected at the dropoff facility because the El Cerrito collection crews aretrained to hand-sort the materials that residents set out, and they leavethe unrecyclable plastics in the collection bins. The recycling programdirector indicated that a major problem is the confusion caused by thechasing arrows symbol, as discussed earlier. Since the symbol appears onso many things, it causes the public to think that all plastics arerecyclable.62
Sonoma County, California
Sonoma County cut waste at its landfills by 39% from 1989 to 1995despite rapid population growth. Little of this change had to do withincreased curbside program participation. Instead, consumers purchasedless and therefore threw away less disposable packaging. Shoppers whoavoided elaborately wrapped goods not only reduced waste but sent amessage to retailers that overpackaged goods were not acceptable.63
Germany
Germany's Green Dot program illustrates the “polluter pays” principle.The Green Dot program requires industries to take back, reuse, or recyclepackaging materials including plastics. Companies that do so arepermitted to display the ecomark Green Dot on their product.
61 Personal correspondence with Tom Klein, City of Philadelphia Recycling Office,
March 22, 1996.62 Personal correspondence with the General Manager of the El Cerrito Recycling
Center, El Cerrito, CA, January 6, 1995.63 “Well on the Way to a Lofty Goal,” The Sonoma County Press Democrat, June 17,
1995.

Report of the Berkeley Plastics Task Force 39
The program was implemented by national ordinance in 1993, and byearly 1994 several changes had occurred. Packaging consumption hadbeen reduced by 4%; the proportion of beverages sold in refillablecontainers had increased; reusable and recyclable shipping containershad been developed; and many other product packages had beeneliminated or were made easier to recycle. One of the provisions in thelegislation was that stores were required to provide bins for customers touse for discarded packaging. This requirement led retailers to pressuresuppliers to reduce these materials.
The German program is not without its problems. Since the main drive ofthe program was to preserve shrinking landfill capacity, closing thematerials-flow loop was not imperative. As a result, Germany exports post-consumer plastic and other materials, some of which are highlycontaminated.64 Much of these exports go to Asia, where some isreclaimed and the rest is openly dumped. Also, the packaging industrywas permitted to establish a separate, privately financed operation, calledDuales System Deutschland (DSD) to collect and sort packaging materials.DSD has run out of capacity and is experiencing financial problemsbecause of delinquent Green Dot payments from industry.65 Problemswith the program notwithstanding, transferring responsibility to productand packaging manufacturers has yielded positive results, most visibly inthe reduced volume of packaging.
Taiwan
Taiwan instigated mandatory recycling of PET soft drink bottles becauseof shrinking landfill capacity. The country's twelve soft-drinkmanufacturers put out receptacles for the bottles, collect and sort them,and pay for baling. Baled plastic material is picked up and converted toreusable resin by a recycling corporation established by the country's twolargest PET bottle makers.
The industries that participate are permitted to display an ecomark ontheir products. An important feature of the program is governmentallyarranged education in the nation’s grade schools about the environmentalbenefits of purchasing ecomarked products. Similar systems are being setup for other products, including soy sauce containers.
64 Plastics Recycling Update, Resource Recycling, publisher, v8, No.11, November
1995.65 Bette K. Fishbein, Germany, Garbage, and the Green Dot: Challenging the
Throwaway Society, Inform, 1994.

Report of the Berkeley Plastics Task Force 40
This is one program that facilitates primary, not secondary, recycling.Since the post-consumer material goes directly back to the manufacturers,there is a strong incentive to consider recyclability and source reductionas a part of product design. One problem with the program was that itinitially required authoritarian government intervention to get it going,and that encountered strong resistance from businesses.66 Nevertheless,by late 1995 more than 65% of Taiwan’s PET bottles were beingrecycled.67
Some common elements
These examples teach us the following :• Collecting discarded plastics at curbside and processing them is
expensive and requires subsidies, usually from taxpayers.• Increasing the collection of high-density non-plastic materials
(paper, magazines, and yard debris) can be a more cost effectiveway to reduce the municipal solid waste stream than collectingplastics.
• A large percentage of the target plastic material will be missed bycollection programs (even Taiwan’s comprehensive PETreclamation program lets more than 30% of the targetedcontainers slip through to the landfill).
• Collected material includes a percentage of unusablecontamination that must be landfilled.
• Recycling programs providing benefits such as closed-loopmaterial flow and highest and best use of resources work bestwith full participation by the companies that make the materialin the first place. Programs that make manufacturers takeresponsibility for the life of the materials they produce, as inGermany and Taiwan, have the best results.
9. SEVEN COMMON MISCONCEPTIONS ABOUT PLASTICS
This investigation into plastic packaging has revealed a great deal ofinformation. Most plastic packaging is used only once, its chemicalstability keeps it from degrading in the environment for many years, andit is accumulating in landfills. The processes that produce the plastics use
66 George C. Lodge and J.F. Rayport, “Knee-deep and Rising: America's Recycling
Crisis,” Harvard Business Review, Sept.-Oct. 1991, p.134.67 “Plastics Recycling Update,” op.cit.

Report of the Berkeley Plastics Task Force 41
fossil resources, pollute the air and water, and consume large amounts ofenergy.
It seems clear that producing and using plastic as a packaging material,and taking market share from more recyclable and reusable packaging, isa bad idea from an environmental standpoint. So why is the plasticpackaging business growing? One big reason is that popularmisconceptions about plastic production and reprocessing contribute tothe industry’s growth. Some of them are presented here.
Misconception # 1: Plastics that go into a curbside recycling binget recycled.
Not necessarily. Many plastics are unrecyclable, and the recyclable onesmust be separated out. The rest go to waste.
Collecting plastic packaging at curbside fosters the belief that, likealuminum and glass, the recovered material is converted into newpackaging. In fact, most recovered plastic packaging is not made intopackaging again but into new secondary products such as textiles, parkinglot bumpers, or plastic lumber – all unrecyclable products. This does notreduce the use of virgin materials in plastic packaging.
One of the goals of the Council for Solid Waste Solutions, an industryassociation formed by major resin producing companies, is to increasecurbside pickup of plastics. The Council’s “Blueprint for Plastic Recycling”is aimed squarely at convincing the 6,000 or so municipalities around thecountry that already have curbside recycling service to add plastics.68
How this material is to be handled after being picked up is not addressedin the blueprint, however. In many cases, communities have adoptedcollection programs only to find that there is no reasonable market forthe material, or that they must incur additional costs to clean andseparate it to market specifications. “Recycled” in these cases merelymeans “collected,” not reprocessed or converted into usefulproducts.
Misconception # 2: Curbside collection will reduce the amountof plastic landfilled.
Not necessarily. If establishing collection makes plastic packages seemmore environmentally friendly, people may feel comfortable buyingmore. Curbside plastic collection programs, intended to reduce municipal
68 Recycling Today, May 1991, p.60.

Report of the Berkeley Plastics Task Force 42
plastic waste, might backfire if total use rises faster than collection. Sinceonly a fraction of certain types of plastic could realistically be capturedby a curbside program, the net impact of initiating curbside collectioncould be an increase in the amount of plastic landfilled.
Furthermore, since most plastic reprocessing leads to secondary productsthat are not themselves recycled, this material is only temporarilydiverted from landfills.
Misconception # 3: A chasing arrows symbol means a plasticcontainer is recyclable.
The arrows are meaningless.
Every plastic container is marked with the chasing arrows symbol. Asurvey of 804 people in Saint Paul, Minnesota, revealed that 7 out of 10people believed the symbol means “recyclable.”69 Many even believe thesymbol indicates the container is composed of recycled material. Actually,the only information in the symbol is the number inside the arrows,which indicates the general class of resin used to make the container.
The plastics industry adopted this symbol in 1988 to identify the resinswhen state legislatures were discussing bans on plastic containers. But theplastics industry says it never intended the chasing arrows to indicaterecyclability or identify recycled content, but only to be a catchy graphicto point out the number inside that identifies the type of resin.70 Thesymbol is misleading; nevertheless, the plastics industry has resistedconsumers’ efforts to modify it.71
The attorneys general of 11 states also objected to false and misleadingclaims about plastic recyclability. The recent settlement that they reachedwith the American Plastics Council paves the way for a first-everdefinition of what claims can or cannot be made about plastic recyclingand recyclability.72
69 Saint Paul Neighborhood Energy Consortium, op.cit.70 SPI Resin Identification Code: A White Paper to Evaluate Options To Improve the
Code’s Effectiveness, a joint publication of the National Recycling Coalition andThe Society of the Plastics Industry, July 28, 1993.
71 V. Wigotsky, “To Market To Market,” Plastics Engineering, June 1995, p.16.72 Tom Ford and Roger King, “APC Accord Limits Recycling Claims,” Waste News,
January 8, 1996, p.12.

Report of the Berkeley Plastics Task Force 43
Misconception # 4: Packaging resins are made from petroleumrefineries’ waste.
Plastic resins are made from non-renewable natural resources that couldbe used for a variety of other applications or conserved.
Some people believe that the raw materials for packaging plastics comefrom an otherwise useless industrial waste stream. They believe that ifthese plastics were not made, the raw materials would be dumped into theenvironment as a hazardous waste. But actually, most packaging plasticsare made from the same natural gas used in homes to heat water andcook.
Misconception # 5: Plastics recyclers pay to promote plastics’recyclability.
No; virgin resin producers pay for the bulk of these ads.
Billboards that claim plastic is recyclable and beseech consumers to getinvolved imply that plastic recycling is an established industryimpatiently awaiting consumer participation. In fact, most such ads areplaced by virgin plastic manufacturers whose goal is to promote plasticsales. These advertisements are aimed at removing or diminishing virginplastic’s greatest challenge to market expansion: negative publicconception of plastic as unrecyclable, environmentally harmful, and amajor component of wastes that must be landfilled or burned.
Misconception # 6: Using plastic containers conserves energy.
When the equation includes the energy used to synthesize the plasticresin, making plastic containers uses as much energy as making glasscontainers from virgin materials, and much more than making glasscontainers from recycled materials. Using refillables is most energyconservative.
Energy use studies that compare various packaging materials often do notaccount for the large amount of energy required to synthesize plasticresin. Most of the energy and environmental costs of plastics are hiddenbecause they are incurred in the plastic factory. Also, life-cycleassessments often assume containers will be used only once. The practicesof refilling and reuse, especially if carried out on the local level, have thegreatest potential for reducing energy consumption no matter whatmaterial is used to make the containers.

Report of the Berkeley Plastics Task Force 44
Misconception # 7: Our choice is limited to recycling orwasting.
Source reduction is preferable for many types of plastic and isn’t difficult.Opportunities include using refillable containers, buying in bulk, buyingthings that don’t need much packaging, and buying things in recyclableand recycled packages.
Many people take plastic packaging as a given and narrow the issue downto the simple question of how best to dispose of it. In the resultingturmoil, obvious alternatives may be overlooked, such as reducing oreliminating our consumption of plastic packaging. Simple, effectivesource-reduction strategies for individuals and households are: a) usingrefillable containers; b) buying in bulk; c) selecting products that use littleor no packaging, and d) choosing packaging materials that can berecycled and are made from recycled materials such as glass, metal, andpaper. Holding companies accountable for the material they sell bylegislatively demanding recycled content also has been shown to work onthe city, state, and national levels.
Why are there so many misconceptions? The use of plastic as a packagingmaterial is on the rise. Since so many products are available in plasticpackaging, the choice of plastic is a matter of convenience. The desire forconvenience coupled with a throwaway mentality or culture supports theflow of disposable plastic packaging. Yet people are concerned about theaccumulation of discarded plastic in landfills and in the environment;they show this by participating at a high level in curbside collectionprograms and voting for mandatory container deposits. The conflict ofinterest between the convenience of throwaway containers andresponsibility for long-lasting waste and environmental damage hasshifted public hope and attention to plastic recycling.
The popular ideal appears to be for some sort of technologicalbreakthrough to make using plastic acceptable without requiring anychange in consumption or discard practices. The plastics industry hasresponded by advertising plastic recyclability and joining the chorus oftechnological optimism while continuing to promote the consumption ofsingle-use plastics.
10. ALTERNATIVES
How can we address the problems posed by plastic packaging in aconstructive way? There are five main actions the public can take.

Report of the Berkeley Plastics Task Force 45
Reduce the use – source reduction.
The most direct way to eliminate the problems that stem from producing,using, and disposing of plastic packaging is to reduce the use ofpackaging. Retailers and consumers can select products that use little orno packaging, and when packaging is necessary, select packagingmaterials that are recycled into new packaging — such as glass,aluminum, and paper. Many product manufacturers, such as waterbottlers, have only recently switched from an easily recyclable containerto plastic. If people refuse plastic as a packaging material, the industrywill decrease production for that purpose, and the associated problemssuch as energy use, pollution, and adverse health effects will diminish.Established waste management groups cannot be expected to organize orsupport source reduction efforts. For example, the primary plasticrecycling entity, the American Plastics Council, does not include sourcereduction in its charter and systematically overlooked it73 until recently,when it began promoting lighter-weight packages as source reduction.74
This “solution” creates the same high number of containers and tends tolegitimize their production. Reducing the use lies in the hands ofconsumers, retailers, and elected officials.
Reuse containers.
One effective and inexpensive source-reduction technique is containerreuse. Since refillable plastic containers can be reused about 25 times,container reuse can lead to a substantial reduction in the demand fordisposable plastic. The direct result is reduced use of materials andenergy, with the consequent reduced environmental impacts. In addition,some important indirect benefits stem from container reuse. If reusebecomes a market objective, resin and container designers will take intoaccount the fate of the container beyond the point of sale and considerthe service the container provides. “Design for service” differs sharplyfrom the “design for disposal” paradigm underlying most plasticpackaging today. As with take-back programs, reuse makes new demandson both the material and the infrastructure. Container makers candirectly participate in developing a refilling infrastructure andencouraging public participation. An innovative approach to encourageconsumers to choose reusable and refillable containers could be toinclude these containers in curbside collection services. The benefit ofsuch an approach or any public education program that promotes reuse 73 “Management of Plastic Wastes in the ECE Region,” United Nations Publication
E.93.II.E.3, New York, N.Y., 1992, p.44.74 American Plastics Council full-page advertisement in the Atlantic Monthly, April
1996, for packages that are lighter now compared to 20 years ago.

Report of the Berkeley Plastics Task Force 46
would be a higher level of public awareness about how their choices inconsumption affect the environment.
Require producers to take back resins.
Getting plastic manufacturers directly involved with plastic disposal andwaste closes the materials loop, which can lead to developing morerecyclable materials and establishing an infrastructure to accomplish thereprocessing. Closing the loop stimulates designers and manufacturers toconsider the product’s life cycle from cradle to grave.
Container makers can make reprocessing easier by limiting the number ofcontainer types and shapes, using only one type of resin in eachcontainer, making collapsible containers, using water-dispersibleadhesives for labels, and phasing out associated metals such as aluminumseals.75 Resin manufacturers can limit the variety of resins within eachresin type, avoid using pigments, and formulate resins to better withstandpost-consumer processing. Both container and resin makers can helpdevelop the reprocessing infrastructure by taking back plastic fromconsumers.
Legislatively require recycled content.
Requiring that all containers sold contain a percentage of post-consumermaterial reduces the amount of virgin material consumed. Although notas effective as other source reduction techniques, mandating recycledcontent is one way to implement primary recycling and, as a result, toclose part of the materials-flow loop. Worn-out refillable containers couldbecome a source of feedstock. Incorporating primary recycling into asystem of container reuse would be straightforward, since establishedtransportation lines exist between container makers and filling locations.
If container makers were required to use recycled material, designerswould be stimulated to create containers that are more recyclable. If resinproducers participated in post-consumer plastic processing, polymermaterials would be altered to be more recyclable. In these ways,instituting recycled-content practices would lead to life-cycleconsideration during design and manufacturing.
75 Peter Anderson, op.cit., p.65.

Report of the Berkeley Plastics Task Force 47
Standardize labeling and inform the public.
No matter what kind of program is adopted for dealing with plastics,standardized terms and labels are necessary for the sake of clarity andfairness. The chasing arrows symbol is an example of an ambiguous andmisleading label. Significantly different standardized labels for “recycled,”“recyclable,” and “made of plastic type x” must be developed.
In addition, if a working definition can be found for “ecologicallyfriendly,” an ecomark system similar to those in Taiwan and Germanycould be initiated to distinguish products that conform to the definitionfrom those that do not. An independent entity could be used to audit theenvironmental impact of products and certify conformance. Theimplementation of standards and labeling programs must be accompaniedby public education.
The goal of both standardized labeling and public education is to openaccess to, and activate public participation in, plastic packagingpractices, programs, and policies.
11. CONCLUSIONS
1. Plastic packaging offers advantages such as flexibility and light weight,but it creates problems including consumption of fossil resources,pollution, and high energy use in manufacturing; accumulation ofwasted plastic in the environment; migration of polymers and additivesinto foods; and an abundance of public misinformation about plasticsissues.
2. Curbside collection of discarded plastics is expensive and has limitedbenefits in reducing environmental impacts, diverting resources fromwaste, or achieving mandated recycling goals. Residential curbsidecollection in Berkeley would capture only about 132 tons a year - lessthan one-half of one percent of municipal discards.
3. It is likely that establishing plastics collection would increaseconsumption by making plastic appear more ecologically friendly bothto consumers and retailers. By making plastics seem ecologicallyfriendly, collecting plastics at curbside would legitimize the productionand marketing of packaging made from virgin plastic. But much of thispackaging is in fact unrecyclable, so the effect could be a net increasein the amount of plastic discarded, collected as garbage at Cityexpense, and sent to the landfill

Report of the Berkeley Plastics Task Force 48
4. Increasing the capture rates of aluminum, glass, paper, or yard debrisin Berkeley could divert more resources from landfills than collectingplastics at curbside, since plastics are a small fraction of the wastestream’s weight.
5. Existing plastic recycling practices have significant hidden problems,including the creation of unrecyclable products.
6. The question of whether to recycle plastics or not should be replacedby the question “How can we best reduce the environmental impact ofpackaging?”
7. Strategies that reduce the environmental impact of plastics and lead tosystematic improvements in consumption and disposal practices are to:
• Reduce the use – source reduction;• Reuse containers;• Require producers to take back resins;• Legislatively require recycled content;• Standardize labeling, and• Inform the public.


![CHLORINATED PARAFFINS [ASSESSMENT]echa.europa.eu/.../orats_summary_2-nitrotoluene_en.pdfMelting point - 9.55 ºC Kirk-Othmer, 1996 Boiling point 221.7 ºC Kirk-Othmer, 1996 Relative](https://img.pdfslide.us/doc/110x75/60e045b44c3f5a4210771b47/chlorinated-paraffins-assessmentecha-melting-point-955-c-kirk-othmer-1996.jpg)


![[] Kirk-Othmer Encyclopedia of Chemical Technology(BookZZ.org)-18](https://img.pdfslide.us/doc/110x75/56d6bd641a28ab30168dcd8c/-kirk-othmer-encyclopedia-of-chemical-technologybookzzorg-18.jpg)


