Embed Size (px)
Citation preview

UNIVERSITY OF CALIFORNIA, DAVIS BERKELEY ● DAVIS ● IRVINE ● LOS ANGELES ● MERCED ● RIVERSIDE ● SAN DIEGO ● SAN FRANCISCO ● SANTA BARBARA ● SANTA CRUZ
DEPARTMENT OF ENVIRONMENTAL SCIENCE AND POLICY ONE SHIELDS AVENUE DAVIS, CALIFORNIA 95616-8576
May 29, 2009 Janis Cooke, Environmental Scientist Regional Water Quality Control Board, Central Valley Region 11020 Sun Center Drive, #200 Rancho Cordova, CA 95670 Dear Dr. Cooke: Please find here a report prepared for the Central Valley Regional Water Quality Control Board, Central Valley Region, under SWRCB contract # 06-447-300-0, entitled: "Data synthesis and research on emerging Bay-Delta issues, including the Pelagic Organism Decline". The report estimates the number of anglers and their family-members at risk from consuming mercury in fish from the Delta. There are approximately 10,000 anglers and 40,000 associated family members who are consuming greater than 10 times the USEPA recommended dose of mercury, which puts them at immediate risk of neurological and other harm. The report provides support for the numbers based on my research in this area, where for the last 3 years my graduate students and I have surveyed anglers and community members in the Delta region. This work was conducted in partnership with staff of the Southeast Asian Assistance Center, a service organization for Southeast Asians and others in the Sacramento area. The study constitutes the largest set of interviews, greatest geographic extent, and longest running study of its kind in the Delta. I am available to address and clarify any outstanding issues related to this report. Sincerely, Fraser Shilling, Ph.D., Staff Research Associate Department of Environmental Science & Policy University of California, Davis [email protected] 530-752-7859

1
Memorandum
Characterizing High Mercury Exposure Rates of Delta Subsistence Fishers
Report to the Central Valley Regional Water Quality Control Board Fraser Shilling, Ph.D., Department of Environmental Science and Policy, University of California, Davis May 29, 2009
Summary
Fish consumption is the primary pathway for mercury ingestion among the general public. My recent research at UC Davis has shown that approximately half of anglers and their families in the Sacramento San Joaquin River Delta may consume more than the USEPA reference dose for mercury (a safe dose unlikely to result in health effects) and 5 to 6% of anglers may consume 10 times the reference dose. A rate of intake that is ten times the reference dose places them and their families at immediate risk of mercury-related health impacts. These findings resulted from a survey of over 500 anglers and community members between 2005 and 2008 throughout the Delta. The survey included quantification of consumption rate of individual fish species which, when combined with average mercury concentrations for these species, allowed for calculation of mercury intake rates. There are approximately 170,000 licensed anglers in the Delta, meaning that up to 10,000 anglers and their families may be exposed to poisonous levels of mercury in their fish intake. This memorandum characterizes this high-intake rate population and briefly describes analyses that can improve knowledge of both rates of mercury intake and ethnic and geographic diversity associated with elevated rates.
This report was prepared for the Central Valley Regional Water Quality Control Board (SWRCB contract #
etc.)
Background
The US Department of the Interior estimates that 10% of Californians engage in sport and subsistence-fishing (USDI et al. 2003), many of whom fish in the watersheds of the Sacramento-San Joaquin River Delta and San Francisco Bay. Subsistence fishing in areas with fish contamination creates the need for immediate policy initiatives, both to educate anglers about contamination and to speed the rate of remediation of the contamination. In California, fish contamination from mercury, polychlorinated biphenyls (PCBs), and other chemicals threatens fish consumption as a part of the daily diet. Subsistence fishing is prevalent throughout the world, but tends not to be viewed as a behavior characteristic of urban communities. Urban California contains broad ethnic diversity, including many recently-arrived immigrants who appear to have retained the cultural and economic practice of subsistence fishing. There is very high ethnic and language diversity in the Delta region of the Central Valley. Recently-arrived Hmong, Cambodian, Vietnamese, Russian, and Mexican populations are common in Central Valley urban areas (Fujimoto 1998). Many of these diverse communities relied on fishing as a cultural and economic practice in their countries of origin and have brought that practice with them. In addition, the social structure and accepted pathways of communication are quite different

2
from the host culture (Fujimoto 1998). This can make effective communication for education and/or decision-making particularly challenging – a problem that is poorly addressed in California state policy. There are also many California-born anglers and fish-consumers in the Delta region who subsistence fish. The Central Valley Regional Water Quality Control Board (hereafter the Central Valley Water Board) has developed a draft total maximum daily load (TMDL) for methyl-mercury in the Delta because of impairment to fish consumed by humans and wildlife (Central Valley Regional Water Quality Control Board 2008). Because the consumption of fish by wildlife and humans is legally protected in these waters as a beneficial use, legally, the state must develop a plan, which is approved by the USEPA, to resolve this impairment. One definition for impairment resolution is reductions of mercury concentrations in fish. Method of Exposure Analysis This study relies on previous research on mercury exposure via fish consumption. In this previous research, we used a food frequency questionnaire (FFQ) to study fish consumption patterns. Survey respondents were asked for a 30-day recall of fish intake from local waters and commercial sources. The vast majority of comparable studies using FFQs have reported accurate findings using this approach among a wide range of nationalities and ethnicities (Villegas et al. 2007; Quandt et al. 2007; Sullivan et al. 2006; Kuster et al. 2006; McNaughton et al. 2005). In cases where the FFQ has been less accurate, it tended to under-estimate actual consumption (Hudson et al. 2006; Lee et al. 2002). Anglers and community members were interviewed in English or the respondents’ native language. A statistical description of fish consumption patterns was presented for the North Delta region of the Central Valley over 3 years (2005-2008), including information about individual fish species and ethnic communities. This information, combined with existing information about fish tissue concentrations of mercury was used as the basis for an exposure analysis. Study Area The study area comprised the North, South, and West Delta regions of the Central Valley, stretching from the cities of Sacramento and Stockton to the city of Fairfield (Figure 1). The waterways included the Sacramento River (the largest in California), the Port of Sacramento Shipping Channel, Montezuma Slough, and the San Joaquin River. Specific sites for surveying along the Sacramento River were: Garcia Bend City Park, Freeport, Clarksburg, and
Figure 1 Study areas in the Delta (rectangles) and angler
effort (dots).
3
Port of Sacramento Shipping Channel. These sites were chosen as high activity sites after a review of CDFG creel survey data and site visits (Figure 1). These areas were also chosen because fish tissue concentrations of mercury are high in the vicinity of the sites (within 10 river miles). Survey Instrument, Sample, & Protocol The survey instrument was designed to cover target fish species, fish consumption rates, health communication, and household demographics. It was designed in 2003 and 2004 in collaboration with the California Department of Public Health and the California Office of Environmental Health Hazard Assessment and is nearly identical to the instrument used in the recently-published study of women attending clinics in Stockton, CA (Silver et al. 2007). There were 17 questions and the questionnaire took about 10 minutes to administer. Answers were recorded on the questionnaire, coded, and transferred to a computer spreadsheet. Fish filet models were used representing 3 different cooked weights of fish filet (1.5 oz., 4.5 oz., and 7.5 oz) in order to allow conservative estimates of actual fish consumption rates. Anglers were chosen for interviews as they were encountered along the river-bank by surveyors. No bias was present in the selection. However, the angler interviews were only conducted in English, which resulted in a failure to interview about 5% of those approached. 373 shore anglers were interviewed during biweekly to monthly site visits between September 2005 and June, 2008. Community members were chosen for interviews based on prior knowledge of Southeast Asian Assistance Center (SAAC) staff that an extended family member fished, but without specific knowledge of how often they fished or ate fish. SAAC staff members live in the communities they serve and have access to households because of community familiarity with the organization. 137 community members were interviewed between December, 2006 and June, 2008. Subjects were told that the survey was about fishing activity along the river and was being conducted to better understand what kinds of fish people were catching and eating. They were not told in advance that the survey was related to concerns about fish contamination. Spatial and Creel Survey Data Fish contamination data up to 2006 were obtained from the California Regional Board, covering almost 30 years of measurements of mercury in various fish species, and from the San Francisco Estuary Institute (SFEI) for 2005 to 2007. Mean mercury concentrations (parts per million or micrograms/gram) were calculated for each target species using values for legal-sized or edible fish at or near the angler survey sites. In the case of striped bass, this corresponded to lengths >18 inches, for sturgeon this corresponded to lengths >48” and for all other fish species lengths >12”, except sunfish, bluegill, and crappie where lengths >6” were used. Survey Data Analysis Fish consumption rates (g/day) were calculated for each individual based on 30-day recall of how much and how often individual types of fish (e.g., catfish) were eaten. Anglers were grouped by major race/ethnicity (e.g., Hispanic) according to Census Bureau classification. Minor ethnicity (e.g., Lao) was also recorded when the survey respondent provided sufficient information for the classification. Rates of mercury intake were calculated for individuals based on individual consumption rates determined
4
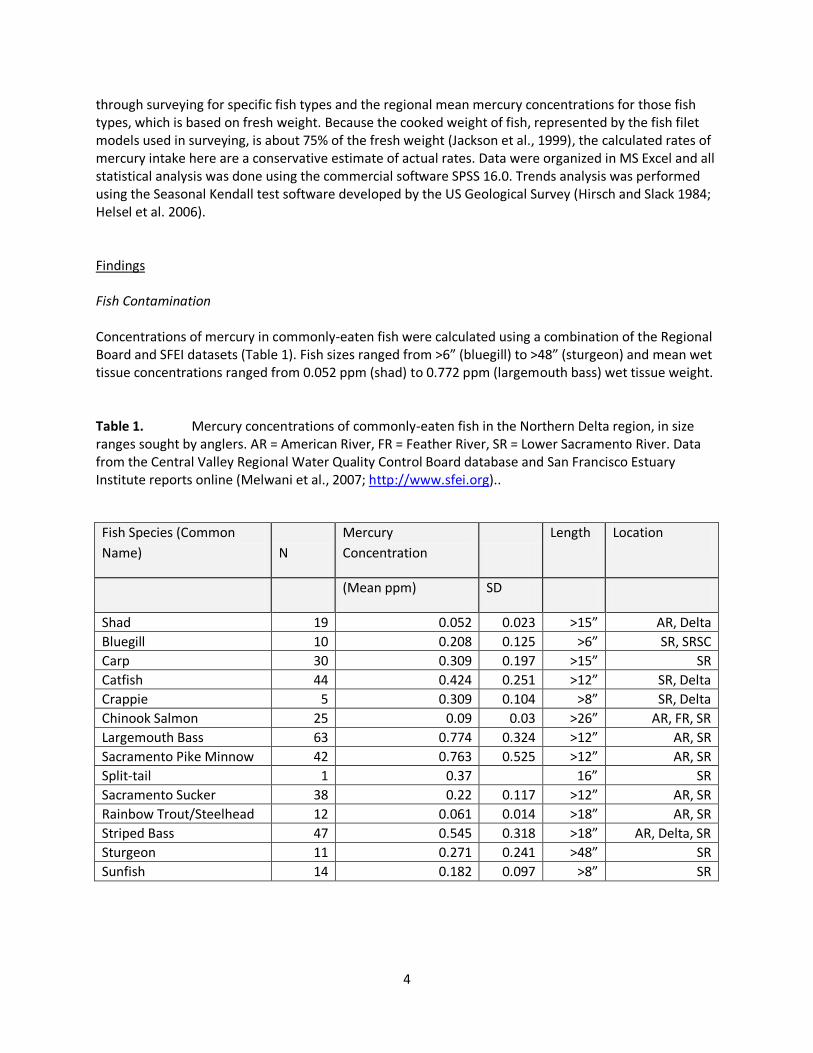
through surveying for specific fish types and the regional mean mercury concentrations for those fish types, which is based on fresh weight. Because the cooked weight of fish, represented by the fish filet models used in surveying, is about 75% of the fresh weight (Jackson et al., 1999), the calculated rates of mercury intake here are a conservative estimate of actual rates. Data were organized in MS Excel and all statistical analysis was done using the commercial software SPSS 16.0. Trends analysis was performed using the Seasonal Kendall test software developed by the US Geological Survey (Hirsch and Slack 1984; Helsel et al. 2006). Findings Fish Contamination Concentrations of mercury in commonly-eaten fish were calculated using a combination of the Regional Board and SFEI datasets (Table 1). Fish sizes ranged from >6” (bluegill) to >48” (sturgeon) and mean wet tissue concentrations ranged from 0.052 ppm (shad) to 0.772 ppm (largemouth bass) wet tissue weight. Table 1. Mercury concentrations of commonly-eaten fish in the Northern Delta region, in size ranges sought by anglers. AR = American River, FR = Feather River, SR = Lower Sacramento River. Data from the Central Valley Regional Water Quality Control Board database and San Francisco Estuary Institute reports online (Melwani et al., 2007; http://www.sfei.org)..
Fish Species (Common
Name) N
Mercury
Concentration
Length Location
(Mean ppm) SD
Shad 19 0.052 0.023 >15” AR, Delta
Bluegill 10 0.208 0.125 >6” SR, SRSC
Carp 30 0.309 0.197 >15” SR
Catfish 44 0.424 0.251 >12” SR, Delta
Crappie 5 0.309 0.104 >8” SR, Delta
Chinook Salmon 25 0.09 0.03 >26” AR, FR, SR
Largemouth Bass 63 0.774 0.324 >12” AR, SR
Sacramento Pike Minnow 42 0.763 0.525 >12” AR, SR
Split-tail 1 0.37 16” SR
Sacramento Sucker 38 0.22 0.117 >12” AR, SR
Rainbow Trout/Steelhead 12 0.061 0.014 >18” AR, SR
Striped Bass 47 0.545 0.318 >18” AR, Delta, SR
Sturgeon 11 0.271 0.241 >48” SR
Sunfish 14 0.182 0.097 >8” SR

5
Angling Activity Creel survey data collected by the California Department of Fish and Game (CDFG) indicate that the primary target fish species for all anglers, regardless of ethnicity, in the Northern region of the Central Valley Delta were striped bass, salmon, shad, and catfish (Murphy et al. 1999, 2000; Schroyer et al. 2001). This is similar to the targeted species in the present study (Table 2), with inter-ethnic differences in fish preferences. For all commonly-caught fish there were mercury concentration data available in the study region (Table 1). Knowing angler preferences for certain fish species is important for both understanding current consumption patterns and advised patterns, in terms of balancing trophic level 3 and 4 fish. Table 2. Ethnicity-specific targeting of fish species: Locally-caught fish species most commonly eaten/fish species eaten in largest quantity. Ranks determined from survey for all respondents. Carp = carp, CF = catfish, SF = sunfish, KS = Chinook salmon, LMB = largemouth bass, SB = striped bass, Stur = sturgeon.
Ethnicity Target
1st choice 2
nd choice
Frequency/amount Frequency/amount
African-American SB/SB CF/CF
SE-Asian SB/SB CF/CF
Lao CF/SB SB/SF
Hmong SB/SB CF/Stur
Asian/Pacific
Islander
SB/SB CF/CF
Hispanic SB/SB CF/CF
Native American CF/LMB CF/KS
White SF/SB SB/Stur
Russian Carp/Carp CF/CF
In 2001, CDFG reported about 22,000 directly-counted anglers at a survey rate of about one in every 4 days for all months of the year, but on different tributary rivers to the Delta (Schroyer et al. 2001). About 80% of those counted were fishing on the Sacramento River between the Feather River and the San Francisco Bay and other tributary rivers to the Delta. In 2005, of the approximately 1.1 million licensed anglers in California, 170,000 of them lived in 5 counties encompassing the Delta (Sacramento, San Joaquin, Solano, Yolo, and Contra Costa; data from the CDFG License Branch). One interpretation of the 8-fold difference between the number of anglers counted by CDFG and the number of licensed anglers is that anglers fish about one of every 8 days on regional rivers. This is similar to the self-reported rate of fishing among anglers (one of every 4.5 days) and community members (one of every 10 days) in the present study.

6
Rates of Fish Consumption To understand and potentially influence rates of mercury intake, it is important to separately quantify consumption of locally-caught and commercially-acquired fish. Consumption rates for locally-caught fish and commercially-acquired fish were calculated for all respondents (Figure 2 and Table 3). There was no significant relationship between day of the week when surveying occurred and ethnic group type, or fish consumption rate. Rates found for Southeast Asian community members were not significantly different from rates found for Southeast Asian anglers, but for other ethnic groups, community member consumption rates and angler consumption rates were significantly different. Because of this, most data analyses on these two datasets were done separately. Consumption rates for anglers as a whole varied throughout the year, with the highest rates peak during the Fall and Winter (Figure 2), when both striped bass and salmon are returning to rivers to spawn and fishing activity is the highest (Figure 3). An important finding from the surveying of fish consumption was that people consuming at the highest rates are primarily eating locally-caught fish, not commercially-acquired fish (Table 3). This means that, a primary way to reduce the mercury intake for these high-consumers will be to reduce the mercury in locally-caught fish. Rates of Mercury Intake Rates of mercury intake were calculated for each interviewee by multiplying the rate of consumption of specific fish by the average mercury concentration for that fish species in the region of surveying. These individual-specific rates were aggregated into different groups (Table 3) for calculation of mean and 95th percentile rates of consumption. These rates were also compared to the USEPA reference dose (RfD) for mercury intake, 0.1 micrograms mercury/kg body-weight per day. For the comparison with the RfD, an average body weight of 67 kg was assumed, meaning that variation around this mean weight will cause variation in actual individual exposure. “The reference dose (RfD) is an estimate of the highest daily dose of a chemical that the most sensitive in the population can be exposed to over a lifetime of exposure without experiencing an adverse effect.” (Center for Food, Nutrition, and Agriculture Policy, University of Maryland Web site) The rates of mercury intake presented here are likely to be an under-estimate of actual rates. The fish filet models presented to interviewees were of cooked fish, which are approximately 75% of the weight of fresh fish. The mercury concentrations used in this study were determined for fresh fish, not cooked fish. To compensate for this difference, all mercury intake rates were multiplied by a factor of 1.3. When this was done, 50% and 34% of all respondents were found to have total fish and local fish (respectively) derived mercury intake rates greater than the EPA reference dose. More seriously, 6% of all respondents were found to have mercury intake rates from total fish consumption greater than 10 times the EPA reference dose and 5% of all respondents had mercury intake rates from local fish consumption greater than 10 times the EPA reference dose. The EPA reference dose represents a conservative and protective standard for protecting the health of children <17 years-old and women who are bearing or may bear children. The dose was calculated as 1/10 the rate of mercury intake that was likely to lead to detectable learning impairments and other neurosystem related problems Consuming mercury at a rate greater than the reference dose may pose harm to children or fetuses of women consuming fish. Consuming mercury at a rate greater than 10 times the reference dose is likely to lead to neuorological and other harm (NRC, 2000; Trasande et al.,
7
2005; USEPA, 2000). The highest-consuming groups (e.g., Lao people) had 95th percentile rates up to 30 times the reference dose and the highest consuming individuals consumed at ~60 times the reference dose. Whole Population Exposure to Fish-Tissue Mercury There are about 170,000 licensed anglers in the counties containing the Delta (data from License Branch, Department of Fish and Game for 2005). Although there are anglers that are likely to visit from other counties and un-licensed anglers, this represents an approximation of the base angler base for the region. The number of anglers consuming mercury from fish meals at rates greater than the EPA reference dose is about 85,000, with 75,000 of these reaching that level from local fish consumption alone. The number of anglers consuming mercury at rates greater than 10 times the EPA reference dose and therefore exposed at toxic levels to mercury, is 10,200, with 8,500 of these reaching that exposure level through local-fish consumption alone. Anglers are one group that may be expected to eat fish in large quantities, but there are other people in the communities around the Delta who may also be expected to consume large amounts of fish, including family members and friends of anglers. Women interviewed in community settings ate significantly more locally-caught (54.1 g/day) and total (66.4 g/day) fish than male anglers (26.4 g/day and 39.3 g/day; P<0.05, t-test) and identical amounts of commercially-obtained fish. There was no statistically significant difference between male and female angler consumption rates (P>0.05, Table 3). There were also no significant differences in consumption rates among age groups (Table 3). Rates of consumption for locally-caught and total fish were significantly higher (P<0.05, t-test) for anglers from households with children, or from households with women of child-bearing age, than anglers from households without children or women of child-bearing age. Given these results, it is likely that the findings from angler surveys approximately represent a larger population of members of subsistence and recreational fishing households. Therefore, the number of anglers can be multiplied by a “family factor” (of 4 for a family of four) to obtain a more realistic estimate of the population exposed to mercury from fish consumption. This would mean that the 10,200 anglers exposed to mercury at 10 times the EPA reference dose, may represent 40,800 (family of 4) to 61,200 (family of 6) people in the Delta region.

8
Figure 2 Total fish (commercial + local) consumption rates over the year (Julian Day 1 = January 1st). Each symbol represents an individual interviewee. The lines at the bottom represent the scenarios for total fish consumption used by the Central Valley Regional Water Quality Control Board’s TMDL for methyl-mercury in the Delta. A,C = 40 g/day; B,D = 44.5 g/day; E = 142 g/day of fish consumed.
Figure 3 Fishing intensity as angling hours varying by season and location on the Sacramento River and San Joaquin River. Data from the California Department of Fish & Game creel survey program, 2000.
9
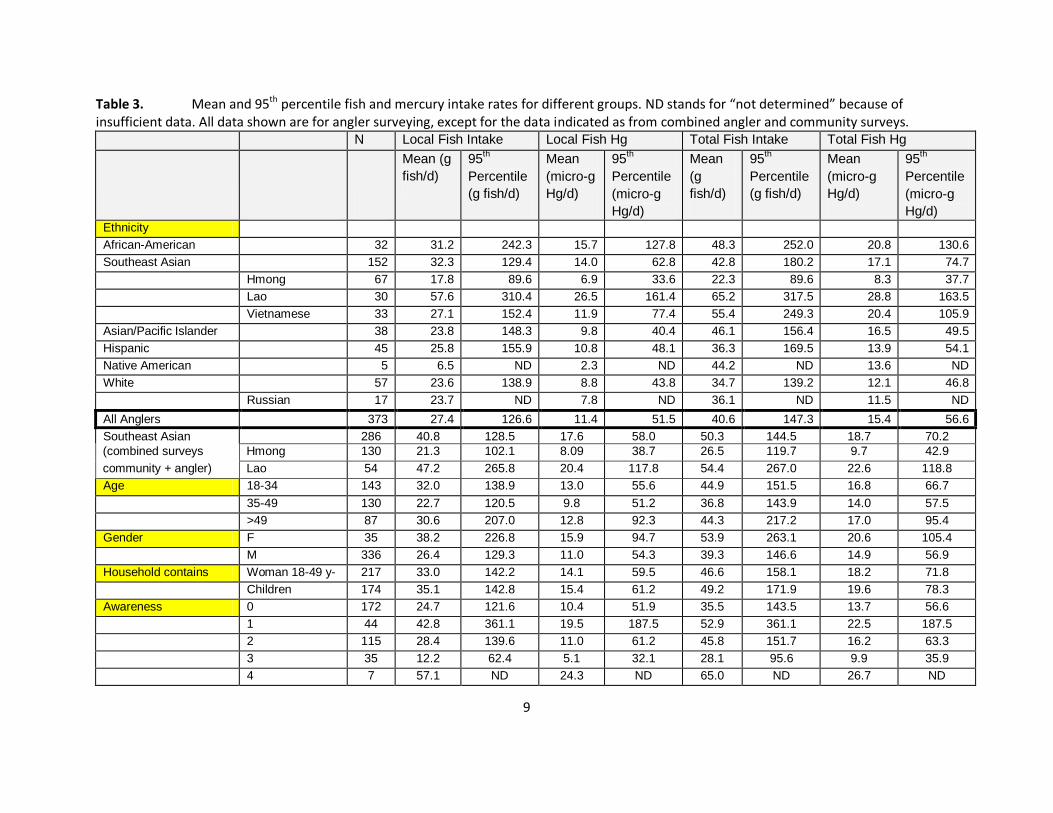
Table 3. Mean and 95th percentile fish and mercury intake rates for different groups. ND stands for “not determined” because of insufficient data. All data shown are for angler surveying, except for the data indicated as from combined angler and community surveys. N Local Fish Intake Local Fish Hg Total Fish Intake Total Fish Hg
Mean (g
fish/d)
95th
Percentile
(g fish/d)
Mean
(micro-g
Hg/d)
95th
Percentile
(micro-g
Hg/d)
Mean
(g
fish/d)
95th
Percentile
(g fish/d)
Mean
(micro-g
Hg/d)
95th
Percentile
(micro-g
Hg/d)
Ethnicity
African-American 32 31.2 242.3 15.7 127.8 48.3 252.0 20.8 130.6
Southeast Asian 152 32.3 129.4 14.0 62.8 42.8 180.2 17.1 74.7
Hmong 67 17.8 89.6 6.9 33.6 22.3 89.6 8.3 37.7
Lao 30 57.6 310.4 26.5 161.4 65.2 317.5 28.8 163.5
Vietnamese 33 27.1 152.4 11.9 77.4 55.4 249.3 20.4 105.9
Asian/Pacific Islander 38 23.8 148.3 9.8 40.4 46.1 156.4 16.5 49.5
Hispanic 45 25.8 155.9 10.8 48.1 36.3 169.5 13.9 54.1
Native American 5 6.5 ND 2.3 ND 44.2 ND 13.6 ND
White 57 23.6 138.9 8.8 43.8 34.7 139.2 12.1 46.8
Russian 17 23.7 ND 7.8 ND 36.1 ND 11.5 ND
All Anglers 373 27.4 126.6 11.4 51.5 40.6 147.3 15.4 56.6
Southeast Asian 286 40.8 128.5 17.6 58.0 50.3 144.5 18.7 70.2
(combined surveys Hmong 130 21.3 102.1 8.09 38.7 26.5 119.7 9.7 42.9
community + angler) Lao 54 47.2 265.8 20.4 117.8 54.4 267.0 22.6 118.8
Age 18-34 143 32.0 138.9 13.0 55.6 44.9 151.5 16.8 66.7
35-49 130 22.7 120.5 9.8 51.2 36.8 143.9 14.0 57.5
>49 87 30.6 207.0 12.8 92.3 44.3 217.2 17.0 95.4
Gender F 35 38.2 226.8 15.9 94.7 53.9 263.1 20.6 105.4
M 336 26.4 129.3 11.0 54.3 39.3 146.6 14.9 56.9
Household contains Woman 18-49 y-
o
217 33.0 142.2 14.1 59.5 46.6 158.1 18.2 71.8
Children 174 35.1 142.8 15.4 61.2 49.2 171.9 19.6 78.3
Awareness 0 172 24.7 121.6 10.4 51.9 35.5 143.5 13.7 56.6
1 44 42.8 361.1 19.5 187.5 52.9 361.1 22.5 187.5
2 115 28.4 139.6 11.0 61.2 45.8 151.7 16.2 63.3
3 35 12.2 62.4 5.1 32.1 28.1 95.6 9.9 35.9
4 7 57.1 ND 24.3 ND 65.0 ND 26.7 ND
10
Differential Exposure There were wide ranges of consumption both within ethnic groups and among groups. When poor, disenfranchised, and/or non-white communities are disproportionately affected by environmental contamination then the issue is one of environmental justice. In the case of consumption of contaminated fish by major ethnic groups, white anglers had the lowest mean and 95th percentile consumption rates of locally-caught fish and all fish, though in comparison to other major ethnic groups, these rates were only statistically different from Southeast Asians as a major ethnic sub-group. Southeast Asian anglers and community members reported similar rates of fish consumption and had the highest rate of mercury intake among large ethnic/national-origin groups. The rates measured in our study (Table 3)were similar to rates found in countries of origin for first and second generation Southeast Asians by the Food and Agriculture Organization of the United Nations for Lao people (48 g/day) and Mekong Basin residents (107 g/day; FAO, 2003). It is more appropriate to go beyond traditional Census Bureau designation and refer to ethnicities separately. There are many Hmong, Lao, and Iu Mien people in the Delta region who originated in this or previous generations from countries in Southeast Asia. Many Lao people in Laos and Cambodia live at lower elevations near fish-bearing streams and rivers, whereas Hmong people in Vietnam and Thailand live in mountainous areas. These origins may help to explain the higher rates of fish consumption among Lao when compared to Hmong. Survey Sufficiency Most of the findings here depend upon sufficient power in the statistical analysis, based on the amount of data available for the analysis. When used this way, power refers to the likelihood that a Type II error (rejecting a false null hypothesis) will be avoided. Power analysis is related to the size of the effect or difference sought and the number of samples. Sample size analysis is a related calculation that can help determine how many samples may be needed to determine an effect or difference. Because of the number of ethnicities fishing in the Delta region, it is challenging to conduct a survey with sufficient power to differentiate between groups or between mean fish consumption rates for a group and a standard rate, such as the rate used by the Regional Board for TMDL Scenario A/C for fish consumption (17.5 g/day). I used the information available from past surveying to determine sample sizes needed to measure the difference between the mean rates we found for local fish consumption and the rate used by the Regional Board (17.5 g/day). Despite the wide range of rates found, for all Asians and for Southeast Asians, the past surveying had sample sizes sufficient for comparison. Similarly, the statistical power was sufficient (57% to 83%) for this comparison. For all other mean rate comparisons, the sample sizes were too small to provide sufficient statistical power to compare the ethnicity-specific mean rates and the TMDL Scenario A/C rate. This would have been ever more of an issue when comparing mean rates found with 95th percentile rate from the San Francisco Bay study (32 g/day), used to develop TMDL Scenario B/D. Another way to say this is that in order to state with confidence whether or not mean rates for individual ethnicities are similar to the rates used to develop TMDL Scenarios A, B, C, and D, a larger survey would need to be performed. The sample sizes needed per group are on the order of 100 to 200 individuals for 50% power and 150 to 450 individuals for 80% power. 80% power is a commonly used standard for biostatistics.

11
As stated in the Delta Methyl-Mercury TMDL: “The San Francisco Bay Mercury TMDL selected the consumption rate for the 95th percentile of anglers (32 g/day) for calculation of the San Francisco Bay fish mercury target (0.2 mg/kg) to protect people who choose to eat San Francisco Bay fish on a regular basis ….” Table 3 above provides the 95th percentile rates for all anglers and anglers within different demographic groups. In almost all cases, the 95th percentile rates for Delta fish-consumers are greater than Scenarios A, B, C, D. As stated in the TMDL in reference to choosing subsistence level consumption rates for Scenario E: “In selecting the 90th percentile, rather than the mean or median, the USEPA intended to recommend a consumption rate that is protective of the majority of the entire population. The USEPA recommended a consumption rate of 142.4 g/day (four to five fish meals per week) of local fish for the development of a human health criterion for anglers whose main source of protein is from locally caught fish. This value represents the 99th percentile consumption rate for all survey participants.” If the Regional Board chooses to use mean fish consumption rates for Delta anglers across ethnic and other demographic groupings, then sufficient surveying must be conducted to provide power to the statistical analyses in determining whether the assumed rates used in the TMDL are protective of public and individual health. In contrast the 95th percentile rates found from surveying anglers and community members in the Delta region are sufficiently different from the Scenarios A-D rates and similar to the Scenario E rates to ensure that additional surveying may not be needed to assure health-protective standards. Conclusions and Recommendations 1) There is a population of approximately 10,000 anglers and their families, which together represent at least 40,000 people, in the Delta region who are ingesting dangerous amounts of mercury through locally-caught fish consumption. The Regional Board and responsible state and federal entities should recognize this population and their rates of fish consumption in the methyl-mercury TMDL and similar pollution control processes. 2) Ethnicity-specific rates of fish consumption, patterns of fish choice, separate health communication pathways, and different levels of awareness of fish contamination and advisories mean that measuring fish consumption rates and communicating effectively with different communities is a larger task than currently recognized among state agencies. The state and federal government should support continuing fish consumption and other dietary and health-related surveying in order to both understand practices and collaborate with communities to find ways to develop alternatives. 3) The choice of fish consumption rates for developing TMDL targets is an important exercise. Currently the rates used in the TMDL for Scenarios A-D are neither protective of 50% of the population consuming higher than the mean rates in the region, nor of the ethnicities that eat at higher rates than the central tendency. The Central Valley Regional Board should adopt the health-protection standard set by the San Francisco Bay Regional Board and recommended by the USEPA of using the 95th percentile or 99th percentile fish consumption rates in the Delta communities to set mercury targets in fish tissue. These rates should be based on continuing monitoring and not one-time studies that can become obsolete or incompletely reflect ethnicity-specific practices.
12
References Central Valley Regional Water Quality Control Board (CVRWQCB), 2008. Sacramento – San Joaquin Delta Estuary TMDL for Methylmercury, Draft Staff Report. Central Valley Regional Water Quality Control Board. FAO/MRC/Government of Thailand/Government of the Netherlands. 2003. New approaches for the improvement of inland capture fisheries statistics in the Mekong Basin. RAP Publication 2003/01. 145 p. Fujimoto, I., 1998. Building Civic Participation in California’s Central Valley, Book One: Getting to Know the Central Valley. California Institute for Rural Studies. Helsel, D.R., Mueller, D.K., and Slack, J.R., 2006. Computer program for the Kendall family of trend tests: U.S. Geological Survey Scientific Investigations Report 2005–5275. Hirsch, R.M., and Slack, J.R., 1984, A nonparametric trend test for seasonal data with serial dependence: Water Resources Research 20: 727–732. Hudson, T.S., Forman, M.R., Cantwell, M.M., Schatzkin, A., Albert, P.S., Lanza, E., 2006. Dietary fiber intake: Assessing the degree of agreement between food frequency questionnaires and 4-day food records. Journal of the American College of Nutrition 25(5): 370-381. Jackson, L.S., M.G. Knize, J.N. Morgan. 1999. Impact of Processing on Food Safety: [proceedings of the American Chemical Society Symposium on Impact of Processing on Food Safety, Held April 14 - 18, 1997, in San Francisco, California]. Springer, 270 pages Kuster, C., Vuki, V.C., Zann L.P., 2006. Validation of the accuracy of huosehold reporting of subsistence fishing catch and effort: a Fijian case study. Fisheries Management and Ecology 13(3): 177-184. Lee, K.Y., Uchida, K., Shirota, T., Kono, S., 2002. Validity of a self-administered food frequency questionnaire against 7-day dietary records in four seasons. Journal of Nutritional Science and Vitaminology 48(6): 467-476. McNaughton, S.A., Mishra, G.D., Bramwell, G. A., Paul, A., Wadsworth, M.E.J., 2005. Comparability of dietary patterns assessed by multiple dietary assessment mehods: results from the 1946 British Birth Cohort. European Journal of Clinical Nutrition 59(3): 341-352. Melwani, A., S. BEzalel, J. Hunt, L. Grenier, J. Davis, G. Ichikawa, B. Jakl, W. Heim, A. Bonnema, and M. Gassel. 2007. California Bay-Delta Authority Fish Mercury Project Year 2 Annual Report Sport Fish Sampling and Analysis. San Francisco Estuary Institute, 118 pages. Murphy, K, Hanson, L., Harris, M., and Schroyer, T., 1999. Central Valley Salmon and Steelhead Harvest Monitoring Project - 1999 Angler Survey. California Department of Fish and Game, unpublished annual report. Murphy, K, Schroyer, T., and Massa, D., 2000. Central Valley Salmon and Steelhead Harvest Monitoring Project - 2000 Angler Survey. California Department of Fish and Game, unpublished annual report.
NRC, 2000. Toxicological Effects of Methylmercury. National Academy of Sciences National Research Council
Report, Committee on the Toxicological Effects of Methylmercury. Washington, DC: National Academy Press Quandt, S.A., Vitolins, M.Z., Smith, S.L., Tooze, J.A., Bell, R.A., Davis, C.C., DeVellis, R.F., and Arcury, T.A., 2007. Comparative validation of standard, picture-sort, and meal-based food-frequency questionnaires adapted for an elderly population of low socio-economic status. Public Health Nutrition 10(5): 524-532.
13
Schroyer, T., Massa, D., and Murphy, K., 2001. Central Valley Salmon and Steelhead Harvest Monitoring Project - 2000 Angler Survey. California Department of Fish and Game, unpublished annual report Silver, E., Kaslow, J., Lee, D., Lee, S., Tan, M.L., Weis, E., and Ujihara, A., 2007. Fish consumption and advisory awareness among low-income women in California’s Sacramento-San Joaquin Delta. Environmental Research 104: 410-419. Sullivan, B.L., Williams, P.G., Meyer, B.J., 2006. Biomarker validation of a long-chain omega-3 polyunsaturated fatty acid food frequency questionnaire. Lipids 41(9): 845-850.
Trasande, L., P. J. Landrigan, and C. Schecter. 2005. Public Health and Economic Consequences of Methylmercury
Toxicity to the Developing Brain. Environmental Health Perspectives 113:590. USEPA 1997 Exposure Factors Handbook (http://www.epa.gov/ncea/pdfs/efh/front.pdf)
USEPA, 2000. Methodology for Deriving Ambient Water Quality Criteria for the Protection of Human Health
(2000). US Environmental Protection Agency Office of Water and Office of Science and Technology. EPA-822-B-00-
004, October. Pg. 4-5. Villegas, R., Yang, G., Liu, D.K., Xiang, Y.B., Cai, H., Zheng, W., Shu, X.O., 2007. Validity and reproducibility of the food-frequency questionnaire used in the Shanghai Men’s Health Study. British Journal of Nutrition 97(5): 993-1000.
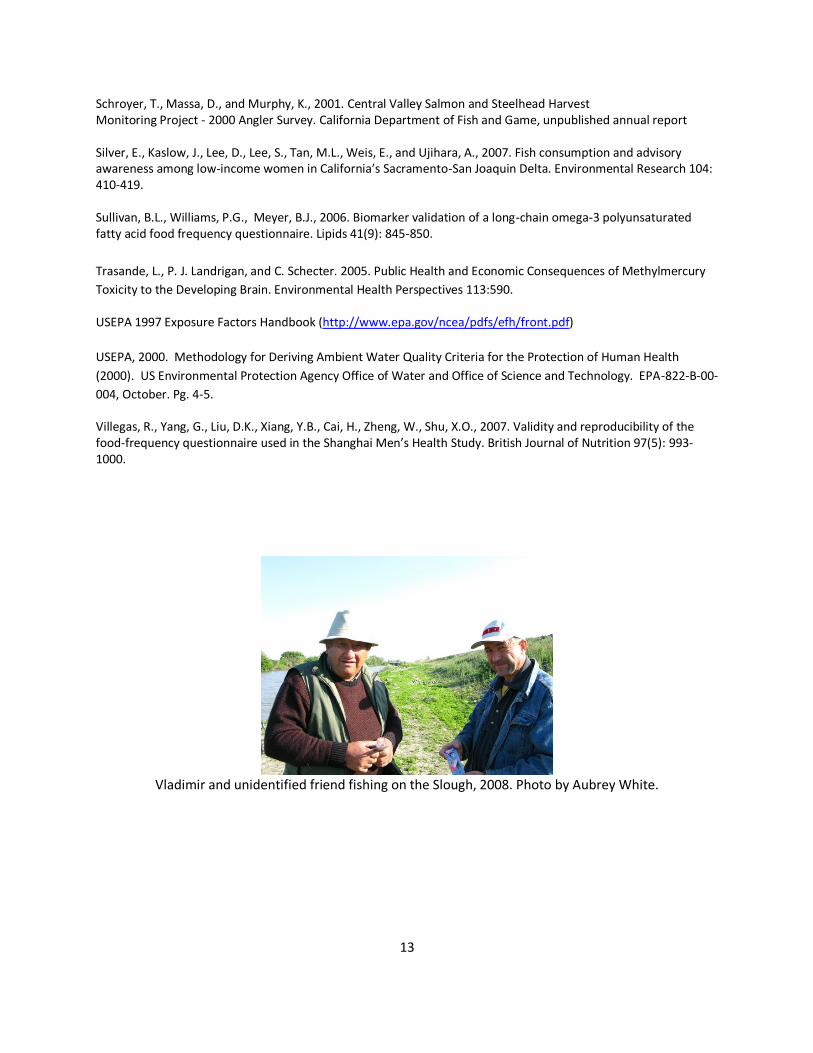
Vladimir and unidentified friend fishing on the Slough, 2008. Photo by Aubrey White.