Embed Size (px)
Citation preview

Regi
stra
tion
Ballo
ts C
ast
Turn
out (
%)
GOVE
RNOR
& L
IEUT
ENAN
T
KIM
GUA
DAGN
O &
CARL
OS A
.
PHIL
IP M
URPH
Y &
SHEI
LA O
LIVE
R
MAT
THEW
RIC
CARD
I
GINA
GEN
OVES
E
PETE
R J.
ROH
RMAN
& K
ARES
E J.
SETH
KAP
ER-D
ALE
& LI
SA
VINC
ENT
ROSS
& A
PRIL
A. J
OHNS
O N
Pers
onal
Choic
e
GOVERNOR & LIEUTENANT GOVERNOR
BERGEN COUNTY Statement of VoteBER_20171107_E
Allendale 1 - Election Day 1618 755 46.66 379 352 3 3 1 3 2 0Allendale 2 - Election Day 853 363 42.56 185 169 0 1 3 1 0 0Allendale 3 - Election Day 982 456 46.44 257 182 1 2 2 1 0 2Allendale 4 - Election Day 1439 606 42.11 341 248 1 4 3 2 1 0Allendale Mail-In Ballot - Mail-In B 0 129 0.00 66 56 0 3 2 0 0 0Allendale Provisional - Provisional 0 12 0.00 4 6 0 0 1 0 0 0Alpine 1 - Election Day 1416 405 28.60 222 175 0 2 1 1 0 0Alpine Mail-In Ballot - Mail-In Ballo 0 30 0.00 7 23 0 0 0 0 0 0Alpine Provisional - Provisional 0 1 0.00 0 1 0 0 0 0 0 0Bergenfield 1 - Election Day 787 282 35.83 99 177 1 0 0 1 0 0Bergenfield 2 - Election Day 868 377 43.43 118 243 1 0 2 2 0 1Bergenfield 3 - Election Day 791 309 39.06 95 196 2 3 1 2 1 0Bergenfield 4 - Election Day 891 319 35.80 113 188 2 0 2 3 1 0Bergenfield 5 - Election Day 873 312 35.74 79 222 0 1 0 2 1 0Bergenfield 6 - Election Day 873 325 37.23 92 222 0 0 3 1 0 1Bergenfield 7 - Election Day 793 269 33.92 75 184 0 1 1 2 0 0Bergenfield 8 - Election Day 850 290 34.12 94 191 0 0 0 1 1 0Bergenfield 9 - Election Day 842 274 32.54 50 206 0 0 1 0 0 0Bergenfield 10 - Election Day 1127 399 35.40 166 223 0 1 1 1 0 0Bergenfield 11 - Election Day 950 386 40.63 185 191 1 0 1 1 0 0Bergenfield 12 - Election Day 1081 375 34.69 99 263 0 0 0 0 1 0Bergenfield 13 - Election Day 1178 414 35.14 112 290 1 2 2 0 0 0Bergenfield 14 - Election Day 798 297 37.22 91 200 0 0 0 0 0 1Bergenfield 15 - Election Day 1131 387 34.22 121 254 0 1 0 0 1 0Bergenfield 16 - Election Day 932 320 34.33 114 190 5 0 1 2 0 0Bergenfield 17 - Election Day 866 285 32.91 81 195 1 0 0 1 0 0Bergenfield Mail-In Ballot - Mail-In 0 233 0.00 69 157 0 1 0 1 0 0Bergenfield Provisional - Provision 0 38 0.00 5 30 0 0 0 0 0 0Bogota 1 - Election Day 807 331 41.02 107 207 2 0 1 1 0 0Bogota 2 - Election Day 1014 364 35.90 97 250 5 2 2 0 2 1Bogota 3 - Election Day 953 346 36.31 122 204 0 0 2 3 0 0Bogota 4 - Election Day 909 400 44.00 151 220 2 4 1 2 1 0Bogota 5 - Election Day 562 254 45.20 86 149 1 0 1 0 0 1Bogota 6 - Election Day 808 318 39.36 102 193 3 2 0 9 0 0Bogota Mail-In Ballot - Mail-In Ball 0 114 0.00 57 52 1 2 0 0 0 0Bogota Provisional - Provisional 0 20 0.00 6 14 0 0 0 0 0 0Carlstadt 1 - Election Day 633 270 42.65 127 121 1 0 16 0 0 0Carlstadt 2 - Election Day 822 326 39.66 158 147 2 2 9 1 0 0Carlstadt 3 - Election Day 714 283 39.64 99 162 0 0 15 1 0 0Carlstadt 4 - Election Day 780 316 40.51 133 163 2 0 13 0 0 0Carlstadt 5 - Election Day 753 287 38.11 124 131 1 1 19 1 0 1Carlstadt Mail-In Ballot - Mail-In Ba 0 78 0.00 42 31 0 0 0 3 0 0Carlstadt Provisional - Provisional 0 5 0.00 0 5 0 0 0 0 0 0Cliffside Park 1 - Election Day 770 228 29.61 48 170 2 0 2 0 1 0Cliffside Park 2 - Election Day 822 227 27.62 45 176 0 0 0 1 0 0Cliffside Park 3 - Election Day 815 227 27.85 41 180 1 0 0 0 1 0Cliffside Park 4 - Election Day 1213 471 38.83 153 305 0 0 1 3 0 0Cliffside Park 5 - Election Day 726 215 29.61 51 157 1 0 1 1 0 1Cliffside Park 6 - Election Day 759 271 35.70 60 191 3 2 0 2 0 1Cliffside Park 7 - Election Day 800 236 29.50 66 162 0 0 1 0 0 1Cliffside Park 8 - Election Day 817 325 39.78 85 224 0 0 0 2 0 0Cliffside Park 9 - Election Day 644 204 31.68 80 118 0 0 1 0 0 0Cliffside Park 10 - Election Day 1128 349 30.94 92 251 0 2 1 2 0 0Cliffside Park 11 - Election Day 593 161 27.15 46 110 1 0 0 2 0 0Cliffside Park 12 - Election Day 548 160 29.20 42 107 5 0 2 2 1 0Cliffside Park 13 - Election Day 886 307 34.65 79 221 0 2 2 0 0 0Cliffside Park 14 - Election Day 748 326 43.58 123 190 1 1 0 0 0 0Cliffside Park 15 - Election Day 777 313 40.28 102 198 0 0 1 0 0 2Cliffside Park Mail-In Ballot - Mail- 0 199 0.00 57 131 0 0 1 0 0 2
November 15, 2017 8:37 am Page 1 of 219

Regi
stra
tion
Ballo
ts C
ast
Turn
out (
%)
GOVE
RNOR
& L
IEUT
ENAN
T
KIM
GUA
DAGN
O &
CARL
OS A
.
PHIL
IP M
URPH
Y &
SHEI
LA O
LIVE
R
MAT
THEW
RIC
CARD
I
GINA
GEN
OVES
E
PETE
R J.
ROH
RMAN
& K
ARES
E J.
SETH
KAP
ER-D
ALE
& LI
SA
VINC
ENT
ROSS
& A
PRIL
A. J
OHNS
O N
Pers
onal
Choic
e
GOVERNOR & LIEUTENANT GOVERNOR
BERGEN COUNTY Statement of VoteBER_20171107_E
Cliffside Park Provisional - Provisio 0 25 0.00 4 19 0 0 1 0 0 0Closter 1 - Election Day 647 279 43.12 109 164 1 0 0 0 0 0Closter 2 - Election Day 905 344 38.01 125 212 1 0 0 0 0 0Closter 3 - Election Day 857 315 36.76 136 168 1 1 0 0 1 0Closter 4 - Election Day 911 337 36.99 141 180 0 3 1 1 1 0Closter 5 - Election Day 824 318 38.59 144 165 0 1 0 0 0 1Closter 6 - Election Day 1084 380 35.06 139 232 0 1 0 1 0 0Closter Mail-In Ballot - Mail-In Ball 0 100 0.00 37 61 0 0 0 1 0 0Closter Provisional - Provisional 0 6 0.00 3 3 0 0 0 0 0 0Cresskill 1 - Election Day 815 300 36.81 133 155 0 1 1 1 0 0Cresskill 2 - Election Day 928 315 33.94 119 192 1 0 0 0 0 0Cresskill 3 - Election Day 1480 496 33.51 232 246 1 2 7 0 0 0Cresskill 4 - Election Day 781 278 35.60 120 152 0 1 0 0 1 0Cresskill 5 - Election Day 601 250 41.60 120 126 2 0 0 0 1 0Cresskill 6 - Election Day 659 245 37.18 109 130 0 2 1 1 0 0Cresskill Mail-In Ballot - Mail-In Ba 0 59 0.00 25 30 0 0 0 1 0 1Cresskill Provisional - Provisional 0 4 0.00 1 3 0 0 0 0 0 0Demarest 1 - Election Day 1087 481 44.25 202 267 2 1 0 2 0 0Demarest 2 - Election Day 1102 402 36.48 158 230 0 1 2 0 1 0Demarest 3 - Election Day 1113 456 40.97 161 283 1 0 1 0 0 0Demarest Mail-In Ballot - Mail-In B 0 89 0.00 36 51 0 0 2 0 0 0Demarest Provisional - Provisiona 0 9 0.00 2 7 0 0 0 0 0 0Dumont 1 - Election Day 901 324 35.96 152 166 1 0 2 2 0 0Dumont 2 - Election Day 1159 430 37.10 175 243 2 0 3 3 0 0Dumont 3 - Election Day 937 394 42.05 162 218 1 1 2 3 3 0Dumont 4 - Election Day 1213 486 40.07 181 287 2 2 4 1 0 2Dumont 5 - Election Day 1023 407 39.78 156 234 0 3 5 0 1 0Dumont 6 - Election Day 1123 411 36.60 202 201 0 1 1 0 0 1Dumont 7 - Election Day 945 373 39.47 131 233 0 2 2 1 0 0Dumont 8 - Election Day 1150 477 41.48 197 261 4 3 3 4 0 0Dumont 9 - Election Day 1075 402 37.40 192 200 2 0 1 1 0 0Dumont 10 - Election Day 680 306 45.00 129 165 1 3 1 2 0 0Dumont 11 - Election Day 1093 455 41.63 229 214 2 0 2 0 2 0Dumont Mail-In Ballot - Mail-In Ba 0 141 0.00 57 76 1 2 1 1 0 0Dumont Provisional - Provisional 0 22 0.00 6 15 0 0 0 0 0 0East Rutherford 1 - Election Day 1198 385 32.14 114 253 1 1 6 4 2 1East Rutherford 2 - Election Day 1080 414 38.33 163 211 3 2 9 3 0 1East Rutherford 3 - Election Day 881 373 42.34 140 202 2 4 5 2 0 0East Rutherford 4 - Election Day 1901 786 41.35 374 358 7 3 10 2 2 0East Rutherford Mail-In Ballot - Ma 0 85 0.00 28 49 0 2 0 0 1 0East Rutherford Provisional - Prov 0 12 0.00 2 9 0 0 0 0 0 0Edgewater 1 - Election Day 1072 335 31.25 69 257 0 1 1 0 2 0Edgewater 2 - Election Day 1385 405 29.24 97 293 0 1 4 4 0 0Edgewater 3 - Election Day 1416 469 33.12 133 314 0 2 2 2 1 0Edgewater 4 - Election Day 1898 486 25.61 113 358 1 1 4 2 0 0Edgewater Mail-In Ballot - Mail-In 0 123 0.00 33 85 1 2 0 1 0 0Edgewater Provisional - Provisiona 0 16 0.00 2 13 0 0 1 0 0 0Elmwood Park 1 - Election Day 1427 492 34.48 202 250 3 3 4 2 4 0Elmwood Park 2 - Election Day 1446 464 32.09 172 268 3 1 0 2 1 0Elmwood Park 3 - Election Day 943 380 40.30 153 206 2 0 0 1 0 0Elmwood Park 4 - Election Day 809 246 30.41 75 155 1 3 1 1 0 0Elmwood Park 5 - Election Day 860 333 38.72 131 187 1 3 0 0 1 0Elmwood Park 6 - Election Day 714 224 31.37 50 163 0 0 1 0 1 1Elmwood Park 7 - Election Day 1146 437 38.13 189 226 4 1 2 0 0 2Elmwood Park 8 - Election Day 1919 563 29.34 227 298 0 2 3 2 1 1Elmwood Park 9 - Election Day 1183 353 29.84 159 165 4 3 2 0 4 0Elmwood Park 10 - Election Day 1470 495 33.67 221 245 3 3 2 1 0 0Elmwood Park Mail-In Ballot - Mai 0 605 0.00 157 383 2 8 0 1 2 0Elmwood Park Provisional - Provis 0 61 0.00 18 35 0 1 0 0 0 0
November 15, 2017 8:37 am Page 2 of 219

Regi
stra
tion
Ballo
ts C
ast
Turn
out (
%)
GOVE
RNOR
& L
IEUT
ENAN
T
KIM
GUA
DAGN
O &
CARL
OS A
.
PHIL
IP M
URPH
Y &
SHEI
LA O
LIVE
R
MAT
THEW
RIC
CARD
I
GINA
GEN
OVES
E
PETE
R J.
ROH
RMAN
& K
ARES
E J.
SETH
KAP
ER-D
ALE
& LI
SA
VINC
ENT
ROSS
& A
PRIL
A. J
OHNS
O N
Pers
onal
Choic
e
GOVERNOR & LIEUTENANT GOVERNOR
BERGEN COUNTY Statement of VoteBER_20171107_E
Emerson 1 - Election Day 1033 501 48.50 238 237 0 4 5 3 1 0Emerson 2 - Election Day 837 377 45.04 183 179 1 1 3 0 0 0Emerson 3 - Election Day 672 269 40.03 125 132 2 0 2 1 0 0Emerson 4 - Election Day 1065 445 41.78 245 186 0 5 1 0 0 0Emerson 5 - Election Day 813 338 41.57 169 164 0 0 0 0 0 1Emerson 6 - Election Day 605 278 45.95 128 141 1 0 1 0 0 0Emerson Mail-In Ballot - Mail-In Ba 0 122 0.00 68 49 0 0 3 1 0 0Emerson Provisional - Provisional 0 10 0.00 4 6 0 0 0 0 0 0Englewood W1 D1 - Election Day 1396 527 37.75 183 315 3 2 3 1 0 0Englewood W1 D2 - Election Day 862 361 41.88 142 209 0 1 0 0 0 0Englewood W1 D3 - Election Day 793 285 35.94 34 242 0 0 0 0 1 1Englewood W1 D4 - Election Day 869 320 36.82 21 279 0 0 1 0 0 0Englewood W2 D1 - Election Day 816 310 37.99 122 175 0 0 3 0 1 0Englewood W2 D2 - Election Day 723 266 36.79 129 120 0 1 0 1 0 0Englewood W2 D3 - Election Day 1145 371 32.40 131 216 0 2 1 2 2 1Englewood W2 D4 - Election Day 1823 466 25.56 82 376 1 0 2 1 0 0Englewood W3 D1 - Election Day 860 290 33.72 29 245 0 2 3 1 0 0Englewood W3 D2 - Election Day 1411 574 40.68 48 503 0 2 0 2 0 0Englewood W3 D3 - Election Day 706 322 45.61 16 294 0 2 1 2 0 0Englewood W3 D4 - Election Day 999 409 40.94 16 372 3 1 0 3 1 0Englewood W4 D1 - Election Day 679 215 31.66 2 203 1 0 3 0 0 0Englewood W4 D2 - Election Day 1167 474 40.62 18 434 1 1 1 1 2 0Englewood W4 D3 - Election Day 1102 388 35.21 8 365 0 2 0 0 1 0Englewood W4 D4 - Election Day 1038 326 31.41 17 298 3 0 2 0 0 0Englewood Mail-In Ballot - Mail-In 0 324 0.00 52 253 0 1 0 3 0 0Englewood Provisional - Provision 0 40 0.00 4 34 0 0 0 0 0 0Englewood Cliffs 1 - Election Day 1056 439 41.57 211 193 0 3 1 3 1 0Englewood Cliffs 2 - Election Day 874 379 43.36 169 186 0 1 1 3 0 0Englewood Cliffs 3 - Election Day 880 402 45.68 179 190 1 1 4 0 0 0Englewood Cliffs 4 - Election Day 797 327 41.03 161 144 2 2 0 1 0 0Englewood Cliffs Mail-In Ballot - M 0 383 0.00 180 174 1 0 0 1 1 1Englewood Cliffs Provisional - Pro 0 26 0.00 9 15 0 0 0 0 0 0Fair Lawn 1 - Election Day 961 392 40.79 164 213 0 2 2 1 0 0Fair Lawn 2 - Election Day 1378 583 42.31 245 312 3 2 6 3 0 1Fair Lawn 3 - Election Day 856 367 42.87 175 170 0 1 3 2 1 0Fair Lawn 4 - Election Day 1055 450 42.65 172 259 1 0 3 0 3 0Fair Lawn 5 - Election Day 672 304 45.24 138 147 2 3 0 1 1 1Fair Lawn 6 - Election Day 930 386 41.51 164 199 5 3 2 1 0 1Fair Lawn 7 - Election Day 732 334 45.63 137 181 1 0 3 3 0 0Fair Lawn 8 - Election Day 898 375 41.76 122 242 0 1 3 1 0 0Fair Lawn 9 - Election Day 972 400 41.15 156 230 0 5 3 0 0 0Fair Lawn 10 - Election Day 1006 426 42.35 179 230 1 0 5 1 2 0Fair Lawn 11 - Election Day 929 411 44.24 157 244 3 0 1 2 0 0Fair Lawn 12 - Election Day 763 339 44.43 121 210 1 0 0 1 0 0Fair Lawn 13 - Election Day 1052 493 46.86 155 324 1 3 6 0 0 0Fair Lawn 14 - Election Day 773 364 47.09 121 224 2 2 1 3 0 1Fair Lawn 15 - Election Day 1311 449 34.25 150 277 2 0 4 3 0 1Fair Lawn 16 - Election Day 1052 452 42.97 185 248 2 4 2 4 0 0Fair Lawn 17 - Election Day 944 377 39.94 171 189 0 1 0 1 0 1Fair Lawn 18 - Election Day 797 369 46.30 152 201 0 0 2 2 0 0Fair Lawn 19 - Election Day 819 361 44.08 161 183 0 3 0 2 0 1Fair Lawn 20 - Election Day 889 349 39.26 139 201 1 2 0 1 0 0Fair Lawn 21 - Election Day 1181 457 38.70 184 256 1 2 2 2 0 0Fair Lawn 22 - Election Day 838 288 34.37 115 153 2 1 5 2 0 0Fair Lawn 23 - Election Day 1011 446 44.11 167 260 1 5 1 1 0 0Fair Lawn Mail-In Ballot - Mail-In B 0 496 0.00 164 301 2 5 3 4 1 2Fair Lawn Provisional - Provisiona 0 61 0.00 21 38 0 0 2 0 0 0Fairview 1 - Election Day 757 255 33.69 44 206 0 0 2 0 0 0Fairview 2 - Election Day 1265 396 31.30 92 289 2 2 2 0 0 0
November 15, 2017 8:37 am Page 3 of 219

Regi
stra
tion
Ballo
ts C
ast
Turn
out (
%)
GOVE
RNOR
& L
IEUT
ENAN
T
KIM
GUA
DAGN
O &
CARL
OS A
.
PHIL
IP M
URPH
Y &
SHEI
LA O
LIVE
R
MAT
THEW
RIC
CARD
I
GINA
GEN
OVES
E
PETE
R J.
ROH
RMAN
& K
ARES
E J.
SETH
KAP
ER-D
ALE
& LI
SA
VINC
ENT
ROSS
& A
PRIL
A. J
OHNS
O N
Pers
onal
Choic
e
GOVERNOR & LIEUTENANT GOVERNOR
BERGEN COUNTY Statement of VoteBER_20171107_E
Fairview 3 - Election Day 941 297 31.56 66 211 0 1 1 0 1 0Fairview 4 - Election Day 860 258 30.00 69 175 0 1 0 3 0 0Fairview 5 - Election Day 1334 428 32.08 88 317 2 1 0 4 0 1Fairview 6 - Election Day 165 85 51.52 22 58 0 0 0 0 0 0Fairview Mail-In Ballot - Mail-In Ba 0 64 0.00 28 29 0 1 0 0 0 0Fairview Provisional - Provisional 0 8 0.00 0 7 0 0 0 0 0 0Fort Lee 1 - Election Day 1117 383 34.29 174 192 2 0 1 2 1 0Fort Lee 2 - Election Day 768 271 35.29 86 170 0 0 0 2 0 1Fort Lee 3 - Election Day 1454 495 34.04 186 290 0 1 2 0 0 0Fort Lee 4 - Election Day 583 269 46.14 90 175 0 1 0 0 0 0Fort Lee 5 - Election Day 908 301 33.15 103 176 0 0 0 3 1 1Fort Lee 6 - Election Day 1556 506 32.52 159 330 2 0 3 2 1 0Fort Lee 7 - Election Day 2142 777 36.27 200 518 2 4 2 3 1 0Fort Lee 8 - Election Day 609 158 25.94 47 102 0 1 0 0 0 0Fort Lee 9 - Election Day 687 203 29.55 86 107 0 0 1 1 0 0Fort Lee 10 - Election Day 2683 836 31.16 248 568 1 0 2 0 1 0Fort Lee 11 - Election Day 683 226 33.09 46 159 0 0 1 0 0 0Fort Lee 12 - Election Day 1270 380 29.92 112 249 1 3 1 3 0 0Fort Lee 13 - Election Day 737 269 36.50 62 201 1 0 1 0 0 1Fort Lee 14 - Election Day 607 223 36.74 46 160 1 1 4 2 1 0Fort Lee 15 - Election Day 777 217 27.93 61 150 0 1 1 0 1 0Fort Lee 16 - Election Day 1013 330 32.58 99 209 1 2 0 3 2 0Fort Lee 17 - Election Day 503 203 40.36 75 123 0 0 2 1 0 0Fort Lee 18 - Election Day 471 169 35.88 63 101 1 0 0 1 0 0Fort Lee 19 - Election Day 1374 483 35.15 101 364 1 0 0 3 0 0Fort Lee Mail-In Ballot - Mail-In Ba 0 463 0.00 109 327 3 5 0 3 0 0Fort Lee Provisional - Provisional 0 62 0.00 14 44 0 1 0 0 0 0Franklin Lakes 1 - Election Day 1044 371 35.54 240 123 0 0 3 1 0 0Franklin Lakes 2 - Election Day 1054 398 37.76 247 134 1 1 3 4 1 0Franklin Lakes 3 - Election Day 1110 407 36.67 260 139 1 1 1 1 0 0Franklin Lakes 4 - Election Day 2024 712 35.18 456 238 2 2 2 0 0 0Franklin Lakes 5 - Election Day 1480 531 35.88 372 150 0 0 2 2 0 0Franklin Lakes 6 - Election Day 1328 490 36.90 333 153 0 0 0 0 0 0Franklin Lakes Mail-In Ballot - Mai 0 240 0.00 128 106 0 0 0 0 0 0Franklin Lakes Provisional - Provis 0 20 0.00 13 7 0 0 0 0 0 0Garfield W1 D1 - Election Day 841 187 22.24 51 132 1 0 0 0 0 0Garfield W1 D2 - Election Day 495 103 20.81 23 76 0 0 2 0 0 0Garfield W1 D3 - Election Day 994 204 20.52 47 152 0 1 1 1 1 0Garfield W2 D1 - Election Day 1036 205 19.79 71 128 0 0 1 2 1 0Garfield W2 D2 - Election Day 1016 295 29.04 108 179 0 1 1 4 0 0Garfield W2 D3 - Election Day 747 195 26.10 77 113 1 0 0 0 0 0Garfield W3 D1 - Election Day 1114 253 22.71 65 185 0 0 0 0 1 0Garfield W3 D2 - Election Day 1099 291 26.48 69 212 1 2 0 0 0 2Garfield W3 D3 - Election Day 933 265 28.40 88 170 1 2 1 3 0 0Garfield W4 D1 - Election Day 1193 299 25.06 111 181 2 0 2 0 1 0Garfield W4 D2 - Election Day 856 231 26.99 103 118 0 2 0 2 1 0Garfield W4 D3 - Election Day 754 147 19.50 56 89 0 0 1 0 1 0Garfield W5 D1 - Election Day 1515 386 25.48 133 239 2 1 2 0 1 0Garfield W5 D2 - Election Day 869 250 28.77 87 149 0 5 1 2 1 0Garfield W5 D3 - Election Day 575 191 33.22 78 108 1 1 0 0 0 0Garfield Mail-In Ballot - Mail-In Ba 0 167 0.00 64 90 2 2 0 0 1 0Garfield Provisional - Provisional 0 23 0.00 3 19 0 0 0 0 0 0Glen Rock 1 - Election Day 1038 497 47.88 202 285 0 3 0 1 0 1Glen Rock 2 - Election Day 1143 566 49.52 187 362 1 2 2 0 0 0Glen Rock 3 - Election Day 1168 560 47.95 265 277 0 0 4 3 1 0Glen Rock 4 - Election Day 967 471 48.71 186 267 0 0 1 1 0 0Glen Rock 5 - Election Day 1221 572 46.85 227 334 1 1 0 1 0 0Glen Rock 6 - Election Day 942 432 45.86 157 262 3 0 3 1 1 0Glen Rock 7 - Election Day 1113 531 47.71 202 320 0 2 0 0 0 0
November 15, 2017 8:37 am Page 4 of 219

Regi
stra
tion
Ballo
ts C
ast
Turn
out (
%)
GOVE
RNOR
& L
IEUT
ENAN
T
KIM
GUA
DAGN
O &
CARL
OS A
.
PHIL
IP M
URPH
Y &
SHEI
LA O
LIVE
R
MAT
THEW
RIC
CARD
I
GINA
GEN
OVES
E
PETE
R J.
ROH
RMAN
& K
ARES
E J.
SETH
KAP
ER-D
ALE
& LI
SA
VINC
ENT
ROSS
& A
PRIL
A. J
OHNS
O N
Pers
onal
Choic
e
GOVERNOR & LIEUTENANT GOVERNOR
BERGEN COUNTY Statement of VoteBER_20171107_E
Glen Rock 8 - Election Day 832 404 48.56 151 246 1 0 1 1 0 0Glen Rock Mail-In Ballot - Mail-In B 0 329 0.00 110 211 1 2 1 0 2 0Glen Rock Provisional - Provisiona 0 25 0.00 9 12 0 0 0 0 0 0Hackensack W1 D1 - Election Day 787 223 28.34 54 156 4 1 2 1 1 0Hackensack W1 D2 - Election Day 778 249 32.01 53 187 2 0 0 0 0 0Hackensack W1 D3 - Election Day 853 249 29.19 57 179 1 0 2 0 0 0Hackensack W1 D4 - Election Day 749 171 22.83 33 126 1 0 1 1 0 0Hackensack W2 D1 - Election Day 520 140 26.92 15 121 1 1 2 0 0 0Hackensack W2 D2 - Election Day 1120 352 31.43 56 284 0 0 0 2 0 0Hackensack W2 D3 - Election Day 1067 320 29.99 49 266 1 0 2 0 0 0Hackensack W2 D4 - Election Day 729 248 34.02 57 185 0 0 1 0 0 0Hackensack W2 D5 - Election Day 707 259 36.63 43 211 0 1 1 0 0 1Hackensack W3 D1 - Election Day 515 174 33.79 15 128 1 0 0 0 1 0Hackensack W3 D2 - Election Day 677 240 35.45 56 172 0 2 0 0 1 0Hackensack W3 D3 - Election Day 576 199 34.55 2 196 0 0 0 0 0 0Hackensack W3 D4 - Election Day 987 340 34.45 40 295 0 1 1 1 0 0Hackensack W3 D5 - Election Day 850 293 34.47 41 237 0 1 4 1 1 1Hackensack W4 D1 - Election Day 874 340 38.90 62 271 1 1 1 0 0 1Hackensack W4 D2 - Election Day 1607 474 29.50 91 371 0 3 3 3 1 0Hackensack W4 D3 - Election Day 1288 459 35.64 98 353 1 0 1 1 0 1Hackensack W4 D4 - Election Day 1060 390 36.79 97 284 2 1 1 3 0 0Hackensack W4 D5 - Election Day 633 260 41.07 57 193 1 2 0 4 1 0Hackensack W5 D1 - Election Day 903 293 32.45 66 219 3 0 1 1 0 0Hackensack W5 D2 - Election Day 690 261 37.83 48 204 1 1 4 1 0 0Hackensack W5 D3 - Election Day 834 331 39.69 101 215 4 2 1 4 1 0Hackensack W5 D4 - Election Day 794 319 40.18 71 235 2 2 1 3 0 0Hackensack W5 D5 - Election Day 702 290 41.31 77 204 0 0 3 1 0 0Hackensack W5 D6 - Election Day 948 327 34.49 50 265 0 3 3 1 1 1Hackensack Mail-In Ballot - Mail-In 0 511 0.00 122 363 2 3 2 4 0 0Hackensack Provisional - Provisio 0 84 0.00 11 63 0 0 0 0 1 0Harrington Park 1 - Election Day 1017 485 47.69 219 249 1 0 0 3 1 0Harrington Park 2 - Election Day 1186 550 46.37 234 297 2 4 1 1 1 0Harrington Park 3 - Election Day 1145 561 49.00 269 270 0 4 2 0 0 0Harrington Park Mail-In Ballot - Ma 0 87 0.00 23 59 0 0 0 2 0 0Harrington Park Provisional - Prov 0 12 0.00 3 8 0 0 0 0 0 0Hasbrouck Heights 1 - Election Da 865 396 45.78 209 170 2 4 1 2 2 1Hasbrouck Heights 2 - Election Da 1027 409 39.82 182 207 1 1 2 0 2 0Hasbrouck Heights 3 - Election Da 832 348 41.83 168 157 2 4 5 0 0 0Hasbrouck Heights 4 - Election Da 963 419 43.51 217 185 0 2 1 0 1 0Hasbrouck Heights 5 - Election Da 823 323 39.25 142 165 1 2 3 0 0 0Hasbrouck Heights 6 - Election Da 855 379 44.33 189 173 3 1 1 0 0 0Hasbrouck Heights 7 - Election Da 863 357 41.37 169 176 0 0 2 0 1 1Hasbrouck Heights 8 - Election Da 985 410 41.62 178 220 0 1 1 1 0 1Hasbrouck Heights 9 - Election Da 682 262 38.42 108 147 0 0 0 1 0 1Hasbrouck Heights Mail-In Ballot - 0 188 0.00 95 81 0 1 2 0 1 0Hasbrouck Heights Provisional - P 0 19 0.00 8 10 0 0 0 0 0 0Haworth 1 - Election Day 1295 592 45.71 217 358 0 4 0 0 1 0Haworth 2 - Election Day 1193 550 46.10 204 323 3 0 2 1 0 1Haworth Mail-In Ballot - Mail-In Ba 0 87 0.00 23 58 0 0 0 1 0 0Haworth Provisional - Provisional 0 4 0.00 1 3 0 0 0 0 0 0Hillsdale 1 - Election Day 1036 472 45.56 226 234 0 2 5 1 0 0Hillsdale 2 - Election Day 912 404 44.30 155 234 4 2 1 2 1 0Hillsdale 3 - Election Day 1364 585 42.89 255 306 1 3 1 3 0 1Hillsdale 4 - Election Day 1376 592 43.02 291 281 3 0 3 1 1 0Hillsdale 5 - Election Day 1373 631 45.96 326 284 2 0 3 1 0 1Hillsdale 6 - Election Day 1485 643 43.30 299 329 5 1 0 2 1 0Hillsdale Mail-In Ballot - Mail-In Ba 0 192 0.00 80 107 0 0 0 1 0 0Hillsdale Provisional - Provisional 0 9 0.00 2 6 0 1 0 0 0 0Ho-Ho-Kus 1 - Election Day 1061 551 51.93 283 233 2 5 15 2 0 1
November 15, 2017 8:37 am Page 5 of 219

Regi
stra
tion
Ballo
ts C
ast
Turn
out (
%)
GOVE
RNOR
& L
IEUT
ENAN
T
KIM
GUA
DAGN
O &
CARL
OS A
.
PHIL
IP M
URPH
Y &
SHEI
LA O
LIVE
R
MAT
THEW
RIC
CARD
I
GINA
GEN
OVES
E
PETE
R J.
ROH
RMAN
& K
ARES
E J.
SETH
KAP
ER-D
ALE
& LI
SA
VINC
ENT
ROSS
& A
PRIL
A. J
OHNS
O N
Pers
onal
Choic
e
GOVERNOR & LIEUTENANT GOVERNOR
BERGEN COUNTY Statement of VoteBER_20171107_E
Ho-Ho-Kus 2 - Election Day 1104 539 48.82 287 226 1 0 11 3 0 0Ho-Ho-Kus 3 - Election Day 914 486 53.17 261 203 0 0 7 1 0 0Ho-Ho-Kus Mail-In Ballot - Mail-In 0 89 0.00 30 57 0 0 0 0 0 0Ho-Ho-Kus Provisional - Provision 0 13 0.00 6 5 0 0 0 0 0 0Leonia 1 - Election Day 876 385 43.95 105 269 2 0 0 2 0 0Leonia 2 - Election Day 812 346 42.61 98 239 3 0 1 2 0 0Leonia 3 - Election Day 767 301 39.24 68 226 0 1 0 3 0 0Leonia 4 - Election Day 787 257 32.66 70 176 1 1 0 3 0 1Leonia 5 - Election Day 1171 459 39.20 133 307 0 2 2 7 0 0Leonia 6 - Election Day 725 277 38.21 88 185 0 2 1 0 0 0Leonia Mail-In Ballot - Mail-In Ballo 0 93 0.00 29 61 0 0 0 1 0 0Leonia Provisional - Provisional 0 9 0.00 1 8 0 0 0 0 0 0Little Ferry 1 - Election Day 809 277 34.24 121 145 0 2 0 0 1 1Little Ferry 2 - Election Day 611 190 31.10 69 114 0 1 2 1 0 0Little Ferry 3 - Election Day 1114 304 27.29 110 180 1 2 0 0 0 0Little Ferry 4 - Election Day 838 261 31.15 102 148 0 2 0 1 0 0Little Ferry 5 - Election Day 1192 305 25.59 94 200 0 2 3 0 0 1Little Ferry 6 - Election Day 796 248 31.16 100 136 0 2 2 0 0 1Little Ferry Mail-In Ballot - Mail-In 0 101 0.00 40 56 0 0 0 0 0 0Little Ferry Provisional - Provisiona 0 10 0.00 3 7 0 0 0 0 0 0Lodi 1 - Election Day 1349 419 31.06 142 247 1 0 3 0 2 0Lodi 2 - Election Day 1382 419 30.32 128 268 0 2 2 0 1 0Lodi 3 - Election Day 919 248 26.99 73 165 0 2 0 1 0 0Lodi 4 - Election Day 923 234 25.35 37 191 0 1 2 1 0 0Lodi 5 - Election Day 999 324 32.43 120 185 1 4 0 2 0 1Lodi 6 - Election Day 842 275 32.66 101 156 1 1 1 2 1 0Lodi 7 - Election Day 637 214 33.59 80 120 2 1 0 0 0 0Lodi 8 - Election Day 1214 380 31.30 131 222 5 2 0 1 0 0Lodi 9 - Election Day 987 297 30.09 82 194 1 3 4 4 0 0Lodi 10 - Election Day 1134 314 27.69 102 192 3 1 1 1 3 1Lodi 11 - Election Day 1166 390 33.45 116 247 2 3 0 1 0 0Lodi 12 - Election Day 1102 379 34.39 145 219 0 1 1 0 0 0Lodi Mail-In Ballot - Mail-In Ballot 0 225 0.00 93 113 2 1 2 1 1 0Lodi Provisional - Provisional 0 30 0.00 11 17 0 0 0 0 0 0Lyndhurst 1 - Election Day 748 275 36.76 127 138 0 2 1 0 0 0Lyndhurst 2 - Election Day 748 243 32.49 115 112 1 3 3 1 1 1Lyndhurst 3 - Election Day 1199 340 28.36 129 197 0 5 2 0 1 0Lyndhurst 4 - Election Day 867 341 39.33 167 158 3 3 1 1 0 2Lyndhurst 5 - Election Day 745 271 36.38 122 131 0 3 3 0 0 0Lyndhurst 6 - Election Day 1017 328 32.25 135 172 3 4 1 1 1 1Lyndhurst 7 - Election Day 775 285 36.77 119 144 0 3 1 1 0 0Lyndhurst 8 - Election Day 860 320 37.21 121 175 0 1 0 3 1 0Lyndhurst 9 - Election Day 708 276 38.98 106 152 2 1 3 1 1 0Lyndhurst 10 - Election Day 953 359 37.67 146 194 2 2 2 2 2 0Lyndhurst 11 - Election Day 793 342 43.13 151 174 0 2 0 0 0 0Lyndhurst 12 - Election Day 702 280 39.89 138 122 0 2 1 2 1 0Lyndhurst 13 - Election Day 929 294 31.65 141 123 4 3 2 5 0 0Lyndhurst 14 - Election Day 747 253 33.87 108 131 0 0 1 1 0 0Lyndhurst 15 - Election Day 843 293 34.76 121 160 1 1 1 1 0 0Lyndhurst Mail-In Ballot - Mail-In B 0 329 0.00 152 152 1 3 0 2 0 0Lyndhurst Provisional - Provisiona 0 22 0.00 11 9 1 0 1 0 0 0Mahwah 1 - Election Day 1581 771 48.77 468 277 2 0 1 4 3 0Mahwah 2 - Election Day 1236 685 55.42 391 258 3 4 5 3 2 1Mahwah 3 - Election Day 1256 614 48.89 354 235 0 2 6 1 0 0Mahwah 4 - Election Day 1051 522 49.67 268 231 1 2 2 4 1 0Mahwah 5 - Election Day 947 432 45.62 282 132 4 0 5 2 0 0Mahwah 6 - Election Day 1188 545 45.88 334 190 1 2 8 1 0 1Mahwah 7 - Election Day 1536 732 47.66 465 241 1 3 3 3 0 0Mahwah 8 - Election Day 1366 495 36.24 318 165 1 3 2 0 0 0
November 15, 2017 8:37 am Page 6 of 219

Regi
stra
tion
Ballo
ts C
ast
Turn
out (
%)
GOVE
RNOR
& L
IEUT
ENAN
T
KIM
GUA
DAGN
O &
CARL
OS A
.
PHIL
IP M
URPH
Y &
SHEI
LA O
LIVE
R
MAT
THEW
RIC
CARD
I
GINA
GEN
OVES
E
PETE
R J.
ROH
RMAN
& K
ARES
E J.
SETH
KAP
ER-D
ALE
& LI
SA
VINC
ENT
ROSS
& A
PRIL
A. J
OHNS
O N
Pers
onal
Choic
e
GOVERNOR & LIEUTENANT GOVERNOR
BERGEN COUNTY Statement of VoteBER_20171107_E
Mahwah 9 - Election Day 484 212 43.80 112 91 2 1 2 0 0 0Mahwah 10 - Election Day 1424 650 45.65 317 302 1 2 5 3 0 0Mahwah 11 - Election Day 1595 739 46.33 459 254 0 2 3 5 1 0Mahwah 12 - Election Day 749 378 50.47 206 159 0 3 2 2 0 0Mahwah 13 - Election Day 1063 426 40.08 209 204 0 4 3 1 0 0Mahwah 14 - Election Day 1098 417 37.98 194 207 1 4 2 4 0 0Mahwah Mail-In Ballot - Mail-In Ba 0 385 0.00 187 179 1 2 3 2 0 0Mahwah Provisional - Provisional 0 58 0.00 35 21 0 0 1 1 0 0Maywood 1 - Election Day 926 377 40.71 132 232 0 2 1 3 0 0Maywood 2 - Election Day 898 373 41.54 153 205 2 4 3 1 0 0Maywood 3 - Election Day 915 379 41.42 148 218 1 3 2 1 1 0Maywood 4 - Election Day 905 408 45.08 165 216 2 2 3 0 0 0Maywood 5 - Election Day 867 371 42.79 162 193 0 0 2 3 0 0Maywood 6 - Election Day 878 378 43.05 161 203 1 1 0 4 0 1Maywood 7 - Election Day 689 192 27.87 72 112 2 0 2 1 1 0Maywood Mail-In Ballot - Mail-In B 0 160 0.00 66 90 0 0 0 0 0 0Maywood Provisional - Provisiona 0 11 0.00 2 9 0 0 0 0 0 0Midland Park 1 - Election Day 1135 547 48.19 272 259 2 2 0 0 0 0Midland Park 2 - Election Day 745 345 46.31 188 146 1 0 0 2 0 0Midland Park 3 - Election Day 1151 525 45.61 263 243 2 0 2 3 0 0Midland Park 4 - Election Day 896 409 45.65 206 181 2 2 5 0 1 0Midland Park 5 - Election Day 1083 526 48.57 299 190 3 5 4 5 0 1Midland Park Mail-In Ballot - Mail- 0 104 0.00 38 61 0 1 0 0 0 0Midland Park Provisional - Provisio 0 17 0.00 3 14 0 0 0 0 0 0Montvale 1 - Election Day 738 351 47.56 180 162 0 1 3 0 0 0Montvale 2 - Election Day 1113 528 47.44 287 230 1 0 3 1 0 0Montvale 3 - Election Day 1929 836 43.34 465 339 1 0 5 2 1 1Montvale 4 - Election Day 1849 749 40.51 420 303 4 1 1 1 2 1Montvale Mail-In Ballot - Mail-In Ba 0 164 0.00 83 75 0 0 1 0 0 0Montvale Provisional - Provisional 0 14 0.00 6 7 0 0 0 0 0 0Moonachie 1 - Election Day 296 70 23.65 20 46 2 0 1 0 0 0Moonachie 2 - Election Day 890 313 35.17 125 173 1 0 0 0 0 0Moonachie 3 - Election Day 414 120 28.99 43 70 2 0 1 0 0 0Moonachie Mail-In Ballot - Mail-In 0 24 0.00 4 17 0 0 0 0 0 0Moonachie Provisional - Provision 0 1 0.00 0 1 0 0 0 0 0 0New Milford 1 - Election Day 1273 541 42.50 232 284 1 2 8 2 0 0New Milford 2 - Election Day 1185 524 44.22 239 255 6 5 4 0 0 0New Milford 3 - Election Day 1267 573 45.22 273 270 3 3 3 0 0 0New Milford 4 - Election Day 1356 567 41.81 287 263 1 3 2 1 0 0New Milford 5 - Election Day 1081 421 38.95 184 212 2 3 2 0 0 0New Milford 6 - Election Day 918 323 35.19 117 195 3 1 2 1 0 0New Milford 7 - Election Day 778 251 32.26 81 162 0 0 1 0 0 0New Milford 8 - Election Day 1404 580 41.31 254 290 1 6 4 0 3 2New Milford 9 - Election Day 861 383 44.48 189 174 2 2 7 2 0 0New Milford Mail-In Ballot - Mail-In 0 210 0.00 79 121 1 2 3 1 0 1New Milford Provisional - Provision 0 32 0.00 11 21 0 0 0 0 0 0North Arlington 1 - Election Day 547 226 41.32 96 117 2 1 0 1 3 0North Arlington 2 - Election Day 789 294 37.26 118 157 1 0 1 0 0 1North Arlington 3 - Election Day 934 360 38.54 158 187 0 1 3 0 1 2North Arlington 4 - Election Day 969 423 43.65 187 216 2 3 0 0 0 2North Arlington 5 - Election Day 1224 481 39.30 251 217 1 0 3 0 0 0North Arlington 6 - Election Day 968 346 35.74 159 169 3 0 1 2 0 0North Arlington 7 - Election Day 1448 635 43.85 325 290 2 3 2 1 0 1North Arlington 8 - Election Day 692 289 41.76 137 141 3 0 0 0 1 0North Arlington 9 - Election Day 970 408 42.06 209 186 1 0 2 4 2 0North Arlington 10 - Election Day 643 273 42.46 101 144 1 4 1 0 2 1North Arlington Mail-In Ballot - Ma 0 302 0.00 155 138 0 0 2 2 0 1North Arlington Provisional - Provi 0 16 0.00 3 11 0 0 0 0 0 0Northvale 1 - Election Day 976 422 43.24 202 207 0 0 3 4 0 0
November 15, 2017 8:37 am Page 7 of 219

Regi
stra
tion
Ballo
ts C
ast
Turn
out (
%)
GOVE
RNOR
& L
IEUT
ENAN
T
KIM
GUA
DAGN
O &
CARL
OS A
.
PHIL
IP M
URPH
Y &
SHEI
LA O
LIVE
R
MAT
THEW
RIC
CARD
I
GINA
GEN
OVES
E
PETE
R J.
ROH
RMAN
& K
ARES
E J.
SETH
KAP
ER-D
ALE
& LI
SA
VINC
ENT
ROSS
& A
PRIL
A. J
OHNS
O N
Pers
onal
Choic
e
GOVERNOR & LIEUTENANT GOVERNOR
BERGEN COUNTY Statement of VoteBER_20171107_E
Northvale 2 - Election Day 836 317 37.92 167 138 0 4 1 2 1 0Northvale 3 - Election Day 1156 464 40.14 194 249 1 5 3 1 0 0Northvale Mail-In Ballot - Mail-In B 0 50 0.00 25 22 1 0 0 0 0 0Northvale Provisional - Provisiona 0 2 0.00 0 2 0 0 0 0 0 0Norwood 1 - Election Day 1761 857 48.67 355 463 2 3 8 2 0 0Norwood 2 - Election Day 1899 821 43.23 379 406 2 1 4 2 1 1Norwood Mail-In Ballot - Mail-In Ba 0 88 0.00 40 44 0 1 0 2 0 0Norwood Provisional - Provisional 0 3 0.00 3 0 0 0 0 0 0 0Oakland 1 - Election Day 1001 452 45.15 206 228 2 0 0 4 0 0Oakland 2 - Election Day 912 394 43.20 205 164 5 4 3 2 0 0Oakland 3 - Election Day 755 331 43.84 163 153 1 0 2 1 0 1Oakland 4 - Election Day 942 428 45.44 238 171 1 1 6 3 0 0Oakland 5 - Election Day 1013 468 46.20 216 233 2 2 1 5 1 0Oakland 6 - Election Day 1232 556 45.13 276 265 3 1 3 1 0 0Oakland 7 - Election Day 1257 546 43.44 284 238 1 3 8 2 0 1Oakland 8 - Election Day 1705 605 35.48 301 293 1 1 0 1 0 0Oakland Mail-In Ballot - Mail-In Ba 0 199 0.00 85 103 2 0 2 3 0 0Oakland Provisional - Provisional 0 7 0.00 4 3 0 0 0 0 0 0Old Tappan 1 - Election Day 1201 435 36.22 241 189 0 1 0 1 0 0Old Tappan 2 - Election Day 1443 477 33.06 260 202 1 2 1 0 1 0Old Tappan 3 - Election Day 1513 497 32.85 269 214 1 1 2 0 0 0Old Tappan Mail-In Ballot - Mail-In 0 128 0.00 62 64 0 1 0 0 0 0Old Tappan Provisional - Provision 0 6 0.00 3 3 0 0 0 0 0 0Oradell 1 - Election Day 977 474 48.52 230 232 0 1 1 1 1 0Oradell 2 - Election Day 886 387 43.68 171 202 1 0 4 0 0 0Oradell 3 - Election Day 922 450 48.81 209 223 0 2 2 1 0 0Oradell 4 - Election Day 934 461 49.36 198 252 0 0 3 0 1 0Oradell 5 - Election Day 1122 530 47.24 268 244 0 2 3 2 0 0Oradell 6 - Election Day 1122 530 47.24 271 243 1 2 2 2 1 0Oradell Mail-In Ballot - Mail-In Ball 0 184 0.00 72 108 0 2 1 0 0 0Oradell Provisional - Provisional 0 14 0.00 6 8 0 0 0 0 0 0Palisades Park 1 - Election Day 569 132 23.20 37 88 0 1 0 0 1 0Palisades Park 2 - Election Day 701 241 34.38 74 134 1 1 0 0 0 0Palisades Park 3 - Election Day 696 170 24.43 60 102 0 1 0 0 0 0Palisades Park 4 - Election Day 744 186 25.00 53 116 0 0 1 0 0 0Palisades Park 5 - Election Day 853 199 23.33 86 97 0 0 1 1 1 0Palisades Park 6 - Election Day 1144 291 25.44 102 153 1 1 0 4 0 0Palisades Park 7 - Election Day 748 193 25.80 76 95 1 0 2 1 0 0Palisades Park 8 - Election Day 944 206 21.82 66 130 1 3 1 0 0 0Palisades Park 9 - Election Day 1088 208 19.12 64 128 1 0 2 2 0 0Palisades Park Mail-In Ballot - Ma 0 301 0.00 64 214 0 0 0 0 2 0Palisades Park Provisional - Provi 0 37 0.00 12 22 0 0 0 0 0 0Paramus 1 - Election Day 1250 397 31.76 188 192 2 2 4 3 0 0Paramus 2 - Election Day 946 360 38.05 164 187 0 2 1 2 0 0Paramus 3 - Election Day 1066 455 42.68 217 227 1 1 0 3 0 1Paramus 4 - Election Day 823 304 36.94 153 139 1 0 2 1 0 0Paramus 5 - Election Day 746 323 43.30 159 151 0 2 6 3 0 0Paramus 6 - Election Day 887 334 37.66 147 176 2 0 2 0 1 0Paramus 7 - Election Day 975 441 45.23 206 212 6 0 2 3 0 0Paramus 8 - Election Day 911 317 34.80 166 134 2 3 0 0 0 0Paramus 9 - Election Day 864 325 37.62 163 155 0 1 0 1 0 1Paramus 10 - Election Day 790 294 37.22 131 151 1 0 1 0 0 0Paramus 11 - Election Day 740 277 37.43 120 142 2 5 0 1 0 0Paramus 12 - Election Day 1277 521 40.80 276 227 1 3 4 1 1 0Paramus 13 - Election Day 625 262 41.92 109 146 1 0 0 0 0 0Paramus 14 - Election Day 933 351 37.62 174 166 2 0 2 1 0 0Paramus 15 - Election Day 1422 471 33.12 200 258 0 1 6 1 1 0Paramus 16 - Election Day 698 308 44.13 142 149 1 1 0 1 2 1Paramus 17 - Election Day 841 324 38.53 138 173 0 2 1 0 1 0
November 15, 2017 8:37 am Page 8 of 219

Regi
stra
tion
Ballo
ts C
ast
Turn
out (
%)
GOVE
RNOR
& L
IEUT
ENAN
T
KIM
GUA
DAGN
O &
CARL
OS A
.
PHIL
IP M
URPH
Y &
SHEI
LA O
LIVE
R
MAT
THEW
RIC
CARD
I
GINA
GEN
OVES
E
PETE
R J.
ROH
RMAN
& K
ARES
E J.
SETH
KAP
ER-D
ALE
& LI
SA
VINC
ENT
ROSS
& A
PRIL
A. J
OHNS
O N
Pers
onal
Choic
e
GOVERNOR & LIEUTENANT GOVERNOR
BERGEN COUNTY Statement of VoteBER_20171107_E
Paramus 18 - Election Day 600 256 42.67 101 142 1 1 5 0 2 0Paramus 19 - Election Day 717 332 46.30 145 179 0 1 0 0 0 0Paramus 20 - Election Day 832 318 38.22 152 158 0 1 2 0 0 0Paramus Mail-In Ballot - Mail-In Ba 0 542 0.00 231 280 1 4 5 3 1 0Paramus Provisional - Provisional 0 37 0.00 17 20 0 0 0 0 0 0Park Ridge 1 - Election Day 1195 667 55.82 369 279 1 2 1 1 1 1Park Ridge 2 - Election Day 875 440 50.29 240 178 3 2 2 1 0 0Park Ridge 3 - Election Day 951 507 53.31 300 191 2 0 1 1 0 0Park Ridge 4 - Election Day 868 472 54.38 241 217 2 2 2 1 0 1Park Ridge 5 - Election Day 1088 487 44.76 255 210 2 1 3 1 1 0Park Ridge 6 - Election Day 1174 609 51.87 312 271 1 1 0 2 0 0Park Ridge Mail-In Ballot - Mail-In 0 138 0.00 70 61 1 2 0 0 0 1Park Ridge Provisional - Provision 0 16 0.00 6 9 0 0 0 0 0 0Ramsey 1 - Election Day 1185 529 44.64 230 284 1 3 2 1 2 1Ramsey 2 - Election Day 1482 717 48.38 359 340 3 2 2 1 0 0Ramsey 3 - Election Day 1457 724 49.69 399 304 0 7 3 3 1 0Ramsey 4 - Election Day 785 350 44.59 180 156 0 2 0 1 0 0Ramsey 5 - Election Day 1508 701 46.49 366 314 1 2 3 0 3 0Ramsey 6 - Election Day 1828 718 39.28 350 355 2 0 4 1 0 0Ramsey 7 - Election Day 1242 567 45.65 301 243 0 3 8 2 0 1Ramsey 8 - Election Day 1006 488 48.51 313 165 0 2 1 1 0 0Ramsey Mail-In Ballot - Mail-In Ba 0 280 0.00 149 125 0 0 1 0 0 1Ramsey Provisional - Provisional 0 14 0.00 11 3 0 0 0 0 0 0Ridgefield 1 - Election Day 1202 396 32.95 163 219 0 3 0 3 0 0Ridgefield 2 - Election Day 921 358 38.87 136 210 3 0 0 0 0 1Ridgefield 3 - Election Day 1481 429 28.97 146 262 0 2 5 2 0 1Ridgefield 4 - Election Day 963 303 31.46 112 177 3 1 1 0 2 1Ridgefield 5 - Election Day 1300 382 29.38 141 225 1 1 1 2 0 0Ridgefield Mail-In Ballot - Mail-In B 0 135 0.00 69 62 1 1 0 1 0 1Ridgefield Provisional - Provisiona 0 14 0.00 6 8 0 0 0 0 0 0Ridgefield Park 1 - Election Day 588 227 38.61 65 153 2 1 0 2 0 0Ridgefield Park 2 - Election Day 1076 382 35.50 125 246 0 2 3 0 0 0Ridgefield Park 3 - Election Day 797 255 31.99 78 159 3 2 2 0 0 2Ridgefield Park 4 - Election Day 1073 393 36.63 142 243 0 0 2 0 0 0Ridgefield Park 5 - Election Day 602 230 38.21 82 142 0 0 0 2 0 1Ridgefield Park 6 - Election Day 964 382 39.63 137 225 5 3 1 2 1 0Ridgefield Park 7 - Election Day 935 359 38.40 107 240 5 3 0 0 0 0Ridgefield Park 8 - Election Day 1125 451 40.09 160 271 0 7 0 2 0 0Ridgefield Park Mail-In Ballot - Ma 0 98 0.00 33 56 0 2 1 0 2 0Ridgefield Park Provisional - Provi 0 26 0.00 9 18 0 0 0 0 0 0Ridgewood 1 - Election Day 809 325 40.17 128 190 0 1 1 3 0 0Ridgewood 2 - Election Day 1049 374 35.65 161 211 1 0 1 0 0 0Ridgewood 3 - Election Day 940 371 39.47 163 202 0 0 0 1 0 1Ridgewood 4 - Election Day 788 311 39.47 115 193 0 0 2 1 0 0Ridgewood 5 - Election Day 1023 334 32.65 174 156 0 0 1 1 0 0Ridgewood 6 - Election Day 859 376 43.77 126 241 0 2 3 3 0 0Ridgewood 7 - Election Day 990 402 40.61 148 244 0 0 3 2 0 0Ridgewood 8 - Election Day 724 298 41.16 99 192 1 1 1 1 0 0Ridgewood 9 - Election Day 702 305 43.45 108 186 0 1 3 2 0 0Ridgewood 10 - Election Day 718 244 33.98 56 178 0 3 1 1 1 1Ridgewood 11 - Election Day 979 435 44.43 179 243 1 1 5 0 1 0Ridgewood 12 - Election Day 864 369 42.71 145 217 0 1 3 0 0 0Ridgewood 13 - Election Day 948 378 39.87 110 260 2 1 0 1 0 0Ridgewood 14 - Election Day 1196 489 40.89 196 282 0 1 3 4 1 1Ridgewood 15 - Election Day 848 370 43.63 140 221 2 4 0 3 0 0Ridgewood 16 - Election Day 695 278 40.00 114 155 0 3 4 0 0 0Ridgewood 17 - Election Day 785 320 40.76 140 174 0 2 1 0 1 1Ridgewood 18 - Election Day 870 390 44.83 136 248 0 2 0 2 0 0Ridgewood 19 - Election Day 821 339 41.29 124 206 0 3 2 0 0 0
November 15, 2017 8:37 am Page 9 of 219

Regi
stra
tion
Ballo
ts C
ast
Turn
out (
%)
GOVE
RNOR
& L
IEUT
ENAN
T
KIM
GUA
DAGN
O &
CARL
OS A
.
PHIL
IP M
URPH
Y &
SHEI
LA O
LIVE
R
MAT
THEW
RIC
CARD
I
GINA
GEN
OVES
E
PETE
R J.
ROH
RMAN
& K
ARES
E J.
SETH
KAP
ER-D
ALE
& LI
SA
VINC
ENT
ROSS
& A
PRIL
A. J
OHNS
O N
Pers
onal
Choic
e
GOVERNOR & LIEUTENANT GOVERNOR
BERGEN COUNTY Statement of VoteBER_20171107_E
Ridgewood Mail-In Ballot - Mail-In 0 432 0.00 129 290 0 0 3 7 1 0Ridgewood Provisional - Provision 0 35 0.00 10 24 0 0 0 0 0 0River Edge 1 - Election Day 1133 485 42.81 187 282 1 1 2 2 0 0River Edge 2 - Election Day 964 410 42.53 176 221 2 2 2 0 0 0River Edge 3 - Election Day 863 371 42.99 144 219 1 0 1 0 1 0River Edge 4 - Election Day 935 444 47.49 175 259 0 1 1 1 1 0River Edge 5 - Election Day 758 301 39.71 117 172 0 2 0 0 0 0River Edge 6 - Election Day 878 347 39.52 135 199 0 5 2 2 0 0River Edge 7 - Election Day 914 366 40.04 136 220 0 1 0 1 0 0River Edge 8 - Election Day 752 241 32.05 89 146 2 0 0 1 0 0River Edge Mail-In Ballot - Mail-In 0 198 0.00 80 111 0 1 3 0 0 0River Edge Provisional - Provision 0 7 0.00 3 4 0 0 0 0 0 0River Vale 1 - Election Day 1533 578 37.70 309 257 1 4 2 1 0 0River Vale 2 - Election Day 2055 856 41.65 453 382 0 8 4 1 3 0River Vale 3 - Election Day 1486 632 42.53 300 313 1 4 2 2 0 0River Vale 4 - Election Day 1159 476 41.07 241 229 0 1 2 1 0 0River Vale 5 - Election Day 1231 493 40.05 274 210 1 1 0 1 0 0River Vale Mail-In Ballot - Mail-In B 0 134 0.00 56 73 0 0 0 1 0 0River Vale Provisional - Provisiona 0 10 0.00 4 6 0 0 0 0 0 0Rochelle Park 1 - Election Day 1001 472 47.15 204 241 1 2 3 0 2 0Rochelle Park 2 - Election Day 894 421 47.09 207 191 1 1 2 1 2 0Rochelle Park 3 - Election Day 852 413 48.47 152 209 5 8 0 3 1 0Rochelle Park 4 - Election Day 956 432 45.19 215 188 1 3 1 0 0 0Rochelle Park Mail-In Ballot - Mail 0 105 0.00 47 54 0 0 0 1 0 0Rochelle Park Provisional - Provis 0 16 0.00 9 6 0 0 0 0 0 0Rockleigh 1 - Election Day 227 81 35.68 57 19 2 0 1 0 0 0Rockleigh Mail-In Ballot - Mail-In B 0 15 0.00 6 8 0 0 0 1 0 0Rockleigh Provisional - Provisiona 0 1 0.00 0 1 0 0 0 0 0 0Rutherford 1 - Election Day 990 496 50.10 199 280 1 3 2 0 0 0Rutherford 2 - Election Day 1099 509 46.31 216 269 0 5 3 4 1 0Rutherford 3 - Election Day 989 434 43.88 142 279 0 2 1 3 1 0Rutherford 4 - Election Day 730 346 47.40 153 180 2 0 2 1 1 0Rutherford 5 - Election Day 776 344 44.33 135 196 0 3 2 2 0 0Rutherford 6 - Election Day 743 282 37.95 96 177 1 1 2 1 1 0Rutherford 7 - Election Day 938 404 43.07 149 240 2 2 1 3 0 0Rutherford 8 - Election Day 1007 420 41.71 159 248 1 3 4 2 1 0Rutherford 9 - Election Day 1051 491 46.72 196 279 2 4 1 2 1 0Rutherford 10 - Election Day 969 437 45.10 178 247 2 2 0 2 0 0Rutherford 11 - Election Day 1041 405 38.90 145 250 2 0 1 1 0 0Rutherford 12 - Election Day 763 311 40.76 133 169 0 0 1 1 0 0Rutherford Mail-In Ballot - Mail-In 0 257 0.00 92 157 0 4 1 1 0 0Rutherford Provisional - Provisiona 0 43 0.00 8 32 0 0 0 0 0 0Saddle Brook 1 - Election Day 778 267 34.32 114 147 0 3 0 0 1 0Saddle Brook 2 - Election Day 769 325 42.26 124 183 1 1 2 1 0 1Saddle Brook 3 - Election Day 582 236 40.55 81 144 1 2 3 1 0 0Saddle Brook 4 - Election Day 892 378 42.38 183 180 5 1 0 0 0 1Saddle Brook 5 - Election Day 995 344 34.57 165 164 3 1 3 1 0 0Saddle Brook 6 - Election Day 973 424 43.58 227 178 1 0 2 0 2 0Saddle Brook 7 - Election Day 598 255 42.64 146 90 2 3 1 0 1 0Saddle Brook 8 - Election Day 790 329 41.65 156 159 1 2 2 0 0 0Saddle Brook 9 - Election Day 916 369 40.28 175 175 3 1 1 2 0 2Saddle Brook 10 - Election Day 857 371 43.29 201 166 0 0 1 1 0 0Saddle Brook 11 - Election Day 864 386 44.68 176 192 2 2 1 0 0 0Saddle Brook Mail-In Ballot - Mail- 0 144 0.00 60 76 0 1 0 0 1 0Saddle Brook Provisional - Provisi 0 18 0.00 5 9 0 0 0 1 0 0Saddle River 1 - Election Day 1185 380 32.07 279 94 0 0 3 2 0 0Saddle River 2 - Election Day 1452 532 36.64 397 126 1 0 4 0 0 0Saddle River Mail-In Ballot - Mail-I 0 74 0.00 41 31 0 0 0 0 0 0Saddle River Provisional - Provisio 0 8 0.00 4 3 0 0 0 0 0 0
November 15, 2017 8:37 am Page 10 of 219

Regi
stra
tion
Ballo
ts C
ast
Turn
out (
%)
GOVE
RNOR
& L
IEUT
ENAN
T
KIM
GUA
DAGN
O &
CARL
OS A
.
PHIL
IP M
URPH
Y &
SHEI
LA O
LIVE
R
MAT
THEW
RIC
CARD
I
GINA
GEN
OVES
E
PETE
R J.
ROH
RMAN
& K
ARES
E J.
SETH
KAP
ER-D
ALE
& LI
SA
VINC
ENT
ROSS
& A
PRIL
A. J
OHNS
O N
Pers
onal
Choic
e
GOVERNOR & LIEUTENANT GOVERNOR
BERGEN COUNTY Statement of VoteBER_20171107_E
South Hackensack 1 - Election Da 1417 525 37.05 179 324 1 3 3 0 0 0South Hackensack Mail-In Ballot - 0 32 0.00 11 15 0 3 0 0 0 0South Hackensack Provisional - P 0 1 0.00 0 1 0 0 0 0 0 0Teaneck 1 - Election Day 995 372 37.39 73 291 0 2 2 1 0 0Teaneck 2 - Election Day 1310 466 35.57 76 375 0 2 2 3 1 0Teaneck 3 - Election Day 1247 545 43.70 113 417 2 1 4 3 0 1Teaneck 4 - Election Day 1154 478 41.42 105 366 1 3 1 1 0 0Teaneck 5 - Election Day 860 317 36.86 47 262 0 0 1 3 1 1Teaneck 6 - Election Day 1021 463 45.35 61 386 0 2 1 3 4 0Teaneck 7 - Election Day 1069 430 40.22 66 352 0 0 1 5 0 0Teaneck 8 - Election Day 1286 622 48.37 119 488 1 4 3 1 1 3Teaneck 9 - Election Day 1261 491 38.94 139 341 0 2 2 3 0 0Teaneck 10 - Election Day 1438 477 33.17 194 279 0 1 0 1 0 0Teaneck 11 - Election Day 1297 388 29.92 169 206 1 5 3 0 0 0Teaneck 12 - Election Day 1440 486 33.75 187 293 0 1 0 0 0 0Teaneck 13 - Election Day 1098 527 48.00 19 500 1 1 1 1 0 1Teaneck 14 - Election Day 1464 636 43.44 14 609 0 4 2 0 2 1Teaneck 15 - Election Day 1080 330 30.56 57 264 1 0 1 3 1 0Teaneck 16 - Election Day 750 313 41.73 6 300 0 1 0 0 0 1Teaneck 17 - Election Day 1259 524 41.62 38 474 1 2 0 4 1 0Teaneck 18 - Election Day 1333 547 41.04 132 400 3 2 3 2 1 1Teaneck 19 - Election Day 1147 462 40.28 85 366 2 1 1 1 1 0Teaneck 20 - Election Day 830 314 37.83 94 215 0 1 1 0 1 0Teaneck 21 - Election Day 1355 459 33.87 74 372 0 0 1 3 0 0Teaneck 22 - Election Day 994 354 35.61 53 292 1 0 1 1 1 0Teaneck 23 - Election Day 981 341 34.76 16 316 2 0 1 0 0 0Teaneck Mail-In Ballot - Mail-In Ba 0 513 0.00 106 386 1 4 3 2 0 0Teaneck Provisional - Provisional 0 37 0.00 7 30 0 0 0 0 0 0Tenafly 1 - Election Day 778 281 36.12 92 178 0 3 2 3 1 1Tenafly 2 - Election Day 631 211 33.44 77 128 0 1 0 5 0 0Tenafly 3 - Election Day 592 217 36.66 66 143 0 1 1 3 0 0Tenafly 4 - Election Day 824 318 38.59 76 235 0 0 0 4 0 0Tenafly 5 - Election Day 728 254 34.89 58 193 0 0 1 1 0 0Tenafly 6 - Election Day 636 229 36.01 62 162 0 1 0 1 1 1Tenafly 7 - Election Day 708 195 27.54 73 117 1 0 1 1 0 1Tenafly 8 - Election Day 835 277 33.17 68 204 0 0 1 0 0 0Tenafly 9 - Election Day 847 333 39.32 93 233 0 0 3 2 0 0Tenafly 10 - Election Day 687 267 38.86 88 174 0 1 0 0 0 0Tenafly 11 - Election Day 824 278 33.74 95 179 0 0 1 0 1 0Tenafly 12 - Election Day 960 287 29.90 102 184 0 0 0 0 0 0Tenafly Mail-In Ballot - Mail-In Bal 0 196 0.00 55 138 0 0 0 1 0 0Tenafly Provisional - Provisional 0 15 0.00 4 9 0 0 1 0 0 0Teterboro 1 - Election Day 34 17 50.00 7 9 0 0 0 0 0 0Teterboro Mail-In Ballot - Mail-In B 0 0 0.00 0 0 0 0 0 0 0 0Teterboro Provisional - Provisiona 0 0 0.00 0 0 0 0 0 0 0 0Upper Saddle River 1 - Election D 1468 548 37.33 326 216 0 0 2 2 0 0Upper Saddle River 2 - Election D 1049 375 35.75 238 133 0 0 1 1 0 0Upper Saddle River 3 - Election D 1271 447 35.17 274 161 2 3 2 0 0 0Upper Saddle River 4 - Election D 1269 453 35.70 247 195 2 3 1 1 0 0Upper Saddle River 5 - Election D 930 322 34.62 185 131 0 0 2 3 0 0Upper Saddle River Mail-In Ballot 0 126 0.00 64 59 0 2 1 0 0 0Upper Saddle River Provisional - P 0 18 0.00 6 12 0 0 0 0 0 0Waldwick 1 - Election Day 1287 574 44.60 264 291 3 3 3 1 1 1Waldwick 2 - Election Day 1141 472 41.37 218 243 4 2 0 1 0 1Waldwick 3 - Election Day 1088 478 43.93 203 256 2 1 6 5 0 0Waldwick 4 - Election Day 1098 481 43.81 252 206 2 6 8 2 0 0Waldwick 5 - Election Day 1037 463 44.65 219 233 0 1 3 4 0 0Waldwick 6 - Election Day 1001 456 45.55 235 203 1 4 4 5 1 0Waldwick Mail-In Ballot - Mail-In B 0 129 0.00 73 51 0 0 2 1 0 0
November 15, 2017 8:37 am Page 11 of 219

Regi
stra
tion
Ballo
ts C
ast
Turn
out (
%)
GOVE
RNOR
& L
IEUT
ENAN
T
KIM
GUA
DAGN
O &
CARL
OS A
.
PHIL
IP M
URPH
Y &
SHEI
LA O
LIVE
R
MAT
THEW
RIC
CARD
I
GINA
GEN
OVES
E
PETE
R J.
ROH
RMAN
& K
ARES
E J.
SETH
KAP
ER-D
ALE
& LI
SA
VINC
ENT
ROSS
& A
PRIL
A. J
OHNS
O N
Pers
onal
Choic
e
GOVERNOR & LIEUTENANT GOVERNOR
BERGEN COUNTY Statement of VoteBER_20171107_E
Waldwick Provisional - Provisiona 0 16 0.00 6 10 0 0 0 0 0 0Wallington 1 - Election Day 623 211 33.87 94 89 1 1 4 2 0 1Wallington 2 - Election Day 738 232 31.44 114 99 0 1 0 2 0 0Wallington 3 - Election Day 1129 373 33.04 147 184 1 6 4 7 1 0Wallington 4 - Election Day 1305 655 50.19 347 257 1 4 0 1 1 0Wallington 5 - Election Day 1101 381 34.60 199 144 4 1 7 0 0 0Wallington 6 - Election Day 710 251 35.35 111 125 1 0 1 1 0 0Wallington Mail-In Ballot - Mail-In B 0 137 0.00 71 54 0 0 1 1 1 0Wallington Provisional - Provisiona 0 9 0.00 4 5 0 0 0 0 0 0Washington Township 1 - Election 1346 640 47.55 321 287 1 2 3 1 1 1Washington Township 2 - Election 912 425 46.60 248 162 1 0 2 1 0 0Washington Township 3 - Election 746 373 50.00 187 164 3 2 1 0 1 0Washington Township 4 - Election 1192 512 42.95 282 216 1 0 0 6 0 0Washington Township 5 - Election 1117 549 49.15 303 219 1 0 6 3 0 0Washington Township 6 - Election 1508 680 45.09 389 263 3 3 5 1 0 0Washington Township Mail-In Ball 0 211 0.00 123 78 0 0 0 2 1 0Washington Township Provisional 0 19 0.00 10 8 0 0 0 0 0 0Westwood 1 - Election Day 1114 513 46.05 235 264 1 1 2 1 1 0Westwood 2 - Election Day 959 446 46.51 199 231 2 2 1 5 0 0Westwood 3 - Election Day 605 297 49.09 120 159 5 2 5 0 1 0Westwood 4 - Election Day 894 429 47.99 153 263 0 4 3 0 1 0Westwood 5 - Election Day 707 351 49.65 172 162 2 1 3 3 0 1Westwood 6 - Election Day 1242 469 37.76 150 304 3 3 0 1 0 0Westwood 7 - Election Day 781 356 45.58 190 160 2 1 1 0 0 0Westwood 8 - Election Day 944 445 47.14 225 207 1 2 1 2 0 0Westwood Mail-In Ballot - Mail-In B 0 156 0.00 80 70 1 0 2 0 0 0Westwood Provisional - Provisiona 0 20 0.00 4 15 0 0 0 0 0 0Woodcliff Lake 1 - Election Day 897 425 47.38 191 214 1 1 1 3 1 1Woodcliff Lake 2 - Election Day 1176 556 47.28 279 259 1 1 5 0 1 0Woodcliff Lake 3 - Election Day 983 475 48.32 243 221 1 0 1 0 0 0Woodcliff Lake 4 - Election Day 1427 621 43.52 293 299 0 1 4 0 2 0Woodcliff Lake Mail-In Ballot - Mai 0 170 0.00 84 71 0 2 2 0 1 0Woodcliff Lake Provisional - Provis 0 21 0.00 11 8 0 0 0 0 0 0Wood Ridge 1 - Election Day 1442 602 41.75 203 366 1 3 8 1 0 0Wood Ridge 2 - Election Day 772 408 52.85 206 178 3 0 4 0 2 0Wood Ridge 3 - Election Day 1200 569 47.42 253 276 4 1 7 3 1 1Wood Ridge 4 - Election Day 1182 499 42.22 207 271 6 3 3 2 0 0Wood Ridge 5 - Election Day 1243 601 48.35 247 313 3 3 9 2 1 1Wood Ridge Mail-In Ballot - Mail-In 0 136 0.00 42 88 0 2 1 0 0 0Wood Ridge Provisional - Provisio 0 8 0.00 3 4 0 0 0 0 0 0Wyckoff 1 - Election Day 1382 630 45.59 348 262 1 3 3 2 0 2Wyckoff 2 - Election Day 1496 704 47.06 401 284 1 1 4 1 0 0Wyckoff 3 - Election Day 1259 542 43.05 309 225 0 0 3 1 0 0Wyckoff 4 - Election Day 1421 628 44.19 368 239 0 4 1 1 0 0Wyckoff 5 - Election Day 929 450 48.44 248 186 1 0 2 1 1 0Wyckoff 6 - Election Day 1229 556 45.24 317 229 1 1 1 2 1 0Wyckoff 7 - Election Day 1270 631 49.69 366 248 3 2 3 0 0 0Wyckoff 8 - Election Day 1347 585 43.43 390 183 3 0 1 2 0 0Wyckoff 9 - Election Day 876 435 49.66 259 170 0 0 3 0 0 0Wyckoff 10 - Election Day 1139 511 44.86 276 217 0 1 0 2 0 0Wyckoff Mail-In Ballot - Mail-In Ba 0 439 0.00 205 217 1 1 1 3 2 0Wyckoff Provisional - Provisional 0 29 0.00 12 17 0 0 0 0 0 0
Election Day Totals 559538 218514 39.05 89272 120724 625 811 1088 728 233 124
Mail-In Ballot Totals 0 13571 0.00 5198 7679 30 82 58 68 22 11
Provisional Totals 0 1374 0.00 434 862 1 3 8 2 1 0
November 15, 2017 8:37 am Page 12 of 219

Regi
stra
tion
Ballo
ts C
ast
Turn
out (
%)
GOVE
RNOR
& L
IEUT
ENAN
T
KIM
GUA
DAGN
O &
CARL
OS A
.
PHIL
IP M
URPH
Y &
SHEI
LA O
LIVE
R
MAT
THEW
RIC
CARD
I
GINA
GEN
OVES
E
PETE
R J.
ROH
RMAN
& K
ARES
E J.
SETH
KAP
ER-D
ALE
& LI
SA
VINC
ENT
ROSS
& A
PRIL
A. J
OHNS
O N
Pers
onal
Choic
e
GOVERNOR & LIEUTENANT GOVERNOR
BERGEN COUNTY Statement of VoteBER_20171107_E
District Totals - Absentee
District Grand TotalsCounty 559538 233459 41.72 94904 129265 656 896 1154 798 256 135Allendale 4892 2321 47.44 1232 1013 5 13 12 7 3 2Alpine 1416 436 30.79 229 199 0 2 1 1 0 0Bergenfield 15631 5891 37.69 1858 3822 14 10 15 20 6 3Bogota 5053 2147 42.49 728 1289 14 10 7 15 3 2Carlstadt 3702 1565 42.27 683 760 6 3 72 6 0 1Cliffside Park 12046 4244 35.23 1174 2910 14 7 14 15 3 7Closter 5228 2079 39.77 834 1185 3 6 1 3 2 1Cresskill 5264 1947 36.99 859 1034 4 6 9 3 2 1Demarest 3302 1437 43.52 559 838 3 2 5 2 1 0Dumont 11299 4628 40.96 1969 2513 16 17 27 18 6 3East Rutherford 5060 2055 40.61 821 1082 13 12 30 11 5 2Edgewater 5771 1834 31.78 447 1320 2 7 12 9 3 0Elmwood Park 11917 4653 39.05 1754 2581 23 28 15 10 14 4Emerson 5025 2340 46.57 1160 1094 4 10 15 5 1 1Englewood 16389 6268 38.25 1054 4933 12 17 20 17 8 2Englewood Cliffs 3607 1956 54.23 909 902 4 7 6 8 2 1Fair Lawn 21819 9729 44.59 3815 5492 31 45 59 41 8 9Fair View 5322 1791 33.65 409 1292 4 6 5 7 1 1Fort Lee 19942 7224 36.23 2167 4715 16 20 21 29 9 3Franklin Lakes 8040 3169 39.42 2049 1050 4 4 11 8 1 0Garfield 14037 3692 26.30 1234 2340 11 17 12 14 9 2Glen Rock 8424 4387 52.08 1696 2576 7 10 12 8 4 1Hackensack 21248 7796 36.69 1522 5983 28 25 37 32 9 5Harrington Park 3348 1695 50.63 748 883 3 8 3 6 2 0Hasbrouck Heights 7895 3510 44.46 1665 1691 9 16 18 4 7 4Haworth 2488 1233 49.56 445 742 3 4 2 2 1 1Hillsdale 7546 3528 46.75 1634 1781 15 9 13 11 3 2Ho-Ho-Kus 3079 1678 54.50 867 724 3 5 33 6 0 1Leonia 5138 2127 41.40 592 1471 6 6 4 18 0 1Little Ferry 5360 1696 31.64 639 986 1 11 7 2 1 3Lodi 12654 4148 32.78 1361 2536 18 22 16 14 8 2Lyndhurst 12634 4851 38.40 2109 2444 18 38 23 21 8 4Mahwah 16574 8061 48.64 4599 3146 18 34 53 36 7 2Maywood 6078 2649 43.58 1061 1478 8 12 13 13 2 1Midland Park 5010 2473 49.36 1269 1094 10 10 11 10 1 1Montvale 5629 2642 46.94 1441 1116 6 2 13 4 3 2Moonachie 1600 528 33.00 192 307 5 0 2 0 0 0New Milford 10123 4405 43.51 1946 2247 20 27 36 7 3 3North Arlington 9184 4053 44.13 1899 1973 16 12 15 10 9 8Northvale 2968 1255 42.28 588 618 2 9 7 7 1 0Norwood 3660 1769 48.33 777 913 4 5 12 6 1 1Oakland 8817 3986 45.21 1978 1851 18 12 25 22 1 2Old Tappan 4157 1543 37.12 835 672 2 5 3 1 1 0Oradell 5963 3030 50.81 1425 1512 2 9 16 6 3 0Palisades Park 7487 2164 28.90 694 1279 5 7 7 8 4 0Paramus 17943 7549 42.07 3499 3764 24 30 43 24 9 3Park Ridge 6151 3336 54.24 1793 1416 12 10 9 7 2 3Ramsey 10493 5088 48.49 2658 2289 7 21 24 10 6 3Ridgefield 5867 2017 34.38 773 1163 8 8 7 8 2 4Ridgefield Park 7160 2803 39.15 938 1753 15 20 9 8 3 3Ridgewood 16608 7175 43.20 2701 4313 7 26 37 32 5 4River Edge 7197 3170 44.05 1242 1833 6 13 11 7 2 0River Vale 7464 3179 42.59 1637 1470 3 18 10 7 3 0Rochelle Park 3703 1859 50.20 834 889 8 14 6 5 5 0Rockleigh 227 97 42.73 63 28 2 0 1 1 0 0
November 15, 2017 8:37 am Page 13 of 219
Regi
stra
tion
Ballo
ts C
ast
Turn
out (
%)
GOVE
RNOR
& L
IEUT
ENAN
T
KIM
GUA
DAGN
O &
CARL
OS A
.
PHIL
IP M
URPH
Y &
SHEI
LA O
LIVE
R
MAT
THEW
RIC
CARD
I
GINA
GEN
OVES
E
PETE
R J.
ROH
RMAN
& K
ARES
E J.
SETH
KAP
ER-D
ALE
& LI
SA
VINC
ENT
ROSS
& A
PRIL
A. J
OHNS
O N
Pers
onal
Choic
e
GOVERNOR & LIEUTENANT GOVERNOR
BERGEN COUNTY Statement of VoteBER_20171107_E
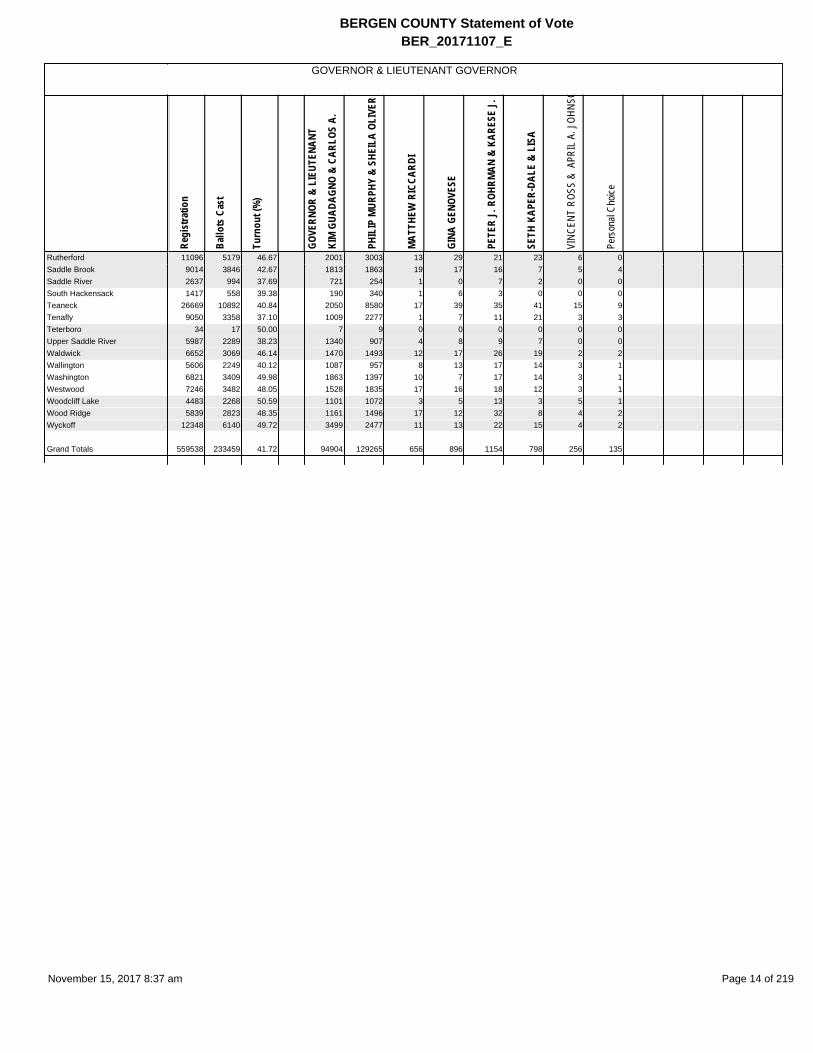
Rutherford 11096 5179 46.67 2001 3003 13 29 21 23 6 0Saddle Brook 9014 3846 42.67 1813 1863 19 17 16 7 5 4Saddle River 2637 994 37.69 721 254 1 0 7 2 0 0South Hackensack 1417 558 39.38 190 340 1 6 3 0 0 0Teaneck 26669 10892 40.84 2050 8580 17 39 35 41 15 9Tenafly 9050 3358 37.10 1009 2277 1 7 11 21 3 3Teterboro 34 17 50.00 7 9 0 0 0 0 0 0Upper Saddle River 5987 2289 38.23 1340 907 4 8 9 7 0 0Waldwick 6652 3069 46.14 1470 1493 12 17 26 19 2 2Wallington 5606 2249 40.12 1087 957 8 13 17 14 3 1Washington 6821 3409 49.98 1863 1397 10 7 17 14 3 1Westwood 7246 3482 48.05 1528 1835 17 16 18 12 3 1Woodcliff Lake 4483 2268 50.59 1101 1072 3 5 13 3 5 1Wood Ridge 5839 2823 48.35 1161 1496 17 12 32 8 4 2Wyckoff 12348 6140 49.72 3499 2477 11 13 22 15 4 2
Grand Totals 559538 233459 41.72 94904 129265 656 896 1154 798 256 135
November 15, 2017 8:37 am Page 14 of 219

Regi
stra
tion
Ballo
ts C
ast
Turn
out (
%)
STAT
E SE
NATE
DIS
T 32
PAUL
CAS
TELL
I
NICH
OLAS
J. S
ACCO
Pers
onal
Cho
ice
STATE SENATE DIST 32
BERGEN COUNTY Statement of VoteBER_20171107_E
Edgewater 1 - Election Day 1072 335 31.25 68 238 0Edgewater 2 - Election Day 1385 405 29.24 90 281 0Edgewater 3 - Election Day 1416 469 33.12 126 297 0Edgewater 4 - Election Day 1898 486 25.61 112 344 0Edgewater Mail-In Ballot - Mail-In 0 123 0.00 34 83 2Edgewater Provisional - Provisiona 0 16 0.00 4 11 0Fairview 1 - Election Day 757 255 33.69 35 182 0Fairview 2 - Election Day 1265 396 31.30 78 269 0Fairview 3 - Election Day 941 297 31.56 69 187 0Fairview 4 - Election Day 860 258 30.00 53 170 0Fairview 5 - Election Day 1334 428 32.08 73 299 0Fairview 6 - Election Day 165 85 51.52 16 59 0Fairview Mail-In Ballot - Mail-In Ba 0 64 0.00 30 33 0Fairview Provisional - Provisional 0 8 0.00 0 8 0
Election Day Totals 11093 3414 30.78 720 2326 0
Mail-In Ballot Totals 0 187 0.00 64 116 2
Provisional Totals 0 24 0.00 4 19 0
District Totals - Absentee
District Grand TotalsCounty 11093 3625 32.68 788 2461 2Edgewater 5771 1834 31.78 434 1254 2Fair View 5322 1791 33.65 354 1207 0
Grand Totals 11093 3625 32.68 788 2461 2
November 15, 2017 8:37 am Page 15 of 219

Regi
stra
tion
Ballo
ts C
ast
Turn
out (
%)
STAT
E SE
NATE
DIS
T 35
MAR
WAN
SHO
LAKH
NELI
DA P
OU
Pers
onal
Cho
ice
STATE SENATE DIST 35
BERGEN COUNTY Statement of VoteBER_20171107_E
Elmwood Park 1 - Election Day 1427 492 34.48 162 236 2Elmwood Park 2 - Election Day 1446 464 32.09 138 249 0Elmwood Park 3 - Election Day 943 380 40.30 123 185 0Elmwood Park 4 - Election Day 809 246 30.41 59 149 0Elmwood Park 5 - Election Day 860 333 38.72 104 184 0Elmwood Park 6 - Election Day 714 224 31.37 62 135 1Elmwood Park 7 - Election Day 1146 437 38.13 140 224 0Elmwood Park 8 - Election Day 1919 563 29.34 194 276 1Elmwood Park 9 - Election Day 1183 353 29.84 133 146 1Elmwood Park 10 - Election Day 1470 495 33.67 182 228 0Elmwood Park Mail-In Ballot - Mai 0 605 0.00 137 401 0Elmwood Park Provisional - Provis 0 61 0.00 14 30 0Garfield W1 D1 - Election Day 841 187 22.24 41 109 0Garfield W1 D2 - Election Day 495 103 20.81 14 69 0Garfield W1 D3 - Election Day 994 204 20.52 43 121 0Garfield W2 D1 - Election Day 1036 205 19.79 52 102 0Garfield W2 D2 - Election Day 1016 295 29.04 82 167 0Garfield W2 D3 - Election Day 747 195 26.10 56 105 0Garfield W3 D1 - Election Day 1114 253 22.71 41 170 1Garfield W3 D2 - Election Day 1099 291 26.48 51 191 0Garfield W3 D3 - Election Day 933 265 28.40 63 153 0Garfield W4 D1 - Election Day 1193 299 25.06 88 165 1Garfield W4 D2 - Election Day 856 231 26.99 64 112 0Garfield W4 D3 - Election Day 754 147 19.50 47 79 0Garfield W5 D1 - Election Day 1515 386 25.48 97 216 1Garfield W5 D2 - Election Day 869 250 28.77 70 144 0Garfield W5 D3 - Election Day 575 191 33.22 62 102 0Garfield Mail-In Ballot - Mail-In Ba 0 167 0.00 54 97 1Garfield Provisional - Provisional 0 23 0.00 3 18 0
Election Day Totals 25954 7489 28.85 2168 4017 8
Mail-In Ballot Totals 0 772 0.00 191 498 1
Provisional Totals 0 84 0.00 17 48 0
District Totals - Absentee
District Grand TotalsCounty 25954 8345 32.15 2376 4563 9Elmwood Park 11917 4653 39.05 1448 2443 5Garfield 14037 3692 26.30 928 2120 4
Grand Totals 25954 8345 32.15 2376 4563 9
November 15, 2017 8:37 am Page 16 of 219

Regi
stra
tion
Ballo
ts C
ast
Turn
out (
%)
STAT
E SE
NATE
DIS
T 36
JEAN
INE
FERR
ARA
PAUL
A. S
ARLO
Pers
onal
Cho
ice
STATE SENATE DIST 36
BERGEN COUNTY Statement of VoteBER_20171107_E
Carlstadt 1 - Election Day 633 270 42.65 119 126 0Carlstadt 2 - Election Day 822 326 39.66 122 172 0Carlstadt 3 - Election Day 714 283 39.64 88 175 0Carlstadt 4 - Election Day 780 316 40.51 103 184 0Carlstadt 5 - Election Day 753 287 38.11 105 152 0Carlstadt Mail-In Ballot - Mail-In Ba 0 78 0.00 37 38 0Carlstadt Provisional - Provisional 0 5 0.00 0 5 0Cliffside Park 1 - Election Day 770 228 29.61 40 166 0Cliffside Park 2 - Election Day 822 227 27.62 37 167 0Cliffside Park 3 - Election Day 815 227 27.85 37 168 0Cliffside Park 4 - Election Day 1213 471 38.83 127 311 0Cliffside Park 5 - Election Day 726 215 29.61 38 152 0Cliffside Park 6 - Election Day 759 271 35.70 61 190 0Cliffside Park 7 - Election Day 800 236 29.50 59 159 1Cliffside Park 8 - Election Day 817 325 39.78 71 215 0Cliffside Park 9 - Election Day 644 204 31.68 67 121 0Cliffside Park 10 - Election Day 1128 349 30.94 82 242 0Cliffside Park 11 - Election Day 593 161 27.15 47 96 0Cliffside Park 12 - Election Day 548 160 29.20 40 111 0Cliffside Park 13 - Election Day 886 307 34.65 71 207 0Cliffside Park 14 - Election Day 748 326 43.58 125 181 1Cliffside Park 15 - Election Day 777 313 40.28 96 189 1Cliffside Park Mail-In Ballot - Mail- 0 199 0.00 50 141 0Cliffside Park Provisional - Provisio 0 25 0.00 5 19 0East Rutherford 1 - Election Day 1198 385 32.14 97 263 0East Rutherford 2 - Election Day 1080 414 38.33 130 230 0East Rutherford 3 - Election Day 881 373 42.34 112 211 0East Rutherford 4 - Election Day 1901 786 41.35 310 388 0East Rutherford Mail-In Ballot - Ma 0 85 0.00 23 57 1East Rutherford Provisional - Prov 0 12 0.00 2 9 0Little Ferry 1 - Election Day 809 277 34.24 104 165 0Little Ferry 2 - Election Day 611 190 31.10 59 117 0Little Ferry 3 - Election Day 1114 304 27.29 97 180 0Little Ferry 4 - Election Day 838 261 31.15 88 159 0Little Ferry 5 - Election Day 1192 305 25.59 80 197 0Little Ferry 6 - Election Day 796 248 31.16 84 147 0Little Ferry Mail-In Ballot - Mail-In 0 101 0.00 31 67 0Little Ferry Provisional - Provisiona 0 10 0.00 4 5 0Lyndhurst 1 - Election Day 748 275 36.76 105 136 0Lyndhurst 2 - Election Day 748 243 32.49 91 108 0Lyndhurst 3 - Election Day 1199 340 28.36 122 167 0Lyndhurst 4 - Election Day 867 341 39.33 123 163 0Lyndhurst 5 - Election Day 745 271 36.38 91 133 0Lyndhurst 6 - Election Day 1017 328 32.25 107 166 2Lyndhurst 7 - Election Day 775 285 36.77 104 127 0Lyndhurst 8 - Election Day 860 320 37.21 107 157 0Lyndhurst 9 - Election Day 708 276 38.98 88 143 0Lyndhurst 10 - Election Day 953 359 37.67 124 176 0Lyndhurst 11 - Election Day 793 342 43.13 117 173 0Lyndhurst 12 - Election Day 702 280 39.89 111 115 0Lyndhurst 13 - Election Day 929 294 31.65 96 135 0Lyndhurst 14 - Election Day 747 253 33.87 82 127 1Lyndhurst 15 - Election Day 843 293 34.76 95 142 0Lyndhurst Mail-In Ballot - Mail-In B 0 329 0.00 133 156 0Lyndhurst Provisional - Provisiona 0 22 0.00 10 11 0Moonachie 1 - Election Day 296 70 23.65 17 38 0Moonachie 2 - Election Day 890 313 35.17 84 187 0Moonachie 3 - Election Day 414 120 28.99 37 76 0Moonachie Mail-In Ballot - Mail-In 0 24 0.00 7 17 0
November 15, 2017 8:37 am Page 17 of 219

Regi
stra
tion
Ballo
ts C
ast
Turn
out (
%)
STAT
E SE
NATE
DIS
T 36
JEAN
INE
FERR
ARA
PAUL
A. S
ARLO
Pers
onal
Cho
ice
STATE SENATE DIST 36
BERGEN COUNTY Statement of VoteBER_20171107_E
Moonachie Provisional - Provision 0 1 0.00 0 1 0North Arlington 1 - Election Day 547 226 41.32 88 115 0North Arlington 2 - Election Day 789 294 37.26 105 154 0North Arlington 3 - Election Day 934 360 38.54 148 169 2North Arlington 4 - Election Day 969 423 43.65 165 212 0North Arlington 5 - Election Day 1224 481 39.30 210 208 1North Arlington 6 - Election Day 968 346 35.74 138 155 2North Arlington 7 - Election Day 1448 635 43.85 275 311 0North Arlington 8 - Election Day 692 289 41.76 110 147 0North Arlington 9 - Election Day 970 408 42.06 190 187 1North Arlington 10 - Election Day 643 273 42.46 97 145 0North Arlington Mail-In Ballot - Ma 0 302 0.00 147 143 0North Arlington Provisional - Provi 0 16 0.00 2 10 0Ridgefield 1 - Election Day 1202 396 32.95 143 216 0Ridgefield 2 - Election Day 921 358 38.87 109 211 0Ridgefield 3 - Election Day 1481 429 28.97 122 263 0Ridgefield 4 - Election Day 963 303 31.46 106 177 0Ridgefield 5 - Election Day 1300 382 29.38 137 207 1Ridgefield Mail-In Ballot - Mail-In B 0 135 0.00 64 66 0Ridgefield Provisional - Provisiona 0 14 0.00 6 8 0Ridgefield Park 1 - Election Day 588 227 38.61 62 133 0Ridgefield Park 2 - Election Day 1076 382 35.50 117 218 0Ridgefield Park 3 - Election Day 797 255 31.99 80 135 0Ridgefield Park 4 - Election Day 1073 393 36.63 121 225 0Ridgefield Park 5 - Election Day 602 230 38.21 79 127 1Ridgefield Park 6 - Election Day 964 382 39.63 109 220 0Ridgefield Park 7 - Election Day 935 359 38.40 102 205 0Ridgefield Park 8 - Election Day 1125 451 40.09 129 255 1Ridgefield Park Mail-In Ballot - Ma 0 98 0.00 29 57 0Ridgefield Park Provisional - Provi 0 26 0.00 8 16 0Rutherford 1 - Election Day 990 496 50.10 172 290 0Rutherford 2 - Election Day 1099 509 46.31 179 287 1Rutherford 3 - Election Day 989 434 43.88 120 283 0Rutherford 4 - Election Day 730 346 47.40 146 174 0Rutherford 5 - Election Day 776 344 44.33 117 187 0Rutherford 6 - Election Day 743 282 37.95 85 172 0Rutherford 7 - Election Day 938 404 43.07 147 236 0Rutherford 8 - Election Day 1007 420 41.71 141 247 1Rutherford 9 - Election Day 1051 491 46.72 187 260 0Rutherford 10 - Election Day 969 437 45.10 147 256 0Rutherford 11 - Election Day 1041 405 38.90 142 247 0Rutherford 12 - Election Day 763 311 40.76 115 177 0Rutherford Mail-In Ballot - Mail-In 0 257 0.00 76 170 0Rutherford Provisional - Provisiona 0 43 0.00 8 33 0South Hackensack 1 - Election Da 1417 525 37.05 156 301 0South Hackensack Mail-In Ballot - 0 32 0.00 9 18 0South Hackensack Provisional - P 0 1 0.00 0 1 0Teterboro 1 - Election Day 34 17 50.00 7 6 0Teterboro Mail-In Ballot - Mail-In B 0 0 0.00 0 0 0Teterboro Provisional - Provisiona 0 0 0.00 0 0 0Wallington 1 - Election Day 623 211 33.87 78 97 0Wallington 2 - Election Day 738 232 31.44 95 111 0Wallington 3 - Election Day 1129 373 33.04 133 197 0Wallington 4 - Election Day 1305 655 50.19 283 290 0Wallington 5 - Election Day 1101 381 34.60 178 139 0Wallington 6 - Election Day 710 251 35.35 98 132 0Wallington Mail-In Ballot - Mail-In B 0 137 0.00 61 63 0Wallington Provisional - Provisiona 0 9 0.00 4 4 0Wood Ridge 1 - Election Day 1442 602 41.75 142 420 0
November 15, 2017 8:37 am Page 18 of 219
Regi
stra
tion
Ballo
ts C
ast
Turn
out (
%)
STAT
E SE
NATE
DIS
T 36
JEAN
INE
FERR
ARA
PAUL
A. S
ARLO
Pers
onal
Cho
ice
STATE SENATE DIST 36
BERGEN COUNTY Statement of VoteBER_20171107_E
Wood Ridge 2 - Election Day 772 408 52.85 124 266 0Wood Ridge 3 - Election Day 1200 569 47.42 171 367 1Wood Ridge 4 - Election Day 1182 499 42.22 156 317 0Wood Ridge 5 - Election Day 1243 601 48.35 180 391 1Wood Ridge Mail-In Ballot - Mail-In 0 136 0.00 20 109 0Wood Ridge Provisional - Provisio 0 8 0.00 3 5 0
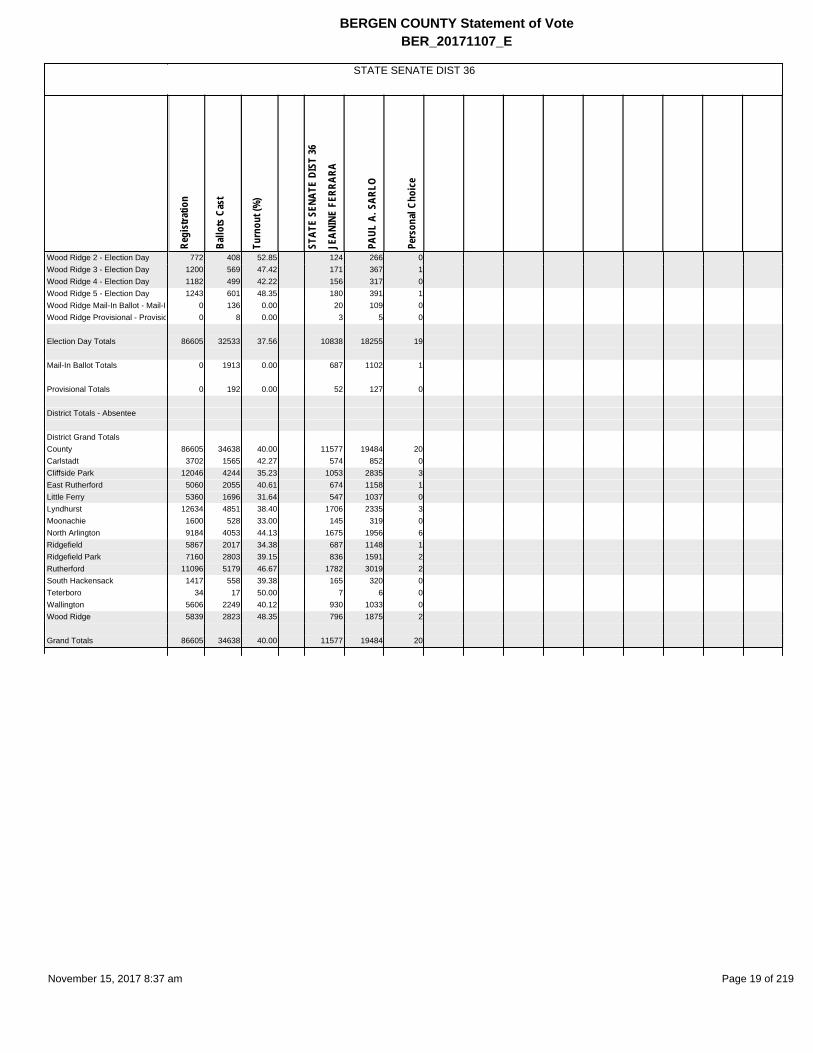
Election Day Totals 86605 32533 37.56 10838 18255 19
Mail-In Ballot Totals 0 1913 0.00 687 1102 1
Provisional Totals 0 192 0.00 52 127 0
District Totals - Absentee
District Grand TotalsCounty 86605 34638 40.00 11577 19484 20Carlstadt 3702 1565 42.27 574 852 0Cliffside Park 12046 4244 35.23 1053 2835 3East Rutherford 5060 2055 40.61 674 1158 1Little Ferry 5360 1696 31.64 547 1037 0Lyndhurst 12634 4851 38.40 1706 2335 3Moonachie 1600 528 33.00 145 319 0North Arlington 9184 4053 44.13 1675 1956 6Ridgefield 5867 2017 34.38 687 1148 1Ridgefield Park 7160 2803 39.15 836 1591 2Rutherford 11096 5179 46.67 1782 3019 2South Hackensack 1417 558 39.38 165 320 0Teterboro 34 17 50.00 7 6 0Wallington 5606 2249 40.12 930 1033 0Wood Ridge 5839 2823 48.35 796 1875 2
Grand Totals 86605 34638 40.00 11577 19484 20
November 15, 2017 8:37 am Page 19 of 219
Regi
stra
tion
Ballo
ts C
ast
Turn
out (
%)
STAT
E SE
NATE
DIS
T 37
MOD
ESTO
ROM
ERO
LORE
TTA
WEI
NBER
G
Pers
onal
Cho
ice
STATE SENATE DIST 37
BERGEN COUNTY Statement of VoteBER_20171107_E
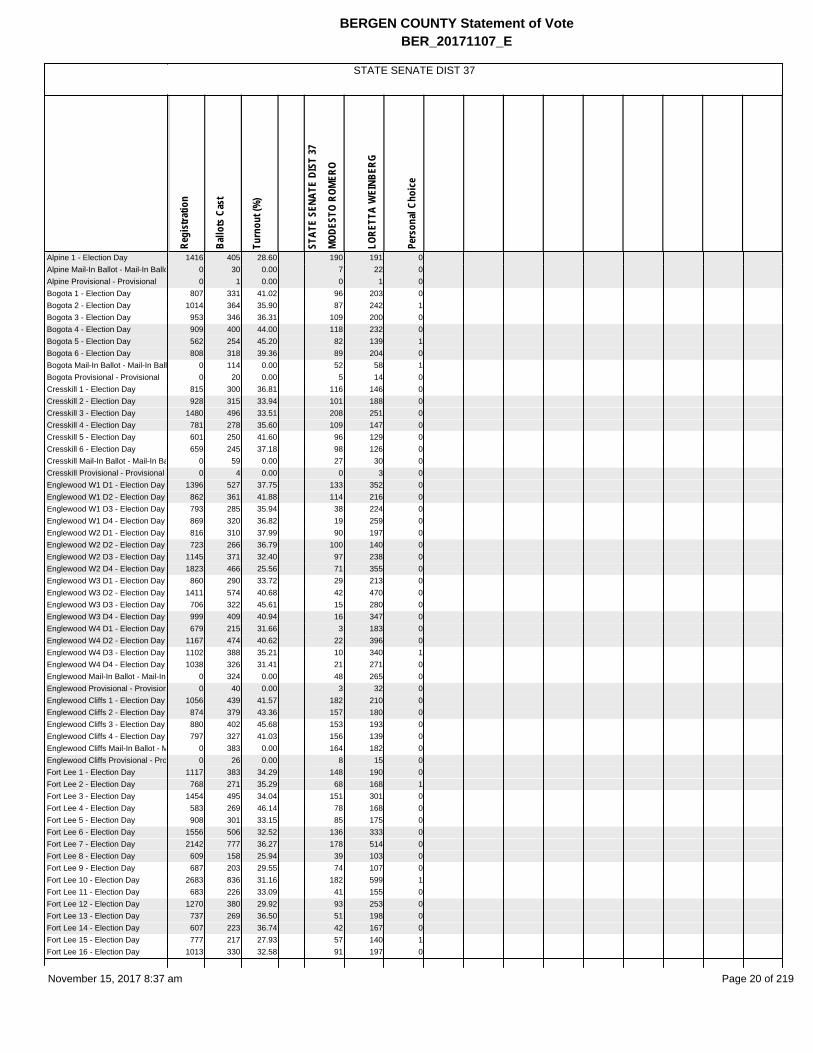
Alpine 1 - Election Day 1416 405 28.60 190 191 0Alpine Mail-In Ballot - Mail-In Ballo 0 30 0.00 7 22 0Alpine Provisional - Provisional 0 1 0.00 0 1 0Bogota 1 - Election Day 807 331 41.02 96 203 0Bogota 2 - Election Day 1014 364 35.90 87 242 1Bogota 3 - Election Day 953 346 36.31 109 200 0Bogota 4 - Election Day 909 400 44.00 118 232 0Bogota 5 - Election Day 562 254 45.20 82 139 1Bogota 6 - Election Day 808 318 39.36 89 204 0Bogota Mail-In Ballot - Mail-In Ball 0 114 0.00 52 58 1Bogota Provisional - Provisional 0 20 0.00 5 14 0Cresskill 1 - Election Day 815 300 36.81 116 146 0Cresskill 2 - Election Day 928 315 33.94 101 188 0Cresskill 3 - Election Day 1480 496 33.51 208 251 0Cresskill 4 - Election Day 781 278 35.60 109 147 0Cresskill 5 - Election Day 601 250 41.60 96 129 0Cresskill 6 - Election Day 659 245 37.18 98 126 0Cresskill Mail-In Ballot - Mail-In Ba 0 59 0.00 27 30 0Cresskill Provisional - Provisional 0 4 0.00 0 3 0Englewood W1 D1 - Election Day 1396 527 37.75 133 352 0Englewood W1 D2 - Election Day 862 361 41.88 114 216 0Englewood W1 D3 - Election Day 793 285 35.94 38 224 0Englewood W1 D4 - Election Day 869 320 36.82 19 259 0Englewood W2 D1 - Election Day 816 310 37.99 90 197 0Englewood W2 D2 - Election Day 723 266 36.79 100 140 0Englewood W2 D3 - Election Day 1145 371 32.40 97 238 0Englewood W2 D4 - Election Day 1823 466 25.56 71 355 0Englewood W3 D1 - Election Day 860 290 33.72 29 213 0Englewood W3 D2 - Election Day 1411 574 40.68 42 470 0Englewood W3 D3 - Election Day 706 322 45.61 15 280 0Englewood W3 D4 - Election Day 999 409 40.94 16 347 0Englewood W4 D1 - Election Day 679 215 31.66 3 183 0Englewood W4 D2 - Election Day 1167 474 40.62 22 396 0Englewood W4 D3 - Election Day 1102 388 35.21 10 340 1Englewood W4 D4 - Election Day 1038 326 31.41 21 271 0Englewood Mail-In Ballot - Mail-In 0 324 0.00 48 265 0Englewood Provisional - Provision 0 40 0.00 3 32 0Englewood Cliffs 1 - Election Day 1056 439 41.57 182 210 0Englewood Cliffs 2 - Election Day 874 379 43.36 157 180 0Englewood Cliffs 3 - Election Day 880 402 45.68 153 193 0Englewood Cliffs 4 - Election Day 797 327 41.03 156 139 0Englewood Cliffs Mail-In Ballot - M 0 383 0.00 164 182 0Englewood Cliffs Provisional - Pro 0 26 0.00 8 15 0Fort Lee 1 - Election Day 1117 383 34.29 148 190 0Fort Lee 2 - Election Day 768 271 35.29 68 168 1Fort Lee 3 - Election Day 1454 495 34.04 151 301 0Fort Lee 4 - Election Day 583 269 46.14 78 168 0Fort Lee 5 - Election Day 908 301 33.15 85 175 0Fort Lee 6 - Election Day 1556 506 32.52 136 333 0Fort Lee 7 - Election Day 2142 777 36.27 178 514 0Fort Lee 8 - Election Day 609 158 25.94 39 103 0Fort Lee 9 - Election Day 687 203 29.55 74 107 0Fort Lee 10 - Election Day 2683 836 31.16 182 599 1Fort Lee 11 - Election Day 683 226 33.09 41 155 0Fort Lee 12 - Election Day 1270 380 29.92 93 253 0Fort Lee 13 - Election Day 737 269 36.50 51 198 0Fort Lee 14 - Election Day 607 223 36.74 42 167 0Fort Lee 15 - Election Day 777 217 27.93 57 140 1Fort Lee 16 - Election Day 1013 330 32.58 91 197 0
November 15, 2017 8:37 am Page 20 of 219

Regi
stra
tion
Ballo
ts C
ast
Turn
out (
%)
STAT
E SE
NATE
DIS
T 37
MOD
ESTO
ROM
ERO
LORE
TTA
WEI
NBER
G
Pers
onal
Cho
ice
STATE SENATE DIST 37
BERGEN COUNTY Statement of VoteBER_20171107_E
Fort Lee 17 - Election Day 503 203 40.36 66 120 0Fort Lee 18 - Election Day 471 169 35.88 61 92 0Fort Lee 19 - Election Day 1374 483 35.15 87 367 0Fort Lee Mail-In Ballot - Mail-In Ba 0 463 0.00 93 352 2Fort Lee Provisional - Provisional 0 62 0.00 12 42 0Hackensack W1 D1 - Election Day 787 223 28.34 56 145 0Hackensack W1 D2 - Election Day 778 249 32.01 71 155 0Hackensack W1 D3 - Election Day 853 249 29.19 78 151 0Hackensack W1 D4 - Election Day 749 171 22.83 39 119 0Hackensack W2 D1 - Election Day 520 140 26.92 19 114 0Hackensack W2 D2 - Election Day 1120 352 31.43 68 254 0Hackensack W2 D3 - Election Day 1067 320 29.99 48 252 0Hackensack W2 D4 - Election Day 729 248 34.02 54 178 0Hackensack W2 D5 - Election Day 707 259 36.63 39 202 0Hackensack W3 D1 - Election Day 515 174 33.79 60 106 0Hackensack W3 D2 - Election Day 677 240 35.45 62 161 0Hackensack W3 D3 - Election Day 576 199 34.55 2 180 0Hackensack W3 D4 - Election Day 987 340 34.45 38 280 0Hackensack W3 D5 - Election Day 850 293 34.47 35 225 0Hackensack W4 D1 - Election Day 874 340 38.90 53 266 0Hackensack W4 D2 - Election Day 1607 474 29.50 71 373 0Hackensack W4 D3 - Election Day 1288 459 35.64 82 350 0Hackensack W4 D4 - Election Day 1060 390 36.79 84 279 0Hackensack W4 D5 - Election Day 633 260 41.07 54 194 0Hackensack W5 D1 - Election Day 903 293 32.45 67 207 0Hackensack W5 D2 - Election Day 690 261 37.83 48 188 0Hackensack W5 D3 - Election Day 834 331 39.69 97 221 0Hackensack W5 D4 - Election Day 794 319 40.18 72 226 0Hackensack W5 D5 - Election Day 702 290 41.31 71 201 0Hackensack W5 D6 - Election Day 948 327 34.49 48 251 1Hackensack Mail-In Ballot - Mail-In 0 511 0.00 120 373 0Hackensack Provisional - Provisio 0 84 0.00 15 64 0Leonia 1 - Election Day 876 385 43.95 84 275 0Leonia 2 - Election Day 812 346 42.61 78 255 0Leonia 3 - Election Day 767 301 39.24 54 225 0Leonia 4 - Election Day 787 257 32.66 58 182 0Leonia 5 - Election Day 1171 459 39.20 114 311 0Leonia 6 - Election Day 725 277 38.21 74 191 0Leonia Mail-In Ballot - Mail-In Ballo 0 93 0.00 33 59 0Leonia Provisional - Provisional 0 9 0.00 1 8 0Northvale 1 - Election Day 976 422 43.24 166 214 0Northvale 2 - Election Day 836 317 37.92 140 149 0Northvale 3 - Election Day 1156 464 40.14 176 226 0Northvale Mail-In Ballot - Mail-In B 0 50 0.00 27 21 1Northvale Provisional - Provisiona 0 2 0.00 0 2 0Palisades Park 1 - Election Day 569 132 23.20 31 83 0Palisades Park 2 - Election Day 701 241 34.38 71 129 0Palisades Park 3 - Election Day 696 170 24.43 49 106 0Palisades Park 4 - Election Day 744 186 25.00 58 105 0Palisades Park 5 - Election Day 853 199 23.33 77 100 0Palisades Park 6 - Election Day 1144 291 25.44 92 143 0Palisades Park 7 - Election Day 748 193 25.80 67 90 0Palisades Park 8 - Election Day 944 206 21.82 57 123 0Palisades Park 9 - Election Day 1088 208 19.12 54 120 0Palisades Park Mail-In Ballot - Ma 0 301 0.00 75 199 0Palisades Park Provisional - Provi 0 37 0.00 11 20 0Rockleigh 1 - Election Day 227 81 35.68 54 21 0Rockleigh Mail-In Ballot - Mail-In B 0 15 0.00 3 12 0Rockleigh Provisional - Provisiona 0 1 0.00 0 1 0
November 15, 2017 8:37 am Page 21 of 219

Regi
stra
tion
Ballo
ts C
ast
Turn
out (
%)
STAT
E SE
NATE
DIS
T 37
MOD
ESTO
ROM
ERO
LORE
TTA
WEI
NBER
G
Pers
onal
Cho
ice
STATE SENATE DIST 37
BERGEN COUNTY Statement of VoteBER_20171107_E
Teaneck 1 - Election Day 995 372 37.39 61 286 0Teaneck 2 - Election Day 1310 466 35.57 70 373 0Teaneck 3 - Election Day 1247 545 43.70 93 418 0Teaneck 4 - Election Day 1154 478 41.42 73 378 0Teaneck 5 - Election Day 860 317 36.86 32 253 1Teaneck 6 - Election Day 1021 463 45.35 50 375 0Teaneck 7 - Election Day 1069 430 40.22 56 353 0Teaneck 8 - Election Day 1286 622 48.37 90 498 0Teaneck 9 - Election Day 1261 491 38.94 92 374 0Teaneck 10 - Election Day 1438 477 33.17 150 304 0Teaneck 11 - Election Day 1297 388 29.92 121 245 0Teaneck 12 - Election Day 1440 486 33.75 129 337 0Teaneck 13 - Election Day 1098 527 48.00 15 463 1Teaneck 14 - Election Day 1464 636 43.44 11 585 0Teaneck 15 - Election Day 1080 330 30.56 48 244 0Teaneck 16 - Election Day 750 313 41.73 3 283 1Teaneck 17 - Election Day 1259 524 41.62 28 463 0Teaneck 18 - Election Day 1333 547 41.04 96 414 1Teaneck 19 - Election Day 1147 462 40.28 63 368 0Teaneck 20 - Election Day 830 314 37.83 58 241 0Teaneck 21 - Election Day 1355 459 33.87 51 374 0Teaneck 22 - Election Day 994 354 35.61 47 277 0Teaneck 23 - Election Day 981 341 34.76 17 296 0Teaneck Mail-In Ballot - Mail-In Ba 0 513 0.00 85 409 0Teaneck Provisional - Provisional 0 37 0.00 5 31 0Tenafly 1 - Election Day 778 281 36.12 82 183 0Tenafly 2 - Election Day 631 211 33.44 66 136 0Tenafly 3 - Election Day 592 217 36.66 65 139 0Tenafly 4 - Election Day 824 318 38.59 64 230 0Tenafly 5 - Election Day 728 254 34.89 53 188 0Tenafly 6 - Election Day 636 229 36.01 50 171 0Tenafly 7 - Election Day 708 195 27.54 64 122 0Tenafly 8 - Election Day 835 277 33.17 68 197 0Tenafly 9 - Election Day 847 333 39.32 82 237 0Tenafly 10 - Election Day 687 267 38.86 76 179 0Tenafly 11 - Election Day 824 278 33.74 77 190 0Tenafly 12 - Election Day 960 287 29.90 79 195 0Tenafly Mail-In Ballot - Mail-In Bal 0 196 0.00 43 150 0Tenafly Provisional - Provisional 0 15 0.00 6 9 0
Election Day Totals 124458 44277 35.58 9945 30643 11
Mail-In Ballot Totals 0 3052 0.00 777 2132 4
Provisional Totals 0 338 0.00 66 242 0
District Totals - Absentee
District Grand TotalsCounty 124458 47667 38.30 10788 33017 15Alpine 1416 436 30.79 197 214 0Bogota 5053 2147 42.49 638 1292 3Cresskill 5264 1947 36.99 755 1020 0Englewood 16389 6268 38.25 871 4778 1Englewood Cliffs 3607 1956 54.23 820 919 0Fort Lee 19942 7224 36.23 1833 4741 5Hackensack 21248 7796 36.69 1551 5715 1Leonia 5138 2127 41.40 496 1506 0Northvale 2968 1255 42.28 509 612 1
November 15, 2017 8:37 am Page 22 of 219

Regi
stra
tion
Ballo
ts C
ast
Turn
out (
%)
STAT
E SE
NATE
DIS
T 37
MOD
ESTO
ROM
ERO
LORE
TTA
WEI
NBER
G
Pers
onal
Cho
ice
STATE SENATE DIST 37
BERGEN COUNTY Statement of VoteBER_20171107_E
Palisades Park 7487 2164 28.90 642 1218 0Rockleigh 227 97 42.73 57 34 0Teaneck 26669 10892 40.84 1544 8642 4Tenafly 9050 3358 37.10 875 2326 0
Grand Totals 124458 47667 38.30 10788 33017 15
November 15, 2017 8:37 am Page 23 of 219

Regi
stra
tion
Ballo
ts C
ast
Turn
out (
%)
STAT
E SE
NATE
DIS
T 38
KELL
Y LA
NGSC
HULT
Z
BOB
GORD
ON
Pers
onal
Cho
ice
STATE SENATE DIST 38
BERGEN COUNTY Statement of VoteBER_20171107_E
Bergenfield 1 - Election Day 787 282 35.83 108 154 0Bergenfield 2 - Election Day 868 377 43.43 123 229 1Bergenfield 3 - Election Day 791 309 39.06 95 183 0Bergenfield 4 - Election Day 891 319 35.80 100 184 0Bergenfield 5 - Election Day 873 312 35.74 80 214 0Bergenfield 6 - Election Day 873 325 37.23 91 202 1Bergenfield 7 - Election Day 793 269 33.92 72 186 0Bergenfield 8 - Election Day 850 290 34.12 94 177 0Bergenfield 9 - Election Day 842 274 32.54 48 193 0Bergenfield 10 - Election Day 1127 399 35.40 140 244 0Bergenfield 11 - Election Day 950 386 40.63 158 217 0Bergenfield 12 - Election Day 1081 375 34.69 100 246 0Bergenfield 13 - Election Day 1178 414 35.14 99 280 0Bergenfield 14 - Election Day 798 297 37.22 91 185 0Bergenfield 15 - Election Day 1131 387 34.22 123 225 0Bergenfield 16 - Election Day 932 320 34.33 119 177 0Bergenfield 17 - Election Day 866 285 32.91 78 180 0Bergenfield Mail-In Ballot - Mail-In 0 233 0.00 60 163 0Bergenfield Provisional - Provision 0 38 0.00 5 26 0Fair Lawn 1 - Election Day 961 392 40.79 149 204 0Fair Lawn 2 - Election Day 1378 583 42.31 215 326 0Fair Lawn 3 - Election Day 856 367 42.87 151 178 0Fair Lawn 4 - Election Day 1055 450 42.65 156 269 0Fair Lawn 5 - Election Day 672 304 45.24 119 169 1Fair Lawn 6 - Election Day 930 386 41.51 141 213 0Fair Lawn 7 - Election Day 732 334 45.63 116 193 0Fair Lawn 8 - Election Day 898 375 41.76 104 235 0Fair Lawn 9 - Election Day 972 400 41.15 151 216 0Fair Lawn 10 - Election Day 1006 426 42.35 155 236 0Fair Lawn 11 - Election Day 929 411 44.24 133 248 0Fair Lawn 12 - Election Day 763 339 44.43 102 221 0Fair Lawn 13 - Election Day 1052 493 46.86 150 313 1Fair Lawn 14 - Election Day 773 364 47.09 107 231 0Fair Lawn 15 - Election Day 1311 449 34.25 142 280 0Fair Lawn 16 - Election Day 1052 452 42.97 160 262 0Fair Lawn 17 - Election Day 944 377 39.94 149 202 0Fair Lawn 18 - Election Day 797 369 46.30 140 205 0Fair Lawn 19 - Election Day 819 361 44.08 143 191 1Fair Lawn 20 - Election Day 889 349 39.26 115 204 0Fair Lawn 21 - Election Day 1181 457 38.70 171 250 0Fair Lawn 22 - Election Day 838 288 34.37 112 149 0Fair Lawn 23 - Election Day 1011 446 44.11 152 257 0Fair Lawn Mail-In Ballot - Mail-In B 0 496 0.00 147 330 0Fair Lawn Provisional - Provisiona 0 61 0.00 22 37 0Glen Rock 1 - Election Day 1038 497 47.88 188 279 0Glen Rock 2 - Election Day 1143 566 49.52 197 331 0Glen Rock 3 - Election Day 1168 560 47.95 257 260 0Glen Rock 4 - Election Day 967 471 48.71 189 245 0Glen Rock 5 - Election Day 1221 572 46.85 211 330 0Glen Rock 6 - Election Day 942 432 45.86 152 257 0Glen Rock 7 - Election Day 1113 531 47.71 192 313 0Glen Rock 8 - Election Day 832 404 48.56 158 225 0Glen Rock Mail-In Ballot - Mail-In B 0 329 0.00 111 212 0Glen Rock Provisional - Provisiona 0 25 0.00 10 12 0Hasbrouck Heights 1 - Election Da 865 396 45.78 178 167 0Hasbrouck Heights 2 - Election Da 1027 409 39.82 172 187 0Hasbrouck Heights 3 - Election Da 832 348 41.83 157 136 0Hasbrouck Heights 4 - Election Da 963 419 43.51 199 175 0Hasbrouck Heights 5 - Election Da 823 323 39.25 139 142 0
November 15, 2017 8:37 am Page 24 of 219

Regi
stra
tion
Ballo
ts C
ast
Turn
out (
%)
STAT
E SE
NATE
DIS
T 38
KELL
Y LA
NGSC
HULT
Z
BOB
GORD
ON
Pers
onal
Cho
ice
STATE SENATE DIST 38
BERGEN COUNTY Statement of VoteBER_20171107_E
Hasbrouck Heights 6 - Election Da 855 379 44.33 175 170 0Hasbrouck Heights 7 - Election Da 863 357 41.37 162 155 1Hasbrouck Heights 8 - Election Da 985 410 41.62 172 201 1Hasbrouck Heights 9 - Election Da 682 262 38.42 100 135 1Hasbrouck Heights Mail-In Ballot - 0 188 0.00 96 80 0Hasbrouck Heights Provisional - P 0 19 0.00 5 9 0Lodi 1 - Election Day 1349 419 31.06 124 220 0Lodi 2 - Election Day 1382 419 30.32 112 242 0Lodi 3 - Election Day 919 248 26.99 62 140 0Lodi 4 - Election Day 923 234 25.35 37 161 0Lodi 5 - Election Day 999 324 32.43 103 175 0Lodi 6 - Election Day 842 275 32.66 90 138 0Lodi 7 - Election Day 637 214 33.59 72 107 0Lodi 8 - Election Day 1214 380 31.30 108 203 0Lodi 9 - Election Day 987 297 30.09 77 168 0Lodi 10 - Election Day 1134 314 27.69 89 176 0Lodi 11 - Election Day 1166 390 33.45 88 234 0Lodi 12 - Election Day 1102 379 34.39 107 184 1Lodi Mail-In Ballot - Mail-In Ballot 0 225 0.00 78 122 0Lodi Provisional - Provisional 0 30 0.00 7 18 0Maywood 1 - Election Day 926 377 40.71 116 240 0Maywood 2 - Election Day 898 373 41.54 143 215 0Maywood 3 - Election Day 915 379 41.42 140 219 0Maywood 4 - Election Day 905 408 45.08 162 220 0Maywood 5 - Election Day 867 371 42.79 144 198 0Maywood 6 - Election Day 878 378 43.05 144 215 0Maywood 7 - Election Day 689 192 27.87 66 119 0Maywood Mail-In Ballot - Mail-In B 0 160 0.00 63 95 0Maywood Provisional - Provisiona 0 11 0.00 4 7 0New Milford 1 - Election Day 1273 541 42.50 265 243 0New Milford 2 - Election Day 1185 524 44.22 292 211 0New Milford 3 - Election Day 1267 573 45.22 299 241 0New Milford 4 - Election Day 1356 567 41.81 314 229 1New Milford 5 - Election Day 1081 421 38.95 206 190 0New Milford 6 - Election Day 918 323 35.19 124 183 0New Milford 7 - Election Day 778 251 32.26 86 148 0New Milford 8 - Election Day 1404 580 41.31 294 250 1New Milford 9 - Election Day 861 383 44.48 209 165 0New Milford Mail-In Ballot - Mail-In 0 210 0.00 93 111 0New Milford Provisional - Provision 0 32 0.00 14 18 0Oradell 1 - Election Day 977 474 48.52 229 215 0Oradell 2 - Election Day 886 387 43.68 175 180 0Oradell 3 - Election Day 922 450 48.81 214 206 0Oradell 4 - Election Day 934 461 49.36 195 228 0Oradell 5 - Election Day 1122 530 47.24 254 241 0Oradell 6 - Election Day 1122 530 47.24 277 214 0Oradell Mail-In Ballot - Mail-In Ball 0 184 0.00 72 105 0Oradell Provisional - Provisional 0 14 0.00 7 7 0Paramus 1 - Election Day 1250 397 31.76 179 182 0Paramus 2 - Election Day 946 360 38.05 157 186 0Paramus 3 - Election Day 1066 455 42.68 203 218 0Paramus 4 - Election Day 823 304 36.94 141 143 0Paramus 5 - Election Day 746 323 43.30 152 152 1Paramus 6 - Election Day 887 334 37.66 140 173 0Paramus 7 - Election Day 975 441 45.23 199 213 0Paramus 8 - Election Day 911 317 34.80 164 122 0Paramus 9 - Election Day 864 325 37.62 153 154 0Paramus 10 - Election Day 790 294 37.22 124 153 0Paramus 11 - Election Day 740 277 37.43 117 139 0
November 15, 2017 8:37 am Page 25 of 219

Regi
stra
tion
Ballo
ts C
ast
Turn
out (
%)
STAT
E SE
NATE
DIS
T 38
KELL
Y LA
NGSC
HULT
Z
BOB
GORD
ON
Pers
onal
Cho
ice
STATE SENATE DIST 38
BERGEN COUNTY Statement of VoteBER_20171107_E
Paramus 12 - Election Day 1277 521 40.80 265 220 0Paramus 13 - Election Day 625 262 41.92 101 145 0Paramus 14 - Election Day 933 351 37.62 163 171 0Paramus 15 - Election Day 1422 471 33.12 208 239 0Paramus 16 - Election Day 698 308 44.13 147 129 0Paramus 17 - Election Day 841 324 38.53 134 172 0Paramus 18 - Election Day 600 256 42.67 87 153 0Paramus 19 - Election Day 717 332 46.30 135 173 0Paramus 20 - Election Day 832 318 38.22 145 145 0Paramus Mail-In Ballot - Mail-In Ba 0 542 0.00 234 287 0Paramus Provisional - Provisional 0 37 0.00 19 18 0River Edge 1 - Election Day 1133 485 42.81 176 272 0River Edge 2 - Election Day 964 410 42.53 166 217 0River Edge 3 - Election Day 863 371 42.99 150 195 0River Edge 4 - Election Day 935 444 47.49 167 253 0River Edge 5 - Election Day 758 301 39.71 115 166 0River Edge 6 - Election Day 878 347 39.52 142 182 0River Edge 7 - Election Day 914 366 40.04 134 205 0River Edge 8 - Election Day 752 241 32.05 82 145 0River Edge Mail-In Ballot - Mail-In 0 198 0.00 84 105 0River Edge Provisional - Provision 0 7 0.00 4 3 0Rochelle Park 1 - Election Day 1001 472 47.15 179 217 0Rochelle Park 2 - Election Day 894 421 47.09 171 178 0Rochelle Park 3 - Election Day 852 413 48.47 120 194 0Rochelle Park 4 - Election Day 956 432 45.19 194 179 0Rochelle Park Mail-In Ballot - Mail 0 105 0.00 43 58 0Rochelle Park Provisional - Provis 0 16 0.00 5 7 0Saddle Brook 1 - Election Day 778 267 34.32 95 144 0Saddle Brook 2 - Election Day 769 325 42.26 102 175 1Saddle Brook 3 - Election Day 582 236 40.55 68 141 0Saddle Brook 4 - Election Day 892 378 42.38 153 170 0Saddle Brook 5 - Election Day 995 344 34.57 139 161 0Saddle Brook 6 - Election Day 973 424 43.58 199 170 0Saddle Brook 7 - Election Day 598 255 42.64 130 93 0Saddle Brook 8 - Election Day 790 329 41.65 134 155 0Saddle Brook 9 - Election Day 916 369 40.28 154 178 1Saddle Brook 10 - Election Day 857 371 43.29 173 171 0Saddle Brook 11 - Election Day 864 386 44.68 159 193 0Saddle Brook Mail-In Ballot - Mail- 0 144 0.00 53 82 0Saddle Brook Provisional - Provisi 0 18 0.00 5 11 0
Election Day Totals 126444 50851 40.22 19783 26690 14
Mail-In Ballot Totals 0 3014 0.00 1134 1750 0
Provisional Totals 0 308 0.00 107 173 0
District Totals - Absentee
District Grand TotalsCounty 126444 54173 42.84 21024 28613 14Bergenfield 15631 5891 37.69 1784 3665 2Fair Lawn 21819 9729 44.59 3402 5619 3Glen Rock 8424 4387 52.08 1665 2464 0Hasbrouck Heights 7895 3510 44.46 1555 1557 3Lodi 12654 4148 32.78 1154 2288 1Maywood 6078 2649 43.58 982 1528 0New Milford 10123 4405 43.51 2196 1989 2Oradell 5963 3030 50.81 1423 1396 0
November 15, 2017 8:37 am Page 26 of 219

Regi
stra
tion
Ballo
ts C
ast
Turn
out (
%)
STAT
E SE
NATE
DIS
T 38
KELL
Y LA
NGSC
HULT
Z
BOB
GORD
ON
Pers
onal
Cho
ice
STATE SENATE DIST 38
BERGEN COUNTY Statement of VoteBER_20171107_E
Paramus 17943 7549 42.07 3367 3687 1River Edge 7197 3170 44.05 1220 1743 0Rochelle Park 3703 1859 50.20 712 833 0Saddle Brook 9014 3846 42.67 1564 1844 2
Grand Totals 126444 54173 42.84 21024 28613 14
November 15, 2017 8:37 am Page 27 of 219

Regi
stra
tion
Ballo
ts C
ast
Turn
out (
%)
STAT
E SE
NATE
DIS
T 39
GERA
LD C
ARDI
NALE
LIND
A H.
SCH
WAG
ER
JAM
ES T
OSON
E
Pers
onal
Cho
ice
STATE SENATE DIST 39
BERGEN COUNTY Statement of VoteBER_20171107_E
Closter 1 - Election Day 647 279 43.12 109 159 0 0Closter 2 - Election Day 905 344 38.01 134 195 2 0Closter 3 - Election Day 857 315 36.76 135 155 3 0Closter 4 - Election Day 911 337 36.99 144 165 3 0Closter 5 - Election Day 824 318 38.59 146 158 3 0Closter 6 - Election Day 1084 380 35.06 146 213 1 0Closter Mail-In Ballot - Mail-In Ball 0 100 0.00 38 60 1 0Closter Provisional - Provisional 0 6 0.00 4 2 0 0Demarest 1 - Election Day 1087 481 44.25 213 252 1 0Demarest 2 - Election Day 1102 402 36.48 169 216 2 0Demarest 3 - Election Day 1113 456 40.97 157 281 3 0Demarest Mail-In Ballot - Mail-In B 0 89 0.00 35 52 1 0Demarest Provisional - Provisiona 0 9 0.00 2 6 0 0Dumont 1 - Election Day 901 324 35.96 145 157 3 0Dumont 2 - Election Day 1159 430 37.10 187 213 6 0Dumont 3 - Election Day 937 394 42.05 177 194 1 0Dumont 4 - Election Day 1213 486 40.07 186 267 7 0Dumont 5 - Election Day 1023 407 39.78 154 223 7 0Dumont 6 - Election Day 1123 411 36.60 208 172 3 1Dumont 7 - Election Day 945 373 39.47 145 195 4 0Dumont 8 - Election Day 1150 477 41.48 212 233 2 0Dumont 9 - Election Day 1075 402 37.40 183 190 2 0Dumont 10 - Election Day 680 306 45.00 132 149 4 0Dumont 11 - Election Day 1093 455 41.63 243 183 4 0Dumont Mail-In Ballot - Mail-In Ba 0 141 0.00 49 90 0 0Dumont Provisional - Provisional 0 22 0.00 9 13 0 0Emerson 1 - Election Day 1033 501 48.50 245 212 1 0Emerson 2 - Election Day 837 377 45.04 189 145 1 0Emerson 3 - Election Day 672 269 40.03 128 108 3 0Emerson 4 - Election Day 1065 445 41.78 255 161 0 0Emerson 5 - Election Day 813 338 41.57 183 141 0 0Emerson 6 - Election Day 605 278 45.95 138 123 1 0Emerson Mail-In Ballot - Mail-In Ba 0 122 0.00 65 53 1 0Emerson Provisional - Provisional 0 10 0.00 3 6 0 0Harrington Park 1 - Election Day 1017 485 47.69 211 233 1 0Harrington Park 2 - Election Day 1186 550 46.37 239 266 2 0Harrington Park 3 - Election Day 1145 561 49.00 268 248 4 0Harrington Park Mail-In Ballot - Ma 0 87 0.00 27 59 0 0Harrington Park Provisional - Prov 0 12 0.00 3 8 0 0Haworth 1 - Election Day 1295 592 45.71 221 327 3 0Haworth 2 - Election Day 1193 550 46.10 216 276 6 0Haworth Mail-In Ballot - Mail-In Ba 0 87 0.00 22 60 1 0Haworth Provisional - Provisional 0 4 0.00 1 3 0 0Hillsdale 1 - Election Day 1036 472 45.56 237 199 4 0Hillsdale 2 - Election Day 912 404 44.30 167 206 3 0Hillsdale 3 - Election Day 1364 585 42.89 271 282 0 0Hillsdale 4 - Election Day 1376 592 43.02 306 242 6 0Hillsdale 5 - Election Day 1373 631 45.96 343 238 7 0Hillsdale 6 - Election Day 1485 643 43.30 316 298 0 0Hillsdale Mail-In Ballot - Mail-In Ba 0 192 0.00 83 104 0 0Hillsdale Provisional - Provisional 0 9 0.00 3 5 1 0Mahwah 1 - Election Day 1581 771 48.77 421 266 4 0Mahwah 2 - Election Day 1236 685 55.42 373 235 2 0Mahwah 3 - Election Day 1256 614 48.89 317 207 6 0Mahwah 4 - Election Day 1051 522 49.67 246 224 3 0Mahwah 5 - Election Day 947 432 45.62 261 116 6 0Mahwah 6 - Election Day 1188 545 45.88 316 179 3 0Mahwah 7 - Election Day 1536 732 47.66 442 227 2 0Mahwah 8 - Election Day 1366 495 36.24 301 157 4 0
November 15, 2017 8:37 am Page 28 of 219

Regi
stra
tion
Ballo
ts C
ast
Turn
out (
%)
STAT
E SE
NATE
DIS
T 39
GERA
LD C
ARDI
NALE
LIND
A H.
SCH
WAG
ER
JAM
ES T
OSON
E
Pers
onal
Cho
ice
STATE SENATE DIST 39
BERGEN COUNTY Statement of VoteBER_20171107_E
Mahwah 9 - Election Day 484 212 43.80 104 80 3 0Mahwah 10 - Election Day 1424 650 45.65 304 292 5 0Mahwah 11 - Election Day 1595 739 46.33 423 255 5 0Mahwah 12 - Election Day 749 378 50.47 193 159 0 0Mahwah 13 - Election Day 1063 426 40.08 191 201 3 0Mahwah 14 - Election Day 1098 417 37.98 185 190 2 0Mahwah Mail-In Ballot - Mail-In Ba 0 385 0.00 181 194 1 0Mahwah Provisional - Provisional 0 58 0.00 29 27 1 0Montvale 1 - Election Day 738 351 47.56 181 139 4 0Montvale 2 - Election Day 1113 528 47.44 291 195 2 0Montvale 3 - Election Day 1929 836 43.34 462 311 5 0Montvale 4 - Election Day 1849 749 40.51 400 293 5 0Montvale Mail-In Ballot - Mail-In Ba 0 164 0.00 84 73 0 0Montvale Provisional - Provisional 0 14 0.00 7 6 0 0Norwood 1 - Election Day 1761 857 48.67 368 422 8 0Norwood 2 - Election Day 1899 821 43.23 380 380 5 0Norwood Mail-In Ballot - Mail-In Ba 0 88 0.00 41 45 0 0Norwood Provisional - Provisional 0 3 0.00 3 0 0 0Oakland 1 - Election Day 1001 452 45.15 190 230 4 0Oakland 2 - Election Day 912 394 43.20 180 185 6 0Oakland 3 - Election Day 755 331 43.84 155 157 1 1Oakland 4 - Election Day 942 428 45.44 208 190 8 0Oakland 5 - Election Day 1013 468 46.20 208 237 4 0Oakland 6 - Election Day 1232 556 45.13 255 286 1 1Oakland 7 - Election Day 1257 546 43.44 276 240 5 0Oakland 8 - Election Day 1705 605 35.48 269 316 7 0Oakland Mail-In Ballot - Mail-In Ba 0 199 0.00 77 115 1 0Oakland Provisional - Provisional 0 7 0.00 5 2 0 0Old Tappan 1 - Election Day 1201 435 36.22 240 171 4 0Old Tappan 2 - Election Day 1443 477 33.06 254 195 1 0Old Tappan 3 - Election Day 1513 497 32.85 250 207 3 0Old Tappan Mail-In Ballot - Mail-In 0 128 0.00 66 60 1 0Old Tappan Provisional - Provision 0 6 0.00 3 3 0 0Park Ridge 1 - Election Day 1195 667 55.82 369 247 4 0Park Ridge 2 - Election Day 875 440 50.29 249 164 4 0Park Ridge 3 - Election Day 951 507 53.31 299 167 1 0Park Ridge 4 - Election Day 868 472 54.38 249 191 1 0Park Ridge 5 - Election Day 1088 487 44.76 254 191 5 0Park Ridge 6 - Election Day 1174 609 51.87 312 247 0 0Park Ridge Mail-In Ballot - Mail-In 0 138 0.00 80 55 0 0Park Ridge Provisional - Provision 0 16 0.00 6 9 0 0Ramsey 1 - Election Day 1185 529 44.64 231 255 5 1Ramsey 2 - Election Day 1482 717 48.38 357 301 6 0Ramsey 3 - Election Day 1457 724 49.69 383 298 2 0Ramsey 4 - Election Day 785 350 44.59 184 146 3 0Ramsey 5 - Election Day 1508 701 46.49 356 292 3 0Ramsey 6 - Election Day 1828 718 39.28 340 329 3 0Ramsey 7 - Election Day 1242 567 45.65 308 220 4 1Ramsey 8 - Election Day 1006 488 48.51 294 149 1 0Ramsey Mail-In Ballot - Mail-In Ba 0 280 0.00 145 129 0 0Ramsey Provisional - Provisional 0 14 0.00 10 4 0 0River Vale 1 - Election Day 1533 578 37.70 293 242 5 0River Vale 2 - Election Day 2055 856 41.65 474 338 6 0River Vale 3 - Election Day 1486 632 42.53 301 291 4 0River Vale 4 - Election Day 1159 476 41.07 235 205 7 0River Vale 5 - Election Day 1231 493 40.05 281 178 3 0River Vale Mail-In Ballot - Mail-In B 0 134 0.00 63 66 1 0River Vale Provisional - Provisiona 0 10 0.00 3 6 0 0Saddle River 1 - Election Day 1185 380 32.07 278 84 2 0
November 15, 2017 8:37 am Page 29 of 219

Regi
stra
tion
Ballo
ts C
ast
Turn
out (
%)
STAT
E SE
NATE
DIS
T 39
GERA
LD C
ARDI
NALE
LIND
A H.
SCH
WAG
ER
JAM
ES T
OSON
E
Pers
onal
Cho
ice
STATE SENATE DIST 39
BERGEN COUNTY Statement of VoteBER_20171107_E
Saddle River 2 - Election Day 1452 532 36.64 391 116 4 0Saddle River Mail-In Ballot - Mail-I 0 74 0.00 40 32 1 0Saddle River Provisional - Provisio 0 8 0.00 4 3 0 0Upper Saddle River 1 - Election D 1468 548 37.33 320 200 2 0Upper Saddle River 2 - Election D 1049 375 35.75 233 123 5 0Upper Saddle River 3 - Election D 1271 447 35.17 281 147 3 0Upper Saddle River 4 - Election D 1269 453 35.70 253 167 5 0Upper Saddle River 5 - Election D 930 322 34.62 191 118 2 0Upper Saddle River Mail-In Ballot 0 126 0.00 62 59 1 0Upper Saddle River Provisional - P 0 18 0.00 7 10 0 0Washington Township 1 - Election 1346 640 47.55 339 233 4 0Washington Township 2 - Election 912 425 46.60 241 137 4 0Washington Township 3 - Election 746 373 50.00 190 136 5 0Washington Township 4 - Election 1192 512 42.95 283 184 3 0Washington Township 5 - Election 1117 549 49.15 292 189 7 0Washington Township 6 - Election 1508 680 45.09 377 230 11 0Washington Township Mail-In Ball 0 211 0.00 121 76 2 0Washington Township Provisional 0 19 0.00 11 5 0 0Westwood 1 - Election Day 1114 513 46.05 225 238 7 0Westwood 2 - Election Day 959 446 46.51 201 213 1 0Westwood 3 - Election Day 605 297 49.09 136 145 4 0Westwood 4 - Election Day 894 429 47.99 158 246 3 0Westwood 5 - Election Day 707 351 49.65 177 152 4 0Westwood 6 - Election Day 1242 469 37.76 162 276 1 0Westwood 7 - Election Day 781 356 45.58 189 147 1 0Westwood 8 - Election Day 944 445 47.14 222 189 1 0Westwood Mail-In Ballot - Mail-In B 0 156 0.00 89 64 2 0Westwood Provisional - Provisiona 0 20 0.00 3 16 0 0Woodcliff Lake 1 - Election Day 897 425 47.38 185 205 3 0Woodcliff Lake 2 - Election Day 1176 556 47.28 274 240 6 0Woodcliff Lake 3 - Election Day 983 475 48.32 234 216 2 0Woodcliff Lake 4 - Election Day 1427 621 43.52 262 286 6 0Woodcliff Lake Mail-In Ballot - Mai 0 170 0.00 83 67 6 0Woodcliff Lake Provisional - Provis 0 21 0.00 10 8 0 0
Election Day Totals 128355 55629 43.34 27765 23685 387 5
Mail-In Ballot Totals 0 3071 0.00 1451 1513 20 0
Provisional Totals 0 286 0.00 126 142 2 0
District Totals - Absentee
District Grand TotalsCounty 128355 58986 45.96 29342 25340 409 5Closter 5228 2079 39.77 856 1107 13 0Demarest 3302 1437 43.52 576 807 7 0Dumont 11299 4628 40.96 2030 2279 43 1Emerson 5025 2340 46.57 1206 949 7 0Harrington Park 3348 1695 50.63 748 814 7 0Haworth 2488 1233 49.56 460 666 10 0Hillsdale 7546 3528 46.75 1726 1574 21 0Mahwah 16574 8061 48.64 4287 3009 50 0Montvale 5629 2642 46.94 1425 1017 16 0Norwood 3660 1769 48.33 792 847 13 0Oakland 8817 3986 45.21 1823 1958 37 2Old Tappan 4157 1543 37.12 813 636 9 0Park Ridge 6151 3336 54.24 1818 1271 15 0Ramsey 10493 5088 48.49 2608 2123 27 2
November 15, 2017 8:37 am Page 30 of 219

Regi
stra
tion
Ballo
ts C
ast
Turn
out (
%)
STAT
E SE
NATE
DIS
T 39
GERA
LD C
ARDI
NALE
LIND
A H.
SCH
WAG
ER
JAM
ES T
OSON
E
Pers
onal
Cho
ice
STATE SENATE DIST 39
BERGEN COUNTY Statement of VoteBER_20171107_E
River Vale 7464 3179 42.59 1650 1326 26 0Saddle River 2637 994 37.69 713 235 7 0Upper Saddle River 5987 2289 38.23 1347 824 18 0Washington 6821 3409 49.98 1854 1190 36 0Westwood 7246 3482 48.05 1562 1686 24 0Woodcliff Lake 4483 2268 50.59 1048 1022 23 0
Grand Totals 128355 58986 45.96 29342 25340 409 5
November 15, 2017 8:37 am Page 31 of 219

Regi
stra
tion
Ballo
ts C
ast
Turn
out (
%)
STAT
E SE
NATE
DIS
T 40
KRIS
TIN
M. C
ORRA
DO
THOM
AS D
UCH
Pers
onal
Cho
ice
STATE SENATE DIST 40
BERGEN COUNTY Statement of VoteBER_20171107_E
Allendale 1 - Election Day 1618 755 46.66 374 332 0Allendale 2 - Election Day 853 363 42.56 181 156 0Allendale 3 - Election Day 982 456 46.44 256 163 0Allendale 4 - Election Day 1439 606 42.11 349 231 0Allendale Mail-In Ballot - Mail-In B 0 129 0.00 66 59 0Allendale Provisional - Provisional 0 12 0.00 5 7 0Franklin Lakes 1 - Election Day 1044 371 35.54 239 109 0Franklin Lakes 2 - Election Day 1054 398 37.76 240 128 0Franklin Lakes 3 - Election Day 1110 407 36.67 267 126 0Franklin Lakes 4 - Election Day 2024 712 35.18 445 225 0Franklin Lakes 5 - Election Day 1480 531 35.88 350 157 0Franklin Lakes 6 - Election Day 1328 490 36.90 324 136 0Franklin Lakes Mail-In Ballot - Mai 0 240 0.00 131 104 0Franklin Lakes Provisional - Provis 0 20 0.00 13 6 0Ho-Ho-Kus 1 - Election Day 1061 551 51.93 281 208 0Ho-Ho-Kus 2 - Election Day 1104 539 48.82 293 200 0Ho-Ho-Kus 3 - Election Day 914 486 53.17 259 189 0Ho-Ho-Kus Mail-In Ballot - Mail-In 0 89 0.00 31 53 0Ho-Ho-Kus Provisional - Provision 0 13 0.00 4 4 0Midland Park 1 - Election Day 1135 547 48.19 260 228 0Midland Park 2 - Election Day 745 345 46.31 187 121 0Midland Park 3 - Election Day 1151 525 45.61 252 231 0Midland Park 4 - Election Day 896 409 45.65 214 152 0Midland Park 5 - Election Day 1083 526 48.57 293 167 0Midland Park Mail-In Ballot - Mail- 0 104 0.00 45 55 0Midland Park Provisional - Provisio 0 17 0.00 3 12 0Ridgewood 1 - Election Day 809 325 40.17 130 172 0Ridgewood 2 - Election Day 1049 374 35.65 147 211 0Ridgewood 3 - Election Day 940 371 39.47 158 187 0Ridgewood 4 - Election Day 788 311 39.47 111 186 0Ridgewood 5 - Election Day 1023 334 32.65 170 150 0Ridgewood 6 - Election Day 859 376 43.77 121 235 0Ridgewood 7 - Election Day 990 402 40.61 150 225 0Ridgewood 8 - Election Day 724 298 41.16 102 173 0Ridgewood 9 - Election Day 702 305 43.45 101 189 0Ridgewood 10 - Election Day 718 244 33.98 59 173 0Ridgewood 11 - Election Day 979 435 44.43 173 238 0Ridgewood 12 - Election Day 864 369 42.71 140 213 0Ridgewood 13 - Election Day 948 378 39.87 115 241 1Ridgewood 14 - Election Day 1196 489 40.89 170 270 0Ridgewood 15 - Election Day 848 370 43.63 136 209 0Ridgewood 16 - Election Day 695 278 40.00 109 156 0Ridgewood 17 - Election Day 785 320 40.76 138 161 1Ridgewood 18 - Election Day 870 390 44.83 131 244 0Ridgewood 19 - Election Day 821 339 41.29 130 186 0Ridgewood Mail-In Ballot - Mail-In 0 432 0.00 136 286 0Ridgewood Provisional - Provision 0 35 0.00 9 26 0Waldwick 1 - Election Day 1287 574 44.60 256 274 0Waldwick 2 - Election Day 1141 472 41.37 213 226 0Waldwick 3 - Election Day 1088 478 43.93 201 234 0Waldwick 4 - Election Day 1098 481 43.81 247 193 0Waldwick 5 - Election Day 1037 463 44.65 224 200 0Waldwick 6 - Election Day 1001 456 45.55 241 182 0Waldwick Mail-In Ballot - Mail-In B 0 129 0.00 72 54 0Waldwick Provisional - Provisiona 0 16 0.00 6 10 0Wyckoff 1 - Election Day 1382 630 45.59 333 254 1Wyckoff 2 - Election Day 1496 704 47.06 385 280 0Wyckoff 3 - Election Day 1259 542 43.05 301 216 0Wyckoff 4 - Election Day 1421 628 44.19 355 249 0
November 15, 2017 8:37 am Page 32 of 219

Regi
stra
tion
Ballo
ts C
ast
Turn
out (
%)
STAT
E SE
NATE
DIS
T 40
KRIS
TIN
M. C
ORRA
DO
THOM
AS D
UCH
Pers
onal
Cho
ice
STATE SENATE DIST 40
BERGEN COUNTY Statement of VoteBER_20171107_E
Wyckoff 5 - Election Day 929 450 48.44 245 174 1Wyckoff 6 - Election Day 1229 556 45.24 303 226 0Wyckoff 7 - Election Day 1270 631 49.69 333 263 0Wyckoff 8 - Election Day 1347 585 43.43 367 192 0Wyckoff 9 - Election Day 876 435 49.66 264 146 0Wyckoff 10 - Election Day 1139 511 44.86 256 228 0Wyckoff Mail-In Ballot - Mail-In Ba 0 439 0.00 206 215 0Wyckoff Provisional - Provisional 0 29 0.00 11 18 0
Election Day Totals 56629 24321 42.95 12079 10615 4
Mail-In Ballot Totals 0 1562 0.00 687 826 0
Provisional Totals 0 142 0.00 51 83 0
District Totals - Absentee
District Grand TotalsCounty 56629 26025 45.96 12817 11524 4Allendale 4892 2321 47.44 1231 948 0Franklin Lakes 8040 3169 39.42 2009 991 0Ho-Ho-Kus 3079 1678 54.50 868 654 0Midland Park 5010 2473 49.36 1254 966 0Ridgewood 16608 7175 43.20 2636 4131 2Waldwick 6652 3069 46.14 1460 1373 0Wyckoff 12348 6140 49.72 3359 2461 2
Grand Totals 56629 26025 45.96 12817 11524 4
November 15, 2017 8:37 am Page 33 of 219

Regi
stra
tion
Ballo
ts C
ast
Turn
out (
%)
GENE
RAL
ASSE
MBL
Y DI
ST 3
2
ANN
M C
ORLE
TTA
BART
HOLO
MEW
J. T
ALAM
INI
VINC
ENT
PRIE
TO
ANGE
LICA
M. J
IMEN
EZ
Pers
onal
Cho
ice
GENERAL ASSEMBLY DIST 32
BERGEN COUNTY Statement of VoteBER_20171107_E
Edgewater 1 - Election Day 1072 335 31.25 66 61 229 236 0Edgewater 2 - Election Day 1385 405 29.24 85 85 283 285 0Edgewater 3 - Election Day 1416 469 33.12 125 121 299 298 0Edgewater 4 - Election Day 1898 486 25.61 116 107 330 344 0Edgewater Mail-In Ballot - Mail-In 0 123 0.00 35 31 85 80 1Edgewater Provisional - Provisiona 0 16 0.00 4 4 11 11 0Fairview 1 - Election Day 757 255 33.69 32 31 177 177 0Fairview 2 - Election Day 1265 396 31.30 76 79 262 261 0Fairview 3 - Election Day 941 297 31.56 63 65 178 176 0Fairview 4 - Election Day 860 258 30.00 52 55 159 161 1Fairview 5 - Election Day 1334 428 32.08 71 73 288 280 0Fairview 6 - Election Day 165 85 51.52 16 14 54 54 0Fairview Mail-In Ballot - Mail-In Ba 0 64 0.00 26 26 36 33 1Fairview Provisional - Provisional 0 8 0.00 0 0 8 8 0
Election Day Totals 11093 3414 30.78 702 691 2259 2272 1
Mail-In Ballot Totals 0 187 0.00 61 57 121 113 2
Provisional Totals 0 24 0.00 4 4 19 19 0
District Totals - Absentee
District Grand TotalsCounty 11093 3625 32.68 767 752 2399 2404 3Edgewater 5771 1834 31.78 431 409 1237 1254 1Fair View 5322 1791 33.65 336 343 1162 1150 2
Grand Totals 11093 3625 32.68 767 752 2399 2404 3
November 15, 2017 8:37 am Page 34 of 219

Regi
stra
tion
Ballo
ts C
ast
Turn
out (
%)
GENE
RAL
ASSE
MBL
Y DI
ST 3
5
IBRA
HIM
MAH
MOU
D
NIHA
D YO
UNES
SHAV
ONDA
E. S
UMTE
R
BENJ
IE E
. WIM
BERL
Y
Pers
onal
Cho
ice
GENERAL ASSEMBLY DIST 35
BERGEN COUNTY Statement of VoteBER_20171107_E
Elmwood Park 1 - Election Day 1427 492 34.48 152 160 229 233 4Elmwood Park 2 - Election Day 1446 464 32.09 131 132 241 244 0Elmwood Park 3 - Election Day 943 380 40.30 123 120 186 183 0Elmwood Park 4 - Election Day 809 246 30.41 59 58 144 150 0Elmwood Park 5 - Election Day 860 333 38.72 101 102 179 181 0Elmwood Park 6 - Election Day 714 224 31.37 64 60 130 134 0Elmwood Park 7 - Election Day 1146 437 38.13 135 139 212 212 0Elmwood Park 8 - Election Day 1919 563 29.34 190 187 262 266 2Elmwood Park 9 - Election Day 1183 353 29.84 120 126 142 148 0Elmwood Park 10 - Election Day 1470 495 33.67 174 171 219 226 0Elmwood Park Mail-In Ballot - Mai 0 605 0.00 136 132 382 386 0Elmwood Park Provisional - Provis 0 61 0.00 14 12 29 29 0Garfield W1 D1 - Election Day 841 187 22.24 40 42 102 101 0Garfield W1 D2 - Election Day 495 103 20.81 11 14 69 66 0Garfield W1 D3 - Election Day 994 204 20.52 38 39 123 119 0Garfield W2 D1 - Election Day 1036 205 19.79 45 48 104 97 0Garfield W2 D2 - Election Day 1016 295 29.04 71 76 163 165 0Garfield W2 D3 - Election Day 747 195 26.10 51 54 105 101 0Garfield W3 D1 - Election Day 1114 253 22.71 41 40 167 166 2Garfield W3 D2 - Election Day 1099 291 26.48 50 50 185 187 0Garfield W3 D3 - Election Day 933 265 28.40 62 58 152 148 0Garfield W4 D1 - Election Day 1193 299 25.06 76 77 164 162 0Garfield W4 D2 - Election Day 856 231 26.99 57 62 111 112 0Garfield W4 D3 - Election Day 754 147 19.50 42 44 76 72 0Garfield W5 D1 - Election Day 1515 386 25.48 88 93 218 219 0Garfield W5 D2 - Election Day 869 250 28.77 59 67 146 143 1Garfield W5 D3 - Election Day 575 191 33.22 57 56 101 104 0Garfield Mail-In Ballot - Mail-In Ba 0 167 0.00 53 53 94 92 0Garfield Provisional - Provisional 0 23 0.00 2 2 18 18 0
Election Day Totals 25954 7489 28.85 2037 2075 3930 3939 9
Mail-In Ballot Totals 0 772 0.00 189 185 476 478 0
Provisional Totals 0 84 0.00 16 14 47 47 0
District Totals - Absentee
District Grand TotalsCounty 25954 8345 32.15 2242 2274 4453 4464 9Elmwood Park 11917 4653 39.05 1399 1399 2355 2392 6Garfield 14037 3692 26.30 843 875 2098 2072 3
Grand Totals 25954 8345 32.15 2242 2274 4453 4464 9
November 15, 2017 8:37 am Page 35 of 219

Regi
stra
tion
Ballo
ts C
ast
Turn
out (
%)
GENE
RAL
ASSE
MBL
Y DI
ST 3
6
PAUL
PAS
SAM
ANO
JR.
MAR
C M
ARSI
MAR
LENE
CAR
IDE
GARY
SCH
AER
Pers
onal
Cho
ice
GENERAL ASSEMBLY DIST 36
BERGEN COUNTY Statement of VoteBER_20171107_E
Carlstadt 1 - Election Day 633 270 42.65 125 120 105 103 0Carlstadt 2 - Election Day 822 326 39.66 131 119 152 156 0Carlstadt 3 - Election Day 714 283 39.64 106 101 147 145 0Carlstadt 4 - Election Day 780 316 40.51 124 113 151 150 0Carlstadt 5 - Election Day 753 287 38.11 109 103 133 134 0Carlstadt Mail-In Ballot - Mail-In Ba 0 78 0.00 38 36 35 33 0Carlstadt Provisional - Provisional 0 5 0.00 0 0 5 5 0Cliffside Park 1 - Election Day 770 228 29.61 40 39 161 156 0Cliffside Park 2 - Election Day 822 227 27.62 35 36 165 166 0Cliffside Park 3 - Election Day 815 227 27.85 37 37 172 164 0Cliffside Park 4 - Election Day 1213 471 38.83 124 121 316 311 0Cliffside Park 5 - Election Day 726 215 29.61 41 37 146 146 0Cliffside Park 6 - Election Day 759 271 35.70 57 63 187 183 0Cliffside Park 7 - Election Day 800 236 29.50 60 64 148 147 1Cliffside Park 8 - Election Day 817 325 39.78 71 68 211 204 0Cliffside Park 9 - Election Day 644 204 31.68 64 68 125 118 0Cliffside Park 10 - Election Day 1128 349 30.94 80 82 240 236 0Cliffside Park 11 - Election Day 593 161 27.15 45 45 101 95 0Cliffside Park 12 - Election Day 548 160 29.20 39 37 113 111 0Cliffside Park 13 - Election Day 886 307 34.65 71 70 206 202 0Cliffside Park 14 - Election Day 748 326 43.58 118 119 181 176 2Cliffside Park 15 - Election Day 777 313 40.28 90 88 186 186 2Cliffside Park Mail-In Ballot - Mail- 0 199 0.00 51 48 138 136 0Cliffside Park Provisional - Provisio 0 25 0.00 5 5 17 18 0East Rutherford 1 - Election Day 1198 385 32.14 102 94 250 246 0East Rutherford 2 - Election Day 1080 414 38.33 131 135 211 205 0East Rutherford 3 - Election Day 881 373 42.34 123 120 188 188 0East Rutherford 4 - Election Day 1901 786 41.35 323 312 339 338 1East Rutherford Mail-In Ballot - Ma 0 85 0.00 28 24 47 51 0East Rutherford Provisional - Prov 0 12 0.00 2 2 9 8 0Little Ferry 1 - Election Day 809 277 34.24 94 94 160 156 0Little Ferry 2 - Election Day 611 190 31.10 51 54 112 111 0Little Ferry 3 - Election Day 1114 304 27.29 96 89 173 177 0Little Ferry 4 - Election Day 838 261 31.15 84 88 154 152 0Little Ferry 5 - Election Day 1192 305 25.59 80 86 169 181 0Little Ferry 6 - Election Day 796 248 31.16 78 78 140 138 0Little Ferry Mail-In Ballot - Mail-In 0 101 0.00 36 33 60 60 0Little Ferry Provisional - Provisiona 0 10 0.00 4 5 5 4 0Lyndhurst 1 - Election Day 748 275 36.76 139 94 110 129 0Lyndhurst 2 - Election Day 748 243 32.49 125 88 85 98 0Lyndhurst 3 - Election Day 1199 340 28.36 148 113 153 154 0Lyndhurst 4 - Election Day 867 341 39.33 166 123 135 147 0Lyndhurst 5 - Election Day 745 271 36.38 126 91 112 117 0Lyndhurst 6 - Election Day 1017 328 32.25 136 109 157 150 1Lyndhurst 7 - Election Day 775 285 36.77 153 108 101 105 0Lyndhurst 8 - Election Day 860 320 37.21 156 111 131 137 0Lyndhurst 9 - Election Day 708 276 38.98 118 88 122 117 0Lyndhurst 10 - Election Day 953 359 37.67 168 120 140 166 0Lyndhurst 11 - Election Day 793 342 43.13 185 121 126 152 0Lyndhurst 12 - Election Day 702 280 39.89 154 110 87 102 0Lyndhurst 13 - Election Day 929 294 31.65 139 101 114 118 0Lyndhurst 14 - Election Day 747 253 33.87 134 84 94 103 0Lyndhurst 15 - Election Day 843 293 34.76 132 103 116 124 0Lyndhurst Mail-In Ballot - Mail-In B 0 329 0.00 169 132 130 144 0Lyndhurst Provisional - Provisiona 0 22 0.00 15 10 7 8 0Moonachie 1 - Election Day 296 70 23.65 19 20 38 34 0Moonachie 2 - Election Day 890 313 35.17 82 79 167 161 0Moonachie 3 - Election Day 414 120 28.99 34 35 69 69 0Moonachie Mail-In Ballot - Mail-In 0 24 0.00 6 6 18 18 0
November 15, 2017 8:37 am Page 36 of 219

Regi
stra
tion
Ballo
ts C
ast
Turn
out (
%)
GENE
RAL
ASSE
MBL
Y DI
ST 3
6
PAUL
PAS
SAM
ANO
JR.
MAR
C M
ARSI
MAR
LENE
CAR
IDE
GARY
SCH
AER
Pers
onal
Cho
ice
GENERAL ASSEMBLY DIST 36
BERGEN COUNTY Statement of VoteBER_20171107_E
Moonachie Provisional - Provision 0 1 0.00 0 0 1 0 0North Arlington 1 - Election Day 547 226 41.32 95 89 108 110 0North Arlington 2 - Election Day 789 294 37.26 110 106 146 145 0North Arlington 3 - Election Day 934 360 38.54 144 144 171 168 2North Arlington 4 - Election Day 969 423 43.65 175 172 193 194 0North Arlington 5 - Election Day 1224 481 39.30 226 211 185 194 0North Arlington 6 - Election Day 968 346 35.74 130 129 149 148 4North Arlington 7 - Election Day 1448 635 43.85 308 278 275 289 0North Arlington 8 - Election Day 692 289 41.76 123 111 128 137 0North Arlington 9 - Election Day 970 408 42.06 194 193 174 175 2North Arlington 10 - Election Day 643 273 42.46 99 99 132 132 0North Arlington Mail-In Ballot - Ma 0 302 0.00 177 166 112 115 0North Arlington Provisional - Provi 0 16 0.00 3 4 9 9 0Ridgefield 1 - Election Day 1202 396 32.95 135 138 221 211 0Ridgefield 2 - Election Day 921 358 38.87 107 104 208 208 0Ridgefield 3 - Election Day 1481 429 28.97 117 115 267 255 0Ridgefield 4 - Election Day 963 303 31.46 95 104 185 172 0Ridgefield 5 - Election Day 1300 382 29.38 132 121 215 204 0Ridgefield Mail-In Ballot - Mail-In B 0 135 0.00 64 63 65 63 1Ridgefield Provisional - Provisiona 0 14 0.00 6 5 8 8 0Ridgefield Park 1 - Election Day 588 227 38.61 61 56 130 127 0Ridgefield Park 2 - Election Day 1076 382 35.50 99 110 230 218 0Ridgefield Park 3 - Election Day 797 255 31.99 63 68 144 139 0Ridgefield Park 4 - Election Day 1073 393 36.63 122 117 213 221 0Ridgefield Park 5 - Election Day 602 230 38.21 80 76 121 125 2Ridgefield Park 6 - Election Day 964 382 39.63 108 102 219 216 0Ridgefield Park 7 - Election Day 935 359 38.40 90 91 205 201 0Ridgefield Park 8 - Election Day 1125 451 40.09 128 126 256 253 0Ridgefield Park Mail-In Ballot - Ma 0 98 0.00 32 33 55 55 0Ridgefield Park Provisional - Provi 0 26 0.00 7 5 17 16 0Rutherford 1 - Election Day 990 496 50.10 165 173 274 267 0Rutherford 2 - Election Day 1099 509 46.31 203 195 268 261 1Rutherford 3 - Election Day 989 434 43.88 127 119 261 265 0Rutherford 4 - Election Day 730 346 47.40 146 139 163 156 0Rutherford 5 - Election Day 776 344 44.33 117 112 191 178 0Rutherford 6 - Election Day 743 282 37.95 94 92 155 157 0Rutherford 7 - Election Day 938 404 43.07 132 137 232 216 0Rutherford 8 - Election Day 1007 420 41.71 113 147 227 203 0Rutherford 9 - Election Day 1051 491 46.72 167 156 259 248 0Rutherford 10 - Election Day 969 437 45.10 159 157 231 235 0Rutherford 11 - Election Day 1041 405 38.90 130 140 243 239 0Rutherford 12 - Election Day 763 311 40.76 119 115 163 163 0Rutherford Mail-In Ballot - Mail-In 0 257 0.00 88 85 152 155 0Rutherford Provisional - Provisiona 0 43 0.00 8 6 33 34 0South Hackensack 1 - Election Da 1417 525 37.05 152 131 290 293 0South Hackensack Mail-In Ballot - 0 32 0.00 10 11 17 16 0South Hackensack Provisional - P 0 1 0.00 0 0 0 0 0Teterboro 1 - Election Day 34 17 50.00 6 7 7 7 0Teterboro Mail-In Ballot - Mail-In B 0 0 0.00 0 0 0 0 0Teterboro Provisional - Provisiona 0 0 0.00 0 0 0 0 0Wallington 1 - Election Day 623 211 33.87 78 79 86 88 0Wallington 2 - Election Day 738 232 31.44 98 95 98 97 0Wallington 3 - Election Day 1129 373 33.04 132 131 186 181 0Wallington 4 - Election Day 1305 655 50.19 305 299 238 242 0Wallington 5 - Election Day 1101 381 34.60 176 174 124 126 0Wallington 6 - Election Day 710 251 35.35 97 99 124 118 0Wallington Mail-In Ballot - Mail-In B 0 137 0.00 68 64 52 53 0Wallington Provisional - Provisiona 0 9 0.00 5 5 3 3 0Wood Ridge 1 - Election Day 1442 602 41.75 158 154 377 377 0
November 15, 2017 8:37 am Page 37 of 219

Regi
stra
tion
Ballo
ts C
ast
Turn
out (
%)
GENE
RAL
ASSE
MBL
Y DI
ST 3
6
PAUL
PAS
SAM
ANO
JR.
MAR
C M
ARSI
MAR
LENE
CAR
IDE
GARY
SCH
AER
Pers
onal
Cho
ice
GENERAL ASSEMBLY DIST 36
BERGEN COUNTY Statement of VoteBER_20171107_E
Wood Ridge 2 - Election Day 772 408 52.85 153 146 199 205 0Wood Ridge 3 - Election Day 1200 569 47.42 202 197 306 290 0Wood Ridge 4 - Election Day 1182 499 42.22 176 168 276 271 0Wood Ridge 5 - Election Day 1243 601 48.35 210 198 340 337 2Wood Ridge Mail-In Ballot - Mail-In 0 136 0.00 31 30 97 96 0Wood Ridge Provisional - Provisio 0 8 0.00 2 3 6 5 0
Election Day Totals 86605 32533 37.56 11599 10798 16892 16826 20
Mail-In Ballot Totals 0 1913 0.00 798 731 978 995 1
Provisional Totals 0 192 0.00 57 50 120 118 0
District Totals - Absentee
District Grand TotalsCounty 86605 34638 40.00 12454 11579 17990 17939 21Carlstadt 3702 1565 42.27 633 592 728 726 0Cliffside Park 12046 4244 35.23 1028 1027 2813 2755 5East Rutherford 5060 2055 40.61 709 687 1044 1036 1Little Ferry 5360 1696 31.64 523 527 973 979 0Lyndhurst 12634 4851 38.40 2363 1706 1920 2071 1Moonachie 1600 528 33.00 141 140 293 282 0North Arlington 9184 4053 44.13 1784 1702 1782 1816 8Ridgefield 5867 2017 34.38 656 650 1169 1121 1Ridgefield Park 7160 2803 39.15 790 784 1590 1571 2Rutherford 11096 5179 46.67 1768 1773 2852 2777 1South Hackensack 1417 558 39.38 162 142 307 309 0Teterboro 34 17 50.00 6 7 7 7 0Wallington 5606 2249 40.12 959 946 911 908 0Wood Ridge 5839 2823 48.35 932 896 1601 1581 2
Grand Totals 86605 34638 40.00 12454 11579 17990 17939 21
November 15, 2017 8:37 am Page 38 of 219

Regi
stra
tion
Ballo
ts C
ast
Turn
out (
%)
GENE
RAL
ASSE
MBL
Y DI
ST 3
7
GINO
P. T
ESSA
RO
ANGE
LA H
ENDR
ICKS
GORD
ON M
. JOH
NSON
VALE
RIE
VAIN
IERI
HUT
TLE
CLAU
DIO
I. BE
LUSI
C
Pers
onal
Cho
ice
GENERAL ASSEMBLY DIST 37
BERGEN COUNTY Statement of VoteBER_20171107_E
Alpine 1 - Election Day 1416 405 28.60 189 183 176 193 5 0Alpine Mail-In Ballot - Mail-In Ballo 0 30 0.00 9 6 22 22 0 0Alpine Provisional - Provisional 0 1 0.00 0 0 1 1 0 0Bogota 1 - Election Day 807 331 41.02 99 97 196 200 0 0Bogota 2 - Election Day 1014 364 35.90 81 84 233 235 4 2Bogota 3 - Election Day 953 346 36.31 111 108 193 192 2 0Bogota 4 - Election Day 909 400 44.00 119 118 218 223 2 0Bogota 5 - Election Day 562 254 45.20 77 83 131 134 4 2Bogota 6 - Election Day 808 318 39.36 85 88 189 197 4 0Bogota Mail-In Ballot - Mail-In Ball 0 114 0.00 53 57 56 56 0 1Bogota Provisional - Provisional 0 20 0.00 4 4 13 12 0 0Cresskill 1 - Election Day 815 300 36.81 122 117 134 135 1 0Cresskill 2 - Election Day 928 315 33.94 100 95 184 184 2 0Cresskill 3 - Election Day 1480 496 33.51 216 204 230 242 7 0Cresskill 4 - Election Day 781 278 35.60 114 114 132 137 2 0Cresskill 5 - Election Day 601 250 41.60 100 101 119 119 3 0Cresskill 6 - Election Day 659 245 37.18 100 98 118 119 1 0Cresskill Mail-In Ballot - Mail-In Ba 0 59 0.00 26 25 29 30 0 0Cresskill Provisional - Provisional 0 4 0.00 0 0 3 3 0 0Englewood W1 D1 - Election Day 1396 527 37.75 129 134 336 340 8 0Englewood W1 D2 - Election Day 862 361 41.88 118 114 209 220 2 0Englewood W1 D3 - Election Day 793 285 35.94 29 30 225 221 3 0Englewood W1 D4 - Election Day 869 320 36.82 19 19 253 244 3 0Englewood W2 D1 - Election Day 816 310 37.99 100 94 173 177 3 1Englewood W2 D2 - Election Day 723 266 36.79 106 108 122 116 1 0Englewood W2 D3 - Election Day 1145 371 32.40 110 111 221 217 0 0Englewood W2 D4 - Election Day 1823 466 25.56 70 69 353 349 0 0Englewood W3 D1 - Election Day 860 290 33.72 17 20 226 219 1 0Englewood W3 D2 - Election Day 1411 574 40.68 39 36 465 456 5 0Englewood W3 D3 - Election Day 706 322 45.61 17 21 276 273 3 0Englewood W3 D4 - Election Day 999 409 40.94 14 17 339 337 4 0Englewood W4 D1 - Election Day 679 215 31.66 1 2 181 173 4 0Englewood W4 D2 - Election Day 1167 474 40.62 20 18 394 383 1 0Englewood W4 D3 - Election Day 1102 388 35.21 8 8 336 332 0 1Englewood W4 D4 - Election Day 1038 326 31.41 16 14 272 264 4 0Englewood Mail-In Ballot - Mail-In 0 324 0.00 48 47 249 256 1 0Englewood Provisional - Provision 0 40 0.00 2 3 31 29 0 0Englewood Cliffs 1 - Election Day 1056 439 41.57 186 183 210 208 3 0Englewood Cliffs 2 - Election Day 874 379 43.36 157 156 174 169 4 0Englewood Cliffs 3 - Election Day 880 402 45.68 150 144 189 194 5 0Englewood Cliffs 4 - Election Day 797 327 41.03 152 154 140 141 3 0Englewood Cliffs Mail-In Ballot - M 0 383 0.00 165 164 178 177 1 0Englewood Cliffs Provisional - Pro 0 26 0.00 7 8 14 16 0 0Fort Lee 1 - Election Day 1117 383 34.29 146 144 175 181 3 0Fort Lee 2 - Election Day 768 271 35.29 64 63 164 169 4 2Fort Lee 3 - Election Day 1454 495 34.04 157 154 286 281 0 0Fort Lee 4 - Election Day 583 269 46.14 77 80 163 159 0 0Fort Lee 5 - Election Day 908 301 33.15 81 83 165 164 5 0Fort Lee 6 - Election Day 1556 506 32.52 135 127 327 322 1 2Fort Lee 7 - Election Day 2142 777 36.27 167 170 501 493 7 0Fort Lee 8 - Election Day 609 158 25.94 44 36 98 100 1 0Fort Lee 9 - Election Day 687 203 29.55 77 75 99 101 2 0Fort Lee 10 - Election Day 2683 836 31.16 193 199 563 568 5 2Fort Lee 11 - Election Day 683 226 33.09 38 39 150 152 2 0Fort Lee 12 - Election Day 1270 380 29.92 92 95 239 236 6 0Fort Lee 13 - Election Day 737 269 36.50 49 52 194 193 3 0Fort Lee 14 - Election Day 607 223 36.74 41 43 152 155 2 0Fort Lee 15 - Election Day 777 217 27.93 51 55 135 136 3 1Fort Lee 16 - Election Day 1013 330 32.58 93 85 194 190 3 0
November 15, 2017 8:37 am Page 39 of 219
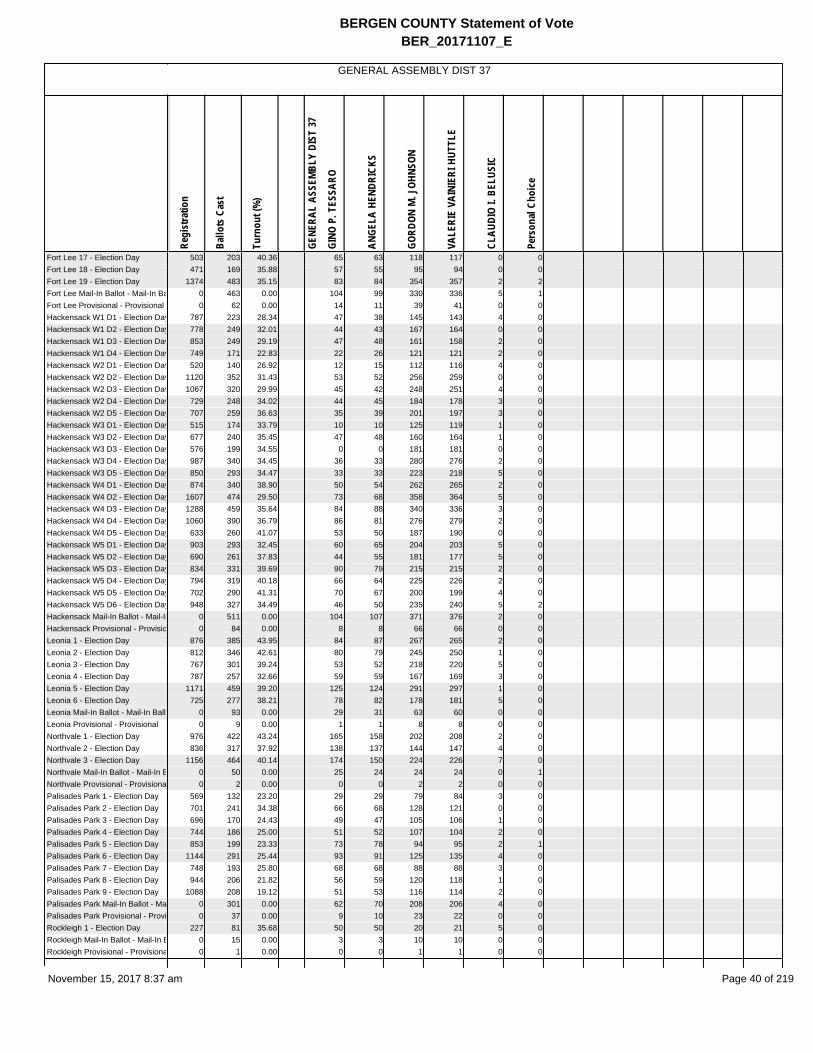
Regi
stra
tion
Ballo
ts C
ast
Turn
out (
%)
GENE
RAL
ASSE
MBL
Y DI
ST 3
7
GINO
P. T
ESSA
RO
ANGE
LA H
ENDR
ICKS
GORD
ON M
. JOH
NSON
VALE
RIE
VAIN
IERI
HUT
TLE
CLAU
DIO
I. BE
LUSI
C
Pers
onal
Cho
ice
GENERAL ASSEMBLY DIST 37
BERGEN COUNTY Statement of VoteBER_20171107_E
Fort Lee 17 - Election Day 503 203 40.36 65 63 118 117 0 0Fort Lee 18 - Election Day 471 169 35.88 57 55 95 94 0 0Fort Lee 19 - Election Day 1374 483 35.15 83 84 354 357 2 2Fort Lee Mail-In Ballot - Mail-In Ba 0 463 0.00 104 99 330 336 5 1Fort Lee Provisional - Provisional 0 62 0.00 14 11 39 41 0 0Hackensack W1 D1 - Election Day 787 223 28.34 47 38 145 143 4 0Hackensack W1 D2 - Election Day 778 249 32.01 44 43 167 164 0 0Hackensack W1 D3 - Election Day 853 249 29.19 47 48 161 158 2 0Hackensack W1 D4 - Election Day 749 171 22.83 22 26 121 121 2 0Hackensack W2 D1 - Election Day 520 140 26.92 12 15 112 116 4 0Hackensack W2 D2 - Election Day 1120 352 31.43 53 52 256 259 0 0Hackensack W2 D3 - Election Day 1067 320 29.99 45 42 248 251 4 0Hackensack W2 D4 - Election Day 729 248 34.02 44 45 184 178 3 0Hackensack W2 D5 - Election Day 707 259 36.63 35 39 201 197 3 0Hackensack W3 D1 - Election Day 515 174 33.79 10 10 125 119 1 0Hackensack W3 D2 - Election Day 677 240 35.45 47 48 160 164 1 0Hackensack W3 D3 - Election Day 576 199 34.55 0 0 181 181 0 0Hackensack W3 D4 - Election Day 987 340 34.45 36 33 280 276 2 0Hackensack W3 D5 - Election Day 850 293 34.47 33 33 223 218 5 0Hackensack W4 D1 - Election Day 874 340 38.90 50 54 262 265 2 0Hackensack W4 D2 - Election Day 1607 474 29.50 73 68 358 364 5 0Hackensack W4 D3 - Election Day 1288 459 35.64 84 88 340 336 3 0Hackensack W4 D4 - Election Day 1060 390 36.79 86 81 276 279 2 0Hackensack W4 D5 - Election Day 633 260 41.07 53 50 187 190 0 0Hackensack W5 D1 - Election Day 903 293 32.45 60 65 204 203 5 0Hackensack W5 D2 - Election Day 690 261 37.83 44 55 181 177 5 0Hackensack W5 D3 - Election Day 834 331 39.69 90 79 215 215 2 0Hackensack W5 D4 - Election Day 794 319 40.18 66 64 225 226 2 0Hackensack W5 D5 - Election Day 702 290 41.31 70 67 200 199 4 0Hackensack W5 D6 - Election Day 948 327 34.49 46 50 235 240 5 2Hackensack Mail-In Ballot - Mail-In 0 511 0.00 104 107 371 376 2 0Hackensack Provisional - Provisio 0 84 0.00 8 8 66 66 0 0Leonia 1 - Election Day 876 385 43.95 84 87 267 265 2 0Leonia 2 - Election Day 812 346 42.61 80 79 245 250 1 0Leonia 3 - Election Day 767 301 39.24 53 52 218 220 5 0Leonia 4 - Election Day 787 257 32.66 59 59 167 169 3 0Leonia 5 - Election Day 1171 459 39.20 125 124 291 297 1 0Leonia 6 - Election Day 725 277 38.21 78 82 178 181 5 0Leonia Mail-In Ballot - Mail-In Ballo 0 93 0.00 29 31 63 60 0 0Leonia Provisional - Provisional 0 9 0.00 1 1 8 8 0 0Northvale 1 - Election Day 976 422 43.24 165 158 202 208 2 0Northvale 2 - Election Day 836 317 37.92 138 137 144 147 4 0Northvale 3 - Election Day 1156 464 40.14 174 150 224 226 7 0Northvale Mail-In Ballot - Mail-In B 0 50 0.00 25 24 24 24 0 1Northvale Provisional - Provisiona 0 2 0.00 0 0 2 2 0 0Palisades Park 1 - Election Day 569 132 23.20 29 29 79 84 3 0Palisades Park 2 - Election Day 701 241 34.38 66 68 128 121 0 0Palisades Park 3 - Election Day 696 170 24.43 49 47 105 106 1 0Palisades Park 4 - Election Day 744 186 25.00 51 52 107 104 2 0Palisades Park 5 - Election Day 853 199 23.33 73 78 94 95 2 1Palisades Park 6 - Election Day 1144 291 25.44 93 91 125 135 4 0Palisades Park 7 - Election Day 748 193 25.80 68 68 88 88 3 0Palisades Park 8 - Election Day 944 206 21.82 56 59 120 118 1 0Palisades Park 9 - Election Day 1088 208 19.12 51 53 116 114 2 0Palisades Park Mail-In Ballot - Ma 0 301 0.00 62 70 208 206 4 0Palisades Park Provisional - Provi 0 37 0.00 9 10 23 22 0 0Rockleigh 1 - Election Day 227 81 35.68 50 50 20 21 5 0Rockleigh Mail-In Ballot - Mail-In B 0 15 0.00 3 3 10 10 0 0Rockleigh Provisional - Provisiona 0 1 0.00 0 0 1 1 0 0
November 15, 2017 8:37 am Page 40 of 219

Regi
stra
tion
Ballo
ts C
ast
Turn
out (
%)
GENE
RAL
ASSE
MBL
Y DI
ST 3
7
GINO
P. T
ESSA
RO
ANGE
LA H
ENDR
ICKS
GORD
ON M
. JOH
NSON
VALE
RIE
VAIN
IERI
HUT
TLE
CLAU
DIO
I. BE
LUSI
C
Pers
onal
Cho
ice
GENERAL ASSEMBLY DIST 37
BERGEN COUNTY Statement of VoteBER_20171107_E
Teaneck 1 - Election Day 995 372 37.39 65 68 271 276 2 0Teaneck 2 - Election Day 1310 466 35.57 63 70 352 362 9 0Teaneck 3 - Election Day 1247 545 43.70 96 98 400 405 7 0Teaneck 4 - Election Day 1154 478 41.42 81 81 365 364 2 0Teaneck 5 - Election Day 860 317 36.86 29 34 242 242 5 2Teaneck 6 - Election Day 1021 463 45.35 48 36 346 349 6 0Teaneck 7 - Election Day 1069 430 40.22 56 55 343 344 1 0Teaneck 8 - Election Day 1286 622 48.37 96 100 476 470 10 0Teaneck 9 - Election Day 1261 491 38.94 111 107 331 334 5 0Teaneck 10 - Election Day 1438 477 33.17 159 161 278 277 1 0Teaneck 11 - Election Day 1297 388 29.92 137 135 206 215 5 0Teaneck 12 - Election Day 1440 486 33.75 149 150 286 296 0 2Teaneck 13 - Election Day 1098 527 48.00 14 14 469 460 1 0Teaneck 14 - Election Day 1464 636 43.44 8 10 564 513 6 0Teaneck 15 - Election Day 1080 330 30.56 50 52 233 235 1 0Teaneck 16 - Election Day 750 313 41.73 5 5 273 268 0 2Teaneck 17 - Election Day 1259 524 41.62 26 27 451 451 2 0Teaneck 18 - Election Day 1333 547 41.04 101 100 385 391 4 0Teaneck 19 - Election Day 1147 462 40.28 69 68 351 353 4 0Teaneck 20 - Election Day 830 314 37.83 67 63 226 228 0 0Teaneck 21 - Election Day 1355 459 33.87 57 59 357 360 3 0Teaneck 22 - Election Day 994 354 35.61 47 46 275 266 2 0Teaneck 23 - Election Day 981 341 34.76 15 17 288 283 3 0Teaneck Mail-In Ballot - Mail-In Ba 0 513 0.00 92 90 392 396 4 0Teaneck Provisional - Provisional 0 37 0.00 6 9 26 28 0 0Tenafly 1 - Election Day 778 281 36.12 77 86 174 181 7 0Tenafly 2 - Election Day 631 211 33.44 68 72 125 123 1 0Tenafly 3 - Election Day 592 217 36.66 61 61 140 140 1 0Tenafly 4 - Election Day 824 318 38.59 67 67 220 219 3 0Tenafly 5 - Election Day 728 254 34.89 51 51 181 186 3 0Tenafly 6 - Election Day 636 229 36.01 50 50 164 164 3 0Tenafly 7 - Election Day 708 195 27.54 62 59 118 116 2 0Tenafly 8 - Election Day 835 277 33.17 71 65 183 190 4 0Tenafly 9 - Election Day 847 333 39.32 81 85 232 229 3 0Tenafly 10 - Election Day 687 267 38.86 76 74 166 171 1 0Tenafly 11 - Election Day 824 278 33.74 86 84 174 178 2 0Tenafly 12 - Election Day 960 287 29.90 78 81 158 185 2 0Tenafly Mail-In Ballot - Mail-In Bal 0 196 0.00 36 42 144 145 1 0Tenafly Provisional - Provisional 0 15 0.00 6 6 8 9 1 0
Election Day Totals 124458 44277 35.58 9797 9751 29487 29523 373 24
Mail-In Ballot Totals 0 3052 0.00 756 765 2076 2094 18 3
Provisional Totals 0 338 0.00 57 60 235 238 1 0
District Totals - Absentee
District Grand TotalsCounty 124458 47667 38.30 10610 10576 31798 31855 392 27Alpine 1416 436 30.79 198 189 199 216 5 0Bogota 5053 2147 42.49 629 639 1229 1249 16 5Cresskill 5264 1947 36.99 778 754 949 969 16 0Englewood 16389 6268 38.25 863 865 4661 4606 43 2Englewood Cliffs 3607 1956 54.23 817 809 905 905 16 0Fort Lee 19942 7224 36.23 1828 1812 4541 4545 54 10Hackensack 21248 7796 36.69 1309 1308 5684 5681 68 2Leonia 5138 2127 41.40 509 515 1437 1450 17 0Northvale 2968 1255 42.28 502 469 596 607 13 1
November 15, 2017 8:37 am Page 41 of 219

Regi
stra
tion
Ballo
ts C
ast
Turn
out (
%)
GENE
RAL
ASSE
MBL
Y DI
ST 3
7
GINO
P. T
ESSA
RO
ANGE
LA H
ENDR
ICKS
GORD
ON M
. JOH
NSON
VALE
RIE
VAIN
IERI
HUT
TLE
CLAU
DIO
I. BE
LUSI
C
Pers
onal
Cho
ice
GENERAL ASSEMBLY DIST 37
BERGEN COUNTY Statement of VoteBER_20171107_E
Palisades Park 7487 2164 28.90 607 625 1193 1193 22 1Rockleigh 227 97 42.73 53 53 31 32 5 0Teaneck 26669 10892 40.84 1647 1655 8186 8166 83 6Tenafly 9050 3358 37.10 870 883 2187 2236 34 0
Grand Totals 124458 47667 38.30 10610 10576 31798 31855 392 27
November 15, 2017 8:37 am Page 42 of 219

Regi
stra
tion
Ballo
ts C
ast
Turn
out (
%)
GENE
RAL
ASSE
MBL
Y DI
ST 3
8
WIL
LIAM
LEO
NARD
CHRI
STOP
HER
B. W
OLF
TIM
EUS
TACE
JOSE
PH A
. LAG
ANA
DEV
GOSW
AMI
Pers
onal
Cho
ice
GENERAL ASSEMBLY DIST 38
BERGEN COUNTY Statement of VoteBER_20171107_E
Bergenfield 1 - Election Day 787 282 35.83 101 97 156 160 1 0Bergenfield 2 - Election Day 868 377 43.43 110 106 237 235 0 0Bergenfield 3 - Election Day 791 309 39.06 89 81 177 185 1 0Bergenfield 4 - Election Day 891 319 35.80 94 90 173 184 3 0Bergenfield 5 - Election Day 873 312 35.74 73 77 208 206 0 1Bergenfield 6 - Election Day 873 325 37.23 82 83 202 208 3 2Bergenfield 7 - Election Day 793 269 33.92 71 73 180 176 3 0Bergenfield 8 - Election Day 850 290 34.12 81 83 184 183 0 0Bergenfield 9 - Election Day 842 274 32.54 47 44 189 192 2 0Bergenfield 10 - Election Day 1127 399 35.40 137 133 241 249 0 0Bergenfield 11 - Election Day 950 386 40.63 139 149 223 221 4 0Bergenfield 12 - Election Day 1081 375 34.69 93 88 245 255 2 0Bergenfield 13 - Election Day 1178 414 35.14 93 93 278 284 3 1Bergenfield 14 - Election Day 798 297 37.22 83 83 187 187 2 0Bergenfield 15 - Election Day 1131 387 34.22 109 111 230 233 0 0Bergenfield 16 - Election Day 932 320 34.33 108 110 183 180 0 0Bergenfield 17 - Election Day 866 285 32.91 71 71 181 181 2 0Bergenfield Mail-In Ballot - Mail-In 0 233 0.00 58 61 163 158 1 0Bergenfield Provisional - Provision 0 38 0.00 5 4 25 27 0 0Fair Lawn 1 - Election Day 961 392 40.79 134 134 197 206 6 0Fair Lawn 2 - Election Day 1378 583 42.31 212 218 297 301 13 0Fair Lawn 3 - Election Day 856 367 42.87 146 159 159 159 9 0Fair Lawn 4 - Election Day 1055 450 42.65 146 151 261 260 7 0Fair Lawn 5 - Election Day 672 304 45.24 119 118 152 153 4 1Fair Lawn 6 - Election Day 930 386 41.51 136 138 193 197 14 0Fair Lawn 7 - Election Day 732 334 45.63 109 114 175 171 12 0Fair Lawn 8 - Election Day 898 375 41.76 99 99 226 227 5 0Fair Lawn 9 - Election Day 972 400 41.15 140 141 216 218 3 0Fair Lawn 10 - Election Day 1006 426 42.35 148 154 221 218 5 1Fair Lawn 11 - Election Day 929 411 44.24 134 135 237 233 7 0Fair Lawn 12 - Election Day 763 339 44.43 106 105 204 207 2 0Fair Lawn 13 - Election Day 1052 493 46.86 148 149 301 306 7 0Fair Lawn 14 - Election Day 773 364 47.09 108 108 224 224 2 0Fair Lawn 15 - Election Day 1311 449 34.25 131 132 271 270 6 0Fair Lawn 16 - Election Day 1052 452 42.97 163 166 246 244 4 0Fair Lawn 17 - Election Day 944 377 39.94 152 159 187 182 2 0Fair Lawn 18 - Election Day 797 369 46.30 141 136 200 200 2 0Fair Lawn 19 - Election Day 819 361 44.08 139 151 182 177 1 0Fair Lawn 20 - Election Day 889 349 39.26 119 123 191 188 4 0Fair Lawn 21 - Election Day 1181 457 38.70 175 174 230 227 2 0Fair Lawn 22 - Election Day 838 288 34.37 104 104 146 141 4 0Fair Lawn 23 - Election Day 1011 446 44.11 152 150 236 242 2 0Fair Lawn Mail-In Ballot - Mail-In B 0 496 0.00 146 153 307 307 11 0Fair Lawn Provisional - Provisiona 0 61 0.00 20 20 35 35 1 0Glen Rock 1 - Election Day 1038 497 47.88 190 184 262 266 2 0Glen Rock 2 - Election Day 1143 566 49.52 204 194 324 324 5 0Glen Rock 3 - Election Day 1168 560 47.95 266 249 251 246 2 0Glen Rock 4 - Election Day 967 471 48.71 190 184 225 230 3 0Glen Rock 5 - Election Day 1221 572 46.85 233 208 302 312 3 0Glen Rock 6 - Election Day 942 432 45.86 162 150 238 248 2 2Glen Rock 7 - Election Day 1113 531 47.71 198 187 298 298 3 0Glen Rock 8 - Election Day 832 404 48.56 164 153 215 220 3 0Glen Rock Mail-In Ballot - Mail-In B 0 329 0.00 114 106 201 204 4 0Glen Rock Provisional - Provisiona 0 25 0.00 13 10 10 10 0 0Hasbrouck Heights 1 - Election Da 865 396 45.78 169 167 168 171 3 0Hasbrouck Heights 2 - Election Da 1027 409 39.82 165 164 184 190 1 0Hasbrouck Heights 3 - Election Da 832 348 41.83 144 145 138 134 2 0Hasbrouck Heights 4 - Election Da 963 419 43.51 195 198 169 167 3 0Hasbrouck Heights 5 - Election Da 823 323 39.25 128 129 143 141 2 0
November 15, 2017 8:37 am Page 43 of 219

Regi
stra
tion
Ballo
ts C
ast
Turn
out (
%)
GENE
RAL
ASSE
MBL
Y DI
ST 3
8
WIL
LIAM
LEO
NARD
CHRI
STOP
HER
B. W
OLF
TIM
EUS
TACE
JOSE
PH A
. LAG
ANA
DEV
GOSW
AMI
Pers
onal
Cho
ice
GENERAL ASSEMBLY DIST 38
BERGEN COUNTY Statement of VoteBER_20171107_E
Hasbrouck Heights 6 - Election Da 855 379 44.33 159 166 174 160 3 0Hasbrouck Heights 7 - Election Da 863 357 41.37 151 142 151 150 4 2Hasbrouck Heights 8 - Election Da 985 410 41.62 156 158 205 201 4 0Hasbrouck Heights 9 - Election Da 682 262 38.42 89 92 133 139 2 2Hasbrouck Heights Mail-In Ballot - 0 188 0.00 90 93 79 78 1 0Hasbrouck Heights Provisional - P 0 19 0.00 4 3 9 10 0 0Lodi 1 - Election Day 1349 419 31.06 116 119 220 213 0 0Lodi 2 - Election Day 1382 419 30.32 103 100 230 236 1 0Lodi 3 - Election Day 919 248 26.99 59 59 132 135 3 0Lodi 4 - Election Day 923 234 25.35 30 34 159 156 4 0Lodi 5 - Election Day 999 324 32.43 101 91 172 177 2 0Lodi 6 - Election Day 842 275 32.66 79 84 138 139 6 0Lodi 7 - Election Day 637 214 33.59 60 63 110 113 1 0Lodi 8 - Election Day 1214 380 31.30 100 104 198 197 1 0Lodi 9 - Election Day 987 297 30.09 73 72 160 164 3 0Lodi 10 - Election Day 1134 314 27.69 83 85 170 169 5 0Lodi 11 - Election Day 1166 390 33.45 88 88 228 230 5 0Lodi 12 - Election Day 1102 379 34.39 99 100 179 178 0 0Lodi Mail-In Ballot - Mail-In Ballot 0 225 0.00 80 73 113 112 0 0Lodi Provisional - Provisional 0 30 0.00 7 7 18 18 0 0Maywood 1 - Election Day 926 377 40.71 92 104 269 247 2 0Maywood 2 - Election Day 898 373 41.54 121 129 240 218 0 0Maywood 3 - Election Day 915 379 41.42 121 132 243 225 3 0Maywood 4 - Election Day 905 408 45.08 133 148 251 230 3 0Maywood 5 - Election Day 867 371 42.79 115 131 242 213 2 0Maywood 6 - Election Day 878 378 43.05 120 132 243 220 1 0Maywood 7 - Election Day 689 192 27.87 60 62 126 120 1 0Maywood Mail-In Ballot - Mail-In B 0 160 0.00 52 56 109 95 0 0Maywood Provisional - Provisiona 0 11 0.00 4 4 7 7 0 0New Milford 1 - Election Day 1273 541 42.50 217 208 269 276 1 0New Milford 2 - Election Day 1185 524 44.22 214 218 249 246 2 0New Milford 3 - Election Day 1267 573 45.22 265 265 247 262 6 0New Milford 4 - Election Day 1356 567 41.81 278 276 248 249 4 0New Milford 5 - Election Day 1081 421 38.95 178 168 201 206 1 0New Milford 6 - Election Day 918 323 35.19 108 100 192 199 1 0New Milford 7 - Election Day 778 251 32.26 73 70 148 153 1 0New Milford 8 - Election Day 1404 580 41.31 247 243 266 272 2 0New Milford 9 - Election Day 861 383 44.48 187 189 165 170 5 0New Milford Mail-In Ballot - Mail-In 0 210 0.00 77 77 122 119 0 0New Milford Provisional - Provision 0 32 0.00 11 11 21 21 0 0Oradell 1 - Election Day 977 474 48.52 206 206 223 215 3 0Oradell 2 - Election Day 886 387 43.68 158 158 187 188 5 0Oradell 3 - Election Day 922 450 48.81 190 191 211 210 9 0Oradell 4 - Election Day 934 461 49.36 185 184 230 231 1 0Oradell 5 - Election Day 1122 530 47.24 243 241 244 238 0 0Oradell 6 - Election Day 1122 530 47.24 267 262 213 214 1 0Oradell Mail-In Ballot - Mail-In Ball 0 184 0.00 65 65 112 112 0 0Oradell Provisional - Provisional 0 14 0.00 5 6 9 7 0 0Paramus 1 - Election Day 1250 397 31.76 158 159 187 206 7 0Paramus 2 - Election Day 946 360 38.05 130 138 189 193 3 0Paramus 3 - Election Day 1066 455 42.68 195 186 213 224 4 0Paramus 4 - Election Day 823 304 36.94 125 121 150 159 4 0Paramus 5 - Election Day 746 323 43.30 137 137 156 163 3 1Paramus 6 - Election Day 887 334 37.66 134 138 173 176 1 0Paramus 7 - Election Day 975 441 45.23 186 184 210 217 6 0Paramus 8 - Election Day 911 317 34.80 149 143 125 133 3 0Paramus 9 - Election Day 864 325 37.62 144 141 157 160 5 0Paramus 10 - Election Day 790 294 37.22 120 117 152 154 2 1Paramus 11 - Election Day 740 277 37.43 109 103 140 153 2 0
November 15, 2017 8:37 am Page 44 of 219

Regi
stra
tion
Ballo
ts C
ast
Turn
out (
%)
GENE
RAL
ASSE
MBL
Y DI
ST 3
8
WIL
LIAM
LEO
NARD
CHRI
STOP
HER
B. W
OLF
TIM
EUS
TACE
JOSE
PH A
. LAG
ANA
DEV
GOSW
AMI
Pers
onal
Cho
ice
GENERAL ASSEMBLY DIST 38
BERGEN COUNTY Statement of VoteBER_20171107_E
Paramus 12 - Election Day 1277 521 40.80 254 241 225 242 2 0Paramus 13 - Election Day 625 262 41.92 100 96 142 152 1 0Paramus 14 - Election Day 933 351 37.62 156 150 171 184 3 0Paramus 15 - Election Day 1422 471 33.12 186 176 252 257 4 0Paramus 16 - Election Day 698 308 44.13 130 130 135 137 3 0Paramus 17 - Election Day 841 324 38.53 129 120 167 177 1 0Paramus 18 - Election Day 600 256 42.67 73 71 158 170 2 0Paramus 19 - Election Day 717 332 46.30 131 123 174 184 4 0Paramus 20 - Election Day 832 318 38.22 134 133 151 156 3 0Paramus Mail-In Ballot - Mail-In Ba 0 542 0.00 199 206 294 307 4 0Paramus Provisional - Provisional 0 37 0.00 15 14 19 22 0 0River Edge 1 - Election Day 1133 485 42.81 154 161 284 277 3 0River Edge 2 - Election Day 964 410 42.53 155 152 218 218 3 0River Edge 3 - Election Day 863 371 42.99 127 127 211 212 3 0River Edge 4 - Election Day 935 444 47.49 156 153 256 254 4 0River Edge 5 - Election Day 758 301 39.71 101 100 169 165 2 0River Edge 6 - Election Day 878 347 39.52 115 122 189 188 1 0River Edge 7 - Election Day 914 366 40.04 124 119 208 209 1 0River Edge 8 - Election Day 752 241 32.05 69 79 145 146 2 0River Edge Mail-In Ballot - Mail-In 0 198 0.00 71 71 114 108 2 0River Edge Provisional - Provision 0 7 0.00 4 3 3 4 0 0Rochelle Park 1 - Election Day 1001 472 47.15 152 151 225 218 3 0Rochelle Park 2 - Election Day 894 421 47.09 142 128 207 166 11 0Rochelle Park 3 - Election Day 852 413 48.47 107 83 195 168 8 0Rochelle Park 4 - Election Day 956 432 45.19 161 168 195 164 1 0Rochelle Park Mail-In Ballot - Mail 0 105 0.00 38 43 63 57 1 0Rochelle Park Provisional - Provis 0 16 0.00 5 6 8 8 0 0Saddle Brook 1 - Election Day 778 267 34.32 86 89 141 145 5 0Saddle Brook 2 - Election Day 769 325 42.26 89 98 140 161 8 1Saddle Brook 3 - Election Day 582 236 40.55 59 65 137 138 3 0Saddle Brook 4 - Election Day 892 378 42.38 140 141 172 173 5 0Saddle Brook 5 - Election Day 995 344 34.57 123 131 156 163 6 0Saddle Brook 6 - Election Day 973 424 43.58 164 175 171 166 3 0Saddle Brook 7 - Election Day 598 255 42.64 113 107 97 100 4 1Saddle Brook 8 - Election Day 790 329 41.65 130 133 139 145 4 0Saddle Brook 9 - Election Day 916 369 40.28 144 153 170 172 2 1Saddle Brook 10 - Election Day 857 371 43.29 154 141 162 157 1 0Saddle Brook 11 - Election Day 864 386 44.68 137 141 167 193 4 0Saddle Brook Mail-In Ballot - Mail- 0 144 0.00 51 56 82 79 0 0Saddle Brook Provisional - Provisi 0 18 0.00 4 4 11 12 1 0
Election Day Totals 126444 50851 40.22 18256 18200 26590 26671 431 17
Mail-In Ballot Totals 0 3014 0.00 1041 1060 1759 1736 24 0
Provisional Totals 0 308 0.00 97 92 175 181 2 0
District Totals - Absentee
District Grand TotalsCounty 126444 54173 42.84 19394 19352 28524 28588 457 17Bergenfield 15631 5891 37.69 1644 1637 3662 3704 27 4Fair Lawn 21819 9729 44.59 3327 3391 5294 5293 135 2Glen Rock 8424 4387 52.08 1734 1625 2326 2358 27 2Hasbrouck Heights 7895 3510 44.46 1450 1457 1553 1541 25 4Lodi 12654 4148 32.78 1078 1079 2227 2237 31 0Maywood 6078 2649 43.58 818 898 1730 1575 12 0New Milford 10123 4405 43.51 1855 1825 2128 2173 23 0Oradell 5963 3030 50.81 1319 1313 1429 1415 19 0
November 15, 2017 8:37 am Page 45 of 219

Regi
stra
tion
Ballo
ts C
ast
Turn
out (
%)
GENE
RAL
ASSE
MBL
Y DI
ST 3
8
WIL
LIAM
LEO
NARD
CHRI
STOP
HER
B. W
OLF
TIM
EUS
TACE
JOSE
PH A
. LAG
ANA
DEV
GOSW
AMI
Pers
onal
Cho
ice
GENERAL ASSEMBLY DIST 38
BERGEN COUNTY Statement of VoteBER_20171107_E
Paramus 17943 7549 42.07 3094 3027 3740 3926 67 2River Edge 7197 3170 44.05 1076 1087 1797 1781 21 0Rochelle Park 3703 1859 50.20 605 579 893 781 24 0Saddle Brook 9014 3846 42.67 1394 1434 1745 1804 46 3
Grand Totals 126444 54173 42.84 19394 19352 28524 28588 457 17
November 15, 2017 8:37 am Page 46 of 219

Regi
stra
tion
Ballo
ts C
ast
Turn
out (
%)
GENE
RAL
ASSE
MBL
Y DI
ST 3
9
ROBE
RT A
UTH
HOLL
Y SC
HEPI
SI
JANN
IE C
HUNG
ANNI
E HA
USM
ANN
Pers
onal
Cho
ice
GENERAL ASSEMBLY DIST 39
BERGEN COUNTY Statement of VoteBER_20171107_E
Closter 1 - Election Day 647 279 43.12 91 97 170 163 0Closter 2 - Election Day 905 344 38.01 131 131 205 190 0Closter 3 - Election Day 857 315 36.76 128 132 155 150 0Closter 4 - Election Day 911 337 36.99 133 133 177 174 0Closter 5 - Election Day 824 318 38.59 130 140 167 157 0Closter 6 - Election Day 1084 380 35.06 126 131 237 218 0Closter Mail-In Ballot - Mail-In Ball 0 100 0.00 37 42 60 57 0Closter Provisional - Provisional 0 6 0.00 4 4 2 2 0Demarest 1 - Election Day 1087 481 44.25 192 195 265 264 0Demarest 2 - Election Day 1102 402 36.48 160 165 218 225 0Demarest 3 - Election Day 1113 456 40.97 136 155 287 283 0Demarest Mail-In Ballot - Mail-In B 0 89 0.00 35 36 48 53 0Demarest Provisional - Provisiona 0 9 0.00 2 2 6 6 0Dumont 1 - Election Day 901 324 35.96 138 145 160 155 0Dumont 2 - Election Day 1159 430 37.10 167 171 217 222 0Dumont 3 - Election Day 937 394 42.05 162 164 195 187 0Dumont 4 - Election Day 1213 486 40.07 171 177 271 266 0Dumont 5 - Election Day 1023 407 39.78 153 164 218 219 0Dumont 6 - Election Day 1123 411 36.60 198 205 173 177 2Dumont 7 - Election Day 945 373 39.47 137 149 189 188 0Dumont 8 - Election Day 1150 477 41.48 189 201 240 230 0Dumont 9 - Election Day 1075 402 37.40 172 186 186 184 0Dumont 10 - Election Day 680 306 45.00 129 139 153 145 0Dumont 11 - Election Day 1093 455 41.63 227 228 186 193 0Dumont Mail-In Ballot - Mail-In Ba 0 141 0.00 54 52 84 82 0Dumont Provisional - Provisional 0 22 0.00 7 5 13 16 0Emerson 1 - Election Day 1033 501 48.50 242 259 202 192 0Emerson 2 - Election Day 837 377 45.04 175 186 146 138 0Emerson 3 - Election Day 672 269 40.03 121 136 103 100 0Emerson 4 - Election Day 1065 445 41.78 243 256 155 155 0Emerson 5 - Election Day 813 338 41.57 174 184 141 139 0Emerson 6 - Election Day 605 278 45.95 121 131 128 122 0Emerson Mail-In Ballot - Mail-In Ba 0 122 0.00 62 70 48 49 0Emerson Provisional - Provisional 0 10 0.00 4 3 4 5 0Harrington Park 1 - Election Day 1017 485 47.69 210 216 226 225 0Harrington Park 2 - Election Day 1186 550 46.37 231 242 267 257 0Harrington Park 3 - Election Day 1145 561 49.00 270 292 244 226 0Harrington Park Mail-In Ballot - Ma 0 87 0.00 25 27 56 57 0Harrington Park Provisional - Prov 0 12 0.00 3 3 8 6 0Haworth 1 - Election Day 1295 592 45.71 197 216 325 333 0Haworth 2 - Election Day 1193 550 46.10 192 201 281 299 0Haworth Mail-In Ballot - Mail-In Ba 0 87 0.00 20 23 59 58 0Haworth Provisional - Provisional 0 4 0.00 0 1 3 4 0Hillsdale 1 - Election Day 1036 472 45.56 227 240 198 198 0Hillsdale 2 - Election Day 912 404 44.30 161 169 210 200 0Hillsdale 3 - Election Day 1364 585 42.89 266 279 273 252 1Hillsdale 4 - Election Day 1376 592 43.02 298 314 237 238 0Hillsdale 5 - Election Day 1373 631 45.96 335 350 245 246 0Hillsdale 6 - Election Day 1485 643 43.30 289 296 304 309 0Hillsdale Mail-In Ballot - Mail-In Ba 0 192 0.00 80 84 107 105 0Hillsdale Provisional - Provisional 0 9 0.00 4 4 5 5 0Mahwah 1 - Election Day 1581 771 48.77 415 426 260 252 0Mahwah 2 - Election Day 1236 685 55.42 367 385 231 219 0Mahwah 3 - Election Day 1256 614 48.89 303 319 201 201 0Mahwah 4 - Election Day 1051 522 49.67 239 256 214 213 0Mahwah 5 - Election Day 947 432 45.62 259 262 114 111 0Mahwah 6 - Election Day 1188 545 45.88 307 306 171 177 0Mahwah 7 - Election Day 1536 732 47.66 425 446 222 216 0Mahwah 8 - Election Day 1366 495 36.24 298 295 154 155 0
November 15, 2017 8:37 am Page 47 of 219

Regi
stra
tion
Ballo
ts C
ast
Turn
out (
%)
GENE
RAL
ASSE
MBL
Y DI
ST 3
9
ROBE
RT A
UTH
HOLL
Y SC
HEPI
SI
JANN
IE C
HUNG
ANNI
E HA
USM
ANN
Pers
onal
Cho
ice
GENERAL ASSEMBLY DIST 39
BERGEN COUNTY Statement of VoteBER_20171107_E
Mahwah 9 - Election Day 484 212 43.80 99 111 75 75 0Mahwah 10 - Election Day 1424 650 45.65 283 300 291 286 0Mahwah 11 - Election Day 1595 739 46.33 410 433 255 187 0Mahwah 12 - Election Day 749 378 50.47 180 185 159 162 0Mahwah 13 - Election Day 1063 426 40.08 190 197 193 185 0Mahwah 14 - Election Day 1098 417 37.98 181 184 193 175 0Mahwah Mail-In Ballot - Mail-In Ba 0 385 0.00 178 180 188 183 1Mahwah Provisional - Provisional 0 58 0.00 29 32 28 23 0Montvale 1 - Election Day 738 351 47.56 181 190 135 128 0Montvale 2 - Election Day 1113 528 47.44 274 304 186 185 0Montvale 3 - Election Day 1929 836 43.34 440 471 299 279 0Montvale 4 - Election Day 1849 749 40.51 398 416 286 266 0Montvale Mail-In Ballot - Mail-In Ba 0 164 0.00 81 90 70 70 0Montvale Provisional - Provisional 0 14 0.00 6 7 6 6 0Norwood 1 - Election Day 1761 857 48.67 344 370 433 431 0Norwood 2 - Election Day 1899 821 43.23 350 350 389 421 0Norwood Mail-In Ballot - Mail-In Ba 0 88 0.00 38 35 42 47 0Norwood Provisional - Provisional 0 3 0.00 3 3 0 0 0Oakland 1 - Election Day 1001 452 45.15 196 209 210 214 0Oakland 2 - Election Day 912 394 43.20 203 205 147 149 0Oakland 3 - Election Day 755 331 43.84 167 169 132 135 0Oakland 4 - Election Day 942 428 45.44 212 223 171 175 0Oakland 5 - Election Day 1013 468 46.20 206 215 213 215 0Oakland 6 - Election Day 1232 556 45.13 250 276 250 241 0Oakland 7 - Election Day 1257 546 43.44 289 288 211 212 0Oakland 8 - Election Day 1705 605 35.48 284 289 287 285 0Oakland Mail-In Ballot - Mail-In Ba 0 199 0.00 85 93 106 103 0Oakland Provisional - Provisional 0 7 0.00 5 5 2 2 0Old Tappan 1 - Election Day 1201 435 36.22 227 235 174 174 0Old Tappan 2 - Election Day 1443 477 33.06 238 245 196 194 0Old Tappan 3 - Election Day 1513 497 32.85 249 255 207 199 0Old Tappan Mail-In Ballot - Mail-In 0 128 0.00 66 68 59 54 0Old Tappan Provisional - Provision 0 6 0.00 3 3 3 3 0Park Ridge 1 - Election Day 1195 667 55.82 359 391 236 222 0Park Ridge 2 - Election Day 875 440 50.29 241 256 155 153 0Park Ridge 3 - Election Day 951 507 53.31 290 328 160 151 1Park Ridge 4 - Election Day 868 472 54.38 229 261 191 188 0Park Ridge 5 - Election Day 1088 487 44.76 249 272 183 176 0Park Ridge 6 - Election Day 1174 609 51.87 302 331 241 238 0Park Ridge Mail-In Ballot - Mail-In 0 138 0.00 76 81 58 53 1Park Ridge Provisional - Provision 0 16 0.00 6 7 8 8 0Ramsey 1 - Election Day 1185 529 44.64 225 223 258 259 2Ramsey 2 - Election Day 1482 717 48.38 358 369 289 295 0Ramsey 3 - Election Day 1457 724 49.69 377 384 285 285 0Ramsey 4 - Election Day 785 350 44.59 179 181 137 141 0Ramsey 5 - Election Day 1508 701 46.49 340 356 290 286 0Ramsey 6 - Election Day 1828 718 39.28 327 332 330 323 2Ramsey 7 - Election Day 1242 567 45.65 300 305 215 209 0Ramsey 8 - Election Day 1006 488 48.51 296 309 140 135 0Ramsey Mail-In Ballot - Mail-In Ba 0 280 0.00 146 150 126 124 0Ramsey Provisional - Provisional 0 14 0.00 10 10 4 4 0River Vale 1 - Election Day 1533 578 37.70 290 320 222 224 0River Vale 2 - Election Day 2055 856 41.65 461 466 338 326 0River Vale 3 - Election Day 1486 632 42.53 270 308 282 281 0River Vale 4 - Election Day 1159 476 41.07 225 238 207 208 0River Vale 5 - Election Day 1231 493 40.05 264 263 179 176 0River Vale Mail-In Ballot - Mail-In B 0 134 0.00 60 69 65 61 0River Vale Provisional - Provisiona 0 10 0.00 3 3 4 4 0Saddle River 1 - Election Day 1185 380 32.07 267 263 84 89 0
November 15, 2017 8:37 am Page 48 of 219

Regi
stra
tion
Ballo
ts C
ast
Turn
out (
%)
GENE
RAL
ASSE
MBL
Y DI
ST 3
9
ROBE
RT A
UTH
HOLL
Y SC
HEPI
SI
JANN
IE C
HUNG
ANNI
E HA
USM
ANN
Pers
onal
Cho
ice
GENERAL ASSEMBLY DIST 39
BERGEN COUNTY Statement of VoteBER_20171107_E
Saddle River 2 - Election Day 1452 532 36.64 378 373 113 107 0Saddle River Mail-In Ballot - Mail-I 0 74 0.00 40 43 30 31 0Saddle River Provisional - Provisio 0 8 0.00 5 3 2 3 0Upper Saddle River 1 - Election D 1468 548 37.33 314 333 195 188 0Upper Saddle River 2 - Election D 1049 375 35.75 223 223 120 119 0Upper Saddle River 3 - Election D 1271 447 35.17 272 280 155 146 0Upper Saddle River 4 - Election D 1269 453 35.70 244 243 174 170 0Upper Saddle River 5 - Election D 930 322 34.62 186 190 121 119 0Upper Saddle River Mail-In Ballot 0 126 0.00 56 60 61 61 0Upper Saddle River Provisional - P 0 18 0.00 8 8 10 10 0Washington Township 1 - Election 1346 640 47.55 323 335 239 233 0Washington Township 2 - Election 912 425 46.60 222 238 140 139 0Washington Township 3 - Election 746 373 50.00 177 188 138 134 0Washington Township 4 - Election 1192 512 42.95 269 269 182 190 0Washington Township 5 - Election 1117 549 49.15 287 298 179 186 0Washington Township 6 - Election 1508 680 45.09 373 371 231 231 0Washington Township Mail-In Ball 0 211 0.00 121 131 72 69 0Washington Township Provisional 0 19 0.00 10 10 6 6 0Westwood 1 - Election Day 1114 513 46.05 215 233 243 233 0Westwood 2 - Election Day 959 446 46.51 194 202 207 211 0Westwood 3 - Election Day 605 297 49.09 131 134 143 148 0Westwood 4 - Election Day 894 429 47.99 155 168 239 242 0Westwood 5 - Election Day 707 351 49.65 172 187 151 141 0Westwood 6 - Election Day 1242 469 37.76 148 153 272 276 0Westwood 7 - Election Day 781 356 45.58 185 201 142 145 0Westwood 8 - Election Day 944 445 47.14 214 228 184 186 0Westwood Mail-In Ballot - Mail-In B 0 156 0.00 88 91 66 61 0Westwood Provisional - Provisiona 0 20 0.00 3 3 16 16 0Woodcliff Lake 1 - Election Day 897 425 47.38 179 191 198 191 0Woodcliff Lake 2 - Election Day 1176 556 47.28 256 267 245 250 0Woodcliff Lake 3 - Election Day 983 475 48.32 220 228 216 211 0Woodcliff Lake 4 - Election Day 1427 621 43.52 255 266 289 285 0Woodcliff Lake Mail-In Ballot - Mai 0 170 0.00 83 86 70 69 0Woodcliff Lake Provisional - Provis 0 21 0.00 11 11 7 7 0
Election Day Totals 128355 55629 43.34 26727 27945 23351 22982 8
Mail-In Ballot Totals 0 3071 0.00 1431 1511 1475 1447 2
Provisional Totals 0 286 0.00 126 127 137 136 0
District Totals - Absentee
District Grand TotalsCounty 128355 58986 45.96 28284 29583 24963 24565 10Closter 5228 2079 39.77 780 810 1173 1111 0Demarest 3302 1437 43.52 525 553 824 831 0Dumont 11299 4628 40.96 1904 1986 2285 2264 2Emerson 5025 2340 46.57 1142 1225 927 900 0Harrington Park 3348 1695 50.63 739 780 801 771 0Haworth 2488 1233 49.56 409 441 668 694 0Hillsdale 7546 3528 46.75 1660 1736 1579 1553 1Mahwah 16574 8061 48.64 4163 4317 2949 2820 1Montvale 5629 2642 46.94 1380 1478 982 934 0Norwood 3660 1769 48.33 735 758 864 899 0Oakland 8817 3986 45.21 1897 1972 1729 1731 0Old Tappan 4157 1543 37.12 783 806 639 624 0Park Ridge 6151 3336 54.24 1752 1927 1232 1189 2Ramsey 10493 5088 48.49 2558 2619 2074 2061 4
November 15, 2017 8:37 am Page 49 of 219

Regi
stra
tion
Ballo
ts C
ast
Turn
out (
%)
GENE
RAL
ASSE
MBL
Y DI
ST 3
9
ROBE
RT A
UTH
HOLL
Y SC
HEPI
SI
JANN
IE C
HUNG
ANNI
E HA
USM
ANN
Pers
onal
Cho
ice
GENERAL ASSEMBLY DIST 39
BERGEN COUNTY Statement of VoteBER_20171107_E
River Vale 7464 3179 42.59 1573 1667 1297 1280 0Saddle River 2637 994 37.69 690 682 229 230 0Upper Saddle River 5987 2289 38.23 1303 1337 836 813 0Washington 6821 3409 49.98 1782 1840 1187 1188 0Westwood 7246 3482 48.05 1505 1600 1663 1659 0Woodcliff Lake 4483 2268 50.59 1004 1049 1025 1013 0
Grand Totals 128355 58986 45.96 28284 29583 24963 24565 10
November 15, 2017 8:37 am Page 50 of 219

Regi
stra
tion
Ballo
ts C
ast
Turn
out (
%)
GENE
RAL
ASSE
MBL
Y DI
ST 4
0
CHRI
STOP
HER
P. D
EPHI
LLIP
S
KEVI
N J.
ROO
NEY
PAUL
VAG
IANO
S
CHRI
STIN
E OR
DWAY
ANTH
ONY
J. P
ELLE
CHIA
Pers
onal
Cho
ice
GENERAL ASSEMBLY DIST 40
BERGEN COUNTY Statement of VoteBER_20171107_E
Allendale 1 - Election Day 1618 755 46.66 354 363 332 336 7 0Allendale 2 - Election Day 853 363 42.56 178 176 154 157 3 0Allendale 3 - Election Day 982 456 46.44 243 248 165 173 0 0Allendale 4 - Election Day 1439 606 42.11 341 347 220 231 3 0Allendale Mail-In Ballot - Mail-In B 0 129 0.00 61 65 59 60 0 0Allendale Provisional - Provisional 0 12 0.00 5 5 6 7 0 0Franklin Lakes 1 - Election Day 1044 371 35.54 234 234 102 116 3 0Franklin Lakes 2 - Election Day 1054 398 37.76 222 231 119 133 2 0Franklin Lakes 3 - Election Day 1110 407 36.67 249 255 125 134 1 0Franklin Lakes 4 - Election Day 2024 712 35.18 418 430 221 241 2 0Franklin Lakes 5 - Election Day 1480 531 35.88 332 339 158 166 2 0Franklin Lakes 6 - Election Day 1328 490 36.90 301 307 137 141 0 0Franklin Lakes Mail-In Ballot - Mai 0 240 0.00 115 125 108 115 1 0Franklin Lakes Provisional - Provis 0 20 0.00 10 11 9 9 0 0Ho-Ho-Kus 1 - Election Day 1061 551 51.93 265 272 203 209 6 0Ho-Ho-Kus 2 - Election Day 1104 539 48.82 281 281 201 204 3 0Ho-Ho-Kus 3 - Election Day 914 486 53.17 253 260 184 185 0 0Ho-Ho-Kus Mail-In Ballot - Mail-In 0 89 0.00 29 33 53 54 0 0Ho-Ho-Kus Provisional - Provision 0 13 0.00 4 4 4 4 0 0Midland Park 1 - Election Day 1135 547 48.19 245 245 230 225 7 0Midland Park 2 - Election Day 745 345 46.31 178 174 128 129 3 0Midland Park 3 - Election Day 1151 525 45.61 234 238 233 228 5 0Midland Park 4 - Election Day 896 409 45.65 200 210 154 156 3 0Midland Park 5 - Election Day 1083 526 48.57 278 285 164 172 7 0Midland Park Mail-In Ballot - Mail- 0 104 0.00 37 37 57 60 3 0Midland Park Provisional - Provisio 0 17 0.00 3 3 11 11 0 0Ridgewood 1 - Election Day 809 325 40.17 123 131 177 173 0 0Ridgewood 2 - Election Day 1049 374 35.65 144 141 213 214 2 0Ridgewood 3 - Election Day 940 371 39.47 148 154 197 185 0 0Ridgewood 4 - Election Day 788 311 39.47 111 105 191 184 1 0Ridgewood 5 - Election Day 1023 334 32.65 162 155 159 159 0 0Ridgewood 6 - Election Day 859 376 43.77 115 104 235 237 2 0Ridgewood 7 - Election Day 990 402 40.61 149 147 226 227 3 0Ridgewood 8 - Election Day 724 298 41.16 93 95 184 178 5 0Ridgewood 9 - Election Day 702 305 43.45 88 90 186 190 4 0Ridgewood 10 - Election Day 718 244 33.98 54 62 166 176 0 0Ridgewood 11 - Election Day 979 435 44.43 170 168 235 235 4 0Ridgewood 12 - Election Day 864 369 42.71 133 133 221 214 1 0Ridgewood 13 - Election Day 948 378 39.87 107 113 242 248 1 1Ridgewood 14 - Election Day 1196 489 40.89 165 171 278 275 2 0Ridgewood 15 - Election Day 848 370 43.63 116 134 216 210 1 0Ridgewood 16 - Election Day 695 278 40.00 102 100 165 158 1 0Ridgewood 17 - Election Day 785 320 40.76 137 127 169 162 1 2Ridgewood 18 - Election Day 870 390 44.83 116 123 249 250 0 0Ridgewood 19 - Election Day 821 339 41.29 123 119 192 183 1 0Ridgewood Mail-In Ballot - Mail-In 0 432 0.00 131 132 288 291 2 0Ridgewood Provisional - Provision 0 35 0.00 8 8 26 25 0 0Waldwick 1 - Election Day 1287 574 44.60 221 233 277 290 2 0Waldwick 2 - Election Day 1141 472 41.37 203 207 223 232 5 0Waldwick 3 - Election Day 1088 478 43.93 187 192 234 236 6 0Waldwick 4 - Election Day 1098 481 43.81 236 245 195 200 2 0Waldwick 5 - Election Day 1037 463 44.65 210 217 206 208 2 0Waldwick 6 - Election Day 1001 456 45.55 223 223 184 188 1 0Waldwick Mail-In Ballot - Mail-In B 0 129 0.00 66 71 56 57 1 0Waldwick Provisional - Provisiona 0 16 0.00 6 6 9 10 0 0Wyckoff 1 - Election Day 1382 630 45.59 324 319 264 264 0 0Wyckoff 2 - Election Day 1496 704 47.06 384 366 286 279 6 0Wyckoff 3 - Election Day 1259 542 43.05 294 296 213 212 2 0Wyckoff 4 - Election Day 1421 628 44.19 364 351 248 244 1 0
November 15, 2017 8:37 am Page 51 of 219

Regi
stra
tion
Ballo
ts C
ast
Turn
out (
%)
GENE
RAL
ASSE
MBL
Y DI
ST 4
0
CHRI
STOP
HER
P. D
EPHI
LLIP
S
KEVI
N J.
ROO
NEY
PAUL
VAG
IANO
S
CHRI
STIN
E OR
DWAY
ANTH
ONY
J. P
ELLE
CHIA
Pers
onal
Cho
ice
GENERAL ASSEMBLY DIST 40
BERGEN COUNTY Statement of VoteBER_20171107_E
Wyckoff 5 - Election Day 929 450 48.44 244 244 170 169 1 0Wyckoff 6 - Election Day 1229 556 45.24 295 276 232 233 1 0Wyckoff 7 - Election Day 1270 631 49.69 331 328 262 262 2 0Wyckoff 8 - Election Day 1347 585 43.43 363 350 196 195 0 0Wyckoff 9 - Election Day 876 435 49.66 269 262 154 146 0 0Wyckoff 10 - Election Day 1139 511 44.86 258 257 216 222 0 0Wyckoff Mail-In Ballot - Mail-In Ba 0 439 0.00 192 200 214 226 0 0Wyckoff Provisional - Provisional 0 29 0.00 11 11 17 17 0 0
Election Day Totals 56629 24321 42.95 11568 11633 10691 10774 117 3
Mail-In Ballot Totals 0 1562 0.00 631 663 835 863 7 0
Provisional Totals 0 142 0.00 47 48 82 83 0 0
District Totals - Absentee
District Grand TotalsCounty 56629 26025 45.96 12246 12344 11608 11720 124 3Allendale 4892 2321 47.44 1182 1204 936 964 13 0Franklin Lakes 8040 3169 39.42 1881 1932 979 1055 11 0Ho-Ho-Kus 3079 1678 54.50 832 850 645 656 9 0Midland Park 5010 2473 49.36 1175 1192 977 981 28 0Ridgewood 16608 7175 43.20 2495 2512 4215 4174 31 3Waldwick 6652 3069 46.14 1352 1394 1384 1421 19 0Wyckoff 12348 6140 49.72 3329 3260 2472 2469 13 0
Grand Totals 56629 26025 45.96 12246 12344 11608 11720 124 3
November 15, 2017 8:37 am Page 52 of 219

Regi
stra
tion
Ballo
ts C
ast
Turn
out (
%)
BOAR
D OF
CHO
SEN
RAYM
OND
COTT
IERS
JR.
JOHN
DRI
SCOL
L JR
.
JOAN
M. V
OSS
DAVI
D L.
GAN
Z
Pers
onal
Cho
ice
BOARD OF CHOSEN FREEHOLDERS
BERGEN COUNTY Statement of VoteBER_20171107_E
Allendale 1 - Election Day 1618 755 46.66 364 373 322 317 0Allendale 2 - Election Day 853 363 42.56 170 184 157 157 0Allendale 3 - Election Day 982 456 46.44 239 245 163 165 0Allendale 4 - Election Day 1439 606 42.11 335 340 224 217 0Allendale Mail-In Ballot - Mail-In B 0 129 0.00 61 65 59 58 0Allendale Provisional - Provisional 0 12 0.00 5 5 7 7 0Alpine 1 - Election Day 1416 405 28.60 188 195 181 178 0Alpine Mail-In Ballot - Mail-In Ballo 0 30 0.00 11 10 21 16 0Alpine Provisional - Provisional 0 1 0.00 0 0 1 1 0Bergenfield 1 - Election Day 787 282 35.83 99 110 150 153 0Bergenfield 2 - Election Day 868 377 43.43 113 119 228 221 0Bergenfield 3 - Election Day 791 309 39.06 84 93 172 175 0Bergenfield 4 - Election Day 891 319 35.80 92 100 180 177 0Bergenfield 5 - Election Day 873 312 35.74 76 85 203 208 0Bergenfield 6 - Election Day 873 325 37.23 78 90 197 201 2Bergenfield 7 - Election Day 793 269 33.92 74 77 179 175 0Bergenfield 8 - Election Day 850 290 34.12 83 87 178 179 0Bergenfield 9 - Election Day 842 274 32.54 47 48 189 183 0Bergenfield 10 - Election Day 1127 399 35.40 129 147 227 236 0Bergenfield 11 - Election Day 950 386 40.63 151 166 205 212 0Bergenfield 12 - Election Day 1081 375 34.69 89 97 247 238 0Bergenfield 13 - Election Day 1178 414 35.14 95 106 265 272 0Bergenfield 14 - Election Day 798 297 37.22 84 94 186 182 0Bergenfield 15 - Election Day 1131 387 34.22 114 129 217 215 0Bergenfield 16 - Election Day 932 320 34.33 112 122 173 171 0Bergenfield 17 - Election Day 866 285 32.91 72 79 176 176 0Bergenfield Mail-In Ballot - Mail-In 0 233 0.00 62 66 162 157 0Bergenfield Provisional - Provision 0 38 0.00 5 6 24 24 0Bogota 1 - Election Day 807 331 41.02 104 114 186 186 0Bogota 2 - Election Day 1014 364 35.90 86 94 225 223 0Bogota 3 - Election Day 953 346 36.31 114 123 182 185 0Bogota 4 - Election Day 909 400 44.00 136 140 200 198 0Bogota 5 - Election Day 562 254 45.20 85 87 124 123 2Bogota 6 - Election Day 808 318 39.36 88 90 198 196 0Bogota Mail-In Ballot - Mail-In Ball 0 114 0.00 55 57 56 54 0Bogota Provisional - Provisional 0 20 0.00 4 6 12 14 0Carlstadt 1 - Election Day 633 270 42.65 125 125 101 98 0Carlstadt 2 - Election Day 822 326 39.66 128 130 157 151 0Carlstadt 3 - Election Day 714 283 39.64 94 104 152 146 0Carlstadt 4 - Election Day 780 316 40.51 113 124 151 149 0Carlstadt 5 - Election Day 753 287 38.11 103 115 128 131 0Carlstadt Mail-In Ballot - Mail-In Ba 0 78 0.00 36 39 34 35 0Carlstadt Provisional - Provisional 0 5 0.00 0 0 5 5 0Cliffside Park 1 - Election Day 770 228 29.61 37 38 161 163 0Cliffside Park 2 - Election Day 822 227 27.62 31 34 165 170 0Cliffside Park 3 - Election Day 815 227 27.85 34 36 171 166 0Cliffside Park 4 - Election Day 1213 471 38.83 113 116 320 313 0Cliffside Park 5 - Election Day 726 215 29.61 38 37 147 150 0Cliffside Park 6 - Election Day 759 271 35.70 56 58 189 187 0Cliffside Park 7 - Election Day 800 236 29.50 59 65 149 148 0Cliffside Park 8 - Election Day 817 325 39.78 68 65 214 207 0Cliffside Park 9 - Election Day 644 204 31.68 60 60 126 126 0Cliffside Park 10 - Election Day 1128 349 30.94 81 83 240 236 0Cliffside Park 11 - Election Day 593 161 27.15 45 47 97 94 0Cliffside Park 12 - Election Day 548 160 29.20 39 40 110 108 0Cliffside Park 13 - Election Day 886 307 34.65 66 67 208 202 0Cliffside Park 14 - Election Day 748 326 43.58 114 113 185 182 0Cliffside Park 15 - Election Day 777 313 40.28 84 94 191 188 2Cliffside Park Mail-In Ballot - Mail- 0 199 0.00 46 49 140 137 0
November 15, 2017 8:37 am Page 53 of 219

Regi
stra
tion
Ballo
ts C
ast
Turn
out (
%)
BOAR
D OF
CHO
SEN
RAYM
OND
COTT
IERS
JR.
JOHN
DRI
SCOL
L JR
.
JOAN
M. V
OSS
DAVI
D L.
GAN
Z
Pers
onal
Cho
ice
BOARD OF CHOSEN FREEHOLDERS
BERGEN COUNTY Statement of VoteBER_20171107_E
Cliffside Park Provisional - Provisio 0 25 0.00 5 5 17 17 0Closter 1 - Election Day 647 279 43.12 100 99 158 148 1Closter 2 - Election Day 905 344 38.01 130 138 188 189 0Closter 3 - Election Day 857 315 36.76 127 127 153 151 0Closter 4 - Election Day 911 337 36.99 128 138 164 168 1Closter 5 - Election Day 824 318 38.59 132 138 152 153 0Closter 6 - Election Day 1084 380 35.06 128 135 215 212 0Closter Mail-In Ballot - Mail-In Ball 0 100 0.00 36 40 59 58 0Closter Provisional - Provisional 0 6 0.00 3 3 3 3 0Cresskill 1 - Election Day 815 300 36.81 117 117 142 133 0Cresskill 2 - Election Day 928 315 33.94 93 106 183 178 0Cresskill 3 - Election Day 1480 496 33.51 215 220 223 227 0Cresskill 4 - Election Day 781 278 35.60 112 121 129 132 0Cresskill 5 - Election Day 601 250 41.60 101 108 116 116 0Cresskill 6 - Election Day 659 245 37.18 95 104 118 113 0Cresskill Mail-In Ballot - Mail-In Ba 0 59 0.00 25 25 30 29 0Cresskill Provisional - Provisional 0 4 0.00 0 0 3 3 0Demarest 1 - Election Day 1087 481 44.25 181 194 259 265 0Demarest 2 - Election Day 1102 402 36.48 157 163 221 214 0Demarest 3 - Election Day 1113 456 40.97 146 152 269 273 0Demarest Mail-In Ballot - Mail-In B 0 89 0.00 31 35 53 51 0Demarest Provisional - Provisiona 0 9 0.00 2 3 6 6 0Dumont 1 - Election Day 901 324 35.96 138 142 155 155 0Dumont 2 - Election Day 1159 430 37.10 158 172 217 222 1Dumont 3 - Election Day 937 394 42.05 152 160 198 201 0Dumont 4 - Election Day 1213 486 40.07 168 177 271 270 0Dumont 5 - Election Day 1023 407 39.78 157 158 220 213 0Dumont 6 - Election Day 1123 411 36.60 185 197 180 181 2Dumont 7 - Election Day 945 373 39.47 120 140 200 205 0Dumont 8 - Election Day 1150 477 41.48 190 199 241 239 0Dumont 9 - Election Day 1075 402 37.40 162 170 191 191 0Dumont 10 - Election Day 680 306 45.00 128 133 154 144 0Dumont 11 - Election Day 1093 455 41.63 219 225 192 190 0Dumont Mail-In Ballot - Mail-In Ba 0 141 0.00 50 53 87 84 0Dumont Provisional - Provisional 0 22 0.00 6 8 13 13 0East Rutherford 1 - Election Day 1198 385 32.14 94 105 248 243 0East Rutherford 2 - Election Day 1080 414 38.33 131 137 202 199 0East Rutherford 3 - Election Day 881 373 42.34 120 125 188 182 0East Rutherford 4 - Election Day 1901 786 41.35 315 331 342 333 0East Rutherford Mail-In Ballot - Ma 0 85 0.00 24 29 49 47 0East Rutherford Provisional - Prov 0 12 0.00 2 2 8 9 0Edgewater 1 - Election Day 1072 335 31.25 57 61 240 238 0Edgewater 2 - Election Day 1385 405 29.24 81 79 292 282 0Edgewater 3 - Election Day 1416 469 33.12 121 118 308 294 0Edgewater 4 - Election Day 1898 486 25.61 110 107 341 329 0Edgewater Mail-In Ballot - Mail-In 0 123 0.00 34 30 87 79 2Edgewater Provisional - Provisiona 0 16 0.00 3 3 11 11 0Elmwood Park 1 - Election Day 1427 492 34.48 168 182 226 217 0Elmwood Park 2 - Election Day 1446 464 32.09 140 147 229 228 0Elmwood Park 3 - Election Day 943 380 40.30 126 138 183 173 0Elmwood Park 4 - Election Day 809 246 30.41 60 60 150 142 0Elmwood Park 5 - Election Day 860 333 38.72 101 112 181 183 0Elmwood Park 6 - Election Day 714 224 31.37 53 54 138 137 0Elmwood Park 7 - Election Day 1146 437 38.13 141 156 212 211 0Elmwood Park 8 - Election Day 1919 563 29.34 199 209 256 242 2Elmwood Park 9 - Election Day 1183 353 29.84 123 144 133 134 0Elmwood Park 10 - Election Day 1470 495 33.67 189 209 213 212 0Elmwood Park Mail-In Ballot - Mai 0 605 0.00 134 146 385 381 0Elmwood Park Provisional - Provis 0 61 0.00 18 17 28 27 0
November 15, 2017 8:37 am Page 54 of 219

Regi
stra
tion
Ballo
ts C
ast
Turn
out (
%)
BOAR
D OF
CHO
SEN
RAYM
OND
COTT
IERS
JR.
JOHN
DRI
SCOL
L JR
.
JOAN
M. V
OSS
DAVI
D L.
GAN
Z
Pers
onal
Cho
ice
BOARD OF CHOSEN FREEHOLDERS
BERGEN COUNTY Statement of VoteBER_20171107_E
Emerson 1 - Election Day 1033 501 48.50 223 232 210 199 0Emerson 2 - Election Day 837 377 45.04 169 175 138 139 0Emerson 3 - Election Day 672 269 40.03 115 121 108 105 0Emerson 4 - Election Day 1065 445 41.78 221 234 163 157 0Emerson 5 - Election Day 813 338 41.57 155 163 158 159 0Emerson 6 - Election Day 605 278 45.95 111 119 129 132 0Emerson Mail-In Ballot - Mail-In Ba 0 122 0.00 57 62 58 55 0Emerson Provisional - Provisional 0 10 0.00 3 3 6 4 0Englewood W1 D1 - Election Day 1396 527 37.75 136 143 325 316 0Englewood W1 D2 - Election Day 862 361 41.88 114 124 197 197 0Englewood W1 D3 - Election Day 793 285 35.94 29 30 222 221 0Englewood W1 D4 - Election Day 869 320 36.82 19 20 243 248 0Englewood W2 D1 - Election Day 816 310 37.99 100 105 167 167 0Englewood W2 D2 - Election Day 723 266 36.79 108 111 110 117 0Englewood W2 D3 - Election Day 1145 371 32.40 111 112 217 214 0Englewood W2 D4 - Election Day 1823 466 25.56 68 72 347 346 0Englewood W3 D1 - Election Day 860 290 33.72 21 20 216 211 0Englewood W3 D2 - Election Day 1411 574 40.68 41 43 453 447 0Englewood W3 D3 - Election Day 706 322 45.61 15 18 274 272 0Englewood W3 D4 - Election Day 999 409 40.94 15 15 335 342 0Englewood W4 D1 - Election Day 679 215 31.66 2 3 177 170 0Englewood W4 D2 - Election Day 1167 474 40.62 15 19 380 380 0Englewood W4 D3 - Election Day 1102 388 35.21 8 10 331 332 0Englewood W4 D4 - Election Day 1038 326 31.41 15 15 268 266 0Englewood Mail-In Ballot - Mail-In 0 324 0.00 47 53 247 250 0Englewood Provisional - Provision 0 40 0.00 3 3 29 29 0Englewood Cliffs 1 - Election Day 1056 439 41.57 187 193 205 197 0Englewood Cliffs 2 - Election Day 874 379 43.36 163 169 167 156 0Englewood Cliffs 3 - Election Day 880 402 45.68 147 148 191 183 0Englewood Cliffs 4 - Election Day 797 327 41.03 148 153 138 135 0Englewood Cliffs Mail-In Ballot - M 0 383 0.00 169 167 168 170 2Englewood Cliffs Provisional - Pro 0 26 0.00 8 7 16 14 0Fair Lawn 1 - Election Day 961 392 40.79 146 149 192 186 0Fair Lawn 2 - Election Day 1378 583 42.31 206 228 296 303 0Fair Lawn 3 - Election Day 856 367 42.87 147 160 162 158 0Fair Lawn 4 - Election Day 1055 450 42.65 156 160 252 251 0Fair Lawn 5 - Election Day 672 304 45.24 111 122 152 155 1Fair Lawn 6 - Election Day 930 386 41.51 142 152 193 202 0Fair Lawn 7 - Election Day 732 334 45.63 107 113 178 187 0Fair Lawn 8 - Election Day 898 375 41.76 100 107 219 222 0Fair Lawn 9 - Election Day 972 400 41.15 143 148 206 211 0Fair Lawn 10 - Election Day 1006 426 42.35 155 161 213 203 0Fair Lawn 11 - Election Day 929 411 44.24 131 139 233 234 0Fair Lawn 12 - Election Day 763 339 44.43 109 116 189 187 0Fair Lawn 13 - Election Day 1052 493 46.86 146 154 304 297 0Fair Lawn 14 - Election Day 773 364 47.09 110 113 227 213 0Fair Lawn 15 - Election Day 1311 449 34.25 125 141 262 268 0Fair Lawn 16 - Election Day 1052 452 42.97 164 167 251 240 0Fair Lawn 17 - Election Day 944 377 39.94 149 156 184 181 2Fair Lawn 18 - Election Day 797 369 46.30 131 144 195 203 0Fair Lawn 19 - Election Day 819 361 44.08 148 154 178 167 0Fair Lawn 20 - Election Day 889 349 39.26 121 121 185 189 0Fair Lawn 21 - Election Day 1181 457 38.70 176 182 227 229 0Fair Lawn 22 - Election Day 838 288 34.37 101 113 138 146 0Fair Lawn 23 - Election Day 1011 446 44.11 140 163 238 248 0Fair Lawn Mail-In Ballot - Mail-In B 0 496 0.00 142 164 305 307 0Fair Lawn Provisional - Provisiona 0 61 0.00 17 19 37 40 0Fairview 1 - Election Day 757 255 33.69 29 31 175 170 0Fairview 2 - Election Day 1265 396 31.30 73 76 252 258 0
November 15, 2017 8:37 am Page 55 of 219

Regi
stra
tion
Ballo
ts C
ast
Turn
out (
%)
BOAR
D OF
CHO
SEN
RAYM
OND
COTT
IERS
JR.
JOHN
DRI
SCOL
L JR
.
JOAN
M. V
OSS
DAVI
D L.
GAN
Z
Pers
onal
Cho
ice
BOARD OF CHOSEN FREEHOLDERS
BERGEN COUNTY Statement of VoteBER_20171107_E
Fairview 3 - Election Day 941 297 31.56 63 62 174 169 0Fairview 4 - Election Day 860 258 30.00 50 51 160 162 0Fairview 5 - Election Day 1334 428 32.08 64 72 283 290 0Fairview 6 - Election Day 165 85 51.52 15 14 50 45 0Fairview Mail-In Ballot - Mail-In Ba 0 64 0.00 24 27 36 34 0Fairview Provisional - Provisional 0 8 0.00 0 1 7 7 0Fort Lee 1 - Election Day 1117 383 34.29 136 129 210 174 0Fort Lee 2 - Election Day 768 271 35.29 65 63 180 156 2Fort Lee 3 - Election Day 1454 495 34.04 149 147 304 293 0Fort Lee 4 - Election Day 583 269 46.14 78 81 159 157 0Fort Lee 5 - Election Day 908 301 33.15 82 89 172 157 0Fort Lee 6 - Election Day 1556 506 32.52 126 130 341 325 0Fort Lee 7 - Election Day 2142 777 36.27 161 170 514 499 0Fort Lee 8 - Election Day 609 158 25.94 33 39 103 102 0Fort Lee 9 - Election Day 687 203 29.55 73 74 109 98 0Fort Lee 10 - Election Day 2683 836 31.16 192 204 571 565 0Fort Lee 11 - Election Day 683 226 33.09 37 38 160 151 0Fort Lee 12 - Election Day 1270 380 29.92 86 88 255 246 0Fort Lee 13 - Election Day 737 269 36.50 50 49 204 189 0Fort Lee 14 - Election Day 607 223 36.74 40 41 161 162 0Fort Lee 15 - Election Day 777 217 27.93 57 60 137 131 0Fort Lee 16 - Election Day 1013 330 32.58 82 90 206 191 0Fort Lee 17 - Election Day 503 203 40.36 68 65 116 114 0Fort Lee 18 - Election Day 471 169 35.88 51 56 101 94 0Fort Lee 19 - Election Day 1374 483 35.15 81 81 367 354 0Fort Lee Mail-In Ballot - Mail-In Ba 0 463 0.00 96 106 340 335 2Fort Lee Provisional - Provisional 0 62 0.00 11 12 43 40 0Franklin Lakes 1 - Election Day 1044 371 35.54 231 236 101 104 0Franklin Lakes 2 - Election Day 1054 398 37.76 226 240 115 112 0Franklin Lakes 3 - Election Day 1110 407 36.67 252 256 129 128 0Franklin Lakes 4 - Election Day 2024 712 35.18 417 431 216 216 0Franklin Lakes 5 - Election Day 1480 531 35.88 343 350 148 149 0Franklin Lakes 6 - Election Day 1328 490 36.90 311 316 128 126 0Franklin Lakes Mail-In Ballot - Mai 0 240 0.00 120 123 113 107 0Franklin Lakes Provisional - Provis 0 20 0.00 12 15 5 6 0Garfield W1 D1 - Election Day 841 187 22.24 45 47 100 98 0Garfield W1 D2 - Election Day 495 103 20.81 17 17 65 65 0Garfield W1 D3 - Election Day 994 204 20.52 43 49 118 118 0Garfield W2 D1 - Election Day 1036 205 19.79 55 54 100 96 0Garfield W2 D2 - Election Day 1016 295 29.04 86 90 152 153 0Garfield W2 D3 - Election Day 747 195 26.10 49 63 100 99 0Garfield W3 D1 - Election Day 1114 253 22.71 41 42 161 162 2Garfield W3 D2 - Election Day 1099 291 26.48 52 56 179 186 0Garfield W3 D3 - Election Day 933 265 28.40 66 75 148 147 0Garfield W4 D1 - Election Day 1193 299 25.06 84 92 159 160 0Garfield W4 D2 - Election Day 856 231 26.99 63 73 112 110 0Garfield W4 D3 - Election Day 754 147 19.50 42 49 76 72 0Garfield W5 D1 - Election Day 1515 386 25.48 110 110 207 201 0Garfield W5 D2 - Election Day 869 250 28.77 72 82 138 131 1Garfield W5 D3 - Election Day 575 191 33.22 66 69 101 97 0Garfield Mail-In Ballot - Mail-In Ba 0 167 0.00 53 61 94 95 0Garfield Provisional - Provisional 0 23 0.00 3 3 17 17 0Glen Rock 1 - Election Day 1038 497 47.88 181 186 267 263 0Glen Rock 2 - Election Day 1143 566 49.52 185 191 335 332 0Glen Rock 3 - Election Day 1168 560 47.95 251 254 250 242 0Glen Rock 4 - Election Day 967 471 48.71 185 189 224 223 0Glen Rock 5 - Election Day 1221 572 46.85 203 217 313 311 0Glen Rock 6 - Election Day 942 432 45.86 154 166 228 225 2Glen Rock 7 - Election Day 1113 531 47.71 184 194 300 274 0
November 15, 2017 8:37 am Page 56 of 219

Regi
stra
tion
Ballo
ts C
ast
Turn
out (
%)
BOAR
D OF
CHO
SEN
RAYM
OND
COTT
IERS
JR.
JOHN
DRI
SCOL
L JR
.
JOAN
M. V
OSS
DAVI
D L.
GAN
Z
Pers
onal
Cho
ice
BOARD OF CHOSEN FREEHOLDERS
BERGEN COUNTY Statement of VoteBER_20171107_E
Glen Rock 8 - Election Day 832 404 48.56 151 164 213 212 2Glen Rock Mail-In Ballot - Mail-In B 0 329 0.00 99 111 202 200 0Glen Rock Provisional - Provisiona 0 25 0.00 8 10 11 11 0Hackensack W1 D1 - Election Day 787 223 28.34 46 52 139 143 0Hackensack W1 D2 - Election Day 778 249 32.01 42 46 160 156 0Hackensack W1 D3 - Election Day 853 249 29.19 47 49 149 158 0Hackensack W1 D4 - Election Day 749 171 22.83 26 30 120 118 0Hackensack W2 D1 - Election Day 520 140 26.92 11 14 111 117 0Hackensack W2 D2 - Election Day 1120 352 31.43 52 54 256 259 0Hackensack W2 D3 - Election Day 1067 320 29.99 36 46 248 249 0Hackensack W2 D4 - Election Day 729 248 34.02 53 54 167 165 0Hackensack W2 D5 - Election Day 707 259 36.63 40 43 198 195 0Hackensack W3 D1 - Election Day 515 174 33.79 10 11 118 117 0Hackensack W3 D2 - Election Day 677 240 35.45 49 53 157 154 0Hackensack W3 D3 - Election Day 576 199 34.55 0 2 181 166 0Hackensack W3 D4 - Election Day 987 340 34.45 31 36 279 275 0Hackensack W3 D5 - Election Day 850 293 34.47 31 34 215 216 0Hackensack W4 D1 - Election Day 874 340 38.90 51 53 265 267 0Hackensack W4 D2 - Election Day 1607 474 29.50 74 75 360 358 0Hackensack W4 D3 - Election Day 1288 459 35.64 82 82 340 338 0Hackensack W4 D4 - Election Day 1060 390 36.79 83 87 278 279 0Hackensack W4 D5 - Election Day 633 260 41.07 46 48 193 195 0Hackensack W5 D1 - Election Day 903 293 32.45 55 66 204 171 0Hackensack W5 D2 - Election Day 690 261 37.83 49 52 178 176 0Hackensack W5 D3 - Election Day 834 331 39.69 97 97 214 212 0Hackensack W5 D4 - Election Day 794 319 40.18 69 69 219 221 0Hackensack W5 D5 - Election Day 702 290 41.31 63 72 194 199 0Hackensack W5 D6 - Election Day 948 327 34.49 45 50 240 238 1Hackensack Mail-In Ballot - Mail-In 0 511 0.00 104 116 369 369 0Hackensack Provisional - Provisio 0 84 0.00 9 8 65 63 0Harrington Park 1 - Election Day 1017 485 47.69 193 204 226 224 0Harrington Park 2 - Election Day 1186 550 46.37 221 233 270 267 0Harrington Park 3 - Election Day 1145 561 49.00 250 257 247 231 0Harrington Park Mail-In Ballot - Ma 0 87 0.00 27 29 51 51 0Harrington Park Provisional - Prov 0 12 0.00 3 5 8 8 0Hasbrouck Heights 1 - Election Da 865 396 45.78 168 170 162 163 0Hasbrouck Heights 2 - Election Da 1027 409 39.82 164 164 167 178 0Hasbrouck Heights 3 - Election Da 832 348 41.83 146 155 128 124 0Hasbrouck Heights 4 - Election Da 963 419 43.51 188 196 170 159 0Hasbrouck Heights 5 - Election Da 823 323 39.25 127 146 121 128 0Hasbrouck Heights 6 - Election Da 855 379 44.33 155 180 157 152 0Hasbrouck Heights 7 - Election Da 863 357 41.37 150 157 152 144 2Hasbrouck Heights 8 - Election Da 985 410 41.62 161 164 199 186 0Hasbrouck Heights 9 - Election Da 682 262 38.42 89 95 140 135 2Hasbrouck Heights Mail-In Ballot - 0 188 0.00 89 98 75 75 0Hasbrouck Heights Provisional - P 0 19 0.00 4 5 8 9 0Haworth 1 - Election Day 1295 592 45.71 192 213 321 311 0Haworth 2 - Election Day 1193 550 46.10 188 204 280 236 0Haworth Mail-In Ballot - Mail-In Ba 0 87 0.00 21 22 57 56 0Haworth Provisional - Provisional 0 4 0.00 0 0 4 4 0Hillsdale 1 - Election Day 1036 472 45.56 228 232 200 195 0Hillsdale 2 - Election Day 912 404 44.30 140 160 197 193 2Hillsdale 3 - Election Day 1364 585 42.89 220 259 273 267 0Hillsdale 4 - Election Day 1376 592 43.02 270 291 248 242 0Hillsdale 5 - Election Day 1373 631 45.96 333 346 236 231 0Hillsdale 6 - Election Day 1485 643 43.30 283 291 291 304 0Hillsdale Mail-In Ballot - Mail-In Ba 0 192 0.00 70 81 106 112 0Hillsdale Provisional - Provisional 0 9 0.00 4 4 5 5 0Ho-Ho-Kus 1 - Election Day 1061 551 51.93 261 258 204 196 0
November 15, 2017 8:37 am Page 57 of 219

Regi
stra
tion
Ballo
ts C
ast
Turn
out (
%)
BOAR
D OF
CHO
SEN
RAYM
OND
COTT
IERS
JR.
JOHN
DRI
SCOL
L JR
.
JOAN
M. V
OSS
DAVI
D L.
GAN
Z
Pers
onal
Cho
ice
BOARD OF CHOSEN FREEHOLDERS
BERGEN COUNTY Statement of VoteBER_20171107_E
Ho-Ho-Kus 2 - Election Day 1104 539 48.82 272 285 200 191 0Ho-Ho-Kus 3 - Election Day 914 486 53.17 248 258 166 180 0Ho-Ho-Kus Mail-In Ballot - Mail-In 0 89 0.00 29 30 55 53 0Ho-Ho-Kus Provisional - Provision 0 13 0.00 4 4 4 4 0Leonia 1 - Election Day 876 385 43.95 91 92 260 252 0Leonia 2 - Election Day 812 346 42.61 62 85 245 240 0Leonia 3 - Election Day 767 301 39.24 43 49 222 218 0Leonia 4 - Election Day 787 257 32.66 62 64 162 156 0Leonia 5 - Election Day 1171 459 39.20 116 122 296 293 0Leonia 6 - Election Day 725 277 38.21 81 80 174 174 0Leonia Mail-In Ballot - Mail-In Ballo 0 93 0.00 33 36 54 56 0Leonia Provisional - Provisional 0 9 0.00 1 1 8 8 0Little Ferry 1 - Election Day 809 277 34.24 96 102 152 156 0Little Ferry 2 - Election Day 611 190 31.10 57 61 116 108 0Little Ferry 3 - Election Day 1114 304 27.29 93 98 176 171 0Little Ferry 4 - Election Day 838 261 31.15 86 91 151 148 0Little Ferry 5 - Election Day 1192 305 25.59 76 84 172 184 0Little Ferry 6 - Election Day 796 248 31.16 75 92 138 130 0Little Ferry Mail-In Ballot - Mail-In 0 101 0.00 26 39 64 57 0Little Ferry Provisional - Provisiona 0 10 0.00 4 5 4 5 0Lodi 1 - Election Day 1349 419 31.06 119 124 209 194 0Lodi 2 - Election Day 1382 419 30.32 107 113 224 220 0Lodi 3 - Election Day 919 248 26.99 55 48 132 131 0Lodi 4 - Election Day 923 234 25.35 28 29 160 158 0Lodi 5 - Election Day 999 324 32.43 99 99 176 165 0Lodi 6 - Election Day 842 275 32.66 83 71 138 130 0Lodi 7 - Election Day 637 214 33.59 62 66 108 104 0Lodi 8 - Election Day 1214 380 31.30 103 103 193 187 0Lodi 9 - Election Day 987 297 30.09 76 74 160 155 0Lodi 10 - Election Day 1134 314 27.69 82 86 173 169 0Lodi 11 - Election Day 1166 390 33.45 86 87 228 224 0Lodi 12 - Election Day 1102 379 34.39 98 106 171 170 0Lodi Mail-In Ballot - Mail-In Ballot 0 225 0.00 76 81 116 111 0Lodi Provisional - Provisional 0 30 0.00 7 7 19 18 0Lyndhurst 1 - Election Day 748 275 36.76 95 109 122 122 0Lyndhurst 2 - Election Day 748 243 32.49 80 88 101 99 0Lyndhurst 3 - Election Day 1199 340 28.36 112 121 163 161 0Lyndhurst 4 - Election Day 867 341 39.33 114 108 150 147 0Lyndhurst 5 - Election Day 745 271 36.38 83 88 128 119 0Lyndhurst 6 - Election Day 1017 328 32.25 85 117 159 139 0Lyndhurst 7 - Election Day 775 285 36.77 101 107 110 111 0Lyndhurst 8 - Election Day 860 320 37.21 103 108 146 144 0Lyndhurst 9 - Election Day 708 276 38.98 82 86 137 133 0Lyndhurst 10 - Election Day 953 359 37.67 113 128 160 157 0Lyndhurst 11 - Election Day 793 342 43.13 115 132 130 155 0Lyndhurst 12 - Election Day 702 280 39.89 102 106 103 101 0Lyndhurst 13 - Election Day 929 294 31.65 94 100 126 118 0Lyndhurst 14 - Election Day 747 253 33.87 79 86 108 104 0Lyndhurst 15 - Election Day 843 293 34.76 88 96 130 130 0Lyndhurst Mail-In Ballot - Mail-In B 0 329 0.00 133 140 147 142 0Lyndhurst Provisional - Provisiona 0 22 0.00 9 10 8 9 0Mahwah 1 - Election Day 1581 771 48.77 394 412 264 263 0Mahwah 2 - Election Day 1236 685 55.42 346 358 231 231 0Mahwah 3 - Election Day 1256 614 48.89 290 302 210 212 0Mahwah 4 - Election Day 1051 522 49.67 230 241 207 199 0Mahwah 5 - Election Day 947 432 45.62 249 254 118 116 0Mahwah 6 - Election Day 1188 545 45.88 306 299 167 172 0Mahwah 7 - Election Day 1536 732 47.66 415 425 222 226 0Mahwah 8 - Election Day 1366 495 36.24 298 298 136 137 0
November 15, 2017 8:37 am Page 58 of 219

Regi
stra
tion
Ballo
ts C
ast
Turn
out (
%)
BOAR
D OF
CHO
SEN
RAYM
OND
COTT
IERS
JR.
JOHN
DRI
SCOL
L JR
.
JOAN
M. V
OSS
DAVI
D L.
GAN
Z
Pers
onal
Cho
ice
BOARD OF CHOSEN FREEHOLDERS
BERGEN COUNTY Statement of VoteBER_20171107_E
Mahwah 9 - Election Day 484 212 43.80 99 101 79 77 0Mahwah 10 - Election Day 1424 650 45.65 269 281 295 287 0Mahwah 11 - Election Day 1595 739 46.33 392 401 253 245 0Mahwah 12 - Election Day 749 378 50.47 178 187 160 147 0Mahwah 13 - Election Day 1063 426 40.08 189 187 191 189 0Mahwah 14 - Election Day 1098 417 37.98 173 177 190 181 0Mahwah Mail-In Ballot - Mail-In Ba 0 385 0.00 174 179 195 187 1Mahwah Provisional - Provisional 0 58 0.00 26 28 25 27 0Maywood 1 - Election Day 926 377 40.71 116 104 225 220 0Maywood 2 - Election Day 898 373 41.54 139 150 195 197 0Maywood 3 - Election Day 915 379 41.42 154 165 193 195 0Maywood 4 - Election Day 905 408 45.08 152 160 211 203 0Maywood 5 - Election Day 867 371 42.79 141 147 196 188 0Maywood 6 - Election Day 878 378 43.05 144 144 205 195 0Maywood 7 - Election Day 689 192 27.87 69 72 113 111 0Maywood Mail-In Ballot - Mail-In B 0 160 0.00 63 59 96 91 0Maywood Provisional - Provisiona 0 11 0.00 4 4 7 6 0Midland Park 1 - Election Day 1135 547 48.19 214 238 233 231 0Midland Park 2 - Election Day 745 345 46.31 171 174 131 128 0Midland Park 3 - Election Day 1151 525 45.61 212 232 228 223 0Midland Park 4 - Election Day 896 409 45.65 183 209 156 153 0Midland Park 5 - Election Day 1083 526 48.57 258 271 172 166 0Midland Park Mail-In Ballot - Mail- 0 104 0.00 41 44 53 51 0Midland Park Provisional - Provisio 0 17 0.00 2 3 12 12 0Montvale 1 - Election Day 738 351 47.56 163 165 145 142 0Montvale 2 - Election Day 1113 528 47.44 259 269 199 202 0Montvale 3 - Election Day 1929 836 43.34 416 433 307 313 1Montvale 4 - Election Day 1849 749 40.51 368 377 289 290 0Montvale Mail-In Ballot - Mail-In Ba 0 164 0.00 79 80 77 68 0Montvale Provisional - Provisional 0 14 0.00 6 6 7 7 0Moonachie 1 - Election Day 296 70 23.65 20 20 34 34 0Moonachie 2 - Election Day 890 313 35.17 78 84 161 157 0Moonachie 3 - Election Day 414 120 28.99 33 36 69 70 0Moonachie Mail-In Ballot - Mail-In 0 24 0.00 8 9 15 14 0Moonachie Provisional - Provision 0 1 0.00 0 0 1 0 0New Milford 1 - Election Day 1273 541 42.50 259 241 249 236 0New Milford 2 - Election Day 1185 524 44.22 271 242 213 208 1New Milford 3 - Election Day 1267 573 45.22 301 280 230 216 0New Milford 4 - Election Day 1356 567 41.81 303 274 233 221 0New Milford 5 - Election Day 1081 421 38.95 191 188 192 186 0New Milford 6 - Election Day 918 323 35.19 112 114 187 186 0New Milford 7 - Election Day 778 251 32.26 81 76 146 131 0New Milford 8 - Election Day 1404 580 41.31 279 257 255 235 0New Milford 9 - Election Day 861 383 44.48 196 205 156 155 1New Milford Mail-In Ballot - Mail-In 0 210 0.00 84 84 119 109 0New Milford Provisional - Provision 0 32 0.00 11 11 21 21 0North Arlington 1 - Election Day 547 226 41.32 92 94 104 104 0North Arlington 2 - Election Day 789 294 37.26 109 111 141 139 0North Arlington 3 - Election Day 934 360 38.54 144 149 154 161 0North Arlington 4 - Election Day 969 423 43.65 166 176 186 186 0North Arlington 5 - Election Day 1224 481 39.30 208 227 185 185 0North Arlington 6 - Election Day 968 346 35.74 133 130 150 146 3North Arlington 7 - Election Day 1448 635 43.85 274 283 289 267 0North Arlington 8 - Election Day 692 289 41.76 112 114 137 128 0North Arlington 9 - Election Day 970 408 42.06 190 197 172 145 4North Arlington 10 - Election Day 643 273 42.46 88 92 140 138 0North Arlington Mail-In Ballot - Ma 0 302 0.00 173 174 113 110 0North Arlington Provisional - Provi 0 16 0.00 4 3 9 9 0Northvale 1 - Election Day 976 422 43.24 148 173 200 167 0
November 15, 2017 8:37 am Page 59 of 219

Regi
stra
tion
Ballo
ts C
ast
Turn
out (
%)
BOAR
D OF
CHO
SEN
RAYM
OND
COTT
IERS
JR.
JOHN
DRI
SCOL
L JR
.
JOAN
M. V
OSS
DAVI
D L.
GAN
Z
Pers
onal
Cho
ice
BOARD OF CHOSEN FREEHOLDERS
BERGEN COUNTY Statement of VoteBER_20171107_E
Northvale 2 - Election Day 836 317 37.92 120 141 142 148 0Northvale 3 - Election Day 1156 464 40.14 164 181 220 222 0Northvale Mail-In Ballot - Mail-In B 0 50 0.00 27 28 21 20 0Northvale Provisional - Provisiona 0 2 0.00 0 0 2 2 0Norwood 1 - Election Day 1761 857 48.67 345 365 412 409 0Norwood 2 - Election Day 1899 821 43.23 314 365 369 358 0Norwood Mail-In Ballot - Mail-In Ba 0 88 0.00 33 37 46 44 1Norwood Provisional - Provisional 0 3 0.00 2 2 1 1 0Oakland 1 - Election Day 1001 452 45.15 180 193 220 216 0Oakland 2 - Election Day 912 394 43.20 197 202 150 146 0Oakland 3 - Election Day 755 331 43.84 162 169 134 133 0Oakland 4 - Election Day 942 428 45.44 213 223 172 165 0Oakland 5 - Election Day 1013 468 46.20 208 220 211 210 0Oakland 6 - Election Day 1232 556 45.13 263 276 232 233 0Oakland 7 - Election Day 1257 546 43.44 279 288 216 211 0Oakland 8 - Election Day 1705 605 35.48 267 291 279 269 0Oakland Mail-In Ballot - Mail-In Ba 0 199 0.00 78 88 105 109 1Oakland Provisional - Provisional 0 7 0.00 5 5 2 2 0Old Tappan 1 - Election Day 1201 435 36.22 202 222 177 175 0Old Tappan 2 - Election Day 1443 477 33.06 237 248 189 194 0Old Tappan 3 - Election Day 1513 497 32.85 249 255 204 193 0Old Tappan Mail-In Ballot - Mail-In 0 128 0.00 57 61 63 66 0Old Tappan Provisional - Provision 0 6 0.00 3 3 3 2 0Oradell 1 - Election Day 977 474 48.52 211 226 210 191 0Oradell 2 - Election Day 886 387 43.68 136 171 174 178 0Oradell 3 - Election Day 922 450 48.81 198 214 198 198 0Oradell 4 - Election Day 934 461 49.36 188 196 215 220 0Oradell 5 - Election Day 1122 530 47.24 256 266 228 215 0Oradell 6 - Election Day 1122 530 47.24 264 285 205 201 0Oradell Mail-In Ballot - Mail-In Ball 0 184 0.00 64 70 110 109 0Oradell Provisional - Provisional 0 14 0.00 6 6 8 7 0Palisades Park 1 - Election Day 569 132 23.20 29 27 82 85 0Palisades Park 2 - Election Day 701 241 34.38 59 67 112 116 0Palisades Park 3 - Election Day 696 170 24.43 42 51 102 99 0Palisades Park 4 - Election Day 744 186 25.00 50 50 108 105 0Palisades Park 5 - Election Day 853 199 23.33 65 76 94 93 0Palisades Park 6 - Election Day 1144 291 25.44 77 89 134 132 0Palisades Park 7 - Election Day 748 193 25.80 63 72 80 77 0Palisades Park 8 - Election Day 944 206 21.82 55 54 124 117 0Palisades Park 9 - Election Day 1088 208 19.12 51 53 113 110 0Palisades Park Mail-In Ballot - Ma 0 301 0.00 64 71 206 204 0Palisades Park Provisional - Provi 0 37 0.00 10 10 20 20 0Paramus 1 - Election Day 1250 397 31.76 172 180 169 172 0Paramus 2 - Election Day 946 360 38.05 135 156 179 178 0Paramus 3 - Election Day 1066 455 42.68 206 215 198 197 0Paramus 4 - Election Day 823 304 36.94 129 143 139 146 0Paramus 5 - Election Day 746 323 43.30 144 156 142 138 1Paramus 6 - Election Day 887 334 37.66 133 146 170 172 0Paramus 7 - Election Day 975 441 45.23 185 201 202 204 0Paramus 8 - Election Day 911 317 34.80 163 163 120 109 1Paramus 9 - Election Day 864 325 37.62 144 158 145 148 0Paramus 10 - Election Day 790 294 37.22 119 125 152 147 0Paramus 11 - Election Day 740 277 37.43 101 108 141 134 0Paramus 12 - Election Day 1277 521 40.80 264 266 214 205 1Paramus 13 - Election Day 625 262 41.92 100 106 135 134 0Paramus 14 - Election Day 933 351 37.62 149 165 169 163 0Paramus 15 - Election Day 1422 471 33.12 179 194 252 244 0Paramus 16 - Election Day 698 308 44.13 132 142 131 121 0Paramus 17 - Election Day 841 324 38.53 134 154 150 151 0
November 15, 2017 8:37 am Page 60 of 219

Regi
stra
tion
Ballo
ts C
ast
Turn
out (
%)
BOAR
D OF
CHO
SEN
RAYM
OND
COTT
IERS
JR.
JOHN
DRI
SCOL
L JR
.
JOAN
M. V
OSS
DAVI
D L.
GAN
Z
Pers
onal
Cho
ice
BOARD OF CHOSEN FREEHOLDERS
BERGEN COUNTY Statement of VoteBER_20171107_E
Paramus 18 - Election Day 600 256 42.67 83 97 148 142 0Paramus 19 - Election Day 717 332 46.30 110 149 163 161 0Paramus 20 - Election Day 832 318 38.22 132 153 136 141 0Paramus Mail-In Ballot - Mail-In Ba 0 542 0.00 215 231 289 273 1Paramus Provisional - Provisional 0 37 0.00 14 17 19 18 0Park Ridge 1 - Election Day 1195 667 55.82 311 320 265 256 0Park Ridge 2 - Election Day 875 440 50.29 220 230 173 167 0Park Ridge 3 - Election Day 951 507 53.31 253 275 178 172 0Park Ridge 4 - Election Day 868 472 54.38 196 224 202 203 0Park Ridge 5 - Election Day 1088 487 44.76 224 230 201 201 0Park Ridge 6 - Election Day 1174 609 51.87 258 274 234 266 0Park Ridge Mail-In Ballot - Mail-In 0 138 0.00 70 75 64 60 0Park Ridge Provisional - Provision 0 16 0.00 5 5 9 8 0Ramsey 1 - Election Day 1185 529 44.64 201 218 249 260 0Ramsey 2 - Election Day 1482 717 48.38 327 347 307 307 0Ramsey 3 - Election Day 1457 724 49.69 362 375 297 284 0Ramsey 4 - Election Day 785 350 44.59 173 178 134 135 0Ramsey 5 - Election Day 1508 701 46.49 335 346 290 287 0Ramsey 6 - Election Day 1828 718 39.28 314 321 334 332 2Ramsey 7 - Election Day 1242 567 45.65 301 311 212 210 0Ramsey 8 - Election Day 1006 488 48.51 295 299 137 142 0Ramsey Mail-In Ballot - Mail-In Ba 0 280 0.00 144 144 126 121 2Ramsey Provisional - Provisional 0 14 0.00 11 11 3 3 0Ridgefield 1 - Election Day 1202 396 32.95 138 141 209 209 0Ridgefield 2 - Election Day 921 358 38.87 103 108 210 202 0Ridgefield 3 - Election Day 1481 429 28.97 116 122 254 241 0Ridgefield 4 - Election Day 963 303 31.46 104 108 167 168 0Ridgefield 5 - Election Day 1300 382 29.38 118 133 197 188 0Ridgefield Mail-In Ballot - Mail-In B 0 135 0.00 62 60 68 68 0Ridgefield Provisional - Provisiona 0 14 0.00 5 5 8 8 0Ridgefield Park 1 - Election Day 588 227 38.61 55 59 128 123 0Ridgefield Park 2 - Election Day 1076 382 35.50 109 109 201 214 0Ridgefield Park 3 - Election Day 797 255 31.99 64 61 140 141 0Ridgefield Park 4 - Election Day 1073 393 36.63 96 120 221 225 0Ridgefield Park 5 - Election Day 602 230 38.21 76 82 122 117 2Ridgefield Park 6 - Election Day 964 382 39.63 104 115 217 215 0Ridgefield Park 7 - Election Day 935 359 38.40 89 97 212 209 0Ridgefield Park 8 - Election Day 1125 451 40.09 125 139 245 253 0Ridgefield Park Mail-In Ballot - Ma 0 98 0.00 31 33 56 54 0Ridgefield Park Provisional - Provi 0 26 0.00 6 6 18 15 0Ridgewood 1 - Election Day 809 325 40.17 118 127 166 165 0Ridgewood 2 - Election Day 1049 374 35.65 146 146 211 207 0Ridgewood 3 - Election Day 940 371 39.47 147 160 172 180 0Ridgewood 4 - Election Day 788 311 39.47 110 108 180 177 0Ridgewood 5 - Election Day 1023 334 32.65 167 165 150 146 0Ridgewood 6 - Election Day 859 376 43.77 115 116 221 230 0Ridgewood 7 - Election Day 990 402 40.61 149 151 225 220 0Ridgewood 8 - Election Day 724 298 41.16 92 93 178 178 0Ridgewood 9 - Election Day 702 305 43.45 97 98 179 182 0Ridgewood 10 - Election Day 718 244 33.98 51 56 170 162 0Ridgewood 11 - Election Day 979 435 44.43 169 153 230 228 0Ridgewood 12 - Election Day 864 369 42.71 139 146 202 207 0Ridgewood 13 - Election Day 948 378 39.87 107 106 238 237 0Ridgewood 14 - Election Day 1196 489 40.89 172 171 263 267 0Ridgewood 15 - Election Day 848 370 43.63 123 127 211 209 0Ridgewood 16 - Election Day 695 278 40.00 106 111 152 147 0Ridgewood 17 - Election Day 785 320 40.76 131 133 162 163 2Ridgewood 18 - Election Day 870 390 44.83 120 127 240 242 0Ridgewood 19 - Election Day 821 339 41.29 118 123 182 177 0
November 15, 2017 8:37 am Page 61 of 219

Regi
stra
tion
Ballo
ts C
ast
Turn
out (
%)
BOAR
D OF
CHO
SEN
RAYM
OND
COTT
IERS
JR.
JOHN
DRI
SCOL
L JR
.
JOAN
M. V
OSS
DAVI
D L.
GAN
Z
Pers
onal
Cho
ice
BOARD OF CHOSEN FREEHOLDERS
BERGEN COUNTY Statement of VoteBER_20171107_E
Ridgewood Mail-In Ballot - Mail-In 0 432 0.00 129 135 286 283 1Ridgewood Provisional - Provision 0 35 0.00 9 9 0 0 0River Edge 1 - Election Day 1133 485 42.81 173 177 258 248 0River Edge 2 - Election Day 964 410 42.53 158 168 213 203 0River Edge 3 - Election Day 863 371 42.99 136 146 194 173 0River Edge 4 - Election Day 935 444 47.49 170 168 239 231 0River Edge 5 - Election Day 758 301 39.71 109 112 154 157 0River Edge 6 - Election Day 878 347 39.52 126 135 189 175 0River Edge 7 - Election Day 914 366 40.04 120 131 209 207 0River Edge 8 - Election Day 752 241 32.05 77 83 116 140 0River Edge Mail-In Ballot - Mail-In 0 198 0.00 71 80 108 102 0River Edge Provisional - Provision 0 7 0.00 4 3 3 4 0River Vale 1 - Election Day 1533 578 37.70 272 296 242 238 0River Vale 2 - Election Day 2055 856 41.65 427 431 357 354 0River Vale 3 - Election Day 1486 632 42.53 268 280 289 287 0River Vale 4 - Election Day 1159 476 41.07 226 212 209 203 1River Vale 5 - Election Day 1231 493 40.05 249 255 185 194 0River Vale Mail-In Ballot - Mail-In B 0 134 0.00 61 62 65 63 0River Vale Provisional - Provisiona 0 10 0.00 3 3 5 5 0Rochelle Park 1 - Election Day 1001 472 47.15 163 170 197 198 0Rochelle Park 2 - Election Day 894 421 47.09 164 173 159 143 0Rochelle Park 3 - Election Day 852 413 48.47 120 107 166 166 0Rochelle Park 4 - Election Day 956 432 45.19 186 175 152 155 0Rochelle Park Mail-In Ballot - Mail 0 105 0.00 43 44 53 55 0Rochelle Park Provisional - Provis 0 16 0.00 7 7 6 6 0Rockleigh 1 - Election Day 227 81 35.68 50 40 17 20 0Rockleigh Mail-In Ballot - Mail-In B 0 15 0.00 3 3 9 9 0Rockleigh Provisional - Provisiona 0 1 0.00 0 0 1 1 0Rutherford 1 - Election Day 990 496 50.10 178 176 264 255 0Rutherford 2 - Election Day 1099 509 46.31 200 201 253 242 1Rutherford 3 - Election Day 989 434 43.88 100 145 248 229 0Rutherford 4 - Election Day 730 346 47.40 141 140 159 153 0Rutherford 5 - Election Day 776 344 44.33 120 103 189 183 0Rutherford 6 - Election Day 743 282 37.95 89 97 157 148 0Rutherford 7 - Election Day 938 404 43.07 140 141 226 222 0Rutherford 8 - Election Day 1007 420 41.71 138 151 225 198 0Rutherford 9 - Election Day 1051 491 46.72 165 168 252 236 0Rutherford 10 - Election Day 969 437 45.10 154 164 232 220 0Rutherford 11 - Election Day 1041 405 38.90 141 140 229 225 0Rutherford 12 - Election Day 763 311 40.76 96 123 154 156 0Rutherford Mail-In Ballot - Mail-In 0 257 0.00 83 88 157 157 0Rutherford Provisional - Provisiona 0 43 0.00 4 5 36 36 0Saddle Brook 1 - Election Day 778 267 34.32 87 83 129 138 0Saddle Brook 2 - Election Day 769 325 42.26 87 81 163 127 1Saddle Brook 3 - Election Day 582 236 40.55 59 65 140 135 0Saddle Brook 4 - Election Day 892 378 42.38 126 147 158 173 0Saddle Brook 5 - Election Day 995 344 34.57 118 125 172 172 0Saddle Brook 6 - Election Day 973 424 43.58 162 151 155 143 0Saddle Brook 7 - Election Day 598 255 42.64 109 125 89 89 0Saddle Brook 8 - Election Day 790 329 41.65 117 129 135 138 0Saddle Brook 9 - Election Day 916 369 40.28 129 137 158 171 1Saddle Brook 10 - Election Day 857 371 43.29 151 165 143 155 0Saddle Brook 11 - Election Day 864 386 44.68 141 121 179 160 0Saddle Brook Mail-In Ballot - Mail- 0 144 0.00 50 49 87 80 0Saddle Brook Provisional - Provisi 0 18 0.00 4 4 11 12 0Saddle River 1 - Election Day 1185 380 32.07 263 266 89 88 0Saddle River 2 - Election Day 1452 532 36.64 381 380 107 110 1Saddle River Mail-In Ballot - Mail-I 0 74 0.00 40 41 32 31 0Saddle River Provisional - Provisio 0 8 0.00 4 3 5 3 0
November 15, 2017 8:37 am Page 62 of 219

Regi
stra
tion
Ballo
ts C
ast
Turn
out (
%)
BOAR
D OF
CHO
SEN
RAYM
OND
COTT
IERS
JR.
JOHN
DRI
SCOL
L JR
.
JOAN
M. V
OSS
DAVI
D L.
GAN
Z
Pers
onal
Cho
ice
BOARD OF CHOSEN FREEHOLDERS
BERGEN COUNTY Statement of VoteBER_20171107_E
South Hackensack 1 - Election Da 1417 525 37.05 145 155 260 267 0South Hackensack Mail-In Ballot - 0 32 0.00 11 11 16 16 0South Hackensack Provisional - P 0 1 0.00 0 0 0 0 0Teaneck 1 - Election Day 995 372 37.39 69 67 281 273 0Teaneck 2 - Election Day 1310 466 35.57 67 71 364 351 0Teaneck 3 - Election Day 1247 545 43.70 98 105 374 397 0Teaneck 4 - Election Day 1154 478 41.42 76 85 354 357 0Teaneck 5 - Election Day 860 317 36.86 35 40 239 237 2Teaneck 6 - Election Day 1021 463 45.35 51 46 355 362 0Teaneck 7 - Election Day 1069 430 40.22 60 65 317 334 0Teaneck 8 - Election Day 1286 622 48.37 98 107 472 466 0Teaneck 9 - Election Day 1261 491 38.94 106 112 328 335 0Teaneck 10 - Election Day 1438 477 33.17 164 163 267 269 2Teaneck 11 - Election Day 1297 388 29.92 138 145 202 205 0Teaneck 12 - Election Day 1440 486 33.75 144 153 286 293 3Teaneck 13 - Election Day 1098 527 48.00 14 15 454 467 0Teaneck 14 - Election Day 1464 636 43.44 10 10 549 476 0Teaneck 15 - Election Day 1080 330 30.56 48 50 230 232 0Teaneck 16 - Election Day 750 313 41.73 4 4 269 266 2Teaneck 17 - Election Day 1259 524 41.62 26 30 446 441 0Teaneck 18 - Election Day 1333 547 41.04 102 105 376 372 0Teaneck 19 - Election Day 1147 462 40.28 74 79 346 349 0Teaneck 20 - Election Day 830 314 37.83 61 72 214 227 0Teaneck 21 - Election Day 1355 459 33.87 59 62 362 353 0Teaneck 22 - Election Day 994 354 35.61 47 49 265 269 0Teaneck 23 - Election Day 981 341 34.76 14 15 287 286 0Teaneck Mail-In Ballot - Mail-In Ba 0 513 0.00 94 102 383 378 0Teaneck Provisional - Provisional 0 37 0.00 7 8 29 26 0Tenafly 1 - Election Day 778 281 36.12 81 90 175 167 0Tenafly 2 - Election Day 631 211 33.44 67 71 125 123 0Tenafly 3 - Election Day 592 217 36.66 67 69 130 131 0Tenafly 4 - Election Day 824 318 38.59 66 73 222 208 1Tenafly 5 - Election Day 728 254 34.89 48 59 179 171 0Tenafly 6 - Election Day 636 229 36.01 51 60 161 159 0Tenafly 7 - Election Day 708 195 27.54 65 57 118 114 0Tenafly 8 - Election Day 835 277 33.17 69 74 181 159 0Tenafly 9 - Election Day 847 333 39.32 79 97 190 201 0Tenafly 10 - Election Day 687 267 38.86 79 80 165 162 0Tenafly 11 - Election Day 824 278 33.74 86 92 172 175 0Tenafly 12 - Election Day 960 287 29.90 76 88 171 171 0Tenafly Mail-In Ballot - Mail-In Bal 0 196 0.00 49 53 136 130 0Tenafly Provisional - Provisional 0 15 0.00 5 5 10 10 0Teterboro 1 - Election Day 34 17 50.00 7 7 7 6 0Teterboro Mail-In Ballot - Mail-In B 0 0 0.00 0 0 0 0 0Teterboro Provisional - Provisiona 0 0 0.00 0 0 0 0 0Upper Saddle River 1 - Election D 1468 548 37.33 277 309 200 197 0Upper Saddle River 2 - Election D 1049 375 35.75 221 227 119 122 0Upper Saddle River 3 - Election D 1271 447 35.17 248 258 158 150 0Upper Saddle River 4 - Election D 1269 453 35.70 242 236 170 168 0Upper Saddle River 5 - Election D 930 322 34.62 181 186 115 117 0Upper Saddle River Mail-In Ballot 0 126 0.00 59 60 58 59 0Upper Saddle River Provisional - P 0 18 0.00 6 6 12 12 0Waldwick 1 - Election Day 1287 574 44.60 235 235 269 264 0Waldwick 2 - Election Day 1141 472 41.37 199 209 227 226 0Waldwick 3 - Election Day 1088 478 43.93 183 195 242 231 2Waldwick 4 - Election Day 1098 481 43.81 244 250 192 187 0Waldwick 5 - Election Day 1037 463 44.65 210 215 211 208 0Waldwick 6 - Election Day 1001 456 45.55 184 225 202 190 0Waldwick Mail-In Ballot - Mail-In B 0 129 0.00 67 68 58 55 0
November 15, 2017 8:37 am Page 63 of 219

Regi
stra
tion
Ballo
ts C
ast
Turn
out (
%)
BOAR
D OF
CHO
SEN
RAYM
OND
COTT
IERS
JR.
JOHN
DRI
SCOL
L JR
.
JOAN
M. V
OSS
DAVI
D L.
GAN
Z
Pers
onal
Cho
ice
BOARD OF CHOSEN FREEHOLDERS
BERGEN COUNTY Statement of VoteBER_20171107_E
Waldwick Provisional - Provisiona 0 16 0.00 6 6 10 9 0Wallington 1 - Election Day 623 211 33.87 74 86 81 89 0Wallington 2 - Election Day 738 232 31.44 93 100 95 95 0Wallington 3 - Election Day 1129 373 33.04 125 138 177 166 0Wallington 4 - Election Day 1305 655 50.19 314 321 233 222 0Wallington 5 - Election Day 1101 381 34.60 137 171 120 122 0Wallington 6 - Election Day 710 251 35.35 96 101 120 116 0Wallington Mail-In Ballot - Mail-In B 0 137 0.00 70 69 55 52 0Wallington Provisional - Provisiona 0 9 0.00 5 5 3 3 0Washington Township 1 - Election 1346 640 47.55 302 317 242 246 0Washington Township 2 - Election 912 425 46.60 216 225 145 145 0Washington Township 3 - Election 746 373 50.00 169 176 137 132 0Washington Township 4 - Election 1192 512 42.95 249 258 195 194 0Washington Township 5 - Election 1117 549 49.15 268 278 195 191 0Washington Township 6 - Election 1508 680 45.09 346 355 221 229 0Washington Township Mail-In Ball 0 211 0.00 113 119 81 79 0Washington Township Provisional 0 19 0.00 9 9 6 5 0Westwood 1 - Election Day 1114 513 46.05 204 211 250 243 0Westwood 2 - Election Day 959 446 46.51 183 193 215 214 0Westwood 3 - Election Day 605 297 49.09 127 131 149 145 0Westwood 4 - Election Day 894 429 47.99 147 150 253 249 0Westwood 5 - Election Day 707 351 49.65 163 170 157 156 0Westwood 6 - Election Day 1242 469 37.76 132 137 293 288 0Westwood 7 - Election Day 781 356 45.58 184 183 151 144 0Westwood 8 - Election Day 944 445 47.14 208 215 189 183 0Westwood Mail-In Ballot - Mail-In B 0 156 0.00 81 86 69 68 0Westwood Provisional - Provisiona 0 20 0.00 3 3 16 16 0Woodcliff Lake 1 - Election Day 897 425 47.38 166 174 207 204 0Woodcliff Lake 2 - Election Day 1176 556 47.28 241 245 252 249 0Woodcliff Lake 3 - Election Day 983 475 48.32 205 213 212 211 0Woodcliff Lake 4 - Election Day 1427 621 43.52 237 247 294 289 0Woodcliff Lake Mail-In Ballot - Mai 0 170 0.00 79 79 74 72 0Woodcliff Lake Provisional - Provis 0 21 0.00 8 10 8 8 0Wood Ridge 1 - Election Day 1442 602 41.75 156 172 364 363 0Wood Ridge 2 - Election Day 772 408 52.85 146 153 193 194 0Wood Ridge 3 - Election Day 1200 569 47.42 192 203 303 296 0Wood Ridge 4 - Election Day 1182 499 42.22 166 173 274 268 0Wood Ridge 5 - Election Day 1243 601 48.35 204 209 327 328 2Wood Ridge Mail-In Ballot - Mail-In 0 136 0.00 27 29 95 96 0Wood Ridge Provisional - Provisio 0 8 0.00 3 2 6 6 0Wyckoff 1 - Election Day 1382 630 45.59 307 315 254 262 0Wyckoff 2 - Election Day 1496 704 47.06 360 368 272 263 0Wyckoff 3 - Election Day 1259 542 43.05 277 289 215 218 0Wyckoff 4 - Election Day 1421 628 44.19 344 345 245 241 0Wyckoff 5 - Election Day 929 450 48.44 234 238 169 172 0Wyckoff 6 - Election Day 1229 556 45.24 290 303 215 216 0Wyckoff 7 - Election Day 1270 631 49.69 326 329 250 247 0Wyckoff 8 - Election Day 1347 585 43.43 350 352 191 194 0Wyckoff 9 - Election Day 876 435 49.66 254 254 157 150 0Wyckoff 10 - Election Day 1139 511 44.86 239 248 220 219 0Wyckoff Mail-In Ballot - Mail-In Ba 0 439 0.00 198 208 216 217 0Wyckoff Provisional - Provisional 0 29 0.00 11 12 17 17 0
Election Day Totals 559538 218514 39.05 78469 82243 111537 109923 70
Mail-In Ballot Totals 0 13571 0.00 4815 5103 7739 7581 13
Provisional Totals 0 1374 0.00 381 405 801 788 0
November 15, 2017 8:37 am Page 64 of 219

Regi
stra
tion
Ballo
ts C
ast
Turn
out (
%)
BOAR
D OF
CHO
SEN
RAYM
OND
COTT
IERS
JR.
JOHN
DRI
SCOL
L JR
.
JOAN
M. V
OSS
DAVI
D L.
GAN
Z
Pers
onal
Cho
ice
BOARD OF CHOSEN FREEHOLDERS
BERGEN COUNTY Statement of VoteBER_20171107_E
District Totals - Absentee
District Grand TotalsCounty 559538 233459 41.72 83665 87751 120077 118292 83Allendale 4892 2321 47.44 1174 1212 932 921 0Alpine 1416 436 30.79 199 205 203 195 0Bergenfield 15631 5891 37.69 1659 1821 3558 3555 2Bogota 5053 2147 42.49 672 711 1183 1179 2Carlstadt 3702 1565 42.27 599 637 728 715 0Cliffside Park 12046 4244 35.23 976 1007 2830 2794 2Closter 5228 2079 39.77 784 818 1092 1082 2Cresskill 5264 1947 36.99 758 801 944 931 0Demarest 3302 1437 43.52 517 547 808 809 0Dumont 11299 4628 40.96 1833 1934 2319 2308 3East Rutherford 5060 2055 40.61 686 729 1037 1013 0Edgewater 5771 1834 31.78 406 398 1279 1233 2Elmwood Park 11917 4653 39.05 1452 1574 2334 2287 2Emerson 5025 2340 46.57 1054 1109 970 950 0Englewood 16389 6268 38.25 867 916 4538 4525 0Englewood Cliffs 3607 1956 54.23 822 837 885 855 2Fair Lawn 21819 9729 44.59 3323 3546 5216 5227 3Fair View 5322 1791 33.65 318 334 1137 1135 0Fort Lee 19942 7224 36.23 1754 1812 4753 4533 4Franklin Lakes 8040 3169 39.42 1912 1967 955 948 0Garfield 14037 3692 26.30 947 1032 2027 2007 3Glen Rock 8424 4387 52.08 1601 1682 2343 2293 4Hackensack 21248 7796 36.69 1301 1399 5617 5574 1Harrington Park 3348 1695 50.63 694 728 802 781 0Hasbrouck Heights 7895 3510 44.46 1441 1530 1479 1453 4Haworth 2488 1233 49.56 401 439 662 607 0Hillsdale 7546 3528 46.75 1548 1664 1556 1549 2Ho-Ho-Kus 3079 1678 54.50 814 835 629 624 0Leonia 5138 2127 41.40 489 529 1421 1397 0Little Ferry 5360 1696 31.64 513 572 973 959 0Lodi 12654 4148 32.78 1081 1094 2207 2136 0Lyndhurst 12634 4851 38.40 1588 1730 2128 2091 0Mahwah 16574 8061 48.64 4028 4130 2943 2896 1Maywood 6078 2649 43.58 982 1005 1441 1406 0Midland Park 5010 2473 49.36 1081 1171 985 964 0Montvale 5629 2642 46.94 1291 1330 1024 1022 1Moonachie 1600 528 33.00 139 149 280 275 0New Milford 10123 4405 43.51 2088 1972 2001 1904 2North Arlington 9184 4053 44.13 1693 1750 1780 1718 7Northvale 2968 1255 42.28 459 523 585 559 0Norwood 3660 1769 48.33 694 769 828 812 1Oakland 8817 3986 45.21 1852 1955 1721 1694 1Old Tappan 4157 1543 37.12 748 789 636 630 0Oradell 5963 3030 50.81 1323 1434 1348 1319 0Palisades Park 7487 2164 28.90 565 620 1175 1158 0Paramus 17943 7549 42.07 3143 3425 3563 3498 4Park Ridge 6151 3336 54.24 1537 1633 1326 1333 0Ramsey 10493 5088 48.49 2463 2550 2089 2081 4Ridgefield 5867 2017 34.38 646 677 1113 1084 0Ridgefield Park 7160 2803 39.15 755 821 1560 1566 2Ridgewood 16608 7175 43.20 2515 2561 4018 4007 3River Edge 7197 3170 44.05 1144 1203 1683 1640 0River Vale 7464 3179 42.59 1506 1539 1352 1344 1Rochelle Park 3703 1859 50.20 683 676 733 723 0Rockleigh 227 97 42.73 53 43 27 30 0
November 15, 2017 8:37 am Page 65 of 219

Regi
stra
tion
Ballo
ts C
ast
Turn
out (
%)
BOAR
D OF
CHO
SEN
RAYM
OND
COTT
IERS
JR.
JOHN
DRI
SCOL
L JR
.
JOAN
M. V
OSS
DAVI
D L.
GAN
Z
Pers
onal
Cho
ice
BOARD OF CHOSEN FREEHOLDERS
BERGEN COUNTY Statement of VoteBER_20171107_E
Rutherford 11096 5179 46.67 1749 1842 2781 2660 1Saddle Brook 9014 3846 42.67 1340 1382 1719 1693 2Saddle River 2637 994 37.69 688 690 233 232 1South Hackensack 1417 558 39.38 156 166 276 283 0Teaneck 26669 10892 40.84 1666 1760 8049 8021 9Tenafly 9050 3358 37.10 888 968 2135 2081 1Teterboro 34 17 50.00 7 7 7 6 0Upper Saddle River 5987 2289 38.23 1234 1282 832 825 0Waldwick 6652 3069 46.14 1328 1403 1411 1370 2Wallington 5606 2249 40.12 914 991 884 865 0Washington 6821 3409 49.98 1672 1737 1222 1221 0Westwood 7246 3482 48.05 1432 1479 1742 1706 0Woodcliff Lake 4483 2268 50.59 936 968 1047 1033 0Wood Ridge 5839 2823 48.35 894 941 1562 1551 2Wyckoff 12348 6140 49.72 3190 3261 2421 2416 0
Grand Totals 559538 233459 41.72 83665 87751 120077 118292 83
November 15, 2017 8:37 am Page 66 of 219

Regi
stra
tion
Ballo
ts C
ast
Turn
out (
%)
ALLE
NDAL
E CO
UNCI
L
AMY
E. W
ILCZ
YNSK
I
EDW
ARD
O'CO
NNEL
L
MAR
IA C
HRIS
TINA
MON
TANY
E
Pers
onal
Cho
ice
ALLENDALE COUNCIL
BERGEN COUNTY Statement of VoteBER_20171107_E
Allendale 1 - Election Day 1618 755 46.66 426 414 355 2Allendale 2 - Election Day 853 363 42.56 200 190 176 1Allendale 3 - Election Day 982 456 46.44 261 257 191 0Allendale 4 - Election Day 1439 606 42.11 373 351 250 4Allendale Mail-In Ballot - Mail-In B 0 129 0.00 73 72 59 1Allendale Provisional - Provisional 0 12 0.00 6 6 5 0
Election Day Totals 4892 2180 44.56 1260 1212 972 7
Mail-In Ballot Totals 0 129 0.00 73 72 59 1
Provisional Totals 0 12 0.00 6 6 5 0
District Totals - Absentee
District Grand TotalsCounty 4892 2321 47.44 1339 1290 1036 8Allendale 4892 2321 47.44 1339 1290 1036 8
Grand Totals 4892 2321 47.44 1339 1290 1036 8
November 15, 2017 8:37 am Page 67 of 219

Regi
stra
tion
Ballo
ts C
ast
Turn
out (
%)
ALPI
NE C
OUNC
IL
LAUR
ENCE
A. S
HADE
K
ARTH
UR F
RANK
EL
Pers
onal
Cho
ice
ALPINE COUNCIL
BERGEN COUNTY Statement of VoteBER_20171107_E
Alpine 1 - Election Day 1416 405 28.60 241 214 0Alpine Mail-In Ballot - Mail-In Ballo 0 30 0.00 24 25 0Alpine Provisional - Provisional 0 1 0.00 1 1 0
Election Day Totals 1416 405 28.60 241 214 0
Mail-In Ballot Totals 0 30 0.00 24 25 0
Provisional Totals 0 1 0.00 1 1 0
District Totals - Absentee
District Grand TotalsCounty 1416 436 30.79 266 240 0Alpine 1416 436 30.79 266 240 0
Grand Totals 1416 436 30.79 266 240 0
November 15, 2017 8:37 am Page 68 of 219

Regi
stra
tion
Ballo
ts C
ast
Turn
out (
%)
BERG
ENFI
ELD
COUN
CIL
JOHN
F. G
ALLA
GHER
KATH
LEEN
J. S
AHLB
ERG
ARVI
N G.
AM
ATOR
IO
RAFA
EL A
. MAR
TE
Pers
onal
Cho
ice
BERGENFIELD COUNCIL
BERGEN COUNTY Statement of VoteBER_20171107_E
Bergenfield 1 - Election Day 787 282 35.83 121 121 151 146 0Bergenfield 2 - Election Day 868 377 43.43 144 137 216 218 0Bergenfield 3 - Election Day 791 309 39.06 112 107 170 166 0Bergenfield 4 - Election Day 891 319 35.80 128 119 168 173 0Bergenfield 5 - Election Day 873 312 35.74 86 89 210 208 0Bergenfield 6 - Election Day 873 325 37.23 103 98 196 192 2Bergenfield 7 - Election Day 793 269 33.92 73 74 188 181 0Bergenfield 8 - Election Day 850 290 34.12 90 96 180 170 0Bergenfield 9 - Election Day 842 274 32.54 46 46 198 196 0Bergenfield 10 - Election Day 1127 399 35.40 142 138 237 238 0Bergenfield 11 - Election Day 950 386 40.63 155 154 220 221 0Bergenfield 12 - Election Day 1081 375 34.69 105 103 244 243 0Bergenfield 13 - Election Day 1178 414 35.14 122 115 274 269 0Bergenfield 14 - Election Day 798 297 37.22 97 99 183 175 1Bergenfield 15 - Election Day 1131 387 34.22 135 134 231 219 0Bergenfield 16 - Election Day 932 320 34.33 127 123 167 166 0Bergenfield 17 - Election Day 866 285 32.91 93 86 174 178 0Bergenfield Mail-In Ballot - Mail-In 0 233 0.00 84 81 143 138 0Bergenfield Provisional - Provision 0 38 0.00 4 5 29 28 0
Election Day Totals 15631 5620 35.95 1879 1839 3407 3359 3
Mail-In Ballot Totals 0 233 0.00 84 81 143 138 0
Provisional Totals 0 38 0.00 4 5 29 28 0
District Totals - Absentee
District Grand TotalsCounty 15631 5891 37.69 1967 1925 3579 3525 3Bergenfield 15631 5891 37.69 1967 1925 3579 3525 3
Grand Totals 15631 5891 37.69 1967 1925 3579 3525 3
November 15, 2017 8:37 am Page 69 of 219
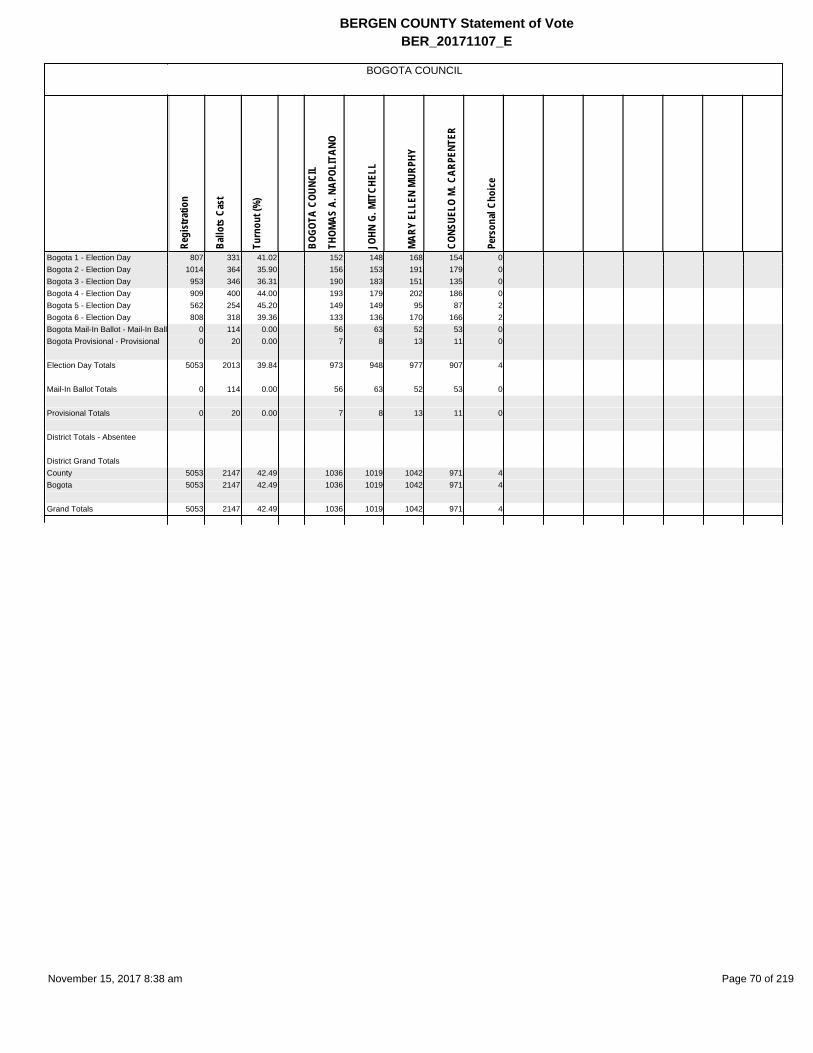
Regi
stra
tion
Ballo
ts C
ast
Turn
out (
%)
BOGO
TA C
OUNC
IL
THOM
AS A
. NAP
OLIT
ANO
JOHN
G. M
ITCH
ELL
MAR
Y EL
LEN
MUR
PHY
CONS
UELO
M. C
ARPE
NTER
Pers
onal
Cho
ice
BOGOTA COUNCIL
BERGEN COUNTY Statement of VoteBER_20171107_E
Bogota 1 - Election Day 807 331 41.02 152 148 168 154 0Bogota 2 - Election Day 1014 364 35.90 156 153 191 179 0Bogota 3 - Election Day 953 346 36.31 190 183 151 135 0Bogota 4 - Election Day 909 400 44.00 193 179 202 186 0Bogota 5 - Election Day 562 254 45.20 149 149 95 87 2Bogota 6 - Election Day 808 318 39.36 133 136 170 166 2Bogota Mail-In Ballot - Mail-In Ball 0 114 0.00 56 63 52 53 0Bogota Provisional - Provisional 0 20 0.00 7 8 13 11 0
Election Day Totals 5053 2013 39.84 973 948 977 907 4
Mail-In Ballot Totals 0 114 0.00 56 63 52 53 0
Provisional Totals 0 20 0.00 7 8 13 11 0
District Totals - Absentee
District Grand TotalsCounty 5053 2147 42.49 1036 1019 1042 971 4Bogota 5053 2147 42.49 1036 1019 1042 971 4
Grand Totals 5053 2147 42.49 1036 1019 1042 971 4
November 15, 2017 8:38 am Page 70 of 219
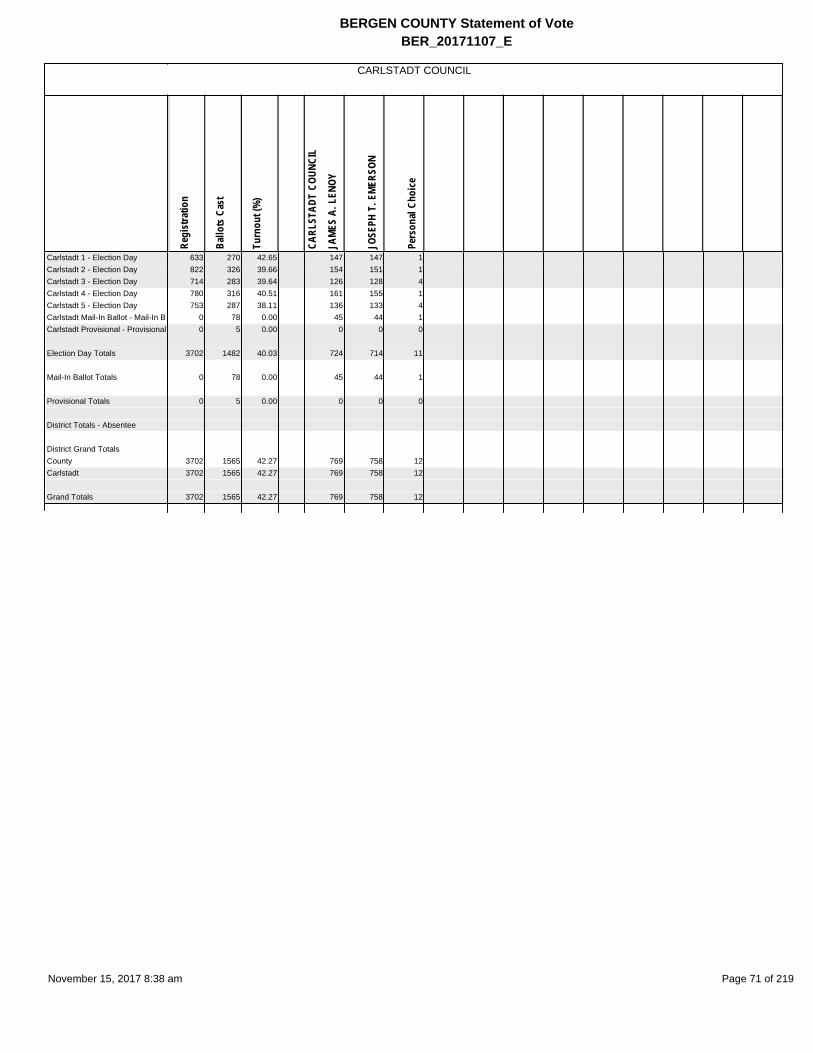
Regi
stra
tion
Ballo
ts C
ast
Turn
out (
%)
CARL
STAD
T CO
UNCI
L
JAM
ES A
. LEN
OY
JOSE
PH T
. EM
ERSO
N
Pers
onal
Cho
ice
CARLSTADT COUNCIL
BERGEN COUNTY Statement of VoteBER_20171107_E
Carlstadt 1 - Election Day 633 270 42.65 147 147 1Carlstadt 2 - Election Day 822 326 39.66 154 151 1Carlstadt 3 - Election Day 714 283 39.64 126 128 4Carlstadt 4 - Election Day 780 316 40.51 161 155 1Carlstadt 5 - Election Day 753 287 38.11 136 133 4Carlstadt Mail-In Ballot - Mail-In Ba 0 78 0.00 45 44 1Carlstadt Provisional - Provisional 0 5 0.00 0 0 0
Election Day Totals 3702 1482 40.03 724 714 11
Mail-In Ballot Totals 0 78 0.00 45 44 1
Provisional Totals 0 5 0.00 0 0 0
District Totals - Absentee
District Grand TotalsCounty 3702 1565 42.27 769 758 12Carlstadt 3702 1565 42.27 769 758 12
Grand Totals 3702 1565 42.27 769 758 12
November 15, 2017 8:38 am Page 71 of 219

Regi
stra
tion
Ballo
ts C
ast
Turn
out (
%)
CLIF
FSID
E PA
RK C
OUNC
IL
DANA
MAR
TINO
TTI
LAW
RENC
E BO
NGAR
D
Pers
onal
Cho
ice
CLIFFSIDE PARK COUNCIL
BERGEN COUNTY Statement of VoteBER_20171107_E
Cliffside Park 1 - Election Day 770 228 29.61 167 157 0Cliffside Park 2 - Election Day 822 227 27.62 174 173 4Cliffside Park 3 - Election Day 815 227 27.85 173 175 0Cliffside Park 4 - Election Day 1213 471 38.83 346 335 2Cliffside Park 5 - Election Day 726 215 29.61 149 146 2Cliffside Park 6 - Election Day 759 271 35.70 200 195 0Cliffside Park 7 - Election Day 800 236 29.50 160 156 4Cliffside Park 8 - Election Day 817 325 39.78 225 212 0Cliffside Park 9 - Election Day 644 204 31.68 140 134 0Cliffside Park 10 - Election Day 1128 349 30.94 246 243 0Cliffside Park 11 - Election Day 593 161 27.15 98 99 0Cliffside Park 12 - Election Day 548 160 29.20 118 117 2Cliffside Park 13 - Election Day 886 307 34.65 207 203 3Cliffside Park 14 - Election Day 748 326 43.58 189 184 2Cliffside Park 15 - Election Day 777 313 40.28 178 173 3Cliffside Park Mail-In Ballot - Mail- 0 199 0.00 152 146 0Cliffside Park Provisional - Provisio 0 25 0.00 17 17 0
Election Day Totals 12046 4020 33.37 2770 2702 22
Mail-In Ballot Totals 0 199 0.00 152 146 0
Provisional Totals 0 25 0.00 17 17 0
District Totals - Absentee
District Grand TotalsCounty 12046 4244 35.23 2939 2865 22Cliffside Park 12046 4244 35.23 2939 2865 22
Grand Totals 12046 4244 35.23 2939 2865 22
November 15, 2017 8:38 am Page 72 of 219

Regi
stra
tion
Ballo
ts C
ast
Turn
out (
%)
CLOS
TER
COUN
CIL
DAVI
D H.
BAR
AD
ROBE
RT A
. DI D
IO
SCOT
T M
. DEV
LIN
DOLO
RES
A. W
ITKO
Pers
onal
Cho
ice
CLOSTER COUNCIL
BERGEN COUNTY Statement of VoteBER_20171107_E
Closter 1 - Election Day 647 279 43.12 117 114 151 146 1Closter 2 - Election Day 905 344 38.01 159 164 170 168 0Closter 3 - Election Day 857 315 36.76 145 139 151 144 0Closter 4 - Election Day 911 337 36.99 177 179 142 142 0Closter 5 - Election Day 824 318 38.59 156 152 145 149 0Closter 6 - Election Day 1084 380 35.06 161 151 202 200 0Closter Mail-In Ballot - Mail-In Ball 0 100 0.00 45 45 54 50 1Closter Provisional - Provisional 0 6 0.00 4 4 2 2 0
Election Day Totals 5228 1973 37.74 915 899 961 949 1
Mail-In Ballot Totals 0 100 0.00 45 45 54 50 1
Provisional Totals 0 6 0.00 4 4 2 2 0
District Totals - Absentee
District Grand TotalsCounty 5228 2079 39.77 964 948 1017 1001 2Closter 5228 2079 39.77 964 948 1017 1001 2
Grand Totals 5228 2079 39.77 964 948 1017 1001 2
November 15, 2017 8:38 am Page 73 of 219

Regi
stra
tion
Ballo
ts C
ast
Turn
out (
%)
CRES
SKIL
L CO
UNCI
L
JAM
ES C
LEAR
Y
HECT
OR O
LMO
Pers
onal
Cho
ice
CRESSKILL COUNCIL
BERGEN COUNTY Statement of VoteBER_20171107_E
Cresskill 1 - Election Day 815 300 36.81 127 130 0Cresskill 2 - Election Day 928 315 33.94 130 123 0Cresskill 3 - Election Day 1480 496 33.51 239 236 0Cresskill 4 - Election Day 781 278 35.60 132 140 0Cresskill 5 - Election Day 601 250 41.60 106 110 0Cresskill 6 - Election Day 659 245 37.18 111 107 0Cresskill Mail-In Ballot - Mail-In Ba 0 59 0.00 35 35 2Cresskill Provisional - Provisional 0 4 0.00 0 0 0
Election Day Totals 5264 1884 35.79 845 846 0
Mail-In Ballot Totals 0 59 0.00 35 35 2
Provisional Totals 0 4 0.00 0 0 0
District Totals - Absentee
District Grand TotalsCounty 5264 1947 36.99 880 881 2Cresskill 5264 1947 36.99 880 881 2
Grand Totals 5264 1947 36.99 880 881 2
November 15, 2017 8:38 am Page 74 of 219

Regi
stra
tion
Ballo
ts C
ast
Turn
out (
%)
DEM
ARES
T CO
UNCI
L
JOSE
PH G
RAY
THEO
DORE
E. D
AVIS
JR.
MAR
Y LY
NNE
HAM
ILTO
N
REBE
CCA
LaPI
RA
Pers
onal
Cho
ice
DEMAREST COUNCIL
BERGEN COUNTY Statement of VoteBER_20171107_E
Demarest 1 - Election Day 1087 481 44.25 205 198 249 260 0Demarest 2 - Election Day 1102 402 36.48 173 165 210 212 0Demarest 3 - Election Day 1113 456 40.97 157 156 262 268 0Demarest Mail-In Ballot - Mail-In B 0 89 0.00 37 37 50 48 0Demarest Provisional - Provisiona 0 9 0.00 2 2 6 7 0
Election Day Totals 3302 1339 40.55 535 519 721 740 0
Mail-In Ballot Totals 0 89 0.00 37 37 50 48 0
Provisional Totals 0 9 0.00 2 2 6 7 0
District Totals - Absentee
District Grand TotalsCounty 3302 1437 43.52 574 558 777 795 0Demarest 3302 1437 43.52 574 558 777 795 0
Grand Totals 3302 1437 43.52 574 558 777 795 0
November 15, 2017 8:38 am Page 75 of 219
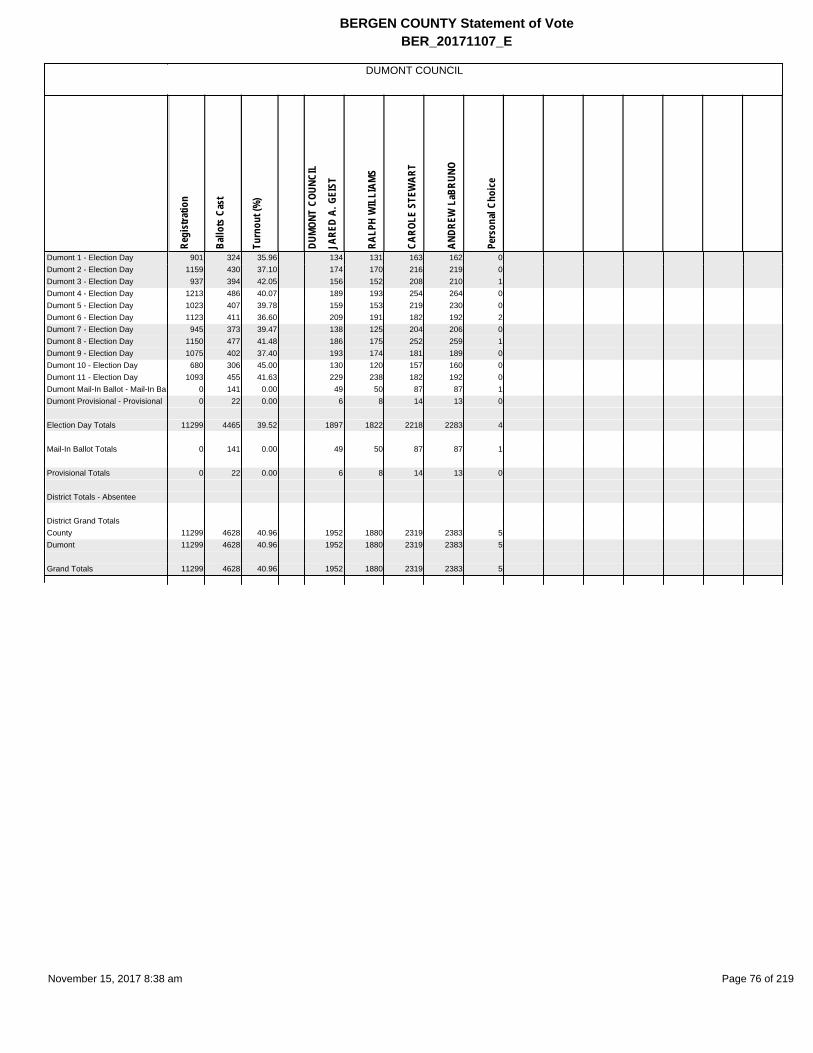
Regi
stra
tion
Ballo
ts C
ast
Turn
out (
%)
DUM
ONT
COUN
CIL
JARE
D A.
GEI
ST
RALP
H W
ILLI
AMS
CARO
LE S
TEW
ART
ANDR
EW L
aBRU
NO
Pers
onal
Cho
ice
DUMONT COUNCIL
BERGEN COUNTY Statement of VoteBER_20171107_E
Dumont 1 - Election Day 901 324 35.96 134 131 163 162 0Dumont 2 - Election Day 1159 430 37.10 174 170 216 219 0Dumont 3 - Election Day 937 394 42.05 156 152 208 210 1Dumont 4 - Election Day 1213 486 40.07 189 193 254 264 0Dumont 5 - Election Day 1023 407 39.78 159 153 219 230 0Dumont 6 - Election Day 1123 411 36.60 209 191 182 192 2Dumont 7 - Election Day 945 373 39.47 138 125 204 206 0Dumont 8 - Election Day 1150 477 41.48 186 175 252 259 1Dumont 9 - Election Day 1075 402 37.40 193 174 181 189 0Dumont 10 - Election Day 680 306 45.00 130 120 157 160 0Dumont 11 - Election Day 1093 455 41.63 229 238 182 192 0Dumont Mail-In Ballot - Mail-In Ba 0 141 0.00 49 50 87 87 1Dumont Provisional - Provisional 0 22 0.00 6 8 14 13 0
Election Day Totals 11299 4465 39.52 1897 1822 2218 2283 4
Mail-In Ballot Totals 0 141 0.00 49 50 87 87 1
Provisional Totals 0 22 0.00 6 8 14 13 0
District Totals - Absentee
District Grand TotalsCounty 11299 4628 40.96 1952 1880 2319 2383 5Dumont 11299 4628 40.96 1952 1880 2319 2383 5
Grand Totals 11299 4628 40.96 1952 1880 2319 2383 5
November 15, 2017 8:38 am Page 76 of 219

Regi
stra
tion
Ballo
ts C
ast
Turn
out (
%)
EAST
RUT
HERF
ORD
COUN
CIL
THOM
AS A
. BAN
CA
SAVE
RIO
STAL
LONE
EDW
ARD
C. R
AVET
TINE
Pers
onal
Cho
ice
EAST RUTHERFORD COUNCIL
BERGEN COUNTY Statement of VoteBER_20171107_E
East Rutherford 1 - Election Day 1198 385 32.14 110 263 247 1East Rutherford 2 - Election Day 1080 414 38.33 169 242 219 4East Rutherford 3 - Election Day 881 373 42.34 155 215 202 0East Rutherford 4 - Election Day 1901 786 41.35 339 436 405 2East Rutherford Mail-In Ballot - Ma 0 85 0.00 29 54 55 1East Rutherford Provisional - Prov 0 12 0.00 2 10 8 0
Election Day Totals 5060 1958 38.70 773 1156 1073 7
Mail-In Ballot Totals 0 85 0.00 29 54 55 1
Provisional Totals 0 12 0.00 2 10 8 0
District Totals - Absentee
District Grand TotalsCounty 5060 2055 40.61 804 1220 1136 8East Rutherford 5060 2055 40.61 804 1220 1136 8
Grand Totals 5060 2055 40.61 804 1220 1136 8
November 15, 2017 8:38 am Page 77 of 219

Regi
stra
tion
Ballo
ts C
ast
Turn
out (
%)
EDGE
WAT
ER C
OUNC
IL
JACQ
UELI
NE M
AGAL
HAES
ANDR
EW P
OYE
MIC
HAEL
HEN
WOO
D
JOSE
LUI
S VI
DAL
Pers
onal
Cho
ice
EDGEWATER COUNCIL
BERGEN COUNTY Statement of VoteBER_20171107_E
Edgewater 1 - Election Day 1072 335 31.25 70 66 226 231 0Edgewater 2 - Election Day 1385 405 29.24 82 83 287 283 1Edgewater 3 - Election Day 1416 469 33.12 128 129 294 287 5Edgewater 4 - Election Day 1898 486 25.61 115 114 331 334 2Edgewater Mail-In Ballot - Mail-In 0 123 0.00 32 32 82 82 5Edgewater Provisional - Provisiona 0 16 0.00 3 3 11 11 0
Election Day Totals 5771 1695 29.37 395 392 1138 1135 8
Mail-In Ballot Totals 0 123 0.00 32 32 82 82 5
Provisional Totals 0 16 0.00 3 3 11 11 0
District Totals - Absentee
District Grand TotalsCounty 5771 1834 31.78 430 427 1231 1228 13Edgewater 5771 1834 31.78 430 427 1231 1228 13
Grand Totals 5771 1834 31.78 430 427 1231 1228 13
November 15, 2017 8:38 am Page 78 of 219
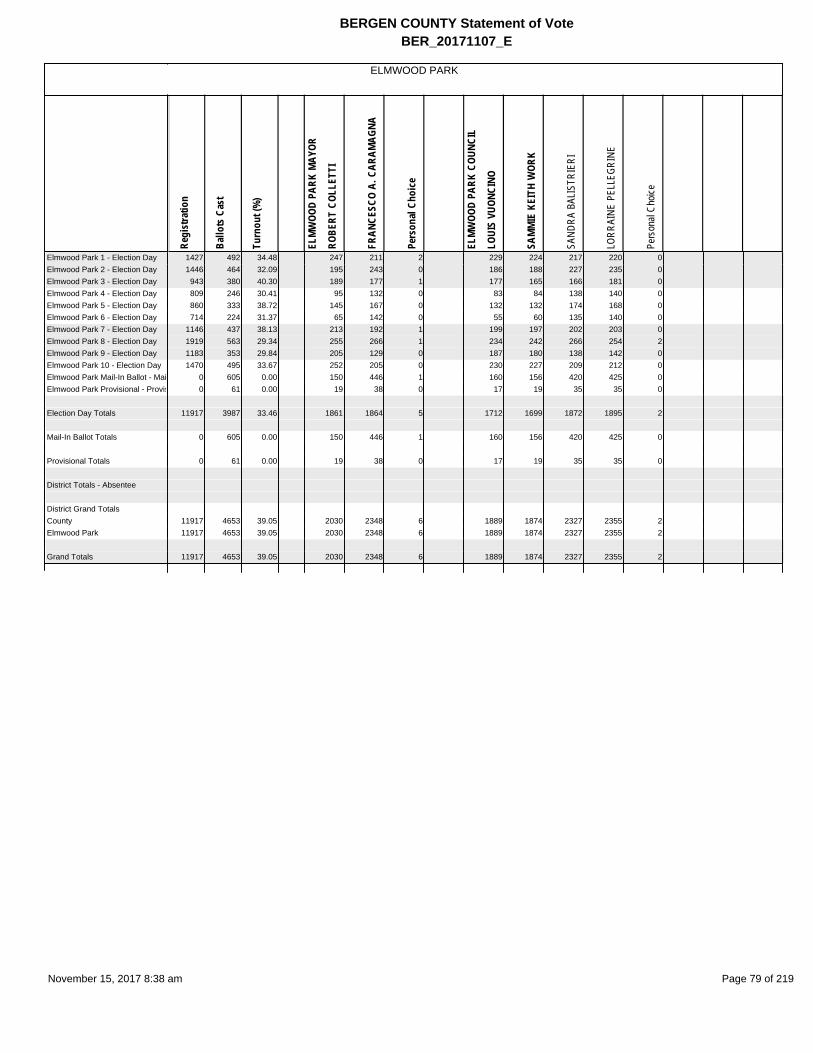
Regi
stra
tion
Ballo
ts C
ast
Turn
out (
%)
ELM
WOO
D PA
RK M
AYOR
ROBE
RT C
OLLE
TTI
FRAN
CESC
O A.
CAR
AMAG
NA
Pers
onal
Cho
ice
ELM
WOO
D PA
RK C
OUNC
IL
LOUI
S VU
ONCI
NO
SAM
MIE
KEI
TH W
ORK
SAND
RA B
ALIS
TRIE
RI
LORR
AINE
PEL
LEGR
INE
Pers
onal
Choic
e
ELMWOOD PARK
BERGEN COUNTY Statement of VoteBER_20171107_E
Elmwood Park 1 - Election Day 1427 492 34.48 247 211 2 229 224 217 220 0Elmwood Park 2 - Election Day 1446 464 32.09 195 243 0 186 188 227 235 0Elmwood Park 3 - Election Day 943 380 40.30 189 177 1 177 165 166 181 0Elmwood Park 4 - Election Day 809 246 30.41 95 132 0 83 84 138 140 0Elmwood Park 5 - Election Day 860 333 38.72 145 167 0 132 132 174 168 0Elmwood Park 6 - Election Day 714 224 31.37 65 142 0 55 60 135 140 0Elmwood Park 7 - Election Day 1146 437 38.13 213 192 1 199 197 202 203 0Elmwood Park 8 - Election Day 1919 563 29.34 255 266 1 234 242 266 254 2Elmwood Park 9 - Election Day 1183 353 29.84 205 129 0 187 180 138 142 0Elmwood Park 10 - Election Day 1470 495 33.67 252 205 0 230 227 209 212 0Elmwood Park Mail-In Ballot - Mai 0 605 0.00 150 446 1 160 156 420 425 0Elmwood Park Provisional - Provis 0 61 0.00 19 38 0 17 19 35 35 0
Election Day Totals 11917 3987 33.46 1861 1864 5 1712 1699 1872 1895 2
Mail-In Ballot Totals 0 605 0.00 150 446 1 160 156 420 425 0
Provisional Totals 0 61 0.00 19 38 0 17 19 35 35 0
District Totals - Absentee
District Grand TotalsCounty 11917 4653 39.05 2030 2348 6 1889 1874 2327 2355 2Elmwood Park 11917 4653 39.05 2030 2348 6 1889 1874 2327 2355 2
Grand Totals 11917 4653 39.05 2030 2348 6 1889 1874 2327 2355 2
November 15, 2017 8:38 am Page 79 of 219

Regi
stra
tion
Ballo
ts C
ast
Turn
out (
%)
EMER
SON
COUN
CIL
MIC
HAEL
E. M
YERS
CHRI
STOP
HER
KNOL
LER
JAM
ES B
AYLE
Y
Pers
onal
Cho
ice
EMERSON COUNCIL
BERGEN COUNTY Statement of VoteBER_20171107_E
Emerson 1 - Election Day 1033 501 48.50 198 260 338 0Emerson 2 - Election Day 837 377 45.04 138 185 271 0Emerson 3 - Election Day 672 269 40.03 100 134 202 0Emerson 4 - Election Day 1065 445 41.78 194 201 280 0Emerson 5 - Election Day 813 338 41.57 122 188 240 0Emerson 6 - Election Day 605 278 45.95 96 161 195 0Emerson Mail-In Ballot - Mail-In Ba 0 122 0.00 47 67 84 2Emerson Provisional - Provisional 0 10 0.00 4 6 2 0
Election Day Totals 5025 2208 43.94 848 1129 1526 0
Mail-In Ballot Totals 0 122 0.00 47 67 84 2
Provisional Totals 0 10 0.00 4 6 2 0
District Totals - Absentee
District Grand TotalsCounty 5025 2340 46.57 899 1202 1612 2Emerson 5025 2340 46.57 899 1202 1612 2
Grand Totals 5025 2340 46.57 899 1202 1612 2
November 15, 2017 8:38 am Page 80 of 219

Regi
stra
tion
Ballo
ts C
ast
Turn
out (
%)
ENGL
EWOO
D W
ARD
1 CO
UNCI
L
CHER
YL R
OSEN
BERG
HORA
CE H
. RAG
BIR
Pers
onal
Cho
ice
ENGLEWOOD WARD 1 COUNCIL
BERGEN COUNTY Statement of VoteBER_20171107_E
Englewood W1 D1 - Election Day 1396 527 37.75 361 20 2Englewood W1 D2 - Election Day 862 361 41.88 240 15 0Englewood W1 D3 - Election Day 793 285 35.94 216 18 0Englewood W1 D4 - Election Day 869 320 36.82 221 31 0Englewood Mail-In Ballot - Mail-In 0 324 0.00 53 3 0Englewood Provisional - Provision 0 40 0.00 9 0 0
Election Day Totals 3920 1493 38.09 1038 84 2
Mail-In Ballot Totals 0 324 0.00 53 3 0
Provisional Totals 0 40 0.00 9 0 0
District Totals - Absentee
District Grand TotalsCounty 3920 1857 47.37 1100 87 2Englewood 3920 1857 47.37 1100 87 2
Grand Totals 3920 1857 47.37 1100 87 2
November 15, 2017 8:38 am Page 81 of 219

Regi
stra
tion
Ballo
ts C
ast
Turn
out (
%)
ENGL
EWOO
D W
ARD
3 CO
UNCI
L
KATH
ARIN
E H.
GLY
NN
GLEN
N CO
LEY
Pers
onal
Cho
ice
ENGLEWOOD WARD 3 COUNCIL
BERGEN COUNTY Statement of VoteBER_20171107_E
Englewood W3 D1 - Election Day 860 290 33.72 191 29 0Englewood W3 D2 - Election Day 1411 574 40.68 372 117 0Englewood W3 D3 - Election Day 706 322 45.61 212 62 2Englewood W3 D4 - Election Day 999 409 40.94 274 85 0Englewood Mail-In Ballot - Mail-In 0 324 0.00 57 10 0Englewood Provisional - Provision 0 40 0.00 6 1 0
Election Day Totals 3976 1595 40.12 1049 293 2
Mail-In Ballot Totals 0 324 0.00 57 10 0
Provisional Totals 0 40 0.00 6 1 0
District Totals - Absentee
District Grand TotalsCounty 3976 1959 49.27 1112 304 2Englewood 3976 1959 49.27 1112 304 2
Grand Totals 3976 1959 49.27 1112 304 2
November 15, 2017 8:38 am Page 82 of 219

Regi
stra
tion
Ballo
ts C
ast
Turn
out (
%)
ENGL
EWOO
D CL
IFFS
COU
NCIL
SANK
ET D
. SHA
H
CARO
LINA
CAL
DERO
N
GLOR
IA O
H
EDW
ARD
F. A
VERS
A
Pers
onal
Cho
ice
ENGLEWOOD CLIFFS COUNCIL
BERGEN COUNTY Statement of VoteBER_20171107_E
Englewood Cliffs 1 - Election Day 1056 439 41.57 170 164 265 253 0Englewood Cliffs 2 - Election Day 874 379 43.36 161 153 206 218 0Englewood Cliffs 3 - Election Day 880 402 45.68 178 170 218 218 0Englewood Cliffs 4 - Election Day 797 327 41.03 139 139 181 179 0Englewood Cliffs Mail-In Ballot - M 0 383 0.00 156 154 221 225 0Englewood Cliffs Provisional - Pro 0 26 0.00 9 11 16 16 0
Election Day Totals 3607 1547 42.89 648 626 870 868 0
Mail-In Ballot Totals 0 383 0.00 156 154 221 225 0
Provisional Totals 0 26 0.00 9 11 16 16 0
District Totals - Absentee
District Grand TotalsCounty 3607 1956 54.23 813 791 1107 1109 0Englewood Cliffs 3607 1956 54.23 813 791 1107 1109 0
Grand Totals 3607 1956 54.23 813 791 1107 1109 0
November 15, 2017 8:38 am Page 83 of 219

Regi
stra
tion
Ballo
ts C
ast
Turn
out (
%)
FAIR
LAW
N CO
UNCI
L
AMY
LEFK
OWIT
Z
MAR
C ZH
ARNE
ST
GAIL
FRI
EDBE
RG R
OTTE
NSTR
ICH
JOSH
UA R
EINI
TZ
Pers
onal
Cho
ice
FAIR LAWN COUNCIL
BERGEN COUNTY Statement of VoteBER_20171107_E
Fair Lawn 1 - Election Day 961 392 40.79 166 153 181 190 0Fair Lawn 2 - Election Day 1378 583 42.31 269 260 288 270 0Fair Lawn 3 - Election Day 856 367 42.87 187 180 145 138 0Fair Lawn 4 - Election Day 1055 450 42.65 191 188 225 227 0Fair Lawn 5 - Election Day 672 304 45.24 147 140 138 139 1Fair Lawn 6 - Election Day 930 386 41.51 169 165 192 189 0Fair Lawn 7 - Election Day 732 334 45.63 143 144 170 167 0Fair Lawn 8 - Election Day 898 375 41.76 135 134 205 207 0Fair Lawn 9 - Election Day 972 400 41.15 170 172 198 193 1Fair Lawn 10 - Election Day 1006 426 42.35 197 174 201 198 0Fair Lawn 11 - Election Day 929 411 44.24 172 165 209 203 0Fair Lawn 12 - Election Day 763 339 44.43 159 143 166 158 0Fair Lawn 13 - Election Day 1052 493 46.86 199 190 283 264 0Fair Lawn 14 - Election Day 773 364 47.09 141 128 211 199 0Fair Lawn 15 - Election Day 1311 449 34.25 169 176 243 239 0Fair Lawn 16 - Election Day 1052 452 42.97 186 189 241 228 1Fair Lawn 17 - Election Day 944 377 39.94 191 187 162 158 0Fair Lawn 18 - Election Day 797 369 46.30 182 180 173 171 0Fair Lawn 19 - Election Day 819 361 44.08 189 179 155 157 0Fair Lawn 20 - Election Day 889 349 39.26 142 140 177 174 0Fair Lawn 21 - Election Day 1181 457 38.70 218 207 203 202 0Fair Lawn 22 - Election Day 838 288 34.37 137 125 133 127 0Fair Lawn 23 - Election Day 1011 446 44.11 204 202 210 210 0Fair Lawn Mail-In Ballot - Mail-In B 0 496 0.00 196 190 291 269 0Fair Lawn Provisional - Provisiona 0 61 0.00 23 23 36 34 0
Election Day Totals 21819 9172 42.04 4063 3921 4509 4408 3
Mail-In Ballot Totals 0 496 0.00 196 190 291 269 0
Provisional Totals 0 61 0.00 23 23 36 34 0
District Totals - Absentee
District Grand TotalsCounty 21819 9729 44.59 4282 4134 4836 4711 3Fair Lawn 21819 9729 44.59 4282 4134 4836 4711 3
Grand Totals 21819 9729 44.59 4282 4134 4836 4711 3
November 15, 2017 8:38 am Page 84 of 219

Regi
stra
tion
Ballo
ts C
ast
Turn
out (
%)
FAIR
VIEW
COU
NCIL
ALBE
RT L
UKIN
STEP
HEN
BURK
E
Pers
onal
Cho
ice
FAIR
VIEW
COU
NCIL
UNE
XPIR
ED
VIOL
ETTA
BER
ISHA
Pers
onal
Cho
ice
FAIR VIEW
BERGEN COUNTY Statement of VoteBER_20171107_E
Fairview 1 - Election Day 757 255 33.69 172 175 0 183 0Fairview 2 - Election Day 1265 396 31.30 270 279 1 282 0Fairview 3 - Election Day 941 297 31.56 184 187 0 201 0Fairview 4 - Election Day 860 258 30.00 166 169 2 176 1Fairview 5 - Election Day 1334 428 32.08 298 296 2 327 1Fairview 6 - Election Day 165 85 51.52 48 53 0 53 0Fairview Mail-In Ballot - Mail-In Ba 0 64 0.00 44 44 2 46 1Fairview Provisional - Provisional 0 8 0.00 7 7 0 7 0
Election Day Totals 5322 1719 32.30 1138 1159 5 1222 2
Mail-In Ballot Totals 0 64 0.00 44 44 2 46 1
Provisional Totals 0 8 0.00 7 7 0 7 0
District Totals - Absentee
District Grand TotalsCounty 5322 1791 33.65 1189 1210 7 1275 3Fair View 5322 1791 33.65 1189 1210 7 1275 3
Grand Totals 5322 1791 33.65 1189 1210 7 1275 3
November 15, 2017 8:38 am Page 85 of 219

Regi
stra
tion
Ballo
ts C
ast
Turn
out (
%)
FORT
LEE
COU
NCIL
MAR
C DE
SIND
ALAN
TEO
MIC
HAEL
SAR
GENT
I
PAUL
YOO
N
Pers
onal
Cho
ice
FORT LEE COUNCIL
BERGEN COUNTY Statement of VoteBER_20171107_E
Fort Lee 1 - Election Day 1117 383 34.29 128 132 220 204 0Fort Lee 2 - Election Day 768 271 35.29 60 65 176 174 2Fort Lee 3 - Election Day 1454 495 34.04 151 147 301 298 0Fort Lee 4 - Election Day 583 269 46.14 78 75 161 159 0Fort Lee 5 - Election Day 908 301 33.15 68 71 185 183 0Fort Lee 6 - Election Day 1556 506 32.52 132 125 331 331 2Fort Lee 7 - Election Day 2142 777 36.27 161 151 515 559 1Fort Lee 8 - Election Day 609 158 25.94 36 35 107 109 0Fort Lee 9 - Election Day 687 203 29.55 73 67 101 109 1Fort Lee 10 - Election Day 2683 836 31.16 208 191 554 561 0Fort Lee 11 - Election Day 683 226 33.09 39 36 146 149 0Fort Lee 12 - Election Day 1270 380 29.92 91 80 253 261 0Fort Lee 13 - Election Day 737 269 36.50 47 46 192 202 0Fort Lee 14 - Election Day 607 223 36.74 46 43 150 152 0Fort Lee 15 - Election Day 777 217 27.93 54 55 134 143 0Fort Lee 16 - Election Day 1013 330 32.58 84 77 206 214 0Fort Lee 17 - Election Day 503 203 40.36 62 60 121 120 0Fort Lee 18 - Election Day 471 169 35.88 50 51 105 96 0Fort Lee 19 - Election Day 1374 483 35.15 81 82 357 352 2Fort Lee Mail-In Ballot - Mail-In Ba 0 463 0.00 99 99 334 339 1Fort Lee Provisional - Provisional 0 62 0.00 11 12 39 45 0
Election Day Totals 19942 6699 33.59 1649 1589 4315 4376 8
Mail-In Ballot Totals 0 463 0.00 99 99 334 339 1
Provisional Totals 0 62 0.00 11 12 39 45 0
District Totals - Absentee
District Grand TotalsCounty 19942 7224 36.23 1759 1700 4688 4760 9Fort Lee 19942 7224 36.23 1759 1700 4688 4760 9
Grand Totals 19942 7224 36.23 1759 1700 4688 4760 9
November 15, 2017 8:38 am Page 86 of 219

Regi
stra
tion
Ballo
ts C
ast
Turn
out (
%)
FRAN
KLIN
LAK
ES C
OUNC
IL
PAUL
ETTE
D. R
AMSE
Y
JOSE
PH F
. KEL
LY
LISA
SCI
ANCA
LEPO
RE
Pers
onal
Cho
ice
FRANKLIN LAKES COUNCIL
BERGEN COUNTY Statement of VoteBER_20171107_E
Franklin Lakes 1 - Election Day 1044 371 35.54 231 233 122 1Franklin Lakes 2 - Election Day 1054 398 37.76 230 232 143 0Franklin Lakes 3 - Election Day 1110 407 36.67 250 260 149 0Franklin Lakes 4 - Election Day 2024 712 35.18 425 432 255 1Franklin Lakes 5 - Election Day 1480 531 35.88 334 359 176 0Franklin Lakes 6 - Election Day 1328 490 36.90 323 331 137 0Franklin Lakes Mail-In Ballot - Mai 0 240 0.00 140 117 118 8Franklin Lakes Provisional - Provis 0 20 0.00 10 14 9 0
Election Day Totals 8040 2909 36.18 1793 1847 982 2
Mail-In Ballot Totals 0 240 0.00 140 117 118 8
Provisional Totals 0 20 0.00 10 14 9 0
District Totals - Absentee
District Grand TotalsCounty 8040 3169 39.42 1943 1978 1109 10Franklin Lakes 8040 3169 39.42 1943 1978 1109 10
Grand Totals 8040 3169 39.42 1943 1978 1109 10
November 15, 2017 8:38 am Page 87 of 219

Regi
stra
tion
Ballo
ts C
ast
Turn
out (
%)
GLEN
ROC
K CO
UNCI
L
EILE
EN M
AHER
HIL
LOCK
AMY
MAR
TIN
ARAT
I KRE
IBIC
H
MIC
HELL
E TO
RPEY
Pers
onal
Cho
ice
GLEN ROCK COUNCIL
BERGEN COUNTY Statement of VoteBER_20171107_E
Glen Rock 1 - Election Day 1038 497 47.88 220 263 250 215 0Glen Rock 2 - Election Day 1143 566 49.52 227 333 324 214 0Glen Rock 3 - Election Day 1168 560 47.95 313 226 238 313 0Glen Rock 4 - Election Day 967 471 48.71 234 212 218 235 0Glen Rock 5 - Election Day 1221 572 46.85 268 297 285 243 0Glen Rock 6 - Election Day 942 432 45.86 182 237 221 183 0Glen Rock 7 - Election Day 1113 531 47.71 238 281 271 231 0Glen Rock 8 - Election Day 832 404 48.56 199 195 199 188 0Glen Rock Mail-In Ballot - Mail-In B 0 329 0.00 129 197 195 121 1Glen Rock Provisional - Provisiona 0 25 0.00 14 10 10 12 0
Election Day Totals 8424 4033 47.88 1881 2044 2006 1822 0
Mail-In Ballot Totals 0 329 0.00 129 197 195 121 1
Provisional Totals 0 25 0.00 14 10 10 12 0
District Totals - Absentee
District Grand TotalsCounty 8424 4387 52.08 2024 2251 2211 1955 1Glen Rock 8424 4387 52.08 2024 2251 2211 1955 1
Grand Totals 8424 4387 52.08 2024 2251 2211 1955 1
November 15, 2017 8:38 am Page 88 of 219

Regi
stra
tion
Ballo
ts C
ast
Turn
out (
%)
HARR
INGT
ON P
ARK
COUN
CIL
JOON
L. C
HUNG
ALLA
N S.
NAP
OLIT
ANO
Pers
onal
Cho
ice
HARRINGTON PARK COUNCIL
BERGEN COUNTY Statement of VoteBER_20171107_E
Harrington Park 1 - Election Day 1017 485 47.69 190 185 0Harrington Park 2 - Election Day 1186 550 46.37 229 223 0Harrington Park 3 - Election Day 1145 561 49.00 206 203 2Harrington Park Mail-In Ballot - Ma 0 87 0.00 48 48 2Harrington Park Provisional - Prov 0 12 0.00 3 3 0
Election Day Totals 3348 1596 47.67 625 611 2
Mail-In Ballot Totals 0 87 0.00 48 48 2
Provisional Totals 0 12 0.00 3 3 0
District Totals - Absentee
District Grand TotalsCounty 3348 1695 50.63 676 662 4Harrington Park 3348 1695 50.63 676 662 4
Grand Totals 3348 1695 50.63 676 662 4
November 15, 2017 8:38 am Page 89 of 219

Regi
stra
tion
Ballo
ts C
ast
Turn
out (
%)
HASB
ROUC
K HE
IGHT
S CO
UNCI
L
JUST
IN A
. DiP
ISA
IVET
TE P
UJAD
AS
CHRI
STOP
HER
HILL
MAN
N
PAM
ELA
J. L
INK
Pers
onal
Cho
ice
HASBROUCK HEIGHTS COUNCIL
BERGEN COUNTY Statement of VoteBER_20171107_E
Hasbrouck Heights 1 - Election Da 865 396 45.78 200 169 159 68 2Hasbrouck Heights 2 - Election Da 1027 409 39.82 184 157 189 65 0Hasbrouck Heights 3 - Election Da 832 348 41.83 186 155 132 38 0Hasbrouck Heights 4 - Election Da 963 419 43.51 194 180 176 60 1Hasbrouck Heights 5 - Election Da 823 323 39.25 154 142 138 41 1Hasbrouck Heights 6 - Election Da 855 379 44.33 177 140 157 76 0Hasbrouck Heights 7 - Election Da 863 357 41.37 161 157 154 44 2Hasbrouck Heights 8 - Election Da 985 410 41.62 179 154 193 53 0Hasbrouck Heights 9 - Election Da 682 262 38.42 115 97 120 36 1Hasbrouck Heights Mail-In Ballot - 0 188 0.00 103 88 73 39 0Hasbrouck Heights Provisional - P 0 19 0.00 7 8 8 3 0
Election Day Totals 7895 3303 41.84 1550 1351 1418 481 7
Mail-In Ballot Totals 0 188 0.00 103 88 73 39 0
Provisional Totals 0 19 0.00 7 8 8 3 0
District Totals - Absentee
District Grand TotalsCounty 7895 3510 44.46 1660 1447 1499 523 7Hasbrouck Heights 7895 3510 44.46 1660 1447 1499 523 7
Grand Totals 7895 3510 44.46 1660 1447 1499 523 7
November 15, 2017 8:38 am Page 90 of 219

Regi
stra
tion
Ballo
ts C
ast
Turn
out (
%)
HAW
ORTH
COU
NCIL
ANTH
ONY
VOLP
E
DONA
LD W
RIGH
T
JACQ
UELI
NE S
. GUE
NEGO
Pers
onal
Cho
ice
HAWORTH COUNCIL
BERGEN COUNTY Statement of VoteBER_20171107_E
Haworth 1 - Election Day 1295 592 45.71 311 277 296 0Haworth 2 - Election Day 1193 550 46.10 277 260 291 0Haworth Mail-In Ballot - Mail-In Ba 0 87 0.00 40 31 57 2Haworth Provisional - Provisional 0 4 0.00 0 2 4 0
Election Day Totals 2488 1142 45.90 588 537 587 0
Mail-In Ballot Totals 0 87 0.00 40 31 57 2
Provisional Totals 0 4 0.00 0 2 4 0
District Totals - Absentee
District Grand TotalsCounty 2488 1233 49.56 628 570 648 2Haworth 2488 1233 49.56 628 570 648 2
Grand Totals 2488 1233 49.56 628 570 648 2
November 15, 2017 8:38 am Page 91 of 219

Regi
stra
tion
Ballo
ts C
ast
Turn
out (
%)
HILL
SDAL
E M
AYOR
UNE
XPIR
ED
MIC
HAEL
SHE
INFI
ELD
JOHN
RUO
CCO
Pers
onal
Cho
ice
HILL
SDAL
E CO
UNCI
L
LOUI
SA G
HIBE
RTI-T
OLED
O
ADAM
TAT
E
ANTH
ONY
DeRO
SA
ZOLT
AN H
ORVA
TH
Pers
onal
Choic
e
HILLSDALE
BERGEN COUNTY Statement of VoteBER_20171107_E
Hillsdale 1 - Election Day 1036 472 45.56 160 284 0 174 175 276 264 0Hillsdale 2 - Election Day 912 404 44.30 190 186 0 189 183 185 184 0Hillsdale 3 - Election Day 1364 585 42.89 237 320 1 260 254 288 284 0Hillsdale 4 - Election Day 1376 592 43.02 185 376 0 210 197 352 348 0Hillsdale 5 - Election Day 1373 631 45.96 183 404 1 208 195 391 373 0Hillsdale 6 - Election Day 1485 643 43.30 279 332 1 293 284 316 315 2Hillsdale Mail-In Ballot - Mail-In Ba 0 192 0.00 89 99 0 97 87 97 89 0Hillsdale Provisional - Provisional 0 9 0.00 5 4 0 5 5 4 4 0
Election Day Totals 7546 3327 44.09 1234 1902 3 1334 1288 1808 1768 2
Mail-In Ballot Totals 0 192 0.00 89 99 0 97 87 97 89 0
Provisional Totals 0 9 0.00 5 4 0 5 5 4 4 0
District Totals - Absentee
District Grand TotalsCounty 7546 3528 46.75 1328 2005 3 1436 1380 1909 1861 2Hillsdale 7546 3528 46.75 1328 2005 3 1436 1380 1909 1861 2
Grand Totals 7546 3528 46.75 1328 2005 3 1436 1380 1909 1861 2
November 15, 2017 8:38 am Page 92 of 219

Regi
stra
tion
Ballo
ts C
ast
Turn
out (
%)
HO H
O KU
S CO
UNCI
L
STEV
EN D
. SHE
LL
EDM
UND
M. I
ANNE
LLI
Pers
onal
Cho
ice
HO HO KUS COUNCIL
BERGEN COUNTY Statement of VoteBER_20171107_E
Ho-Ho-Kus 1 - Election Day 1061 551 51.93 305 302 0Ho-Ho-Kus 2 - Election Day 1104 539 48.82 266 290 0Ho-Ho-Kus 3 - Election Day 914 486 53.17 292 289 0Ho-Ho-Kus Mail-In Ballot - Mail-In 0 89 0.00 46 47 5Ho-Ho-Kus Provisional - Provision 0 13 0.00 4 4 0
Election Day Totals 3079 1576 51.19 863 881 0
Mail-In Ballot Totals 0 89 0.00 46 47 5
Provisional Totals 0 13 0.00 4 4 0
District Totals - Absentee
District Grand TotalsCounty 3079 1678 54.50 913 932 5Ho-Ho-Kus 3079 1678 54.50 913 932 5
Grand Totals 3079 1678 54.50 913 932 5
November 15, 2017 8:38 am Page 93 of 219

Regi
stra
tion
Ballo
ts C
ast
Turn
out (
%)
LEON
IA C
OUNC
IL
MAU
REEN
E. D
AVIS
PASQ
UALE
A. F
USCO
Pers
onal
Cho
ice
LEONIA COUNCIL
BERGEN COUNTY Statement of VoteBER_20171107_E
Leonia 1 - Election Day 876 385 43.95 273 275 3Leonia 2 - Election Day 812 346 42.61 250 254 4Leonia 3 - Election Day 767 301 39.24 217 219 2Leonia 4 - Election Day 787 257 32.66 160 160 0Leonia 5 - Election Day 1171 459 39.20 292 300 0Leonia 6 - Election Day 725 277 38.21 171 172 4Leonia Mail-In Ballot - Mail-In Ballo 0 93 0.00 58 58 2Leonia Provisional - Provisional 0 9 0.00 8 8 0
Election Day Totals 5138 2025 39.41 1363 1380 13
Mail-In Ballot Totals 0 93 0.00 58 58 2
Provisional Totals 0 9 0.00 8 8 0
District Totals - Absentee
District Grand TotalsCounty 5138 2127 41.40 1429 1446 15Leonia 5138 2127 41.40 1429 1446 15
Grand Totals 5138 2127 41.40 1429 1446 15
November 15, 2017 8:38 am Page 94 of 219

Regi
stra
tion
Ballo
ts C
ast
Turn
out (
%)
LITT
LE F
ERRY
COU
NCIL
JENI
FER
A. L
ANGE
MAR
GARE
T A.
STE
INHI
LBER
Pers
onal
Cho
ice
LITTLE FERRY COUNCIL
BERGEN COUNTY Statement of VoteBER_20171107_E
Little Ferry 1 - Election Day 809 277 34.24 171 175 0Little Ferry 2 - Election Day 611 190 31.10 121 124 0Little Ferry 3 - Election Day 1114 304 27.29 184 180 0Little Ferry 4 - Election Day 838 261 31.15 158 157 4Little Ferry 5 - Election Day 1192 305 25.59 206 207 0Little Ferry 6 - Election Day 796 248 31.16 158 153 0Little Ferry Mail-In Ballot - Mail-In 0 101 0.00 71 72 0Little Ferry Provisional - Provisiona 0 10 0.00 4 4 0
Election Day Totals 5360 1585 29.57 998 996 4
Mail-In Ballot Totals 0 101 0.00 71 72 0
Provisional Totals 0 10 0.00 4 4 0
District Totals - Absentee
District Grand TotalsCounty 5360 1696 31.64 1073 1072 4Little Ferry 5360 1696 31.64 1073 1072 4
Grand Totals 5360 1696 31.64 1073 1072 4
November 15, 2017 8:38 am Page 95 of 219

Regi
stra
tion
Ballo
ts C
ast
Turn
out (
%)
MAH
WAH
COU
NCIL
1 Y
R
VICT
ORIA
N. G
ALOW
GEOR
GE W
. ERV
IN
Pers
onal
Cho
ice
MAH
WAH
COU
NCIL
3 Y
R
SUSA
N B.
STE
INBE
RG
DAVI
D C.
MAY
Pers
onal
Choic
e
MAHWAH
BERGEN COUNTY Statement of VoteBER_20171107_E
Mahwah 1 - Election Day 1581 771 48.77 272 325 1 237 372 0Mahwah 2 - Election Day 1236 685 55.42 230 343 0 199 373 1Mahwah 3 - Election Day 1256 614 48.89 166 333 0 153 337 0Mahwah 4 - Election Day 1051 522 49.67 218 167 1 202 175 0Mahwah 5 - Election Day 947 432 45.62 129 200 0 114 222 0Mahwah 6 - Election Day 1188 545 45.88 171 200 0 166 207 0Mahwah 7 - Election Day 1536 732 47.66 233 328 0 199 362 0Mahwah 8 - Election Day 1366 495 36.24 182 184 0 168 202 0Mahwah 9 - Election Day 484 212 43.80 50 107 0 43 111 0Mahwah 10 - Election Day 1424 650 45.65 238 254 0 218 269 0Mahwah 11 - Election Day 1595 739 46.33 199 387 0 179 412 0Mahwah 12 - Election Day 749 378 50.47 134 149 0 128 163 0Mahwah 13 - Election Day 1063 426 40.08 146 122 1 132 142 0Mahwah 14 - Election Day 1098 417 37.98 159 130 0 140 143 1Mahwah Mail-In Ballot - Mail-In Ba 0 385 0.00 153 165 2 131 181 3Mahwah Provisional - Provisional 0 58 0.00 20 21 0 17 24 0
Election Day Totals 16574 7618 45.96 2527 3229 3 2278 3490 2
Mail-In Ballot Totals 0 385 0.00 153 165 2 131 181 3
Provisional Totals 0 58 0.00 20 21 0 17 24 0
District Totals - Absentee
District Grand TotalsCounty 16574 8061 48.64 2700 3415 5 2426 3695 5Mahwah 16574 8061 48.64 2700 3415 5 2426 3695 5
Grand Totals 16574 8061 48.64 2700 3415 5 2426 3695 5
November 15, 2017 8:38 am Page 96 of 219

Regi
stra
tion
Ballo
ts C
ast
Turn
out (
%)
MAY
WOO
D CO
UNCI
L
FRAN
CIS
J. M
ESSA
R III
RICK
IE A
. DE
HEER
RYAN
P. U
LLM
AN
MAT
THEW
T. G
AROF
ALOW
Pers
onal
Cho
ice
MAYWOOD COUNCIL
BERGEN COUNTY Statement of VoteBER_20171107_E
Maywood 1 - Election Day 926 377 40.71 142 145 214 210 0Maywood 2 - Election Day 898 373 41.54 193 182 170 171 0Maywood 3 - Election Day 915 379 41.42 188 178 181 183 0Maywood 4 - Election Day 905 408 45.08 193 192 195 193 0Maywood 5 - Election Day 867 371 42.79 166 167 180 177 0Maywood 6 - Election Day 878 378 43.05 163 164 195 190 3Maywood 7 - Election Day 689 192 27.87 80 80 105 102 0Maywood Mail-In Ballot - Mail-In B 0 160 0.00 68 70 86 87 0Maywood Provisional - Provisiona 0 11 0.00 6 5 6 5 0
Election Day Totals 6078 2478 40.77 1125 1108 1240 1226 3
Mail-In Ballot Totals 0 160 0.00 68 70 86 87 0
Provisional Totals 0 11 0.00 6 5 6 5 0
District Totals - Absentee
District Grand TotalsCounty 6078 2649 43.58 1199 1183 1332 1318 3Maywood 6078 2649 43.58 1199 1183 1332 1318 3
Grand Totals 6078 2649 43.58 1199 1183 1332 1318 3
November 15, 2017 8:38 am Page 97 of 219

Regi
stra
tion
Ballo
ts C
ast
Turn
out (
%)
MID
LAND
PAR
K CO
UNCI
L
MAR
K BR
AUNI
US
LORR
AINE
DeL
UCA
RUSS
ELL
D. K
AMP
JOHN
J. C
ONSI
DINE
Pers
onal
Cho
ice
MIDLAND PARK COUNCIL
BERGEN COUNTY Statement of VoteBER_20171107_E
Midland Park 1 - Election Day 1135 547 48.19 170 208 253 215 2Midland Park 2 - Election Day 745 345 46.31 140 150 148 118 0Midland Park 3 - Election Day 1151 525 45.61 172 201 243 182 1Midland Park 4 - Election Day 896 409 45.65 183 204 139 112 0Midland Park 5 - Election Day 1083 526 48.57 188 215 222 198 0Midland Park Mail-In Ballot - Mail- 0 104 0.00 33 47 47 37 0Midland Park Provisional - Provisio 0 17 0.00 2 3 7 7 0
Election Day Totals 5010 2352 46.95 853 978 1005 825 3
Mail-In Ballot Totals 0 104 0.00 33 47 47 37 0
Provisional Totals 0 17 0.00 2 3 7 7 0
District Totals - Absentee
District Grand TotalsCounty 5010 2473 49.36 888 1028 1059 869 3Midland Park 5010 2473 49.36 888 1028 1059 869 3
Grand Totals 5010 2473 49.36 888 1028 1059 869 3
November 15, 2017 8:38 am Page 98 of 219

Regi
stra
tion
Ballo
ts C
ast
Turn
out (
%)
MON
TVAL
E CO
UNCI
L
ROSE
S. C
URRY
DOUG
LAS
M. A
REND
ACS
ROBE
RT P
. ZIT
ELLI
KARI
SOL
OMON
Pers
onal
Cho
ice
MONTVALE COUNCIL
BERGEN COUNTY Statement of VoteBER_20171107_E
Montvale 1 - Election Day 738 351 47.56 188 196 133 142 0Montvale 2 - Election Day 1113 528 47.44 278 294 201 201 1Montvale 3 - Election Day 1929 836 43.34 417 478 293 333 3Montvale 4 - Election Day 1849 749 40.51 356 422 287 294 6Montvale Mail-In Ballot - Mail-In Ba 0 164 0.00 85 84 64 66 0Montvale Provisional - Provisional 0 14 0.00 5 6 6 8 0
Election Day Totals 5629 2464 43.77 1239 1390 914 970 10
Mail-In Ballot Totals 0 164 0.00 85 84 64 66 0
Provisional Totals 0 14 0.00 5 6 6 8 0
District Totals - Absentee
District Grand TotalsCounty 5629 2642 46.94 1329 1480 984 1044 10Montvale 5629 2642 46.94 1329 1480 984 1044 10
Grand Totals 5629 2642 46.94 1329 1480 984 1044 10
November 15, 2017 8:38 am Page 99 of 219

Regi
stra
tion
Ballo
ts C
ast
Turn
out (
%)
MOO
NACH
IE C
OUNC
IL
MAN
UEL
MAR
TINE
Z J
R.
ANTO
NIO
CIRI
LLO
KAM
RAN
ALI
Pers
onal
Cho
ice
MOONACHIE COUNCIL
BERGEN COUNTY Statement of VoteBER_20171107_E
Moonachie 1 - Election Day 296 70 23.65 38 39 0 0Moonachie 2 - Election Day 890 313 35.17 180 212 18 0Moonachie 3 - Election Day 414 120 28.99 74 74 1 0Moonachie Mail-In Ballot - Mail-In 0 24 0.00 18 16 2 0Moonachie Provisional - Provision 0 1 0.00 1 1 0 0
Election Day Totals 1600 503 31.44 292 325 19 0
Mail-In Ballot Totals 0 24 0.00 18 16 2 0
Provisional Totals 0 1 0.00 1 1 0 0
District Totals - Absentee
District Grand TotalsCounty 1600 528 33.00 311 342 21 0Moonachie 1600 528 33.00 311 342 21 0
Grand Totals 1600 528 33.00 311 342 21 0
November 15, 2017 8:38 am Page 100 of 219

Regi
stra
tion
Ballo
ts C
ast
Turn
out (
%)
NEW
MIL
FORD
COU
NCIL
JOSE
ALO
NSO
DOM
INIC
COL
UCCI
MIC
HAEL
J. P
UTRI
NO
IRA
S. G
ROTS
KY
Pers
onal
Cho
ice
NEW MILFORD COUNCIL
BERGEN COUNTY Statement of VoteBER_20171107_E
New Milford 1 - Election Day 1273 541 42.50 212 215 305 275 0New Milford 2 - Election Day 1185 524 44.22 234 234 271 245 0New Milford 3 - Election Day 1267 573 45.22 270 278 274 255 0New Milford 4 - Election Day 1356 567 41.81 282 308 257 231 0New Milford 5 - Election Day 1081 421 38.95 180 180 225 199 0New Milford 6 - Election Day 918 323 35.19 110 116 196 187 0New Milford 7 - Election Day 778 251 32.26 75 72 159 150 0New Milford 8 - Election Day 1404 580 41.31 263 269 285 263 0New Milford 9 - Election Day 861 383 44.48 180 190 185 178 0New Milford Mail-In Ballot - Mail-In 0 210 0.00 74 74 128 122 0New Milford Provisional - Provision 0 32 0.00 11 12 19 18 0
Election Day Totals 10123 4163 41.12 1806 1862 2157 1983 0
Mail-In Ballot Totals 0 210 0.00 74 74 128 122 0
Provisional Totals 0 32 0.00 11 12 19 18 0
District Totals - Absentee
District Grand TotalsCounty 10123 4405 43.51 1891 1948 2304 2123 0New Milford 10123 4405 43.51 1891 1948 2304 2123 0
Grand Totals 10123 4405 43.51 1891 1948 2304 2123 0
November 15, 2017 8:38 am Page 101 of 219

Regi
stra
tion
Ballo
ts C
ast
Turn
out (
%)
NORT
H AR
LING
TON
COUN
CIL
DANI
EL H
. PRO
NTI
MAR
IJO
L. K
ARCI
C JR
.
THOM
AS A
. ZAM
MAT
ORE
KELL
Y A.
VEL
EZ
Pers
onal
Cho
ice
NORTH ARLINGTON COUNCIL
BERGEN COUNTY Statement of VoteBER_20171107_E
North Arlington 1 - Election Day 547 226 41.32 133 127 75 78 0North Arlington 2 - Election Day 789 294 37.26 143 141 129 131 0North Arlington 3 - Election Day 934 360 38.54 179 167 155 160 1North Arlington 4 - Election Day 969 423 43.65 238 217 171 167 2North Arlington 5 - Election Day 1224 481 39.30 275 264 175 170 0North Arlington 6 - Election Day 968 346 35.74 169 170 138 136 0North Arlington 7 - Election Day 1448 635 43.85 346 341 259 245 0North Arlington 8 - Election Day 692 289 41.76 156 153 113 132 0North Arlington 9 - Election Day 970 408 42.06 233 232 147 140 2North Arlington 10 - Election Day 643 273 42.46 144 119 114 117 0North Arlington Mail-In Ballot - Ma 0 302 0.00 200 192 98 95 0North Arlington Provisional - Provi 0 16 0.00 5 5 8 10 0
Election Day Totals 9184 3735 40.67 2016 1931 1476 1476 5
Mail-In Ballot Totals 0 302 0.00 200 192 98 95 0
Provisional Totals 0 16 0.00 5 5 8 10 0
District Totals - Absentee
District Grand TotalsCounty 9184 4053 44.13 2221 2128 1582 1581 5North Arlington 9184 4053 44.13 2221 2128 1582 1581 5
Grand Totals 9184 4053 44.13 2221 2128 1582 1581 5
November 15, 2017 8:38 am Page 102 of 219

Regi
stra
tion
Ballo
ts C
ast
Turn
out (
%)
NORT
HVAL
E CO
UNCI
L
ROY
J. S
OKOL
OSKI
KENN
ETH
F. S
HEPA
RD
THOM
AS R
. ARG
IRO
Pers
onal
Cho
ice
NORTHVALE COUNCIL
BERGEN COUNTY Statement of VoteBER_20171107_E
Northvale 1 - Election Day 976 422 43.24 205 209 213 1Northvale 2 - Election Day 836 317 37.92 155 155 141 0Northvale 3 - Election Day 1156 464 40.14 212 270 243 0Northvale Mail-In Ballot - Mail-In B 0 50 0.00 29 23 24 1Northvale Provisional - Provisiona 0 2 0.00 0 2 2 0
Election Day Totals 2968 1203 40.53 572 634 597 1
Mail-In Ballot Totals 0 50 0.00 29 23 24 1
Provisional Totals 0 2 0.00 0 2 2 0
District Totals - Absentee
District Grand TotalsCounty 2968 1255 42.28 601 659 623 2Northvale 2968 1255 42.28 601 659 623 2
Grand Totals 2968 1255 42.28 601 659 623 2
November 15, 2017 8:38 am Page 103 of 219

Regi
stra
tion
Ballo
ts C
ast
Turn
out (
%)
NORW
OOD
COUN
CIL
BARR
Y A.
SCO
TT
PAUL
STU
ART
HABE
RMAN
ALLE
N RA
PAPO
RT
GEOR
GE L
. SAN
TIAG
O
Pers
onal
Cho
ice
NORWOOD COUNCIL
BERGEN COUNTY Statement of VoteBER_20171107_E
Norwood 1 - Election Day 1761 857 48.67 417 399 347 394 0Norwood 2 - Election Day 1899 821 43.23 410 414 321 344 3Norwood Mail-In Ballot - Mail-In Ba 0 88 0.00 41 35 43 45 0Norwood Provisional - Provisional 0 3 0.00 3 3 0 0 0
Election Day Totals 3660 1678 45.85 827 813 668 738 3
Mail-In Ballot Totals 0 88 0.00 41 35 43 45 0
Provisional Totals 0 3 0.00 3 3 0 0 0
District Totals - Absentee
District Grand TotalsCounty 3660 1769 48.33 871 851 711 783 3Norwood 3660 1769 48.33 871 851 711 783 3
Grand Totals 3660 1769 48.33 871 851 711 783 3
November 15, 2017 8:38 am Page 104 of 219

Regi
stra
tion
Ballo
ts C
ast
Turn
out (
%)
OAKL
AND
COUN
CIL
RUSS
ELL
TALA
MIN
I
PASQ
UALE
A. P
IGNA
TELL
I
SAND
RA C
OIRA
THOM
AS F
. CON
NOLL
Y
Pers
onal
Cho
ice
OAKLAND COUNCIL
BERGEN COUNTY Statement of VoteBER_20171107_E
Oakland 1 - Election Day 1001 452 45.15 201 215 209 210 0Oakland 2 - Election Day 912 394 43.20 198 214 159 147 0Oakland 3 - Election Day 755 331 43.84 168 169 141 133 1Oakland 4 - Election Day 942 428 45.44 218 233 175 171 0Oakland 5 - Election Day 1013 468 46.20 195 218 235 200 0Oakland 6 - Election Day 1232 556 45.13 285 311 234 213 0Oakland 7 - Election Day 1257 546 43.44 305 306 216 201 0Oakland 8 - Election Day 1705 605 35.48 271 291 298 285 0Oakland Mail-In Ballot - Mail-In Ba 0 199 0.00 85 93 111 94 1Oakland Provisional - Provisional 0 7 0.00 4 5 3 2 0
Election Day Totals 8817 3780 42.87 1841 1957 1667 1560 1
Mail-In Ballot Totals 0 199 0.00 85 93 111 94 1
Provisional Totals 0 7 0.00 4 5 3 2 0
District Totals - Absentee
District Grand TotalsCounty 8817 3986 45.21 1930 2055 1781 1656 2Oakland 8817 3986 45.21 1930 2055 1781 1656 2
Grand Totals 8817 3986 45.21 1930 2055 1781 1656 2
November 15, 2017 8:38 am Page 105 of 219

Regi
stra
tion
Ballo
ts C
ast
Turn
out (
%)
OLD
TAPP
AN C
OUNC
IL
RONA
LD E
. BIN
AGHI
JR.
THOM
AS E
. GAL
LAGH
ER
Pers
onal
Cho
ice
OLD TAPPAN COUNCIL
BERGEN COUNTY Statement of VoteBER_20171107_E
Old Tappan 1 - Election Day 1201 435 36.22 262 263 0Old Tappan 2 - Election Day 1443 477 33.06 274 274 2Old Tappan 3 - Election Day 1513 497 32.85 279 288 1Old Tappan Mail-In Ballot - Mail-In 0 128 0.00 81 83 2Old Tappan Provisional - Provision 0 6 0.00 5 5 0
Election Day Totals 4157 1409 33.89 815 825 3
Mail-In Ballot Totals 0 128 0.00 81 83 2
Provisional Totals 0 6 0.00 5 5 0
District Totals - Absentee
District Grand TotalsCounty 4157 1543 37.12 901 913 5Old Tappan 4157 1543 37.12 901 913 5
Grand Totals 4157 1543 37.12 901 913 5
November 15, 2017 8:38 am Page 106 of 219

Regi
stra
tion
Ballo
ts C
ast
Turn
out (
%)
ORAD
ELL
COUN
CIL
THOM
AS P
. KEL
LY
PAUL
TIN
A
ROBE
RT M
. JAN
NICE
LLI
MIR
IAM
D. Y
U
Pers
onal
Cho
ice
ORADELL COUNCIL
BERGEN COUNTY Statement of VoteBER_20171107_E
Oradell 1 - Election Day 977 474 48.52 221 207 242 244 2Oradell 2 - Election Day 886 387 43.68 185 177 198 187 0Oradell 3 - Election Day 922 450 48.81 218 210 217 214 0Oradell 4 - Election Day 934 461 49.36 202 178 240 249 0Oradell 5 - Election Day 1122 530 47.24 288 236 254 246 0Oradell 6 - Election Day 1122 530 47.24 310 268 224 211 1Oradell Mail-In Ballot - Mail-In Ball 0 184 0.00 74 67 112 109 0Oradell Provisional - Provisional 0 14 0.00 7 7 7 7 0
Election Day Totals 5963 2832 47.49 1424 1276 1375 1351 3
Mail-In Ballot Totals 0 184 0.00 74 67 112 109 0
Provisional Totals 0 14 0.00 7 7 7 7 0
District Totals - Absentee
District Grand TotalsCounty 5963 3030 50.81 1505 1350 1494 1467 3Oradell 5963 3030 50.81 1505 1350 1494 1467 3
Grand Totals 5963 3030 50.81 1505 1350 1494 1467 3
November 15, 2017 8:38 am Page 107 of 219

Regi
stra
tion
Ballo
ts C
ast
Turn
out (
%)
PALI
SADE
S PA
RK C
OUNC
IL
PAUL
J. A
LBAN
ESE
VINC
ENT
R. C
ARNO
VALE
FRAN
K DO
NOHU
E
CYNT
HIA
A. P
IRRE
RA
Pers
onal
Cho
ice
PALISADES PARK COUNCIL
BERGEN COUNTY Statement of VoteBER_20171107_E
Palisades Park 1 - Election Day 569 132 23.20 29 29 88 88 0Palisades Park 2 - Election Day 701 241 34.38 70 64 122 121 0Palisades Park 3 - Election Day 696 170 24.43 53 47 102 93 0Palisades Park 4 - Election Day 744 186 25.00 54 48 111 92 0Palisades Park 5 - Election Day 853 199 23.33 71 69 109 100 0Palisades Park 6 - Election Day 1144 291 25.44 108 84 144 138 0Palisades Park 7 - Election Day 748 193 25.80 73 63 103 98 0Palisades Park 8 - Election Day 944 206 21.82 62 58 109 116 0Palisades Park 9 - Election Day 1088 208 19.12 60 51 125 125 2Palisades Park Mail-In Ballot - Ma 0 301 0.00 87 93 195 192 2Palisades Park Provisional - Provi 0 37 0.00 10 10 24 24 0
Election Day Totals 7487 1826 24.39 580 513 1013 971 2
Mail-In Ballot Totals 0 301 0.00 87 93 195 192 2
Provisional Totals 0 37 0.00 10 10 24 24 0
District Totals - Absentee
District Grand TotalsCounty 7487 2164 28.90 677 616 1232 1187 4Palisades Park 7487 2164 28.90 677 616 1232 1187 4
Grand Totals 7487 2164 28.90 677 616 1232 1187 4
November 15, 2017 8:38 am Page 108 of 219

Regi
stra
tion
Ballo
ts C
ast
Turn
out (
%)
PARA
MUS
COU
NCIL
CHRI
STOP
HER
DiPI
AZZA
MOH
AMM
ED R
EDA
MAR
IAEL
ENA
BELL
INGE
R
JOSE
PH G
ARCI
A
Pers
onal
Cho
ice
PARAMUS COUNCIL
BERGEN COUNTY Statement of VoteBER_20171107_E
Paramus 1 - Election Day 1250 397 31.76 191 170 190 186 0Paramus 2 - Election Day 946 360 38.05 156 140 175 187 0Paramus 3 - Election Day 1066 455 42.68 227 200 213 205 0Paramus 4 - Election Day 823 304 36.94 149 138 144 146 0Paramus 5 - Election Day 746 323 43.30 160 140 163 148 0Paramus 6 - Election Day 887 334 37.66 150 121 175 184 0Paramus 7 - Election Day 975 441 45.23 216 193 214 208 0Paramus 8 - Election Day 911 317 34.80 193 172 109 108 0Paramus 9 - Election Day 864 325 37.62 166 144 147 144 0Paramus 10 - Election Day 790 294 37.22 138 124 145 149 0Paramus 11 - Election Day 740 277 37.43 132 115 140 136 0Paramus 12 - Election Day 1277 521 40.80 294 259 211 220 1Paramus 13 - Election Day 625 262 41.92 126 112 127 127 0Paramus 14 - Election Day 933 351 37.62 184 160 164 164 0Paramus 15 - Election Day 1422 471 33.12 212 193 254 241 0Paramus 16 - Election Day 698 308 44.13 178 157 114 122 0Paramus 17 - Election Day 841 324 38.53 174 141 148 145 0Paramus 18 - Election Day 600 256 42.67 99 84 147 149 0Paramus 19 - Election Day 717 332 46.30 138 125 186 177 0Paramus 20 - Election Day 832 318 38.22 154 124 164 145 0Paramus Mail-In Ballot - Mail-In Ba 0 542 0.00 255 217 272 274 0Paramus Provisional - Provisional 0 37 0.00 19 18 14 14 0
Election Day Totals 17943 6970 38.85 3437 3012 3330 3291 1
Mail-In Ballot Totals 0 542 0.00 255 217 272 274 0
Provisional Totals 0 37 0.00 19 18 14 14 0
District Totals - Absentee
District Grand TotalsCounty 17943 7549 42.07 3711 3247 3616 3579 1Paramus 17943 7549 42.07 3711 3247 3616 3579 1
Grand Totals 17943 7549 42.07 3711 3247 3616 3579 1
November 15, 2017 8:38 am Page 109 of 219

Regi
stra
tion
Ballo
ts C
ast
Turn
out (
%)
PARK
RID
GE M
AYOR
UNE
XPIR
ED
RICH
ARD
BOSI
KEIT
H M
ISCI
AGNA
Pers
onal
Cho
ice
PARK
RID
GE C
OUNC
IL
KERI
COO
PER
DONN
A P.
SZO
T
THOM
AS F
ARIN
ARO
MIC
HAEL
G. M
INTZ
Pers
onal
Choic
e
PARK RIDGE
BERGEN COUNTY Statement of VoteBER_20171107_E
Park Ridge 1 - Election Day 1195 667 55.82 233 407 3 290 267 337 361 2Park Ridge 2 - Election Day 875 440 50.29 182 234 0 210 192 208 219 0Park Ridge 3 - Election Day 951 507 53.31 185 304 0 246 211 235 269 0Park Ridge 4 - Election Day 868 472 54.38 146 310 0 201 176 240 268 0Park Ridge 5 - Election Day 1088 487 44.76 178 284 1 228 210 223 241 0Park Ridge 6 - Election Day 1174 609 51.87 196 386 0 258 218 323 349 0Park Ridge Mail-In Ballot - Mail-In 0 138 0.00 59 76 1 61 62 70 69 0Park Ridge Provisional - Provision 0 16 0.00 4 12 0 8 8 7 9 0
Election Day Totals 6151 3182 51.73 1120 1925 4 1433 1274 1566 1707 2
Mail-In Ballot Totals 0 138 0.00 59 76 1 61 62 70 69 0
Provisional Totals 0 16 0.00 4 12 0 8 8 7 9 0
District Totals - Absentee
District Grand TotalsCounty 6151 3336 54.24 1183 2013 5 1502 1344 1643 1785 2Park Ridge 6151 3336 54.24 1183 2013 5 1502 1344 1643 1785 2
Grand Totals 6151 3336 54.24 1183 2013 5 1502 1344 1643 1785 2
November 15, 2017 8:38 am Page 110 of 219

Regi
stra
tion
Ballo
ts C
ast
Turn
out (
%)
RAM
SEY
COUN
CIL
JOSE
PH V
ERDO
NE
MIC
HAEL
W. G
UTW
ETTE
R
DEBR
A A.
SAH
LER
APAR
NA M
ULCH
ANDA
NI
Pers
onal
Cho
ice
RAMSEY COUNCIL
BERGEN COUNTY Statement of VoteBER_20171107_E
Ramsey 1 - Election Day 1185 529 44.64 235 227 255 260 1Ramsey 2 - Election Day 1482 717 48.38 384 369 289 290 1Ramsey 3 - Election Day 1457 724 49.69 385 380 287 290 0Ramsey 4 - Election Day 785 350 44.59 189 191 135 133 0Ramsey 5 - Election Day 1508 701 46.49 371 368 282 289 0Ramsey 6 - Election Day 1828 718 39.28 351 354 317 303 2Ramsey 7 - Election Day 1242 567 45.65 330 325 208 204 1Ramsey 8 - Election Day 1006 488 48.51 318 300 162 149 1Ramsey Mail-In Ballot - Mail-In Ba 0 280 0.00 152 142 120 129 2Ramsey Provisional - Provisional 0 14 0.00 10 9 5 4 0
Election Day Totals 10493 4794 45.69 2563 2514 1935 1918 6
Mail-In Ballot Totals 0 280 0.00 152 142 120 129 2
Provisional Totals 0 14 0.00 10 9 5 4 0
District Totals - Absentee
District Grand TotalsCounty 10493 5088 48.49 2725 2665 2060 2051 8Ramsey 10493 5088 48.49 2725 2665 2060 2051 8
Grand Totals 10493 5088 48.49 2725 2665 2060 2051 8
November 15, 2017 8:38 am Page 111 of 219

Regi
stra
tion
Ballo
ts C
ast
Turn
out (
%)
RIDG
EFIE
LD C
OUNC
IL
RUSS
ELL
A. C
ASTE
LLI
JAVI
ER A
COST
A
Pers
onal
Cho
ice
RIDGEFIELD COUNCIL
BERGEN COUNTY Statement of VoteBER_20171107_E
Ridgefield 1 - Election Day 1202 396 32.95 226 233 12Ridgefield 2 - Election Day 921 358 38.87 222 230 3Ridgefield 3 - Election Day 1481 429 28.97 288 299 2Ridgefield 4 - Election Day 963 303 31.46 186 189 6Ridgefield 5 - Election Day 1300 382 29.38 221 223 3Ridgefield Mail-In Ballot - Mail-In B 0 135 0.00 61 66 12Ridgefield Provisional - Provisiona 0 14 0.00 10 9 12
Election Day Totals 5867 1868 31.84 1143 1174 26
Mail-In Ballot Totals 0 135 0.00 61 66 12
Provisional Totals 0 14 0.00 10 9 12
District Totals - Absentee
District Grand TotalsCounty 5867 2017 34.38 1214 1249 50Ridgefield 5867 2017 34.38 1214 1249 50
Grand Totals 5867 2017 34.38 1214 1249 50
November 15, 2017 8:38 am Page 112 of 219

Regi
stra
tion
Ballo
ts C
ast
Turn
out (
%)
RIDG
EFIE
LD P
ARK
COM
MIS
SION
ER
THER
ESA
A. K
OHLE
S
Pers
onal
Cho
ice
RIDGEFIELD PARK COMMISSIONER
BERGEN COUNTY Statement of VoteBER_20171107_E
Ridgefield Park 1 - Election Day 588 227 38.61 62 0Ridgefield Park 2 - Election Day 1076 382 35.50 105 2Ridgefield Park 3 - Election Day 797 255 31.99 74 2Ridgefield Park 4 - Election Day 1073 393 36.63 128 4Ridgefield Park 5 - Election Day 602 230 38.21 84 2Ridgefield Park 6 - Election Day 964 382 39.63 139 4Ridgefield Park 7 - Election Day 935 359 38.40 120 4Ridgefield Park 8 - Election Day 1125 451 40.09 170 1Ridgefield Park Mail-In Ballot - Ma 0 98 0.00 45 0Ridgefield Park Provisional - Provi 0 26 0.00 7 0
Election Day Totals 7160 2679 37.42 882 19
Mail-In Ballot Totals 0 98 0.00 45 0
Provisional Totals 0 26 0.00 7 0
District Totals - Absentee
District Grand TotalsCounty 7160 2803 39.15 934 19Ridgefield Park 7160 2803 39.15 934 19
Grand Totals 7160 2803 39.15 934 19
November 15, 2017 8:38 am Page 113 of 219

Regi
stra
tion
Ballo
ts C
ast
Turn
out (
%)
RIVE
R ED
GE C
OUNC
IL
THOM
AS P
APAL
EO
DARI
O A.
CHI
NIGO
ANN
MAR
IE R
UDIS
Pers
onal
Cho
ice
RIVER EDGE COUNCIL
BERGEN COUNTY Statement of VoteBER_20171107_E
River Edge 1 - Election Day 1133 485 42.81 286 269 188 0River Edge 2 - Election Day 964 410 42.53 228 224 169 0River Edge 3 - Election Day 863 371 42.99 213 196 147 2River Edge 4 - Election Day 935 444 47.49 278 264 158 0River Edge 5 - Election Day 758 301 39.71 172 182 107 0River Edge 6 - Election Day 878 347 39.52 176 197 119 0River Edge 7 - Election Day 914 366 40.04 236 220 122 0River Edge 8 - Election Day 752 241 32.05 149 142 75 0River Edge Mail-In Ballot - Mail-In 0 198 0.00 115 113 74 0River Edge Provisional - Provision 0 7 0.00 4 4 3 0
Election Day Totals 7197 2965 41.20 1738 1694 1085 2
Mail-In Ballot Totals 0 198 0.00 115 113 74 0
Provisional Totals 0 7 0.00 4 4 3 0
District Totals - Absentee
District Grand TotalsCounty 7197 3170 44.05 1857 1811 1162 2River Edge 7197 3170 44.05 1857 1811 1162 2
Grand Totals 7197 3170 44.05 1857 1811 1162 2
November 15, 2017 8:38 am Page 114 of 219

Regi
stra
tion
Ballo
ts C
ast
Turn
out (
%)
ROCH
ELLE
PAR
K TO
WNS
HIP
FRAN
CIS
VALE
NZUE
LA J
R.
SAM
ALL
OS
LIND
A C.
BON
IFAC
E
MAR
C P.
VOJ
NICH
JOSE
PH J
. SCA
RPA
Pers
onal
Cho
ice
ROCHELLE PARK TOWNSHIP COMMITTEE
BERGEN COUNTY Statement of VoteBER_20171107_E
Rochelle Park 1 - Election Day 1001 472 47.15 174 150 210 213 76 0Rochelle Park 2 - Election Day 894 421 47.09 153 137 164 150 125 0Rochelle Park 3 - Election Day 852 413 48.47 142 92 181 170 89 6Rochelle Park 4 - Election Day 956 432 45.19 174 178 155 147 99 1Rochelle Park Mail-In Ballot - Mail 0 105 0.00 31 37 45 41 28 0Rochelle Park Provisional - Provis 0 16 0.00 10 7 6 9 0 0
Election Day Totals 3703 1738 46.93 643 557 710 680 389 7
Mail-In Ballot Totals 0 105 0.00 31 37 45 41 28 0
Provisional Totals 0 16 0.00 10 7 6 9 0 0
District Totals - Absentee
District Grand TotalsCounty 3703 1859 50.20 684 601 761 730 417 7Rochelle Park 3703 1859 50.20 684 601 761 730 417 7
Grand Totals 3703 1859 50.20 684 601 761 730 417 7
November 15, 2017 8:38 am Page 115 of 219

Regi
stra
tion
Ballo
ts C
ast
Turn
out (
%)
ROCK
LEIG
H CO
UNCI
L
DOUG
LAS
B. J
OHNS
EN S
R.
FRAN
K S.
CUM
ISKE
Y
Pers
onal
Cho
ice
ROCKLEIGH COUNCIL
BERGEN COUNTY Statement of VoteBER_20171107_E
Rockleigh 1 - Election Day 227 81 35.68 54 55 0Rockleigh Mail-In Ballot - Mail-In B 0 15 0.00 6 6 0Rockleigh Provisional - Provisiona 0 1 0.00 1 1 0
Election Day Totals 227 81 35.68 54 55 0
Mail-In Ballot Totals 0 15 0.00 6 6 0
Provisional Totals 0 1 0.00 1 1 0
District Totals - Absentee
District Grand TotalsCounty 227 97 42.73 61 62 0Rockleigh 227 97 42.73 61 62 0
Grand Totals 227 97 42.73 61 62 0
November 15, 2017 8:38 am Page 116 of 219

Regi
stra
tion
Ballo
ts C
ast
Turn
out (
%)
RUTH
ERFO
RD C
OUNC
IL
MIC
HAEL
J. D
UFFY
MIC
HAEL
A. A
NDER
SON
STEP
HANI
E M
cGOW
AN
EDW
ARD
C. N
ARUC
KI
Pers
onal
Cho
ice
RUTHERFORD COUNCIL
BERGEN COUNTY Statement of VoteBER_20171107_E
Rutherford 1 - Election Day 990 496 50.10 174 185 291 272 0Rutherford 2 - Election Day 1099 509 46.31 213 205 262 263 1Rutherford 3 - Election Day 989 434 43.88 145 134 273 259 1Rutherford 4 - Election Day 730 346 47.40 162 163 160 141 0Rutherford 5 - Election Day 776 344 44.33 128 123 199 184 0Rutherford 6 - Election Day 743 282 37.95 94 92 162 155 0Rutherford 7 - Election Day 938 404 43.07 136 132 244 227 2Rutherford 8 - Election Day 1007 420 41.71 148 143 253 228 1Rutherford 9 - Election Day 1051 491 46.72 186 174 264 261 1Rutherford 10 - Election Day 969 437 45.10 154 149 258 247 0Rutherford 11 - Election Day 1041 405 38.90 135 139 253 236 0Rutherford 12 - Election Day 763 311 40.76 133 137 166 150 0Rutherford Mail-In Ballot - Mail-In 0 257 0.00 88 89 168 150 0Rutherford Provisional - Provisiona 0 43 0.00 5 7 35 35 0
Election Day Totals 11096 4879 43.97 1808 1776 2785 2623 6
Mail-In Ballot Totals 0 257 0.00 88 89 168 150 0
Provisional Totals 0 43 0.00 5 7 35 35 0
District Totals - Absentee
District Grand TotalsCounty 11096 5179 46.67 1901 1872 2988 2808 6Rutherford 11096 5179 46.67 1901 1872 2988 2808 6
Grand Totals 11096 5179 46.67 1901 1872 2988 2808 6
November 15, 2017 8:38 am Page 117 of 219

Regi
stra
tion
Ballo
ts C
ast
Turn
out (
%)
SADD
LE B
ROOK
COU
NCIL
DAVI
D GI
EREK
JOSE
PH C
AMIL
LERI
Pers
onal
Cho
ice
SADDLE BROOK COUNCIL UNEXPIRED
BERGEN COUNTY Statement of VoteBER_20171107_E
Saddle Brook 1 - Election Day 778 267 34.32 170 25 0Saddle Brook 2 - Election Day 769 325 42.26 197 61 1Saddle Brook 3 - Election Day 582 236 40.55 160 21 0Saddle Brook 4 - Election Day 892 378 42.38 224 66 0Saddle Brook 5 - Election Day 995 344 34.57 197 62 0Saddle Brook 6 - Election Day 973 424 43.58 204 106 0Saddle Brook 7 - Election Day 598 255 42.64 142 50 0Saddle Brook 8 - Election Day 790 329 41.65 183 78 0Saddle Brook 9 - Election Day 916 369 40.28 211 50 1Saddle Brook 10 - Election Day 857 371 43.29 195 89 0Saddle Brook 11 - Election Day 864 386 44.68 228 71 0Saddle Brook Mail-In Ballot - Mail- 0 144 0.00 89 26 0Saddle Brook Provisional - Provisi 0 18 0.00 12 0 0
Election Day Totals 9014 3684 40.87 2111 679 2
Mail-In Ballot Totals 0 144 0.00 89 26 0
Provisional Totals 0 18 0.00 12 0 0
District Totals - Absentee
District Grand TotalsCounty 9014 3846 42.67 2212 705 2Saddle Brook 9014 3846 42.67 2212 705 2
Grand Totals 9014 3846 42.67 2212 705 2
November 15, 2017 8:38 am Page 118 of 219

Regi
stra
tion
Ballo
ts C
ast
Turn
out (
%)
SADD
LE R
IVER
COU
NCIL
PAUL
SCH
ULST
AD
ERIC
C. J
ENSE
N
Pers
onal
Cho
ice
SADDLE RIVER COUNCIL
BERGEN COUNTY Statement of VoteBER_20171107_E
Saddle River 1 - Election Day 1185 380 32.07 260 261 5Saddle River 2 - Election Day 1452 532 36.64 335 339 19Saddle River Mail-In Ballot - Mail-I 0 74 0.00 41 43 5Saddle River Provisional - Provisio 0 8 0.00 4 4 0
Election Day Totals 2637 912 34.58 595 600 24
Mail-In Ballot Totals 0 74 0.00 41 43 5
Provisional Totals 0 8 0.00 4 4 0
District Totals - Absentee
District Grand TotalsCounty 2637 994 37.69 640 647 29Saddle River 2637 994 37.69 640 647 29
Grand Totals 2637 994 37.69 640 647 29
November 15, 2017 8:38 am Page 119 of 219

Regi
stra
tion
Ballo
ts C
ast
Turn
out (
%)
SOUT
H HA
CKEN
SACK
TOW
NSHI
P
JAM
ES A
. ANZ
EVIN
O
LUIS
E. P
ERDO
MO
Pers
onal
Cho
ice
SOUTH HACKENSACK TOWNSHIP COMMITTEE
BERGEN COUNTY Statement of VoteBER_20171107_E
South Hackensack 1 - Election Da 1417 525 37.05 382 354 3South Hackensack Mail-In Ballot - 0 32 0.00 20 23 0South Hackensack Provisional - P 0 1 0.00 0 0 0
Election Day Totals 1417 525 37.05 382 354 3
Mail-In Ballot Totals 0 32 0.00 20 23 0
Provisional Totals 0 1 0.00 0 0 0
District Totals - Absentee
District Grand TotalsCounty 1417 558 39.38 402 377 3South Hackensack 1417 558 39.38 402 377 3
Grand Totals 1417 558 39.38 402 377 3
November 15, 2017 8:38 am Page 120 of 219

Regi
stra
tion
Ballo
ts C
ast
Turn
out (
%)
TENA
FLY
COUN
CIL
EDW
ARD
MAZ
LISH
JEFF
REY
D. G
ROSS
MAN
LAUR
EN D
AYTO
N
Pers
onal
Cho
ice
TENAFLY COUNCIL
BERGEN COUNTY Statement of VoteBER_20171107_E
Tenafly 1 - Election Day 778 281 36.12 89 175 173 0Tenafly 2 - Election Day 631 211 33.44 68 124 128 1Tenafly 3 - Election Day 592 217 36.66 67 139 137 3Tenafly 4 - Election Day 824 318 38.59 72 207 220 1Tenafly 5 - Election Day 728 254 34.89 53 185 177 0Tenafly 6 - Election Day 636 229 36.01 55 162 162 0Tenafly 7 - Election Day 708 195 27.54 66 117 114 0Tenafly 8 - Election Day 835 277 33.17 72 185 173 0Tenafly 9 - Election Day 847 333 39.32 89 213 226 0Tenafly 10 - Election Day 687 267 38.86 79 179 173 0Tenafly 11 - Election Day 824 278 33.74 81 177 175 0Tenafly 12 - Election Day 960 287 29.90 81 178 179 0Tenafly Mail-In Ballot - Mail-In Bal 0 196 0.00 54 135 141 0Tenafly Provisional - Provisional 0 15 0.00 4 11 11 0
Election Day Totals 9050 3147 34.77 872 2041 2037 5
Mail-In Ballot Totals 0 196 0.00 54 135 141 0
Provisional Totals 0 15 0.00 4 11 11 0
District Totals - Absentee
District Grand TotalsCounty 9050 3358 37.10 930 2187 2189 5Tenafly 9050 3358 37.10 930 2187 2189 5
Grand Totals 9050 3358 37.10 930 2187 2189 5
November 15, 2017 8:38 am Page 121 of 219

Regi
stra
tion
Ballo
ts C
ast
Turn
out (
%)
TETE
RBOR
O CO
UNCI
L UN
EXPI
RED
CHRI
STIE
EM
DEN
MAR
ITZA
TOR
RES
Pers
onal
Cho
ice
TETERBORO COUNCIL UNEXPIRED TERM
BERGEN COUNTY Statement of VoteBER_20171107_E
Teterboro 1 - Election Day 34 17 50.00 10 3 0Teterboro Mail-In Ballot - Mail-In B 0 0 0.00 0 0 0Teterboro Provisional - Provisiona 0 0 0.00 0 0 0
Election Day Totals 34 17 50.00 10 3 0
Mail-In Ballot Totals 0 0 0.00 0 0 0
Provisional Totals 0 0 0.00 0 0 0
District Totals - Absentee
District Grand TotalsCounty 34 17 50.00 10 3 0Teterboro 34 17 50.00 10 3 0
Grand Totals 34 17 50.00 10 3 0
November 15, 2017 8:38 am Page 122 of 219

Regi
stra
tion
Ballo
ts C
ast
Turn
out (
%)
UPPE
R SA
DDLE
RIV
ER C
OUNC
IL
ROGE
R B.
DeB
ERAR
DINE
STEV
EN F
. DIM
ARTI
NO
Pers
onal
Cho
ice
UPPER SADDLE RIVER COUNCIL
BERGEN COUNTY Statement of VoteBER_20171107_E
Upper Saddle River 1 - Election D 1468 548 37.33 312 323 3Upper Saddle River 2 - Election D 1049 375 35.75 219 227 6Upper Saddle River 3 - Election D 1271 447 35.17 261 284 4Upper Saddle River 4 - Election D 1269 453 35.70 261 266 4Upper Saddle River 5 - Election D 930 322 34.62 180 191 2Upper Saddle River Mail-In Ballot 0 126 0.00 66 66 4Upper Saddle River Provisional - P 0 18 0.00 10 9 1
Election Day Totals 5987 2145 35.83 1233 1291 19
Mail-In Ballot Totals 0 126 0.00 66 66 4
Provisional Totals 0 18 0.00 10 9 1
District Totals - Absentee
District Grand TotalsCounty 5987 2289 38.23 1309 1366 24Upper Saddle River 5987 2289 38.23 1309 1366 24
Grand Totals 5987 2289 38.23 1309 1366 24
November 15, 2017 8:38 am Page 123 of 219

Regi
stra
tion
Ballo
ts C
ast
Turn
out (
%)
WAL
DWIC
K CO
UNCI
L
DEBO
RAH
DELL
AVEC
HIA
PAUL
SCH
ATZ
Pers
onal
Cho
ice
WALDWICK COUNCIL
BERGEN COUNTY Statement of VoteBER_20171107_E
Waldwick 1 - Election Day 1287 574 44.60 265 263 7Waldwick 2 - Election Day 1141 472 41.37 241 242 2Waldwick 3 - Election Day 1088 478 43.93 222 216 3Waldwick 4 - Election Day 1098 481 43.81 280 265 2Waldwick 5 - Election Day 1037 463 44.65 227 229 0Waldwick 6 - Election Day 1001 456 45.55 252 255 1Waldwick Mail-In Ballot - Mail-In B 0 129 0.00 80 80 5Waldwick Provisional - Provisiona 0 16 0.00 7 7 0
Election Day Totals 6652 2924 43.96 1487 1470 15
Mail-In Ballot Totals 0 129 0.00 80 80 5
Provisional Totals 0 16 0.00 7 7 0
District Totals - Absentee
District Grand TotalsCounty 6652 3069 46.14 1574 1557 20Waldwick 6652 3069 46.14 1574 1557 20
Grand Totals 6652 3069 46.14 1574 1557 20
November 15, 2017 8:38 am Page 124 of 219
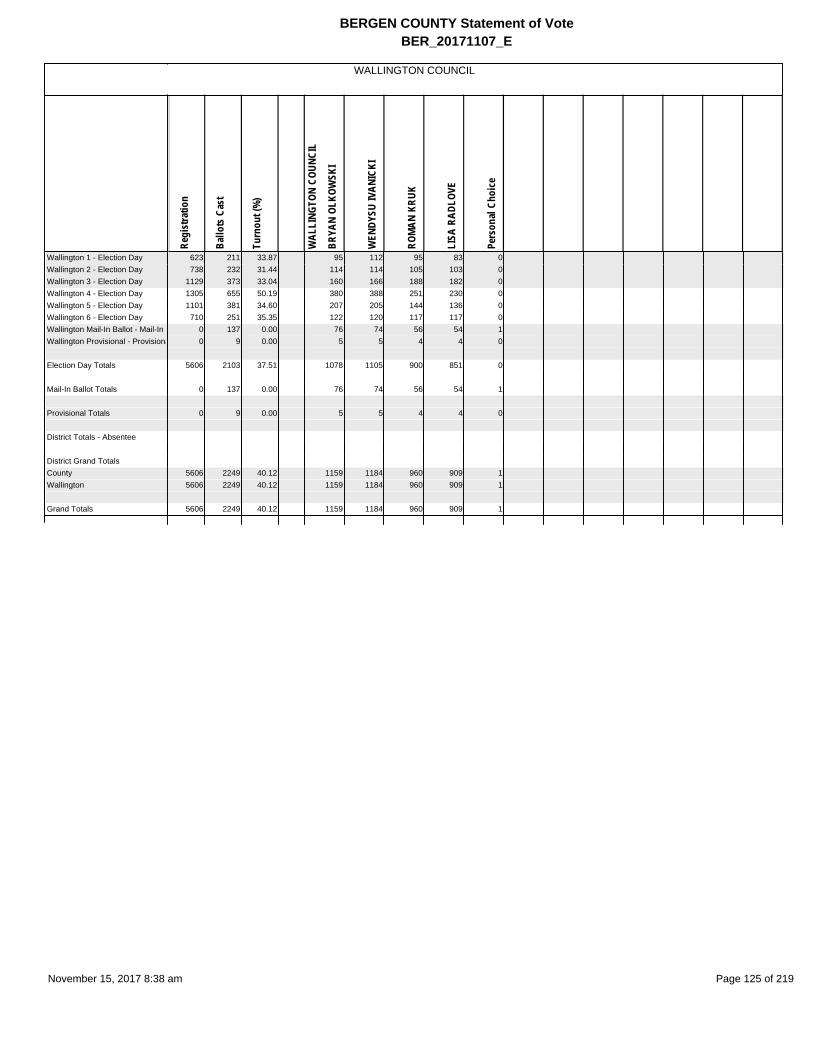
Regi
stra
tion
Ballo
ts C
ast
Turn
out (
%)
WAL
LING
TON
COUN
CIL
BRYA
N OL
KOW
SKI
WEN
DYSU
IVAN
ICKI
ROM
AN K
RUK
LISA
RAD
LOVE
Pers
onal
Cho
ice
WALLINGTON COUNCIL
BERGEN COUNTY Statement of VoteBER_20171107_E
Wallington 1 - Election Day 623 211 33.87 95 112 95 83 0Wallington 2 - Election Day 738 232 31.44 114 114 105 103 0Wallington 3 - Election Day 1129 373 33.04 160 166 188 182 0Wallington 4 - Election Day 1305 655 50.19 380 388 251 230 0Wallington 5 - Election Day 1101 381 34.60 207 205 144 136 0Wallington 6 - Election Day 710 251 35.35 122 120 117 117 0Wallington Mail-In Ballot - Mail-In B 0 137 0.00 76 74 56 54 1Wallington Provisional - Provisiona 0 9 0.00 5 5 4 4 0
Election Day Totals 5606 2103 37.51 1078 1105 900 851 0
Mail-In Ballot Totals 0 137 0.00 76 74 56 54 1
Provisional Totals 0 9 0.00 5 5 4 4 0
District Totals - Absentee
District Grand TotalsCounty 5606 2249 40.12 1159 1184 960 909 1Wallington 5606 2249 40.12 1159 1184 960 909 1
Grand Totals 5606 2249 40.12 1159 1184 960 909 1
November 15, 2017 8:38 am Page 125 of 219

Regi
stra
tion
Ballo
ts C
ast
Turn
out (
%)
WAS
HING
TON
TOW
NSHI
P M
AYOR
PETE
R CA
LAM
ARI
ROBE
RT B
RUNO
Pers
onal
Cho
ice
WAS
HING
TON
TOW
NSHI
P CO
UNCI
L
ARTH
UR J
. CUM
MIN
G
THOM
AS J
. SEA
RS
MIC
HAEL
L. W
ERFE
L
MIC
HAEL
DeS
ENA
Pers
onal
Choic
e
WASHINGTON
BERGEN COUNTY Statement of VoteBER_20171107_E
Washington Township 1 - Election 1346 640 47.55 286 258 2 266 254 256 276 0Washington Township 2 - Election 912 425 46.60 174 195 0 179 162 191 190 0Washington Township 3 - Election 746 373 50.00 169 156 0 154 145 161 170 0Washington Township 4 - Election 1192 512 42.95 254 171 1 234 227 171 181 2Washington Township 5 - Election 1117 549 49.15 227 252 4 211 202 267 274 0Washington Township 6 - Election 1508 680 45.09 311 291 3 309 296 277 282 0Washington Township Mail-In Ball 0 211 0.00 101 86 1 99 95 85 83 5Washington Township Provisional 0 19 0.00 11 6 0 11 9 7 8 0
Election Day Totals 6821 3179 46.61 1421 1323 10 1353 1286 1323 1373 2
Mail-In Ballot Totals 0 211 0.00 101 86 1 99 95 85 83 5
Provisional Totals 0 19 0.00 11 6 0 11 9 7 8 0
District Totals - Absentee
District Grand TotalsCounty 6821 3409 49.98 1533 1415 11 1463 1390 1415 1464 7Washington 6821 3409 49.98 1533 1415 11 1463 1390 1415 1464 7
Grand Totals 6821 3409 49.98 1533 1415 11 1463 1390 1415 1464 7
November 15, 2017 8:38 am Page 126 of 219

Regi
stra
tion
Ballo
ts C
ast
Turn
out (
%)
WES
TWOO
D CO
UNCI
L
CHRI
STOP
HER
MON
TANA
CHRI
STOP
HER
OWEN
S
JODI
MUR
PHY
ERIN
COL
LINS
Pers
onal
Cho
ice
WESTWOOD COUNCIL
BERGEN COUNTY Statement of VoteBER_20171107_E
Westwood 1 - Election Day 1114 513 46.05 238 233 247 242 0Westwood 2 - Election Day 959 446 46.51 213 208 209 214 0Westwood 3 - Election Day 605 297 49.09 143 134 146 149 0Westwood 4 - Election Day 894 429 47.99 156 148 245 254 0Westwood 5 - Election Day 707 351 49.65 207 195 134 142 0Westwood 6 - Election Day 1242 469 37.76 165 158 282 285 0Westwood 7 - Election Day 781 356 45.58 207 205 132 134 0Westwood 8 - Election Day 944 445 47.14 263 252 162 159 0Westwood Mail-In Ballot - Mail-In B 0 156 0.00 86 85 67 67 0Westwood Provisional - Provisiona 0 20 0.00 4 4 15 15 0
Election Day Totals 7246 3306 45.63 1592 1533 1557 1579 0
Mail-In Ballot Totals 0 156 0.00 86 85 67 67 0
Provisional Totals 0 20 0.00 4 4 15 15 0
District Totals - Absentee
District Grand TotalsCounty 7246 3482 48.05 1682 1622 1639 1661 0Westwood 7246 3482 48.05 1682 1622 1639 1661 0
Grand Totals 7246 3482 48.05 1682 1622 1639 1661 0
November 15, 2017 8:38 am Page 127 of 219

Regi
stra
tion
Ballo
ts C
ast
Turn
out (
%)
WOO
DCLI
FF L
AKE
COUN
CIL
THOM
AS P
ANSO
ROBE
RT H
AYES
NANC
Y GR
OSS
BRIA
N SI
NGLE
TON
CHER
YL A
. DIS
POTO
Pers
onal
Cho
ice
WOODCLIFF LAKE COUNCIL
BERGEN COUNTY Statement of VoteBER_20171107_E
Woodcliff Lake 1 - Election Day 897 425 47.38 85 101 202 191 165 0Woodcliff Lake 2 - Election Day 1176 556 47.28 150 171 234 234 205 2Woodcliff Lake 3 - Election Day 983 475 48.32 130 147 209 191 191 0Woodcliff Lake 4 - Election Day 1427 621 43.52 172 176 334 300 175 0Woodcliff Lake Mail-In Ballot - Mai 0 170 0.00 52 58 69 61 55 0Woodcliff Lake Provisional - Provis 0 21 0.00 7 7 9 9 4 0
Election Day Totals 4483 2077 46.33 537 595 979 916 736 2
Mail-In Ballot Totals 0 170 0.00 52 58 69 61 55 0
Provisional Totals 0 21 0.00 7 7 9 9 4 0
District Totals - Absentee
District Grand TotalsCounty 4483 2268 50.59 596 660 1057 986 795 2Woodcliff Lake 4483 2268 50.59 596 660 1057 986 795 2
Grand Totals 4483 2268 50.59 596 660 1057 986 795 2
November 15, 2017 8:38 am Page 128 of 219

Regi
stra
tion
Ballo
ts C
ast
Turn
out (
%)
WOO
D RI
DGE
COUN
CIL
BRUC
E E.
FER
DA
DIAN
E T.
GOL
D
DOM
INIC
K AZ
ZOLI
NI
PHIL
IP D
. ROM
ERO
Pers
onal
Cho
ice
WOOD RIDGE COUNCIL
BERGEN COUNTY Statement of VoteBER_20171107_E
Wood Ridge 1 - Election Day 1442 602 41.75 138 142 412 421 0Wood Ridge 2 - Election Day 772 408 52.85 103 100 274 277 0Wood Ridge 3 - Election Day 1200 569 47.42 161 156 368 373 0Wood Ridge 4 - Election Day 1182 499 42.22 140 134 326 326 0Wood Ridge 5 - Election Day 1243 601 48.35 168 155 392 409 2Wood Ridge Mail-In Ballot - Mail-In 0 136 0.00 21 23 110 108 0Wood Ridge Provisional - Provisio 0 8 0.00 3 2 5 6 0
Election Day Totals 5839 2679 45.88 710 687 1772 1806 2
Mail-In Ballot Totals 0 136 0.00 21 23 110 108 0
Provisional Totals 0 8 0.00 3 2 5 6 0
District Totals - Absentee
District Grand TotalsCounty 5839 2823 48.35 734 712 1887 1920 2Wood Ridge 5839 2823 48.35 734 712 1887 1920 2
Grand Totals 5839 2823 48.35 734 712 1887 1920 2
November 15, 2017 8:38 am Page 129 of 219

Regi
stra
tion
Ballo
ts C
ast
Turn
out (
%)
WYC
KOFF
TOW
NSHI
P CO
MM
ITTE
E
JOHN
A C
AROL
AN
HAYL
EY J
. ROO
NEY
BRIA
N S
CANL
AN
MEL
ISSA
D. R
UBEN
STEI
N
Pers
onal
Cho
ice
WYC
KOFF
TOW
NSHI
P CO
MM
ITTE
E U
TIM
OTHY
E. S
HANL
EY
CARL
A F.
PAP
PALA
RDO
Pers
onal
Choic
e
WYCKOFF
BERGEN COUNTY Statement of VoteBER_20171107_E
Wyckoff 1 - Election Day 1382 630 45.59 258 263 372 327 0 291 316 0Wyckoff 2 - Election Day 1496 704 47.06 317 331 391 333 0 354 329 0Wyckoff 3 - Election Day 1259 542 43.05 259 253 284 243 0 277 233 0Wyckoff 4 - Election Day 1421 628 44.19 292 284 345 309 0 292 323 0Wyckoff 5 - Election Day 929 450 48.44 211 219 233 202 0 227 201 0Wyckoff 6 - Election Day 1229 556 45.24 253 241 309 263 0 282 251 0Wyckoff 7 - Election Day 1270 631 49.69 284 286 346 293 0 302 298 0Wyckoff 8 - Election Day 1347 585 43.43 311 298 281 234 0 311 245 0Wyckoff 9 - Election Day 876 435 49.66 231 228 199 170 0 243 174 0Wyckoff 10 - Election Day 1139 511 44.86 211 214 289 260 0 222 257 0Wyckoff Mail-In Ballot - Mail-In Ba 0 439 0.00 171 162 272 242 0 170 251 0Wyckoff Provisional - Provisional 0 29 0.00 11 9 19 17 0 12 16 0
Election Day Totals 12348 5672 45.93 2627 2617 3049 2634 0 2801 2627 0
Mail-In Ballot Totals 0 439 0.00 171 162 272 242 0 170 251 0
Provisional Totals 0 29 0.00 11 9 19 17 0 12 16 0
District Totals - Absentee
District Grand TotalsCounty 12348 6140 49.72 2809 2788 3340 2893 0 2983 2894 0Wyckoff 12348 6140 49.72 2809 2788 3340 2893 0 2983 2894 0
Grand Totals 12348 6140 49.72 2809 2788 3340 2893 0 2983 2894 0
November 15, 2017 8:38 am Page 130 of 219

Regi
stra
tion
Ballo
ts C
ast
Turn
out (
%)
ALLE
NDAL
E RE
GION
AL B
OARD
OF
LISA
JIL
L W
EBB
ANNE
GOD
DARD
Pers
onal
Cho
ice
ALLE
NDAL
E LO
CAL
BOAR
D OF
TODD
R. F
LIEG
EL
Pers
onal
Cho
ice
ALLENDALE SCHOOL
BERGEN COUNTY Statement of VoteBER_20171107_E
Allendale 1 - Election Day 1618 755 46.66 279 203 1 291 0Allendale 2 - Election Day 853 363 42.56 145 120 2 139 1Allendale 3 - Election Day 982 456 46.44 159 111 0 156 1Allendale 4 - Election Day 1439 606 42.11 224 161 1 221 2Allendale Mail-In Ballot - Mail-In B 0 129 0.00 64 51 2 65 1Allendale Provisional - Provisional 0 12 0.00 5 4 0 6 0
Election Day Totals 4892 2180 44.56 807 595 4 807 4
Mail-In Ballot Totals 0 129 0.00 64 51 2 65 1
Provisional Totals 0 12 0.00 5 4 0 6 0
District Totals - Absentee
District Grand TotalsCounty 4892 2321 47.44 876 650 6 878 5Allendale 4892 2321 47.44 876 650 6 878 5
Grand Totals 4892 2321 47.44 876 650 6 878 5
November 15, 2017 8:38 am Page 131 of 219

Regi
stra
tion
Ballo
ts C
ast
Turn
out (
%)
ALPI
NE L
OCAL
BOA
RD O
F
SRIN
IVAS
DHU
LIPA
LA
PHIL
IP S
IMOT
AS
Pers
onal
Cho
ice
ALPINE LOCAL BOARD OF EDUCATION
BERGEN COUNTY Statement of VoteBER_20171107_E
Alpine 1 - Election Day 1416 405 28.60 86 122 0Alpine Mail-In Ballot - Mail-In Ballo 0 30 0.00 15 21 1Alpine Provisional - Provisional 0 1 0.00 0 0 0
Election Day Totals 1416 405 28.60 86 122 0
Mail-In Ballot Totals 0 30 0.00 15 21 1
Provisional Totals 0 1 0.00 0 0 0
District Totals - Absentee
District Grand TotalsCounty 1416 436 30.79 101 143 1Alpine 1416 436 30.79 101 143 1
Grand Totals 1416 436 30.79 101 143 1
November 15, 2017 8:38 am Page 132 of 219

Regi
stra
tion
Ballo
ts C
ast
Turn
out (
%)
BERG
ENFI
ELD
LOCA
L BO
ARD
OF
NELS
ON R
EYNO
SO
EILE
EN R
YDER
Pers
onal
Cho
ice
BERGENFIELD LOCAL BOARD OF EDUCATION
BERGEN COUNTY Statement of VoteBER_20171107_E
Bergenfield 1 - Election Day 787 282 35.83 43 59 2Bergenfield 2 - Election Day 868 377 43.43 81 84 1Bergenfield 3 - Election Day 791 309 39.06 58 55 0Bergenfield 4 - Election Day 891 319 35.80 69 74 0Bergenfield 5 - Election Day 873 312 35.74 59 60 0Bergenfield 6 - Election Day 873 325 37.23 83 57 1Bergenfield 7 - Election Day 793 269 33.92 58 43 0Bergenfield 8 - Election Day 850 290 34.12 60 67 1Bergenfield 9 - Election Day 842 274 32.54 41 25 0Bergenfield 10 - Election Day 1127 399 35.40 60 114 1Bergenfield 11 - Election Day 950 386 40.63 59 119 0Bergenfield 12 - Election Day 1081 375 34.69 79 89 0Bergenfield 13 - Election Day 1178 414 35.14 111 84 0Bergenfield 14 - Election Day 798 297 37.22 71 62 0Bergenfield 15 - Election Day 1131 387 34.22 93 84 0Bergenfield 16 - Election Day 932 320 34.33 51 90 0Bergenfield 17 - Election Day 866 285 32.91 58 64 0Bergenfield Mail-In Ballot - Mail-In 0 233 0.00 50 132 3Bergenfield Provisional - Provision 0 38 0.00 12 8 0
Election Day Totals 15631 5620 35.95 1134 1230 6
Mail-In Ballot Totals 0 233 0.00 50 132 3
Provisional Totals 0 38 0.00 12 8 0
District Totals - Absentee
District Grand TotalsCounty 15631 5891 37.69 1196 1370 9Bergenfield 15631 5891 37.69 1196 1370 9
Grand Totals 15631 5891 37.69 1196 1370 9
November 15, 2017 8:38 am Page 133 of 219

Regi
stra
tion
Ballo
ts C
ast
Turn
out (
%)
BOGO
TA L
OCAL
BOA
RD O
F
PATR
ICK
H. M
cHAL
E
JAM
ES A
. MOO
RE
MAU
REEN
MIL
LER
MIC
HAEL
LEO
NG
Pers
onal
Cho
ice
BOGOTA LOCAL BOARD OF EDUCATION
BERGEN COUNTY Statement of VoteBER_20171107_E
Bogota 1 - Election Day 807 331 41.02 83 97 101 63 2Bogota 2 - Election Day 1014 364 35.90 86 88 81 66 0Bogota 3 - Election Day 953 346 36.31 84 90 96 69 0Bogota 4 - Election Day 909 400 44.00 115 140 118 86 0Bogota 5 - Election Day 562 254 45.20 71 70 74 60 1Bogota 6 - Election Day 808 318 39.36 81 84 83 52 0Bogota Mail-In Ballot - Mail-In Ball 0 114 0.00 39 58 60 35 1Bogota Provisional - Provisional 0 20 0.00 4 9 7 4 0
Election Day Totals 5053 2013 39.84 520 569 553 396 3
Mail-In Ballot Totals 0 114 0.00 39 58 60 35 1
Provisional Totals 0 20 0.00 4 9 7 4 0
District Totals - Absentee
District Grand TotalsCounty 5053 2147 42.49 563 636 620 435 4Bogota 5053 2147 42.49 563 636 620 435 4
Grand Totals 5053 2147 42.49 563 636 620 435 4
November 15, 2017 8:38 am Page 134 of 219

Regi
stra
tion
Ballo
ts C
ast
Turn
out (
%)
CARL
STAD
T RE
GION
AL B
OARD
OF
BRUC
E YO
UNG
ZAKA
RIA
KAND
IEL
BREN
DA K
ANEA
STER
FRED
N. M
EO
Pers
onal
Cho
ice
CARL
STAD
T LO
CAL
BOAR
D OF
EDU
C
THOM
AS C
OX
MAR
C CH
RIST
IANO
SUSA
N HA
MIL
TON
Pers
onal
Choic
e
CARLSTADT SCHOOL
BERGEN COUNTY Statement of VoteBER_20171107_E
Carlstadt 1 - Election Day 633 270 42.65 114 56 44 30 1 116 74 69 0Carlstadt 2 - Election Day 822 326 39.66 127 63 55 30 1 132 82 89 1Carlstadt 3 - Election Day 714 283 39.64 100 63 47 41 0 106 78 77 1Carlstadt 4 - Election Day 780 316 40.51 128 59 56 51 0 141 110 87 0Carlstadt 5 - Election Day 753 287 38.11 113 53 38 34 0 112 78 71 0Carlstadt Mail-In Ballot - Mail-In Ba 0 78 0.00 34 22 26 15 1 47 35 35 2Carlstadt Provisional - Provisional 0 5 0.00 5 4 2 0 0 1 1 1 0
Election Day Totals 3702 1482 40.03 582 294 240 186 2 607 422 393 2
Mail-In Ballot Totals 0 78 0.00 34 22 26 15 1 47 35 35 2
Provisional Totals 0 5 0.00 5 4 2 0 0 1 1 1 0
District Totals - Absentee
District Grand TotalsCounty 3702 1565 42.27 621 320 268 201 3 655 458 429 4Carlstadt 3702 1565 42.27 621 320 268 201 3 655 458 429 4
Grand Totals 3702 1565 42.27 621 320 268 201 3 655 458 429 4
November 15, 2017 8:38 am Page 135 of 219

Regi
stra
tion
Ballo
ts C
ast
Turn
out (
%)
CARL
STAD
T LO
CAL
BOE-
1YR
LORI
NUN
ZIAT
O
Pers
onal
Cho
ice
CARLSTADT LOCAL BOE- 1YR UNEXPIRED TERM
BERGEN COUNTY Statement of VoteBER_20171107_E
Carlstadt 1 - Election Day 633 270 42.65 110 0Carlstadt 2 - Election Day 822 326 39.66 130 0Carlstadt 3 - Election Day 714 283 39.64 110 0Carlstadt 4 - Election Day 780 316 40.51 138 1Carlstadt 5 - Election Day 753 287 38.11 117 0Carlstadt Mail-In Ballot - Mail-In Ba 0 78 0.00 43 0Carlstadt Provisional - Provisional 0 5 0.00 1 0
Election Day Totals 3702 1482 40.03 605 1
Mail-In Ballot Totals 0 78 0.00 43 0
Provisional Totals 0 5 0.00 1 0
District Totals - Absentee
District Grand TotalsCounty 3702 1565 42.27 649 1Carlstadt 3702 1565 42.27 649 1
Grand Totals 3702 1565 42.27 649 1
November 15, 2017 8:38 am Page 136 of 219

Regi
stra
tion
Ballo
ts C
ast
Turn
out (
%)
CLOS
TER
REGI
ONAL
BOA
RD O
F
JOSE
PH A
RGEN
ZIAN
O
Pers
onal
Cho
ice
CLOS
TER
LOCA
L BO
ARD
OF
SUNG
HUI
KW
ON
MEL
ODY
FINK
ELST
EIN
GREG
G DA
VID
LAM
BERT
Pers
onal
Choic
e
CLOSTER SCHOOL
BERGEN COUNTY Statement of VoteBER_20171107_E
Closter 1 - Election Day 647 279 43.12 146 2 97 90 94 1Closter 2 - Election Day 905 344 38.01 170 0 122 100 102 0Closter 3 - Election Day 857 315 36.76 141 0 96 74 92 0Closter 4 - Election Day 911 337 36.99 130 0 94 89 95 0Closter 5 - Election Day 824 318 38.59 157 1 106 87 91 0Closter 6 - Election Day 1084 380 35.06 169 0 143 97 103 0Closter Mail-In Ballot - Mail-In Ball 0 100 0.00 62 1 52 46 48 0Closter Provisional - Provisional 0 6 0.00 3 0 2 1 1 0
Election Day Totals 5228 1973 37.74 913 3 658 537 577 1
Mail-In Ballot Totals 0 100 0.00 62 1 52 46 48 0
Provisional Totals 0 6 0.00 3 0 2 1 1 0
District Totals - Absentee
District Grand TotalsCounty 5228 2079 39.77 978 4 712 584 626 1Closter 5228 2079 39.77 978 4 712 584 626 1
Grand Totals 5228 2079 39.77 978 4 712 584 626 1
November 15, 2017 8:38 am Page 137 of 219

Regi
stra
tion
Ballo
ts C
ast
Turn
out (
%)
CRES
SKIL
L LO
CAL
BOAR
D OF
DENI
SE M
. VIL
LANI
MAR
Y KL
EIN
JOHN
PAR
K
Pers
onal
Cho
ice
CRES
SKIL
L LO
CAL
BOE-
2 Y
R
RAFF
I ODA
BASH
IAN
Pers
onal
Choic
e
CRESSKILL SCHOOL
BERGEN COUNTY Statement of VoteBER_20171107_E
Cresskill 1 - Election Day 815 300 36.81 115 85 83 2 95 0Cresskill 2 - Election Day 928 315 33.94 110 84 90 4 95 0Cresskill 3 - Election Day 1480 496 33.51 141 155 133 3 136 0Cresskill 4 - Election Day 781 278 35.60 102 80 82 0 88 0Cresskill 5 - Election Day 601 250 41.60 88 63 63 2 86 0Cresskill 6 - Election Day 659 245 37.18 83 57 57 0 66 0Cresskill Mail-In Ballot - Mail-In Ba 0 59 0.00 24 25 25 0 22 0Cresskill Provisional - Provisional 0 4 0.00 1 0 0 0 0 0
Election Day Totals 5264 1884 35.79 639 524 508 11 566 0
Mail-In Ballot Totals 0 59 0.00 24 25 25 0 22 0
Provisional Totals 0 4 0.00 1 0 0 0 0 0
District Totals - Absentee
District Grand TotalsCounty 5264 1947 36.99 664 549 533 11 588 0Cresskill 5264 1947 36.99 664 549 533 11 588 0
Grand Totals 5264 1947 36.99 664 549 533 11 588 0
November 15, 2017 8:38 am Page 138 of 219

Regi
stra
tion
Ballo
ts C
ast
Turn
out (
%)
DEM
ARES
T RE
GION
AL B
OARD
OF
TIFF
ANY
KAPL
AN
Pers
onal
Cho
ice
DEM
ARES
T LO
CAL
BOAR
D OF
ERIC
A CA
NTAT
ORE
DIAN
E HO
LZBE
RG
KYUS
OON
LEE
Pers
onal
Choic
e
DEMAREST SCHOOL
BERGEN COUNTY Statement of VoteBER_20171107_E
Demarest 1 - Election Day 1087 481 44.25 195 0 157 152 166 0Demarest 2 - Election Day 1102 402 36.48 158 0 150 116 121 0Demarest 3 - Election Day 1113 456 40.97 196 0 156 175 117 0Demarest Mail-In Ballot - Mail-In B 0 89 0.00 53 0 36 61 23 0Demarest Provisional - Provisiona 0 9 0.00 4 0 4 3 3 0
Election Day Totals 3302 1339 40.55 549 0 463 443 404 0
Mail-In Ballot Totals 0 89 0.00 53 0 36 61 23 0
Provisional Totals 0 9 0.00 4 0 4 3 3 0
District Totals - Absentee
District Grand TotalsCounty 3302 1437 43.52 606 0 503 507 430 0Demarest 3302 1437 43.52 606 0 503 507 430 0
Grand Totals 3302 1437 43.52 606 0 503 507 430 0
November 15, 2017 8:38 am Page 139 of 219
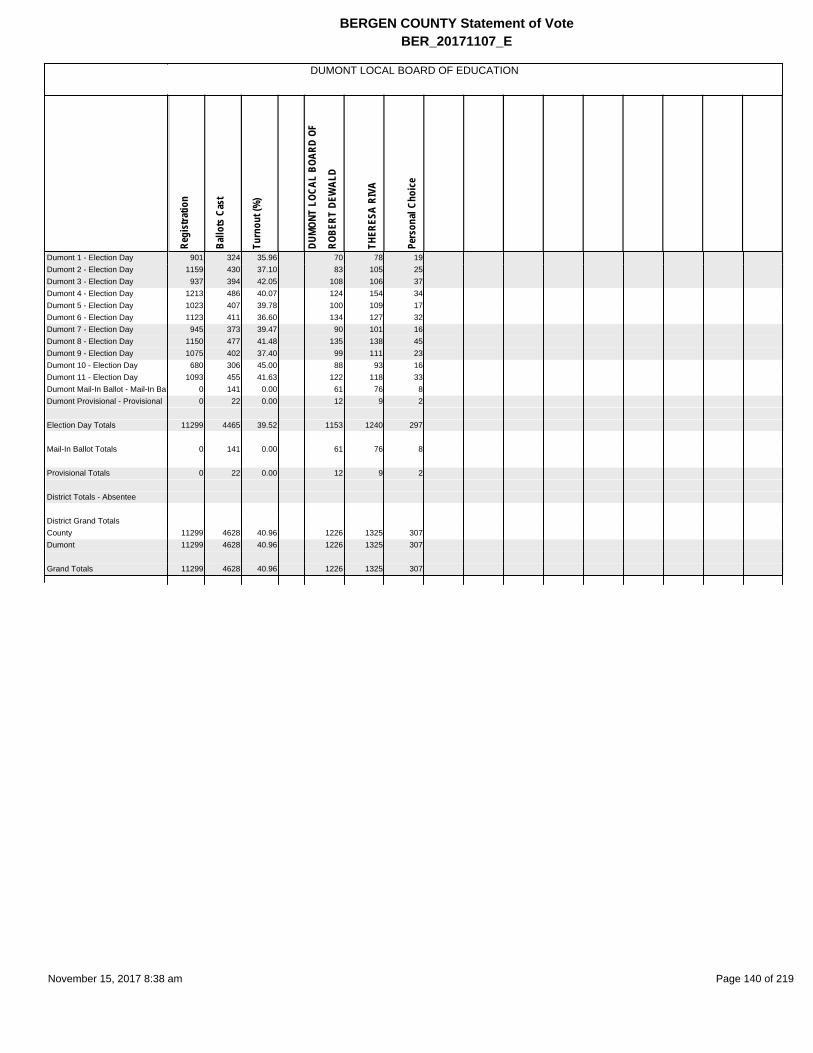
Regi
stra
tion
Ballo
ts C
ast
Turn
out (
%)
DUM
ONT
LOCA
L BO
ARD
OF
ROBE
RT D
EWAL
D
THER
ESA
RIVA
Pers
onal
Cho
ice
DUMONT LOCAL BOARD OF EDUCATION
BERGEN COUNTY Statement of VoteBER_20171107_E
Dumont 1 - Election Day 901 324 35.96 70 78 19Dumont 2 - Election Day 1159 430 37.10 83 105 25Dumont 3 - Election Day 937 394 42.05 108 106 37Dumont 4 - Election Day 1213 486 40.07 124 154 34Dumont 5 - Election Day 1023 407 39.78 100 109 17Dumont 6 - Election Day 1123 411 36.60 134 127 32Dumont 7 - Election Day 945 373 39.47 90 101 16Dumont 8 - Election Day 1150 477 41.48 135 138 45Dumont 9 - Election Day 1075 402 37.40 99 111 23Dumont 10 - Election Day 680 306 45.00 88 93 16Dumont 11 - Election Day 1093 455 41.63 122 118 33Dumont Mail-In Ballot - Mail-In Ba 0 141 0.00 61 76 8Dumont Provisional - Provisional 0 22 0.00 12 9 2
Election Day Totals 11299 4465 39.52 1153 1240 297
Mail-In Ballot Totals 0 141 0.00 61 76 8
Provisional Totals 0 22 0.00 12 9 2
District Totals - Absentee
District Grand TotalsCounty 11299 4628 40.96 1226 1325 307Dumont 11299 4628 40.96 1226 1325 307
Grand Totals 11299 4628 40.96 1226 1325 307
November 15, 2017 8:38 am Page 140 of 219

Regi
stra
tion
Ballo
ts C
ast
Turn
out (
%)
EAST
RUT
HERF
ORD
REGI
ONAL
REBE
CCA
CRUZ
TINA
M. C
AVAL
LO
Pers
onal
Cho
ice
EAST
RUT
HERF
ORD
LOCA
L
Sha
Vonn
e HO
NOR
RICH
ARD
VART
AN
Pers
onal
Choic
e
EAST RUTHERFORD SCHOOL
BERGEN COUNTY Statement of VoteBER_20171107_E
East Rutherford 1 - Election Day 1198 385 32.14 117 52 0 88 84 3East Rutherford 2 - Election Day 1080 414 38.33 126 103 5 103 125 17East Rutherford 3 - Election Day 881 373 42.34 118 80 1 76 112 13East Rutherford 4 - Election Day 1901 786 41.35 180 172 10 132 224 40East Rutherford Mail-In Ballot - Ma 0 85 0.00 40 32 0 35 47 3East Rutherford Provisional - Prov 0 12 0.00 3 1 0 3 4 0
Election Day Totals 5060 1958 38.70 541 407 16 399 545 73
Mail-In Ballot Totals 0 85 0.00 40 32 0 35 47 3
Provisional Totals 0 12 0.00 3 1 0 3 4 0
District Totals - Absentee
District Grand TotalsCounty 5060 2055 40.61 584 440 16 437 596 76East Rutherford 5060 2055 40.61 584 440 16 437 596 76
Grand Totals 5060 2055 40.61 584 440 16 437 596 76
November 15, 2017 8:38 am Page 141 of 219

Regi
stra
tion
Ballo
ts C
ast
Turn
out (
%)
EDGE
WAT
ER L
OCAL
BOA
RD O
F
CHRI
STIN
A LI
NG
THOM
AS M
. QUI
NTON
Pers
onal
Cho
ice
EDGEWATER LOCAL BOARD OF EDUCATION
BERGEN COUNTY Statement of VoteBER_20171107_E
Edgewater 1 - Election Day 1072 335 31.25 103 91 1Edgewater 2 - Election Day 1385 405 29.24 119 99 1Edgewater 3 - Election Day 1416 469 33.12 138 124 1Edgewater 4 - Election Day 1898 486 25.61 162 102 0Edgewater Mail-In Ballot - Mail-In 0 123 0.00 60 65 4Edgewater Provisional - Provisiona 0 16 0.00 5 4 0
Election Day Totals 5771 1695 29.37 522 416 3
Mail-In Ballot Totals 0 123 0.00 60 65 4
Provisional Totals 0 16 0.00 5 4 0
District Totals - Absentee
District Grand TotalsCounty 5771 1834 31.78 587 485 7Edgewater 5771 1834 31.78 587 485 7
Grand Totals 5771 1834 31.78 587 485 7
November 15, 2017 8:38 am Page 142 of 219

Regi
stra
tion
Ballo
ts C
ast
Turn
out (
%)
ELM
WOO
D PA
RK L
OCAL
BOA
RD
DORI
N AS
PRAS
JAY
E. L
OPEZ
DOUG
LAS
DeM
ATTE
O
JAKU
B GO
LABE
K
CHAK
IB F
AKHO
URY
Pers
onal
Cho
ice
ELMWOOD PARK LOCAL BOARD OF EDUCATION
BERGEN COUNTY Statement of VoteBER_20171107_E
Elmwood Park 1 - Election Day 1427 492 34.48 97 79 93 104 41 1Elmwood Park 2 - Election Day 1446 464 32.09 73 83 115 87 38 0Elmwood Park 3 - Election Day 943 380 40.30 61 57 98 89 60 0Elmwood Park 4 - Election Day 809 246 30.41 34 37 48 34 16 1Elmwood Park 5 - Election Day 860 333 38.72 37 58 71 55 38 0Elmwood Park 6 - Election Day 714 224 31.37 24 37 29 31 19 0Elmwood Park 7 - Election Day 1146 437 38.13 66 62 118 100 59 0Elmwood Park 8 - Election Day 1919 563 29.34 65 74 114 122 52 1Elmwood Park 9 - Election Day 1183 353 29.84 49 58 89 58 21 2Elmwood Park 10 - Election Day 1470 495 33.67 96 93 117 96 54 0Elmwood Park Mail-In Ballot - Mai 0 605 0.00 271 106 169 349 229 2Elmwood Park Provisional - Provis 0 61 0.00 16 13 19 10 3 0
Election Day Totals 11917 3987 33.46 602 638 892 776 398 5
Mail-In Ballot Totals 0 605 0.00 271 106 169 349 229 2
Provisional Totals 0 61 0.00 16 13 19 10 3 0
District Totals - Absentee
District Grand TotalsCounty 11917 4653 39.05 889 757 1080 1135 630 7Elmwood Park 11917 4653 39.05 889 757 1080 1135 630 7
Grand Totals 11917 4653 39.05 889 757 1080 1135 630 7
November 15, 2017 8:38 am Page 143 of 219

Regi
stra
tion
Ballo
ts C
ast
Turn
out (
%)
EMER
SON
LOCA
L BO
ARD
OF
JERE
MY
M. T
EIGE
N
ANN
PRES
SIM
ONE
Pers
onal
Cho
ice
EMER
SON
LOCA
L BO
E UN
EXPI
RED
BEHR
OOZ
PASD
AR
Pers
onal
Cho
ice
EMERSON SCHOOL
BERGEN COUNTY Statement of VoteBER_20171107_E
Emerson 1 - Election Day 1033 501 48.50 123 125 0 125 0Emerson 2 - Election Day 837 377 45.04 97 104 0 88 1Emerson 3 - Election Day 672 269 40.03 64 66 0 64 1Emerson 4 - Election Day 1065 445 41.78 111 105 2 118 1Emerson 5 - Election Day 813 338 41.57 84 98 0 73 0Emerson 6 - Election Day 605 278 45.95 71 63 0 67 0Emerson Mail-In Ballot - Mail-In Ba 0 122 0.00 70 65 1 53 0Emerson Provisional - Provisional 0 10 0.00 4 6 0 6 0
Election Day Totals 5025 2208 43.94 550 561 2 535 3
Mail-In Ballot Totals 0 122 0.00 70 65 1 53 0
Provisional Totals 0 10 0.00 4 6 0 6 0
District Totals - Absentee
District Grand TotalsCounty 5025 2340 46.57 624 632 3 594 3Emerson 5025 2340 46.57 624 632 3 594 3
Grand Totals 5025 2340 46.57 624 632 3 594 3
November 15, 2017 8:38 am Page 144 of 219

Regi
stra
tion
Ballo
ts C
ast
Turn
out (
%)
ENGL
EWOO
D LO
CAL
BOAR
D OF
BREN
T D.
WAT
SON
MIC
HELL
E M
AROM
HOW
ARD
L. H
AUGH
TON
BETT
Y H.
GRI
FFIN
WIL
LIAM
FEI
NSTE
IN
MAT
THEW
GAR
RISO
N
DIER
DRE
GLEN
N PA
UL
DALI
A LE
RNER
Pers
onal
Choic
e
ENGLEWOOD LOCAL BOARD OF EDUCATION
BERGEN COUNTY Statement of VoteBER_20171107_E
Englewood W1 D1 - Election Day 1396 527 37.75 142 195 109 63 60 25 38 224 0Englewood W1 D2 - Election Day 862 361 41.88 98 129 102 59 39 16 29 169 1Englewood W1 D3 - Election Day 793 285 35.94 39 52 44 46 33 20 34 39 0Englewood W1 D4 - Election Day 869 320 36.82 64 50 69 55 37 14 28 45 1Englewood W2 D1 - Election Day 816 310 37.99 86 146 40 29 34 21 16 152 0Englewood W2 D2 - Election Day 723 266 36.79 114 160 31 19 22 13 9 169 1Englewood W2 D3 - Election Day 1145 371 32.40 138 183 49 32 39 27 16 178 0Englewood W2 D4 - Election Day 1823 466 25.56 111 120 74 90 57 35 60 72 0Englewood W3 D1 - Election Day 860 290 33.72 53 38 48 58 39 21 32 32 0Englewood W3 D2 - Election Day 1411 574 40.68 89 80 167 128 86 52 76 65 0Englewood W3 D3 - Election Day 706 322 45.61 57 53 98 62 37 35 38 65 0Englewood W3 D4 - Election Day 999 409 40.94 51 35 117 101 58 21 79 23 0Englewood W4 D1 - Election Day 679 215 31.66 37 31 49 71 32 16 37 15 0Englewood W4 D2 - Election Day 1167 474 40.62 83 52 103 138 86 17 79 37 3Englewood W4 D3 - Election Day 1102 388 35.21 64 57 85 131 54 16 46 32 0Englewood W4 D4 - Election Day 1038 326 31.41 74 56 62 90 58 20 42 48 0Englewood Mail-In Ballot - Mail-In 0 324 0.00 48 75 50 75 66 38 75 71 3Englewood Provisional - Provision 0 40 0.00 7 11 7 8 4 7 4 7 0
Election Day Totals 16389 5904 36.02 1300 1437 1247 1172 771 369 659 1365 6
Mail-In Ballot Totals 0 324 0.00 48 75 50 75 66 38 75 71 3
Provisional Totals 0 40 0.00 7 11 7 8 4 7 4 7 0
District Totals - Absentee
District Grand TotalsCounty 16389 6268 38.25 1355 1523 1304 1255 841 414 738 1443 9Englewood 16389 6268 38.25 1355 1523 1304 1255 841 414 738 1443 9
Grand Totals 16389 6268 38.25 1355 1523 1304 1255 841 414 738 1443 9
November 15, 2017 8:38 am Page 145 of 219

Regi
stra
tion
Ballo
ts C
ast
Turn
out (
%)
ENGL
EWOO
D CL
IFFS
LOC
AL
EUGE
NE L
. CHA
NG
PHIL
IP K
. CHO
I
KATH
ERIN
E KA
NG
Pers
onal
Cho
ice
ENGLEWOOD CLIFFS LOCAL BOARD OF EDUCATION
BERGEN COUNTY Statement of VoteBER_20171107_E
Englewood Cliffs 1 - Election Day 1056 439 41.57 115 110 107 2Englewood Cliffs 2 - Election Day 874 379 43.36 104 91 100 2Englewood Cliffs 3 - Election Day 880 402 45.68 94 76 76 2Englewood Cliffs 4 - Election Day 797 327 41.03 88 89 83 0Englewood Cliffs Mail-In Ballot - M 0 383 0.00 148 151 130 9Englewood Cliffs Provisional - Pro 0 26 0.00 7 7 6 0
Election Day Totals 3607 1547 42.89 401 366 366 6
Mail-In Ballot Totals 0 383 0.00 148 151 130 9
Provisional Totals 0 26 0.00 7 7 6 0
District Totals - Absentee
District Grand TotalsCounty 3607 1956 54.23 556 524 502 15Englewood Cliffs 3607 1956 54.23 556 524 502 15
Grand Totals 3607 1956 54.23 556 524 502 15
November 15, 2017 8:38 am Page 146 of 219

Regi
stra
tion
Ballo
ts C
ast
Turn
out (
%)
FAIR
LAW
N LO
CAL
BOAR
D OF
DAVI
D TR
ATNE
R
RONA
LD J
. BAR
BARU
LO
ELYS
S FR
ENKE
L
HELE
N M
. POL
LAK
JOAN
M. P
IELA
EMIL
Y CO
HEN
ADI V
AXM
AN
Pers
onal
Choic
e
FAIR LAWN LOCAL BOARD OF EDUCATION
BERGEN COUNTY Statement of VoteBER_20171107_E
Fair Lawn 1 - Election Day 961 392 40.79 75 111 93 25 84 52 31 1Fair Lawn 2 - Election Day 1378 583 42.31 134 115 149 37 60 199 168 0Fair Lawn 3 - Election Day 856 367 42.87 65 66 70 15 53 130 112 0Fair Lawn 4 - Election Day 1055 450 42.65 84 85 101 26 61 130 96 0Fair Lawn 5 - Election Day 672 304 45.24 83 75 75 16 51 103 70 1Fair Lawn 6 - Election Day 930 386 41.51 75 84 74 24 65 127 99 0Fair Lawn 7 - Election Day 732 334 45.63 71 84 67 22 61 99 85 0Fair Lawn 8 - Election Day 898 375 41.76 85 102 107 27 88 44 19 0Fair Lawn 9 - Election Day 972 400 41.15 80 103 97 23 72 80 43 1Fair Lawn 10 - Election Day 1006 426 42.35 86 124 98 21 89 64 38 0Fair Lawn 11 - Election Day 929 411 44.24 95 118 99 17 98 80 51 0Fair Lawn 12 - Election Day 763 339 44.43 79 118 103 22 96 79 56 0Fair Lawn 13 - Election Day 1052 493 46.86 113 107 104 27 65 138 107 0Fair Lawn 14 - Election Day 773 364 47.09 92 89 92 11 58 115 102 1Fair Lawn 15 - Election Day 1311 449 34.25 84 93 90 22 67 87 41 2Fair Lawn 16 - Election Day 1052 452 42.97 105 129 117 20 94 77 35 0Fair Lawn 17 - Election Day 944 377 39.94 88 93 93 23 81 73 51 1Fair Lawn 18 - Election Day 797 369 46.30 85 87 67 20 53 73 47 4Fair Lawn 19 - Election Day 819 361 44.08 89 115 87 17 98 72 45 0Fair Lawn 20 - Election Day 889 349 39.26 71 111 84 19 93 68 31 1Fair Lawn 21 - Election Day 1181 457 38.70 102 126 100 24 100 62 32 0Fair Lawn 22 - Election Day 838 288 34.37 53 73 50 14 55 36 22 2Fair Lawn 23 - Election Day 1011 446 44.11 122 142 106 16 108 80 51 1Fair Lawn Mail-In Ballot - Mail-In B 0 496 0.00 172 166 165 64 119 152 101 6Fair Lawn Provisional - Provisiona 0 61 0.00 12 15 16 3 16 26 14 0
Election Day Totals 21819 9172 42.04 2016 2350 2123 488 1750 2068 1432 15
Mail-In Ballot Totals 0 496 0.00 172 166 165 64 119 152 101 6
Provisional Totals 0 61 0.00 12 15 16 3 16 26 14 0
District Totals - Absentee
District Grand TotalsCounty 21819 9729 44.59 2200 2531 2304 555 1885 2246 1547 21Fair Lawn 21819 9729 44.59 2200 2531 2304 555 1885 2246 1547 21
Grand Totals 21819 9729 44.59 2200 2531 2304 555 1885 2246 1547 21
November 15, 2017 8:38 am Page 147 of 219

Regi
stra
tion
Ballo
ts C
ast
Turn
out (
%)
FORT
LEE
LOC
AL B
OARD
OF
ELIS
A CH
O
RALP
H A.
DiM
EGLI
O
MIC
HAEL
OSS
O
LAUR
AN T
UCK
Pers
onal
Cho
ice
FORT
LEE
LOC
AL B
OE- 2
YR U
NEXP
I R
MIC
HAEL
RUB
INO
Pers
onal
Choic
e
FORT LEE SCHOOL
BERGEN COUNTY Statement of VoteBER_20171107_E
Fort Lee 1 - Election Day 1117 383 34.29 109 97 114 126 0 92 0Fort Lee 2 - Election Day 768 271 35.29 79 69 82 101 3 67 1Fort Lee 3 - Election Day 1454 495 34.04 141 100 99 169 0 145 0Fort Lee 4 - Election Day 583 269 46.14 60 56 44 67 0 66 0Fort Lee 5 - Election Day 908 301 33.15 103 98 72 105 0 93 0Fort Lee 6 - Election Day 1556 506 32.52 178 101 90 141 0 154 0Fort Lee 7 - Election Day 2142 777 36.27 319 174 135 210 1 218 0Fort Lee 8 - Election Day 609 158 25.94 63 41 32 39 0 43 0Fort Lee 9 - Election Day 687 203 29.55 84 66 45 58 1 75 0Fort Lee 10 - Election Day 2683 836 31.16 219 120 115 170 2 195 1Fort Lee 11 - Election Day 683 226 33.09 96 50 33 34 0 51 0Fort Lee 12 - Election Day 1270 380 29.92 132 71 59 69 1 112 0Fort Lee 13 - Election Day 737 269 36.50 97 54 63 61 0 79 0Fort Lee 14 - Election Day 607 223 36.74 58 44 41 52 0 59 0Fort Lee 15 - Election Day 777 217 27.93 85 49 46 46 0 72 0Fort Lee 16 - Election Day 1013 330 32.58 122 99 80 86 1 114 0Fort Lee 17 - Election Day 503 203 40.36 51 30 30 41 0 41 0Fort Lee 18 - Election Day 471 169 35.88 59 42 36 57 0 61 0Fort Lee 19 - Election Day 1374 483 35.15 148 93 96 134 0 131 0Fort Lee Mail-In Ballot - Mail-In Ba 0 463 0.00 159 142 138 164 3 203 3Fort Lee Provisional - Provisional 0 62 0.00 28 13 16 13 0 23 0
Election Day Totals 19942 6699 33.59 2203 1454 1312 1766 9 1868 2
Mail-In Ballot Totals 0 463 0.00 159 142 138 164 3 203 3
Provisional Totals 0 62 0.00 28 13 16 13 0 23 0
District Totals - Absentee
District Grand TotalsCounty 19942 7224 36.23 2390 1609 1466 1943 12 2094 5Fort Lee 19942 7224 36.23 2390 1609 1466 1943 12 2094 5
Grand Totals 19942 7224 36.23 2390 1609 1466 1943 12 2094 5
November 15, 2017 8:38 am Page 148 of 219

Regi
stra
tion
Ballo
ts C
ast
Turn
out (
%)
FRAN
KLIN
LAK
ES L
OCAL
BOA
RD
PETE
R KO
ULIK
OURD
IS
DAN
LADN
ER
LISA
T. A
CQUA
IRE
ANN
KRAE
MER
Pers
onal
Cho
ice
FRANKLIN LAKES LOCAL BOARD OF EDUCATION
BERGEN COUNTY Statement of VoteBER_20171107_E
Franklin Lakes 1 - Election Day 1044 371 35.54 120 60 110 95 0Franklin Lakes 2 - Election Day 1054 398 37.76 114 79 99 84 0Franklin Lakes 3 - Election Day 1110 407 36.67 134 88 126 102 2Franklin Lakes 4 - Election Day 2024 712 35.18 228 142 206 173 0Franklin Lakes 5 - Election Day 1480 531 35.88 175 111 157 128 0Franklin Lakes 6 - Election Day 1328 490 36.90 132 110 125 109 1Franklin Lakes Mail-In Ballot - Mai 0 240 0.00 91 58 107 90 0Franklin Lakes Provisional - Provis 0 20 0.00 6 2 4 4 0
Election Day Totals 8040 2909 36.18 903 590 823 691 3
Mail-In Ballot Totals 0 240 0.00 91 58 107 90 0
Provisional Totals 0 20 0.00 6 2 4 4 0
District Totals - Absentee
District Grand TotalsCounty 8040 3169 39.42 1000 650 934 785 3Franklin Lakes 8040 3169 39.42 1000 650 934 785 3
Grand Totals 8040 3169 39.42 1000 650 934 785 3
November 15, 2017 8:38 am Page 149 of 219

Regi
stra
tion
Ballo
ts C
ast
Turn
out (
%)
GLEN
ROC
K LO
CAL
BOAR
D OF
EDM
UND
C. H
AYW
ARD
RONA
D. M
cNAB
OLA
THEO
DORE
S. J
ADIC
K Jr
MEG
AN M
ARIE
FIN
DLEY
Pers
onal
Cho
ice
GLEN ROCK LOCAL BOARD OF EDUCATION
BERGEN COUNTY Statement of VoteBER_20171107_E
Glen Rock 1 - Election Day 1038 497 47.88 163 148 127 195 0Glen Rock 2 - Election Day 1143 566 49.52 142 182 131 249 3Glen Rock 3 - Election Day 1168 560 47.95 174 167 145 171 1Glen Rock 4 - Election Day 967 471 48.71 195 136 125 198 0Glen Rock 5 - Election Day 1221 572 46.85 154 193 147 227 1Glen Rock 6 - Election Day 942 432 45.86 134 145 101 154 0Glen Rock 7 - Election Day 1113 531 47.71 162 181 141 192 3Glen Rock 8 - Election Day 832 404 48.56 144 152 149 174 0Glen Rock Mail-In Ballot - Mail-In B 0 329 0.00 135 160 130 188 3Glen Rock Provisional - Provisiona 0 25 0.00 9 5 9 10 0
Election Day Totals 8424 4033 47.88 1268 1304 1066 1560 8
Mail-In Ballot Totals 0 329 0.00 135 160 130 188 3
Provisional Totals 0 25 0.00 9 5 9 10 0
District Totals - Absentee
District Grand TotalsCounty 8424 4387 52.08 1412 1469 1205 1758 11Glen Rock 8424 4387 52.08 1412 1469 1205 1758 11
Grand Totals 8424 4387 52.08 1412 1469 1205 1758 11
November 15, 2017 8:38 am Page 150 of 219

Regi
stra
tion
Ballo
ts C
ast
Turn
out (
%)
HARR
INGT
ON P
ARK
REGI
ONAL
JESS
ICA
SPIL
LANE
JOHN
L. S
CHET
TINO
Pers
onal
Cho
ice
HARR
INGT
ON P
ARK
LOCA
L
ERIC
FIS
HBEI
N
DIAN
NE S
MIT
H
Pers
onal
Choic
e
HARRINGTON PARK SCHOOL
BERGEN COUNTY Statement of VoteBER_20171107_E
Harrington Park 1 - Election Day 1017 485 47.69 180 182 0 184 201 0Harrington Park 2 - Election Day 1186 550 46.37 228 193 0 214 231 0Harrington Park 3 - Election Day 1145 561 49.00 198 197 0 213 220 0Harrington Park Mail-In Ballot - Ma 0 87 0.00 32 37 0 44 45 0Harrington Park Provisional - Prov 0 12 0.00 5 4 0 4 2 0
Election Day Totals 3348 1596 47.67 606 572 0 611 652 0
Mail-In Ballot Totals 0 87 0.00 32 37 0 44 45 0
Provisional Totals 0 12 0.00 5 4 0 4 2 0
District Totals - Absentee
District Grand TotalsCounty 3348 1695 50.63 643 613 0 659 699 0Harrington Park 3348 1695 50.63 643 613 0 659 699 0
Grand Totals 3348 1695 50.63 643 613 0 659 699 0
November 15, 2017 8:38 am Page 151 of 219

Regi
stra
tion
Ballo
ts C
ast
Turn
out (
%)
HASB
ROUC
K HE
IGHT
S LO
CAL
JILL
IAN
FERD
INAN
D
REI V
AKA
ROBE
RT S
ALER
NO
JANE
T LO
HRM
ANN
NICO
LE C
AMPB
ELL
RUSS
O
JOSE
PH A
. SAM
PERI
Pers
onal
Choic
e
HASB
ROUC
K HE
IGHT
S LO
CAL
BOE
-
CARA
CAP
ASSO
-MUR
RAY
Pers
onal
Choic
e
HASBROUCK HEIGHTS SCHOOL
BERGEN COUNTY Statement of VoteBER_20171107_E
Hasbrouck Heights 1 - Election Da 865 396 45.78 81 46 85 51 66 64 0 90 0Hasbrouck Heights 2 - Election Da 1027 409 39.82 84 27 92 64 68 71 0 95 0Hasbrouck Heights 3 - Election Da 832 348 41.83 81 35 84 74 76 64 0 80 0Hasbrouck Heights 4 - Election Da 963 419 43.51 79 38 86 50 64 68 1 89 0Hasbrouck Heights 5 - Election Da 823 323 39.25 88 31 54 50 57 49 1 85 0Hasbrouck Heights 6 - Election Da 855 379 44.33 78 32 74 58 61 59 3 96 0Hasbrouck Heights 7 - Election Da 863 357 41.37 68 31 73 70 68 69 3 91 0Hasbrouck Heights 8 - Election Da 985 410 41.62 103 56 66 56 72 78 1 107 1Hasbrouck Heights 9 - Election Da 682 262 38.42 65 17 47 34 30 34 0 80 0Hasbrouck Heights Mail-In Ballot - 0 188 0.00 53 23 59 55 48 48 0 72 0Hasbrouck Heights Provisional - P 0 19 0.00 4 1 5 4 5 5 0 5 0
Election Day Totals 7895 3303 41.84 727 313 661 507 562 556 9 813 1
Mail-In Ballot Totals 0 188 0.00 53 23 59 55 48 48 0 72 0
Provisional Totals 0 19 0.00 4 1 5 4 5 5 0 5 0
District Totals - Absentee
District Grand TotalsCounty 7895 3510 44.46 784 337 725 566 615 609 9 890 1Hasbrouck Heights 7895 3510 44.46 784 337 725 566 615 609 9 890 1
Grand Totals 7895 3510 44.46 784 337 725 566 615 609 9 890 1
November 15, 2017 8:38 am Page 152 of 219

Regi
stra
tion
Ballo
ts C
ast
Turn
out (
%)
HAW
ORTH
LOC
AL B
OARD
OF
MAR
Y AN
NE D
ORAN
MIC
HAEL
A. R
ODIN
O
JEFF
REY
NADL
ER
MIC
HAEL
WIN
IK
Pers
onal
Cho
ice
HAWORTH LOCAL BOARD OF EDUCATION
BERGEN COUNTY Statement of VoteBER_20171107_E
Haworth 1 - Election Day 1295 592 45.71 203 132 111 130 0Haworth 2 - Election Day 1193 550 46.10 158 158 101 102 0Haworth Mail-In Ballot - Mail-In Ba 0 87 0.00 31 20 18 23 1Haworth Provisional - Provisional 0 4 0.00 3 1 1 0 0
Election Day Totals 2488 1142 45.90 361 290 212 232 0
Mail-In Ballot Totals 0 87 0.00 31 20 18 23 1
Provisional Totals 0 4 0.00 3 1 1 0 0
District Totals - Absentee
District Grand TotalsCounty 2488 1233 49.56 395 311 231 255 1Haworth 2488 1233 49.56 395 311 231 255 1
Grand Totals 2488 1233 49.56 395 311 231 255 1
November 15, 2017 8:38 am Page 153 of 219

Regi
stra
tion
Ballo
ts C
ast
Turn
out (
%)
HILL
SDAL
E RE
GION
AL B
OARD
OF
ARNO
LD S
CHER
MIC
HAEL
J. E
LIAV
KENN
ETH
RALP
H
Pers
onal
Cho
ice
HILL
SDAL
E LO
CAL
BOAR
D OF
CHRI
STIN
A JE
NNIN
GS
MIC
HAEL
M. M
ARTI
NEZ
KRIS
TA F
LINN
ADAM
D. W
OLPE
R
Pers
onal
Choic
e
HILLSDALE SCHOOL
BERGEN COUNTY Statement of VoteBER_20171107_E
Hillsdale 1 - Election Day 1036 472 45.56 102 90 108 0 123 37 97 30 0Hillsdale 2 - Election Day 912 404 44.30 93 61 63 0 108 29 64 17 0Hillsdale 3 - Election Day 1364 585 42.89 139 97 99 0 173 69 88 33 0Hillsdale 4 - Election Day 1376 592 43.02 138 106 114 1 160 60 108 31 0Hillsdale 5 - Election Day 1373 631 45.96 146 126 128 0 159 74 133 35 1Hillsdale 6 - Election Day 1485 643 43.30 184 85 106 0 205 55 109 39 0Hillsdale Mail-In Ballot - Mail-In Ba 0 192 0.00 91 43 67 0 85 32 52 28 0Hillsdale Provisional - Provisional 0 9 0.00 3 7 1 0 4 3 5 1 0
Election Day Totals 7546 3327 44.09 802 565 618 1 928 324 599 185 1
Mail-In Ballot Totals 0 192 0.00 91 43 67 0 85 32 52 28 0
Provisional Totals 0 9 0.00 3 7 1 0 4 3 5 1 0
District Totals - Absentee
District Grand TotalsCounty 7546 3528 46.75 896 615 686 1 1017 359 656 214 1Hillsdale 7546 3528 46.75 896 615 686 1 1017 359 656 214 1
Grand Totals 7546 3528 46.75 896 615 686 1 1017 359 656 214 1
November 15, 2017 8:38 am Page 154 of 219

Regi
stra
tion
Ballo
ts C
ast
Turn
out (
%)
HO-H
O-KU
S LO
CAL
BOAR
D OF
ELLE
N M
ARIE
WAL
SH
JOHN
BAT
T
Pers
onal
Cho
ice
HO-HO-KUS LOCAL BOARD OF EDUCATION
BERGEN COUNTY Statement of VoteBER_20171107_E
Ho-Ho-Kus 1 - Election Day 1061 551 51.93 249 177 1Ho-Ho-Kus 2 - Election Day 1104 539 48.82 269 183 0Ho-Ho-Kus 3 - Election Day 914 486 53.17 248 202 1Ho-Ho-Kus Mail-In Ballot - Mail-In 0 89 0.00 45 48 2Ho-Ho-Kus Provisional - Provision 0 13 0.00 4 0 0
Election Day Totals 3079 1576 51.19 766 562 2
Mail-In Ballot Totals 0 89 0.00 45 48 2
Provisional Totals 0 13 0.00 4 0 0
District Totals - Absentee
District Grand TotalsCounty 3079 1678 54.50 815 610 4Ho-Ho-Kus 3079 1678 54.50 815 610 4
Grand Totals 3079 1678 54.50 815 610 4
November 15, 2017 8:38 am Page 155 of 219
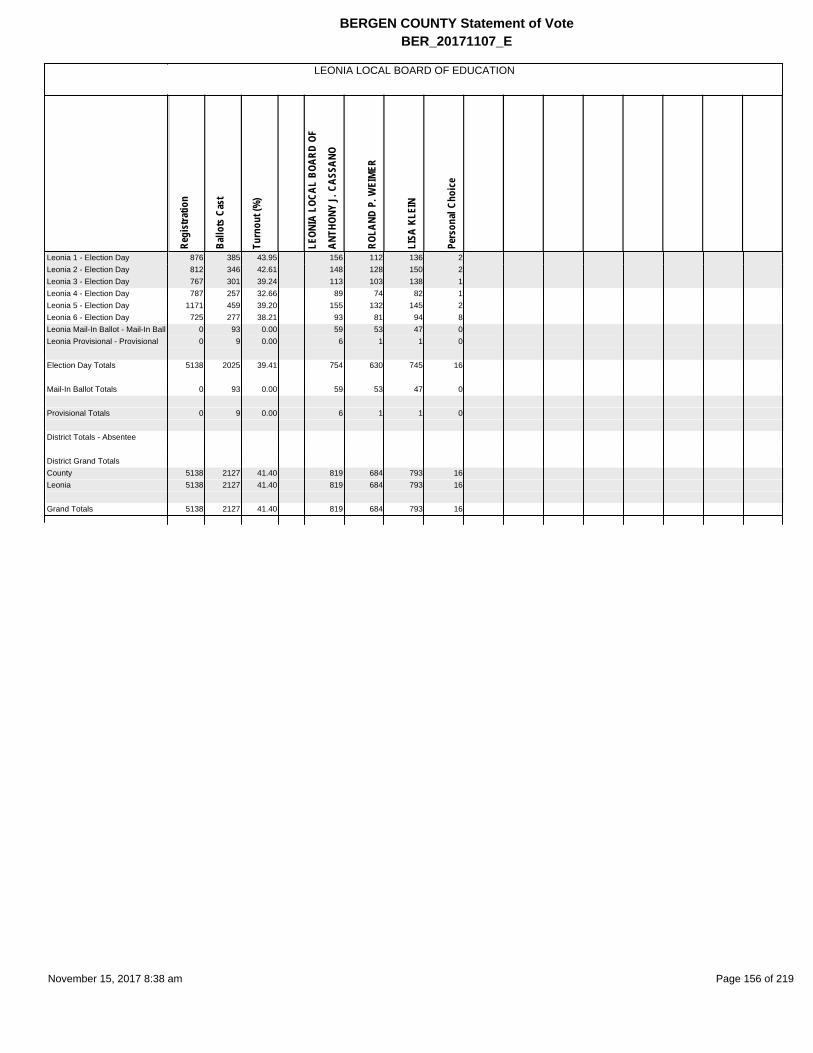
Regi
stra
tion
Ballo
ts C
ast
Turn
out (
%)
LEON
IA L
OCAL
BOA
RD O
F
ANTH
ONY
J. C
ASSA
NO
ROLA
ND P
. WEI
MER
LISA
KLE
IN
Pers
onal
Cho
ice
LEONIA LOCAL BOARD OF EDUCATION
BERGEN COUNTY Statement of VoteBER_20171107_E
Leonia 1 - Election Day 876 385 43.95 156 112 136 2Leonia 2 - Election Day 812 346 42.61 148 128 150 2Leonia 3 - Election Day 767 301 39.24 113 103 138 1Leonia 4 - Election Day 787 257 32.66 89 74 82 1Leonia 5 - Election Day 1171 459 39.20 155 132 145 2Leonia 6 - Election Day 725 277 38.21 93 81 94 8Leonia Mail-In Ballot - Mail-In Ballo 0 93 0.00 59 53 47 0Leonia Provisional - Provisional 0 9 0.00 6 1 1 0
Election Day Totals 5138 2025 39.41 754 630 745 16
Mail-In Ballot Totals 0 93 0.00 59 53 47 0
Provisional Totals 0 9 0.00 6 1 1 0
District Totals - Absentee
District Grand TotalsCounty 5138 2127 41.40 819 684 793 16Leonia 5138 2127 41.40 819 684 793 16
Grand Totals 5138 2127 41.40 819 684 793 16
November 15, 2017 8:38 am Page 156 of 219
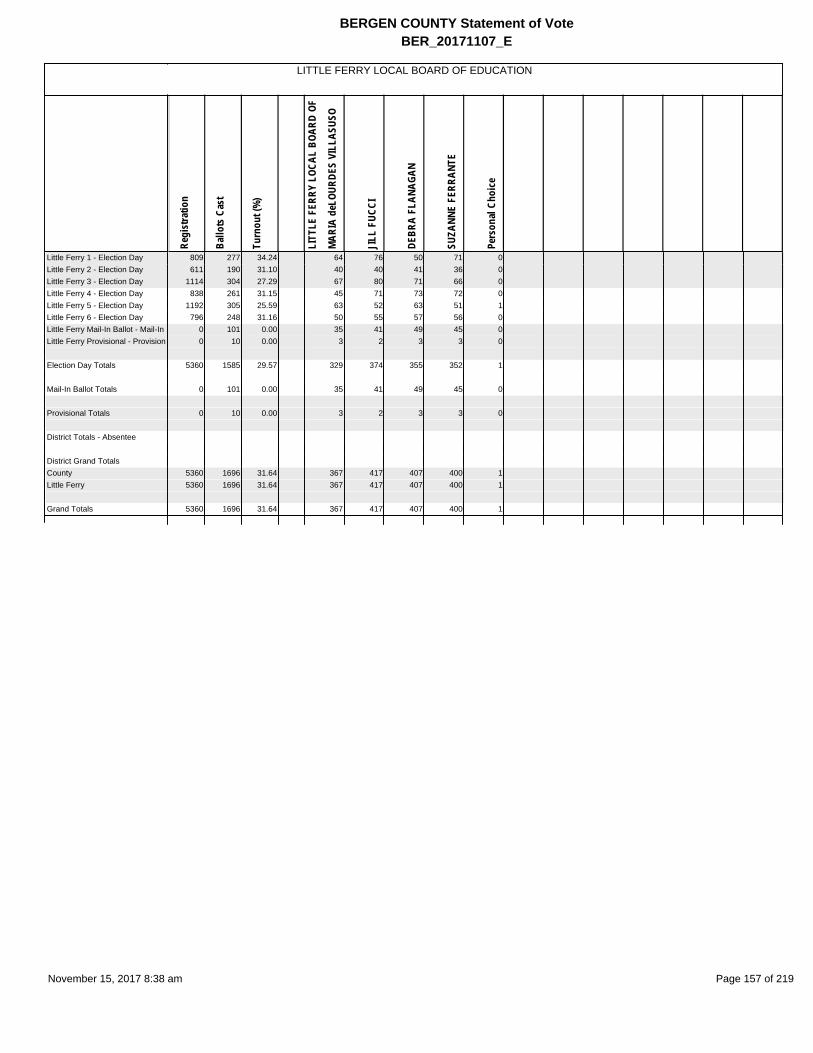
Regi
stra
tion
Ballo
ts C
ast
Turn
out (
%)
LITT
LE F
ERRY
LOC
AL B
OARD
OF
MAR
IA d
eLOU
RDES
VIL
LASU
SO
JILL
FUC
CI
DEBR
A FL
ANAG
AN
SUZA
NNE
FERR
ANTE
Pers
onal
Cho
ice
LITTLE FERRY LOCAL BOARD OF EDUCATION
BERGEN COUNTY Statement of VoteBER_20171107_E
Little Ferry 1 - Election Day 809 277 34.24 64 76 50 71 0Little Ferry 2 - Election Day 611 190 31.10 40 40 41 36 0Little Ferry 3 - Election Day 1114 304 27.29 67 80 71 66 0Little Ferry 4 - Election Day 838 261 31.15 45 71 73 72 0Little Ferry 5 - Election Day 1192 305 25.59 63 52 63 51 1Little Ferry 6 - Election Day 796 248 31.16 50 55 57 56 0Little Ferry Mail-In Ballot - Mail-In 0 101 0.00 35 41 49 45 0Little Ferry Provisional - Provisiona 0 10 0.00 3 2 3 3 0
Election Day Totals 5360 1585 29.57 329 374 355 352 1
Mail-In Ballot Totals 0 101 0.00 35 41 49 45 0
Provisional Totals 0 10 0.00 3 2 3 3 0
District Totals - Absentee
District Grand TotalsCounty 5360 1696 31.64 367 417 407 400 1Little Ferry 5360 1696 31.64 367 417 407 400 1
Grand Totals 5360 1696 31.64 367 417 407 400 1
November 15, 2017 8:38 am Page 157 of 219

Regi
stra
tion
Ballo
ts C
ast
Turn
out (
%)
LODI
LOC
AL B
OARD
OF
JEFF
REY
TELE
P
JOSE
PH B
IGIC
A
DAVI
D T.
KIM
DONA
LD S
CORZ
ETTI
JOSE
PH A
. RAM
OS J
r
SHAR
ON S
ALVA
CION
BURT
ON W
EINE
R
JOSE
PH P
. LET
O IV
PAM
ELA
LAVE
ZZOL
A
MIC
HAEL
RAV
ENDA
Pers
onal
Choic
e
LODI LOCAL BOARD OF EDUCATION
BERGEN COUNTY Statement of VoteBER_20171107_E
Lodi 1 - Election Day 1349 419 31.06 86 75 59 100 39 64 22 130 39 55 0Lodi 2 - Election Day 1382 419 30.32 96 71 75 70 30 60 30 94 27 37 0Lodi 3 - Election Day 919 248 26.99 35 50 40 50 18 26 21 49 15 19 0Lodi 4 - Election Day 923 234 25.35 34 27 33 28 28 30 23 30 21 20 0Lodi 5 - Election Day 999 324 32.43 59 43 40 63 27 57 17 80 39 31 0Lodi 6 - Election Day 842 275 32.66 63 54 56 70 30 52 22 78 26 34 0Lodi 7 - Election Day 637 214 33.59 53 35 37 39 33 30 12 41 28 51 0Lodi 8 - Election Day 1214 380 31.30 97 62 79 57 59 51 27 68 42 43 2Lodi 9 - Election Day 987 297 30.09 54 56 61 38 58 33 26 40 32 53 4Lodi 10 - Election Day 1134 314 27.69 72 54 61 28 34 39 29 42 24 31 0Lodi 11 - Election Day 1166 390 33.45 80 49 77 86 34 59 25 107 55 46 1Lodi 12 - Election Day 1102 379 34.39 99 74 79 76 30 45 25 88 39 40 0Lodi Mail-In Ballot - Mail-In Ballot 0 225 0.00 56 39 45 59 28 38 15 69 39 42 0Lodi Provisional - Provisional 0 30 0.00 7 5 4 6 2 3 2 7 4 1 0
Election Day Totals 12654 3893 30.76 828 650 697 705 420 546 279 847 387 460 7
Mail-In Ballot Totals 0 225 0.00 56 39 45 59 28 38 15 69 39 42 0
Provisional Totals 0 30 0.00 7 5 4 6 2 3 2 7 4 1 0
District Totals - Absentee
District Grand TotalsCounty 12654 4148 32.78 891 694 746 770 450 587 296 923 430 503 7Lodi 12654 4148 32.78 891 694 746 770 450 587 296 923 430 503 7
Grand Totals 12654 4148 32.78 891 694 746 770 450 587 296 923 430 503 7
November 15, 2017 8:38 am Page 158 of 219

Regi
stra
tion
Ballo
ts C
ast
Turn
out (
%)
LODI
LOC
AL B
OE- 2
YR U
NEXP
IRED
ANTO
NINO
PIT
TI
NANC
Y CA
RDON
E
ALFO
NSO
MAS
TROF
ILIP
O Jr
Pers
onal
Cho
ice
LODI
LOC
AL B
OARD
OF
LOUI
S TU
CCIL
LO
ROBE
RT M
ARRA
KERR
Y M
ASTR
OFIL
IPO
JASO
N JA
COBY
Pers
onal
Choic
e
LODI SCHOOL
BERGEN COUNTY Statement of VoteBER_20171107_E
Lodi 1 - Election Day 1349 419 31.06 40 143 67 0 50 73 72 26 0Lodi 2 - Election Day 1382 419 30.32 20 112 108 0 42 75 98 15 0Lodi 3 - Election Day 919 248 26.99 16 75 39 0 15 45 41 13 0Lodi 4 - Election Day 923 234 25.35 17 54 23 0 23 36 25 16 0Lodi 5 - Election Day 999 324 32.43 34 95 53 0 40 56 62 12 0Lodi 6 - Election Day 842 275 32.66 15 102 54 0 26 62 54 14 0Lodi 7 - Election Day 637 214 33.59 8 63 48 0 15 37 40 7 0Lodi 8 - Election Day 1214 380 31.30 16 91 100 0 24 61 95 30 0Lodi 9 - Election Day 987 297 30.09 21 76 57 1 28 52 42 24 1Lodi 10 - Election Day 1134 314 27.69 31 70 48 0 37 51 52 12 0Lodi 11 - Election Day 1166 390 33.45 30 128 59 0 31 90 61 22 0Lodi 12 - Election Day 1102 379 34.39 34 128 72 0 32 95 67 15 0Lodi Mail-In Ballot - Mail-In Ballot 0 225 0.00 14 82 60 0 33 68 44 16 0Lodi Provisional - Provisional 0 30 0.00 3 11 6 0 2 8 6 1 0
Election Day Totals 12654 3893 30.76 282 1137 728 1 363 733 709 206 1
Mail-In Ballot Totals 0 225 0.00 14 82 60 0 33 68 44 16 0
Provisional Totals 0 30 0.00 3 11 6 0 2 8 6 1 0
District Totals - Absentee
District Grand TotalsCounty 12654 4148 32.78 299 1230 794 1 398 809 759 223 1Lodi 12654 4148 32.78 299 1230 794 1 398 809 759 223 1
Grand Totals 12654 4148 32.78 299 1230 794 1 398 809 759 223 1
November 15, 2017 8:38 am Page 159 of 219

Regi
stra
tion
Ballo
ts C
ast
Turn
out (
%)
LYND
HURS
T LO
CAL
BOAR
D OF
ROSA
OLI
VARE
S
JOSE
PH A
BRUS
CATO
JAM
ES V
UONO
FRAN
K FE
RRAN
DINO
PATR
ICK
J. G
LOVE
R
ELAI
NE S
TELL
A
ERIN
KEE
FE
WIL
LIE
GARC
IA
Pers
onal
Choic
e
LYNDHURST LOCAL BOARD OF EDUCATION
BERGEN COUNTY Statement of VoteBER_20171107_E
Lyndhurst 1 - Election Day 748 275 36.76 41 80 58 57 69 49 117 55 0Lyndhurst 2 - Election Day 748 243 32.49 28 77 70 58 53 41 78 52 0Lyndhurst 3 - Election Day 1199 340 28.36 55 84 68 51 84 48 98 69 0Lyndhurst 4 - Election Day 867 341 39.33 40 125 98 61 81 80 96 55 1Lyndhurst 5 - Election Day 745 271 36.38 42 94 67 50 61 60 80 50 1Lyndhurst 6 - Election Day 1017 328 32.25 25 104 87 74 60 52 75 68 0Lyndhurst 7 - Election Day 775 285 36.77 27 116 89 76 50 38 58 68 0Lyndhurst 8 - Election Day 860 320 37.21 57 86 67 62 71 50 95 50 1Lyndhurst 9 - Election Day 708 276 38.98 33 78 65 46 64 33 106 56 0Lyndhurst 10 - Election Day 953 359 37.67 58 116 111 71 96 51 114 72 0Lyndhurst 11 - Election Day 793 342 43.13 53 117 97 89 85 60 114 63 1Lyndhurst 12 - Election Day 702 280 39.89 31 110 88 61 67 55 98 61 0Lyndhurst 13 - Election Day 929 294 31.65 23 150 121 58 56 52 81 82 1Lyndhurst 14 - Election Day 747 253 33.87 33 111 92 58 48 29 68 68 0Lyndhurst 15 - Election Day 843 293 34.76 23 140 125 67 64 48 64 87 0Lyndhurst Mail-In Ballot - Mail-In B 0 329 0.00 35 154 133 70 56 90 81 100 0Lyndhurst Provisional - Provisiona 0 22 0.00 1 8 8 5 5 0 6 7 0
Election Day Totals 12634 4500 35.62 569 1588 1303 939 1009 746 1342 956 5
Mail-In Ballot Totals 0 329 0.00 35 154 133 70 56 90 81 100 0
Provisional Totals 0 22 0.00 1 8 8 5 5 0 6 7 0
District Totals - Absentee
District Grand TotalsCounty 12634 4851 38.40 605 1750 1444 1014 1070 836 1429 1063 5Lyndhurst 12634 4851 38.40 605 1750 1444 1014 1070 836 1429 1063 5
Grand Totals 12634 4851 38.40 605 1750 1444 1014 1070 836 1429 1063 5
November 15, 2017 8:38 am Page 160 of 219

Regi
stra
tion
Ballo
ts C
ast
Turn
out (
%)
MAH
WAH
LOC
AL B
OARD
OF
RICH
ARD
A. D
eSIL
VA J
r
SALV
ATOR
E TR
ABON
A
LYND
A ZA
CCON
E
JOHN
DIN
ICE
KIM
M. B
ARRO
N
PETE
R J.
DeP
ASQU
ALE
Pers
onal
Choic
e
MAH
WAH
LOC
AL B
OE- 1
YR
UNEX
PIR
BENJ
AMIN
KEZ
MAR
SKY
Pers
onal
Choic
e
MAHWAH SCHOOL
BERGEN COUNTY Statement of VoteBER_20171107_E
Mahwah 1 - Election Day 1581 771 48.77 310 152 295 158 227 119 0 270 0Mahwah 2 - Election Day 1236 685 55.42 250 195 308 143 217 125 0 267 1Mahwah 3 - Election Day 1256 614 48.89 198 154 271 91 156 119 0 216 0Mahwah 4 - Election Day 1051 522 49.67 164 80 168 86 112 76 1 176 0Mahwah 5 - Election Day 947 432 45.62 174 71 162 90 128 92 3 141 0Mahwah 6 - Election Day 1188 545 45.88 170 78 186 85 119 96 3 147 1Mahwah 7 - Election Day 1536 732 47.66 259 141 249 136 174 206 0 258 0Mahwah 8 - Election Day 1366 495 36.24 161 73 143 85 105 97 0 131 0Mahwah 9 - Election Day 484 212 43.80 73 36 72 38 57 33 0 72 0Mahwah 10 - Election Day 1424 650 45.65 230 120 224 113 141 106 0 171 0Mahwah 11 - Election Day 1595 739 46.33 222 169 318 193 201 112 3 228 0Mahwah 12 - Election Day 749 378 50.47 126 52 109 57 94 38 0 133 0Mahwah 13 - Election Day 1063 426 40.08 108 79 113 65 89 64 1 112 0Mahwah 14 - Election Day 1098 417 37.98 134 71 99 61 79 64 0 118 0Mahwah Mail-In Ballot - Mail-In Ba 0 385 0.00 149 81 156 119 154 63 5 165 3Mahwah Provisional - Provisional 0 58 0.00 21 11 12 10 17 4 0 17 0
Election Day Totals 16574 7618 45.96 2579 1471 2717 1401 1899 1347 11 2440 2
Mail-In Ballot Totals 0 385 0.00 149 81 156 119 154 63 5 165 3
Provisional Totals 0 58 0.00 21 11 12 10 17 4 0 17 0
District Totals - Absentee
District Grand TotalsCounty 16574 8061 48.64 2749 1563 2885 1530 2070 1414 16 2622 5Mahwah 16574 8061 48.64 2749 1563 2885 1530 2070 1414 16 2622 5
Grand Totals 16574 8061 48.64 2749 1563 2885 1530 2070 1414 16 2622 5
November 15, 2017 8:38 am Page 161 of 219

Regi
stra
tion
Ballo
ts C
ast
Turn
out (
%)
MAY
WOO
D LO
CAL
BOAR
D OF
DANY
EL C
ICAR
ELLI
GINA
-MAR
IE K
IELY
Pers
onal
Cho
ice
MAYWOOD LOCAL BOARD OF EDUCATION
BERGEN COUNTY Statement of VoteBER_20171107_E
Maywood 1 - Election Day 926 377 40.71 98 115 4Maywood 2 - Election Day 898 373 41.54 103 123 1Maywood 3 - Election Day 915 379 41.42 91 109 2Maywood 4 - Election Day 905 408 45.08 99 114 0Maywood 5 - Election Day 867 371 42.79 115 121 2Maywood 6 - Election Day 878 378 43.05 101 102 2Maywood 7 - Election Day 689 192 27.87 51 43 0Maywood Mail-In Ballot - Mail-In B 0 160 0.00 99 100 2Maywood Provisional - Provisiona 0 11 0.00 5 6 0
Election Day Totals 6078 2478 40.77 658 727 11
Mail-In Ballot Totals 0 160 0.00 99 100 2
Provisional Totals 0 11 0.00 5 6 0
District Totals - Absentee
District Grand TotalsCounty 6078 2649 43.58 762 833 13Maywood 6078 2649 43.58 762 833 13
Grand Totals 6078 2649 43.58 762 833 13
November 15, 2017 8:38 am Page 162 of 219

Regi
stra
tion
Ballo
ts C
ast
Turn
out (
%)
MID
LAND
PAR
K LO
CAL
BOAR
D OF
PETE
R TR
IOLO
MAR
YALI
CE T
HOM
AS
JAM
ES S
. CAN
ELLA
S
Pers
onal
Cho
ice
MIDLAND PARK LOCAL BOARD OF EDUCATION
BERGEN COUNTY Statement of VoteBER_20171107_E
Midland Park 1 - Election Day 1135 547 48.19 160 174 138 0Midland Park 2 - Election Day 745 345 46.31 93 100 76 0Midland Park 3 - Election Day 1151 525 45.61 145 145 123 3Midland Park 4 - Election Day 896 409 45.65 128 123 108 0Midland Park 5 - Election Day 1083 526 48.57 135 125 119 5Midland Park Mail-In Ballot - Mail- 0 104 0.00 48 48 46 7Midland Park Provisional - Provisio 0 17 0.00 2 6 2 0
Election Day Totals 5010 2352 46.95 661 667 564 8
Mail-In Ballot Totals 0 104 0.00 48 48 46 7
Provisional Totals 0 17 0.00 2 6 2 0
District Totals - Absentee
District Grand TotalsCounty 5010 2473 49.36 711 721 612 15Midland Park 5010 2473 49.36 711 721 612 15
Grand Totals 5010 2473 49.36 711 721 612 15
November 15, 2017 8:38 am Page 163 of 219

Regi
stra
tion
Ballo
ts C
ast
Turn
out (
%)
MON
TVAL
E RE
GION
AL B
OARD
OF
BRIA
N HA
LLOW
ELL
Pers
onal
Cho
ice
MON
TVAL
E LO
CAL
BOAR
D OF
DEBR
A M
cGAU
LEY-
EICH
HORN
JOHN
F. C
ARVE
LLI
RACH
EL B
ASKI
N
Pers
onal
Choic
e
MONTVALE SCHOOL
BERGEN COUNTY Statement of VoteBER_20171107_E
Montvale 1 - Election Day 738 351 47.56 144 0 105 91 82 0Montvale 2 - Election Day 1113 528 47.44 216 1 158 132 113 2Montvale 3 - Election Day 1929 836 43.34 364 1 300 250 224 0Montvale 4 - Election Day 1849 749 40.51 286 2 246 182 170 1Montvale Mail-In Ballot - Mail-In Ba 0 164 0.00 97 0 89 64 58 0Montvale Provisional - Provisional 0 14 0.00 8 0 8 2 4 0
Election Day Totals 5629 2464 43.77 1010 4 809 655 589 3
Mail-In Ballot Totals 0 164 0.00 97 0 89 64 58 0
Provisional Totals 0 14 0.00 8 0 8 2 4 0
District Totals - Absentee
District Grand TotalsCounty 5629 2642 46.94 1115 4 906 721 651 3Montvale 5629 2642 46.94 1115 4 906 721 651 3
Grand Totals 5629 2642 46.94 1115 4 906 721 651 3
November 15, 2017 8:38 am Page 164 of 219

Regi
stra
tion
Ballo
ts C
ast
Turn
out (
%)
MOO
NACH
IE L
OCAL
BOA
RD O
F
DAVI
D VA
CCAR
O
Pers
onal
Cho
ice
MOO
NACH
I LOC
AL B
OE -
1YR
EDM
OND
F. M
ONTI
Pers
onal
Cho
ice
MOONACHIE SCHOOL
BERGEN COUNTY Statement of VoteBER_20171107_E
Moonachie 1 - Election Day 296 70 23.65 19 1 14 0Moonachie 2 - Election Day 890 313 35.17 110 9 103 1Moonachie 3 - Election Day 414 120 28.99 38 2 35 0Moonachie Mail-In Ballot - Mail-In 0 24 0.00 14 0 13 0Moonachie Provisional - Provision 0 1 0.00 0 0 1 0
Election Day Totals 1600 503 31.44 167 12 152 1
Mail-In Ballot Totals 0 24 0.00 14 0 13 0
Provisional Totals 0 1 0.00 0 0 1 0
District Totals - Absentee
District Grand TotalsCounty 1600 528 33.00 181 12 166 1Moonachie 1600 528 33.00 181 12 166 1
Grand Totals 1600 528 33.00 181 12 166 1
November 15, 2017 8:38 am Page 165 of 219

Regi
stra
tion
Ballo
ts C
ast
Turn
out (
%)
NEW
MIL
FORD
LOC
AL B
OARD
OF
PAIG
E RY
AN
GEOR
GE A
DELU
NG
JOHN
A. H
EINE
MAN
N
Pers
onal
Cho
ice
NEW
MIL
FORD
LOC
AL B
OE- 2
YR
TONI
A AN
DREW
S
Pers
onal
Choic
e
NEW
MIL
FORD
LOC
AL B
OE 1
YR
UNE
JASO
N LE
VINE
Pers
onal
Choic
e
NEW MILFORD SCHOOL
BERGEN COUNTY Statement of VoteBER_20171107_E
New Milford 1 - Election Day 1273 541 42.50 209 104 105 1 218 0 225 0New Milford 2 - Election Day 1185 524 44.22 191 113 109 0 180 0 183 0New Milford 3 - Election Day 1267 573 45.22 213 134 124 0 196 0 199 0New Milford 4 - Election Day 1356 567 41.81 214 123 107 0 185 0 184 0New Milford 5 - Election Day 1081 421 38.95 174 101 95 0 170 0 173 0New Milford 6 - Election Day 918 323 35.19 135 57 54 0 128 0 127 0New Milford 7 - Election Day 778 251 32.26 85 50 37 1 89 0 92 0New Milford 8 - Election Day 1404 580 41.31 201 123 99 5 183 0 164 0New Milford 9 - Election Day 861 383 44.48 138 85 66 1 135 0 124 0New Milford Mail-In Ballot - Mail-In 0 210 0.00 106 72 73 0 106 1 101 1New Milford Provisional - Provision 0 32 0.00 20 3 2 0 19 0 19 0
Election Day Totals 10123 4163 41.12 1560 890 796 8 1484 0 1471 0
Mail-In Ballot Totals 0 210 0.00 106 72 73 0 106 1 101 1
Provisional Totals 0 32 0.00 20 3 2 0 19 0 19 0
District Totals - Absentee
District Grand TotalsCounty 10123 4405 43.51 1686 965 871 8 1609 1 1591 1New Milford 10123 4405 43.51 1686 965 871 8 1609 1 1591 1
Grand Totals 10123 4405 43.51 1686 965 871 8 1609 1 1591 1
November 15, 2017 8:38 am Page 166 of 219

Regi
stra
tion
Ballo
ts C
ast
Turn
out (
%)
NORT
H AR
LING
TON
LOCA
L BO
ARD
EDW
ARD
SMIT
H
ANGE
LIQU
E SO
DANO
ANTH
ONY
BLAN
CO
ROBE
RT D
ORSE
TT
Pers
onal
Cho
ice
NORTH ARLINGTON LOCAL BOARD OF EDUCATION
BERGEN COUNTY Statement of VoteBER_20171107_E
North Arlington 1 - Election Day 547 226 41.32 43 32 40 48 0North Arlington 2 - Election Day 789 294 37.26 52 50 47 51 2North Arlington 3 - Election Day 934 360 38.54 81 59 48 74 1North Arlington 4 - Election Day 969 423 43.65 116 76 68 125 1North Arlington 5 - Election Day 1224 481 39.30 106 80 87 92 0North Arlington 6 - Election Day 968 346 35.74 72 54 64 66 0North Arlington 7 - Election Day 1448 635 43.85 179 90 118 177 0North Arlington 8 - Election Day 692 289 41.76 67 73 52 69 0North Arlington 9 - Election Day 970 408 42.06 81 54 77 62 3North Arlington 10 - Election Day 643 273 42.46 50 60 58 59 1North Arlington Mail-In Ballot - Ma 0 302 0.00 101 127 96 104 0North Arlington Provisional - Provi 0 16 0.00 0 2 2 3 0
Election Day Totals 9184 3735 40.67 847 628 659 823 8
Mail-In Ballot Totals 0 302 0.00 101 127 96 104 0
Provisional Totals 0 16 0.00 0 2 2 3 0
District Totals - Absentee
District Grand TotalsCounty 9184 4053 44.13 948 757 757 930 8North Arlington 9184 4053 44.13 948 757 757 930 8
Grand Totals 9184 4053 44.13 948 757 757 930 8
November 15, 2017 8:38 am Page 167 of 219

Regi
stra
tion
Ballo
ts C
ast
Turn
out (
%)
NORT
HVAL
E LO
CAL
BOAR
D OF
JAM
IE C
ORDA
Y
JENN
IFER
DEL
AURA
-VEN
DITT
I
Pers
onal
Cho
ice
NORTHVALE LOCAL BOARD OF EDUCATION
BERGEN COUNTY Statement of VoteBER_20171107_E
Northvale 1 - Election Day 976 422 43.24 96 90 2Northvale 2 - Election Day 836 317 37.92 67 71 0Northvale 3 - Election Day 1156 464 40.14 122 146 0Northvale Mail-In Ballot - Mail-In B 0 50 0.00 19 25 0Northvale Provisional - Provisiona 0 2 0.00 0 1 0
Election Day Totals 2968 1203 40.53 285 307 2
Mail-In Ballot Totals 0 50 0.00 19 25 0
Provisional Totals 0 2 0.00 0 1 0
District Totals - Absentee
District Grand TotalsCounty 2968 1255 42.28 304 333 2Northvale 2968 1255 42.28 304 333 2
Grand Totals 2968 1255 42.28 304 333 2
November 15, 2017 8:38 am Page 168 of 219

Regi
stra
tion
Ballo
ts C
ast
Turn
out (
%)
NORW
OOD
LOCA
L BO
ARD
OF
ANTH
ONY
HADZ
IMIC
HALI
S
TAM
MY
GREE
NBER
G
MIC
HAEL
J. S
PRAG
UE
STEP
HEN
BROS
SARD
KELL
Y W
ILSO
N
Pers
onal
Cho
ice
NORWOOD LOCAL BOARD OF EDUCATION
BERGEN COUNTY Statement of VoteBER_20171107_E
Norwood 1 - Election Day 1761 857 48.67 156 222 262 210 283 0Norwood 2 - Election Day 1899 821 43.23 100 286 283 179 247 4Norwood Mail-In Ballot - Mail-In Ba 0 88 0.00 19 27 27 20 25 1Norwood Provisional - Provisional 0 3 0.00 0 1 0 1 0 0
Election Day Totals 3660 1678 45.85 256 508 545 389 530 4
Mail-In Ballot Totals 0 88 0.00 19 27 27 20 25 1
Provisional Totals 0 3 0.00 0 1 0 1 0 0
District Totals - Absentee
District Grand TotalsCounty 3660 1769 48.33 275 536 572 410 555 5Norwood 3660 1769 48.33 275 536 572 410 555 5
Grand Totals 3660 1769 48.33 275 536 572 410 555 5
November 15, 2017 8:38 am Page 169 of 219

Regi
stra
tion
Ballo
ts C
ast
Turn
out (
%)
OAKL
AND
LOCA
L BO
ARD
OF
Pers
onal
Cho
ice
OAKLAND LOCAL BOARD OF EDUCATION
BERGEN COUNTY Statement of VoteBER_20171107_E
Oakland 1 - Election Day 1001 452 45.15 8Oakland 2 - Election Day 912 394 43.20 15Oakland 3 - Election Day 755 331 43.84 20Oakland 4 - Election Day 942 428 45.44 23Oakland 5 - Election Day 1013 468 46.20 13Oakland 6 - Election Day 1232 556 45.13 10Oakland 7 - Election Day 1257 546 43.44 20Oakland 8 - Election Day 1705 605 35.48 17Oakland Mail-In Ballot - Mail-In Ba 0 199 0.00 7Oakland Provisional - Provisional 0 7 0.00 2
Election Day Totals 8817 3780 42.87 126
Mail-In Ballot Totals 0 199 0.00 7
Provisional Totals 0 7 0.00 2
District Totals - Absentee
District Grand TotalsCounty 8817 3986 45.21 135Oakland 8817 3986 45.21 135
Grand Totals 8817 3986 45.21 135
November 15, 2017 8:38 am Page 170 of 219

Regi
stra
tion
Ballo
ts C
ast
Turn
out (
%)
OLD
TAPP
AN L
OCAL
BOA
RD O
F
KURT
LIN
DER
Pers
onal
Cho
ice
OLD TAPPAN LOCAL BOARD OF EDUCATION
BERGEN COUNTY Statement of VoteBER_20171107_E
Old Tappan 1 - Election Day 1201 435 36.22 120 0Old Tappan 2 - Election Day 1443 477 33.06 145 0Old Tappan 3 - Election Day 1513 497 32.85 151 1Old Tappan Mail-In Ballot - Mail-In 0 128 0.00 72 1Old Tappan Provisional - Provision 0 6 0.00 3 0
Election Day Totals 4157 1409 33.89 416 1
Mail-In Ballot Totals 0 128 0.00 72 1
Provisional Totals 0 6 0.00 3 0
District Totals - Absentee
District Grand TotalsCounty 4157 1543 37.12 491 2Old Tappan 4157 1543 37.12 491 2
Grand Totals 4157 1543 37.12 491 2
November 15, 2017 8:38 am Page 171 of 219

Regi
stra
tion
Ballo
ts C
ast
Turn
out (
%)
ORAD
ELL
REGI
ONAL
BOA
RD O
F
ALBE
RT J
. GRA
EF
Pers
onal
Cho
ice
ORAD
ELL
LOCA
L BO
ARD
OF
JERE
MY
GRIF
FIN
RITA
WAL
KER
GREG
ORY
DERI
AN
HIM
ANSH
U R
ATES
HWAR
NANC
Y SH
APIR
O
Pers
onal
Choic
e
ORADELL SCHOOL
BERGEN COUNTY Statement of VoteBER_20171107_E
Oradell 1 - Election Day 977 474 48.52 142 1 134 216 193 92 171 0Oradell 2 - Election Day 886 387 43.68 129 0 141 139 113 100 107 0Oradell 3 - Election Day 922 450 48.81 137 0 169 128 120 126 119 0Oradell 4 - Election Day 934 461 49.36 167 0 170 183 117 113 156 0Oradell 5 - Election Day 1122 530 47.24 167 1 189 187 132 157 127 0Oradell 6 - Election Day 1122 530 47.24 176 0 174 230 197 132 192 0Oradell Mail-In Ballot - Mail-In Ball 0 184 0.00 85 2 69 86 57 55 69 1Oradell Provisional - Provisional 0 14 0.00 8 0 4 5 2 4 3 0
Election Day Totals 5963 2832 47.49 918 2 977 1083 872 720 872 0
Mail-In Ballot Totals 0 184 0.00 85 2 69 86 57 55 69 1
Provisional Totals 0 14 0.00 8 0 4 5 2 4 3 0
District Totals - Absentee
District Grand TotalsCounty 5963 3030 50.81 1011 4 1050 1174 931 779 944 1Oradell 5963 3030 50.81 1011 4 1050 1174 931 779 944 1
Grand Totals 5963 3030 50.81 1011 4 1050 1174 931 779 944 1
November 15, 2017 8:38 am Page 172 of 219

Regi
stra
tion
Ballo
ts C
ast
Turn
out (
%)
PALI
SADE
S PA
RK L
OCAL
BOA
RD
STEP
HANI
E JA
NG
MAR
IA A
LVAR
EZ
SCOT
T HU
R
BARN
ABAS
Y. W
OO
JEFF
REY
J. W
OO
THOM
AS M
ATAR
AZZO
Pers
onal
Choic
e
PALISADES PARK LOCAL BOARD OF EDUCATION
BERGEN COUNTY Statement of VoteBER_20171107_E
Palisades Park 1 - Election Day 569 132 23.20 54 42 32 37 42 34 0Palisades Park 2 - Election Day 701 241 34.38 111 91 77 77 73 55 0Palisades Park 3 - Election Day 696 170 24.43 51 42 34 48 47 42 0Palisades Park 4 - Election Day 744 186 25.00 62 49 49 52 52 46 0Palisades Park 5 - Election Day 853 199 23.33 64 46 42 51 50 36 1Palisades Park 6 - Election Day 1144 291 25.44 106 70 69 122 114 103 1Palisades Park 7 - Election Day 748 193 25.80 48 42 41 85 89 81 0Palisades Park 8 - Election Day 944 206 21.82 65 63 52 67 67 69 0Palisades Park 9 - Election Day 1088 208 19.12 59 46 46 48 50 46 0Palisades Park Mail-In Ballot - Ma 0 301 0.00 161 154 143 76 86 106 0Palisades Park Provisional - Provi 0 37 0.00 11 10 6 12 11 13 0
Election Day Totals 7487 1826 24.39 620 491 442 587 584 512 2
Mail-In Ballot Totals 0 301 0.00 161 154 143 76 86 106 0
Provisional Totals 0 37 0.00 11 10 6 12 11 13 0
District Totals - Absentee
District Grand TotalsCounty 7487 2164 28.90 792 655 591 675 681 631 2Palisades Park 7487 2164 28.90 792 655 591 675 681 631 2
Grand Totals 7487 2164 28.90 792 655 591 675 681 631 2
November 15, 2017 8:38 am Page 173 of 219

Regi
stra
tion
Ballo
ts C
ast
Turn
out (
%)
PARA
MUS
LOC
AL B
OARD
OF
NICH
OLAS
MAT
AHEN
MEL
ISSA
CAM
INIT
I
WIL
LIAM
F. H
OLZM
ANN
JOAN
NE B
ERGM
ANN
Pers
onal
Cho
ice
PARAMUS LOCAL BOARD OF EDUCATION
BERGEN COUNTY Statement of VoteBER_20171107_E
Paramus 1 - Election Day 1250 397 31.76 98 133 93 97 0Paramus 2 - Election Day 946 360 38.05 94 151 111 109 0Paramus 3 - Election Day 1066 455 42.68 123 148 119 110 0Paramus 4 - Election Day 823 304 36.94 71 113 90 87 0Paramus 5 - Election Day 746 323 43.30 80 119 88 103 0Paramus 6 - Election Day 887 334 37.66 73 131 75 97 0Paramus 7 - Election Day 975 441 45.23 109 187 134 137 0Paramus 8 - Election Day 911 317 34.80 83 114 90 91 2Paramus 9 - Election Day 864 325 37.62 73 126 88 105 2Paramus 10 - Election Day 790 294 37.22 81 110 90 75 0Paramus 11 - Election Day 740 277 37.43 61 91 66 65 0Paramus 12 - Election Day 1277 521 40.80 152 205 154 124 0Paramus 13 - Election Day 625 262 41.92 56 84 68 60 0Paramus 14 - Election Day 933 351 37.62 87 127 92 78 0Paramus 15 - Election Day 1422 471 33.12 92 158 138 103 0Paramus 16 - Election Day 698 308 44.13 73 111 86 77 0Paramus 17 - Election Day 841 324 38.53 81 93 78 71 0Paramus 18 - Election Day 600 256 42.67 62 101 84 70 0Paramus 19 - Election Day 717 332 46.30 76 118 82 74 0Paramus 20 - Election Day 832 318 38.22 58 111 89 79 0Paramus Mail-In Ballot - Mail-In Ba 0 542 0.00 200 287 227 223 7Paramus Provisional - Provisional 0 37 0.00 8 19 12 13 0
Election Day Totals 17943 6970 38.85 1683 2531 1915 1812 4
Mail-In Ballot Totals 0 542 0.00 200 287 227 223 7
Provisional Totals 0 37 0.00 8 19 12 13 0
District Totals - Absentee
District Grand TotalsCounty 17943 7549 42.07 1891 2837 2154 2048 11Paramus 17943 7549 42.07 1891 2837 2154 2048 11
Grand Totals 17943 7549 42.07 1891 2837 2154 2048 11
November 15, 2017 8:38 am Page 174 of 219

Regi
stra
tion
Ballo
ts C
ast
Turn
out (
%)
PARK
RID
GE L
OCAL
BOA
RD O
F
FRAN
K CH
URCH
ROBE
RT S
ILEO
BARB
ARA
von
BRAD
SKY
DAVI
D BR
ADLE
R
Pers
onal
Cho
ice
PARK RIDGE LOCAL BOARD OF EDUCATION
BERGEN COUNTY Statement of VoteBER_20171107_E
Park Ridge 1 - Election Day 1195 667 55.82 177 168 181 135 0Park Ridge 2 - Election Day 875 440 50.29 91 88 98 97 2Park Ridge 3 - Election Day 951 507 53.31 135 109 129 105 1Park Ridge 4 - Election Day 868 472 54.38 147 117 147 91 0Park Ridge 5 - Election Day 1088 487 44.76 118 96 116 89 4Park Ridge 6 - Election Day 1174 609 51.87 158 123 150 130 6Park Ridge Mail-In Ballot - Mail-In 0 138 0.00 51 42 46 35 2Park Ridge Provisional - Provision 0 16 0.00 3 2 4 3 0
Election Day Totals 6151 3182 51.73 826 701 821 647 13
Mail-In Ballot Totals 0 138 0.00 51 42 46 35 2
Provisional Totals 0 16 0.00 3 2 4 3 0
District Totals - Absentee
District Grand TotalsCounty 6151 3336 54.24 880 745 871 685 15Park Ridge 6151 3336 54.24 880 745 871 685 15
Grand Totals 6151 3336 54.24 880 745 871 685 15
November 15, 2017 8:38 am Page 175 of 219

Regi
stra
tion
Ballo
ts C
ast
Turn
out (
%)
RAM
SEY
LOCA
L BO
ARD
OF
ANDR
EA F
. LAM
ENDO
LA
RALP
H J.
CAP
UTO
LAUR
A EL
IZAB
ETH
GENO
VESE
-
NICH
OLAS
CAP
UANO
Pers
onal
Cho
ice
RAM
SEY
LOCA
L BO
E- 2
YR U
NEXP
IRE
JAM
ES H
. MEI
MAN
Pers
onal
Choic
e
RAMSEY SCHOOL
BERGEN COUNTY Statement of VoteBER_20171107_E
Ramsey 1 - Election Day 1185 529 44.64 172 161 121 100 0 180 0Ramsey 2 - Election Day 1482 717 48.38 233 252 229 187 3 268 0Ramsey 3 - Election Day 1457 724 49.69 256 212 225 196 0 273 0Ramsey 4 - Election Day 785 350 44.59 144 109 96 89 1 132 0Ramsey 5 - Election Day 1508 701 46.49 236 270 195 187 0 285 1Ramsey 6 - Election Day 1828 718 39.28 199 147 126 97 7 201 2Ramsey 7 - Election Day 1242 567 45.65 204 226 149 140 0 219 0Ramsey 8 - Election Day 1006 488 48.51 167 159 126 136 1 192 0Ramsey Mail-In Ballot - Mail-In Ba 0 280 0.00 126 104 106 112 3 150 1Ramsey Provisional - Provisional 0 14 0.00 7 7 4 4 0 6 0
Election Day Totals 10493 4794 45.69 1611 1536 1267 1132 12 1750 3
Mail-In Ballot Totals 0 280 0.00 126 104 106 112 3 150 1
Provisional Totals 0 14 0.00 7 7 4 4 0 6 0
District Totals - Absentee
District Grand TotalsCounty 10493 5088 48.49 1744 1647 1377 1248 15 1906 4Ramsey 10493 5088 48.49 1744 1647 1377 1248 15 1906 4
Grand Totals 10493 5088 48.49 1744 1647 1377 1248 15 1906 4
November 15, 2017 8:38 am Page 176 of 219

Regi
stra
tion
Ballo
ts C
ast
Turn
out (
%)
RIDG
EFIE
LD L
OCAL
BOA
RD O
F
RAFA
EL A
. MOR
ILLA
ANDR
EW G
RIPP
A
Pers
onal
Cho
ice
RIDGEFIELD LOCAL BOARD OF EDUCATION
BERGEN COUNTY Statement of VoteBER_20171107_E
Ridgefield 1 - Election Day 1202 396 32.95 79 88 45Ridgefield 2 - Election Day 921 358 38.87 83 75 55Ridgefield 3 - Election Day 1481 429 28.97 101 117 58Ridgefield 4 - Election Day 963 303 31.46 82 75 36Ridgefield 5 - Election Day 1300 382 29.38 97 89 43Ridgefield Mail-In Ballot - Mail-In B 0 135 0.00 46 47 7Ridgefield Provisional - Provisiona 0 14 0.00 8 6 3
Election Day Totals 5867 1868 31.84 442 444 237
Mail-In Ballot Totals 0 135 0.00 46 47 7
Provisional Totals 0 14 0.00 8 6 3
District Totals - Absentee
District Grand TotalsCounty 5867 2017 34.38 496 497 247Ridgefield 5867 2017 34.38 496 497 247
Grand Totals 5867 2017 34.38 496 497 247
November 15, 2017 8:38 am Page 177 of 219

Regi
stra
tion
Ballo
ts C
ast
Turn
out (
%)
RIDG
EFIE
LD P
ARK
LOCA
L BO
ARD
DAVI
D CA
THCA
RT
JODI
E CR
AFT
RONA
LD E
. HID
ALGO
JAYN
E KR
ALJI
C
Pers
onal
Cho
ice
RIDGEFIELD PARK LOCAL BOARD OF EDUCATION
BERGEN COUNTY Statement of VoteBER_20171107_E
Ridgefield Park 1 - Election Day 588 227 38.61 59 71 82 51 0Ridgefield Park 2 - Election Day 1076 382 35.50 99 106 124 79 0Ridgefield Park 3 - Election Day 797 255 31.99 73 86 78 72 2Ridgefield Park 4 - Election Day 1073 393 36.63 160 158 133 127 1Ridgefield Park 5 - Election Day 602 230 38.21 78 80 63 70 1Ridgefield Park 6 - Election Day 964 382 39.63 182 186 145 155 2Ridgefield Park 7 - Election Day 935 359 38.40 124 139 134 101 2Ridgefield Park 8 - Election Day 1125 451 40.09 210 225 156 180 4Ridgefield Park Mail-In Ballot - Ma 0 98 0.00 51 64 37 50 0Ridgefield Park Provisional - Provi 0 26 0.00 8 5 11 8 0
Election Day Totals 7160 2679 37.42 985 1051 915 835 12
Mail-In Ballot Totals 0 98 0.00 51 64 37 50 0
Provisional Totals 0 26 0.00 8 5 11 8 0
District Totals - Absentee
District Grand TotalsCounty 7160 2803 39.15 1044 1120 963 893 12Ridgefield Park 7160 2803 39.15 1044 1120 963 893 12
Grand Totals 7160 2803 39.15 1044 1120 963 893 12
November 15, 2017 8:38 am Page 178 of 219

Regi
stra
tion
Ballo
ts C
ast
Turn
out (
%)
RIDG
EWOO
D LO
CAL
BOAR
D OF
SHEI
LA M
ARY
BROG
AN
CHRI
STIN
A KR
AUSS
Pers
onal
Cho
ice
RIDGEWOOD LOCAL BOARD OF EDUCATION
BERGEN COUNTY Statement of VoteBER_20171107_E
Ridgewood 1 - Election Day 809 325 40.17 145 116 0Ridgewood 2 - Election Day 1049 374 35.65 138 111 1Ridgewood 3 - Election Day 940 371 39.47 148 127 1Ridgewood 4 - Election Day 788 311 39.47 125 102 2Ridgewood 5 - Election Day 1023 334 32.65 107 103 2Ridgewood 6 - Election Day 859 376 43.77 151 120 0Ridgewood 7 - Election Day 990 402 40.61 161 134 1Ridgewood 8 - Election Day 724 298 41.16 116 102 1Ridgewood 9 - Election Day 702 305 43.45 99 95 1Ridgewood 10 - Election Day 718 244 33.98 82 73 1Ridgewood 11 - Election Day 979 435 44.43 170 146 9Ridgewood 12 - Election Day 864 369 42.71 134 144 3Ridgewood 13 - Election Day 948 378 39.87 150 118 0Ridgewood 14 - Election Day 1196 489 40.89 146 151 2Ridgewood 15 - Election Day 848 370 43.63 145 112 5Ridgewood 16 - Election Day 695 278 40.00 107 94 0Ridgewood 17 - Election Day 785 320 40.76 120 103 5Ridgewood 18 - Election Day 870 390 44.83 151 108 5Ridgewood 19 - Election Day 821 339 41.29 123 92 4Ridgewood Mail-In Ballot - Mail-In 0 432 0.00 235 229 9Ridgewood Provisional - Provision 0 35 0.00 13 14 1
Election Day Totals 16608 6708 40.39 2518 2151 43
Mail-In Ballot Totals 0 432 0.00 235 229 9
Provisional Totals 0 35 0.00 13 14 1
District Totals - Absentee
District Grand TotalsCounty 16608 7175 43.20 2766 2394 53Ridgewood 16608 7175 43.20 2766 2394 53
Grand Totals 16608 7175 43.20 2766 2394 53
November 15, 2017 8:38 am Page 179 of 219

Regi
stra
tion
Ballo
ts C
ast
Turn
out (
%)
RIVE
R ED
GE R
EGIO
NAL
BOAR
D OF
DOUG
LAS
S. K
UPFE
R
Pers
onal
Cho
ice
RIVE
R ED
GE L
OCAL
BOA
RD O
F
ELIZ
ABET
H AN
NE B
ROW
N
SHEL
I DAN
SKY
Pers
onal
Cho
ice
RIVER EDGE SCHOOL
BERGEN COUNTY Statement of VoteBER_20171107_E
River Edge 1 - Election Day 1133 485 42.81 147 6 137 107 0River Edge 2 - Election Day 964 410 42.53 129 4 119 105 0River Edge 3 - Election Day 863 371 42.99 127 8 116 101 0River Edge 4 - Election Day 935 444 47.49 156 6 136 109 0River Edge 5 - Election Day 758 301 39.71 81 1 88 54 0River Edge 6 - Election Day 878 347 39.52 123 5 105 54 0River Edge 7 - Election Day 914 366 40.04 109 0 89 64 0River Edge 8 - Election Day 752 241 32.05 66 0 49 37 0River Edge Mail-In Ballot - Mail-In 0 198 0.00 103 3 83 86 0River Edge Provisional - Provision 0 7 0.00 2 0 1 0 0
Election Day Totals 7197 2965 41.20 938 30 839 631 0
Mail-In Ballot Totals 0 198 0.00 103 3 83 86 0
Provisional Totals 0 7 0.00 2 0 1 0 0
District Totals - Absentee
District Grand TotalsCounty 7197 3170 44.05 1043 33 923 717 0River Edge 7197 3170 44.05 1043 33 923 717 0
Grand Totals 7197 3170 44.05 1043 33 923 717 0
November 15, 2017 8:38 am Page 180 of 219

Regi
stra
tion
Ballo
ts C
ast
Turn
out (
%)
RIVE
R VA
LE L
OCAL
BOA
RD O
F
PATR
ICE
PINT
AREL
LI
DAVI
D M
OON
STEV
EN R
OSIN
I
Pers
onal
Cho
ice
RIVER VALE LOCAL BOARD OF EDUCATION
BERGEN COUNTY Statement of VoteBER_20171107_E
River Vale 1 - Election Day 1533 578 37.70 180 150 140 2River Vale 2 - Election Day 2055 856 41.65 264 240 243 3River Vale 3 - Election Day 1486 632 42.53 210 181 206 1River Vale 4 - Election Day 1159 476 41.07 143 113 122 6River Vale 5 - Election Day 1231 493 40.05 146 115 124 0River Vale Mail-In Ballot - Mail-In B 0 134 0.00 62 59 58 0River Vale Provisional - Provisiona 0 10 0.00 3 1 2 0
Election Day Totals 7464 3035 40.66 943 799 835 12
Mail-In Ballot Totals 0 134 0.00 62 59 58 0
Provisional Totals 0 10 0.00 3 1 2 0
District Totals - Absentee
District Grand TotalsCounty 7464 3179 42.59 1008 859 895 12River Vale 7464 3179 42.59 1008 859 895 12
Grand Totals 7464 3179 42.59 1008 859 895 12
November 15, 2017 8:38 am Page 181 of 219

Regi
stra
tion
Ballo
ts C
ast
Turn
out (
%)
ROCH
ELLE
PAR
K LO
CAL
BOAR
D
SHIR
LEY
ABRA
HAM
SCOT
T G.
KRA
L
LAYL
A A.
WUT
HRIC
K
KIM
MAR
RANO
LEW
ICKI
GERA
RD F
. SOR
RENT
INO
Pers
onal
Cho
ice
ROCHELLE PARK LOCAL BOARD OF EDUCATION
BERGEN COUNTY Statement of VoteBER_20171107_E
Rochelle Park 1 - Election Day 1001 472 47.15 97 146 131 91 138 3Rochelle Park 2 - Election Day 894 421 47.09 91 141 106 85 123 2Rochelle Park 3 - Election Day 852 413 48.47 90 155 135 67 134 1Rochelle Park 4 - Election Day 956 432 45.19 115 147 122 114 140 0Rochelle Park Mail-In Ballot - Mail 0 105 0.00 29 44 33 34 38 0Rochelle Park Provisional - Provis 0 16 0.00 3 10 6 2 7 0
Election Day Totals 3703 1738 46.93 393 589 494 357 535 6
Mail-In Ballot Totals 0 105 0.00 29 44 33 34 38 0
Provisional Totals 0 16 0.00 3 10 6 2 7 0
District Totals - Absentee
District Grand TotalsCounty 3703 1859 50.20 425 643 533 393 580 6Rochelle Park 3703 1859 50.20 425 643 533 393 580 6
Grand Totals 3703 1859 50.20 425 643 533 393 580 6
November 15, 2017 8:38 am Page 182 of 219

Regi
stra
tion
Ballo
ts C
ast
Turn
out (
%)
RUTH
ERFO
RD L
OCAL
BOA
RD O
F
DENN
IS H
EALE
Y
DIAN
E M
. JON
ES
SARA
H LI
BRER
A
Pers
onal
Cho
ice
RUTHERFORD LOCAL BOARD OF EDUCATION
BERGEN COUNTY Statement of VoteBER_20171107_E
Rutherford 1 - Election Day 990 496 50.10 148 155 124 6Rutherford 2 - Election Day 1099 509 46.31 166 187 136 2Rutherford 3 - Election Day 989 434 43.88 150 165 126 2Rutherford 4 - Election Day 730 346 47.40 118 120 98 0Rutherford 5 - Election Day 776 344 44.33 116 113 93 1Rutherford 6 - Election Day 743 282 37.95 71 76 64 2Rutherford 7 - Election Day 938 404 43.07 110 115 84 0Rutherford 8 - Election Day 1007 420 41.71 130 125 101 1Rutherford 9 - Election Day 1051 491 46.72 149 162 123 7Rutherford 10 - Election Day 969 437 45.10 139 143 114 2Rutherford 11 - Election Day 1041 405 38.90 119 132 93 0Rutherford 12 - Election Day 763 311 40.76 106 115 90 0Rutherford Mail-In Ballot - Mail-In 0 257 0.00 151 164 127 6Rutherford Provisional - Provisiona 0 43 0.00 19 22 17 0
Election Day Totals 11096 4879 43.97 1522 1608 1246 23
Mail-In Ballot Totals 0 257 0.00 151 164 127 6
Provisional Totals 0 43 0.00 19 22 17 0
District Totals - Absentee
District Grand TotalsCounty 11096 5179 46.67 1692 1794 1390 29Rutherford 11096 5179 46.67 1692 1794 1390 29
Grand Totals 11096 5179 46.67 1692 1794 1390 29
November 15, 2017 8:38 am Page 183 of 219

Regi
stra
tion
Ballo
ts C
ast
Turn
out (
%)
SADD
LE B
ROOK
LOC
AL B
OARD
SYLV
IA Z
OTTA
RELL
I
KELL
Y M
AHON
EY
REGI
NA B
ARRA
LE
HAYL
EY T
RAVE
RSO
Pers
onal
Cho
ice
SADDLE BROOK LOCAL BOARD OF EDUCATION
BERGEN COUNTY Statement of VoteBER_20171107_E
Saddle Brook 1 - Election Day 778 267 34.32 52 74 60 47 0Saddle Brook 2 - Election Day 769 325 42.26 91 100 80 49 2Saddle Brook 3 - Election Day 582 236 40.55 52 74 40 33 0Saddle Brook 4 - Election Day 892 378 42.38 77 122 96 72 0Saddle Brook 5 - Election Day 995 344 34.57 81 112 93 62 0Saddle Brook 6 - Election Day 973 424 43.58 116 132 89 69 0Saddle Brook 7 - Election Day 598 255 42.64 59 90 74 47 0Saddle Brook 8 - Election Day 790 329 41.65 83 114 94 62 0Saddle Brook 9 - Election Day 916 369 40.28 99 127 106 69 1Saddle Brook 10 - Election Day 857 371 43.29 106 136 123 78 0Saddle Brook 11 - Election Day 864 386 44.68 100 138 114 89 0Saddle Brook Mail-In Ballot - Mail- 0 144 0.00 56 78 77 38 0Saddle Brook Provisional - Provisi 0 18 0.00 4 5 8 2 0
Election Day Totals 9014 3684 40.87 916 1219 969 677 3
Mail-In Ballot Totals 0 144 0.00 56 78 77 38 0
Provisional Totals 0 18 0.00 4 5 8 2 0
District Totals - Absentee
District Grand TotalsCounty 9014 3846 42.67 976 1302 1054 717 3Saddle Brook 9014 3846 42.67 976 1302 1054 717 3
Grand Totals 9014 3846 42.67 976 1302 1054 717 3
November 15, 2017 8:38 am Page 184 of 219

Regi
stra
tion
Ballo
ts C
ast
Turn
out (
%)
SADD
LE R
IVER
LOC
AL B
OARD
OF
EMIL
Y KA
UFM
AN
Pers
onal
Cho
ice
SADDLE RIVER LOCAL BOARD OF EDUCATION
BERGEN COUNTY Statement of VoteBER_20171107_E
Saddle River 1 - Election Day 1185 380 32.07 129 3Saddle River 2 - Election Day 1452 532 36.64 154 4Saddle River Mail-In Ballot - Mail-I 0 74 0.00 38 1Saddle River Provisional - Provisio 0 8 0.00 5 0
Election Day Totals 2637 912 34.58 283 7
Mail-In Ballot Totals 0 74 0.00 38 1
Provisional Totals 0 8 0.00 5 0
District Totals - Absentee
District Grand TotalsCounty 2637 994 37.69 326 8Saddle River 2637 994 37.69 326 8
Grand Totals 2637 994 37.69 326 8
November 15, 2017 8:38 am Page 185 of 219

Regi
stra
tion
Ballo
ts C
ast
Turn
out (
%)
SOUT
H HA
CKEN
SACK
LOC
AL
ANIK
A DA
VIS
ELIZ
ABET
H AN
ZEVI
NO
Pers
onal
Cho
ice
SOUTH HACKENSACK LOCAL BOARD OF EDUCATION
BERGEN COUNTY Statement of VoteBER_20171107_E
South Hackensack 1 - Election Da 1417 525 37.05 100 184 2South Hackensack Mail-In Ballot - 0 32 0.00 10 23 0South Hackensack Provisional - P 0 1 0.00 0 0 0
Election Day Totals 1417 525 37.05 100 184 2
Mail-In Ballot Totals 0 32 0.00 10 23 0
Provisional Totals 0 1 0.00 0 0 0
District Totals - Absentee
District Grand TotalsCounty 1417 558 39.38 110 207 2South Hackensack 1417 558 39.38 110 207 2
Grand Totals 1417 558 39.38 110 207 2
November 15, 2017 8:38 am Page 186 of 219

Regi
stra
tion
Ballo
ts C
ast
Turn
out (
%)
TEAN
ECK
LOCA
L BO
ARD
OF
HOW
ARD
ROSE
ARDI
E D.
WAL
SER
CLAR
A W
ILLI
AMS
Pers
onal
Cho
ice
TEANECK LOCAL BOARD OF EDUCATION
BERGEN COUNTY Statement of VoteBER_20171107_E
Teaneck 1 - Election Day 995 372 37.39 98 83 99 0Teaneck 2 - Election Day 1310 466 35.57 120 99 143 2Teaneck 3 - Election Day 1247 545 43.70 175 162 179 0Teaneck 4 - Election Day 1154 478 41.42 194 169 162 4Teaneck 5 - Election Day 860 317 36.86 96 79 120 3Teaneck 6 - Election Day 1021 463 45.35 130 102 116 0Teaneck 7 - Election Day 1069 430 40.22 144 102 136 7Teaneck 8 - Election Day 1286 622 48.37 243 191 216 10Teaneck 9 - Election Day 1261 491 38.94 199 134 130 4Teaneck 10 - Election Day 1438 477 33.17 204 135 138 8Teaneck 11 - Election Day 1297 388 29.92 141 89 88 14Teaneck 12 - Election Day 1440 486 33.75 200 126 140 18Teaneck 13 - Election Day 1098 527 48.00 84 94 188 2Teaneck 14 - Election Day 1464 636 43.44 102 103 170 1Teaneck 15 - Election Day 1080 330 30.56 79 74 108 2Teaneck 16 - Election Day 750 313 41.73 48 50 89 3Teaneck 17 - Election Day 1259 524 41.62 150 147 199 0Teaneck 18 - Election Day 1333 547 41.04 202 158 188 8Teaneck 19 - Election Day 1147 462 40.28 157 143 166 4Teaneck 20 - Election Day 830 314 37.83 126 116 125 2Teaneck 21 - Election Day 1355 459 33.87 128 96 119 0Teaneck 22 - Election Day 994 354 35.61 86 84 116 1Teaneck 23 - Election Day 981 341 34.76 65 67 109 1Teaneck Mail-In Ballot - Mail-In Ba 0 513 0.00 229 213 224 18Teaneck Provisional - Provisional 0 37 0.00 13 8 7 3
Election Day Totals 26669 10342 38.78 3171 2603 3244 94
Mail-In Ballot Totals 0 513 0.00 229 213 224 18
Provisional Totals 0 37 0.00 13 8 7 3
District Totals - Absentee
District Grand TotalsCounty 26669 10892 40.84 3413 2824 3475 115Teaneck 26669 10892 40.84 3413 2824 3475 115
Grand Totals 26669 10892 40.84 3413 2824 3475 115
November 15, 2017 8:38 am Page 187 of 219

Regi
stra
tion
Ballo
ts C
ast
Turn
out (
%)
TENA
FLY
LOCA
L BO
ARD
OF
PATR
ICIA
FLY
NN
EDW
ARD
J. S
ALAS
KI
JANE
T I.
HORA
N
Pers
onal
Cho
ice
TENAFLY LOCAL BOARD OF EDUCATION
BERGEN COUNTY Statement of VoteBER_20171107_E
Tenafly 1 - Election Day 778 281 36.12 127 97 102 0Tenafly 2 - Election Day 631 211 33.44 109 67 86 0Tenafly 3 - Election Day 592 217 36.66 88 62 67 3Tenafly 4 - Election Day 824 318 38.59 150 101 111 0Tenafly 5 - Election Day 728 254 34.89 124 98 99 4Tenafly 6 - Election Day 636 229 36.01 103 86 83 1Tenafly 7 - Election Day 708 195 27.54 90 70 64 0Tenafly 8 - Election Day 835 277 33.17 116 101 108 0Tenafly 9 - Election Day 847 333 39.32 132 119 102 0Tenafly 10 - Election Day 687 267 38.86 105 103 88 4Tenafly 11 - Election Day 824 278 33.74 91 100 95 0Tenafly 12 - Election Day 960 287 29.90 99 95 95 0Tenafly Mail-In Ballot - Mail-In Bal 0 196 0.00 98 101 98 1Tenafly Provisional - Provisional 0 15 0.00 4 6 4 0
Election Day Totals 9050 3147 34.77 1334 1099 1100 12
Mail-In Ballot Totals 0 196 0.00 98 101 98 1
Provisional Totals 0 15 0.00 4 6 4 0
District Totals - Absentee
District Grand TotalsCounty 9050 3358 37.10 1436 1206 1202 13Tenafly 9050 3358 37.10 1436 1206 1202 13
Grand Totals 9050 3358 37.10 1436 1206 1202 13
November 15, 2017 8:38 am Page 188 of 219

Regi
stra
tion
Ballo
ts C
ast
Turn
out (
%)
UPPE
R SA
DDLE
RIV
ER R
EGIO
NAL
BARB
ARA
D. G
ARAN
D
Pers
onal
Cho
ice
UPPE
R SA
DDLE
RIV
ER L
OCAL
KENN
ETH
Y. A
MAN
O
JENN
IFER
JOH
NSTO
N
Pers
onal
Cho
ice
UPPER SADDLE RIVER SCHOOL
BERGEN COUNTY Statement of VoteBER_20171107_E
Upper Saddle River 1 - Election D 1468 548 37.33 248 2 201 174 1Upper Saddle River 2 - Election D 1049 375 35.75 170 0 143 106 0Upper Saddle River 3 - Election D 1271 447 35.17 202 0 165 115 0Upper Saddle River 4 - Election D 1269 453 35.70 189 0 153 129 0Upper Saddle River 5 - Election D 930 322 34.62 165 1 138 100 0Upper Saddle River Mail-In Ballot 0 126 0.00 67 1 54 52 3Upper Saddle River Provisional - P 0 18 0.00 6 0 3 7 0
Election Day Totals 5987 2145 35.83 974 3 800 624 1
Mail-In Ballot Totals 0 126 0.00 67 1 54 52 3
Provisional Totals 0 18 0.00 6 0 3 7 0
District Totals - Absentee
District Grand TotalsCounty 5987 2289 38.23 1047 4 857 683 4Upper Saddle River 5987 2289 38.23 1047 4 857 683 4
Grand Totals 5987 2289 38.23 1047 4 857 683 4
November 15, 2017 8:38 am Page 189 of 219

Regi
stra
tion
Ballo
ts C
ast
Turn
out (
%)
WAL
DWIC
K LO
CAL
BOAR
D OF
ANDR
EW F
REY
TIM
OTHY
O'H
ARE
JAM
ES H
ARRI
S FL
EMIN
G Jr
Pers
onal
Cho
ice
WALDWICK LOCAL BOARD OF EDUCATION
BERGEN COUNTY Statement of VoteBER_20171107_E
Waldwick 1 - Election Day 1287 574 44.60 152 147 154 2Waldwick 2 - Election Day 1141 472 41.37 138 134 90 0Waldwick 3 - Election Day 1088 478 43.93 130 125 104 2Waldwick 4 - Election Day 1098 481 43.81 116 128 79 2Waldwick 5 - Election Day 1037 463 44.65 116 112 99 0Waldwick 6 - Election Day 1001 456 45.55 147 144 101 0Waldwick Mail-In Ballot - Mail-In B 0 129 0.00 51 47 40 3Waldwick Provisional - Provisiona 0 16 0.00 3 8 4 0
Election Day Totals 6652 2924 43.96 799 790 627 6
Mail-In Ballot Totals 0 129 0.00 51 47 40 3
Provisional Totals 0 16 0.00 3 8 4 0
District Totals - Absentee
District Grand TotalsCounty 6652 3069 46.14 853 845 671 9Waldwick 6652 3069 46.14 853 845 671 9
Grand Totals 6652 3069 46.14 853 845 671 9
November 15, 2017 8:38 am Page 190 of 219

Regi
stra
tion
Ballo
ts C
ast
Turn
out (
%)
WAL
LING
TON
LOCA
L BO
ARD
OF
DAVI
D A.
PIN
TO
BOBB
Y RI
STOV
SKI
HELE
NA P
LASK
ON
THEA
DORA
CAL
ABRE
SE
WIL
LIAM
L. D
IGGS
Pers
onal
Cho
ice
WAL
LING
TON
LOCA
L BO
E UN
EXPI
RE
JOHN
D. S
OBCZ
YK
Pers
onal
Choic
e
WALLINGTON SCHOOL
BERGEN COUNTY Statement of VoteBER_20171107_E
Wallington 1 - Election Day 623 211 33.87 90 54 33 64 23 0 66 0Wallington 2 - Election Day 738 232 31.44 89 76 50 67 20 0 68 0Wallington 3 - Election Day 1129 373 33.04 143 115 60 101 33 0 116 0Wallington 4 - Election Day 1305 655 50.19 262 271 121 200 77 5 179 1Wallington 5 - Election Day 1101 381 34.60 139 128 76 122 44 1 135 0Wallington 6 - Election Day 710 251 35.35 68 77 57 76 37 0 61 1Wallington Mail-In Ballot - Mail-In B 0 137 0.00 64 59 42 49 29 0 63 2Wallington Provisional - Provisiona 0 9 0.00 2 3 1 1 1 0 2 0
Election Day Totals 5606 2103 37.51 791 721 397 630 234 6 625 2
Mail-In Ballot Totals 0 137 0.00 64 59 42 49 29 0 63 2
Provisional Totals 0 9 0.00 2 3 1 1 1 0 2 0
District Totals - Absentee
District Grand TotalsCounty 5606 2249 40.12 857 783 440 680 264 6 690 4Wallington 5606 2249 40.12 857 783 440 680 264 6 690 4
Grand Totals 5606 2249 40.12 857 783 440 680 264 6 690 4
November 15, 2017 8:38 am Page 191 of 219

Regi
stra
tion
Ballo
ts C
ast
Turn
out (
%)
WAS
HING
TON
TOW
NSHI
P
STEP
HEN
P. K
ALIS
H
DARL
ENE
MAN
DEVI
LLE
Pers
onal
Cho
ice
WASHINGTON TOWNSHIP REGIONAL BOARD OF EDUCATION
BERGEN COUNTY Statement of VoteBER_20171107_E
Washington Township 1 - Election 1346 640 47.55 151 180 5Washington Township 2 - Election 912 425 46.60 90 104 1Washington Township 3 - Election 746 373 50.00 91 100 1Washington Township 4 - Election 1192 512 42.95 137 133 0Washington Township 5 - Election 1117 549 49.15 130 134 3Washington Township 6 - Election 1508 680 45.09 131 151 1Washington Township Mail-In Ball 0 211 0.00 100 102 2Washington Township Provisional 0 19 0.00 6 6 0
Election Day Totals 6821 3179 46.61 730 802 11
Mail-In Ballot Totals 0 211 0.00 100 102 2
Provisional Totals 0 19 0.00 6 6 0
District Totals - Absentee
District Grand TotalsCounty 6821 3409 49.98 836 910 13Washington 6821 3409 49.98 836 910 13
Grand Totals 6821 3409 49.98 836 910 13
November 15, 2017 8:38 am Page 192 of 219

Regi
stra
tion
Ballo
ts C
ast
Turn
out (
%)
WES
TWOO
D RE
GION
AL B
OARD
OF
SUSA
N SW
IETK
OWSK
I
Pers
onal
Cho
ice
WESTWOOD REGIONAL BOARD OF EDUCATION
BERGEN COUNTY Statement of VoteBER_20171107_E
Westwood 1 - Election Day 1114 513 46.05 147 1Westwood 2 - Election Day 959 446 46.51 122 10Westwood 3 - Election Day 605 297 49.09 92 1Westwood 4 - Election Day 894 429 47.99 137 0Westwood 5 - Election Day 707 351 49.65 110 2Westwood 6 - Election Day 1242 469 37.76 128 1Westwood 7 - Election Day 781 356 45.58 119 5Westwood 8 - Election Day 944 445 47.14 124 0Westwood Mail-In Ballot - Mail-In B 0 156 0.00 86 7Westwood Provisional - Provisiona 0 20 0.00 7 0
Election Day Totals 7246 3306 45.63 979 20
Mail-In Ballot Totals 0 156 0.00 86 7
Provisional Totals 0 20 0.00 7 0
District Totals - Absentee
District Grand TotalsCounty 7246 3482 48.05 1072 27Westwood 7246 3482 48.05 1072 27
Grand Totals 7246 3482 48.05 1072 27
November 15, 2017 8:38 am Page 193 of 219

Regi
stra
tion
Ballo
ts C
ast
Turn
out (
%)
WOO
DCLI
FF L
AKE
REGI
ONAL
DAVI
D ST
EINB
ERG
Pers
onal
Cho
ice
WOO
DCLI
FF L
AKE
LOCA
L BO
ARD
LYSB
ETH
ESPI
NOSA
KRIS
TAN
SAKS
Pers
onal
Cho
ice
WOODCLIFF LAKE SCHOOL
BERGEN COUNTY Statement of VoteBER_20171107_E
Woodcliff Lake 1 - Election Day 897 425 47.38 176 0 145 149 0Woodcliff Lake 2 - Election Day 1176 556 47.28 250 3 197 180 2Woodcliff Lake 3 - Election Day 983 475 48.32 197 0 171 162 0Woodcliff Lake 4 - Election Day 1427 621 43.52 292 0 221 228 0Woodcliff Lake Mail-In Ballot - Mai 0 170 0.00 101 1 87 69 1Woodcliff Lake Provisional - Provis 0 21 0.00 4 0 2 3 0
Election Day Totals 4483 2077 46.33 915 3 734 719 2
Mail-In Ballot Totals 0 170 0.00 101 1 87 69 1
Provisional Totals 0 21 0.00 4 0 2 3 0
District Totals - Absentee
District Grand TotalsCounty 4483 2268 50.59 1020 4 823 791 3Woodcliff Lake 4483 2268 50.59 1020 4 823 791 3
Grand Totals 4483 2268 50.59 1020 4 823 791 3
November 15, 2017 8:38 am Page 194 of 219

Regi
stra
tion
Ballo
ts C
ast
Turn
out (
%)
WOO
D RI
DGE
LOCA
L BO
ARD
OF
CHER
I OTT
EVAE
RE
PAM
ELA
BAYK
AL
PATR
ICK
A. A
MBR
OSIO
Pers
onal
Cho
ice
WOOD RIDGE LOCAL BOARD OF EDUCATION
BERGEN COUNTY Statement of VoteBER_20171107_E
Wood Ridge 1 - Election Day 1442 602 41.75 72 129 111 2Wood Ridge 2 - Election Day 772 408 52.85 54 53 101 0Wood Ridge 3 - Election Day 1200 569 47.42 72 82 135 4Wood Ridge 4 - Election Day 1182 499 42.22 69 54 87 0Wood Ridge 5 - Election Day 1243 601 48.35 61 103 169 2Wood Ridge Mail-In Ballot - Mail-In 0 136 0.00 18 17 53 1Wood Ridge Provisional - Provisio 0 8 0.00 1 1 3 0
Election Day Totals 5839 2679 45.88 328 421 603 8
Mail-In Ballot Totals 0 136 0.00 18 17 53 1
Provisional Totals 0 8 0.00 1 1 3 0
District Totals - Absentee
District Grand TotalsCounty 5839 2823 48.35 347 439 659 9Wood Ridge 5839 2823 48.35 347 439 659 9
Grand Totals 5839 2823 48.35 347 439 659 9
November 15, 2017 8:38 am Page 195 of 219
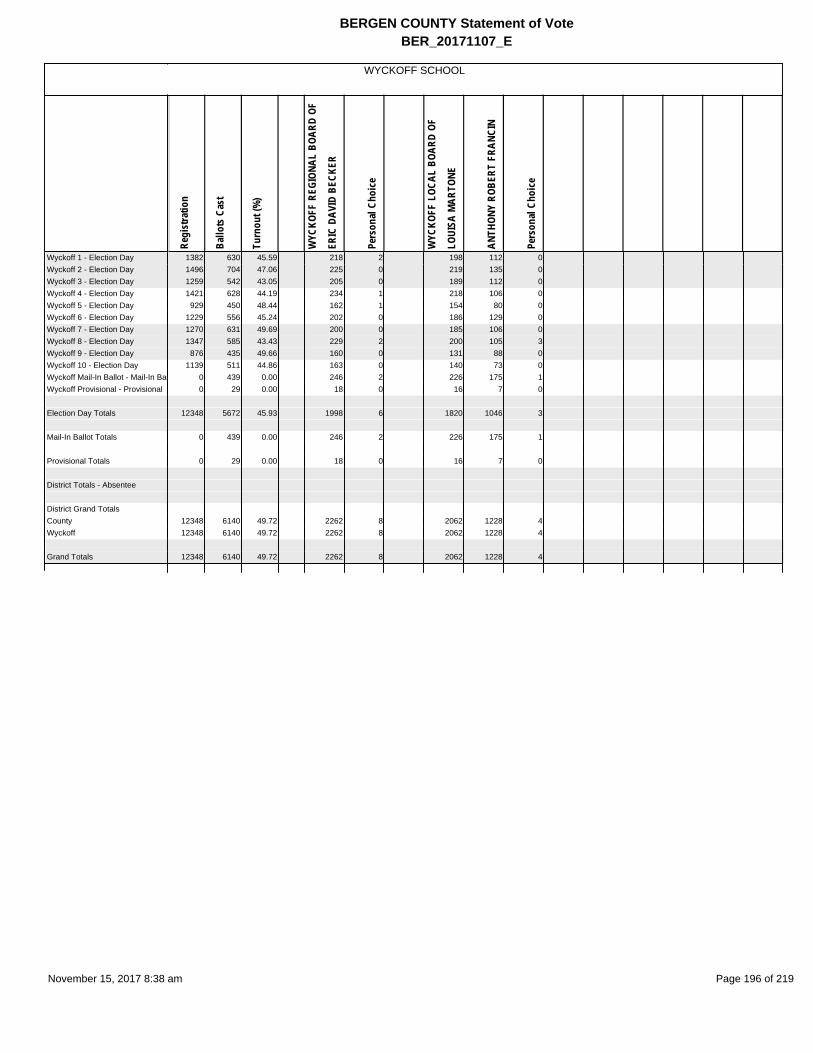
Regi
stra
tion
Ballo
ts C
ast
Turn
out (
%)
WYC
KOFF
REG
IONA
L BO
ARD
OF
ERIC
DAV
ID B
ECKE
R
Pers
onal
Cho
ice
WYC
KOFF
LOC
AL B
OARD
OF
LOUI
SA M
ARTO
NE
ANTH
ONY
ROBE
RT F
RANC
IN
Pers
onal
Cho
ice
WYCKOFF SCHOOL
BERGEN COUNTY Statement of VoteBER_20171107_E
Wyckoff 1 - Election Day 1382 630 45.59 218 2 198 112 0Wyckoff 2 - Election Day 1496 704 47.06 225 0 219 135 0Wyckoff 3 - Election Day 1259 542 43.05 205 0 189 112 0Wyckoff 4 - Election Day 1421 628 44.19 234 1 218 106 0Wyckoff 5 - Election Day 929 450 48.44 162 1 154 80 0Wyckoff 6 - Election Day 1229 556 45.24 202 0 186 129 0Wyckoff 7 - Election Day 1270 631 49.69 200 0 185 106 0Wyckoff 8 - Election Day 1347 585 43.43 229 2 200 105 3Wyckoff 9 - Election Day 876 435 49.66 160 0 131 88 0Wyckoff 10 - Election Day 1139 511 44.86 163 0 140 73 0Wyckoff Mail-In Ballot - Mail-In Ba 0 439 0.00 246 2 226 175 1Wyckoff Provisional - Provisional 0 29 0.00 18 0 16 7 0
Election Day Totals 12348 5672 45.93 1998 6 1820 1046 3
Mail-In Ballot Totals 0 439 0.00 246 2 226 175 1
Provisional Totals 0 29 0.00 18 0 16 7 0
District Totals - Absentee
District Grand TotalsCounty 12348 6140 49.72 2262 8 2062 1228 4Wyckoff 12348 6140 49.72 2262 8 2062 1228 4
Grand Totals 12348 6140 49.72 2262 8 2062 1228 4
November 15, 2017 8:38 am Page 196 of 219

Regi
stra
tion
Ballo
ts C
ast
Turn
out (
%)
STAT
E PU
BLIC
QUE
STIO
N #1
Yes
No
STAT
E PU
BLIC
QUE
STIO
N #2
Yes
No
STATE
BERGEN COUNTY Statement of VoteBER_20171107_E
Allendale 1 - Election Day 1618 755 46.66 386 197 390 160Allendale 2 - Election Day 853 363 42.56 194 86 195 72Allendale 3 - Election Day 982 456 46.44 192 127 212 90Allendale 4 - Election Day 1439 606 42.11 292 186 323 120Allendale Mail-In Ballot - Mail-In B 0 129 0.00 63 33 73 22Allendale Provisional - Provisional 0 12 0.00 7 6 8 0Alpine 1 - Election Day 1416 405 28.60 153 120 169 82Alpine Mail-In Ballot - Mail-In Ballo 0 30 0.00 19 4 19 3Alpine Provisional - Provisional 0 1 0.00 0 1 1 0Bergenfield 1 - Election Day 787 282 35.83 116 48 109 39Bergenfield 2 - Election Day 868 377 43.43 171 76 169 52Bergenfield 3 - Election Day 791 309 39.06 135 52 129 46Bergenfield 4 - Election Day 891 319 35.80 135 70 136 48Bergenfield 5 - Election Day 873 312 35.74 132 65 137 47Bergenfield 6 - Election Day 873 325 37.23 139 66 144 44Bergenfield 7 - Election Day 793 269 33.92 109 58 109 48Bergenfield 8 - Election Day 850 290 34.12 134 48 136 33Bergenfield 9 - Election Day 842 274 32.54 91 19 75 23Bergenfield 10 - Election Day 1127 399 35.40 183 115 182 91Bergenfield 11 - Election Day 950 386 40.63 168 109 157 99Bergenfield 12 - Election Day 1081 375 34.69 163 71 158 58Bergenfield 13 - Election Day 1178 414 35.14 177 87 170 74Bergenfield 14 - Election Day 798 297 37.22 121 58 117 40Bergenfield 15 - Election Day 1131 387 34.22 165 83 162 72Bergenfield 16 - Election Day 932 320 34.33 145 80 147 60Bergenfield 17 - Election Day 866 285 32.91 124 59 123 44Bergenfield Mail-In Ballot - Mail-In 0 233 0.00 119 57 137 33Bergenfield Provisional - Provision 0 38 0.00 21 5 21 4Bogota 1 - Election Day 807 331 41.02 128 80 142 51Bogota 2 - Election Day 1014 364 35.90 175 62 165 64Bogota 3 - Election Day 953 346 36.31 143 71 134 61Bogota 4 - Election Day 909 400 44.00 164 97 170 67Bogota 5 - Election Day 562 254 45.20 111 52 128 33Bogota 6 - Election Day 808 318 39.36 156 65 143 60Bogota Mail-In Ballot - Mail-In Ball 0 114 0.00 59 29 58 26Bogota Provisional - Provisional 0 20 0.00 12 3 9 2Carlstadt 1 - Election Day 633 270 42.65 104 68 113 51Carlstadt 2 - Election Day 822 326 39.66 133 89 133 71Carlstadt 3 - Election Day 714 283 39.64 107 78 117 63Carlstadt 4 - Election Day 780 316 40.51 138 78 141 62Carlstadt 5 - Election Day 753 287 38.11 106 79 110 67Carlstadt Mail-In Ballot - Mail-In Ba 0 78 0.00 41 21 41 21Carlstadt Provisional - Provisional 0 5 0.00 2 1 2 0Cliffside Park 1 - Election Day 770 228 29.61 75 27 76 21Cliffside Park 2 - Election Day 822 227 27.62 75 34 80 28Cliffside Park 3 - Election Day 815 227 27.85 78 13 67 18Cliffside Park 4 - Election Day 1213 471 38.83 209 90 198 81Cliffside Park 5 - Election Day 726 215 29.61 84 29 78 27Cliffside Park 6 - Election Day 759 271 35.70 81 52 94 36Cliffside Park 7 - Election Day 800 236 29.50 83 41 76 40Cliffside Park 8 - Election Day 817 325 39.78 110 37 98 43Cliffside Park 9 - Election Day 644 204 31.68 69 47 67 41Cliffside Park 10 - Election Day 1128 349 30.94 135 63 143 45Cliffside Park 11 - Election Day 593 161 27.15 62 20 52 20Cliffside Park 12 - Election Day 548 160 29.20 54 36 59 27Cliffside Park 13 - Election Day 886 307 34.65 126 44 108 56Cliffside Park 14 - Election Day 748 326 43.58 138 76 136 61Cliffside Park 15 - Election Day 777 313 40.28 130 40 123 36Cliffside Park Mail-In Ballot - Mail- 0 199 0.00 109 31 101 30
November 15, 2017 8:38 am Page 197 of 219

Regi
stra
tion
Ballo
ts C
ast
Turn
out (
%)
STAT
E PU
BLIC
QUE
STIO
N #1
Yes
No
STAT
E PU
BLIC
QUE
STIO
N #2
Yes
No
STATE
BERGEN COUNTY Statement of VoteBER_20171107_E
Cliffside Park Provisional - Provisio 0 25 0.00 18 3 16 2Closter 1 - Election Day 647 279 43.12 153 70 174 41Closter 2 - Election Day 905 344 38.01 160 79 162 67Closter 3 - Election Day 857 315 36.76 145 83 147 64Closter 4 - Election Day 911 337 36.99 154 72 155 49Closter 5 - Election Day 824 318 38.59 146 97 146 84Closter 6 - Election Day 1084 380 35.06 172 101 179 75Closter Mail-In Ballot - Mail-In Ball 0 100 0.00 61 32 69 22Closter Provisional - Provisional 0 6 0.00 2 2 4 2Cresskill 1 - Election Day 815 300 36.81 114 101 137 68Cresskill 2 - Election Day 928 315 33.94 143 77 144 62Cresskill 3 - Election Day 1480 496 33.51 214 153 242 99Cresskill 4 - Election Day 781 278 35.60 132 72 140 46Cresskill 5 - Election Day 601 250 41.60 123 74 123 57Cresskill 6 - Election Day 659 245 37.18 121 65 136 43Cresskill Mail-In Ballot - Mail-In Ba 0 59 0.00 27 21 32 14Cresskill Provisional - Provisional 0 4 0.00 2 0 2 0Demarest 1 - Election Day 1087 481 44.25 236 135 259 98Demarest 2 - Election Day 1102 402 36.48 204 103 214 79Demarest 3 - Election Day 1113 456 40.97 239 106 261 71Demarest Mail-In Ballot - Mail-In B 0 89 0.00 47 25 52 15Demarest Provisional - Provisiona 0 9 0.00 4 3 6 0Dumont 1 - Election Day 901 324 35.96 149 65 147 53Dumont 2 - Election Day 1159 430 37.10 206 81 200 67Dumont 3 - Election Day 937 394 42.05 188 104 188 79Dumont 4 - Election Day 1213 486 40.07 242 120 239 82Dumont 5 - Election Day 1023 407 39.78 207 96 185 84Dumont 6 - Election Day 1123 411 36.60 198 110 195 81Dumont 7 - Election Day 945 373 39.47 161 89 167 61Dumont 8 - Election Day 1150 477 41.48 214 122 223 90Dumont 9 - Election Day 1075 402 37.40 187 112 197 70Dumont 10 - Election Day 680 306 45.00 132 97 159 57Dumont 11 - Election Day 1093 455 41.63 203 134 194 105Dumont Mail-In Ballot - Mail-In Ba 0 141 0.00 67 33 73 16Dumont Provisional - Provisional 0 22 0.00 15 1 12 1East Rutherford 1 - Election Day 1198 385 32.14 191 71 192 53East Rutherford 2 - Election Day 1080 414 38.33 183 93 186 73East Rutherford 3 - Election Day 881 373 42.34 161 78 153 73East Rutherford 4 - Election Day 1901 786 41.35 344 192 330 157East Rutherford Mail-In Ballot - Ma 0 85 0.00 51 22 52 19East Rutherford Provisional - Prov 0 12 0.00 7 1 5 1Edgewater 1 - Election Day 1072 335 31.25 159 52 161 41Edgewater 2 - Election Day 1385 405 29.24 214 59 214 51Edgewater 3 - Election Day 1416 469 33.12 225 92 231 66Edgewater 4 - Election Day 1898 486 25.61 248 84 258 47Edgewater Mail-In Ballot - Mail-In 0 123 0.00 60 25 64 18Edgewater Provisional - Provisiona 0 16 0.00 12 1 9 1Elmwood Park 1 - Election Day 1427 492 34.48 183 116 198 70Elmwood Park 2 - Election Day 1446 464 32.09 167 103 175 78Elmwood Park 3 - Election Day 943 380 40.30 158 99 172 63Elmwood Park 4 - Election Day 809 246 30.41 101 47 86 52Elmwood Park 5 - Election Day 860 333 38.72 128 78 121 69Elmwood Park 6 - Election Day 714 224 31.37 69 38 78 29Elmwood Park 7 - Election Day 1146 437 38.13 172 99 172 79Elmwood Park 8 - Election Day 1919 563 29.34 237 128 243 100Elmwood Park 9 - Election Day 1183 353 29.84 122 98 123 78Elmwood Park 10 - Election Day 1470 495 33.67 196 118 193 108Elmwood Park Mail-In Ballot - Mai 0 605 0.00 181 97 166 100Elmwood Park Provisional - Provis 0 61 0.00 24 10 27 2
November 15, 2017 8:38 am Page 198 of 219
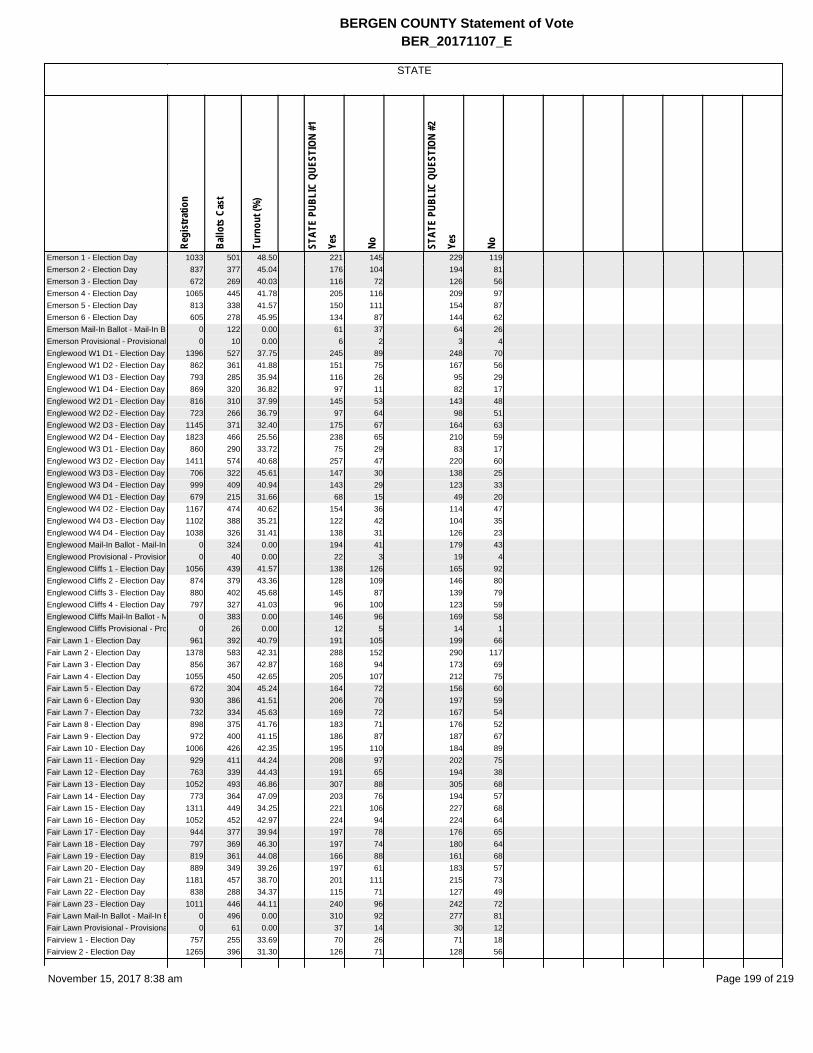
Regi
stra
tion
Ballo
ts C
ast
Turn
out (
%)
STAT
E PU
BLIC
QUE
STIO
N #1
Yes
No
STAT
E PU
BLIC
QUE
STIO
N #2
Yes
No
STATE
BERGEN COUNTY Statement of VoteBER_20171107_E
Emerson 1 - Election Day 1033 501 48.50 221 145 229 119Emerson 2 - Election Day 837 377 45.04 176 104 194 81Emerson 3 - Election Day 672 269 40.03 116 72 126 56Emerson 4 - Election Day 1065 445 41.78 205 116 209 97Emerson 5 - Election Day 813 338 41.57 150 111 154 87Emerson 6 - Election Day 605 278 45.95 134 87 144 62Emerson Mail-In Ballot - Mail-In Ba 0 122 0.00 61 37 64 26Emerson Provisional - Provisional 0 10 0.00 6 2 3 4Englewood W1 D1 - Election Day 1396 527 37.75 245 89 248 70Englewood W1 D2 - Election Day 862 361 41.88 151 75 167 56Englewood W1 D3 - Election Day 793 285 35.94 116 26 95 29Englewood W1 D4 - Election Day 869 320 36.82 97 11 82 17Englewood W2 D1 - Election Day 816 310 37.99 145 53 143 48Englewood W2 D2 - Election Day 723 266 36.79 97 64 98 51Englewood W2 D3 - Election Day 1145 371 32.40 175 67 164 63Englewood W2 D4 - Election Day 1823 466 25.56 238 65 210 59Englewood W3 D1 - Election Day 860 290 33.72 75 29 83 17Englewood W3 D2 - Election Day 1411 574 40.68 257 47 220 60Englewood W3 D3 - Election Day 706 322 45.61 147 30 138 25Englewood W3 D4 - Election Day 999 409 40.94 143 29 123 33Englewood W4 D1 - Election Day 679 215 31.66 68 15 49 20Englewood W4 D2 - Election Day 1167 474 40.62 154 36 114 47Englewood W4 D3 - Election Day 1102 388 35.21 122 42 104 35Englewood W4 D4 - Election Day 1038 326 31.41 138 31 126 23Englewood Mail-In Ballot - Mail-In 0 324 0.00 194 41 179 43Englewood Provisional - Provision 0 40 0.00 22 3 19 4Englewood Cliffs 1 - Election Day 1056 439 41.57 138 126 165 92Englewood Cliffs 2 - Election Day 874 379 43.36 128 109 146 80Englewood Cliffs 3 - Election Day 880 402 45.68 145 87 139 79Englewood Cliffs 4 - Election Day 797 327 41.03 96 100 123 59Englewood Cliffs Mail-In Ballot - M 0 383 0.00 146 96 169 58Englewood Cliffs Provisional - Pro 0 26 0.00 12 5 14 1Fair Lawn 1 - Election Day 961 392 40.79 191 105 199 66Fair Lawn 2 - Election Day 1378 583 42.31 288 152 290 117Fair Lawn 3 - Election Day 856 367 42.87 168 94 173 69Fair Lawn 4 - Election Day 1055 450 42.65 205 107 212 75Fair Lawn 5 - Election Day 672 304 45.24 164 72 156 60Fair Lawn 6 - Election Day 930 386 41.51 206 70 197 59Fair Lawn 7 - Election Day 732 334 45.63 169 72 167 54Fair Lawn 8 - Election Day 898 375 41.76 183 71 176 52Fair Lawn 9 - Election Day 972 400 41.15 186 87 187 67Fair Lawn 10 - Election Day 1006 426 42.35 195 110 184 89Fair Lawn 11 - Election Day 929 411 44.24 208 97 202 75Fair Lawn 12 - Election Day 763 339 44.43 191 65 194 38Fair Lawn 13 - Election Day 1052 493 46.86 307 88 305 68Fair Lawn 14 - Election Day 773 364 47.09 203 76 194 57Fair Lawn 15 - Election Day 1311 449 34.25 221 106 227 68Fair Lawn 16 - Election Day 1052 452 42.97 224 94 224 64Fair Lawn 17 - Election Day 944 377 39.94 197 78 176 65Fair Lawn 18 - Election Day 797 369 46.30 197 74 180 64Fair Lawn 19 - Election Day 819 361 44.08 166 88 161 68Fair Lawn 20 - Election Day 889 349 39.26 197 61 183 57Fair Lawn 21 - Election Day 1181 457 38.70 201 111 215 73Fair Lawn 22 - Election Day 838 288 34.37 115 71 127 49Fair Lawn 23 - Election Day 1011 446 44.11 240 96 242 72Fair Lawn Mail-In Ballot - Mail-In B 0 496 0.00 310 92 277 81Fair Lawn Provisional - Provisiona 0 61 0.00 37 14 30 12Fairview 1 - Election Day 757 255 33.69 70 26 71 18Fairview 2 - Election Day 1265 396 31.30 126 71 128 56
November 15, 2017 8:38 am Page 199 of 219

Regi
stra
tion
Ballo
ts C
ast
Turn
out (
%)
STAT
E PU
BLIC
QUE
STIO
N #1
Yes
No
STAT
E PU
BLIC
QUE
STIO
N #2
Yes
No
STATE
BERGEN COUNTY Statement of VoteBER_20171107_E
Fairview 3 - Election Day 941 297 31.56 85 40 80 35Fairview 4 - Election Day 860 258 30.00 67 40 74 30Fairview 5 - Election Day 1334 428 32.08 120 58 112 54Fairview 6 - Election Day 165 85 51.52 6 4 6 5Fairview Mail-In Ballot - Mail-In Ba 0 64 0.00 29 18 29 14Fairview Provisional - Provisional 0 8 0.00 7 0 4 1Fort Lee 1 - Election Day 1117 383 34.29 128 76 119 70Fort Lee 2 - Election Day 768 271 35.29 95 49 104 35Fort Lee 3 - Election Day 1454 495 34.04 217 106 216 85Fort Lee 4 - Election Day 583 269 46.14 127 45 126 35Fort Lee 5 - Election Day 908 301 33.15 102 64 102 51Fort Lee 6 - Election Day 1556 506 32.52 211 108 209 94Fort Lee 7 - Election Day 2142 777 36.27 335 104 325 90Fort Lee 8 - Election Day 609 158 25.94 65 28 72 22Fort Lee 9 - Election Day 687 203 29.55 78 44 79 35Fort Lee 10 - Election Day 2683 836 31.16 402 166 391 140Fort Lee 11 - Election Day 683 226 33.09 51 21 57 13Fort Lee 12 - Election Day 1270 380 29.92 183 61 179 48Fort Lee 13 - Election Day 737 269 36.50 145 37 148 29Fort Lee 14 - Election Day 607 223 36.74 129 23 106 34Fort Lee 15 - Election Day 777 217 27.93 106 27 103 24Fort Lee 16 - Election Day 1013 330 32.58 142 64 139 47Fort Lee 17 - Election Day 503 203 40.36 98 42 97 21Fort Lee 18 - Election Day 471 169 35.88 69 27 70 25Fort Lee 19 - Election Day 1374 483 35.15 252 79 243 64Fort Lee Mail-In Ballot - Mail-In Ba 0 463 0.00 310 72 296 57Fort Lee Provisional - Provisional 0 62 0.00 33 7 28 6Franklin Lakes 1 - Election Day 1044 371 35.54 144 128 176 83Franklin Lakes 2 - Election Day 1054 398 37.76 144 145 182 95Franklin Lakes 3 - Election Day 1110 407 36.67 170 133 188 107Franklin Lakes 4 - Election Day 2024 712 35.18 273 240 320 171Franklin Lakes 5 - Election Day 1480 531 35.88 197 200 247 124Franklin Lakes 6 - Election Day 1328 490 36.90 190 174 221 128Franklin Lakes Mail-In Ballot - Mai 0 240 0.00 111 69 126 48Franklin Lakes Provisional - Provis 0 20 0.00 10 6 7 6Garfield W1 D1 - Election Day 841 187 22.24 70 39 75 30Garfield W1 D2 - Election Day 495 103 20.81 47 13 36 20Garfield W1 D3 - Election Day 994 204 20.52 70 41 69 36Garfield W2 D1 - Election Day 1036 205 19.79 74 44 72 41Garfield W2 D2 - Election Day 1016 295 29.04 107 84 99 77Garfield W2 D3 - Election Day 747 195 26.10 75 43 83 37Garfield W3 D1 - Election Day 1114 253 22.71 93 46 87 43Garfield W3 D2 - Election Day 1099 291 26.48 113 51 112 38Garfield W3 D3 - Election Day 933 265 28.40 103 69 94 63Garfield W4 D1 - Election Day 1193 299 25.06 111 75 123 52Garfield W4 D2 - Election Day 856 231 26.99 91 65 92 55Garfield W4 D3 - Election Day 754 147 19.50 59 35 61 29Garfield W5 D1 - Election Day 1515 386 25.48 183 91 173 83Garfield W5 D2 - Election Day 869 250 28.77 111 63 114 46Garfield W5 D3 - Election Day 575 191 33.22 83 54 90 41Garfield Mail-In Ballot - Mail-In Ba 0 167 0.00 72 42 66 32Garfield Provisional - Provisional 0 23 0.00 14 1 9 2Glen Rock 1 - Election Day 1038 497 47.88 289 97 302 72Glen Rock 2 - Election Day 1143 566 49.52 336 101 337 77Glen Rock 3 - Election Day 1168 560 47.95 314 132 322 90Glen Rock 4 - Election Day 967 471 48.71 273 105 277 89Glen Rock 5 - Election Day 1221 572 46.85 307 151 329 107Glen Rock 6 - Election Day 942 432 45.86 231 104 237 75Glen Rock 7 - Election Day 1113 531 47.71 301 123 298 102
November 15, 2017 8:38 am Page 200 of 219
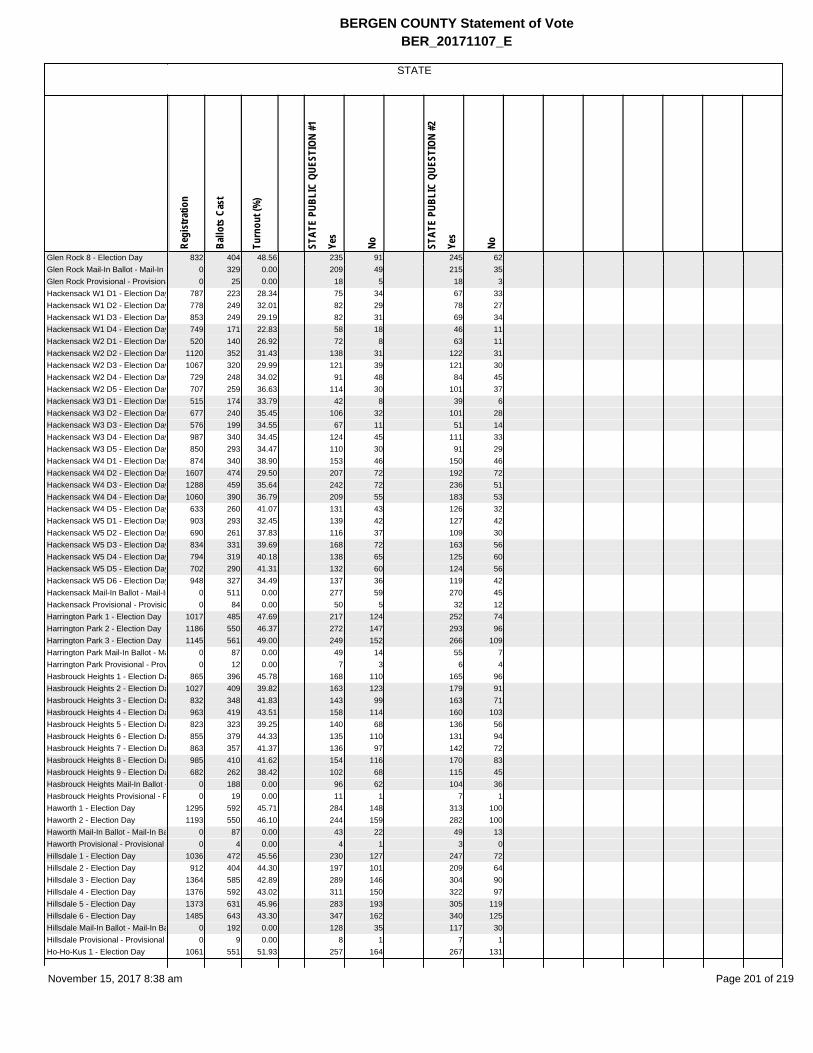
Regi
stra
tion
Ballo
ts C
ast
Turn
out (
%)
STAT
E PU
BLIC
QUE
STIO
N #1
Yes
No
STAT
E PU
BLIC
QUE
STIO
N #2
Yes
No
STATE
BERGEN COUNTY Statement of VoteBER_20171107_E
Glen Rock 8 - Election Day 832 404 48.56 235 91 245 62Glen Rock Mail-In Ballot - Mail-In B 0 329 0.00 209 49 215 35Glen Rock Provisional - Provisiona 0 25 0.00 18 5 18 3Hackensack W1 D1 - Election Day 787 223 28.34 75 34 67 33Hackensack W1 D2 - Election Day 778 249 32.01 82 29 78 27Hackensack W1 D3 - Election Day 853 249 29.19 82 31 69 34Hackensack W1 D4 - Election Day 749 171 22.83 58 18 46 11Hackensack W2 D1 - Election Day 520 140 26.92 72 8 63 11Hackensack W2 D2 - Election Day 1120 352 31.43 138 31 122 31Hackensack W2 D3 - Election Day 1067 320 29.99 121 39 121 30Hackensack W2 D4 - Election Day 729 248 34.02 91 48 84 45Hackensack W2 D5 - Election Day 707 259 36.63 114 30 101 37Hackensack W3 D1 - Election Day 515 174 33.79 42 8 39 6Hackensack W3 D2 - Election Day 677 240 35.45 106 32 101 28Hackensack W3 D3 - Election Day 576 199 34.55 67 11 51 14Hackensack W3 D4 - Election Day 987 340 34.45 124 45 111 33Hackensack W3 D5 - Election Day 850 293 34.47 110 30 91 29Hackensack W4 D1 - Election Day 874 340 38.90 153 46 150 46Hackensack W4 D2 - Election Day 1607 474 29.50 207 72 192 72Hackensack W4 D3 - Election Day 1288 459 35.64 242 72 236 51Hackensack W4 D4 - Election Day 1060 390 36.79 209 55 183 53Hackensack W4 D5 - Election Day 633 260 41.07 131 43 126 32Hackensack W5 D1 - Election Day 903 293 32.45 139 42 127 42Hackensack W5 D2 - Election Day 690 261 37.83 116 37 109 30Hackensack W5 D3 - Election Day 834 331 39.69 168 72 163 56Hackensack W5 D4 - Election Day 794 319 40.18 138 65 125 60Hackensack W5 D5 - Election Day 702 290 41.31 132 60 124 56Hackensack W5 D6 - Election Day 948 327 34.49 137 36 119 42Hackensack Mail-In Ballot - Mail-In 0 511 0.00 277 59 270 45Hackensack Provisional - Provisio 0 84 0.00 50 5 32 12Harrington Park 1 - Election Day 1017 485 47.69 217 124 252 74Harrington Park 2 - Election Day 1186 550 46.37 272 147 293 96Harrington Park 3 - Election Day 1145 561 49.00 249 152 266 109Harrington Park Mail-In Ballot - Ma 0 87 0.00 49 14 55 7Harrington Park Provisional - Prov 0 12 0.00 7 3 6 4Hasbrouck Heights 1 - Election Da 865 396 45.78 168 110 165 96Hasbrouck Heights 2 - Election Da 1027 409 39.82 163 123 179 91Hasbrouck Heights 3 - Election Da 832 348 41.83 143 99 163 71Hasbrouck Heights 4 - Election Da 963 419 43.51 158 114 160 103Hasbrouck Heights 5 - Election Da 823 323 39.25 140 68 136 56Hasbrouck Heights 6 - Election Da 855 379 44.33 135 110 131 94Hasbrouck Heights 7 - Election Da 863 357 41.37 136 97 142 72Hasbrouck Heights 8 - Election Da 985 410 41.62 154 116 170 83Hasbrouck Heights 9 - Election Da 682 262 38.42 102 68 115 45Hasbrouck Heights Mail-In Ballot - 0 188 0.00 96 62 104 36Hasbrouck Heights Provisional - P 0 19 0.00 11 1 7 1Haworth 1 - Election Day 1295 592 45.71 284 148 313 100Haworth 2 - Election Day 1193 550 46.10 244 159 282 100Haworth Mail-In Ballot - Mail-In Ba 0 87 0.00 43 22 49 13Haworth Provisional - Provisional 0 4 0.00 4 1 3 0Hillsdale 1 - Election Day 1036 472 45.56 230 127 247 72Hillsdale 2 - Election Day 912 404 44.30 197 101 209 64Hillsdale 3 - Election Day 1364 585 42.89 289 146 304 90Hillsdale 4 - Election Day 1376 592 43.02 311 150 322 97Hillsdale 5 - Election Day 1373 631 45.96 283 193 305 119Hillsdale 6 - Election Day 1485 643 43.30 347 162 340 125Hillsdale Mail-In Ballot - Mail-In Ba 0 192 0.00 128 35 117 30Hillsdale Provisional - Provisional 0 9 0.00 8 1 7 1Ho-Ho-Kus 1 - Election Day 1061 551 51.93 257 164 267 131
November 15, 2017 8:38 am Page 201 of 219

Regi
stra
tion
Ballo
ts C
ast
Turn
out (
%)
STAT
E PU
BLIC
QUE
STIO
N #1
Yes
No
STAT
E PU
BLIC
QUE
STIO
N #2
Yes
No
STATE
BERGEN COUNTY Statement of VoteBER_20171107_E
Ho-Ho-Kus 2 - Election Day 1104 539 48.82 246 170 275 118Ho-Ho-Kus 3 - Election Day 914 486 53.17 243 141 277 84Ho-Ho-Kus Mail-In Ballot - Mail-In 0 89 0.00 49 27 57 17Ho-Ho-Kus Provisional - Provision 0 13 0.00 8 2 7 2Leonia 1 - Election Day 876 385 43.95 202 76 207 60Leonia 2 - Election Day 812 346 42.61 208 71 202 55Leonia 3 - Election Day 767 301 39.24 179 53 170 54Leonia 4 - Election Day 787 257 32.66 126 39 128 34Leonia 5 - Election Day 1171 459 39.20 235 80 236 71Leonia 6 - Election Day 725 277 38.21 140 60 136 56Leonia Mail-In Ballot - Mail-In Ballo 0 93 0.00 57 19 61 12Leonia Provisional - Provisional 0 9 0.00 4 1 2 0Little Ferry 1 - Election Day 809 277 34.24 105 60 102 47Little Ferry 2 - Election Day 611 190 31.10 90 36 87 29Little Ferry 3 - Election Day 1114 304 27.29 130 78 138 59Little Ferry 4 - Election Day 838 261 31.15 133 42 127 39Little Ferry 5 - Election Day 1192 305 25.59 110 75 112 63Little Ferry 6 - Election Day 796 248 31.16 92 47 96 45Little Ferry Mail-In Ballot - Mail-In 0 101 0.00 42 30 47 22Little Ferry Provisional - Provisiona 0 10 0.00 5 4 7 1Lodi 1 - Election Day 1349 419 31.06 133 78 132 73Lodi 2 - Election Day 1382 419 30.32 112 80 119 59Lodi 3 - Election Day 919 248 26.99 66 41 58 40Lodi 4 - Election Day 923 234 25.35 83 31 81 27Lodi 5 - Election Day 999 324 32.43 124 64 113 57Lodi 6 - Election Day 842 275 32.66 90 58 96 44Lodi 7 - Election Day 637 214 33.59 61 68 72 49Lodi 8 - Election Day 1214 380 31.30 106 77 121 49Lodi 9 - Election Day 987 297 30.09 106 54 117 34Lodi 10 - Election Day 1134 314 27.69 110 54 108 45Lodi 11 - Election Day 1166 390 33.45 112 68 114 45Lodi 12 - Election Day 1102 379 34.39 109 80 125 59Lodi Mail-In Ballot - Mail-In Ballot 0 225 0.00 104 69 109 55Lodi Provisional - Provisional 0 30 0.00 11 4 11 2Lyndhurst 1 - Election Day 748 275 36.76 99 67 123 40Lyndhurst 2 - Election Day 748 243 32.49 90 69 82 63Lyndhurst 3 - Election Day 1199 340 28.36 150 75 153 56Lyndhurst 4 - Election Day 867 341 39.33 125 109 136 84Lyndhurst 5 - Election Day 745 271 36.38 95 73 113 50Lyndhurst 6 - Election Day 1017 328 32.25 129 79 143 53Lyndhurst 7 - Election Day 775 285 36.77 98 79 101 58Lyndhurst 8 - Election Day 860 320 37.21 128 76 130 59Lyndhurst 9 - Election Day 708 276 38.98 113 55 128 29Lyndhurst 10 - Election Day 953 359 37.67 129 86 148 62Lyndhurst 11 - Election Day 793 342 43.13 122 69 135 64Lyndhurst 12 - Election Day 702 280 39.89 88 95 89 82Lyndhurst 13 - Election Day 929 294 31.65 100 79 119 51Lyndhurst 14 - Election Day 747 253 33.87 87 56 98 37Lyndhurst 15 - Election Day 843 293 34.76 103 79 128 48Lyndhurst Mail-In Ballot - Mail-In B 0 329 0.00 133 91 136 79Lyndhurst Provisional - Provisiona 0 22 0.00 4 4 2 2Mahwah 1 - Election Day 1581 771 48.77 346 204 364 155Mahwah 2 - Election Day 1236 685 55.42 305 181 354 119Mahwah 3 - Election Day 1256 614 48.89 234 162 259 117Mahwah 4 - Election Day 1051 522 49.67 246 126 262 88Mahwah 5 - Election Day 947 432 45.62 184 131 210 94Mahwah 6 - Election Day 1188 545 45.88 243 158 265 120Mahwah 7 - Election Day 1536 732 47.66 293 242 365 144Mahwah 8 - Election Day 1366 495 36.24 188 157 223 96
November 15, 2017 8:38 am Page 202 of 219

Regi
stra
tion
Ballo
ts C
ast
Turn
out (
%)
STAT
E PU
BLIC
QUE
STIO
N #1
Yes
No
STAT
E PU
BLIC
QUE
STIO
N #2
Yes
No
STATE
BERGEN COUNTY Statement of VoteBER_20171107_E
Mahwah 9 - Election Day 484 212 43.80 76 58 90 39Mahwah 10 - Election Day 1424 650 45.65 284 150 306 108Mahwah 11 - Election Day 1595 739 46.33 305 224 342 164Mahwah 12 - Election Day 749 378 50.47 171 104 207 56Mahwah 13 - Election Day 1063 426 40.08 200 108 208 85Mahwah 14 - Election Day 1098 417 37.98 202 92 210 72Mahwah Mail-In Ballot - Mail-In Ba 0 385 0.00 214 118 249 67Mahwah Provisional - Provisional 0 58 0.00 24 14 27 6Maywood 1 - Election Day 926 377 40.71 182 80 190 60Maywood 2 - Election Day 898 373 41.54 173 112 184 81Maywood 3 - Election Day 915 379 41.42 187 111 205 88Maywood 4 - Election Day 905 408 45.08 196 115 219 76Maywood 5 - Election Day 867 371 42.79 185 91 205 65Maywood 6 - Election Day 878 378 43.05 184 102 197 78Maywood 7 - Election Day 689 192 27.87 93 35 83 32Maywood Mail-In Ballot - Mail-In B 0 160 0.00 100 30 99 26Maywood Provisional - Provisiona 0 11 0.00 5 4 4 3Midland Park 1 - Election Day 1135 547 48.19 255 147 296 87Midland Park 2 - Election Day 745 345 46.31 141 112 164 81Midland Park 3 - Election Day 1151 525 45.61 236 136 255 102Midland Park 4 - Election Day 896 409 45.65 207 110 216 82Midland Park 5 - Election Day 1083 526 48.57 219 170 258 115Midland Park Mail-In Ballot - Mail- 0 104 0.00 57 22 56 19Midland Park Provisional - Provisio 0 17 0.00 11 2 8 3Montvale 1 - Election Day 738 351 47.56 166 101 192 67Montvale 2 - Election Day 1113 528 47.44 252 158 273 110Montvale 3 - Election Day 1929 836 43.34 397 251 458 161Montvale 4 - Election Day 1849 749 40.51 327 223 367 149Montvale Mail-In Ballot - Mail-In Ba 0 164 0.00 105 37 102 26Montvale Provisional - Provisional 0 14 0.00 7 3 6 3Moonachie 1 - Election Day 296 70 23.65 19 17 20 11Moonachie 2 - Election Day 890 313 35.17 97 86 109 60Moonachie 3 - Election Day 414 120 28.99 26 37 44 15Moonachie Mail-In Ballot - Mail-In 0 24 0.00 8 7 12 3Moonachie Provisional - Provision 0 1 0.00 0 0 0 0New Milford 1 - Election Day 1273 541 42.50 225 162 241 114New Milford 2 - Election Day 1185 524 44.22 230 141 254 107New Milford 3 - Election Day 1267 573 45.22 244 163 251 136New Milford 4 - Election Day 1356 567 41.81 235 172 271 117New Milford 5 - Election Day 1081 421 38.95 170 114 173 92New Milford 6 - Election Day 918 323 35.19 158 57 155 45New Milford 7 - Election Day 778 251 32.26 124 39 128 24New Milford 8 - Election Day 1404 580 41.31 263 144 257 108New Milford 9 - Election Day 861 383 44.48 186 101 188 79New Milford Mail-In Ballot - Mail-In 0 210 0.00 124 53 131 27New Milford Provisional - Provision 0 32 0.00 17 7 17 5North Arlington 1 - Election Day 547 226 41.32 93 58 98 41North Arlington 2 - Election Day 789 294 37.26 113 78 120 57North Arlington 3 - Election Day 934 360 38.54 166 80 146 82North Arlington 4 - Election Day 969 423 43.65 169 109 186 81North Arlington 5 - Election Day 1224 481 39.30 180 142 195 102North Arlington 6 - Election Day 968 346 35.74 132 80 135 65North Arlington 7 - Election Day 1448 635 43.85 268 179 286 136North Arlington 8 - Election Day 692 289 41.76 117 76 122 60North Arlington 9 - Election Day 970 408 42.06 144 124 180 70North Arlington 10 - Election Day 643 273 42.46 105 80 117 60North Arlington Mail-In Ballot - Ma 0 302 0.00 126 91 144 70North Arlington Provisional - Provi 0 16 0.00 7 3 5 3Northvale 1 - Election Day 976 422 43.24 184 155 200 113
November 15, 2017 8:38 am Page 203 of 219

Regi
stra
tion
Ballo
ts C
ast
Turn
out (
%)
STAT
E PU
BLIC
QUE
STIO
N #1
Yes
No
STAT
E PU
BLIC
QUE
STIO
N #2
Yes
No
STATE
BERGEN COUNTY Statement of VoteBER_20171107_E
Northvale 2 - Election Day 836 317 37.92 119 119 132 88Northvale 3 - Election Day 1156 464 40.14 189 171 206 125Northvale Mail-In Ballot - Mail-In B 0 50 0.00 27 12 26 12Northvale Provisional - Provisiona 0 2 0.00 2 0 2 0Norwood 1 - Election Day 1761 857 48.67 403 238 433 171Norwood 2 - Election Day 1899 821 43.23 324 249 351 182Norwood Mail-In Ballot - Mail-In Ba 0 88 0.00 41 26 42 17Norwood Provisional - Provisional 0 3 0.00 0 3 1 1Oakland 1 - Election Day 1001 452 45.15 224 121 233 96Oakland 2 - Election Day 912 394 43.20 183 111 201 71Oakland 3 - Election Day 755 331 43.84 141 114 176 75Oakland 4 - Election Day 942 428 45.44 210 145 216 117Oakland 5 - Election Day 1013 468 46.20 216 136 230 104Oakland 6 - Election Day 1232 556 45.13 258 182 302 112Oakland 7 - Election Day 1257 546 43.44 256 173 286 124Oakland 8 - Election Day 1705 605 35.48 263 203 318 131Oakland Mail-In Ballot - Mail-In Ba 0 199 0.00 108 51 121 33Oakland Provisional - Provisional 0 7 0.00 3 2 4 2Old Tappan 1 - Election Day 1201 435 36.22 211 135 214 108Old Tappan 2 - Election Day 1443 477 33.06 225 154 235 114Old Tappan 3 - Election Day 1513 497 32.85 243 157 258 119Old Tappan Mail-In Ballot - Mail-In 0 128 0.00 67 36 76 24Old Tappan Provisional - Provision 0 6 0.00 2 3 4 1Oradell 1 - Election Day 977 474 48.52 218 119 237 82Oradell 2 - Election Day 886 387 43.68 162 115 166 90Oradell 3 - Election Day 922 450 48.81 207 135 226 107Oradell 4 - Election Day 934 461 49.36 220 128 257 81Oradell 5 - Election Day 1122 530 47.24 241 150 254 117Oradell 6 - Election Day 1122 530 47.24 243 141 258 108Oradell Mail-In Ballot - Mail-In Ball 0 184 0.00 117 38 119 23Oradell Provisional - Provisional 0 14 0.00 9 2 5 5Palisades Park 1 - Election Day 569 132 23.20 52 23 56 16Palisades Park 2 - Election Day 701 241 34.38 57 27 53 27Palisades Park 3 - Election Day 696 170 24.43 57 40 57 35Palisades Park 4 - Election Day 744 186 25.00 67 34 63 33Palisades Park 5 - Election Day 853 199 23.33 57 60 68 40Palisades Park 6 - Election Day 1144 291 25.44 84 70 81 58Palisades Park 7 - Election Day 748 193 25.80 69 49 76 36Palisades Park 8 - Election Day 944 206 21.82 72 48 78 40Palisades Park 9 - Election Day 1088 208 19.12 78 36 72 29Palisades Park Mail-In Ballot - Ma 0 301 0.00 129 63 144 39Palisades Park Provisional - Provi 0 37 0.00 16 8 14 5Paramus 1 - Election Day 1250 397 31.76 162 120 185 87Paramus 2 - Election Day 946 360 38.05 169 105 162 89Paramus 3 - Election Day 1066 455 42.68 186 149 200 106Paramus 4 - Election Day 823 304 36.94 126 93 143 73Paramus 5 - Election Day 746 323 43.30 149 98 165 76Paramus 6 - Election Day 887 334 37.66 145 92 160 64Paramus 7 - Election Day 975 441 45.23 184 134 196 102Paramus 8 - Election Day 911 317 34.80 136 84 131 66Paramus 9 - Election Day 864 325 37.62 146 108 162 81Paramus 10 - Election Day 790 294 37.22 131 86 153 60Paramus 11 - Election Day 740 277 37.43 119 92 123 71Paramus 12 - Election Day 1277 521 40.80 213 189 223 167Paramus 13 - Election Day 625 262 41.92 100 73 112 53Paramus 14 - Election Day 933 351 37.62 140 118 145 87Paramus 15 - Election Day 1422 471 33.12 209 124 211 99Paramus 16 - Election Day 698 308 44.13 138 95 144 73Paramus 17 - Election Day 841 324 38.53 137 94 146 79
November 15, 2017 8:38 am Page 204 of 219
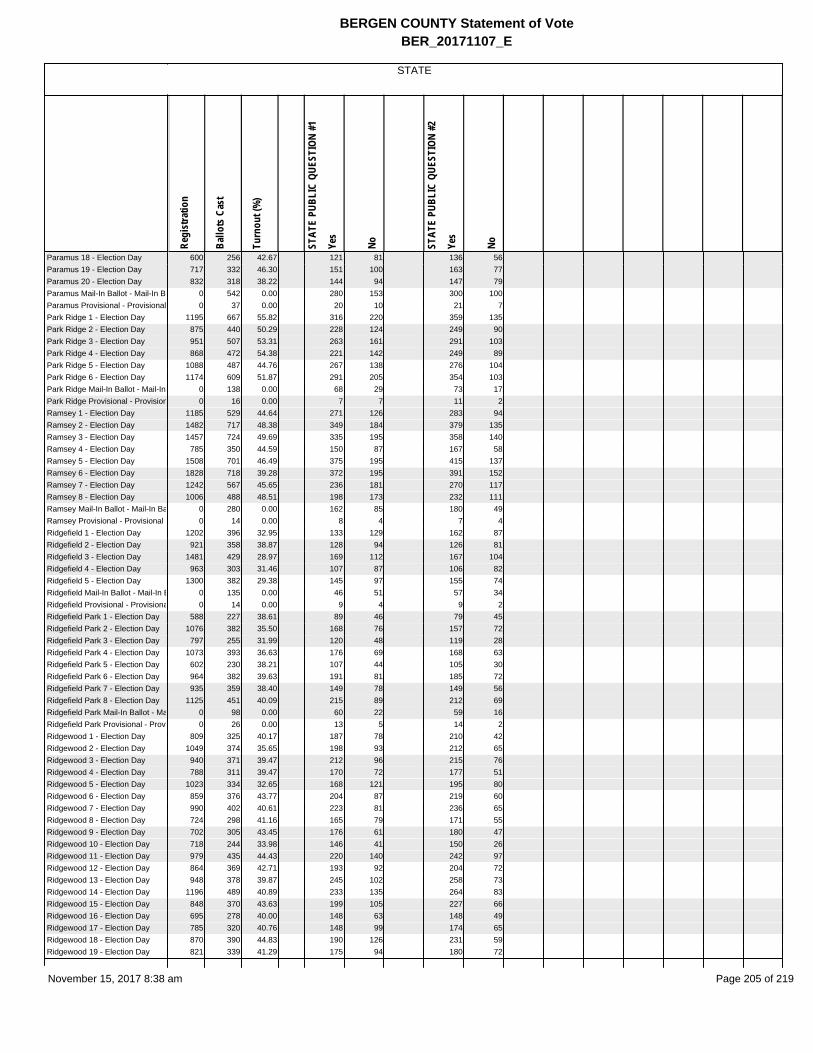
Regi
stra
tion
Ballo
ts C
ast
Turn
out (
%)
STAT
E PU
BLIC
QUE
STIO
N #1
Yes
No
STAT
E PU
BLIC
QUE
STIO
N #2
Yes
No
STATE
BERGEN COUNTY Statement of VoteBER_20171107_E
Paramus 18 - Election Day 600 256 42.67 121 81 136 56Paramus 19 - Election Day 717 332 46.30 151 100 163 77Paramus 20 - Election Day 832 318 38.22 144 94 147 79Paramus Mail-In Ballot - Mail-In Ba 0 542 0.00 280 153 300 100Paramus Provisional - Provisional 0 37 0.00 20 10 21 7Park Ridge 1 - Election Day 1195 667 55.82 316 220 359 135Park Ridge 2 - Election Day 875 440 50.29 228 124 249 90Park Ridge 3 - Election Day 951 507 53.31 263 161 291 103Park Ridge 4 - Election Day 868 472 54.38 221 142 249 89Park Ridge 5 - Election Day 1088 487 44.76 267 138 276 104Park Ridge 6 - Election Day 1174 609 51.87 291 205 354 103Park Ridge Mail-In Ballot - Mail-In 0 138 0.00 68 29 73 17Park Ridge Provisional - Provision 0 16 0.00 7 7 11 2Ramsey 1 - Election Day 1185 529 44.64 271 126 283 94Ramsey 2 - Election Day 1482 717 48.38 349 184 379 135Ramsey 3 - Election Day 1457 724 49.69 335 195 358 140Ramsey 4 - Election Day 785 350 44.59 150 87 167 58Ramsey 5 - Election Day 1508 701 46.49 375 195 415 137Ramsey 6 - Election Day 1828 718 39.28 372 195 391 152Ramsey 7 - Election Day 1242 567 45.65 236 181 270 117Ramsey 8 - Election Day 1006 488 48.51 198 173 232 111Ramsey Mail-In Ballot - Mail-In Ba 0 280 0.00 162 85 180 49Ramsey Provisional - Provisional 0 14 0.00 8 4 7 4Ridgefield 1 - Election Day 1202 396 32.95 133 129 162 87Ridgefield 2 - Election Day 921 358 38.87 128 94 126 81Ridgefield 3 - Election Day 1481 429 28.97 169 112 167 104Ridgefield 4 - Election Day 963 303 31.46 107 87 106 82Ridgefield 5 - Election Day 1300 382 29.38 145 97 155 74Ridgefield Mail-In Ballot - Mail-In B 0 135 0.00 46 51 57 34Ridgefield Provisional - Provisiona 0 14 0.00 9 4 9 2Ridgefield Park 1 - Election Day 588 227 38.61 89 46 79 45Ridgefield Park 2 - Election Day 1076 382 35.50 168 76 157 72Ridgefield Park 3 - Election Day 797 255 31.99 120 48 119 28Ridgefield Park 4 - Election Day 1073 393 36.63 176 69 168 63Ridgefield Park 5 - Election Day 602 230 38.21 107 44 105 30Ridgefield Park 6 - Election Day 964 382 39.63 191 81 185 72Ridgefield Park 7 - Election Day 935 359 38.40 149 78 149 56Ridgefield Park 8 - Election Day 1125 451 40.09 215 89 212 69Ridgefield Park Mail-In Ballot - Ma 0 98 0.00 60 22 59 16Ridgefield Park Provisional - Provi 0 26 0.00 13 5 14 2Ridgewood 1 - Election Day 809 325 40.17 187 78 210 42Ridgewood 2 - Election Day 1049 374 35.65 198 93 212 65Ridgewood 3 - Election Day 940 371 39.47 212 96 215 76Ridgewood 4 - Election Day 788 311 39.47 170 72 177 51Ridgewood 5 - Election Day 1023 334 32.65 168 121 195 80Ridgewood 6 - Election Day 859 376 43.77 204 87 219 60Ridgewood 7 - Election Day 990 402 40.61 223 81 236 65Ridgewood 8 - Election Day 724 298 41.16 165 79 171 55Ridgewood 9 - Election Day 702 305 43.45 176 61 180 47Ridgewood 10 - Election Day 718 244 33.98 146 41 150 26Ridgewood 11 - Election Day 979 435 44.43 220 140 242 97Ridgewood 12 - Election Day 864 369 42.71 193 92 204 72Ridgewood 13 - Election Day 948 378 39.87 245 102 258 73Ridgewood 14 - Election Day 1196 489 40.89 233 135 264 83Ridgewood 15 - Election Day 848 370 43.63 199 105 227 66Ridgewood 16 - Election Day 695 278 40.00 148 63 148 49Ridgewood 17 - Election Day 785 320 40.76 148 99 174 65Ridgewood 18 - Election Day 870 390 44.83 190 126 231 59Ridgewood 19 - Election Day 821 339 41.29 175 94 180 72
November 15, 2017 8:38 am Page 205 of 219

Regi
stra
tion
Ballo
ts C
ast
Turn
out (
%)
STAT
E PU
BLIC
QUE
STIO
N #1
Yes
No
STAT
E PU
BLIC
QUE
STIO
N #2
Yes
No
STATE
BERGEN COUNTY Statement of VoteBER_20171107_E
Ridgewood Mail-In Ballot - Mail-In 0 432 0.00 244 95 255 60Ridgewood Provisional - Provision 0 35 0.00 24 6 17 5River Edge 1 - Election Day 1133 485 42.81 277 110 275 85River Edge 2 - Election Day 964 410 42.53 222 126 215 107River Edge 3 - Election Day 863 371 42.99 196 109 208 71River Edge 4 - Election Day 935 444 47.49 260 124 247 99River Edge 5 - Election Day 758 301 39.71 179 75 153 70River Edge 6 - Election Day 878 347 39.52 187 95 186 75River Edge 7 - Election Day 914 366 40.04 204 94 206 54River Edge 8 - Election Day 752 241 32.05 120 53 115 45River Edge Mail-In Ballot - Mail-In 0 198 0.00 102 64 106 43River Edge Provisional - Provision 0 7 0.00 2 4 3 2River Vale 1 - Election Day 1533 578 37.70 294 157 326 86River Vale 2 - Election Day 2055 856 41.65 450 240 474 165River Vale 3 - Election Day 1486 632 42.53 323 188 336 125River Vale 4 - Election Day 1159 476 41.07 237 139 245 93River Vale 5 - Election Day 1231 493 40.05 233 156 249 93River Vale Mail-In Ballot - Mail-In B 0 134 0.00 62 33 70 18River Vale Provisional - Provisiona 0 10 0.00 8 1 7 1Rochelle Park 1 - Election Day 1001 472 47.15 265 83 223 72Rochelle Park 2 - Election Day 894 421 47.09 246 92 187 92Rochelle Park 3 - Election Day 852 413 48.47 218 87 189 64Rochelle Park 4 - Election Day 956 432 45.19 234 113 204 90Rochelle Park Mail-In Ballot - Mail 0 105 0.00 54 31 61 23Rochelle Park Provisional - Provis 0 16 0.00 9 4 5 6Rockleigh 1 - Election Day 227 81 35.68 22 34 32 20Rockleigh Mail-In Ballot - Mail-In B 0 15 0.00 10 0 8 0Rockleigh Provisional - Provisiona 0 1 0.00 1 0 1 0Rutherford 1 - Election Day 990 496 50.10 233 145 277 92Rutherford 2 - Election Day 1099 509 46.31 254 131 253 110Rutherford 3 - Election Day 989 434 43.88 211 110 218 83Rutherford 4 - Election Day 730 346 47.40 165 98 183 71Rutherford 5 - Election Day 776 344 44.33 157 96 164 71Rutherford 6 - Election Day 743 282 37.95 147 63 157 43Rutherford 7 - Election Day 938 404 43.07 190 104 182 87Rutherford 8 - Election Day 1007 420 41.71 209 96 214 81Rutherford 9 - Election Day 1051 491 46.72 249 101 237 94Rutherford 10 - Election Day 969 437 45.10 211 110 217 90Rutherford 11 - Election Day 1041 405 38.90 226 79 220 69Rutherford 12 - Election Day 763 311 40.76 149 85 171 51Rutherford Mail-In Ballot - Mail-In 0 257 0.00 143 58 149 44Rutherford Provisional - Provisiona 0 43 0.00 25 7 25 3Saddle Brook 1 - Election Day 778 267 34.32 101 64 96 53Saddle Brook 2 - Election Day 769 325 42.26 98 104 106 84Saddle Brook 3 - Election Day 582 236 40.55 96 63 114 36Saddle Brook 4 - Election Day 892 378 42.38 123 133 156 100Saddle Brook 5 - Election Day 995 344 34.57 137 112 153 85Saddle Brook 6 - Election Day 973 424 43.58 133 151 154 105Saddle Brook 7 - Election Day 598 255 42.64 79 90 80 79Saddle Brook 8 - Election Day 790 329 41.65 119 97 143 65Saddle Brook 9 - Election Day 916 369 40.28 152 115 156 96Saddle Brook 10 - Election Day 857 371 43.29 142 122 160 92Saddle Brook 11 - Election Day 864 386 44.68 137 133 166 86Saddle Brook Mail-In Ballot - Mail- 0 144 0.00 69 36 68 24Saddle Brook Provisional - Provisi 0 18 0.00 9 7 10 6Saddle River 1 - Election Day 1185 380 32.07 121 137 166 78Saddle River 2 - Election Day 1452 532 36.64 194 192 215 144Saddle River Mail-In Ballot - Mail-I 0 74 0.00 33 22 39 14Saddle River Provisional - Provisio 0 8 0.00 3 3 2 3
November 15, 2017 8:38 am Page 206 of 219

Regi
stra
tion
Ballo
ts C
ast
Turn
out (
%)
STAT
E PU
BLIC
QUE
STIO
N #1
Yes
No
STAT
E PU
BLIC
QUE
STIO
N #2
Yes
No
STATE
BERGEN COUNTY Statement of VoteBER_20171107_E
South Hackensack 1 - Election Da 1417 525 37.05 171 127 171 111South Hackensack Mail-In Ballot - 0 32 0.00 13 7 15 5South Hackensack Provisional - P 0 1 0.00 1 0 0 0Teaneck 1 - Election Day 995 372 37.39 204 65 187 68Teaneck 2 - Election Day 1310 466 35.57 253 63 235 58Teaneck 3 - Election Day 1247 545 43.70 359 78 325 70Teaneck 4 - Election Day 1154 478 41.42 315 60 293 66Teaneck 5 - Election Day 860 317 36.86 176 33 165 27Teaneck 6 - Election Day 1021 463 45.35 266 59 263 36Teaneck 7 - Election Day 1069 430 40.22 234 63 224 50Teaneck 8 - Election Day 1286 622 48.37 404 80 380 76Teaneck 9 - Election Day 1261 491 38.94 300 94 282 81Teaneck 10 - Election Day 1438 477 33.17 282 100 260 95Teaneck 11 - Election Day 1297 388 29.92 191 105 190 89Teaneck 12 - Election Day 1440 486 33.75 280 115 261 102Teaneck 13 - Election Day 1098 527 48.00 239 55 204 56Teaneck 14 - Election Day 1464 636 43.44 217 63 171 66Teaneck 15 - Election Day 1080 330 30.56 179 28 145 35Teaneck 16 - Election Day 750 313 41.73 105 33 83 41Teaneck 17 - Election Day 1259 524 41.62 273 59 239 54Teaneck 18 - Election Day 1333 547 41.04 327 88 297 86Teaneck 19 - Election Day 1147 462 40.28 257 83 247 63Teaneck 20 - Election Day 830 314 37.83 182 49 183 38Teaneck 21 - Election Day 1355 459 33.87 235 65 219 54Teaneck 22 - Election Day 994 354 35.61 173 47 163 39Teaneck 23 - Election Day 981 341 34.76 147 47 127 51Teaneck Mail-In Ballot - Mail-In Ba 0 513 0.00 300 84 293 65Teaneck Provisional - Provisional 0 37 0.00 23 6 20 5Tenafly 1 - Election Day 778 281 36.12 183 59 183 55Tenafly 2 - Election Day 631 211 33.44 109 54 109 47Tenafly 3 - Election Day 592 217 36.66 120 45 123 41Tenafly 4 - Election Day 824 318 38.59 191 69 207 41Tenafly 5 - Election Day 728 254 34.89 159 45 168 38Tenafly 6 - Election Day 636 229 36.01 145 35 141 38Tenafly 7 - Election Day 708 195 27.54 105 44 100 47Tenafly 8 - Election Day 835 277 33.17 179 56 182 39Tenafly 9 - Election Day 847 333 39.32 204 57 202 52Tenafly 10 - Election Day 687 267 38.86 156 54 162 34Tenafly 11 - Election Day 824 278 33.74 142 75 164 45Tenafly 12 - Election Day 960 287 29.90 170 56 173 44Tenafly Mail-In Ballot - Mail-In Bal 0 196 0.00 128 27 124 27Tenafly Provisional - Provisional 0 15 0.00 11 4 13 2Teterboro 1 - Election Day 34 17 50.00 8 0 8 0Teterboro Mail-In Ballot - Mail-In B 0 0 0.00 0 0 0 0Teterboro Provisional - Provisiona 0 0 0.00 0 0 0 0Upper Saddle River 1 - Election D 1468 548 37.33 251 173 310 98Upper Saddle River 2 - Election D 1049 375 35.75 192 135 213 86Upper Saddle River 3 - Election D 1271 447 35.17 228 151 233 127Upper Saddle River 4 - Election D 1269 453 35.70 223 139 249 103Upper Saddle River 5 - Election D 930 322 34.62 163 103 169 83Upper Saddle River Mail-In Ballot 0 126 0.00 64 30 80 12Upper Saddle River Provisional - P 0 18 0.00 9 6 14 2Waldwick 1 - Election Day 1287 574 44.60 298 169 303 133Waldwick 2 - Election Day 1141 472 41.37 256 124 264 95Waldwick 3 - Election Day 1088 478 43.93 267 122 279 93Waldwick 4 - Election Day 1098 481 43.81 238 150 229 131Waldwick 5 - Election Day 1037 463 44.65 238 118 239 96Waldwick 6 - Election Day 1001 456 45.55 223 140 235 117Waldwick Mail-In Ballot - Mail-In B 0 129 0.00 65 47 75 33
November 15, 2017 8:38 am Page 207 of 219

Regi
stra
tion
Ballo
ts C
ast
Turn
out (
%)
STAT
E PU
BLIC
QUE
STIO
N #1
Yes
No
STAT
E PU
BLIC
QUE
STIO
N #2
Yes
No
STATE
BERGEN COUNTY Statement of VoteBER_20171107_E
Waldwick Provisional - Provisiona 0 16 0.00 8 4 9 2Wallington 1 - Election Day 623 211 33.87 93 59 90 48Wallington 2 - Election Day 738 232 31.44 93 45 70 54Wallington 3 - Election Day 1129 373 33.04 154 58 149 50Wallington 4 - Election Day 1305 655 50.19 229 186 215 170Wallington 5 - Election Day 1101 381 34.60 144 96 144 91Wallington 6 - Election Day 710 251 35.35 102 56 94 53Wallington Mail-In Ballot - Mail-In B 0 137 0.00 61 48 64 37Wallington Provisional - Provisiona 0 9 0.00 2 3 3 2Washington Township 1 - Election 1346 640 47.55 306 162 315 127Washington Township 2 - Election 912 425 46.60 178 133 219 79Washington Township 3 - Election 746 373 50.00 171 88 165 83Washington Township 4 - Election 1192 512 42.95 227 158 234 132Washington Township 5 - Election 1117 549 49.15 232 156 255 118Washington Township 6 - Election 1508 680 45.09 279 218 304 167Washington Township Mail-In Ball 0 211 0.00 105 60 120 37Washington Township Provisional 0 19 0.00 11 6 11 5Westwood 1 - Election Day 1114 513 46.05 253 135 276 102Westwood 2 - Election Day 959 446 46.51 230 108 231 88Westwood 3 - Election Day 605 297 49.09 261 70 162 53Westwood 4 - Election Day 894 429 47.99 231 93 231 72Westwood 5 - Election Day 707 351 49.65 200 92 204 70Westwood 6 - Election Day 1242 469 37.76 226 112 218 98Westwood 7 - Election Day 781 356 45.58 194 105 205 75Westwood 8 - Election Day 944 445 47.14 237 110 246 79Westwood Mail-In Ballot - Mail-In B 0 156 0.00 83 43 95 28Westwood Provisional - Provisiona 0 20 0.00 12 3 8 3Woodcliff Lake 1 - Election Day 897 425 47.38 171 141 217 80Woodcliff Lake 2 - Election Day 1176 556 47.28 224 203 274 130Woodcliff Lake 3 - Election Day 983 475 48.32 194 177 255 94Woodcliff Lake 4 - Election Day 1427 621 43.52 245 222 293 147Woodcliff Lake Mail-In Ballot - Mai 0 170 0.00 75 53 100 23Woodcliff Lake Provisional - Provis 0 21 0.00 3 5 6 1Wood Ridge 1 - Election Day 1442 602 41.75 307 137 307 116Wood Ridge 2 - Election Day 772 408 52.85 184 127 177 106Wood Ridge 3 - Election Day 1200 569 47.42 233 180 252 139Wood Ridge 4 - Election Day 1182 499 42.22 246 120 245 96Wood Ridge 5 - Election Day 1243 601 48.35 250 186 286 115Wood Ridge Mail-In Ballot - Mail-In 0 136 0.00 73 22 65 22Wood Ridge Provisional - Provisio 0 8 0.00 2 3 3 3Wyckoff 1 - Election Day 1382 630 45.59 291 182 324 127Wyckoff 2 - Election Day 1496 704 47.06 357 189 373 140Wyckoff 3 - Election Day 1259 542 43.05 271 158 287 123Wyckoff 4 - Election Day 1421 628 44.19 308 185 331 136Wyckoff 5 - Election Day 929 450 48.44 194 148 223 109Wyckoff 6 - Election Day 1229 556 45.24 294 149 290 136Wyckoff 7 - Election Day 1270 631 49.69 291 200 336 134Wyckoff 8 - Election Day 1347 585 43.43 252 203 292 145Wyckoff 9 - Election Day 876 435 49.66 214 112 213 99Wyckoff 10 - Election Day 1139 511 44.86 230 159 262 110Wyckoff Mail-In Ballot - Mail-In Ba 0 439 0.00 212 125 254 70Wyckoff Provisional - Provisional 0 29 0.00 21 3 21 0
Election Day Totals 559538 218514 39.05 99004 53522 102324 40461
Mail-In Ballot Totals 0 13571 0.00 7059 3183 7394 2236
Provisional Totals 0 1374 0.00 741 262 675 184
November 15, 2017 8:38 am Page 208 of 219

Regi
stra
tion
Ballo
ts C
ast
Turn
out (
%)
STAT
E PU
BLIC
QUE
STIO
N #1
Yes
No
STAT
E PU
BLIC
QUE
STIO
N #2
Yes
No
STATE
BERGEN COUNTY Statement of VoteBER_20171107_E
District Totals - Absentee
District Grand TotalsCounty 559538 233459 41.72 106804 56967 110393 42881Allendale 4892 2321 47.44 1134 635 1201 464Alpine 1416 436 30.79 172 125 189 85Bergenfield 15631 5891 37.69 2548 1226 2518 955Bogota 5053 2147 42.49 948 459 949 364Carlstadt 3702 1565 42.27 631 414 657 335Cliffside Park 12046 4244 35.23 1636 683 1572 612Closter 5228 2079 39.77 993 536 1036 404Cresskill 5264 1947 36.99 876 563 956 389Demarest 3302 1437 43.52 730 372 792 263Dumont 11299 4628 40.96 2169 1164 2179 846East Rutherford 5060 2055 40.61 937 457 918 376Edgewater 5771 1834 31.78 918 313 937 224Elmwood Park 11917 4653 39.05 1738 1031 1754 828Emerson 5025 2340 46.57 1069 674 1123 532Englewood 16389 6268 38.25 2584 753 2362 700Englewood Cliffs 3607 1956 54.23 665 523 756 369Fair Lawn 21819 9729 44.59 4969 2151 4878 1619Fair View 5322 1791 33.65 510 257 504 213Fort Lee 19942 7224 36.23 3278 1250 3209 1025Franklin Lakes 8040 3169 39.42 1239 1095 1467 762Garfield 14037 3692 26.30 1476 856 1455 725Glen Rock 8424 4387 52.08 2513 958 2580 712Hackensack 21248 7796 36.69 3381 1058 3100 966Harrington Park 3348 1695 50.63 794 440 872 290Hasbrouck Heights 7895 3510 44.46 1406 968 1472 748Haworth 2488 1233 49.56 575 330 647 213Hillsdale 7546 3528 46.75 1793 915 1851 598Ho-Ho-Kus 3079 1678 54.50 803 504 883 352Leonia 5138 2127 41.40 1151 399 1142 342Little Ferry 5360 1696 31.64 707 372 716 305Lodi 12654 4148 32.78 1327 826 1376 638Lyndhurst 12634 4851 38.40 1793 1241 1964 917Mahwah 16574 8061 48.64 3515 2229 3941 1530Maywood 6078 2649 43.58 1305 680 1386 509Midland Park 5010 2473 49.36 1126 699 1253 489Montvale 5629 2642 46.94 1254 773 1398 516Moonachie 1600 528 33.00 150 147 185 89New Milford 10123 4405 43.51 1976 1153 2066 854North Arlington 9184 4053 44.13 1620 1100 1734 827Northvale 2968 1255 42.28 521 457 566 338Norwood 3660 1769 48.33 768 516 827 371Oakland 8817 3986 45.21 1862 1238 2087 865Old Tappan 4157 1543 37.12 748 485 787 366Oradell 5963 3030 50.81 1417 828 1522 613Palisades Park 7487 2164 28.90 738 458 762 358Paramus 17943 7549 42.07 3306 2292 3528 1752Park Ridge 6151 3336 54.24 1661 1026 1862 643Ramsey 10493 5088 48.49 2456 1425 2682 997Ridgefield 5867 2017 34.38 737 574 782 464Ridgefield Park 7160 2803 39.15 1288 558 1247 453Ridgewood 16608 7175 43.20 3868 1866 4165 1268River Edge 7197 3170 44.05 1749 854 1714 651River Vale 7464 3179 42.59 1607 914 1707 581Rochelle Park 3703 1859 50.20 1026 410 869 347Rockleigh 227 97 42.73 33 34 41 20
November 15, 2017 8:38 am Page 209 of 219

Regi
stra
tion
Ballo
ts C
ast
Turn
out (
%)
STAT
E PU
BLIC
QUE
STIO
N #1
Yes
No
STAT
E PU
BLIC
QUE
STIO
N #2
Yes
No
STATE
BERGEN COUNTY Statement of VoteBER_20171107_E
Rutherford 11096 5179 46.67 2569 1283 2667 989Saddle Brook 9014 3846 42.67 1395 1227 1562 911Saddle River 2637 994 37.69 351 354 422 239South Hackensack 1417 558 39.38 185 134 186 116Teaneck 26669 10892 40.84 5921 1622 5456 1471Tenafly 9050 3358 37.10 2002 680 2051 550Teterboro 34 17 50.00 8 0 8 0Upper Saddle River 5987 2289 38.23 1130 737 1268 511Waldwick 6652 3069 46.14 1593 874 1633 700Wallington 5606 2249 40.12 878 551 829 505Washington 6821 3409 49.98 1509 981 1623 748Westwood 7246 3482 48.05 1927 871 1876 668Woodcliff Lake 4483 2268 50.59 912 801 1145 475Wood Ridge 5839 2823 48.35 1295 775 1335 597Wyckoff 12348 6140 49.72 2935 1813 3206 1329
Grand Totals 559538 233459 41.72 106804 56967 110393 42881
November 15, 2017 8:38 am Page 210 of 219

Regi
stra
tion
Ballo
ts C
ast
Turn
out (
%)
DUM
ONT
MUN
ICIP
AL Q
UEST
ION
Yes
No
DUMONT MUNICIPAL QUESTION
BERGEN COUNTY Statement of VoteBER_20171107_E
Dumont 1 - Election Day 901 324 35.96 119 63Dumont 2 - Election Day 1159 430 37.10 143 91Dumont 3 - Election Day 937 394 42.05 165 89Dumont 4 - Election Day 1213 486 40.07 197 103Dumont 5 - Election Day 1023 407 39.78 171 92Dumont 6 - Election Day 1123 411 36.60 165 102Dumont 7 - Election Day 945 373 39.47 124 101Dumont 8 - Election Day 1150 477 41.48 170 107Dumont 9 - Election Day 1075 402 37.40 157 112Dumont 10 - Election Day 680 306 45.00 123 75Dumont 11 - Election Day 1093 455 41.63 169 129Dumont Mail-In Ballot - Mail-In Ba 0 141 0.00 80 35Dumont Provisional - Provisional 0 22 0.00 15 0
Election Day Totals 11299 4465 39.52 1703 1064
Mail-In Ballot Totals 0 141 0.00 80 35
Provisional Totals 0 22 0.00 15 0
District Totals - Absentee
District Grand TotalsCounty 11299 4628 40.96 1798 1099Dumont 11299 4628 40.96 1798 1099
Grand Totals 11299 4628 40.96 1798 1099
November 15, 2017 8:38 am Page 211 of 219

Regi
stra
tion
Ballo
ts C
ast
Turn
out (
%)
FAIR
LAW
N M
UNIC
IPAL
QUE
STIO
N
Yes
No
FAIR LAWN MUNICIPAL QUESTION
BERGEN COUNTY Statement of VoteBER_20171107_E
Fair Lawn 1 - Election Day 961 392 40.79 183 77Fair Lawn 2 - Election Day 1378 583 42.31 260 104Fair Lawn 3 - Election Day 856 367 42.87 153 66Fair Lawn 4 - Election Day 1055 450 42.65 191 85Fair Lawn 5 - Election Day 672 304 45.24 155 49Fair Lawn 6 - Election Day 930 386 41.51 183 55Fair Lawn 7 - Election Day 732 334 45.63 143 63Fair Lawn 8 - Election Day 898 375 41.76 154 65Fair Lawn 9 - Election Day 972 400 41.15 150 72Fair Lawn 10 - Election Day 1006 426 42.35 174 101Fair Lawn 11 - Election Day 929 411 44.24 193 74Fair Lawn 12 - Election Day 763 339 44.43 183 43Fair Lawn 13 - Election Day 1052 493 46.86 274 67Fair Lawn 14 - Election Day 773 364 47.09 187 49Fair Lawn 15 - Election Day 1311 449 34.25 220 58Fair Lawn 16 - Election Day 1052 452 42.97 215 71Fair Lawn 17 - Election Day 944 377 39.94 172 81Fair Lawn 18 - Election Day 797 369 46.30 175 73Fair Lawn 19 - Election Day 819 361 44.08 154 62Fair Lawn 20 - Election Day 889 349 39.26 182 58Fair Lawn 21 - Election Day 1181 457 38.70 216 74Fair Lawn 22 - Election Day 838 288 34.37 116 47Fair Lawn 23 - Election Day 1011 446 44.11 206 77Fair Lawn Mail-In Ballot - Mail-In B 0 496 0.00 324 68Fair Lawn Provisional - Provisiona 0 61 0.00 32 13
Election Day Totals 21819 9172 42.04 4239 1571
Mail-In Ballot Totals 0 496 0.00 324 68
Provisional Totals 0 61 0.00 32 13
District Totals - Absentee
District Grand TotalsCounty 21819 9729 44.59 4595 1652Fair Lawn 21819 9729 44.59 4595 1652
Grand Totals 21819 9729 44.59 4595 1652
November 15, 2017 8:39 am Page 212 of 219

Regi
stra
tion
Ballo
ts C
ast
Turn
out (
%)
HILL
SDAL
E M
UNIC
IPAL
QUE
STIO
N
Yes
No
HILLSDALE MUNICIPAL QUESTION
BERGEN COUNTY Statement of VoteBER_20171107_E
Hillsdale 1 - Election Day 1036 472 45.56 228 64Hillsdale 2 - Election Day 912 404 44.30 165 69Hillsdale 3 - Election Day 1364 585 42.89 268 94Hillsdale 4 - Election Day 1376 592 43.02 300 85Hillsdale 5 - Election Day 1373 631 45.96 282 85Hillsdale 6 - Election Day 1485 643 43.30 296 108Hillsdale Mail-In Ballot - Mail-In Ba 0 192 0.00 132 25Hillsdale Provisional - Provisional 0 9 0.00 4 3
Election Day Totals 7546 3327 44.09 1539 505
Mail-In Ballot Totals 0 192 0.00 132 25
Provisional Totals 0 9 0.00 4 3
District Totals - Absentee
District Grand TotalsCounty 7546 3528 46.75 1675 533Hillsdale 7546 3528 46.75 1675 533
Grand Totals 7546 3528 46.75 1675 533
November 15, 2017 8:39 am Page 213 of 219

Regi
stra
tion
Ballo
ts C
ast
Turn
out (
%)
HO-H
O-KU
S SC
HOOL
QUE
STIO
N
Yes
No
HO-HO-KUS SCHOOL QUESTION
BERGEN COUNTY Statement of VoteBER_20171107_E
Ho-Ho-Kus 1 - Election Day 1061 551 51.93 227 254Ho-Ho-Kus 2 - Election Day 1104 539 48.82 223 243Ho-Ho-Kus 3 - Election Day 914 486 53.17 237 197Ho-Ho-Kus Mail-In Ballot - Mail-In 0 89 0.00 32 36Ho-Ho-Kus Provisional - Provision 0 13 0.00 8 2
Election Day Totals 3079 1576 51.19 687 694
Mail-In Ballot Totals 0 89 0.00 32 36
Provisional Totals 0 13 0.00 8 2
District Totals - Absentee
District Grand TotalsCounty 3079 1678 54.50 727 732Ho-Ho-Kus 3079 1678 54.50 727 732
Grand Totals 3079 1678 54.50 727 732
November 15, 2017 8:39 am Page 214 of 219

Regi
stra
tion
Ballo
ts C
ast
Turn
out (
%)
NORT
HVAL
E M
UNIC
IPAL
QUE
STIO
N
Yes
No
NORTHVALE MUNICIPAL QUESTION
BERGEN COUNTY Statement of VoteBER_20171107_E
Northvale 1 - Election Day 976 422 43.24 143 166Northvale 2 - Election Day 836 317 37.92 94 119Northvale 3 - Election Day 1156 464 40.14 166 170Northvale Mail-In Ballot - Mail-In B 0 50 0.00 22 24Northvale Provisional - Provisiona 0 2 0.00 2 0
Election Day Totals 2968 1203 40.53 403 455
Mail-In Ballot Totals 0 50 0.00 22 24
Provisional Totals 0 2 0.00 2 0
District Totals - Absentee
District Grand TotalsCounty 2968 1255 42.28 427 479Northvale 2968 1255 42.28 427 479
Grand Totals 2968 1255 42.28 427 479
November 15, 2017 8:39 am Page 215 of 219

Regi
stra
tion
Ballo
ts C
ast
Turn
out (
%)
PARK
RID
GE M
UNIC
IPAL
Yes
No
PARK RIDGE MUNICIPAL QUESTION
BERGEN COUNTY Statement of VoteBER_20171107_E
Park Ridge 1 - Election Day 1195 667 55.82 423 90Park Ridge 2 - Election Day 875 440 50.29 271 51Park Ridge 3 - Election Day 951 507 53.31 349 44Park Ridge 4 - Election Day 868 472 54.38 300 42Park Ridge 5 - Election Day 1088 487 44.76 296 66Park Ridge 6 - Election Day 1174 609 51.87 393 58Park Ridge Mail-In Ballot - Mail-In 0 138 0.00 105 21Park Ridge Provisional - Provision 0 16 0.00 12 2
Election Day Totals 6151 3182 51.73 2032 351
Mail-In Ballot Totals 0 138 0.00 105 21
Provisional Totals 0 16 0.00 12 2
District Totals - Absentee
District Grand TotalsCounty 6151 3336 54.24 2149 374Park Ridge 6151 3336 54.24 2149 374
Grand Totals 6151 3336 54.24 2149 374
November 15, 2017 8:39 am Page 216 of 219

Regi
stra
tion
Ballo
ts C
ast
Turn
out (
%)
RIVE
R ED
GE M
UNIC
IPAL
QUE
STIO
N
Yes
No
RIVER EDGE MUNICIPAL QUESTION
BERGEN COUNTY Statement of VoteBER_20171107_E
River Edge 1 - Election Day 1133 485 42.81 198 173River Edge 2 - Election Day 964 410 42.53 146 157River Edge 3 - Election Day 863 371 42.99 161 135River Edge 4 - Election Day 935 444 47.49 219 142River Edge 5 - Election Day 758 301 39.71 137 94River Edge 6 - Election Day 878 347 39.52 138 116River Edge 7 - Election Day 914 366 40.04 148 112River Edge 8 - Election Day 752 241 32.05 72 75River Edge Mail-In Ballot - Mail-In 0 198 0.00 81 83River Edge Provisional - Provision 0 7 0.00 2 4
Election Day Totals 7197 2965 41.20 1219 1004
Mail-In Ballot Totals 0 198 0.00 81 83
Provisional Totals 0 7 0.00 2 4
District Totals - Absentee
District Grand TotalsCounty 7197 3170 44.05 1302 1091River Edge 7197 3170 44.05 1302 1091
Grand Totals 7197 3170 44.05 1302 1091
November 15, 2017 8:39 am Page 217 of 219

Regi
stra
tion
Ballo
ts C
ast
Turn
out (
%)
RIVE
R VA
LE M
UNIC
IPAL
QUE
STIO
N
Yes
No
RIVER VALE MUNICIPAL QUESTION
BERGEN COUNTY Statement of VoteBER_20171107_E
River Vale 1 - Election Day 1533 578 37.70 290 89River Vale 2 - Election Day 2055 856 41.65 428 136River Vale 3 - Election Day 1486 632 42.53 328 110River Vale 4 - Election Day 1159 476 41.07 242 88River Vale 5 - Election Day 1231 493 40.05 229 83River Vale Mail-In Ballot - Mail-In B 0 134 0.00 96 25River Vale Provisional - Provisiona 0 10 0.00 4 4
Election Day Totals 7464 3035 40.66 1517 506
Mail-In Ballot Totals 0 134 0.00 96 25
Provisional Totals 0 10 0.00 4 4
District Totals - Absentee
District Grand TotalsCounty 7464 3179 42.59 1617 535River Vale 7464 3179 42.59 1617 535
Grand Totals 7464 3179 42.59 1617 535
November 15, 2017 8:39 am Page 218 of 219

Regi
stra
tion
Ballo
ts C
ast
Turn
out (
%)
ROCH
ELLE
PAR
K M
UNIC
IPAL
Yes
No
ROCHELLE PARK MUNICIPAL QUESTION
BERGEN COUNTY Statement of VoteBER_20171107_E
Rochelle Park 1 - Election Day 1001 472 47.15 221 58Rochelle Park 2 - Election Day 894 421 47.09 213 65Rochelle Park 3 - Election Day 852 413 48.47 224 44Rochelle Park 4 - Election Day 956 432 45.19 223 63Rochelle Park Mail-In Ballot - Mail 0 105 0.00 67 23Rochelle Park Provisional - Provis 0 16 0.00 12 1
Election Day Totals 3703 1738 46.93 881 230
Mail-In Ballot Totals 0 105 0.00 67 23
Provisional Totals 0 16 0.00 12 1
District Totals - Absentee
District Grand TotalsCounty 3703 1859 50.20 960 254Rochelle Park 3703 1859 50.20 960 254
Grand Totals 3703 1859 50.20 960 254
November 15, 2017 8:39 am Page 219 of 219