Embed Size (px)
Citation preview


Beresford Foreshore Coastal Protection and Enhancement–Master Plan Report Prepared for City of Greater Geraldton
MASTER PLAN REPORT March 2012 Version: 6 (Final) i
Cardno (WA) Pty Ltd
ABN 77 009 119 000
11 Harvest Terrace
West Perth WA 6005
PO Box 447, West Perth
Western Australia 6872 Australia
Telephone: 08 9273 3888
Facsimile: 08 94868664
International:+61 89273 3888
www.cardno.com
Document Control
Version Date Author Reviewer
1 Dec 2011 Jeff Allott JA Barbara Pedersen BP
2 Jan 2012 Jeff Allott JA Barbara Pederson BP
3 Mar 2012 Jeff Allott JA Barbara Pedersen BP
4 Mar 2012 Jeff Allott JA Barbara Pedersen BP
5 Mar 2012 Jeff Allott JA Barbara Pederson BP
6 Mar 2012 Jeff Allott JA Barbara Pederson BP
Filename MASTERPLAN REPORT_Final_28March2012.Docx
Author: Jeff Allott Position Title: Manager Landscape Architecture
Reviewer: Barbara Pedersen Position Title: Section Leader-Environmental Planning, Environment & Planning
Printed on 100% Australian Recycled Paper
"© 2012 City of Greater Geraldton All Rights Reserved. Copyright in the whole and every part of this document belongs to City of Greater Geraldton and may not be used, sold, transferred, copied or reproduced in whole or in part in any manner or form or in or on any media to any person without the prior written consent of City of Greater Geraldton.”

Beresford Foreshore Coastal Protection and Enhancement–Master Plan Report Prepared for City of Greater Geraldton
MASTER PLAN REPORT March 2012 Version: 6 (Final) ii
Executive Summary
Cardno (WA) Pty Ltd were engaged by the City of Geraldton – Greenough to provide professional design consultancy services for the Beresford Coastal Protection Project as outlined in the Councils Request for Tender Document, RFT Number; 27/1011. The reports, plans and cost estimates contained in this document presented herein represent the final outcomes in response to this RFT including the Stakeholder and Public Consultation process required as a part of the project process.
The Cardno Business Units involved in the preparation of this document include:
Cardno Coastal and Ocean; Cardno S.P.L.A.T.; Cardno Environmental Services; Cardno Traffic and Transport; and Cardno Civil and Infrastructure.
In summary, Cardno make the following recommendations to the City of Greater Geraldton and their associated Stakeholders in respect to the Beresford Foreshore Coastal Protection and Foreshore Enhancement works:
1) Option 1B as presented in this Master Plan Report should be implemented as a matter of urgency to protect the existing infrastructure along Chapman Road;
2) Option 3 (or variations of this Option) to be implemented over time based on monitoring the performance of the installed protective measures in respect to sand movement and replenishment requirements. Option 3 could be implemented in stages based upon the availability of funding.
The recommended design includes coastal structures to manage erosion along the Beresford Foreshore and also modifications to the ongoing management of the northern beaches at Geraldton to reduce erosion along the whole study are. The design solution proposed by Cardno is based on the predicted 50 year sea level changes rather than the 100 year sea level changes as requested in the RFT Document. Cardno believe that it is possible to accurately forecast for a 50 year interval in relation to the sea level changes, but continual monitoring of sea levels will be required to forecast for the 100 year sea level changes. In addition, current sea level rise forecast for 2110 conditions are sufficiently high that if this were to occur there would be major impacts on other infrastructure in the study area that was not part of the scope of this project. The preferred Concept Design proposed by Cardno is adaptable for the 2100 sea level rise scenario and will allow for modification of the installed protective measures from the 50 year to 100 year sea level changes with minimal impact upon to either the Foreshore Enhancement works or the infrastructure contained within the Chapman Road reserve.
The proposed staging of the works is as follows:
1) Ongoing Action: Modify the ongoing sand bypass programme which is currently undertaken for the Northern Beaches Stabilisation Program to improve the effectiveness of this ongoing management programme.
2) Immediate Action: Installation of two headlands spaced approximately 400 metres apart with adjacent buried seawalls along the southern section of Beresford Foreshore to offer immediate beach and coastal foreshore protection to the southern section of Beresford Foreshore and the section of Chapman Road that is currently most at risk.

Beresford Foreshore Coastal Protection and Enhancement–Master Plan Report Prepared for City of Greater Geraldton
MASTER PLAN REPORT March 2012 Version: 6 (Final) iii
3) Medium Term Action: Monitor and evaluate wave action to allow for considered implementation of further coastal protection structures.
4) Medium / Long Term Action: Installation of an additional two structures spaced approximately 400 metres apart to the northern end of Beresford Foreshore. Dependent upon available funding at the time, these two structures could be either rock structures as indicated on the presented Landscape Master Plan (refer to Figure 4.2) or could be headlands similar to the protection measures proposed for the southern end of Beresford Foreshore.
5) Long Term Action: Monitor the rate of sea level change to allow for considered changes of height to the protective structures at a later date.
6) Long Term Action: Adjust the heights of headlands and or rock structures based upon the outcomes of the continual monitoring programme.
While the installation of the headland and rock structures will not eliminate the need for ongoing sand replenishment along Beresford Foreshore, these structures will retain sand within defined compartments along the beach. However over the medium and longer term, periodic re-nourishment of the defined compartments will be required, particularly following a major storm. Bi-annual sand bypass from west of the Port of Geraldton will also need to be continued.
Cardno estimates that the following quantities of sand will be required for the initial beach renourishment and ongoing replenishment along Beresford Foreshore:
1) Initial renourishment: 60,000 m3
2) Ongoing bypass as part of the NBSP: 24,000m3 per year (≈12,000m3 every 6-months)
3) Re-nourishment of compartments: 60,000m3 every 10-years.

Beresford Foreshore Coastal Protection and Enhancement–Master Plan Report Prepared for City of Greater Geraldton
MASTER PLAN REPORT March 2012 Version: 6 (Final) Page 1
Table of Contents Executive Summary .............................................................................................................................. ii
1 Project Background ...................................................................................................................... 9
1.1 Scope of Work ......................................................................................................................... 9
1.1.1 Option 1 ........................................................................................................................... 9
1.1.2 Option 2 ........................................................................................................................... 9
1.1.3 Option 3 ......................................................................................................................... 10
1.1.4 Alternative Option .......................................................................................................... 10
1.2 Design Criteria ....................................................................................................................... 10
2 Coastal Protection ...................................................................................................................... 11
2.1 Introduction ............................................................................................................................ 11
2.2 Study Site .............................................................................................................................. 12
2.2.1 Site Visit ........................................................................................................................ 14
2.2.2 Geraldton Embayment’s Coastal Sediment Budget Study – Curtin University (2011) . 16
2.3 Coastal Engineering Design Requirements .......................................................................... 16
2.4 Study Methodology and Data Inputs ..................................................................................... 17
2.4.1 Data Inputs .................................................................................................................... 17
2.5 Wave Climate Study .............................................................................................................. 18
2.5.1 Model System ................................................................................................................ 18
2.5.2 Model Setup .................................................................................................................. 19
2.5.3 Calibration ..................................................................................................................... 21
2.5.4 Hindcast Simulations ..................................................................................................... 24
2.6 Sediment Transport and Shoreline Modelling ....................................................................... 25
2.6.1 Model Systems .............................................................................................................. 25
2.6.2 Model Setup .................................................................................................................. 26
2.6.3 Simulations and Investigations – Existing Shoreline Layout ......................................... 29
2.6.3.1 Near Shore Wave Directions ..................................................................................... 29
2.6.3.2 SBEACH Storm Erosion Profile Model...................................................................... 29
2.6.3.3 LITPACK Profile and Shoreline Model ...................................................................... 31
2.7 Concept Options ................................................................................................................... 35
2.7.1 Option 1 ......................................................................................................................... 35

Beresford Foreshore Coastal Protection and Enhancement–Master Plan Report Prepared for City of Greater Geraldton
MASTER PLAN REPORT March 2012 Version: 6 (Final) Page 2
2.7.2 Option 2 ......................................................................................................................... 37
2.7.3 Option 3 ......................................................................................................................... 38
2.8 Beach Nourishment Investigations ........................................................................................ 39
2.8.1 Option 1A Nourishment Profiles .................................................................................... 41
2.8.2 Option 1B Nourishment Profiles .................................................................................... 43
2.8.3 Recommended Nourishment Design: Preferred Design Concept (Option 1B) ............. 44
2.9 Shoreline Processes Investigations ...................................................................................... 45
2.9.1 Shoreline Evolution Modelling – Preliminary Options ................................................... 45
2.9.2 Shoreline Evolution Modelling: Preferred Design Concept (Option 1B) ....................... 50
2.9.3 Storm Erosion (Cross-Shore) ........................................................................................ 52
2.10 Coastal Structure Details ...................................................................................................... 53
2.10.1 Design Criteria ............................................................................................................... 53
2.10.1.1 Design Water Level ............................................................................................... 53
2.10.1.2 Design Wave Conditions ....................................................................................... 53
2.10.2 Headland ....................................................................................................................... 54
2.10.3 Shoreline Protection Structure – Preferred Design Concept (Option 1B) ..................... 55
2.10.4 Low Crest Structures – Options 2 and 3 ....................................................................... 55
2.11 Concluding Comments .......................................................................................................... 56
2.12 References ............................................................................................................................ 58
3 Recreation and Transport Works .............................................................................................. 59
3.1 Introduction ............................................................................................................................ 59
3.2 Foreshore Enhancement Master Plan .................................................................................. 59
3.2.1 Overview ....................................................................................................................... 59
3.2.2 Foreshore Protection ..................................................................................................... 59
3.2.3 Circulation and Access .................................................................................................. 60
3.2.4 Beachfront Amenities .................................................................................................... 61
3.2.5 Soft Landscape Works .................................................................................................. 61
3.3 Water Sensitive Urban Design .............................................................................................. 63
3.3.1 Introduction .................................................................................................................... 63
3.3.2 Modelling Parameters and Assumptions ...................................................................... 63

Beresford Foreshore Coastal Protection and Enhancement–Master Plan Report Prepared for City of Greater Geraldton
MASTER PLAN REPORT March 2012 Version: 6 (Final) Page 3
3.3.2.1 Rainfall Parameters ................................................................................................... 63
3.3.2.2 Infiltration Parameters ............................................................................................... 64
3.3.2.3 Sub-catchment Characteristics ................................................................................. 65
3.3.2.4 Treatment Area Assumptions .................................................................................... 65
3.3.3 Modelling Results .......................................................................................................... 65
3.3.4 References .................................................................................................................... 66
3.4 Traffic .................................................................................................................................... 67
3.4.1 Introduction .................................................................................................................... 67
3.4.2 Pedestrians and Cyclists ............................................................................................... 67
3.4.3 Public Transport ............................................................................................................ 67
3.4.3.1 Bus Movements ......................................................................................................... 67
3.4.3.2 Taxis .......................................................................................................................... 68
3.4.4 Car Parking ................................................................................................................... 68
3.4.5 Intersection Design ....................................................................................................... 68
3.4.6 Carriageway Design ...................................................................................................... 68
4 Coastal Engineering Costing ..................................................................................................... 69
4.1.1 Introduction .................................................................................................................... 69
4.1.2 Initial construction details .............................................................................................. 69
4.1.3 Initial cost estimates ...................................................................................................... 70
5 Community Consultation ........................................................................................................... 74
5.1 Introduction ............................................................................................................................ 74
5.2 Previous Community Consultation Studies ........................................................................... 74
5.3 Beresford Foreshore Community Feedback ......................................................................... 75
6 Conclusions and Recommendations ........................................................................................ 80
Appendix A Power Point Presentation
Appendix B Summary of Shoreline Wave Conditions – Existing Condition
Appendix C Time Series of Wave and Water Level Conditions for SBEACH Model – July 2010 Hindcast
Appendix D Community Consultation
Beresford Foreshore Coastal Protection and Enhancement–Master Plan Report Prepared for City of Greater Geraldton
MASTER PLAN REPORT March 2012 Version: 6 (Final) Page 4
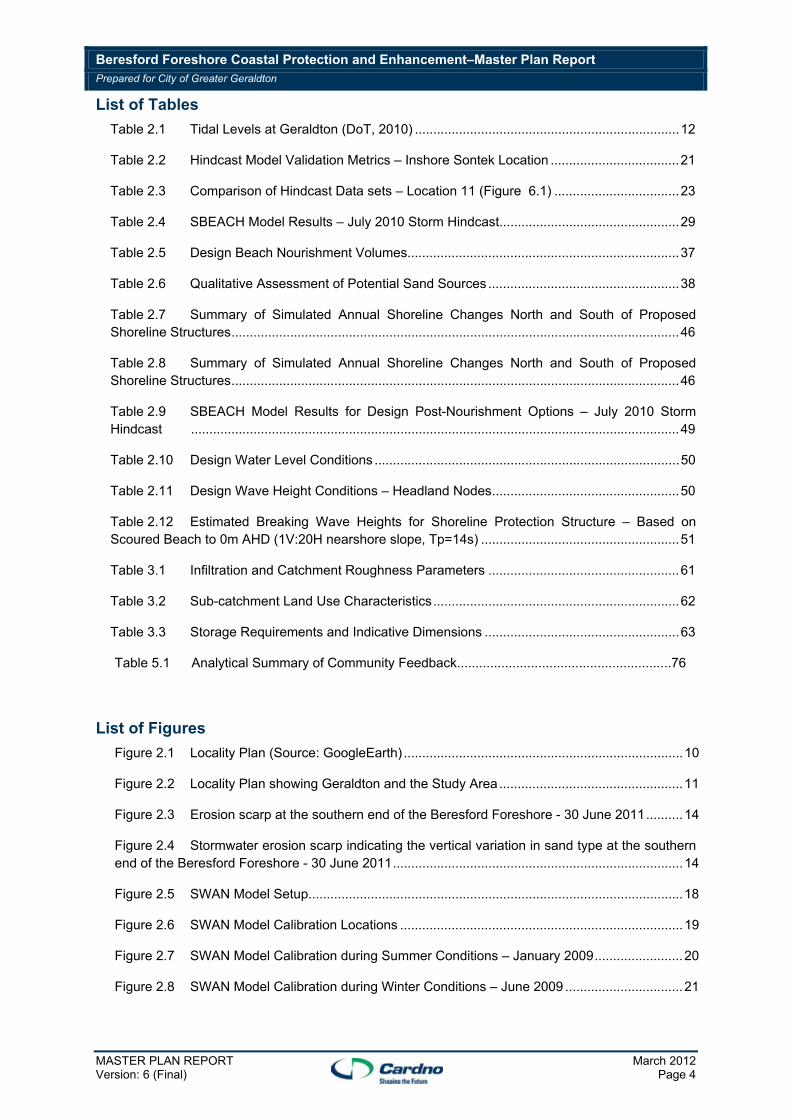
List of Tables
Table 2.1 Tidal Levels at Geraldton (DoT, 2010) ........................................................................ 12
Table 2.2 Hindcast Model Validation Metrics – Inshore Sontek Location ................................... 21
Table 2.3 Comparison of Hindcast Data sets – Location 11 (Figure 6.1) .................................. 23
Table 2.4 SBEACH Model Results – July 2010 Storm Hindcast ................................................. 29
Table 2.5 Design Beach Nourishment Volumes.......................................................................... 37
Table 2.6 Qualitative Assessment of Potential Sand Sources .................................................... 38
Table 2.7 Summary of Simulated Annual Shoreline Changes North and South of Proposed Shoreline Structures .......................................................................................................................... 46
Table 2.8 Summary of Simulated Annual Shoreline Changes North and South of Proposed Shoreline Structures .......................................................................................................................... 46
Table 2.9 SBEACH Model Results for Design Post-Nourishment Options – July 2010 Storm Hindcast ..................................................................................................................................... 49
Table 2.10 Design Water Level Conditions ................................................................................... 50
Table 2.11 Design Wave Height Conditions – Headland Nodes ................................................... 50
Table 2.12 Estimated Breaking Wave Heights for Shoreline Protection Structure – Based on Scoured Beach to 0m AHD (1V:20H nearshore slope, Tp=14s) ...................................................... 51
Table 3.1 Infiltration and Catchment Roughness Parameters .................................................... 61
Table 3.2 Sub-catchment Land Use Characteristics ................................................................... 62
Table 3.3 Storage Requirements and Indicative Dimensions ..................................................... 63
Table 5.1 Analytical Summary of Community Feedback..........................................................76
List of Figures
Figure 2.1 Locality Plan (Source: GoogleEarth) ............................................................................ 10
Figure 2.2 Locality Plan showing Geraldton and the Study Area .................................................. 11
Figure 2.3 Erosion scarp at the southern end of the Beresford Foreshore - 30 June 2011 .......... 14
Figure 2.4 Stormwater erosion scarp indicating the vertical variation in sand type at the southern end of the Beresford Foreshore - 30 June 2011 ............................................................................... 14
Figure 2.5 SWAN Model Setup...................................................................................................... 18
Figure 2.6 SWAN Model Calibration Locations ............................................................................. 19
Figure 2.7 SWAN Model Calibration during Summer Conditions – January 2009 ........................ 20
Figure 2.8 SWAN Model Calibration during Winter Conditions – June 2009 ................................ 21

Beresford Foreshore Coastal Protection and Enhancement–Master Plan Report Prepared for City of Greater Geraldton
MASTER PLAN REPORT March 2012 Version: 6 (Final) Page 5
Figure 2.9 Plan View of LITPACK and Shoreline Evolution Model Profile Locations ................... 25
Figure 2.10 Plan View of SBEACH Model Profile Locations ........................................................... 26
Figure 2.11 Plan View of Weighted Mean Wave Vectors ................................................................ 28
Figure 2.12 Pre-and-Post Storm Beach Profiles – SBEACH Model 2010 Hindcast Event ............. 29
Figure 2.13 Initial and Post 5-year Shoreline Plan Location (0m AHD Contour) – Southern Study Area Existing Shoreline Condition ................................................................................................... 30
Figure 2.14 Initial and Post 5-year Shoreline Plan Location (0m AHD Contour) – Northern Study Area Existing Shoreline Condition ................................................................................................... 31
Figure 2.15 Time series plot of the longshore sediment transport rate along the Beresford foreshore ...................................................................................................................................... 32
Figure 2.16 Plan View of Option 1 Layout ....................................................................................... 34
Figure 2.17 Plan View of Option 2 Layout ....................................................................................... 35
Figure 2.18 Plan View of Option 3 Layout ....................................................................................... 36
Figure 2.19 Comparison of Sediment PSD from the Northern Foreshore and the Western Side of Point Moore ...................................................................................................................................... 39
Figure 2.20 Existing (March 2010 – Quantum Survey) and Post-Nourishment Profile - Compartment 1 ................................................................................................................................. 40
Figure 2.21 Existing (March 2010 – Quantum Survey) and Post-Nourishment Profile - Compartment 2 ................................................................................................................................. 40
Figure 2.22 Initial and Post-5-Year Shoreline Position for Southern Beresford – Option 1 ............ 42
Figure 2.23 Initial and Post-5-Year Shoreline Position for Northern Beresford – Option 1 ............. 43
Figure 2.24 Initial and Post-5-Year Shoreline Position for Northern Beresford – Option 2 ............ 44
Figure 2.25 Initial and Post-5-Year Shoreline Position for Northern Beresford – Option 3 ............ 45
Figure 2.26 Initial and Post-10-Year Shoreline Position for Southern Beresford – Option 1B ........ 47
Figure 2.27 Initial and Post-10-Year Shoreline Position for Northern Beresford – Option 1B ........ 48
Figure 2.28 Preferred Option 1B Coastal Engineering Summary Plan ........................................... 54
Figure 3.1 Landscape Master Plan: Preferred Concept Design ................................ SP113701-006
Figure 3.2 Landscape Master Plan: Option Three .................................................... SP113701-002
Figure 3.3 Landscape Master Plan Staging .............................................................. SP113701-005
Figure 3.4 Landscape Mater Plan ............................................................................. SP113701-003
Figure 3.5 Landscape Maters Plan Plant Palette ...................................................... SP113701-004
Figure 3.6 IFD Chart ...................................................................................................................... 61
Figure 3.7 Catchment Plan ........................................................................................ SP113701-007

Beresford Foreshore Coastal Protection and Enhancement–Master Plan Report Prepared for City of Greater Geraldton
MASTER PLAN REPORT March 2012 Version: 6 (Final) Page 6
Figure 3.8 Traffic and Transport Ehnancements ....................................................... SP113701-008
Figure 4.1 Revetment Wall Concept Design ................................................................................. 70

Beresford Foreshore Coastal Protection and Enhancement–Master Plan Report Prepared for City of Greater Geraldton
MASTER PLAN REPORT March 2012 Version: 6 (Final) Page 7
Abbreviations and Glossary:
AHD Australian Height Datum which is the standard vertical elevation datum for Australia. At Geraldton, AHD is +0.55 m above Chart Datum at the permanent tide gauge.
ARI Average Recurrence Interval; relates to the probability of occurrence of a design event.
BoM Bureau of Meteorology
Coastal Inundation
Flooding of coastal land due to inundation by ocean waters.
CPS Coastal Processes Setback. As Defined in SPP 2.6.
Cross-shore Transport
Sediment transport occurring normal (or perpendicular) to the beach face.
CSIRO Commonwealth Scientific and Industrial Research Organisation
CVS Coastal Vulnerability Study
DCC Australian Department of Climate Change
DEM Digital Elevation Model
Depth of Closure
Term given to the deepest water depth where cross-shore wave driven sediment transport effectively becomes zero. Sometimes separated into an inner and outer closure depth. For this study, the closure depth has been nominally defined as the seaward limit of cross-shore sediment transport for the 12-hours per year wave condition.
DoP Department of Planning
DoT Department of Transport Coastal Management
Erosion Short-term erosion, typically associated with a specific storm event. May be referred to as storm bite. The beach will typically recover after an erosion event.
GIS Geographical Information System
HAT Highest Astronomical Tide
HSD Horizontal Setback Datum
Hb Breaking wave height.
Hmax Maximum wave height in a specified time period.
Hmo Significant wave height (Hs) based on the zeroth moment of the wave energy spectrum (rather than the time domain H1/3 parameter).
hPa hecta-Pascal
Hs Significant wave height is the average wave height of the highest third of a set of waves.
LAT Low Astronomical Tide
LiDAR Light Detection and Ranging
Longshore Transport
The movement of sand along the coastline caused by waves and a wave-caused current running parallel to the beach.
MHWM Mean High Water Mark
MHWN Mean High Water Neaps
MHWS Mean High Water Springs

Beresford Foreshore Coastal Protection and Enhancement–Master Plan Report Prepared for City of Greater Geraldton
MASTER PLAN REPORT March 2012 Version: 6 (Final) Page 8
MLWN Mean Low Water Neap
MLWS Mean Low Water Springs
MSL Mean Sea Level
NBSP Northern Beaches Stabilisation Program
Shoreline Recession
The long-term (decadal plus) net landward movement of the shoreline/mean water line. Occasionally referred to as long-term erosion.
SPP 2.6 Refers to Statement of Planning Policy No. 2.6 which is referred to as the State Coastal Planning Policy which was Gazetted in June 2003.
SLR Sea Level Rise
SLSC Surf Life Saving Club
Storm Surge Elevation in water levels along the coastline caused by wind set-up and the inverse barometer effect.
Tp Wave energy spectral peak period; that is, the wave period related to the highest ordinate in the wave energy spectrum.
Tz
Average zero-crossing period based on upward zero crossings of the still water line. An alternative definition is based on the zeroth and second spectral moments.
ToPH Town of Port Hedland
TSWL
Total Still Water Level - peak total water level including astronomical tide and the water level residual as a result oceanographic processes. In Western Australia, where applicable, for example on the open coast, the TSWL normally includes shoreline wave set-up (see below).
USACE United States Army Corps of Engineers
Water Level Residual
Water level difference between observed water level and the predicted (astronomical) water level.
Wave Height The height between the top of the crest and the bottom of the trough.
Wave Length The distance between two wave crests.
Wave Period The time it takes for two successive wave crests to pass a given point.
Wave Run-up The vertical distance between the maximum height that a wave runs up the beach (or a coastal structure) and the still water level, comprising tide, wave set-up and storm surge.
Wave Set-up Wave set-up is included implicitly in wave run-up calculations.
WAPC Western Australian Planning Commission
WRB Wave Rider Buoy

Beresford Foreshore Coastal Protection and Enhancement–Master Plan Report Prepared for City of Greater Geraldton
MASTER PLAN REPORT March 2012 Version: 6 (Final) Page 9
1 Project Background
The Master Plan Report is the detailed output for the City of Greater Geraldton RFT Number 27/1011: “Professional Consultancy and Architectural Services for the Beresford Foreshore Coastal Protection Project” issued in April 2011
1.1 Scope of Work
The scope is to develop a set of detailed concepts including drawings and design specifications that provide for coastal protection along the Beresford foreshore. It is imperative that the concepts developed:
1. Are driven by the requirement for coastal protection along this section of coastline;
2. Address the Western Australia Planning Commission position statement (State Planning Policy No. 2.6 State Coastal Planning) that adopts a likely 100-year sea-level rise scenario at 0.9m Due to the uncertainties associated with extrapolating sea level changes beyond a 50 year time frame, this study and associated recommendations are based upon providing protective measures for the predicted changes over the next 50 years and not 100 years. The recommendations presented in this report can incorporate alterations and additions to the protective measures proposed as required based upon additional data gathered by any on-going programme monitoring sea level changes.
3 Are based on detailed information on sea conditions impacted by wind, wave, swell, currents and weather systems for this section of coastline;
4 Show design drawings in both plan and aspect views;
5 Show proposed beach lines, sand nourishment locations, initial and annual sand nourishment volumes; potential sources of sand.
6 Allow for amenity and social infrastructure including transport options both the Beresford Foreshore and along Chapman Road .This is a multi-modal protection and improvement scheme and design considerations should be given to the accessibility requirements of all transport modes including pedestrians, cyclists, buses, taxis, scooter riders, motorcyclists, in addition to private cars.
The City requested that three beach protection options be explored within this project scope of works:
1.1.1 Option 1
Of the options contained in the Worley Parsons Study the concept presented in Figure 4.7 on page 114 of this study offers the best social outcome. Although this is the highest capital cost option contained within the study the whole of life costs are significantly less for this option than the Do Nothing option. Advice should be provided on design elements that minimise the need for sand nourishment.
1.1.2 Option 2
The City wishes to explore a series of coastal protection nodes along the foreshore working with the natural wave energy forces on this section of coastline. This idea seeks inspiration from The Strand at Townsville which has been in place since the mid 1990s. This option includes two wide groynes that

Beresford Foreshore Coastal Protection and Enhancement–Master Plan Report Prepared for City of Greater Geraldton
MASTER PLAN REPORT March 2012 Version: 6 (Final) Page 10
can offer the coastal protection required whilst offering utilization as recreation hubs. A hidden sea wall to the north of the northernmost groyne will provide protection from erosive forces.
It is acknowledged that this will be a high cost option and is a variation of the options presented in the Worley Parsons Study. However, such a solution may achieve the best social outcome whilst offering coastal protection to a larger portion of the Beresford foreshore.
1.1.3 Option 3
This option is a variation of Option 2 and includes a third groyne that will offer coastal protection for the entire Beresford foreshore. A cost-benefit analysis should be undertaken to assess the feasibility of this option.
1.1.4 Alternative Option
The City welcomes an alternative option from the Respondent, but it should adhere to the scope presented in earlier in this section.
1.2 Design Criteria
The major focus shall be to develop coastal protection concepts based on the options presented in Section 2.2 of the Request for Tender documents. The successful Consultant shall demonstrate that the options will successfully be able to mitigate erosive forces along the section of coastline they are intended to protect. It is expected that this would include detailed computer modelling. The deliverable shall include but is not limited to:
a detailed concept design of the preferred coastal protection option suitable to proceed to detailed engineering design. Refer to Section 2.
a detailed concept design that incorporates recreational public open space and transport improvements. Refer to Section 3.
a detailed concept design with detailed and accurate cost estimates – it is intended that these cost estimates will be utilised to seek funding support for this project and are an important component of this project. Refer to Section 4.
Beresford Foreshore Coastal Protection and Enhancement–Master Plan Report Prepared for City of Greater Geraldton
MASTER PLAN REPORT March 2012 Version: 6 (Final) Page 11
2 Coastal Protection
2.1 Introduction
This report has been prepared by Cardno following engagement by the City of Greater Geraldton to provide Professional Consultancy and Architectural Services for the Beresford Foreshore Coastal Protection Project (Contract 27/1011). This report presents the concept design details and coastal engineering inputs for three potential coastal protection options for the study area.
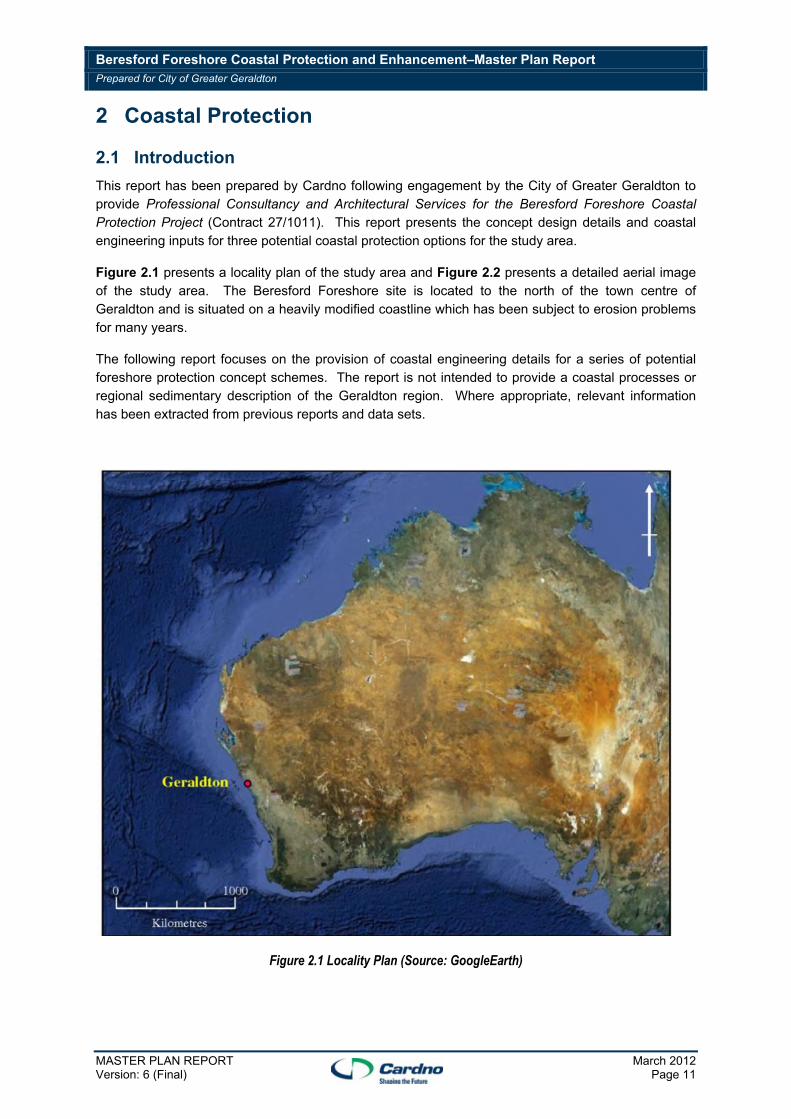
Figure 2.1 presents a locality plan of the study area and Figure 2.2 presents a detailed aerial image of the study area. The Beresford Foreshore site is located to the north of the town centre of Geraldton and is situated on a heavily modified coastline which has been subject to erosion problems for many years.
The following report focuses on the provision of coastal engineering details for a series of potential foreshore protection concept schemes. The report is not intended to provide a coastal processes or regional sedimentary description of the Geraldton region. Where appropriate, relevant information has been extracted from previous reports and data sets.
Figure 2.1 Locality Plan (Source: GoogleEarth)
Beresford Foreshore Coastal Protection and Enhancement–Master Plan Report Prepared for City of Greater Geraldton
MASTER PLAN REPORT March 2012 Version: 6 (Final) Page 12
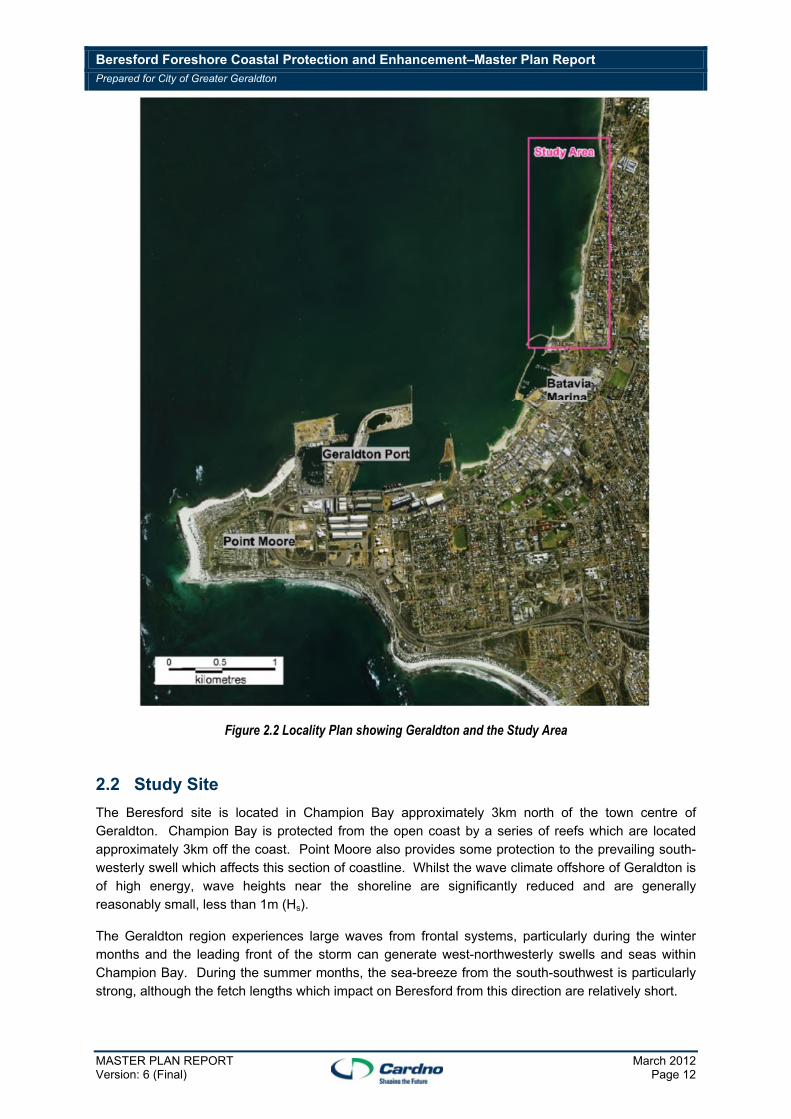
Figure 2.2 Locality Plan showing Geraldton and the Study Area
2.2 Study Site
The Beresford site is located in Champion Bay approximately 3km north of the town centre of Geraldton. Champion Bay is protected from the open coast by a series of reefs which are located approximately 3km off the coast. Point Moore also provides some protection to the prevailing south-westerly swell which affects this section of coastline. Whilst the wave climate offshore of Geraldton is of high energy, wave heights near the shoreline are significantly reduced and are generally reasonably small, less than 1m (Hs).
The Geraldton region experiences large waves from frontal systems, particularly during the winter months and the leading front of the storm can generate west-northwesterly swells and seas within Champion Bay. During the summer months, the sea-breeze from the south-southwest is particularly strong, although the fetch lengths which impact on Beresford from this direction are relatively short.

Beresford Foreshore Coastal Protection and Enhancement–Master Plan Report Prepared for City of Greater Geraldton
MASTER PLAN REPORT March 2012 Version: 6 (Final) Page 13
The Geraldton region is located within a diurnal, micro-tidal environment. Table 2.1 summarises the key tide levels at the site. Storm water levels frequently exceed Highest Astronomical Tide (HAT) at Geraldton. Australian Height Datum (AHD) is 0.55m above chart datum at Geraldton.
Table 2.1: Tidal Levels at Geraldton (DoT, 2010)
Tide Level m Chart Datum
HAT 1.2
MHHW 1.0
MLHW 0.8
MSL 0.6
MHLW 0.4
MLLW 0.2
LAT 0
The shoreline between Point Moore and the Chapman River entrance have been affected significantly by coastal developments, principally the Port of Geraldton and the Batavia Marina. These developments have affected the sediment transport processes in Champion Bay and have interrupted the natural, variable longshore sediment drift. CES (2001) estimates that the coastal developments within Champion Bay have reduced the sand supply to the northern beaches (including Beresford) of Geraldton to 10,000m3 to 15,000m3 per year.
Over the last 20-years, a large number of shoreline protection schemes have been implemented at Geraldton. This work has included the construction of a groyne system and sand nourishment at the beaches near the town centre and a number of shoreline protection schemes for the northern beaches. As documented in the Coastal Processes Study (Worley, 2010), between 1991 and 2001, 30,000m3 to 50,000m3 of nourishment sand was supplied to the northern beaches to assist in maintaining the beach position. In 2004, a major nourishment programme was implemented for the Beresford area as part of the Geraldton Northern Foreshore Stabilisation and Enhancement Strategy. Worley (2010) indicate that nourishment of 89,000m3 of sand was undertaken in 2004. This sand was sourced from the Southern Transport Corridor project (STC sand). Bailey (2005) indicates that post-nourishment survey indicated the loss of nourishment sand was significant and the average northward sediment transport of 50,000 m3/year was estimated.
In 2005, a detached breakwater was constructed 400m north of the Batavia Coast Marina – see Figure 2.2. This structure has assisted in protecting the shoreline, particularly between the Batavia Coast Marina and the breakwater. The breakwater has reduced the northerly longshore transport rate, but the beach volume has been decreasing continuously (Worley, 2010). Since 2005, the regular shoreline monitoring data collected by Quantum Survey (2010) for the northern beaches indicates that to the north of the detached breakwater average annual recession rates in the absence of the ongoing nourishment is approximately 2m per year. This outcome was based on the survey lines N7 to N10 and surveys from March 2006 to September 2007 during which time there was no beach nourishment. A similar outcome was determined using surveys from 2006 to 2010 when there was some beach nourishment work undertaken. This rate of shoreline recession was used to verify the performance of the shoreline plan development model.

Beresford Foreshore Coastal Protection and Enhancement–Master Plan Report Prepared for City of Greater Geraldton
MASTER PLAN REPORT March 2012 Version: 6 (Final) Page 14
Between 2001 and 2010, as part of the Northern Beaches Stabilisation Programme (NBSP), the Geraldton Port Authority (GPA) has provided approximately 90,000m3 of sand nourishment to the northern beaches as part of their bi-annual bypass of sand from Pages Beach (Worley, 2010). The NBSP is monitored through annual surveys undertaken by Quantum Surveys Pty Ltd.
2.2.1 Site Visit
On 29 and 30 June 2011, Cardno undertook a site visit of the Beresford foreshore to inspect the current shoreline condition. Cardno undertook a walkover of the study area with representatives from CGG to discuss issues and options for the study area. The site inspection highlighted the generally degraded nature of the shoreline and as a storm had passed through the region in the preceding days, erosion issues were clearly evident. In the southern area of the study region between the Batavia Coast Marina and the offshore breakwater, a steep erosion scarp was evident at the back of the beach as illustrated in Figure 2.3. An inspection of the vertical sand composition profile surrounding the erosion scarp highlight that there is a variety of sediment types within the beach system that vary in colour and physical grain size. A range of sand colours can be seen in Figure 2.3. The offshore breakwater can be seen in the background, together with a low tombolo. It is likely this physiographic feature blocks approximately 80% of the potential northwards longshore transport, allowing less than 1,000 m3/yr to bypass the offshore breakwater.
The upper section of erosion scarp is generally composed of fine white sand which is most likely to be the bypass material sourced from Pages Beach, which MRA (2003) identified had a median grain size (d50) of 0.14mm. The lower section of the scarp and the active beach at the time of the inspection is composed of a different sand type which is more yellow in colour and generally appears to be a coarser material. Figure 2.4 presents a photograph of an erosion gully that was cut by stormwater flowing through the dune at the southern end of the Beresford foreshore. At the base of the erosion cut, the coarser yellow sand is clearly evident.
CES (2001) indicated that along the Beresford shoreline areas the typical d50 of the sediment was approximately 0.22mm which increased up to approximately 0.3mm north of the Chapman River. Based on the observations from the site inspection, the fine, white sand, which is present in the active beach and dune system at Beresford, appears to be highly mobile and erosive under the prevailing wave climate at the Beresford site.
The site inspection highlighted some of the constraints on coastal engineering options available at the Beresford site including:-
The low lying level of the surrounding land, particularly in the northern areas of the study site;
Variable sediment composition of the existing beach and dune system; and
The highly modified condition of the sediment transport processes in the Champion Bay region that contributed to shoreline erosion issues between Point Moore and the Chapman River.

Beresford Foreshore Coastal Protection and Enhancement–Master Plan Report Prepared for City of Greater Geraldton
MASTER PLAN REPORT March 2012 Version: 6 (Final) Page 15
Figure 2.3: Erosion scarp at the southern end of the Beresford Foreshore - 30 June 2011
Figure 2.4: Stormwater erosion scarp indicating the vertical variation in sand type at the southern end of the Beresford Foreshore- 30 June 2011

Beresford Foreshore Coastal Protection and Enhancement–Master Plan Report Prepared for City of Greater Geraldton
MASTER PLAN REPORT March 2012 Version: 6 (Final) Page 16
2.2.2 Geraldton Embayment’s Coastal Sediment Budget Study – Curtin University (2011)
Curtin University is undertaking a detailed study of the sediment pathways and budget within the Geraldton embayments as part of the Coastal Vulnerability and Risk Assessment Program (CVRAP). The study is focused on “understanding the sources and transport pathways of sand is essential to understanding the long term implications of climate change on coastal erosion and recession. This study will provide vital information to inform the City of Geraldton and other stakeholder in determining long term management of the Geraldton coastline and allow the development of planning and adaptation measures.”(Curtin 2011)
Cardno has been provided with a copy of the first year report which was prepared in March 2011 (Curtin, 2011). The scope of the Curtin study is very extensive and Cardno have reviewed the report to assist in obtaining information and understanding to assist in the Beresford foreshore project. The quality of the study and reporting is very high and the outputs presented in Curtin (2011) have provided very valuable quantitative information which has been applied in the coastal engineering design.
The key outputs from Curtin study which are relevant to the project are:-
The regional sediment transport budget has confirmed the impact on sedimentary processes along the Beresford foreshore from the development of the port and other coastal infrastructure in Geraldton region.
The preliminary sediment budget from the Curtin study also indicates that the navigation channel as well the shoreline structures from the Port of Geraldton reduce the littoral drift sand supply for the northern foreshore.
Nourishment material from Pages Beach immediately west of the port is significantly finer than the residual sand along the northern foreshore.
On the western side of Point Moore, the beach sediments are coarser than at Pages Beach and may be a suitable nourishment or bypass sand source.
2.3 Coastal Engineering Design Requirements
Cardno held an inception meeting with the City of Geraldton-Greenough (CGG) on 29 July 2011. The meeting was attended by a number of Council representatives and stakeholders, including the Department of Transport, Geraldton Port Authority and the Northern Agricultural Catchments Council (NACC).
At that meeting, CGG confirmed their tender requirements for this study and also those areas that the Beresford Foreshore Protection project was required to address. The primary project-drivers required from the CGG were a robust design and life cycle costing of a selected shoreline protection system that would enhance the foreshore of the Beresford area. In addition to these primary objectives, the CGG and the other stakeholders indicated that the design must be adaptable to future climate change, did not adversely affect other shorelines, in particular areas further north of the study site, and that the design incorporated due consideration of the overall sedimentary processes of the area.

Beresford Foreshore Coastal Protection and Enhancement–Master Plan Report Prepared for City of Greater Geraldton
MASTER PLAN REPORT March 2012 Version: 6 (Final) Page 17
2.4 Study Methodology and Data Inputs
The following stages have been undertaken to date for the coastal engineering design stage of the Beresford Foreshore Project.
1. Meet and discuss requirements of the CGG and with stakeholder representatives of the overall project;
2. Inspect the study area and work with the overall study team and CGG to identify potential options and opportunities for the coastal engineering investigations and outcomes in the scheme of the overall project;
3. Compile and review existing data and reports to understand previous investigations and construction work at the study area and the historical and spatial context of the Beresford Foreshore site;
4. Liaise with the Department of Transport and Curtin University on the regional sediment transport study which is being undertaken to identify potential linkages with the Beresford Foreshore project;
5. Develop and calibrate a wave model system of the study area using the available bathymetric and offshore/inshore wave data;
6. Prepare hindcast time-series wave data for a large number of near shore output locations using the historical wave data and for 2060 and 2110 sea-level rise scenarios;
7. Develop a shoreline evolution modelling system and validate the model system to historical survey data and outcomes from earlier studies;
8. Develop up to three concept options which will then be examined using numerical models and also analytical approaches;
9. Qualitatively and quantitatively compare the concept options and identify a preferred option to present for consultation with CGG; and
10. Prepare coastal engineering design details sufficient for utilisation by the landscape design team and for consultation with CGG and stakeholders.
As part of the project brief, three preliminary coastal engineering options were presented for the Beresford foreshore protection – Refer Section 1. These three options provided the basis for the concept designs which have been addressed in this report.
2.4.1 Data Inputs
Cardno obtained a number of data inputs to assist in this study and the principal data sources include:-
CoGG:
o Base GIS inputs,
o Previous reports including the 2010 coastal processes study (Worley, 2010).
Beresford Foreshore Coastal Protection and Enhancement–Master Plan Report Prepared for City of Greater Geraldton
MASTER PLAN REPORT March 2012 Version: 6 (Final) Page 18
Port of Geraldton:
o Wave, wind and tide data since 2001 measured as part of GPA’s met-ocean monitoring system.
o Historical survey data and sand bypass information from the Northern Beaches Stabilisation Programme.
o Historical reports including CES (2001).
o Historical aerial photography.
Department of Transport:
o Measured water level from the Geraldton Harbour tide gauge.
o Compiled bathymetric survey data.
Curtin University Study: Cardno has discussed potential data inputs from the Curtin University regional study and a copy of the 2011 draft report (Curtin, 2011) has been provided to Cardno. At this stage, no outputs from the Curtin study have been presented in this report. However, the information within the Curtin report have been utilised to understand regional sedimentary processes and to assist in identifying suitable nourishment sources. Cardno have presented some of the actual sediment data which is presented in Curtin (2011) but have excluded any of the analysis and interpretation which is contained within that document.
Other data sources include:
o Tidal constituents from Australia Hydrographic Office (AHO, 2009).
o Regional scale bathymetric data from Geoscience Australia’s 9-second DEM (Geoscience Australia, 2009).
2.5 Wave Climate Study
2.5.1 Model System
Cardno developed a SWAN wave model system to transfer wave conditions, measured outside the entrance to the Geraldton harbour navigation channel, to the shoreline areas along the study site. SWAN is a third generation wind/wave modelling system which is incorporated as a module into the Delft3D modelling system. This model was developed at the Delft Technical University and includes wind input (local sea cases), combined sea and swell, offshore wave parameters (swell cases), refraction, shoaling, non-linear wave-wave interaction, a full directional spectral description of wave propagation, bed friction, white capping, currents and wave breaking.
SWAN includes a nested grid capability that allows coarser grids in deeper water and finer grids in shallow water where better definition of seabed form and depth are needed. Output from the model includes significant wave height, dominant wave direction, spectral peak and mean periods and (optionally) the full directional wave spectra at selected grid points.
Cardno has applied the SWAN model to coastal wave process investigations at a large number of locations around Australia and overseas. Cardno have calibrated the model system at a number of locations around Australia including Moreton Bay, Botany Bay, Cockburn Sound and Port Hedland.

Beresford Foreshore Coastal Protection and Enhancement–Master Plan Report Prepared for City of Greater Geraldton
MASTER PLAN REPORT March 2012 Version: 6 (Final) Page 19
2.5.2 Model Setup
The following bathymetric data and survey data was used in the model setup to create a DTM for the study area:-
DoT Multibeam Hydrographic Survey Dec 2009 and October 2010 (GN-1012-s);
DoT Hydrographic Survey Soundings : June-October 1998 (CY98AGD);
DoT Hydrographic Survey Feb 1990 (OA90);
DoT Hydrographic Survey 1972 (OA72A);
GPA - Beach profile survey data collected by Quantum Surveys from March 2010 at Pages Beach, Town Beach and the Northern Beaches between the Batavia Coast Marina and the Chapman River; and
Geoscience Australia Bathymetric Data Set.
A nested SWAN model was setup to model the wave field, driven by the Geraldton offshore Waverider buoy data (moored at 28.757 S , 114.565 E in a depth of 13m at datum AHD). The grid size was 25m through the offshore region from south of Point Moore to the Chapman River, with a refined grid in the near shore region of the Beresford Foreshore redevelopment area at 5m resolution. The setup of this model is shown in Figure 2.5.

Beresford Foreshore Coastal Protection and Enhancement–Master Plan Report Prepared for City of Greater Geraldton
MASTER PLAN REPORT March 2012 Version: 6 (Final) Page 20
Figure 2.5: SWAN Model Setup
The historical record from the offshore WRB was used as the boundary condition for the model. Directional data from March 2004 to September 2009 was obtained from the GPA at this location and non-directional data was provided from January 2000 to March 2004, and from October 2009 to September 2010. An additional SWAN coarse grid (1km) extending offshore and driven by the Wavewatch3 Global wind/wave model was used to supplement the wave direction in the non-directional datasets.
The historical water level record at Geraldton was obtained from the DoT allowing the wave model to apply a varying water level over the hindcast period.
The extended area of shallow reef present in the near shore area is a complex environment to model as it causes a reduction of wave energy through refraction and shoaling, and occasional wave breaking from time-to-time. This effect was represented in the model through the adoption of a high bed friction factor (JONSWAP = 0.25) and wave breaking term of 0.55 (approximate flat bed wave breaking index) to account for energy losses across the reefs.

Beresford Foreshore Coastal Protection and Enhancement–Master Plan Report Prepared for City of Greater Geraldton
MASTER PLAN REPORT March 2012 Version: 6 (Final) Page 21
2.5.3 Calibration
The SWAN model was calibrated to recorded data received from the GPA from a non-directional Sontek instrument at the entrance to the Geraldton Port (28.763 S 114.600 E, in an approximate depth of 9m at datum AHD). The position of the Sontek instrument in relation to the Geraldton Port WRB is shown in Figure 2.6.; near Beacon 17.
Figure 2.6: SWAN Model Calibration Locations
The model was calibrated to a summer and a winter period recorded concurrently by the Sontek instrument and Geraldton offshore WRB setup; because of the variation in seasonal offshore wave directions.
The summer period was assessed for January 2009 and is shown on Figure 2.7.

Beresford Foreshore Coastal Protection and Enhancement–Master Plan Report Prepared for City of Greater Geraldton
MASTER PLAN REPORT March 2012 Version: 6 (Final) Page 22
Figure 2.7: SWAN Model Calibration during Summer Conditions – January 2009

Beresford Foreshore Coastal Protection and Enhancement–Master Plan Report Prepared for City of Greater Geraldton
MASTER PLAN REPORT March 2012 Version: 6 (Final) Page 23
The winter period was assessed for June 2009 and is shown on Figure 2.8.
Figure 2.8: SWAN Model Calibration during Winter Conditions – June 2009
Table 2.2 presents inshore calibration site validation metrics for wave height and period for the two validation periods which indicate that the SWAN model exhibits a positive bias for wave height January and June. The correlation coefficients indicate a reasonable level of calibration and are suitable for the purposes of coastal processes investigations and development of shoreline protection options. Similarly calibrated wave models have been successfully applied by Cardno for shoreline protection projects including at Alkimos (Perth) and for the Wollongong Coastal Hazard study (Wollongong City Council, NSW).
Table 2.2: Hindcast Model Validation Metrics – Inshore Sontek Location
January 2009
Correlation Coefficient
RMS Error
Hm0 0.86 0.17
Tp 0.54 3.22
June
2009
Correlation Coefficient
RMS Error
Hm0 0.76 0.36
Tp 0.64 2.40

Beresford Foreshore Coastal Protection and Enhancement–Master Plan Report Prepared for City of Greater Geraldton
MASTER PLAN REPORT March 2012 Version: 6 (Final) Page 24
These results show that the SWAN model system provides a reliable tool for transforming offshore waves to inshore locations. No recorded data at more shallow locations was available to confirm that further shoreward propagation was described well. Based on the winter period validation, it is possible that that SWAN model is over estimating wave heights during winter however the SWAN indicates that between the northern and southern sides of the navigation channel there is a significant difference in the wave heights which are generally higher on the northern side of the channel. The Beacon 17 location is not an ideal location to calibrate a wave model for the Beresford region due to the steep channel batters and curve in the navigation channel to the north. In order to confirm the wave climate at Beresford, DoT should consider deploying an AWAC or similar instrument to sample waves and currents immediately offshore of the Beresford site. Figure 2.28 presents a potential AWAC location which may provide useful wave and current data for future investigations associated with sediment transport along the northern beaches of Geraldton and for assessing whether future stages to the coastal protection are required.
2.5.4 Hindcast Simulations
Following completion of the model calibration stage, the model system was used to prepare the following hindcast wave data sets:-
5-year hindcast data set from 2001 to 2005 which utilises measured wave height and period data at the offshore end of the model system which extends to seaward of the Geraldton navigation channel. Wave direction information has been based on transferred wave directions from the global NOAA Wavewatch III model hindcast data set.
5-year hindcast data set from 2005 to 2010 which utilises measured wave height, period and direction data at the offshore end of the model system which extends to seaward of the Geraldton navigation channel. Wave height and periods are generally derived from the Waverider Buoy measurements and wave directions from the AWAC instrument near the entrance to the navigation channel – see Figure 2.6. For periods of time when no wave direction data was available, wave direction information has been based on transferred wave directions from the global NOAA Wavewatch III model hindcast data set.
5-year hindcast data set from 2005 to 2010 including a 2060 sea level rise scenario of +0.3m.
5-year hindcast data set from 2005 to 2010 including a 2110 sea level rise scenario of +0.9m.
For all hindcast data sets, wave data has been saved at 3m and 1m depths (to 0m AHD) along the whole Beresford shoreline with output locations at approximately 20m spacing. The hindcast wave data from selected output locations has been used in shoreline evolution modelling and also to determine design criteria.
Table 2.3 compares the effective wave height, mean direction and the standard deviation for the different hindcast periods and data sets. The 2001 to 2005 data appears to be bias towards more southerly waves as the hindcast wave directions are dominated by the offshore SW swell and there is a lack of more westerly to north-westerly wave conditions. The more reliable 2005 to 2010 period has a greater average wave height and more variability in the wave direction. Sea level rise increases the effective wave height at Location 11 (Figure 2.9) by nearly 20% for the 2110 scenario.

Beresford Foreshore Coastal Protection and Enhancement–Master Plan Report Prepared for City of Greater Geraldton
MASTER PLAN REPORT March 2012 Version: 6 (Final) Page 25
Table 2.3: Comparison of Hindcast Data sets – Location 11 (Figure 6.1)
Hindcast Data Set
Heff (m) Dir (Mean
Weighted Deg) Std. Dev. Dir
(deg)
2001-2005 0.61 276.5 3.7
2005-2010 0.68 278.0 4.1
2001-2010 0.64 277.4 3.9
2005-2010 + 0.3m SLR
0.73 274.5 8.0
2005-2010 + 0.9m SLR
0.77 273.1 7.7
2.6 Sediment Transport and Shoreline Modelling
2.6.1 Model Systems
Cardno has utilised a number of model systems to undertake the sediment transport and shoreline modelling for the Beresford project including the development of a shoreline model specifically for this project.
A number of model systems have been applied in this project, with each model investigating a specific sediment transport and shoreline evolution aspect. The model systems which have been utilised are:-
DHI LITPACK model system to investigate longshore transport rates for a range of profile and wave conditions;
SBEACH model system to simulate storm erosion processes; and
A shoreline evolution model developed specially for this project which applied the outputs from the LITPACK model system and the wave hindcast data to simulate longshore sediment transport and shoreline evolution along the study area, including the presence of structures.
It should be noted that sediment transport and shoreline modelling has a degree of uncertainty which is greater than with modelling other coastal processes – for example waves or currents. Whilst a calibrated model may be able to match the general changes in shoreline position over time, there can be considerable uncertainty in the outputs from a calibrated model. For this reason, the shoreline response modelling undertaken in this project has been just one of the tools utilised in the development of the coastal engineering design. The other tools utilised in the design process include analysis of historical data and simple empirical models.

Beresford Foreshore Coastal Protection and Enhancement–Master Plan Report Prepared for City of Greater Geraldton
MASTER PLAN REPORT March 2012 Version: 6 (Final) Page 26
Another important aspect at Beresford is the fact this shoreline is a perched beach influenced by underlying rock which, particularly when the beach becomes eroded, limits the potential longshore and cross-shore sediment transport. Whilst this process can be accounted for in the cross-shore storm erosion modelling to some extent, the longshore transport and shoreline evolution modelling has neglected this process and as a result the model system is likely to overestimate transport and erosion rates for an eroded beach condition which would have exposed rock present. The dynamics of perched beaches are quite different to a straight sandy beach and are more complex than represented within the numerical models applied in this study. Any numerical sediment transport or shoreline response model represents sediment transport processes in a simplified manner. For this study, Cardno have utilised well validated and robust numerical model systems, and have even developed a customised shoreline response model to more reliability model the shoreline response for the base case and the various shoreline protection options that have been assessed in this project. In addition to numerical modelling, Cardno have also assessed shoreline protection options based on historical trend observations and the application of simple empirical models, principally documented in USACE (2002), which have been developed from similar shoreline protection projects.
2.6.2 Model Setup
The LITPACK modelling system has been developed by the Danish Hydraulics Institute. It is used internationally for assessment of coastal processes. LITPACK includes a number of modules. One of these, LITDRIFT, computes longshore sediment transport from a time-series of wave parameters. Natural beach profiles, graded sediments, currents, wind and bed roughness are included. Generally the highest transport rate occurs in the breaking wave zone. LITDRIFT output includes the shore normal variation of longshore transport magnitude across the profile.
LITDRIFT uses the basic Engelund and Fredsoe (1976) transport formulation which includes combined wave and current motion as well as bed and suspended sediment loads. It takes account of the threshold shear stress for initiation of sediment transport through the Shields Parameter.
LITDRIFT was applied to the calculation of longshore transport at 28 shore normal locations between the Batavia Coast Marina and 600m beyond the last possible groyne structure within the study area – see Figure 2.9.. At each of these locations, sets of longshore transport tables were developed for ranges of wave direction of +-25o from the individual shore normal directions, for 6 wave periods (Tz) from 2.5 to 15 seconds and for 6 wave heights (Hrms) from 0.1m to 1.35m. Each of the 28 profiles extended from 3m to -3m AHD, that is, to the approximate closure depth for wave caused sediment transport in most expected wave conditions at this site. A D50 parameter of 0.2mm was adopted with a bed friction (Kn) of 0.004m. Actual shore normal profiles were adopted.
An important feature of LITDRIFT is that it can describe the distribution of sediment transport across the shore normal beach profile. Hence, when groynes are included, or similar shore normal structures block some if the longshore transport, the extent of bypassing can be estimated from this distribution and the length of the structure. This information was used to determine the extent of sand bypassing required for the three coastal protection options assessed.

Beresford Foreshore Coastal Protection and Enhancement–Master Plan Report Prepared for City of Greater Geraldton
MASTER PLAN REPORT March 2012 Version: 6 (Final) Page 27
Because LITLINE can only apply one offshore wave climate time series to a modelled area, and the SWAN wave modelling showed significant variation in wave parameters at the -3m AHD depth along the study area, it was necessary to include these along-coast variations in wave conditions in the coastline evolution modelling. Hence Cardno’sinhouse shoreline development model was used instead of LITLINE. This system is similar to LITLINE in that it applies the Pelnard-Considere one-line principal and includes the effects of groynes (and revetments, if needed). Sand bypassing by short groynes is included. The down-drift boundary condition (beyond the northern extent of the immediate study area, is set on the basis a constant transport gradient. This avoids ‘clamping’ of the shoreline at zero movement which can then impose unrealistic boundary effects on the solution inside the model.
Figure 2.9: Plan View of LITPACK and Shoreline Evolution Model Profile Locations

Beresford Foreshore Coastal Protection and Enhancement–Master Plan Report Prepared for City of Greater Geraldton
MASTER PLAN REPORT March 2012 Version: 6 (Final) Page 28
The SBEACH model has been developed to specifically investigate cross-shore shoreline erosion during severe storms. The model has been setup to investigate erosion for the existing condition and also the post nourishment layout for the concept options at five selected profile locations – see Figure 2.10. SBeach was developed by the USACE to investigate storm induced profile response on fine to medium grain sand beaches. It is an empirically based model which includes wave shoaling, refraction, breaking, setup and run-up. The model can simulate a temporally varying breakpoint which produces offshore bar migration. The model has been widely applied at sites all over the world and has demonstrated reasonable levels of calibration. A feature of SBeach is that underlying rock layers can be specified in the model and where it was evident in the aerial photography, rock at the back of the beach was included in the modelling. For the present investigations, a single storm event from around July 8 to 10, 2010 has been applied in the profile modelling. This particular storm produced moderately large wave conditions along the Beresford Foreshore and also a very high water level.
Figure 2.10: Plan View of SBEACH Model Profile Locations

Beresford Foreshore Coastal Protection and Enhancement–Master Plan Report Prepared for City of Greater Geraldton
MASTER PLAN REPORT March 2012 Version: 6 (Final) Page 29
2.6.3 Simulations and Investigations – Existing Shoreline Layout
2.6.3.1 Near Shore Wave Directions
A preliminary assessment of the post-option construction shoreline orientations has been undertaken based on analysis of the spatial variation in the mean near shore wave direction along the study area shoreline. The hindcast wave data has been used to develop the weighted mean wave directions which can be calculated according to Equation 2.1:
∅∑ ∅
∑ (Equation 2.1)
This weighting takes into account the approximate dependency of longshore transport on wave period and the square of wave height. That is, higher wave height, longer period events have more sediment transport power and need to be given ‘more weight’ in wave direction considerations. The long term along shore shoreline orientation within each ‘groyne compartment’ will be approximately normal to the weighted mean wave direction at a particular location. Based on the existing sea level hindcast wave data, the shore normal wave direction has been calculated every 20m along the study area shoreline to estimate the likely shoreline alignments within each compartment.
Figure 2.11 presents a plan view of the shore-normal weighted mean wave directions based on an analysis of five-years of wave hindcast data (2004 to 2009). Appendix B presents a table of hindcast weighted mean wave directions, effective wave heights and profile closure depths at the hindcast wave locations along the study area. The definition of effective wave height, which is a proxy for longshore sediment transport potential, is presented in Appendix B also. The lengths of the direction ‘vectors’ are scaled to this effective wave height parameter and they demonstrate that nearshore wave heights increase in the northerly direction.
2.6.3.2 SBEACH Storm Erosion Profile Model
The SBEACH model system has been applied to hindcast cross-shore erosion during the July 2010 storm event based on hindcast nearshore wave data and measured water level conditions. The SBEACH model has been applied to five cross-shore profiles which are indicated on Figure 2.10.
The SBEACH model has been configured with 1m computational nodes and a d50 of 0.2mm. For Profile 1, a d50 of 0.15mm has also been simulated. Appendix Cpresents time-series of the hindcast wave height, period and measured water level data which was applied to the SBEACH model for the profile simulations. Figure 2.12 presents an example of the initial profile and post-storm profile for Transect C3. Due to the high water level that occurred at the time of the peak wave conditions, the 0m AHD contour does not move eastward a significant amount.
Table 2.4 presents a summary of the simulated cross-shore erosion volumes (above 0m AHD) from the SBEACH results and the recession of the +1m AHD contour for each profile location. For Transects C2 to C4, and Transect North, the erosion volume above 0m AHD is limited by the volume of available sand above 0m AHD on the SBEACH profile. Transect C1 provides an indication of the cross-shore erosion potential for the Beresford region as a whole. For a d50 of 0.2mm, the erosion volume is approximately 30m3/m, and with a d50 of 0.15mm the potential erosion volume increases by 50% to 45m3/m. The SBEACH model does simulate all of the processes which contribute to measured storm erosion across a beach profile. Variations in longshore sediment transport rates, together with near shore rip cell features, can all significantly increase the actual profile erosion rates that may be observed at a location during and post a storm event. Inspection of the two C1 profile results also shows that storm erosion (bite) depends on sediment particle size.

Beresford Foreshore Coastal Protection and Enhancement–Master Plan Report Prepared for City of Greater Geraldton
MASTER PLAN REPORT March 2012 Version: 6 (Final) Page 30
Figure 2.11: Plan View of Weighted Mean Wave Vectors

Beresford Foreshore Coastal Protection and Enhancement–Master Plan Report Prepared for City of Greater Geraldton
MASTER PLAN REPORT March 2012 Version: 6 (Final) Page 31
Figure 2.12: Pre-and-Post Storm Beach Profiles – SBEACH Model 2010 Hindcast Event
Table 2.4: SBEACH Model Results – July 2010 Storm Hindcast.
Transect
Median Sediment
Diameter (d50) - mm
Total Erosion Volume above 0m AHD (m3/m)
Recession of +1m AHD
Contour (m) – End of Storm
C1 0.2 -29.8 -8.3
C1 0.15 -45.7 -11.4
C2 0.2 -12.7 -10.0
C3 0.2 -12.6 -8.7
C4 0.2 -16.7 -9.3
North 0.2 -17.8 -12.9
2.6.3.3 LITPACK Profile and Shoreline Model
The shoreline development model was validated using the available historical shoreline survey data, adopting a period from 2005 to 2010 when no shoreline sand nourishment occurs north of the offshore breakwater. Quantum Surveys (2010) shows that from survey profile locations N7 to N10 the averaged annual shoreline rate of retreat was about 2m a year. It was assumed that no or little transport occurs over the tombolo feature that connects the offshore breakwater to the shoreline. The shoreline development model was verified on this basis.
The approximate five years of time-series wave parameters (Hs, Tz and wave direction) determined by the SWAN wave modelling were applied to the shoreline plan development model. This was done firstly to the existing layout, as described above, to confirm that 2m/year of shoreline recession occurred in the model immediately north of the offshore breakwater. This assessment of 2m of

Beresford Foreshore Coastal Protection and Enhancement–Master Plan Report Prepared for City of Greater Geraldton
MASTER PLAN REPORT March 2012 Version: 6 (Final) Page 32
shoreline erosion is calculated in the absence of nourishment from the NBSP. (That is, it is based on analysis of survey data between nourishment exercises).
Figure 2.13 presents a plan view of the initial model shoreline location, and the simulated shoreline change over the 5-years simulation period for the southern section of the study area. Figure 2.14 presents a plan view of the initial model shoreline location, and the simulated shoreline change over the 5-year simulation period for the northern section of the study area.
Figure 2.13: Initial and Post 5-year Shoreline Plan Location (0m AHD Contour) – Southern Study Area Existing Shoreline Condition

Beresford Foreshore Coastal Protection and Enhancement–Master Plan Report Prepared for City of Greater Geraldton
MASTER PLAN REPORT March 2012 Version: 6 (Final) Page 33
Figure 2.14: Initial and Post 5-year Shoreline Plan Location (0m AHD Contour) – Northern Study Area Existing Shoreline Condition

Beresford Foreshore Coastal Protection and Enhancement–Master Plan Report Prepared for City of Greater Geraldton
MASTER PLAN REPORT March 2012 Version: 6 (Final) Page 34
Figure 2.15 presents a time series of modelled longshore transport for a location near the proposed second headland node – see Section 2.7. The mean longshore transport is northerly but during the winter there are significant periods when southerly transport has been hindcast. The post-2005 long shore transport results indicate that the wave hindcast data which is based on measured wave direction at the entrance to the navigation channel (post 2005) shows a greater variation in sediment transport direction and magnitude, and a more seasonal characteristic with predominately northerly longshore transport during summer, and winter experiencing both northerly and southerly transport. Due to the greater accuracy of the wave direction data post 2005, Cardno have adopted this data period to assess the shoreline protection options with the numerical model system because of the more realistic description of the seasonal wave direction conditions on the sediment transport processes.
Figure 2.15: Time series plot of the longshore sediment transport rate along the Beresford foreshore

Beresford Foreshore Coastal Protection and Enhancement–Master Plan Report Prepared for City of Greater Geraldton
MASTER PLAN REPORT March 2012 Version: 6 (Final) Page 35
2.7 Concept Options
Cardno has considered a number of options for coastal engineering design along the Beresford Foreshore to provide shoreline protection for the shoreline and the three general options are summarised below. Option 1 features two headland nodes and from a coastal engineering perspective is consistent with options 1 and 2 specified in the Project Brief. Option 2 includes a third structure further which is consistent with option 2 which was specified in the Project Brief. Option 3, which is the most robust of the three options in terms of stabilising the shoreline along the specified study area, has structures spaced along the whole study area and features two headland structures at the southern end, and two shorter structures further north. Further details on the design options are presented in the following sections including the identification of the preferred design concept that is recommended to be progressed to Detailed Design.
At this stage, no detailed investigation has been undertaken of the storm water drains which discharge at the shoreline. At the southern end of the Beresford area, as part of this project it is recommended that the storm water outlets be re-located to discharge near the seaward end of the headland and low crest structures to prevent erosion and scouring of the beach during storm events. At some sites in Queensland the stormwater pipes are covered by the low crest or headland.
In order to ensure that a robust and reliable coastal engineering design was developed for this project, Cardno have adopted a range of tools and techniques in order to develop the concept options. The coastal engineering design for the Beresford site has been based on a combined understanding of the coastal processes at the Beresford site which has been derived from:
Coastal processes studies within the Geraldton region, for example Curtin (2011);
Analysis of historical shoreline changes;
Application of simple empirical and analytical models; and
Outcomes from validated numerical models.
2.7.1 Option 1
Figure 2.16 presents a plan view of Option 1, which features the two southern headlands and no other structures. The structures are spaced approximately 400m apart based on shoreline modelling. The shoreline response modelling has indicated that with a 400m headland spacing, the change in plan alignment from south-to-north compared to the initial design nourishment alignment is less than +/- 5m over the first 5-years post construction (and nourishment). If the headland spacing is increased, the variation in alignment will increase and the beach width at the southern end of each compartment will reduce. This has the potential to reduce the volume of sand available for storm protection at the southern end of the beach.
The two headlands are designed to extend offshore to be close to the depth of closure (2.5 to 3m AHD) and to provide two stable compartments in the long term which should not require re-nourishment within a 10-year period (see Section 2.8.2). This option will require a large volume of regular sand bypassing (beach re-nourishment) to the north of Compartment 2 as part of the NBSP. This option may also require shoreline revetments at key locations to protect assets north of the headlands.

Beresford Foreshore Coastal Protection and Enhancement–Master Plan Report Prepared for City of Greater Geraldton
MASTER PLAN REPORT March 2012 Version: 6 (Final) Page 36
Figure 2.16: Plan View of Option 1 Layout

Beresford Foreshore Coastal Protection and Enhancement–Master Plan Report Prepared for City of Greater Geraldton
MASTER PLAN REPORT March 2012 Version: 6 (Final) Page 37
2.7.2 Option 2
Figure 2.17 presents a plan view of Option 2, which features the two southern headlands as well as one smaller structure further north. The headlands are as per Option 1 (Section 2.7.1). The one structure further north will be smaller and will only practically trap the longshore drift. Over time sand will bypass this structure and this option will require a larger volume of regular sand bypassing (beach re-nourishment) to the north of Compartment 3 as part of the NBSP. This option will also require shoreline revetments at key locations to protect assets to the north of the headlands.
Figure 2.17: Plan View of Option 2 Layout
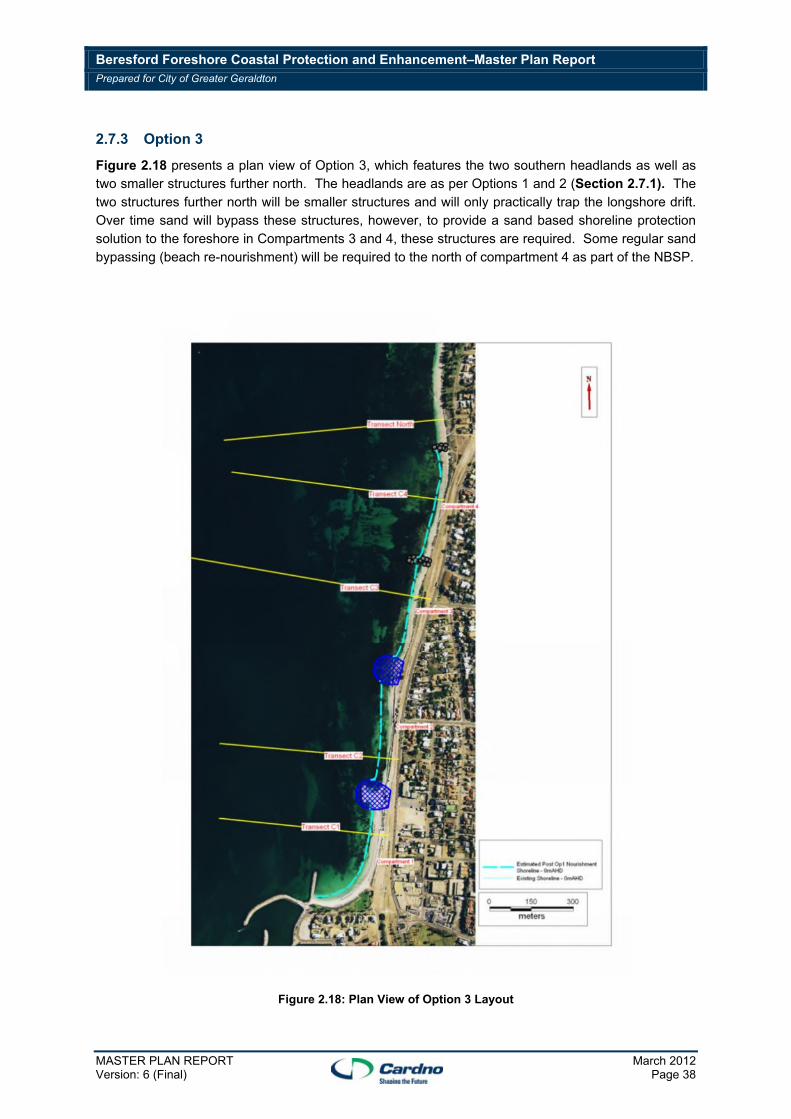
Beresford Foreshore Coastal Protection and Enhancement–Master Plan Report Prepared for City of Greater Geraldton
MASTER PLAN REPORT March 2012 Version: 6 (Final) Page 38
2.7.3 Option 3
Figure 2.18 presents a plan view of Option 3, which features the two southern headlands as well as two smaller structures further north. The headlands are as per Options 1 and 2 (Section 2.7.1). The two structures further north will be smaller structures and will only practically trap the longshore drift. Over time sand will bypass these structures, however, to provide a sand based shoreline protection solution to the foreshore in Compartments 3 and 4, these structures are required. Some regular sand bypassing (beach re-nourishment) will be required to the north of compartment 4 as part of the NBSP.
Figure 2.18: Plan View of Option 3 Layout

Beresford Foreshore Coastal Protection and Enhancement–Master Plan Report Prepared for City of Greater Geraldton
MASTER PLAN REPORT March 2012 Version: 6 (Final) Page 39
2.8 Beach Nourishment Investigations
A beach nourishment design has been developed which aims to provide a high level of beach amenity within the headland nodes over the long term, and which would provide a storm erosion buffer particularly to the shoreline sections north of the proposed headland. The design option at this stage features sand nourishment within the southern two compartments sufficient to add 20m of beach width at the +2.5m AHD contour in Compartments 1 and 2. For Options 2 and 3, the one to two northern shoreline compartments would have sufficient nourishment to add 15m of initial beach width at the +2.5m AHD contour.
Following a stakeholder consultation workshop on 7 October 2011, the volume of initial (capital) nourishment was identified as a major constraint for Options 1 to 3. Option 1 was identified at the meeting as the preferred design concept, and an alternative nourishment design, Option 1B, has been developed which requires approximately 40% less initial capital nourishment. As a result of the reduced nourishment volume for Option 1B, a seawall or similar structure may be required at the back of the beach within the two beach compartments to protect landscaping and other infrastructure from erosion during a severe storm.
A digital model was developed using the software system 12D to develop a post-nourishment seabed and shoreline terrain. The nourishment profile was tied into the existing seabed near approximately -2.5m AHD which is the approximate closure depth for effective sediment transport along much of the study area. Table 2.5 summarises for each option the nourishment compartments and the total nourishment volume including a 15% over nourishment allowance based on nourishment sand with a d50 of 0.2mm.
The suitability of nourishment material with a d50 of 0.15mm which is typical of the sand which accumulates at Pages Beach has been assessed. The cross-shore erosion modelling using the SBEACH model has indicated that for the wave conditions at the study site, this fine sand is highly erosive compared to sand with a d50 of 0.2mm. The stability of a nourishment design with the nourishment sand d50 of 0.15mm compared to a native sand d50 of 0.2mm has been assessed using USACE (2002) design guidelines. Assuming similar relative PSD for the nourishment and native sand materials, in the situation where the native beach material has a d50 of 0.2mm, nourishment sand with a d50 of 0.15mm is highly unstable and is likely to be subject to very high initial loss rates.
Table 2.5: Design Beach Nourishment Volumes
Option Nourishment
Compartments
Total Nourishment Volume (m3)
1 1,2 103,500
1B 1,2 60,000
2 1, 2, 3, 4 155,000
3 1, 2, 3 126,500
A qualitative assessment of potential nourishment sources has been undertaken to identify potential sources of more than 100,000m3 of initial nourishment material for the Beresford region. This is a significant volume of initial nourishment sand and an alternative option, Option 1B, has been developed which features only 60,000m3 of initial sand nourishment in Compartments 1 and 2. Table 2.6 presents a summary of potential sand sources and the advantages and disadvantages of each source.
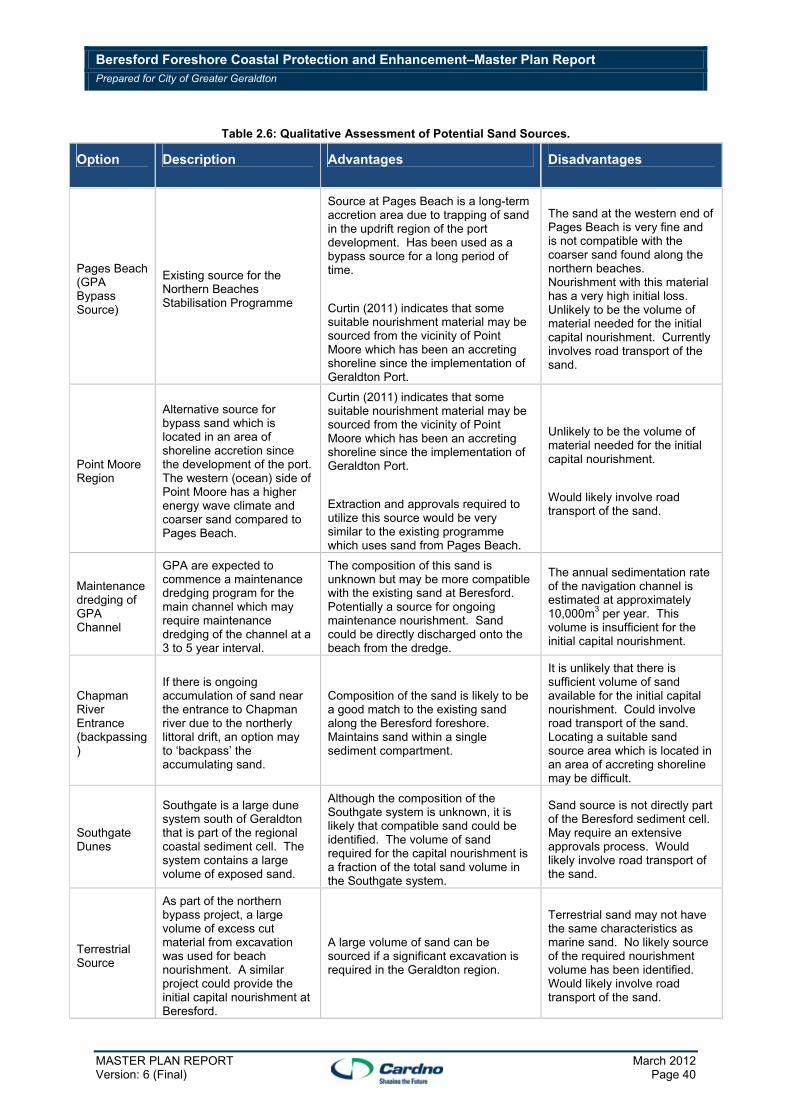
Beresford Foreshore Coastal Protection and Enhancement–Master Plan Report Prepared for City of Greater Geraldton
MASTER PLAN REPORT March 2012 Version: 6 (Final) Page 40
Table 2.6: Qualitative Assessment of Potential Sand Sources.
Option Description Advantages Disadvantages
Pages Beach (GPA Bypass Source)
Existing source for the Northern Beaches Stabilisation Programme
Source at Pages Beach is a long-term accretion area due to trapping of sand in the updrift region of the port development. Has been used as a bypass source for a long period of time.
Curtin (2011) indicates that some suitable nourishment material may be sourced from the vicinity of Point Moore which has been an accreting shoreline since the implementation of Geraldton Port.
The sand at the western end of Pages Beach is very fine and is not compatible with the coarser sand found along the northern beaches. Nourishment with this material has a very high initial loss. Unlikely to be the volume of material needed for the initial capital nourishment. Currently involves road transport of the sand.
Point Moore Region
Alternative source for bypass sand which is located in an area of shoreline accretion since the development of the port. The western (ocean) side of Point Moore has a higher energy wave climate and coarser sand compared to Pages Beach.
Curtin (2011) indicates that some suitable nourishment material may be sourced from the vicinity of Point Moore which has been an accreting shoreline since the implementation of Geraldton Port.
Extraction and approvals required to utilize this source would be very similar to the existing programme which uses sand from Pages Beach.
Unlikely to be the volume of material needed for the initial capital nourishment.
Would likely involve road transport of the sand.
Maintenance dredging of GPA Channel
GPA are expected to commence a maintenance dredging program for the main channel which may require maintenance dredging of the channel at a 3 to 5 year interval.
The composition of this sand is unknown but may be more compatible with the existing sand at Beresford. Potentially a source for ongoing maintenance nourishment. Sand could be directly discharged onto the beach from the dredge.
The annual sedimentation rate of the navigation channel is estimated at approximately 10,000m3 per year. This volume is insufficient for the initial capital nourishment.
Chapman River Entrance (backpassing)
If there is ongoing accumulation of sand near the entrance to Chapman river due to the northerly littoral drift, an option may to ‘backpass’ the accumulating sand.
Composition of the sand is likely to be a good match to the existing sand along the Beresford foreshore. Maintains sand within a single sediment compartment.
It is unlikely that there is sufficient volume of sand available for the initial capital nourishment. Could involve road transport of the sand. Locating a suitable sand source area which is located in an area of accreting shoreline may be difficult.
Southgate Dunes
Southgate is a large dune system south of Geraldton that is part of the regional coastal sediment cell. The system contains a large volume of exposed sand.
Although the composition of the Southgate system is unknown, it is likely that compatible sand could be identified. The volume of sand required for the capital nourishment is a fraction of the total sand volume in the Southgate system.
Sand source is not directly part of the Beresford sediment cell. May require an extensive approvals process. Would likely involve road transport of the sand.
Terrestrial Source
As part of the northern bypass project, a large volume of excess cut material from excavation was used for beach nourishment. A similar project could provide the initial capital nourishment at Beresford.
A large volume of sand can be sourced if a significant excavation is required in the Geraldton region.
Terrestrial sand may not have the same characteristics as marine sand. No likely source of the required nourishment volume has been identified. Would likely involve road transport of the sand.

Beresford Foreshore Coastal Protection and Enhancement–Master Plan Report Prepared for City of Greater Geraldton
MASTER PLAN REPORT March 2012 Version: 6 (Final) Page 41
Figures 2.19 presents a comparison of sediment Particle Size Distributions (PSD) from selected samples along the northern foreshore including at Beresford, and also from a location on the western side of Point Moore (Curtin, 2011). The sample from the western side of Point Moore shows has a slighter coarser PSD than four samples along the northern foreshore and this outcome indicates that the open coast beach at Point Moore may be a more suitable source for the nourishment or bypass for the northern beaches including at Beresford.
Figure 2.19: Comparison of Sediment PSD from the Northern Foreshore and the Western Side of Point Moore
2.8.1 Option 1A Nourishment Profiles
Figures 2.20 to 2.21 present cross-section views of the present and design post nourishment shoreline profiles at the selected cross-shore profiles for the preferred concept design which includes a total of 100,000m3 initial nourishment in Compartments 1 and 2.

Beresford Foreshore Coastal Protection and Enhancement–Master Plan Report Prepared for City of Greater Geraldton
MASTER PLAN REPORT March 2012 Version: 6 (Final) Page 42
Figure 2.20: Existing (March 2010 – Quantum Survey) and Post-Nourishment Profile, 100,000m3Option - Compartment 1
Figure 2.21: Existing (March 2010 – Quantum Survey) and Post-Nourishment Profile, 100,000m3Option - Compartment 2
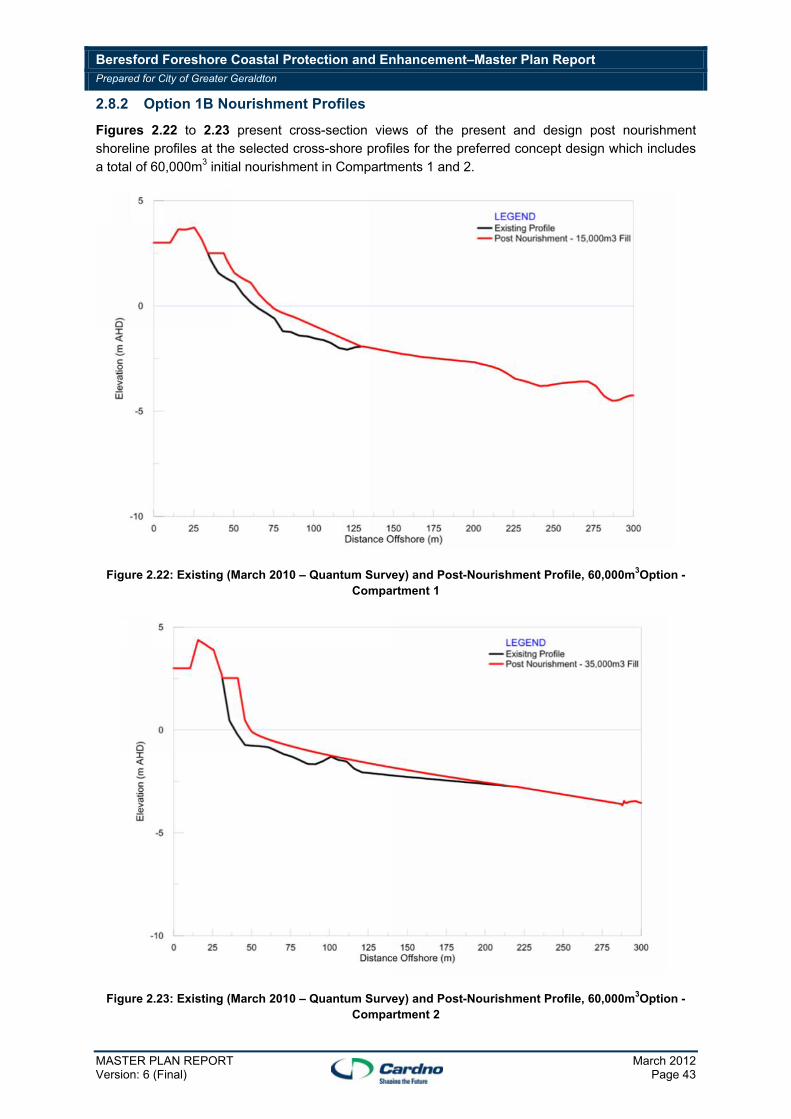
Beresford Foreshore Coastal Protection and Enhancement–Master Plan Report Prepared for City of Greater Geraldton
MASTER PLAN REPORT March 2012 Version: 6 (Final) Page 43
2.8.2 Option 1B Nourishment Profiles
Figures 2.22 to 2.23 present cross-section views of the present and design post nourishment shoreline profiles at the selected cross-shore profiles for the preferred concept design which includes a total of 60,000m3 initial nourishment in Compartments 1 and 2.
Figure 2.22: Existing (March 2010 – Quantum Survey) and Post-Nourishment Profile, 60,000m3Option - Compartment 1
Figure 2.23: Existing (March 2010 – Quantum Survey) and Post-Nourishment Profile, 60,000m3Option - Compartment 2

Beresford Foreshore Coastal Protection and Enhancement–Master Plan Report Prepared for City of Greater Geraldton
MASTER PLAN REPORT March 2012 Version: 6 (Final) Page 44
2.8.3 Recommended Nourishment Design: Preferred Design Concept (Option 1B)
Based on the analysis of potential sand sources, historical observations and the outcomes of the shoreline and erosion modelling the following criteria are recommended for the sand nourishment design for Option 1B:
1. The initial 60,000m3 of nourishment material be sourced from Southgate dunes. This would likely require a modification to the sand extraction licence which currently allows 50,000m3 per annum extraction by Midwest Sand Supplies. The current extraction royalty is $2.50 per cubic meter. A sediment sampling study will need to be undertaken for Southgate Dunes to identify the potential nourishment source area based on suitable sediment characteristics and accessibility.
2. Bypass sand material should be provided north of the northern headland structure twice per year. The total bypass volume which is required per year is approximately 24,000m3 per year. This nourishment should be provided in two instalments, prior to the winter storm period and also prior to the summer period when foreshore utilisation is highest. Based on Curtin (2011), suitable bypass material may exist near Point Moore which is west of the current source area for the NBSP.
3. Re-nourishment of compartments 1 and 2 would be required over a longer period of time. For budget purposes, a once in 10-year programme to re-nourishment the compartments with 60,000m3 of sand should be budgeted. Re-nourishment could be undertaken with dredge material from future maintenance dredging of the navigation channel.

Beresford Foreshore Coastal Protection and Enhancement–Master Plan Report Prepared for City of Greater Geraldton
MASTER PLAN REPORT March 2012 Version: 6 (Final) Page 45
2.9 Shoreline Processes Investigations
2.9.1 Shoreline Evolution Modelling – Preliminary Options
Each of Options 1, 2 and 3 was investigated using the same five years of wave data as the shoreline modelling presented in Section 2.6, but including the shoreline structures and the initial sand nourishment volumes. Figure 2.24 presents a plan view of the simulated initial shoreline position adopted in the model (Green Line), and the simulated post 5-year shoreline position (Red Line) for the southern section of Option 1 between the two headland compartments. The model has assumed that no bypassing of the headland structures occur because the headlands extend seaward to the approximate depth of closure (which is the effective seaward limit of net wave induced longshore transport). The modelling indicates that in the absence of longshore transport occurring outside of each headland compartment, a relatively stable (< +/- 5m shoreline change).In Compartment 2, over the first 5-years, some recession occurs at the southern end (≈5m) whilst at the northern end progradation (≈5m to 10m) of the shoreline occurs.
Figure 2.24: Initial and Post-5-Year Shoreline Position for Southern Beresford – Option 1

Beresford Foreshore Coastal Protection and Enhancement–Master Plan Report Prepared for City of Greater Geraldton
MASTER PLAN REPORT March 2012 Version: 6 (Final) Page 46
Figure 2.25 presents the initial and post 5-years shoreline position for the northern section of the study area for Option 1. This modelling option does not include any annual nourishment of the Beresford system as part of the ongoing NBSP. The results indicate that for shoreline areas to the north of the two headlands a persistent recession trend is expected to occur – in the order of 3m/year.
Figure 2.25: Initial and Post-5-Year Shoreline Position for Northern Beresford – Option 1 (No Annual Bypass)

Beresford Foreshore Coastal Protection and Enhancement–Master Plan Report Prepared for City of Greater Geraldton
MASTER PLAN REPORT March 2012 Version: 6 (Final) Page 47
Figure 2.26 presents the initial and post 5-years shoreline position for the northern section of the study area for Option 2. The results within the southern two compartments are identical to Option 1. The third compartment, which allows some bypass of sand around the northern most groyne, also has a stable shoreline with less than +/-5m shoreline change within the compartment over a 5-year period. This modelling option does not include any annual nourishment of the Beresford system as part of the ongoing NBSPAs a consequence; the results indicate that for Compartment 4, the down-drift area of the northern structure will experience significant recession.
Figure 2.26: Initial and Post-5-Year Shoreline Position for Northern Beresford – Option 2 (No Annual Bypass)

Beresford Foreshore Coastal Protection and Enhancement–Master Plan Report Prepared for City of Greater Geraldton
MASTER PLAN REPORT March 2012 Version: 6 (Final) Page 48
Figure 2.27 presents the initial and post 5-years shoreline position for the northern section of the study area for Option 3. For the short structures at the northern end of the model, bypassing of sand is included in the modelling process. The results indicate that for Compartment 3, the shoreline appears stable (< +/- 5m shoreline change over 5-years) and in Compartment 4 there will be recession (≈3m per year) to the north of the longer southern structure. This modelling option does not include any annual bypass nourishment of the Beresford system as part of the ongoing NBSP. The results within the southern two compartments are identical to Options 1 and 2.
Figure 2.27: Initial and Post-5-Year Shoreline Position for Northern Beresford – Option 3 (No Annual Bypass)

Beresford Foreshore Coastal Protection and Enhancement–Master Plan Report Prepared for City of Greater Geraldton
MASTER PLAN REPORT March 2012 Version: 6 (Final) Page 49
Table 2.7 presents a summary of the simulated annual shoreline changes at the southern and northern sides of the structures for the three concept options. All three options indicate that without any ongoing maintenance, there will be an approximate 3m per year recession to the north of the northern most structure in each option.
Table 2.7: Summary of Simulated Annual Shoreline Changes North and South of Proposed Shoreline Structures.
Scenarios
Average Variation (m/year) from Shoreline (0mAHD)
Structure 1
(Headland) Structure 2 (Headland)
Structure 3
(Mid-Length Structure)
Structure 4
(Short-Length Structure)
S N S N S N S N
Existing 0.5* -2* - - - - - -
Option 1 0.5 -0.4 0.8 -3 - - - -
Option 2 0.5 -0.4 0.8 -1 0.8 -3.4 - -
Option 3 0.5 -0.4 0.8 -1 0.8 -2.2 0 -2.8
* Shoreline changes surrounding the present offshore breakwater which is located at the proposed southern most headland.
Table 2.8 presents a summary of the simulated annual net sediment transport rates at the southern and northern sides of the northern (last) structure for each of the three concept options. All three options indicate that north of the last structure there is a net deficit of sand of approximately 10,000m3 per year immediately north of the northern structure for each options. In order to prevent ongoing recession further north, there is a need to provide more than the 10,000 m3 per year of ongoing nourishment to the north of the last structure with all three options to minimise the longshore sediment transport deficit. In order to be effective, this nourishment material needs to be compatible with the sand along the northern Beresford Foreshore and would need to have a d50 of 0.2mm or coarser.
Table 2.8: Summary of Simulated Annual Longshore Sediment Transport Rates and Deficits at the Northern Structure in each Option .
Scenarios Location
Average Longshore Transport (m3/year) at Northern
Structure (+ve northwards transport)
Net Deficit of Longshore
Transport (m3/year) (+ve northwards
deficit of transport)
S N
Existing* Offshore Breakwater 0* 5200* 5200
Option 1
Headland at the northern end of Compartment 2 – see
Figure 2.24 0 12500 12500
Option 2
Headland at the northern end of Compartment 3 – see
Figure 2.26 5700 15200 9500
Option 3
Headland at the northern end of Compartment 4 – see
Figure 2.27 19700 30100 10400
* Shoreline changes surrounding the present offshore breakwater which is located at the proposed southern most headland.

Beresford Foreshore Coastal Protection and Enhancement–Master Plan Report Prepared for City of Greater Geraldton
MASTER PLAN REPORT March 2012 Version: 6 (Final) Page 50
2.9.2 Shoreline Evolution Modelling: Preferred Design Concept (Option 1B)
The preferred design Option 1B has been modelled in more detail for a 10-year hindcast period (2000 to 2010). The aim of the shoreline modelling was to identify the long term alongshore profile within the two headland compartments, and identify the volume of bypass nourishment which is required each year to the north of the northern headland. Figures 2.28 and 2.29 present the results from the 10-year shoreline change model simulations including with ongoing annual sand bypassing. In order to not increase the annual erosion potential for shoreline areas to the north of the northern headland the shoreline modelling has indicated that an annual bypass volume of 24,000m3 of compatible sand is required to prevent increased erosion for shoreline areas to the north of the headlands.
Figure 2.28: Initial and Post-10-Year Shoreline Position for Southern Beresford – Option 1B

Beresford Foreshore Coastal Protection and Enhancement–Master Plan Report Prepared for City of Greater Geraldton
MASTER PLAN REPORT March 2012 Version: 6 (Final) Page 51
Figure 2.29: Initial and Post-10-Year Shoreline Position for Northern Beresford – Option 1B

Beresford Foreshore Coastal Protection and Enhancement–Master Plan Report Prepared for City of Greater Geraldton
MASTER PLAN REPORT March 2012 Version: 6 (Final) Page 52
2.9.3 Storm Erosion (Cross-Shore)
The SBEACH model described in Section 2.6.3.2 has been applied to the post-nourishment design beach profile for the hindcast July 2010 storm. The results indicate that with the design post-nourishment profile, the recession of the +1m contour is similar to the existing shoreline case (Table 2.4), however the total erosion above 0m AHD is reduced compared to the existing case. If the beach is composed of d50=0.15mm nourishment material, the recession rate is doubled and the erosion volume increases by over 50%.
Table 2.9: SBEACH Model Results for Design Post-Nourishment Options – July 2010 Storm Hindcast.
Transect
Median Sediment
Diameter (d50) - mm
Total Erosion Volume above 0m AHD (m3)
Recession in +1m AHD
Contour (m)
C1-Option 1B
0.2 -19.8 -11.3
C2-Option 1B
0.2 -23.9 -5.6
C1-Option 1 to 3
0.2 -14.2 -10.1
C1-Option 1 to 3
0.15 -26.3 -23.2
C2-Option 1 to 3
0.2 -21.7 -8.9
C3 0.2 -16.3 -9.0
C4 0.2 -19.0 -8.4

Beresford Foreshore Coastal Protection and Enhancement–Master Plan Report Prepared for City of Greater Geraldton
MASTER PLAN REPORT March 2012 Version: 6 (Final) Page 53
2.10 Coastal Structure Details
2.10.1 Design Criteria
At this stage, the shoreline structures have 100-years ARI design criteria specified for structural design. For both water level and wave conditions, the 100-years ARI design criteria have been developed from Extreme Value Analysis of approximately 10-years of measured water level data, and 10-years of hindcast wave conditions. The extrapolation of a 10-years sample to develop 100-years design criteria is beyond the normal application of EVA – see USACE (2003). However, the site is located within a semi-protected coastal embayment which limits the potential maximum wave heights that can reach the structures.
An envelope design approach has been applied by selecting the maximum design load from the 100-years ARI wave height with the 10-years ARI water level, and vice-versa. This approach is commonly adopted in coastal and ocean engineering to address joint occurrence of wave and water levels (DMV, 2010). At Geraldton, there is not a large variation in design wave conditions between 10 and 100 years AIR – see Table 2.11.
2.10.1.1 Design Water Level
Details of the design water level criteria are presented in Table 2.10.
Table 2.10: Design Water Level Conditions
ARI (Yrs) Design WL (m
AHD) Lower 95% Conf. Int.
Upper 95% Conf. Int.
2 0.95 0.88 1.03
5 1.10 0.89 1.31
10 1.23 0.92 1.54
50 1.58 1.00 2.15
100 1.75 1.04 2.45
2.10.1.2 Design Wave Conditions
Details of the design wave height criteria are presented in Table 2.11.
Table 2.11: Design Wave Height Conditions – Headland Nodes
ARI (Yrs) Design Hs (m) Lower 95% Conf. Int.
Upper 95% Conf. Int.
2 1.65 1.61 1.68
5 1.70 1.65 1.76
10 1.74 1.67 1.82
50 1.83 1.72 1.94
100 1.87 1.74 1.99
For the 100-years ARI Hs, the corresponding wave period is approximately 11s for Tz, or 15s Tp. The inshore wave data from Geraldton Port (Section 2.5) indicates that the long period swell still dominates inside the reef system.

Beresford Foreshore Coastal Protection and Enhancement–Master Plan Report Prepared for City of Greater Geraldton
MASTER PLAN REPORT March 2012 Version: 6 (Final) Page 54
Section 2.9 identified the requirement for shoreline protection at the landward interface with the beach for Option 1B. A structure would also be required along the landward interface of the beach along the whole of Compartment 2, and also extending 280m north of the northern headland node. If Option 1A with the larger initial nourishment volume was adopted, then the seawall structure could be shorter in length.
The structure in Compartment 2 is required to protect the landscaping from erosion during severe storms. The seawall to the north of the headland is required to prevent additional erosion from storm processes and also the disruption to the littoral drift as a result of the construction of the headlands. Within Compartments 1 and 2 of Option 1B, the structure proposed will be a rubble mound buried seawall. For the shoreline area north of the northern headland, the seawall structure will likely be exposed but its construction and design will be the same as within Compartments 1 and 2.
The design wave conditions for the shoreline structure would be based on depth limited wave conditions in front of the structure. Table 2.12 presents a summary of estimate breaking wave heights adopting a modified Goda (2000) formula for the waves at the back of the beach based on a beach level of approximately 0m AHD.
Table 2.12: Estimated Breaking Wave Heights for Shoreline Protection Structure – Based on Scoured Beach to 0m AHD (1V:20H nearshore slope, Tp=14s).
ARI (Yrs) Design Hb (m)
2 0.9
5 1.1
10 1.2
50 1.5
100 1.7
2.10.2 Headland
The seaward interface of the two headland structures could be composed of either a rubble mound revetment, pattern placed designed armour units or feature a sloping revetment made of a flexible mattress. Design guidelines, for example USACE (2003), have been applied to estimate armour size requirements. For the headland structures, if a rubble mound structure is adopted then the median armour size would need to be approximately 1400kg around the outer edge of the headland. If a marine mattress, for example a Triton mattress, were used, then the mattress would need to be 0.45m thick.
Wave overtopping has been calculated using the EuroTop manual for a range of crest elevations. Based on these investigations, for the present sea level condition and the 100-years ARI wave height, a reasonable crest level in terms of safety and managing overtopping flows would be +4.5m AHD. As a comparison, the Batavia Coast Marina groyne at the southern end of Compartment 1 has a crest level of +3.7m AHD. At this level (+3.7m AHD), the average wave overtopping volume would be 1.2 L/s per metre section of wall. This volume would be unsafe for pedestrians and sign posting would be required to warn of hazard during storm events. In order to design for a 2060 condition, the crest level would need to be increased to +4.8m AHD to offer a similar level of overtopping risk.

Beresford Foreshore Coastal Protection and Enhancement–Master Plan Report Prepared for City of Greater Geraldton
MASTER PLAN REPORT March 2012 Version: 6 (Final) Page 55
The headlands would require design in such a manner that soil is not lost from the headland structures into the coastal zone. At the very least this will require geotextile to be placed behind the seawall and filter layers will be required between the geotextile and the primary armour in accordance with design guidelines – for example CEM (2003).
2.10.3 Shoreline Protection Structure – Preferred Design Concept (Option 1B)
The revised nourishment design for Option 1B which has a total initial nourishment volume of 60,000m3 seaward interface of the two headland structures could be composed of either a rubble mound revetment, pattern placed designed armour units or feature a sloping revetment made of a flexible mattress. Design guidelines, for example USACE (2003), have been applied to estimate armour size requirements. For the buried seawall, if a rubble mound structure is adopted then the median armour size would need to be approximately 600kg for the outer armour unit. If a marine mattress, for example a Triton mattress, were used, then the mattress would need to be 0.3m thick. The structure will require scour protection down to -1m AHD. The toe protection material will require a minimum mass of 50kg. The buried seawall will require geotextile to be placed behind the seawall and filter layers will be required between the geotextile and the primary armour in accordance with design guidelines – for example CEM (2003).
Wave overtopping would need to be considered in the detailed design. The crest elevation of the structure has been calculated using the EuroTop manual for a range of crest elevations. Based on these investigations, for the present sea level condition and the 100-years ARI wave height, a reasonable crest level in terms of safety and managing overtopping flows would be +3.5m AHD. At this level, the seawall will require protection behind the seawall crest to prevent erosion behind the structure from any wave overtopping. This volume would be unsafe for pedestrians and sign posting would be required to warn of hazards during storm events. In order to design for a 2060 condition, the finished surface level where the buried seawall is located would need to be increased to +3.8m AHD to offer a similar level of overtopping risk.
Wave run-up for the design storm will exceed the beach level which is covered by sand. Following a severe storm the buried seawall may be exposed prior to recovery of the beach and/or re-nourishment. If this is not acceptable, the crest level of the structure may be lowered, however potential impact of wave overtopping will be greater. This needs to be considered when carrying out the design.
2.10.4 Low Crest Structures – Options 2 and 3
The two northern structures in Option 1 are designed to be low crested structures with a low visual profile. For the present sea level condition, the structures could be built with a crest level of approximately +2.5m AHD. At this crest level, these structures will be over-topped by green water and superficial features will be damaged/destroyed in a severe storm. The crest of the structures would be very dangerous for persons on the structure during a storm. The nominal median armour size for the low crest structures is 1100kg.
The structures would be required to have a largely sand transport impervious core layer which could be achieved with geotextile layers or units over a sand core. The seaward interface of the two low crest structures could be composed of either a rubble mound revetment, pattern placed designed armour units or feature a sloping revetment made of a flexible mattress.
Beresford Foreshore Coastal Protection and Enhancement–Master Plan Report Prepared for City of Greater Geraldton
MASTER PLAN REPORT March 2012 Version: 6 (Final) Page 56
2.11 Concluding Comments
A series of coastal processes and engineering investigations have been undertaken to prepare three concept options for foreshore protection along the Beresford shoreline. Due to the heavily modified shoreline within Champion Bay at Geraldton, the Beresford Foreshore has experienced long-term shoreline erosion problems. At present, bi-annual bypassing of sand from Pages Beach is undertaken as part of the Northern Beaches Stabilisation Programme, together with an offshore breakwater constructed in 2005 which limits the erosion along the Beresford foreshore.
The longshore and cross-shore sediment transport investigations undertaken as part of the coastal engineering design in conjunction with a review of historical reports and data indicates that the fine particle size of the historical nourishment material has limited the effectiveness of beach nourishment along the northern foreshore. In order to develop a stable shoreline, even within the two large headland structures of the proposed concept design, the nourishment sand needs to have a d50 of 0.2mm or greater.
Cardno has prepared three concept options which are designed to provide a stable shoreline with a consistently high level of public access and amenity for the two southern beach compartments that would be formed within the two large headland features. Option 1 features only the two large headlands at the southern end of the study area. Option 2 features two southern headlands and one smaller structure further north, and Option 3 also includes two shorter structures further north to assist in stabilising two further sections of shoreline which covers the whole study area. All three initial concept options required 100,000m3 or greater initial sand nourishment.
Following a workshop on 7 October 2011 which identified nourishment sand as a major constraint, a revised Option 1B was developed which only required 60,000m3 in initial sand nourishment within the beach compartments formed within the two headland nodes. Figure 2.30 presents a plan view of the preferred Concept Design Option 1B which also includes a buried seawall along sections of the shoreline to provide protection from severe erosion. Within the beach compartments, the seawall would likely be exposed following a severe storm, for example a 10-year ARI erosion event. Following such an event, re-nourishment of 30,000m3 to 40,000m3 may be required to return the beach compartments to the design beach width. The seawall to the north of the second headland will likely be exposed on a regular basis and an annual bypass sand supply of 24,000m3 (per year, two 12,000m3 campaigns every 6-months) will be required to minimise down-drift erosion impacts from the headland nodes.
Investigation of available sand sources has identified that the Southgate Dunes is likely to offer the best potential as a source for the capital nourishment required for the preferred concept design. It is recommended that for the future bypass nourishment which will be required to the north of the headlands, 24,000m3 per year of sand be sourced from the western side of Point Moore which based on PSD analysis of sediment samples appears to be more compatible with the native sand along the northern foreshore compared to the present source which is the eastern end of Pages Beach. In the future, additional nourishment or re-nourishment of the headland compartments could be undertaken with sand sourced from maintenance dredging of the navigation channel which may be undertaken every three to five years. The ongoing management of erosion impacts to the north headland nodes is essential to minimise the risk of increasing the erosion and shoreline recession for the shoreline areas to the north of the northern most structure.

Beresford Foreshore Coastal Protection and Enhancement–Master Plan Report Prepared for City of Greater Geraldton
MASTER PLAN REPORT March 2012 Version: 6 (Final) Page 57
Figure 2.30: Preferred Option 1B Coastal Engineering Summary Plan

Beresford Foreshore Coastal Protection and Enhancement–Master Plan Report Prepared for City of Greater Geraldton
MASTER PLAN REPORT March 2012 Version: 6 (Final) Page 58
2.12 References
Australian Hydrographic Service (2009): Australian National Tide Tables 2009.
Bailey, February 2005. ‘Report on Coastal Sand Migration Oct 2004 – Jan 2005 Associated with Southern Transport Corridor Sand Placement in September 2004’, Prepared for City of Geraldton
Coastal Engineering Solutions (2001): Geraldton Port Enhancement: Wave and Sediment Studies – Volume 4 Impacts on Northern Beaches. Prepared for Geraldton Port Authority.
CSIRO (2007): “Climate Change in Australia – Technical Report.”. Prepared by CSIRO and Bureau of Meteorology.ISBN 9781921232947.
Curtin University (2011): Geraldton Embayment’s Coastal Sediment Budget Study – Sediment Mapping for Identification of Sediment Sources, Transport Pathways and Sinks for Components of the Batavia Coast, With Special Consideration of the Inshore Waters and Coast between the Greenough River and Buller River. Prepared for the Department of Transport. March 2011.
DMV (2010): Offshore Standard DNV-OS-F101. Submarine Pipeline Systems.Prepared by DET NORSKE VERITAS.
EurOtop (2007) EurOtop: Wave Overtopping of Sea Defences and Related Structures: Assessment Manual. Published by Environmental Agency (UK), German Coastal Engineering Research Council (Germany) and Netherlands Expertise Network on Flood Protection (The Netherlands). Final Version – August 2007.
Geoscience Australia (2009).GEODATA 9 Second Digital Elevation Model (DEM-9S) Version 3.Prepared by Geoscience Australia. Available at: http://www.ga.gov.au/meta/ANZCW0703011541.html
Goda (2000): Random Seas and Design of Maritime Structures. Advanced Series on Ocean Engineering – Volume 15.World Scientific, Singapore.ISBN-13 978-981-02-3256-6.
MRA (2001): Geraldton Northern Foreshore Stage 1, Prepared for City of Geraldton, Geraldton Port Authority & Department for Planning and Infrastructure by M.P. Rogers & Associates, Perth, Western Australia, November 2001.
Quantum Surveys (2010): Shoreline Monitoring Survey – March 2010. Report Prepared for Geraldton Port Authority.
USACE (2002), Coastal Engineering Manual.Prepared by United State Army Corp of Engineers, Washington DC. Ref: EM 1110-2-1100.
WAPC (2010): Position Statement – State Planning Policy No 2.6 – State Coastal Planning Policy Schedule 1 Sea Level Rise. Prepare by the WAPC and the Department of Planning, WA. September 2010.
Worley (2010): COASTAL PROCESSES STUDY - GREYS BEACH TO SUNSET BEACH. Prepared for the City of Geraldton-Greenborough.

Beresford Foreshore Coastal Protection and Enhancement–Master Plan Report Prepared for City of Greater Geraldton
MASTER PLAN REPORT March 2012 Version: 6 (Final) Page 59
3 Recreation and Transport Works
3.1 Introduction
The project brief also called for enhancement works to the strip of land between the proposed foreshore protection works and the eastern verge of Chapman Road. These enhancement works are intended to allow for improvements in amenity and social infrastructure.
The Recreation and Transport Works component of the brief outlines a number of issues to be considered and incorporated into the Foreshore Enhancement portion of the Master Plan. These issues include:
1) Recreation: a. Built environment and urban design considerations b. Recreational facilities; c. Soft Landscape Works; d. Lighting; e. Public Art; f. Water Sensitive Urban Design
2) Transport: a. Shared pathway; b. Accessibility requirements for all transport modes; c. Parking; and d. Lighting.
3.2 Foreshore Enhancement Master Plan
3.2.1 Overview
The Landscape Enhancement Master Plan has been developed based upon the preferred Foreshore Protection option as developed and outlined in Section 2 of this report. In developing the landscape master plan, the following elements have been considered:
Shared pathway connections linking the CBD with the northern suburbs; Provision of recreational facilities; Provision of adequate car parking in conjunction with the recreational facilities. The car park
locations and sizes provisions have been coordinated with the Traffic and Transport Engineers;
Maintenance access to each beach compartment; Provision of lighting throughout the foreshore precinct; Water sensitive urban design; Ensuring the landscape works enhances the visual aspect for residents along Chapman
Road.
Refer to Figure 3.1 for the Option 1B Foreshore Enhancement Works, Figure 3.2 for the Possible Staging of additional Foreshore Protection Works and Figure 3.3 for the Foreshore Enhancement Works associated with the full Foreshore Protection Works as per Option 3.
3.2.2 Foreshore Protection
The preferred Concept Design developed by the Coastal Engineers proposes two headlands at the southern end of Beresford Foreshoreas the immediate urgent foreshore beach protection works and allows for the installation of two rock structures at the northern end of Beresford Foreshore at a later stage. The length of each beach within the containment cells is approximately 400 metres. Dependent

Beresford Foreshore Coastal Protection and Enhancement–Master Plan Report Prepared for City of Greater Geraldton
MASTER PLAN REPORT March 2012 Version: 6 (Final) Page 60
upon available funding, the two proposed northern structures could be replaced by headlands to add further amenity to the Beresford Foreshore.
The beach protection structures will allow for the development of different recreational character zones along the Beresford Foreshore, with the southern end of Beresford Foreshore being characterised by higher use rates and more active recreational pursuits and the northern end of the beach being characterised by lower use rates and more passive forms of recreations.
The two headlands also offer the opportunity to provide different experiences for users, with the southern headland being developed to include a seasonal commercial node for the hire of kayaks, surf skis and the like, while the northern headland being intended for more passive recreational uses. Each headland contains large open lawn areas suitable for a range of inform sports and activities such as kite flying and ball sports, parkland facilities such as shade shelters, barbeque facilities, seating and the like. The rock armour and large concrete slab stairs will also offer the opportunity for fishing. The headlands will also include low mounding to provide topographic relief and visual interest combined with planting of suitable plant materials which will be able to withstand the strong salt laden breezes prevalent along the Beresford Foreshore.
The headlands have been designed to allow for future modification including increases to finished levels based on future sea level changes. The heights of the headlands have been designed to projected sea level changes over the next 50 years, but these heights can be raised as future sea level changes dictate without compromising the basic structure of the headlands.
The design of the headland structures will also accommodate the extension of and outfall of the existing stormwater pipes currently discharging stormwater onto Beresford Foreshore. The incorporation of these stormwater discharges into the headland structures will eliminate the issue of beach erosion associated with the existing pipe discharge locations.
3.2.3 Circulation and Access
The enhancement works along the Beresford Foreshore includes the provision of a variety of circulation systems consisting of pedestrian pathways, shared use pathways (pedestrian and cyclist), controlled vehicle access to the beach cells for maintenance purposes, pedestrian points across both Chapman road and the re-instated and re-profiled beach dunes plus defined car parking areas to cater for a range of recreational vehicle types including cars, vehicles with caravans or trailers, RV’s and buses.
A shared use pathway link has been included in the master plan which will link the CBD to the south with the northern suburbs of Geraldton. The southern connection of the shared use pathway provides options for travel to the CBD with a direct route continuing along Chapman Road and a second link to the CBD via the Batavia Marina which defines the southern extent of Beresford Foreshore. Likewise, the northern end of the shared pathway allows for a continuation of the pathway along Chapman Road or a secondary connection to the northern suburbs via Kempton Street.
The pathway along this section of Foreshore will become one of Western Australia’s premier off-road pathway facilities offering exceptional views of the Indian Ocean and coastline and the City has been implementing both on road and off road cycling improvements for the past several years. The coastal pathway already has high volumes of cyclists and it is expected to increase considerably once these improvements have been completed.
Walkways have been included into the headlands to provide defined access to the park facilities located within the headlands and two open plaza style paved areas have been incorporated into the

Beresford Foreshore Coastal Protection and Enhancement–Master Plan Report Prepared for City of Greater Geraldton
MASTER PLAN REPORT March 2012 Version: 6 (Final) Page 61
design adjacent to the southernmost headland and the southernmost car park. Universal access has been provided to all beaches from all car parks.
Whilst the Master Plan does not identify specific locations for lighting elements, the lighting layout design has been coordinated with the Traffic
3.2.4 Beachfront Amenities
The Master Plan proposes that a range of amenities be provided to allow for a variety of recreational uses along the Beresford Foreshore. Such amenities would include shade shelters and barbeque facilities on the headlands and to locations within the foreshore park adjacent to car parks, public toilet facilities adjacent to the northern headland, beach showers at every beach access point, a playground located near the southernmost car park, bicycle racks plus seats and rubbish bins along the main linear pathway and the shade shelters and barbeque facilities within the headlands.
It is also proposed, although not shown definitively on the master plan, that provision be made for a relocatable seasonal catering caravan be placed within the foreshore parkland to provide food, beverage and other items to beach goers. The preferred location for such a facility would be in the car park adjacent to the southern headland to be close to the public facilities building.
3.2.5 Soft Landscape Works
The landscape works proposed in the Master Plan has been coordinated with the Water Sensitive Urban Design requirements to ensure both elements combine to develop an aesthetic and functional landscape solution.
The following plants have been identified as being suitable for the Beresford Foreshore:
Trees o Acacia amblyophylla o Brachychiton gregorii o Banksia ashbyi o Eucalyptus erythrocorys o Eucalyptus roycei o Grevillea rogersoniana o Melaleuca heugelii o Pittosporum phylliraeoides
Shrubs o Acanthocarpus preissii o Calothamnus chrysanthereus o Calothamnus quadrifidus o Ficinia nodosa o Gahnia trifida o Juncus kraussii o Olearia axillaris "Little Smokie" o Patersonia occidentalis o Pimelea ferruginea o Scaevola crassifolia o Verticordia monadelpha
Groundcovers o Anigozanthos humilis o Banksia ashbyi (dwarf) o Conostylis candicans

Beresford Foreshore Coastal Protection and Enhancement–Master Plan Report Prepared for City of Greater Geraldton
MASTER PLAN REPORT March 2012 Version: 6 (Final) Page 62
o Dianella revoluta o Eremophila glabra "Carramar Carpet" o Eremophila glabra "Firey Red" o Hibbertia racemosa o Kennedia prostrata o Myoporumin sulare (prostrate form) o Rhagodia baccata o Thryptomene baeckeacea (prostrate form) o Verticordia chrysanthella

Perth l 11 Harvest Terrace. West Perth, WA 6005 l T 9273 3888 F 9388 3831 l [email protected] www.cardno.com.au/splat
CITY OF GREATER GERALDTON | BERESFORD FORESHORE | LANDSCAPE MASTER PLAN: PREFERED CONCEPT DESIGNdate: January 2012 | drawing no: SP113701-006 | issue: B
Perth l 11 Harvest Terrace. West Perth, WA 6005 l T 9273 3888 F 9388 3831 l [email protected] www.cardno.com.au/splat
CITY OF GREATER GERALDTON | BERESFORD FORESHORE | LANDSCAPE MASTER PLAN: PREFERED CONCEPT DESIGNdate: January 2012 | drawing no: SP113701-006 | issue: B
Exis ng pedestrian crossing along Chapman Road maintained.
Main park ac vity area sheltered from prevailing winds by adjacent earth mounding.
Formalised pedestrian crossing along Chapman Road.
Large mul -use programmable hardstand with direct access to beach and parkland facili es, including picnic shelters, beach showers, sea ng, barbeques, drinking fountains, bike racks. Main park ac vity area relocated away from exis ng residen al area, passive surveillance from Chapman Road to plaza area.
Equitable access ramp from carpark to beach area. Rock revetment structure incorporated into access
ramp. Access ramp allows for recrea onal watercra to be wheeled onto beach from parking area.
Equitable access ramp from carpark to beach area. Rock revetment structure incorporated into access
ramp. Access ramp allows for recrea onal watercra to be wheeled onto beach from parking area.
Equitable access pathways from carpark to beach area. Council maintenance vehicle access to beach areas.
Headland park located on foreshore protec on pla orm. Open recrea on area with parkland
facili es, including picnic shelters, beach showers, sea ng, barbeques, drinking fountains, bike racks.
Headland park located on foreshore protec on pla orm. Open recrea on area with parkland
facili es, including picnic shelters, beach showers, sea ng, barbeques, drinking fountains, bike racks.
Earthmounding with coastal endemic species, shrubs and small trees, protects passive
recrea on area from prevailing winds and frames views across bay to town centre and port.
Earthmounding with coastal endemic species, shrubs and small trees, protects passive recrea on area from prevailing winds and frames views across bay to town centre and port.
Large stepped pla orms breaks down and allows for alterna ve coastal edge typology. Poten al areas for fi shing. Equitable access ramp incorporated into breakdown terraces. Council maintenance vehicle access to beach areas.
Large stepped pla orms breaks down and allows for alterna ve coastal edge typology. Poten al areas
for fi shing. Equitable access ramp incorporated into breakdown terraces. Council maintenance vehicle access
to beach areas.
Formalised beach access adjacent pedestrian crossing along Chapman Road. Timber board
and chain beach access, with sea ng, beach showers, drinking fountain and bike racks.
Low endemic coastal vegeta on of shrubs and groundcovers and earthmounding along
Chapman Road.
Shared use pathway, 4.0m width, meanders through revegetated coastal dunes.
Shared use pathway, 4.0m width, meanders through revegetated coastal dunes.
Formalised parking area with one-way access (45 spaces), with central drainage to vegetated stormwater infi ltra on area.
Public ameni es structure with beach showers. Single storey structure, low profi le roofl ine and coastal vernacular.
Formalised parking area with one-way access (40 spaces), with central drainage to vegetated stormwater infi ltra on area.
Formalised parking area with one-way access (30 spaces), with central drainage to vegetated stormwater infi ltra on area.
Large mul -use programmable hardstand adjacent to a permanent shade arbour with direct access to beach and parkland facili es, including picnic shelters, beach showers, sea ng, barbeques, drinking fountains, bike racks.
Exis ng residen al stormwater discharge point to be incorporated into a vegetated stormwater infi ltra on and treatment area, with discharge into a vegetated, rock lined swale.
Exis ng residen al stormwater discharge point to be incorporated into a vegetated stormwater infi ltra on and treatment area, with discharge into a vegetated, rock lined swale.
Exis ng residen al stormwater discharge point to be incorporated into a vegetated stormwater infi ltra on and treatment area, with discharge into a vegetated, rock lined swale.
Formalised pedestrian crossing along Chapman Road.
Formalised pedestrian crossing along Chapman Road.
Bus stops located adjacent to Mark Street intersec on.
Bus stops located adjacent to Dean Street intersec on.
Bus stops located adjacent to Trigg Street intersec on.
Views down Mark Street to revegetated coastal foreshore.
Views down Dean Street to revegetated coastal foreshore.
Views down Trigg Street to revegetated coastal foreshore.
Formalised beach access adjacent pedestrian crossing along Chapman Road. Timber board and chain beach access, with sea ng, beach showers,
drinking fountain and bike racks.
Formalised beach access adjacent pedestrian crossing along Chapman Road. Timber board and chain beach access, with sea ng, beach showers,
drinking fountain and bike racks.
Formalised beach access adjacent pedestrian crossing along Chapman
Road. Timber board and chain beach access, with sea ng, beach showers.
Shared use pathway connects to exis ng network at southern end of Rundle Park.
Shared use pathway connects to pathway network along Chapman Road.
Low endemic coastal vegeta on of shrubs and groundcovers and earthmounding along
Chapman Road
Improved pedestrian pathway along eastern Chapman Road verge, 1.5m width. Small coastal trees to provide shade along pathway.
CH
AP
MA
N R
OA
D
DE
AN
ST
RE
ET
MA
RK
ST
RE
ET
TR
IG
GS
TR
EE
T
C H A M P I O N B A Y
B E R E S F O R D
Informal secondary pathway services rear of exis ng residen al.
Low coastal plan ng and low mounding
provides informal buff er for residents.
0 20 40 200m100
scale: 1:2000 @ A1
Buried seawall, alignment and size varies along foreshore.
Buried seawall, alignment and size varies along foreshore.
Low endemic coastal vegeta on of shrubs and groundcovers and
earthmounding along Chapman Road
Buried seawall, alignment and size varies along foreshore.
FIGURE 3 .1
Poten al to relocate coastal pathway relocated away from rear of residen al proper es. This would address nuisance issues to residents.
Poten al playground located close to main park ac vity area and large open grassed area, sheltered from prevailing winds by earth mounding.
Shared use pathway connec on into town centre provides a more direct route, bypassing the western residen al area.
Exis ng carpark accessed off Stella Maris Drive fomalised with one-way access (55 spaces), with central drainage to vegetated stormwater infi ltra on area.

Perth l 11 Harvest Terrace. West Perth, WA 6005 l T 9273 3888 F 9388 3831 l [email protected] www.cardno.com.au/splatPerth l 11 Harvest Terrace. West Perth, WA 6005 l T 9273 3888 F 9388 3831 l [email protected] www.cardno.com.au/splat
CITY OF GREATER GERALDTON | BERESFORD FORESHORE | LANDSCAPE MASTER PLAN: OPTION THREE
FIGURE 3.2
scale: 1:2000@A1 | date: January 2012 | drawing no: SP113701-002 | issue: C
Poten al to relocate coastal pathway relocated away from rear of residen al proper es. This would address nuisance issues to residents.
Exis ng pedestrian crossing along Chapman Road maintained.
Main park ac vity area sheltered from prevailing winds by adjacent earth mounding.
Formalised pedestrian crossing along Chapman Road.
Large mul -use programmable hardstand with direct access to beach and parkland facili es, including picnic shelters, beach showers, sea ng, barbeques, drinking fountains, bike racks. Main park ac vity area relocated away from exis ng residen al area, passive surveillance from Chapman Road to plaza area.
Equitable access ramp from carpark to beach area. Rock revetment structure incorporated into access
ramp. Access ramp allows for recrea onal watercra to be wheeled onto beach from parking area.
Equitable access ramp from carpark to beach area. Rock revetment structure incorporated into access
ramp. Access ramp allows for recrea onal watercra to be wheeled onto beach from parking area.
Equitable access pathways from carpark to beach area. Council maintenance vehicle
access to beach areas.
Headland park located on foreshore protec on pla orm. Open recrea on area with parkland
facili es, including picnic shelters, beach showers, sea ng, barbeques, drinking fountains, bike racks.
Minor foreshore protec on headland, poten al for fi shing area off headland. Exis ng surf spot retained. Parkland
facili es, including picnic shelters, beach showers, sea ng, barbeques, drinking fountains, bike racks.
Minor foreshore protec on headland.
Headland park located on foreshore protec on pla orm. Open recrea on area with parkland
facili es, including picnic shelters, beach showers, sea ng, barbeques, drinking fountains, bike racks.
Earthmounding with coastal endemic species, shrubs and small trees, protects passive
recrea on area from prevailing winds and frames views across bay to town centre and port.
Earthmounding with coastal endemic species, shrubs and small trees, protects passive recrea on area from prevailing winds and frames views across bay to town centre and port.
Large stepped pla orms breaks down and allows for alterna ve coastal edge typology. Poten al areas for fi shing. Equitable access ramp incorporated into breakdown terraces. Council maintenance vehicle access to beach areas.
Large stepped pla orms breaks down and allows for alterna ve coastal edge typology. Poten al areas
for fi shing. Equitable access ramp incorporated into breakdown terraces. Council maintenance vehicle access
to beach areas.
Formalised beach access adjacent pedestrian crossing along Chapman Road. Timber board
and chain beach access, with sea ng, beach showers, drinking fountain and bike racks.
Low endemic coastal vegeta on of shrubs and groundcovers and earthmounding
along Chapman Road
Low endemic coastal vegeta on of shrubs and groundcovers and earthmounding along
Chapman Road.
Buried seawall, alignment and size varies along foreshore.
Buried seawall, alignment and size varies along foreshore.
Buried seawall, alignment and size varies along foreshore.
Shared use pathway, 4.0m width, meanders through revegetated coastal dunes.
Shared use pathway, 4.0m width, meanders through revegetated coastal dunes.
Formalised parking area with one-way access (45 spaces), with central drainage to vegetated stormwater infi ltra on area.
Public ameni es structure with beach showers. Single storey structure, low profi le roofl ine and coastal vernacular.
Formalised parking area with one-way access (40 spaces), with central drainage to vegetated stormwater infi ltra on area.
Formalised parking area with one-way access (30 spaces), with central drainage to vegetated stormwater infi ltra on area.
Large mul -use programmable hardstand adjacent to a permanent shade arbour with direct access to beach and parkland facili es, including picnic shelters, beach showers, sea ng, barbeques, drinking fountains, bike racks.
Exis ng residen al stormwater discharge point to be incorporated into a vegetated stormwater infi ltra on and treatment area, with discharge into a vegetated, rock lined swale.
Exis ng residen al stormwater discharge point to be incorporated into a vegetated stormwater infi ltra on and treatment area, with discharge into a vegetated, rock lined swale.
Exis ng residen al stormwater discharge point to be incorporated into a vegetated stormwater infi ltra on and treatment area, with discharge into a vegetated, rock lined swale.
Poten al playground located close to main park ac vity area and large open grassed area, sheltered from prevailing winds by earth mounding.
Shared use pathway connec on into town centre provides a more direct route, bypassing the western residen al area.
Formalised pedestrian crossing along Chapman Road.
Formalised pedestrian crossing along Chapman Road.
Bus stops located adjacent to Mark Street intersec on.
Bus stops located adjacent to Dean Street intersec on.
Bus stops located adjacent to Trigg Street intersec on.
Views down Mark Street to revegetated coastal foreshore.
Views down Dean Street to revegetated coastal foreshore.
Views down Trigg Street to revegetated coastal foreshore.
Formalised beach access adjacent pedestrian crossing along Chapman Road. Timber board and chain beach access, with sea ng, beach showers,
drinking fountain and bike racks.
Formalised beach access adjacent pedestrian crossing along Chapman Road. Timber board and chain beach access, with sea ng, beach showers,
drinking fountain and bike racks.
Formalised beach access adjacent pedestrian crossing along Chapman
Road. Timber board and chain beach access, with sea ng, beach showers.
Shared use pathway connects to exis ng network at southern end of Rundle Park.
Shared use pathway connects to pathway network along Chapman Road.
Low endemic coastal vegeta on of shrubs and groundcovers and earthmounding along
Chapman Road
Improved pedestrian pathway along eastern Chapman Road verge, 1.5m width. Small coastal trees to provide shade along pathway.
DE
AN
ST
RE
ET
MA
RK
ST
RE
ET
TR
IG
GS
TR
EE
T
C H A M P I O N B A Y
B E R E S F O R D
Informal secondary pathway services rear of exis ng residen al.
Exis ng carpark accessed off Stella Maris Drive fomalised with one-way access (55 spaces), with central drainage to vegetated stormwater infi ltra on area.
Low coastal plan ng and low mounding provides
informal buff er for residents.
0 20 40 200m100
scale: 1:2000 @ A1

Perth l 11 Harvest Terrace. West Perth, WA 6005 l T 9273 3888 F 9388 3831 l [email protected] www.cardno.com.au/splat
CITY OF GREATER GERALDTON | BERESFORD FORESHORE | LANDSCAPE MASTER PLAN STAGING date: January 2012 | drawing no: SP113701-005 | issue: B
Perth l 11 Harvest Terrace. West Perth, WA 6005 l T 9273 3888 F 9388 3831 l [email protected] www.cardno.com.au/splat
CITY OF GREATER GERALDTON | BERESFORD FORESHORE | LANDSCAPE MASTER PLAN STAGING date: January 2012 | drawing no: SP113701-005 | issue: B
C H A P MA N
R OA D
DE
AN
ST
RE
ET
MA
RK
ST
RE
ET
TR
IG
GS
TR
EE
T
C H A M P I O N B A Y
B E R E S F O R D
S T A GG E OOOOO NN EEE
SS TT AAAA GG EEE TT WWW OOOO
S T AAA GGGG EEE TTTT HH RRRRR EE EEE
0 20 40 200m100
scale: 1:2000 @ A1
FIGURE 3.3

Perth l 11 Harvest Terrace. West Perth, WA 6005 l T 9273 3888 F 9388 3831 l [email protected] www.cardno.com.au/splat
CITY OF GREATER GERALDTON | BERESFORD FORESHORE | LANDSCAPE MASTER PLANdate: January 2012 | drawing no: SP113701-003 | issue: C
Chapman Road with delineated cycle lanes.
Improved pedestrian pathway along eastern Chapman Road verge.
Property boundary.
Earth mounding planted with a mixture of endemic shrubs and groundcovers.
Proposed extent of nourishment area and beach area, extent varies along
length of foreshore.Shared use pathway, 4.0m width, meanders
through revegetated coastal dunes.
Typical sect ion along foreshore park and Chapman Roadscale: 1:200@A1
VARIETY OF BEACH ACCESS POINTS
A mixture of beach access opportuni es ranging from formailsed tracks through dunes, mber board and chain and Formalised equitable access points adjacent to primary parkland areas.
MEANDERING COASTAL SHARED USE PATHWAYS
Shared use pathways and secondary pathways meander through revegetated coastal dunes and ac ve parkland areas. Earthmounding planted with a mixture of endemic shrubs and groundcovers provides interest and protec on from prevailing winds.
DISTINCTIVE LANDSCAPE CHARACTER
Cohesive suite of parkland elements establish a unique character for the Beresford foreshore parkland that refl ects the local context and history.
SUSTAINABLE STORMWATER TREATMENT
Exis ng residen al stormwater discharge point to be incorporated into a vegetated stormwater infi ltra on and treatment areas, with discharge into a vegetated, rock lined swale. Formalised parking areas to drain to central vegetated infi ltra on area.
A MIXTURE OF COASTAL EDGE TYPOLOGIES
A variety of coastal edge typologies off er a mixture of uses and experiences along the foreshore, cohesively integrated into the foreshore protec on devices.
ACTIVITY AREAS
Permanent shade structures with vine trellis and public ameni es with beach showers located at the southern headland provide shelter year round. A large mul use plaza area adjacent to the shade structure caters for programmable opportuni es.
Foreshore protec on rock revetment wall, RL
+4.8 AHD, with 3.0m width service way
along top of revetment structure.
Secondary pathway around headland parkland,
meanders through open grassed areas and
vegetated mounds.
Small coastal endemic shade trees located to provide shade and wind protec on adjacent to park facili es and sea ng.
Shade structure with barbeque, sea ng, drinking fountain and waste bins.
Shared use pathway, 4.0m width. Shared use pathway expands into plaza
space adjacent to public ameni es.
Permanent shade structures with vine trellis and public ameni es with beach showers located at the southern headland provide shelter year round. A large mul use plaza area adjacent to the shade structure caters for programmable opportuni es.
Formalised parking area with one-way access, with drainage to vegetated stormwater infi ltra on area.
Exis ng residen al stormwater discharge point incorporated into a vegetated stormwater infi ltra on and treatment area.
Bollards located along Chapman Road to prevent vehicles entering foreshore parkland.
Chapman Road with delineated cycle lanes.
Improved pedestrian pathway to eastern verge, 1.5m width.
Property boundary.
Small coastal shade trees located randomly along length of Chapman Road, posi oned to maintain
views from private residences to foreshore.
Earth mounding to provide protec on from prevailing winds. Planted with a mixture of endemic shrubs and groundcovers.
Open grassed passive use area.
Sect ion through southern headland parkscale: 1:200@A1
Buried seawall, alignment and size varies along foreshore.
FIGURE 3.4

Perth l 11 Harvest Terrace. West Perth, WA 6005 l T 9273 3888 F 9388 3831 l [email protected] www.cardno.com.au/splat
CITY OF GREATER GERALDTON | BERESFORD FORESHORE | LANDSCAPE MASTER PLAN PLANT PALETTEdate: January 2012 | drawing no: SP113701-004 | issue: B
TREESCode SpeciesAGO fle AGONIS flexuosaBAN int BANKSIA integrifoliaCAS equ CASUARINA equisetifoliaCUP ana CUPANIOPSIS anacardioidesFIC mac FICUS macrophyllaGRE oli GREVILLEA olivaceaHIB til HIBISCUS tiliaceusMEL arm MELALEUCA armillarisMEL lan MELALEUCA lanceolata
STREET TREES ALONG EASTERN SIDE OF CHAPMAN ROADCode SpeciesCUP ana CUPANIOPSIS anacardioidesHIB til HIBISCUS tiliaceus
SHRUB AND GROUND COVERSCode SpeciesACA ros ACACIA rostelliferaACA pre ACANTHOCARPUS preissiiALY bux ALYXIA buxifoliaATR cin ATRIPLEX cinereaCAR app CAREX appressaCAR vir CARPOBROTUS virescensDIA rev DIANELLA revolutaERE gla EREMOPHILA glabraFIC nod FICINIA nodosaGAH sie GAHNIA sieberianaJUN kra JUNCUS krausiiJUN usi JUNCUS usitatusLOM lon LOMANDRA longifoliaMYO ins MYOPORUM insulareNIT bill NITRARIA billardieriOLE axi OLEARIA axillarisPOA lab POA labillardeieriRHA bac RHAGODIA baccataRHA pre RHAGODIA preissii subsp. OblovataSCA cra SCAEVOLA crassifloraSOL sym SOLANUM symoniiSPI lon SPINIFEX longifoliusTHE tri THEMEDA triandraWES fru WESTRINGIA fruticosa
Indica ve species pale e only.
ACA ros
BAN int
GRE oli HIB l JUN kra LOM lon MYO insFIC nod
NIT bil
SOL sym SPI lon WES fru
OLE axi POA lab RHA bac
SCA cra
CAR vir CUP ana ERE gla
ACA pre AGO fl e ALY bux ATR cin
DIA rev
MEL lan
FIGURE 3.5

Beresford Foreshore Coastal Protection and Enhancement–Master Plan Report Prepared for City of Greater Geraldton
MASTER PLAN REPORT March 2012 Version: 6 (Final) Page 63
3.3 Water Sensitive Urban Design
3.3.1 Introduction
XPSWMM modelling was undertaken to determine the volume and area required to treat stormwater runoff from the Landscape Master Plan area (Cardno 2011). This is consistent with the agreed design brief dated April 2011.
The Stormwater Management Manual of Western Australia (DoW 2007) requires retention of stormwater runoff from the 1 year 1 hour Average Recurrence Interval (ARI) storm event to provide adequate treatment of stormwater within the foreshore precinct. Therefore, the XPSWMM modelling undertaken has focused on determining the volumes required to be treated within each sub-catchment and has also provided indicative dimensions for treatment structures.
3.3.2 Modelling Parameters and Assumptions
Surface water runoff can be estimated using relationships between the rainfall, infiltration of the underlying soils, surface slope, area of each land use type, and catchment roughness. The interaction of runoff from areas with different characteristics and the routing of this runoff through a sub-catchment can be very complex; it is for these reasons that computational models are used to ensure accuracy and speed of the calculations.
For the calculation of surface water runoff from each sub-catchment, the XPSWMM hydrologic and hydraulic modelling software was used. The hydrologic component of the software uses the Laurenson non-linear runoff-routing method to simulate runoff from the 1 year - 1 hour ARI rainfall event. The rate of runoff is determined by the slope (Table 3.2) and roughness of the surface (Table 3.1). The total volume of runoff is determined by the amount of rainfall (Figure 3.6) less the losses (i.e. initial and continuing infiltration losses given in Table 3.1). The runoff from each sub-catchment is routed through the catchment into the treatment areas using the hydraulic component of XPSWMM.
3.3.2.1 Rainfall Parameters
The Bureau of Meteorology's Rainfall Intensity-Frequency-Duration (IFD) Program (BoM 2011)
produced an IFD Chart and coefficient table for design storms in the Geraldton region (seeFigure3.6). These coefficients were utilised to calculate the runoff multiplier for the 1 year - 1 hour ARI storm event (i.e. 17.58) to be used within the XPSWMM model.

Beresford Foreshore Coastal Protection and Enhancement–Master Plan Report Prepared for City of Greater Geraldton
MASTER PLAN REPORT March 2012 Version: 6 (Final) Page 64
Figure 3.6 IFD Chart
3.3.2.2 Infiltration Parameters
Analysis of the Landscape Master Plan Final Works (Cardno 2011) found the proposed foreshore could be divided into three land use types, as is given in Table 3.1. Loss values and catchment roughness were chosen based on Cardno's experience with similar vegetation and soil types and relevant guidelines (XP Software 2011; Engineers Australia 2001).
Table 3.1 Infiltration and Catchment Roughness Parameters
Land Use Type Infiltration Rates Catchment Roughness
(Manning's n*) Initial Loss (mm) Continuing Loss (mm/hr)
Sand - Turf 17.5 2.5 0.15
Sand - Planting Beds 21.5 2.5 0.3
Road, Path and Car park 1 0.1 0.013

Beresford Foreshore Coastal Protection and Enhancement–Master Plan Report Prepared for City of Greater Geraldton
MASTER PLAN REPORT March 2012 Version: 6 (Final) Page 65
3.3.2.3 Sub-catchment Characteristics
The Landscape Master Plan area was divided into nine sub-catchments, as shown inFigure3.7.
The slope of each catchment was determined from existing topographical data. It was assumed that the redeveloped foreshore would exhibit slopes consistent with the existing topography. The land use areas within each sub-catchment were measured directly from the Landscape Master Plan. These characteristics are given in Table 3.2.
Table 3.2 Sub-catchment Land Use Characteristics
Sub-catchment Sub-catchment Area (ha)
Slope (m/m) Road, Path and Car park Area (ha)
Sand - Turf Area (ha)
Sand - Planting Bed Area (ha)
1 1.04 0.040 0.448 0.472 0.125
2 1.85 0.044 0.927 0.311 0.587
3 0.62 0.034 0.067 0.274 0.277
4 0.94 0.034 0.515 0.097 0.324
5 0.91 0.051 0.467 0.283 0.159
6 0.70 0.029 0.073 0.306 0.325
7 0.86 0.029 0.469 0.077 0.312
8 2.07 0.007 0.852 0.645 0.563
9 1.05 0.015 0.163 0.694 0.194
3.3.2.4 Treatment Area Assumptions
For the purposes of the model, treatment structures were assumed to have a depth of 0.5m with 1 in 6 side slopes. These treatment areas were then sized to retain (and therefore treat) the volume of runoff from the 1 year - 1 hour ARI rainfall event from each catchment. Stormwater runoff from larger rainfall events will not be detained by these structures, but will overtop and discharge into a vegetated, rock lined swale, as shown on the Landscape Master Plan.
The infiltration rate within these structures was assumed to be 2.5x10⁻⁵m/s, which is consistent with the fine sands found on the dune system. Infiltration testing should be conducted prior to construction to confirm the provision of adequate infiltration beneath treatment structures.
3.3.3 Modelling Results
The purpose of the XPSWMM model was to provide the volume of runoff from the 1 year - 1 hour ARI rainfall event within each sub-catchment, which is required to be retained to ensure adequate treatment of the first flush of stormwater. These volumes, along with indicative dimensions of treatment structures are provided in Table 3.3.
These dimensions give an indication of the area needed for drainage purposes. However, the exact number, location and design of these treatment structures will occur during the detailed design stage. The treatment structures are required to have sufficient capacity to accommodate the volumes stated.

Perth l L11 Harvest Terrace West Perth WA 6005 l T +61 8 9273 3888 F +61 8 9486 8664 l [email protected] www.cardno.com.au/splat
Catchment 9
1.05 (ha)
Catchment 8
2.07 (ha)
Catchment 7
0.86 (ha)
Catchment 6
0.70 (ha)Catchment 5
0.91 (ha)
Catchment 4
0.94 (ha)
Catchment 3
0.62 (ha)
Catchment 2
1.85 (ha)
Catchment 1
1.04 (ha)
CITY OF GREATER GERALDTON | BERESFORD BEACH | CATCHMENT PLANnot to scale @ A3 | date: January 2012 | drawing no: SP113701-07 | issue: B
FIGURE 3.7

Beresford Foreshore Coastal Protection and Enhancement–Master Plan Report Prepared for City of Greater Geraldton
MASTER PLAN REPORT March 2012 Version: 6 (Final) Page 66
Table 3.3 Storage Requirements and Indicative Dimensions
Sub-catchment 1 year - 1 hour ARI Volume (m3)
Base Area (m2) Depth (m) Top Area (m2) Top Water Level (m)
1 90 100 0.5 255 0.44
2 180 200 0.5 406 0.48
3 25 25 0.5 122 0.34
4 100 100 0.5 255 0.47
5 95 100 0.5 255 0.45
6 25 25 0.5 122 0.36
7 90 100 0.5 255 0.44
8 165 200 0.5 406 0.45
9 45 25 0.5 122 0.48
3.3.4 References
Bureau of Meteorology (BoM), Rainfall IFD Data System, accessed 15 November 2011 from: www.bom.gov.au.
Cardno, 2011, Beresford Foreshore Landscape Master Plan Final Works, SP113701-002 Issue B, Cardno, Subiaco.
Department of Water (DoW), 2007, Stormwater Management Manual of Western Australia, DoW, Perth.
Engineers Australia, 2001, Australian Rainfall and Runoff, Engineers Australia, Canberra.
XP Software, 2001, 'Manning's n', in XPSWMM, accessed 17 November 2011, from www.xpsoftware.com

Beresford Foreshore Coastal Protection and Enhancement–Master Plan Report Prepared for City of Greater Geraldton
MASTER PLAN REPORT March 2012 Version: 6 (Final) Page 67
3.4 Traffic
3.4.1 Introduction
In the Scope of Works, the brief for the Traffic Study stated that as this is to be a multi-modal protection and improvement scheme, design consideration should be given to the accessibility requirements of all transport modes including pedestrians, cyclists, buses, taxis, scooter riders, motorcyclists in addition to private cars. Refer to Figure 3.8.
3.4.2 Pedestrians and Cyclists
Chapman Road provides an important link in the Geraldton bicycle network, linking the CBD with the northern suburbs. Given the relatively short distances involved and the pleasant environment alongside the ocean, it could be expected that cycling will become more popular as a commuting mode in the future.
There is an existing footpath along the foreshore which is popular amongst recreational walkers, joggers and cyclists. This path should be retained and upgraded to at least 3m in width to cater for increased usage in the future. The design of the path should be aimed at speeds of 20km/h or lower to reduce the risks of conflict between cyclists and other path users. Cyclists wishing to travel at higher speeds should be encouraged to cycle on Chapman Road, utilising either marked shoulders or formal cycle lanes.
The former railway formation alongside Chapman Road provides an opportunity for a well-aligned, easily graded cycle route to be developed from Webberton Road through the Geraldton CBD. However, such a proposal was not recommended as part of the City of Geraldton-Greenough Local Bike Plan (2009).
Existing bicycle parking should be retained unless it is desirable to relocate it closer to relocated focal points within the foreshore area. Bicycle parking should be provided at locations where cyclists are likely to want to dismount, such as at playgrounds, picnic/barbeque areas etc. It is expected that these parking facilities would be used for short term parking in good weather so simple u-rails would be appropriate. The exact location of bicycle parking facilities will be determined at the detailed design phase.
3.4.3 Public Transport
3.4.3.1 Bus Movements
The existing bus service is infrequent – route 701 operates 4 times a day along Chapman Road serving the northern coastal suburbs. The majority of potential patronage through Beresford comes from the residential areas to the east of Chapman Road. To maximise the catchment area, bus stops should be located in close proximity to east-west links as well as near the main activity centres in the foreshore area. Bus stops should therefore be located on both sides of the road at the following locations:
On the southern side of the pedestrian crossing point between Phelps Street and Mark Street; Within 25m of the Mark Street intersection, on the southern approach; Within 25m of the Dean Street intersection, on the southern approach; Between Trigg Street and Mabel Street.
These locations comply with the Design and Planning Guidelines for Public Transport Infrastructure (PTA, 2003). Indented bus bays should not be provided as this may result in safety issues for buses trying to re-enter the traffic stream.

Perth l L11 Harvest Terrace West Perth WA 6005 l T +61 8 9273 3888 F +61 8 9486 8664 l [email protected] www.cardno.com.au/splat
CITY OF GREATER GERALDTON | BERESFORD BEACH | TRAFFIC AND TRANSPORT ENHANCEMENTS1:4000 @ A3 | date: January 2012 | drawing no: SP113701-08 | issue: B
FIGURE 3.8

Beresford Foreshore Coastal Protection and Enhancement–Master Plan Report Prepared for City of Greater Geraldton
MASTER PLAN REPORT March 2012 Version: 6 (Final) Page 68
Refuge islands or kerb extensions should be provided near all bus stops to enable pedestrians to safely cross Chapman Road. Indicative locations for these are shown in Figure 3.8. Final locations and types of pedestrian crossings to be determined during the Detailed Design Phase in accordance with Main Roads and Public Transport Authority requirements.
3.4.3.2 Taxis
While it is anticipated that the foreshore protection and enhancement works to Beresford Foreshore will attract more visitors to the foreshore, it is not anticipated that the intensity of use will require a formal Taxi Rank. During the Detailed Design phases of works, Taxi Zones may be incorporated into the final design of the car parks. A Taxi Call Telephone could be incorporated as a part of the facilities associated with the public amenities located near the northern headland.
3.4.4 Car Parking
On-street parking along Chapman Road will not be provided in order to maintain traffic flow and allow for on-street cycle facilities. Off-street parking will be provided in four separate areas along the foreshore, as shown in Figure 3.8
3.4.5 Intersection Design
The Geraldton Regional Centre Strategy (2005) sets out the future directions for development, parking and transport within Geraldton. Traffic modelling undertaken as part of the Strategy has indicated that Chapman Road, north of Phelps Street, will see a long-term reduction in traffic volumes as improvements to North West Coastal Highway will attract longer distance suburban traffic. Accordingly, Chapman Road will mainly serve local journeys and the road environment should reflect this with lower speeds.
From a traffic volume perspective, the intersections along Chapman Road will continue to operate adequately, with minor delays for traffic on the side roads.
However, in order to slow traffic down and improve the safety of right turns and u-turns, it may be desirable to construct one or more roundabouts on Chapman Road at the intersections with Mark Street, Dean Street and Mabel Street.
3.4.6 Carriageway Design
A two-lane undivided carriageway with either marked shoulders or formal cycle lanes is the most desirable road form for Chapman Road. Refuge islands may be provided as outlined previously. A wide painted median with some areas of raised median or planted trees should not be provided as this will reduce safety for on-street cyclists by encouraging other vehicles to overtake dangerously.
Due to the current and projected traffic volumes plus expected road environment along Chapman Road, the speed limit along this section of Chapman Road should be signed as being 60 km/h. To reduce speeds below 60 km/h would impede traffic flow plus would require considerable capital expenditure to construct traffic calming devices such as speed humps / raised threshold tables, roundabouts, points of road narrowing and the like.

Beresford Foreshore Coastal Protection and Enhancement–Master Plan Report Prepared for City of Greater Geraldton
MASTER PLAN REPORT March 2012 Version: 6 (Final) Page 69
4 Coastal Engineering Costing
4.1.1 Introduction
As per Section 2.6 of the RFT, concept designs and cost estimates for the Coastal Foreshore Protection Works have been prepared for the Preferred Option, Option 1B. The foreshore protection works concept drawings prepared for this Master Plan Report have been prepared based on the sea level changes forecast over the next 50 years as any projections for sea level changes extrapolated beyond this time contain too many uncertainties.
Three types of protective measures have been detailed for the Preferred Option:
1) Rock Armour to Headlands; 2) Placed concrete slabs to form stepped access to the water around the Headlands in addition
to the concrete access ways for beach maintenance works; 3) Buried Rock Armour as located in Figure 2.17.
Refer to Figure 4.1 for Typical Sections though the Revetment Structure Types.
A further drawing has been prepared which details the requirements for a typical Rock Structure which could be located to the northern end of Beresford Foreshore as shown in the Landscape Master Plan (Refer to Figure 3.1) which is based upon Option 3 (an extension of works for the Preferred Concept Design should Council have additional funding) as per Figure 2.7.
If increases in the projected sea levels are greater than current forecast, the design of the civil works associated with the Foreshore Protection has been specifically detailed to allow for the placement of further materials to increase the heights of the presented engineered protective devises in locations behind the current edge treatments for the two Headlands proposed at the southern end of Beresford Foreshore, and over the proposed Rock Structures as located at the northern end of Beresford Foreshore.
4.1.2 Initial construction details
The Foreshore Protection Works Drawings show four (4 No.) types of protection measures as outlined in Section 3.1 Coastal Engineering Design. These four types of protective measures are as follows;
1) Placed rock forming a protective armour to the edges of the Headlands;
2) Placed pre-cast concrete slabs to provide stepped access to the water;
3) Buried rock armour under the beach dune edge to protect both the enhancement works behind the beach protection measures and the infrastructure works along Chapman Road; and
4) Rock structures which could be located at the northern end of Beresford Foreshore, subject to availability of finance.

Beresford Foreshore Coastal Protection and Enhancement–Master Plan Report Prepared for City of Greater Geraldton
MASTER PLAN REPORT March 2012 Version: 6 (Final) Page 70
4.1.3 Initial cost estimates
As outlined in the Section 2.2.1 Introduction, the current civil works structures associated with the Foreshore Protection have been designed to the protect against the projected sea level changes over the next 50 years. The Cost Estimate prepared is for the works associated with this 50 year time frame.
To implement the works as outlined in this report for both the Coastal Protection and Foreshore Enhancement works, the Initial Estimated Costs for the Capital works is $25,406,103.60, while an ongoing $240,000.00 will be required annually for the importation and placement of sand to replenish the foreshore.
Details of the costs are provided below:
ITEM DESCRIPTION QTY UNIT RATE TOTAL 1.0 EARTHWORKS
(Excludes Headlands)
1.1 Stripping and stockpiling of topsoil 66000 m2 $1.00 $66,000.00
1.2 Import, place and compact sand 60000 m3 $10.00 $600,000.00
1.3 Cut to fill (Bank measure) 15000 m3 $3.00 $45,000.00
1.4 Proof roll fill areas 66000 m2 $0.50 $33,000.00
1.5 Respreading of topsoil 33000 m2 $1.00 $33,000.00
Sub Total $777,000.00
2.0 PAVED - TRAFFICABLE AREA 2.1 Subgrade preparation 5540 m2 $5.00 $27,700.00
2.2 Pavement Construction (IPWEA)
2.2.1 200mm limestone compacted basecourse 5540 m2 $10.00 $55,400.00
2.2.2 40mm asphalt (thick lift) 5540 m2 $80.00 $443,200.00
2.2.3 25mm black asphalt 5540 m2 $65.00 $360,100.00
2.2.4 Tie in with existing pavements 8 No $5,000.00 $40,000.00
2.3 Testing
2.3.1 NATA compaction testing 1 No. $7,500.00 $7,500.00
2.3.2 NATA materials quality testing (incl. concrete) 1 No. $7,500.00 $7,500.00
2.4 Kerbing
2.4.1 Standard kerb (adjacent to bituminous concrete) 1530 lin/m $25.00 $38,250.00
2.5 Verge Grading 1530 lin/m $7.50 $11,475.00
Sub Total $991,125.00
3.0 STORMWATER DRAINAGE 3.1 Excavation in all materials, backfilling, 600 lin/m $25.00 $15,000.00
compaction de-watering (as deemed necessary)
3.2 Pipe - supply, lay and bed 900 lin/m $60.00 $54,000.00
3.3 Drainage pit complete - Dia 1050 liner 17 No. $2,500.00 $42,500.00
3.4 Headwall and stone pitching 3 No. $7,500.00 $22,500.00
3.5 Independent NATA compaction testing 1 No. $7,500.00 $7,500.00
Sub Total $141,500.00
4.0 PATHWAYS 4.1 Subgrade preparation 13550 m2 $5.00 $67,750.00
4.2 Pathways (100mm concrete
4.2.1 1.5 metre single use pathway 2900 lin/m $105.00 $304,500.00
4.2.2 4.0 metre dual use pathway 2300 lin/m $300.00 $690,000.00
Sub Total $1,062,250.00 5.0 HEADLANDS AND STRUCTURES 5.1 Southern Headland
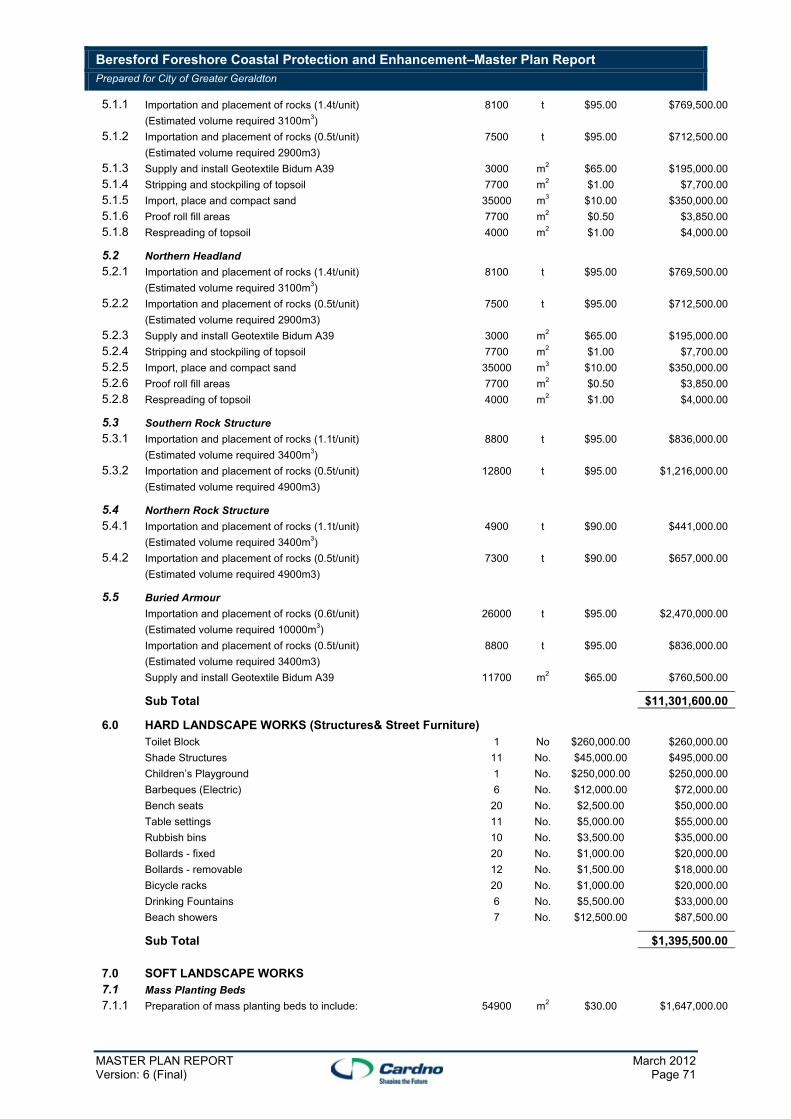
Beresford Foreshore Coastal Protection and Enhancement–Master Plan Report Prepared for City of Greater Geraldton
MASTER PLAN REPORT March 2012 Version: 6 (Final) Page 71
5.1.1 Importation and placement of rocks (1.4t/unit) 8100 t $95.00 $769,500.00
(Estimated volume required 3100m3)
5.1.2 Importation and placement of rocks (0.5t/unit) 7500 t $95.00 $712,500.00
(Estimated volume required 2900m3)
5.1.3 Supply and install Geotextile Bidum A39 3000 m2 $65.00 $195,000.00
5.1.4 Stripping and stockpiling of topsoil 7700 m2 $1.00 $7,700.00
5.1.5 Import, place and compact sand 35000 m3 $10.00 $350,000.00
5.1.6 Proof roll fill areas 7700 m2 $0.50 $3,850.00
5.1.8 Respreading of topsoil 4000 m2 $1.00 $4,000.00
5.2 Northern Headland
5.2.1 Importation and placement of rocks (1.4t/unit) 8100 t $95.00 $769,500.00
(Estimated volume required 3100m3)
5.2.2 Importation and placement of rocks (0.5t/unit) 7500 t $95.00 $712,500.00
(Estimated volume required 2900m3)
5.2.3 Supply and install Geotextile Bidum A39 3000 m2 $65.00 $195,000.00
5.2.4 Stripping and stockpiling of topsoil 7700 m2 $1.00 $7,700.00
5.2.5 Import, place and compact sand 35000 m3 $10.00 $350,000.00
5.2.6 Proof roll fill areas 7700 m2 $0.50 $3,850.00
5.2.8 Respreading of topsoil 4000 m2 $1.00 $4,000.00
5.3 Southern Rock Structure
5.3.1 Importation and placement of rocks (1.1t/unit) 8800 t $95.00 $836,000.00
(Estimated volume required 3400m3)
5.3.2 Importation and placement of rocks (0.5t/unit) 12800 t $95.00 $1,216,000.00
(Estimated volume required 4900m3)
5.4 Northern Rock Structure
5.4.1 Importation and placement of rocks (1.1t/unit) 4900 t $90.00 $441,000.00
(Estimated volume required 3400m3)
5.4.2 Importation and placement of rocks (0.5t/unit) 7300 t $90.00 $657,000.00
(Estimated volume required 4900m3)
5.5 Buried Armour
Importation and placement of rocks (0.6t/unit) 26000 t $95.00 $2,470,000.00
(Estimated volume required 10000m3)
Importation and placement of rocks (0.5t/unit) 8800 t $95.00 $836,000.00
(Estimated volume required 3400m3)
Supply and install Geotextile Bidum A39 11700 m2 $65.00 $760,500.00
Sub Total $11,301,600.00
6.0 HARD LANDSCAPE WORKS (Structures& Street Furniture) Toilet Block 1 No $260,000.00 $260,000.00
Shade Structures 11 No. $45,000.00 $495,000.00
Children’s Playground 1 No. $250,000.00 $250,000.00
Barbeques (Electric) 6 No. $12,000.00 $72,000.00
Bench seats 20 No. $2,500.00 $50,000.00
Table settings 11 No. $5,000.00 $55,000.00
Rubbish bins 10 No. $3,500.00 $35,000.00
Bollards - fixed 20 No. $1,000.00 $20,000.00
Bollards - removable 12 No. $1,500.00 $18,000.00
Bicycle racks 20 No. $1,000.00 $20,000.00
Drinking Fountains 6 No. $5,500.00 $33,000.00
Beach showers 7 No. $12,500.00 $87,500.00
Sub Total $1,395,500.00
7.0 SOFT LANDSCAPE WORKS 7.1 Mass Planting Beds
7.1.1 Preparation of mass planting beds to include: 54900 m2 $30.00 $1,647,000.00

Beresford Foreshore Coastal Protection and Enhancement–Master Plan Report Prepared for City of Greater Geraldton
MASTER PLAN REPORT March 2012 Version: 6 (Final) Page 72
excavation (300mm depth) & stockpiling of existing soil,
cultivation to base of excavated planting areas,
amelioration of site soils and installation into
planting beds
7.1.2 Supply and installation of trees - 100 litre 150 No. $250.00 $37,500.00
7.1.3 Supply and installation of trees - 45 litre 250 No. $125.00 $31,250.00
7.1.4 Supply and installation of shrubs - tubestock 109800 No. $5.00 $549,000.00
(Average 2 per m2)
7.1.5 Supply and installation of groundcovers - tubestock 494000 No. $5.00 $2,470,000.00
(Average 9 per m2)
7.1.6 Supply and installation of mulch 54900 m2 $12.50 $686,250.00
7.2 Turfing works
7.2.1 Preparation of mass planting beds to include: 24750 m2 $15.00 $371,250.00
excavation (100mm depth) & stockpiling of existing soil,
cultivation to base of excavated planting areas,
amelioration of site soils and installation into
planting beds
7.2.2 Supply and place turf 24750 m2 $12.50 $309,375.00
7.3 Maintenance Works
7.3.1 Mass planting areas 12 Wk $7,500.00 $90,000.00
7.3.2 Turf areas 12 Wk $7,500.00 $90,000.00
Sub Total $6,281,625.00
8.0 PRELIMINARIES 8.1 Preliminaries (3.0% OF Estimated Construction Value) $616,653.00
Sub Total $616,653.00
9.0 CONTINGENCY 9.1 Contingency (20%) $4,234,350.60
Sub Total $4,234,350.60
10.0 TOTAL CONSTRUCTION COST $25,406,103.60
(NOTE: GST HAS NOT BEEN INCLUDED IN THIS COST ESTIMATE)
11.0 FORESHORE REPLENISHMENT Annual importation and placement of sand to replenish 24000 m3 $10.00 $240,000.00
foreshore
Subtotal $240,000.00

Beresford Foreshore Coastal Protection and Enhancement–Master Plan Report Prepared for City of Greater Geraldton
MASTER PLAN REPORT March 2012 Version: 6 (Final) Page 73
NOTE: This Cost Estimate is based upon 2011/2012 Construction Rates. Should there be delays in commencing these works, an annual 3.5% cost increase allowance should be made in line with current CPI increases. Projected Capital Works increases annually for the next five years and in ten years are as follows:
Financial Year Revised Cost Estimate
2012 / 2013 $26,295,316
2013 / 2014 $27,215,652
2014 / 2015 $28,168,199
2015 / 2016 $29,154,085
2016 / 2017 $30,174,477
2021 / 2022 $35,837,810
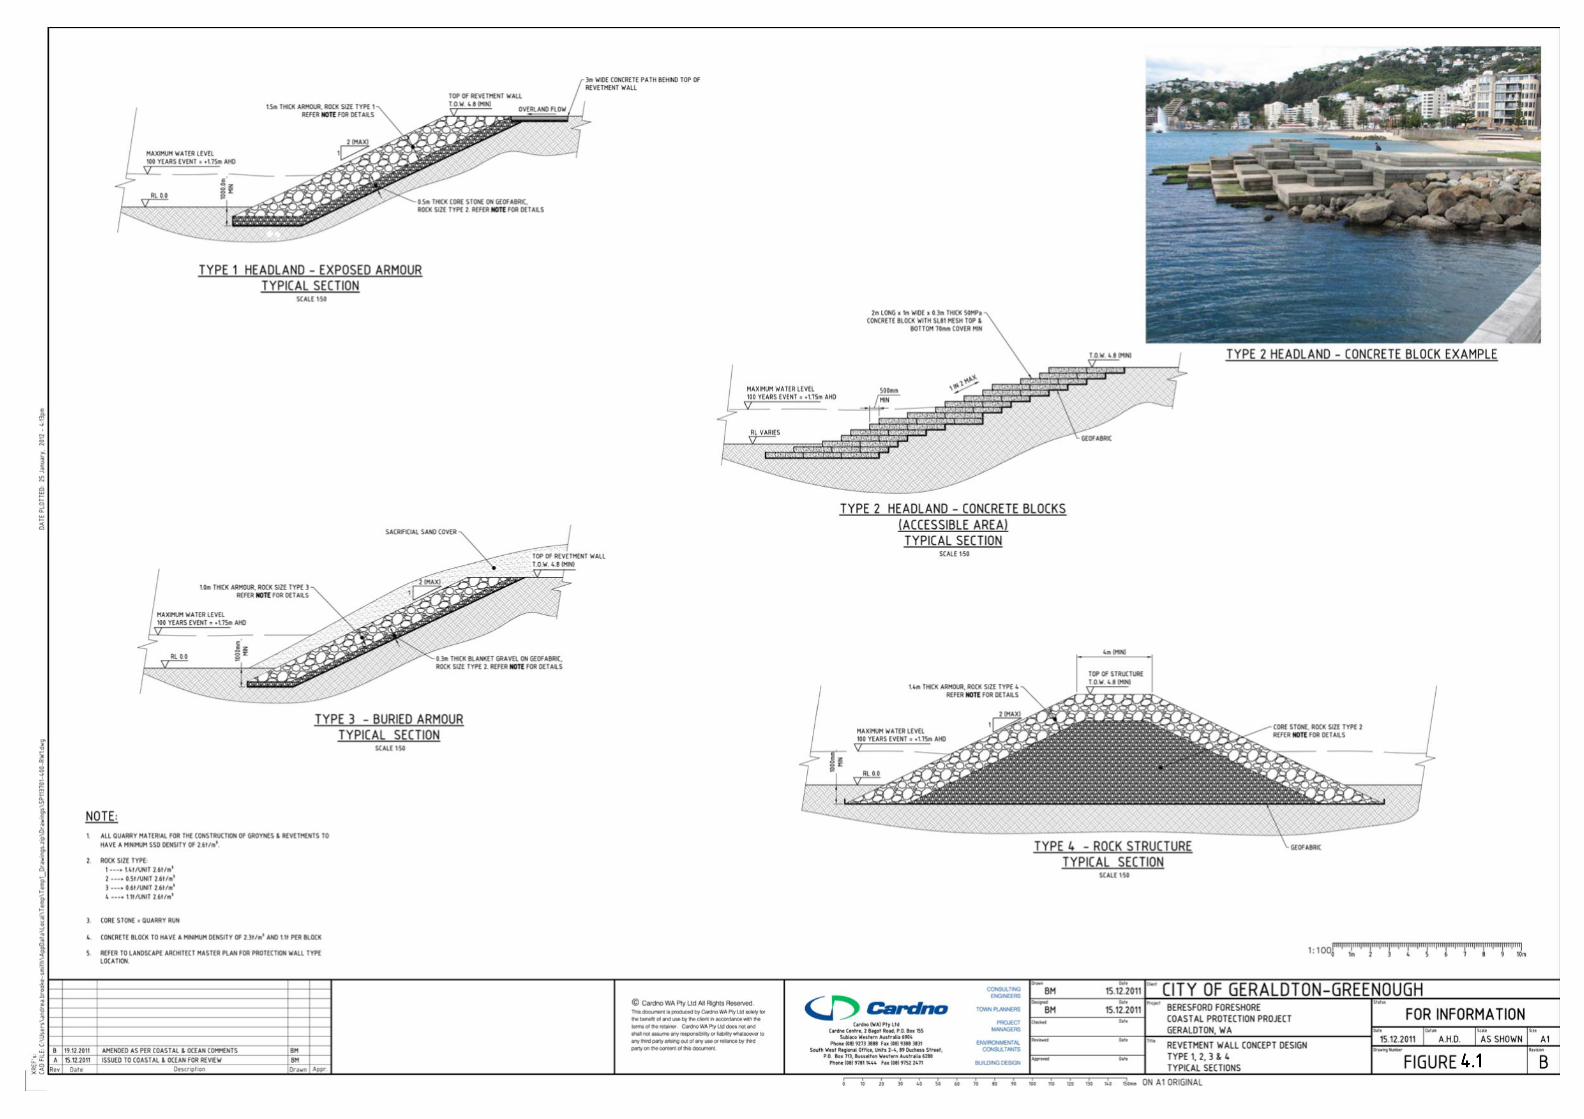

Beresford Foreshore Coastal Protection and Enhancement–Master Plan Report Prepared for City of Greater Geraldton
MASTER PLAN REPORT March 2012 Version: 6 (Final) Page 74
5 Community Consultation
5.1 Introduction
As the City of Greater Geraldton has a Local Planning Policy for Community Consultation and this project has been classed as Level 5 – Very High Impact Project, stakeholder and community engagement has been an integral component of the development of this Master Plan Document. Stakeholder and Community Engagement Sessions were undertaken as follows:
1) 7th October, 2011: Stakeholder Presentation – City of Greater Geraldton Offices 2) 3rd November, 2011: Community Presentation – Randolph Stow Meeting Room, Geraldton
Library; 3) 8th December, 2011: Community Presentation – Randolph Stow Meeting Room, Geraldton
Library.
5.2 Previous Community Consultation Studies
Prior to the Community Presentations and the development of the Master Plans (both the Coastal Foreshore Protection plus Foreshore Enhancement) presented in this Report, Cardno reviewed the presented outcomes from previous Community Consultation processes and studies of the Geraldton Foreshores by the City of Geraldton Greenough. These documents included:
Beckwith Environmental (2010): City of Geraldton – Greenough Coastal Communities Study; “Life’s a beach” – the 2029 and beyond project; Development of Geraldton Regional Strategy; Design Guidelines: Beachfront Sub-Precinct, Beresford, City of Geraldton – Greenough,
February, 2008; Geraldton Regional Centre Strategy, Western Australian Planning Commission, August,
2005; Report: Coastal Vulnerability Study and Risk Assessment Program Coordination, NACC,
June 2010; City of Geraldton – Greenough Local Bike Plan (2009): 2009 – 2014 Implementation
Programme, OPUS 2009; Our Foreshore: A Survey of Geraldton – Greenough Residents – Short Report, Peter Howard
& Ann Larson, October 2009 Geraldton – Greenough Coastal Strategy and Foreshore Management Plan, ATA
Environmental, February 2005; Geraldton Foreshore/CBD Redevelopment and Revitalisation Project: Stakeholder Schematic
Design Outcomes Report (Draft), Taylor Burrell, March 2002; Local TravelSmart Guide, City of Geraldton – Greenough, May 2011; Geraldton Volunteer Beach Monitoring Manual, NACC, February 2011
In conjunction with reviewing these documents, the City of Greater Geraldton facilitated a meeting between Cardno and the Key Stakeholders, with Stakeholder representation from City of Geraldton – Greenough, Geraldton Port Authority, Department of Transport and Curtin University at this meeting. The purpose of this meeting was for Cardno to gain an understanding of the Stakeholders concerns and aspirations in regards to the future development and management of the Beresford Foreshore section of Geraldton’s coastline, as well as key sources of information and data to support development of the Master Plans.
A summary of this research was presented by Cardno as a power point presentation during the first Community Consultation Meeting. Refer to Appendix A for a copy of this Summary.
Key considerations for incorporation into the Master Plans that were identified from this review process included:

Beresford Foreshore Coastal Protection and Enhancement–Master Plan Report Prepared for City of Greater Geraldton
MASTER PLAN REPORT March 2012 Version: 6 (Final) Page 75
Recreational Uses: o More public amenities needed; o Shade; o Places for fishing; o Provide for a hierarchy of beach users; o Link paths to broader network.
Landscape Amenity:
o Maintain natural beauty.
Ecological Values: o Plant local plant species; o Trees for shade.
Coastal Erosion (Note: Extensive and conflicting comments):
o Seek permanent solution; o Base solutions on scientific studies.
Coastal Facilities:
o Boardwalks; o Information along paths.
Coastal Zone Sustainability:
o Manage impacts of climate change.
5.3 Beresford Foreshore Community Feedback
Community Presentations were undertaken on the 3rd of November and the 8th of December 2011 to allow the Project Team to present the Master Plan to the general community and to obtain the views of the general community in respect to the presented Master Plan.
Refer to Table 5.1 for an analytical summary of the community feedback, and refer to Appendix D for tabulated individual comments from members of the community who participated in the Community Presentations.
The five main issues raised during the Community Consultation process and the response to these issues is as follows:
1) Down drift impact: The presence of the Port Channel has a permanent impact upon the sand movement along the coastline. The headland structures and rock structures are intended to contain the moving sand to within defined compartments. Sand will need to be imported and placed to the north of the last structure.
2) Progress protection measures: It is the intent of the City of Greater Geraldton to progress the outcomes and recommendations from this Master Plan Report and the presented Preferred Concept Design into a Detailed Design suitable for implementation during 2012.
3) Evaluate other options: The Council has previously evaluated other options which have been presented to the community as a part of the Coastal Process Study. The time required to undertake further re-evaluations of other options increases the risk that delays in implementing coastal protection works will result in further costs through loss of community assets and infrastructure.
4) Impact on marine life: As a part of the approvals process of the Master Plan, an Environmental Impact Assessment may be required. Cardno recommends the use of Environmental Management Plans during the construction phases of the works to manage

Beresford Foreshore Coastal Protection and Enhancement–Master Plan Report Prepared for City of Greater Geraldton
MASTER PLAN REPORT March 2012 Version: 6 (Final) Page 76
any potential impacts. This EIA will supplement the assessment undertaken by the Port as part of Statement 600. In other locations where similar structures have provided increased marine habitat for both fauna and flora. Along with the WSUD principles included in the Foreshore Enhancement works which will reduce the nutrient load of the stormwater entering the sea, the ability to disperse the stormwater at a greater depth via the seawall outfalls will reduce any potential stormwater impacts
5) Sand grain size: Sand grain size is an important factor in ensuring the success of any Coastal Foreshore Protective measures undertaken. The sand grain naturally occurring at Beresford Beach is 0.2mm in size. Two potential sources of sand have been identified to date, these being the Port Channel and the Southgate Dunes.
A summary of the range of issues raised in all the feedback provided along with some analysis is provided in Table 5.1 below.
Table 5.1 Analytical Summary of Community Feedback
Beresford Foreshore Community Feedback Overall View
Supportive Neutral Negative Total 25 11 8 44
57% 25% 18% 100%
Query items Count Rank % ResponseDown drift impact 11 1 11% Due to the impact of the Port Channel, there is an ongoing
impact on the natural sand down drift process. The proposed Headlands are sited and designed to contain the natural sand movement along Beresford beach into a series of compartments as a part of the ongoing Beresford Beach management process. Sand will need to be imported and placed to the north of the last structure.
Progress protection measures
7 2 7% It is intended that the Master Plan recommendations be progressed through a Detailed Design process followed by a Construction Phase to allow for the physical implementation of the protective measures.
Evaluate other options 6 3 6% Alternative Options have already evaluated and presented to community as part of the Coastal Processes Study. By revisiting these scenarios there is a danger that further foreshore and potentially assets will be lost.
Impact on marine life 6 5 6% In other locations where similar structures have provided increased marine habitat for both fauna and flora. Along with the WSUD principles included in the Foreshore Enhancement works which will reduce the nutrient load of the stormwater entering the sea, the ability to disperse the stormwater at a greater depth via the seawall outfalls will reduce any potential stormwater impacts
Sand grain size 5 4 5% Sand grain size is an important factor in ensuring the success of any Coastal Foreshore Protective measures undertaken
Exposed sea walls 4 5 4% A continuous seawall line along Beresford Beach while protecting the infrastructure along Chapman Road will not address the issue of sand drift or allow for a high level of recreational amenity for beach users.
Funding/Cost plan 4 5 4% The project will be dependent upon funding from Royalties for Regions or other similar infrastructure funding programmes. An indicative Cost Estimate has been included in the Master Plan for the proposed works.
More consultation 4 6 4% There has been considerable public consultation in the past. The Master Plan proposal has addressed the diverse points of views expressed during the previous consultation processes.

Beresford Foreshore Coastal Protection and Enhancement–Master Plan Report Prepared for City of Greater Geraldton
MASTER PLAN REPORT March 2012 Version: 6 (Final) Page 77
Query items Count Rank % Response
Demarcated dual use path
3 6 3% Master Plan proposes a broad dual use pathway along the foreshore as part of the enhancement works. Pathway alignment is along former railway alignment where practical.
Can't change nature 3 6 3% The Master Plan proposed recognises the fact that the natural sand drift process cannot be stopped, but rather the intent is to manage the process to ensure sand when placed is not lost from the existing beach system
Sand bypass pipe 3 6 3% Based on the modelling undertaken, annual volumes for replenishment of sand are insufficient to warrant the expense of a sand by-pass pipe.
Not addressing issue 2 7 2% The Master Plan proposed recognises the fact that the natural sand drift process cannot be stopped, but rather the intent is to manage the process to ensure sand when placed is not lost from the existing beach system
Artificial reef 2 7 2% The option of an Artificial Reef has previously evaluated and presented to community. The main issue associated with an Artificial Reef is there is no guarantee of long term success.
Landscaping and security
2 7 2% Safety and security are major considerations of the Master Plan proposed. The detailed landscape design will be prepared based upon the principles of 'Crime Prevention Through Design'.
Toilets requried 2 7 2% Master Plan proposes a location for a toilet block adjacent to the northern headland. Final location will be determined during Detailed Design Phase.
Sand carting to St Georges
2 7 2% It is not anticipated that any sand cartage will be required to St Georges Beach. Sand management points have been included in the Foreshore Protection Works at Batavia Coast Marina and north of each headland.
More data 2 7 2% The foreshore protection models proposed have been based on currently available data sets with the design allowing for future modifications to be made. Given the critical timeframes required to protect the foreshore infrastructure assets, there is no time to allow for collection of additional data.
Extensible/Sustainable protection
2 7 2% The Headland Structures as indicated on the Master Plan can be increased in height as required to meet the changes resulting from Climate Change. The proposed structures have been designed to meet the projected changes over the next 50 years based on existing data sets available.
Peer review/2nd opinion
2 7 2% A peer review process may be undertaken by CoGG as required.
Write off assets/Do nothing
2 7 2% Due to the financial value of the infrastructure assets along Chapman Road, CoGG has determined that this is not an option.
Traffic calming Chapman Road
2 8 2% Traffic use of Chapman Road will be assessed, and any design adjustments including traffic calming devices will be based on the outcomes from the assessment in conjunction with other Strategic Planning decisions for the Precinct.
Maintain beach 1 8 1% One of the key objectives of the Master Plan Report is to maintain and enhance the existing beach front.
Detached breakwaters islands
1 8 1% Previous public opinion has been against the installation of further rock groynes structures. The Master Plan proposes the development of headlands which will have recreational use values as well as providing foreshore protection
Slip roads to car parks 1 8 1% Final layouts of car parking including slip lanes, disabled parking, bus access and parking locations will be considered in the Detailed Design Phase of the Works.
Impact swimming 1 8 1% Swimming areas have been provided to the south of the two headland structures. The area to the north of the last headland is not intended for swimming but rather for to allow for other seaside recreational pursuits.

Beresford Foreshore Coastal Protection and Enhancement–Master Plan Report Prepared for City of Greater Geraldton
MASTER PLAN REPORT March 2012 Version: 6 (Final) Page 78
Query items Count Rank % Response
No assessment of impact on Bluff Point
1 8 1% The modelling of the sand drift and replenishment considers the impact to Bluff Point.
Remove Port 1 8 1% As the Port is a major contributor of to the economy of Geraldton, this is not an option.
Playground 1 8 1% The Master Plan nominates a site for a playground facility. Final design including location and play facilities provided will be considered during the Detailed Design Phase of the Works.
Larger shade shelters 1 8 1% The Master Plan proposes a number of shade structures to be installed to the proposed headland structures. The final size of the shade structures will be determined during the Detailed Design Phase of the Works.
Detailed/Engineers drawings
1 8 1% Detailed Engineering Design works are a part of future works and will be required as a part of the CoGG's commitment to progress the protective works to the Foreshore.
Sand blowing 1 8 1% The foreshore enhancement works as proposed in the Master Plan provides defined access points to the beach for maintenance purposes plus the proposed revegetation of the foreshore area will reduce the amount of blown sand impacting upon adjacent residents during sand re=spreading works.
Who contributes to project
1 8 1% CoGG will be requesting the relevant organisations to contribute to project costs.
Minister of State to make decision
1 8 1% If required, CoGG will approach the Minister to make the final decision in respect to any or all of the proposed works as outlined in the Master Plan Report.
Bus parking 1 8 1% The proposed parking facilities have the capacity to cater for bus parking and associated passenger movement requirements. The locations and numbers of bus bays will be determined during the Detailed Design Phase of the Works.
No sheoaks 1 8 1% Final species selection will be determined at a later date. While Casuarina species are highly suitable as a foreshore plant the final use of Casuarinas species will be carefully considered
Tourism branding/Unique identity
1 8 1% The foreshore protection and enhancement works are intended to improve the amenity of the precinct which in turn will encourage greater visitation to the Beresford Beach foreshore. Any 'Unique Branding' of the foreshore precinct will be developed during the Detailed Design Phase of the Works.
Noise disturbance 1 8 1% Applying "Crime Prevention Through Design" principles to the ongoing design development of the Foreshore Precinct will allow for a greater level of visual policing of the precinct.
Lighting on shared pathway
1 8 1% Whilst not shown on the Master Plan, security and amenity lighting has been incorporated into the design. The main shared pathway will be illuminated to the curent Lighting Standards and suitable levels of amenity lighting will be provided for the recreational facilities.
Ongoing monitoring 1 8 1% City of Greater Geraldton will undertake monitoring of Beresford Beach to ensure sand is maintained to retain the design beach profiles within the compartments and to the north of the last structure. City of Greater Geraldton along with Geraldton Port Authority and Curtin University have an agreement to monitor sand movement along the Geraldton Coastline.
Access for kayaks 1 8 1% Access for "paddle" recreational craft has been provided for at the points of beach maintenance access
Underground power 1 8 1% City of Greater Geraldton will need to assess the cost implications of undergrounding the existing electrical reticulation system.
Stormwater harvesting 1 8 1% Consideration has been made for WSUD treatment for stormwater within the Foreshore Precinct. Any stormwater outlets will be constructed into the headland seawalls.

Beresford Foreshore Coastal Protection and Enhancement–Master Plan Report Prepared for City of Greater Geraldton
MASTER PLAN REPORT March 2012 Version: 6 (Final) Page 79
Tarmac for pathways not concrete
1 8 1% Final Selection of surface finish will be dependent upon both construction and lifecycle cost factors, pavement durability and aesthetics
Ability to grow trees 1 8 1% Tree species with ability to withstand coastal conditions will be selected during the Detailed Design Phase.

Beresford Foreshore Coastal Protection and Enhancement–Master Plan Report Prepared for City of Greater Geraldton
MASTER PLAN REPORT March 2012 Version: 6 (Final) Page 80
6 Conclusions and Recommendations
Based on the data available and the future predictions in relation to sea level changes, it is Cardno’s opinion that the City of Greater Geraldton and associated Stakeholders initiate foreshore protective measures along Beresford Foreshore to protect the community infrastructure that has been installed along the length of Chapman Road adjacent to the beach.
Cardno make the following recommendations to the City of Greater Geraldton and their associated Stakeholders in respect to the Beresford Foreshore Coastal Protection and Foreshore Enhancement works:
3) Option 1B as presented in this Master Plan Report (Refer to Figure 2.1) should be implemented as a matter of urgency to protect the existing infrastructure along Chapman Road;
4) Option 3 (or variations of this Option) to be implemented over time based on monitoring the performance of the installed protective measures in respect to sand movement and replenishment requirements. Option 3 could be implemented in stages as indicated in Figure 3.3 based upon the availability of funding.
5) Continual monitoring of sea level changes should be undertaken to assess the extent and rate of sea level change.
6) Adjust the heights of the protective measures (headlands and/or rock structures) at a future date based upon the monitored changes of sea levels.
7) Continue to engage with Curtin University and their ongoing programme as an integral component of the monitoring to continue to develop an understanding of the local Geraldton coastal dynamics;
8) Continue to liaise with the Geraldton Port Authority in respect to their channel dredging programme and the potential to use the dredged material as a potential source of replenishment sand.