Embed Size (px)
Citation preview

PuRPoSE
The environment of the Baltic Sea is endangered. Input of plant nutrients from highly intensive and specialized agriculture are a main source. BERAS Implemen-tation can solve this problem through a systemic shift to Ecological Recycling Agriculture in association with the whole food chain from farmer to consumer.
Who can uSE thE guidElinES?
The guidelines will help farmers and advisers to practice and develop Ecological Recycling Agriculture. This type of agriculture will improve the environmental conditions of the Baltic Sea. They can be equally used for educational purposes, by decision makers and by politicians.
contEntS
The guidelines consist of four books that cover the following topics:
The Farming Guidelines give basic practical recommendations for implemen-ting ERA and present proven agronomic measures and optimization strategies for effective nutrient recycling within the farm and between different farm types during and after conversion. Included are Software Tools that help to assess and improve sustainable crop rotation planning and nitrogen fluxes on a farm level.
The Economic Guidelines give advice and support to farmers how to plan the conversion process and highlight how the changes to ERA farming will affect farm economy.
In the Marketing Guidelines farmers can find support and ideas on how to more effectively promote and sell organic and ERA products.
The Farm Examples provide a personal presentation of different farms around the Baltic Sea, mainly farms in conversion to ERA, their challenges and future plans.
The books are available at www. beras. eu in digital form.
Ecological REcycling agRicultuREGuidelines for farmers and advisors Vol I - IV
Stei
n-Ba
chin
ger
Reck
ling
gra
nste
dt
Eco
log
ica
l RE
cyc
lin
g a
gRi
cult
uRE
Vol
i Fa
Rmin
g g
uid
Elin
ES
Vol i: FaRming guidElinESKarin Stein-Bachinger, Moritz Reckling, Artur Granstedt
Farming guidelines
Economicguidelines
Marketingguidelines
Farmexamples
Part-financed by the European Union (European Regional Development Fund
and European Neighbourhood and Partnership Instrument)
PartfinancedbytheEuropeanUnion(EuropeanRegionalDevelopmentFund
andEuropeanNeighbourhoodandPartnershipInstrument)
Biodynamic Research Institute
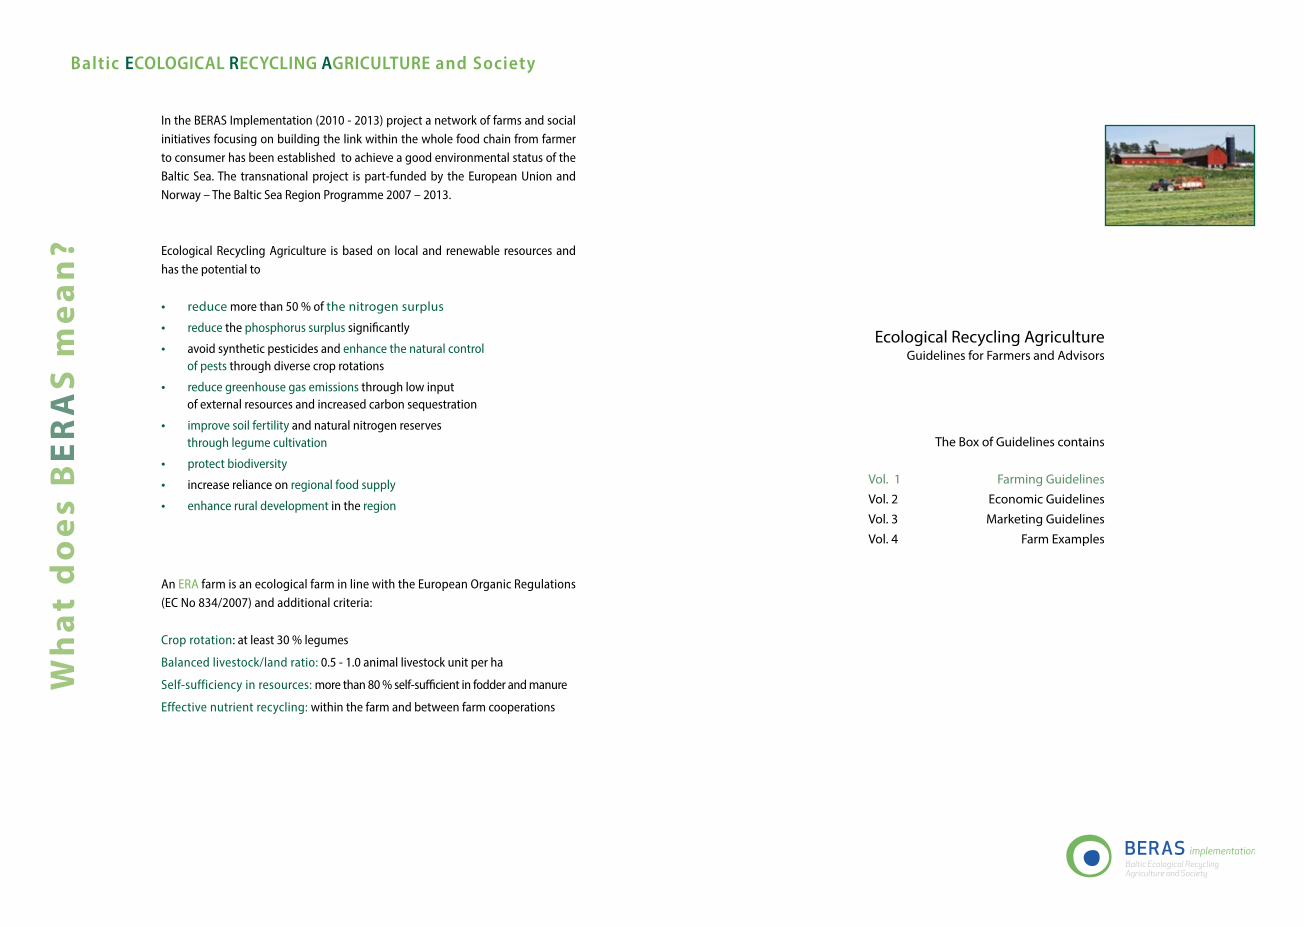
In the BERAS Implementation (2010 - 2013) project a network of farms and social initiatives focusing on building the link within the whole food chain from farmer to consumer has been established to achieve a good environmental status of the Baltic Sea. The transnational project is part-funded by the European Union and Norway – The Baltic Sea Region Programme 2007 – 2013.
Ecological Recycling Agriculture is based on local and renewable resources and has the potential to
• reduce more than 50 % of thenitrogensurplus
• reduce the phosphorus surplus significantly
• avoid synthetic pesticides and enhance the natural control of pests through diverse crop rotations
• reduce greenhouse gas emissions through low input of external resources and increased carbon sequestration
• improve soil fertility and natural nitrogen reserves through legume cultivation
• protect biodiversity
• increase reliance on regional food supply
• enhance rural development in the region
An ERA farm is an ecological farm in line with the European Organic Regulations (EC No 834/2007) and additional criteria:
Crop rotation: at least 30 % legumes
Balanced livestock/land ratio: 0.5 - 1.0 animal livestock unit per ha
Self-sufficiency in resources: more than 80 % self-sufficient in fodder and manure
Effective nutrient recycling: within the farm and between farm cooperations
Wh
at
do
es
BE
RA
S m
ea
n?
Baltic Ecological REcycling agRicultuRE and Society
EcologicalRecyclingAgricultureGuidelinesforFarmersandAdvisors
TheBoxofGuidelinescontains
Vol.1 FarmingGuidelinesVol.2 EconomicGuidelinesVol.3 MarketingGuidelinesVol.4 FarmExamples

Imprint
Karin Stein-Bachinger, Moritz Reckling, Johannes Hufnagel, Artur Granstedt
Artur Granstedt (SE), Karin Stein-Bachinger (GE), Henning Hervik (DK), Helle Reeder (SE), Jaroslaw Stalenga (PL), Wijnand Koker (SE), Moritz Reckling (GE), Johannes Hufnagel (GE).The committee was supported by several project and associated partners.
© 2013 Nikola Acuti, Berlin, www.gruenegrafik.de
Daphne Thuvesson
Medialis Offsetdruck, Berlin
Text highlighted in green refers to another chapter or book.
The information contained in this book was prepared by the authors to the best of their knowledge and was reviewed with the greatest care by the assistance of external experts. Nevertheless mistakes may not be completely ruled out. For this reason all of the information is given without any obligation or guarantee on the part of the authors.The guidelines and all of their contents are protected by copyright. The material may be reproduced and shared among potential users. The reference to the au-thors is obligatory.
First edition August 2013ISBN 978-3-00-042440-3
Business correspondence with:Kulturcentrum 13,15391 Järna, SwedenTel. +46 (0) 8 551 577 99E-Mail: [email protected]://www.beras.eu
Editors
Members of the guide lines committee
Layout and illustrations
Correction of the English text
Production
Vol. 1 Farming Guidelines
Contents
Preface 5How to save the Baltic Sea 7Soil fertility 15Crop rotation 27Legumes 39Manure 51Animal husbandry 63Plant protection 79Phosphorus 89Farm cooperations 97ERA Software Tools 107
Nitrogen budget calculator 109Legume estimation trainer 115ROTOR – Organic crop rotation planner 123
Appendices 131To find out more 131List of abbreviations 134Addresses of editors and authors 135Project partners 136

Preface
Despite various measures the eutrophication of the Baltic Sea is not de-creasing and the resilience of multiple ecosystems is at stake. In this si-tuation business as usual is not an option. New approaches are needed creating a safe operating space within the environmental boundaries. BERAS develops and implements practical examples where innovation and entrepreneurship from a multisectorial engagement flows into re-alistic, fully integrated ecological alternatives for the whole food chain - from farmer to consumer.
The BERAS concepts have been developed through two transnational projects part-financed by the European Union and Norway (the Baltic Sea Region Pro-gramme), BERAS (2003 – 2006) and BERAS Implementation (2010 – 2013). It is the common efforts from the partnership from nine countries around the Bal-tic Sea (Sweden, Denmark, Germany, Poland, Belarus, Lithuania, Latvia, Estonia and Finland), Russia and Norway and includes national and local authorities, uni-versities and research institutes, advisory services, ecological and environmental NGOs, farmers’ organizations, food chain actors and finance institutions. The concept of Ecological Recycling Agriculture (ERA) is based on many years of research and studies on how organic farms can be organized to be truly sus-tainable and environment-friendly and has demonstrated its potential related to reduction of nutrient leakage from the farm, soil carbon sequestration/cli-mate effect, biodiversity and increased soil fertility. BERAS has also successfully started the implementation of fully integrated, full scale examples of regional Sustainable Food Societies (SFS) in all countries in the Baltic Sea Region. The consumer engagement concept “Diet for a clean Baltic” offers a sustainable lifestyle with consumption of enough and good food without threatening the environment of the Baltic Sea or the planetary boundaries.
The Guidelines for Ecological Recycling Agriculture focus on the work by the farmer. It is the result of a transnational Baltic Sea Region cooperation by far-mers, advisors and researchers. With the guidelines, we hope to encourage and help conventional farmers to convert to ERA farming as well as to support or-ganic farmers to optimize their system towards recycling agriculture. We want to thank each of the individual authors of these Guidelines for their dedication to the work and also for the coordinating function performed by Dr. Karin Stein-Bachinger at the Leibniz-Centre for Agricultural Landscape Research in Germany.
Artur Granstedt Jostein HertwigAssociate Professor Attorney at LawProject Coordinator Head of BERAS Secretariat
Resilience of our ecosystems is at stake
BERAS - background and main concepts
Guidelines for farmers and advisors
Catchment area of the Baltic Sea
Following the conclusion of the EU project BERAS Implementation in 2013 a Network Agreement has been concluded to further develop BERAS and secure the continuation of the concepts both in the Baltic Sea Region and to share our competence and building alliances with initiatives in other parts of the world.
BERAS future
Sweden
eStonia
Latvia
BeLaruS
Lithuania
FinLand
Germany
PoLand
denmark
ruSSia

3
How to save tHe baltic seaArtur Granstedt and Karin Stein-Bachinger
Key objectives 8Ecological situation of the Baltic Sea 9Present agricultural situation 10Future scenarios 12Principles of Ecological Recycling Agriculture 13Farm example – Nutrient recycling 14
6

Bottom oxygen concentration
geo
Photo-
synthesis
Respi-
ration
bio Radiation of heatSolar radiation
Photosynthesis Burning
Ecosystem earth out of balance
Basic ecological conditionsw, recycling and biological diversity
8
How to save the Baltic Sea
9
Ecological situation of the Baltic Sea
The Baltic Sea is a unique marine area. The losses of nitrogen and phos-phorus via leaching and erosion are a prime contributor to the eutrophi-cation of streams, lakes and, ultimately, the sea. There, they stimulate the growth of algae, leading to the so-called algae bloom. When the algae die in autumn their decomposition uses up the dissolved oxygen in the water. The depletion of the dissolved oxygen favors organisms that release hydrogen sulphide that kills many fish and aquatic organisms. This results in marine dead zones in the sea bed which increase every year. Hydrogen sulphide is now produced in large areas – close to 70,000 square kilometers [1].
The Baltic Sea drainage area covers ca. 1.7 million km2, an area about four times as large as itself. Sweden (25 %), Finland (19 %), Poland (18 %) and Russia (17 %) have the highest share, while Belarus (5 %), Latvia (4 %), Lithuania (4 %), Estonia (3 %), Denmark (2 %), Germany (2 %), Norway (1 %), and Ukraine (1 %) have a small share. A total of 85 million people live in this land area. It consists of 160 million ha of which 30 million is arable land. Agriculture is responsible for about 50 % of both nitrogen and phosphorus leaching to the Baltic Sea.
For three decades, the Helsinki Commission (HELCOM) has worked to protect the marine environment of the Baltic Sea from all sources of pol-lution through intergovernmental cooperation between the countries in this drainage area [42]. The HELCOM Baltic Sea Action Plan aims at restor-ing the good environmental status of the Baltic marine environment by 2021 (www.helcom.fi) (see [1] pp 49).
HELCOM
Drainage area
Key objectives
The flow of energy from the sun, the recycling of nutrients and organic matter and the diversity of living organisms in interaction give us the air we breathe, the water we drink and the food we eat. Birth and death feed on and into each other. In a balanced ecosystem the synthesis of com-plex organic substances through the photosynthetic capacity of green plants is in equilibrium with the decomposition and combustion of or-ganic matter. Our future is now threatened because the decomposition of organic matter and the combustion of fossil carbon compounds are greater than the synthesis by green plants [24, 1].
Without recycling in agriculture and other sectors non-renewable re-sources are exploited and released into the environment resulting in more and more pollution. The global growing surplus of carbon dioxide and other greenhouse gases in the atmosphere and the regional surplus of nitrogen and phosphorus compounds in the soil and water systems together with increasing amounts of poisonous chemicals is the chal-lenge of our time.
Ecological farming and a changed lifestyle can help us meet these chal-lenges - but we must act now! The objective of the BERAS Implementa-tion project, of which these guidelines are a part, is to support activities within the agricultural sector that will help to restore the ecological bal-ance through conversion to ERA farming including the whole food chain from farmer to consumer.
Global aspects
What can we do?
Basic ecological conditions [24, compare 1]
energy flow, recycling and biological diversity
Areas of the Baltic Sea that have oxygen-free (< 2ml O/ liter water) seabeds [47]

10
How to save the Baltic Sea
11
Fodder
Seed
Lime
NPK
Mineral-fodder Grassland
Leaching
Output70 N
Milk andmeat
FodderGaseous
emissions
Specialized animal farmInput, output and surplus of Nitrogen kg/ha and year
(Avarage 701 dairy farms 00-06, data from Swedish board of agriculture report 2008:25)
Meat
Livestock
Animal production is mainly concentrated in southern Sweden, Den-mark and Central-West Finland. Specialized animal farms have an ani-mal density which is two to three times higher than that which can be based on the farm’s own fodder production. As a result the manure production is much higher than what can be utilized in the farm’s own crop production. Plant nutrients in the animal fodder produced on the specialized crop farms are exported to the increasingly fewer but more intensive animal farms where the surplus is accumulated and finally re-sults in losses to the environment (a linear flow). A part of the fodder input is additionally imported from other countries with serious environmental consequences such as deforestation to give room for soya and palm oil production. Animal farms with grassland also buy artificial fertilizers despite a surplus of animal manure. Data from 701 farms [1, 2] presented in the example below show an aver-age surplus on dairy farms of 130 kg N and 3 kg P per ha and year. The increasing animal density results in increasing surpluses of nitrogen and phosphorus. It is this type of farm that contributes most to agriculture being responsible for an essential part of the nitrogen and phosphorus pollution to the Baltic Sea.
Specialized animal farm [1]
Input, output and surplus of nitrogen (kg/ha and year)Average 701 dairy farms 2000-2006, data from Swedish board of agriculture report 2008: 25
Specialized crop farmInput, output and surplus of Nitrogen kg/ha and year
(Avarage 563 farms 2001 - 2006, data from Swedish board of agriculture report 2008:25)
Seed
Lime
NPK
Input150 N
Gaseous
Leaching
Cash crops
Output105 N
emissions
Present agricultural situation
In Sweden specialized crop farms dominate the fertile plains of the coun-try. On these farms on average 150 kg nitrogen (N) per ha and year is ap-plied. This is mainly in the form of artificial fertilizers produced with the help of fossil energy (about 1 kg oil per kg N and the additional emission of greenhouse gases from the Haber Bosch process). The return from this input is on average 100 kg N/ha in crop products resulting in a surplus lost to the environment of about 50 kg N/ha and year. The figure below is based on official statistics from the national extension programme for nutri-ent conservation ”greppa näringen” in Sweden including more than 1,000 farms [1, 2]. Although it is not these types of farms that have the highest losses of ni-trogen and phosphorus running out into the Baltic Sea, it is here that the prerequisites are created for the high losses. Most of the crop production is sold via the fodder industry to specialized animal farms where high nutrient surpluses are accumulated and lost to the atmosphere and to water systems instead of being recycled (up to 130 kg N/ha) [1, 2]. The specialized crop farm is dependent on the annual input of artificial fertilizers, the macro-nutrients N, P and K, to compensate the output. As illustrated below mainly grain is produced. Approximately 80 % of all grain produced is sold via the fodder industry to specialized animal farms.
Specialized crop farm [1]
Input, output and surplus of Nitrogen (kg/ha and year)Average: 563 farms 2001 - 2006, data from Swedish board of agriculture report 2008: 25
Cereals
Cereals
Oil plants CerealsPeas
Deposition Deposition
Surplus45 N
Input 200 NFodder +Fertilizer
Surplus130 N
Liquid manure
Liquid manure
Fodder(from crop farms
and import)
Fodder

12
How to save the Baltic Sea
13
Principles of Ecological Recycling Agriculture
ERA is based on the recycling principle of ecological agriculture com-bined with diverse crop rotation with a high share of symbiotic nitro-gen-fixing legumes like clover-grass leys, other fodder crops and food crops for sales. ERA farms have a good balance between crop and ani-mal production with an animal density on each farm (or farms in close recycling cooperation) adapted to the farm’s own fodder production. A maximum of 20 % of the fodder can be imported from other farms if the goal of 50 % lower losses of nitrogen per ha compared to the average conventional agriculture is to be realized [1].
Schematic illustration of the Ecological Recycling (ERA) farm [1]
The inner cycle shows the main flows of nutrients and organic matter between soil, stable and crops [1]. Key elements of the crop rotation are the legumes included e.g. in the leys. As humus building crops they ensure a sustainable soil fertility and nitrogen supply to the following crop and are beneficial for plant protection. A large share of the har-vest from the farm feeds its animals. On ERA farms, ruminants (animal husbandry) play a main role as they can digest cellulose which means they can feed on crops that cannot be used for human nutrition. Their manure is returned to the soil and contributes to soil fertility.
Leaching
Cash crops
DepositionGaseousemissions
Mineralfodder
Foddercrops
Manureand urine
Animalproducts
ERA results in a more than 50 % lower nitrogen surplus per ha and lower greenhouse gas emissions compared to conventional agriculture [2,3]. Nearly no losses of phosphorus will occur as well as a complete pre-vention of synthetic pesticide loads. Low input of external resources cause a reduction of greenhouse gas emissions. Additional improve-ment of soil fertility and quality of food as well as biodiversity are also well docu mented [1,3,12,50]. Ecological recycling agriculture does not imply that we return to the illusion of idyllic pictures from 100 years ago. How ever it does mean that we can – using all the technological and biological knowledge we have today – recreate agriculture that is based on the underlying conditions necessary for sustaining an ecosystem and make informed human par-ticipation possible in the future.
Effects of ERA
Future scenarios
If the new EU states Estonia, Latvia, Lithuania and Poland reach the same levels of nutrient surplus as Sweden, Finland and Denmark the surplus and the total load to the Baltic Sea would increase by more than 50 % [2, 3]. Long term field trials and the evaluation of nutrient fluxes on farms show how it is possible to increase soil fertility and natural production capacity through a highly productive, modern, organic farming practice based on local and renewable resources – Ecological Recycling Agriculture (ERA) by building a link within the whole food chain from farmer to consumer [1].
input (nitrogenfixation) 57 N
Cultivatedlegume/ grass ley
Output 22 N
Surplus 36 N
Green fodder
Fodder grain
Bread grain

3
Farm example – Nutrient recycling
This farm example describes the distribution of crops, crop rotation and animals on the biodynamic experimental farm Skilleby in Järna, Sweden, which is representative for the average of the Ecological Recycling Agri-culture (ERA) farms studied [2, 3]. The number of animals is adapted to the farm’s fodder production ca-pacity (0.6 livestock units per ha). This is the same animal density that average agriculture has and is related to our consumption of animal products in Europe (2/3 of the protein consumption). On this farm this is based on ruminants. The rest of the arable land on the farm (16 %) is used for human food crop production, mainly bread grain but also hor-ticulture production. It is important to note that the stable manure on this ERA farm is also used for biogas production in a unique two stage biogas plant before being used as re-cycled fertilizer. The substrate for biogas production can also include ecological wastes from large scale kitchens, thus increasing the rate of recycled nutrients.
Example of Ecological Recycling Agriculture / ERA
The prototype farm Yttereneby – Skilleby in Järna, SwedenThe animal density is adjusted to the farm’s feed production capacity. In this case fodder crops on 84 % and crops for sale on 16 % of the farm area and an animal density of 0.6 AU/ha (= average for Sweden and European food consumption) [1].
Prototype farm
Yttereneby and Skilleby 2003
FeedSeed
MilkMilk products
Veget. Root crops1.5 %
0.5 %
Biogas
0.6 AU/ha
450 m³ urine + 600 m³ manure + dung/urine pasture
Ow
n fe
ed >
84
% o
f the
are
a
Breadgrain
Recycling ExportImport
Ley(grass land)
47 %
Pasture21 %
Breadgrain15 %
Feedgrain15 %
Herd47 cows39 helfers10 calves29 sheep{Arable land ha Crop rotation
Crop rotation 106 Year 1 Spring cereals + insowing
Pasture 29 2 Ley I
Vegetable - 3 Ley II
Root crops 2 4 Ley III
Total 137 5 Winter cereals
Natural pasture 25
14
Soil fertilityKarin Stein-Bachinger
Why it matters 16Principles of soil fertility 17Functions and benefits of soil organic matter 18How to maintain and increase soil fertility 20Control of soil fertility 22Humus balances 24Nutrient balances 25
How to save the Baltic Sea
Soil fertility
16 17
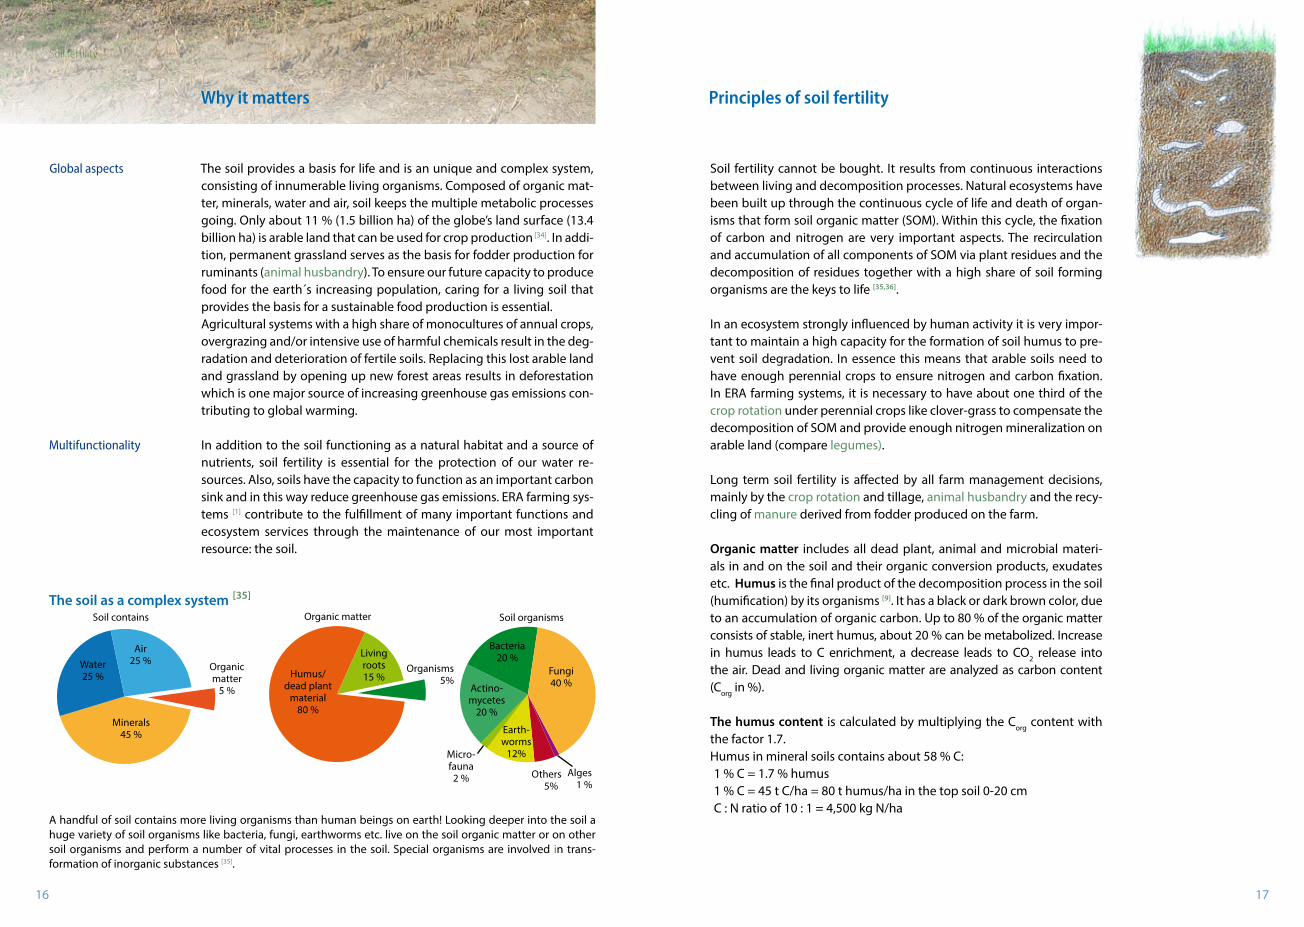
The soil as a complex system [35]
A handful of soil contains more living organisms than human beings on earth! Looking deeper into the soil a huge variety of soil organisms like bacteria, fungi, earthworms etc. live on the soil organic matter or on other soil organisms and perform a number of vital processes in the soil. Special organisms are involved in trans-formation of inorganic substances [35].
The soil provides a basis for life and is an unique and complex system, consisting of innumerable living organisms. Composed of organic mat-ter, minerals, water and air, soil keeps the multiple metabolic processes going. Only about 11 % (1.5 billion ha) of the globe’s land surface (13.4 billion ha) is arable land that can be used for crop production [34]. In addi-tion, permanent grassland serves as the basis for fodder production for ruminants (animal husbandry). To ensure our future capacity to produce food for the earth´s increasing population, caring for a living soil that provides the basis for a sustainable food production is essential. Agricultural systems with a high share of monocultures of annual crops, overgrazing and/or intensive use of harmful chemicals result in the deg-radation and deterioration of fertile soils. Replacing this lost arable land and grassland by opening up new forest areas results in deforestation which is one major source of increasing greenhouse gas emissions con-tributing to global warming.
In addition to the soil functioning as a natural habitat and a source of nutrients, soil fertility is essential for the protection of our water re-sources. Also, soils have the capacity to function as an important carbon sink and in this way reduce greenhouse gas emissions. ERA farming sys-tems [1] contribute to the fulfillment of many important functions and ecosystem services through the maintenance of our most important resource: the soil.
Global aspects Soil fertility cannot be bought. It results from continuous interactions between living and decomposition processes. Natural ecosystems have been built up through the continuous cycle of life and death of organ-isms that form soil organic matter (SOM). Within this cycle, the fixation of carbon and nitrogen are very important aspects. The recirculation and accumulation of all components of SOM via plant residues and the decomposition of residues together with a high share of soil forming organisms are the keys to life [35,36].
In an ecosystem strongly influenced by human activity it is very impor-tant to maintain a high capacity for the formation of soil humus to pre-vent soil degradation. In essence this means that arable soils need to have enough perennial crops to ensure nitrogen and carbon fixation. In ERA farming systems, it is necessary to have about one third of the crop rotation under perennial crops like clover-grass to compensate the decomposition of SOM and provide enough nitrogen mineralization on arable land (compare legumes).
Long term soil fertility is affected by all farm management decisions, mainly by the crop rotation and tillage, animal husbandry and the recy-cling of manure derived from fodder produced on the farm.
Organic matter includes all dead plant, animal and microbial materi-als in and on the soil and their organic conversion products, exudates etc. Humus is the final product of the decomposition process in the soil (humification) by its organisms [9]. It has a black or dark brown color, due to an accumulation of organic carbon. Up to 80 % of the organic matter consists of stable, inert humus, about 20 % can be metabolized. Increase in humus leads to C enrichment, a decrease leads to CO2 release into the air. Dead and living organic matter are analyzed as carbon content (Corg in %).
The humus content is calculated by multiplying the Corg content with the factor 1.7. Humus in mineral soils contains about 58 % C: 1 % C = 1.7 % humus1 % C = 45 t C/ha = 80 t humus/ha in the top soil 0-20 cmC : N ratio of 10 : 1 = 4,500 kg N/ha
Principles of soil fertility
Soil organismsOrganic matterSoil contains
Water 25 %
Air 25 %
Minerals 45 %
Bacteria 20 %
Fungi 40 %
Alges 1 %
Micro-fauna 2 %
Earth-worms
12%
Actino-mycetes
20 %
Organisms 5%
Others 5%
Organic matter
5 %
Living roots15 %Humus/
dead plant material
80 %
Multifunctionality
Why it matters

Soil fertility
18 19
Functions and benefits of soil organic matter
Distinctive for fertile soils is their sustained productivity, of great im-portance to farmers, as well as their high self-regulation capacity, e.g. against pathogens. Fertile soils provide us with clean groundwater, serve as filter, buffer and storage of harmful substances, store nutrients and carbon [36].
The guiding principle from the beginning of organic farming in the early 1920s is described by the functional chain: healthy soils – healthy plants – healthy animals – healthy human beings [36]. Humus provides the basis for continuous building and decomposition processes and in-fluences the physical, chemical and biological soil characteristics. In ERA farming systems the equilibrium of these processes is a key element for sustainable production.
Soil organic matter and humus [9]
• improve soil life and its structure
• supply, inter alia, nutrients to the soil and soil microorganisms
• increase the water-holding capacity
• improve porosity for air and water as well as friability of heavy soils
• prevent nutrients from leaching
• stabilize soils against erosion
• improve plant growth in spring through a quicker soil heating
• lead to saving of energy through easier tillage
• have positive climatic effects as CO2 sink.
The humus content of the soil is characterized by organic carbon (Corg ) and nitrogen (Norg ). Their proportion gives some notion of the humus quality. The C : N ratio in soils varies between 10-12 : 1 (manure). Humus content can only be increased within a particular range (e.g. it takes 40 – 60 years to increase the carbon content in top soil by 1 % [25]). Arable soils contain 0.6 – 4.0 % carbon. In line with the Cross Compliance regu-lations there should be a minimum content of humus in different soil types when analyzed over a six year period (data for Germany) [18]:
Clay content < 13 %: 1 % humus (= 0.6 % C)
Clay content > 13 %: 1.5 % humus (= 0.9 % C)
Clay content > 25 %: > 2 % humus (= 1.2 % C)
Fresh dead plant residues have a higher C : N ratio, while their decom-position leads to a lower C : N ratio. Organic material (from plants or manure) which is incorporated into the soil shallowly or deposited on the soil surface feeds the soil organisms, increases the aeration and the organic activity which leads to the mobilization of bound minerals mak-ing them available to the crops being cultivated.
The activity of the soil organisms increases the weathering processes which in turn influences the mineralization processes. A short vegeta-tion period, high precipitation and droughts all lead to a lower minerali-zation rate. Soil tillage and the liming of acid soils increase the activity of bacteria and can lead to a decrease of humus [9]. Crop rotations with legumes maintain the favorable microbial population balance thereby improving soil fertility.
On arable land the top soil contains about 60 - 90 t humus per ha. This is the equivalent of about 3000 - 6000 kg of N per hectare. Under good temperature and soil moisture conditions about 1 - 3 % of the organic nitrogen can, together with other nutrients such as phosphorus, sulfur and important trace elements, bound in the soil organic matter become available to plants through the mineralization [27].
Calculation example
Humus content of: mineralization of:
1.5 % 20 - 40 kg N/ha
3.0 % 40 - 80 kg N/ha
Humus content and quality
CO2 accumulation capacity
Calculations show [15] that a carbon accumulation in soils up to 500 kg C/ha and year is possible to achieve, depending on the initial content and the share of legume-grass and other humus building crops in the crop rotation. This equals about 1.5 up to 2.0 t CO2 /ha and year.

Soil fertility
20 21
All management decisions like crop rotation and tillage, animal husbandry and manure handling affect the soil fertility in the long run. Positive effects can be reached by [19, 9]:
• Carefully planning the crop rotation by including at least 30 % ley con-tent, based on legume grass mixtures as the main humus-increasing crop. A balanced proportion of humus demanding crops and fertility building crops is necessary. One key factor for increasing soil fertility is the effective rooting depth of the cultivated plants. Annual crops like cereals can reach up to 1.5 m rooting depth, while alfalfa can reach 4.0 m if grown as a perennial. Root hairs have a substantial effect on the spatial access of the plant to potassium and other essential nutrients in the soil [37].
• Supplying organic matter via green manure (e.g. catch and cover crops) and animal manure (solid manure, slurry, compost). Harvest residues (stubble, straw) and roots have a positive effect as well.
• Equally distributing and incorporating plant residues and manure.
• Keeping the soil covered with plants as much as possible to avoid erosion and nutrient leaching.
• Minimizing tillage. Intensive inverting tillage can decrease humus content considerably.
• Preventing soil compaction. Microbial activity improves with aerated soil and water permeable pores. Well functioning soil drainage improves plant health, rooting depth and intensity and the uptake of nutrients.
• Ensuring a sufficient lime supply, which is the precondition for topsoil stability and nutrient availability. Acidity reduces bacterial activity
which results in lower rates of decomposition and nutrient releases, phosphorus and molyb-denum deficiencies can occur due to fixation. The optimum pH for most crops is between 6.0 and 7.0. Legumes are particularly sensitive to acidity, while potatoes thrive in moderately acidic soils. The availability of phosphorous de-creases at pH > 7.
Source: adapted from Kutschera, Wurzelatlas (1960)
Earthworms, along with other soil animals, play an unique role in building up soil fertility. With a life expectancy of up to 8 years they pro-duce up to 100 t excrement per ha and year. This is the equivalent of up to 0.5 cm soil increase in arable soils, and 1.5 cm on grasslands. Their excrements contain 5 times more N, 7 times more P and 11 times more K than the surrounding soil. Their activities have a positive effect on the soil by building stable crumbly structures which increase the aeration as well as the water and nutrient holding capacity and the facilitation of soil tillage. On arable fields earthworms incorporate up to 6 t of organic residues per ha and year and carry soil material from the subsoil to the top soil. Up to 90 % of the earthworm channels are occupied by plant roots allowing them to reach into deep soil layers without resistance. Inten-sive soil tillage decreases the amount of earthworm channels in the soil, leading to a reduced humus content. Especially rotation machines can cause earthworm losses of up to 70 % [35,51].
Crops and their effects on the humus content [25,38]
Negative humus effect Positive humus effect
--- -- - + ++ +++
Sugar beetPotatoes
Vegetables
MaizeVegetables
CerealsOil plants
Grain legumesStubble cropsLegume-grass
sown in autumn
Winter cover cropsLegume-grass undersown in
spring
Perennial legumesLegume-grass
How to maintain and increase soil fertility
Recommendations Earthworms [51]
Keep in mind!
Effects of agronomic measures on carbon (C) fixation in soils [15]
Measure C fixation / reduction(t/ha and year)
Conversion from arable land to grassland, green legume-based fallow > 1.0
Cultivation of perennial legumes/legume-grass mixtures 0.6 up to > 1.0
Organic fertilizers (manure, digestate, compost) > 0.5
Reduced tillage 0 up to 0.25
Conversion from grassland/fallow to arable land > -1.0
Cultivation of maize for silage -0.4 up to -0.8
Soil fertility
22 23
• According to country specific legal requirements soil analysis should be carried out every 6 years/field, based on representative field sam-ples (e.g. in autumn after harvest or early in spring) and analyzed with standard methods.
• The basic nutrients P, K, Mg, S as well as micro-nutrients should reach a site specific level. These values can be found in the country-specific fertilization recommendations. If clear deficiencies are analyzed, a fertilization of these elements is reasonable, using recommended fertilizers according to organic standards regulations.
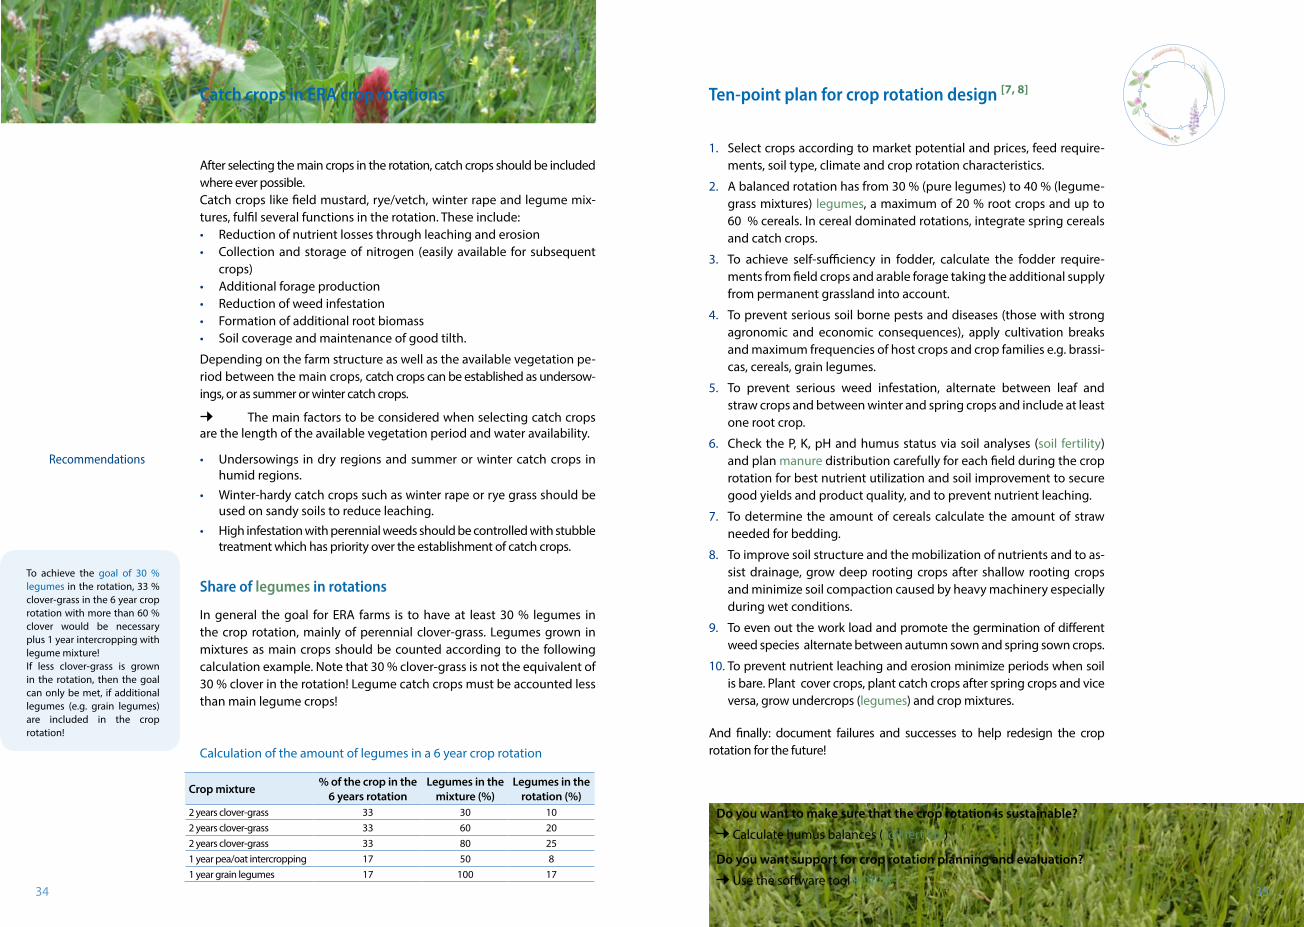
Be aware that both P and S are partly organically bound and are recycled with crop residues, organic biomass and the farms own manure. The potential mineralization of the organically bound nutrients is not included in the common analysis values.
• The pH value should reach a site specific optimum. Values below 5 or above 8 must be avoided. On sandy soils a lower pH (5.5 – 6.5) is com-mon. Deficiencies cause soil and plant health problems. Approved lime fertilizers can be found in the organic standards.
• The analysis of the nitrogen and carbon content plays a special role as changes become apparent only over a long period. Regarding ni-trogen more than 95 % of the N is fixed in the organic matter, only 1 - 3 % becomes available through mineralization each year. Measur-ing the organic carbon content (Corg) gives an idea of the soil specific values that should be reached, but does not provide information on soil fertility!
• Soil samples should not be taken after the spread of manure due to their uneven distribution!
a) Visual check
b) Visual check using in-expensive measurement equipment
c) Analysis of the nutrient content
Control of soil fertility
From the farmers point of view, there are different ways to assess soil fertility. Because of the high complexity of the dynamic soil processes a combination of several methods is recommended: visual methods by going out on the fields, analytic methods and humus and nitrogen bal-ancing methods [25, 36, 38, 39].
• Healthy plants are an indicator of a good soil condition.• Weeds like thistles and chamomile indicate soil compaction.• Soil structure on the surface: round soil particles and small holes
(e.g. from earthworm activities) indicate a fertile soil as opposed to erosion signs.
• Incorporation of plant residues: e.g. if straw remains on the surface for several months, the soil organisms are not active.
• A fertile soil smells and feels good (finger test). • During wet periods and in early spring the crops indicate where min-
eralization and the content of plant nutrients are low. Soil compac-tion, bad drainage systems and water logging can result in a lack of nitrogen which would limit crop yields.
• Spade diagnosis [36] to identify soil compaction, root density and di-versity, structure of soil particles (round or sharp-edged, possibility to break them apart), earthworm channels, other soil organisms.
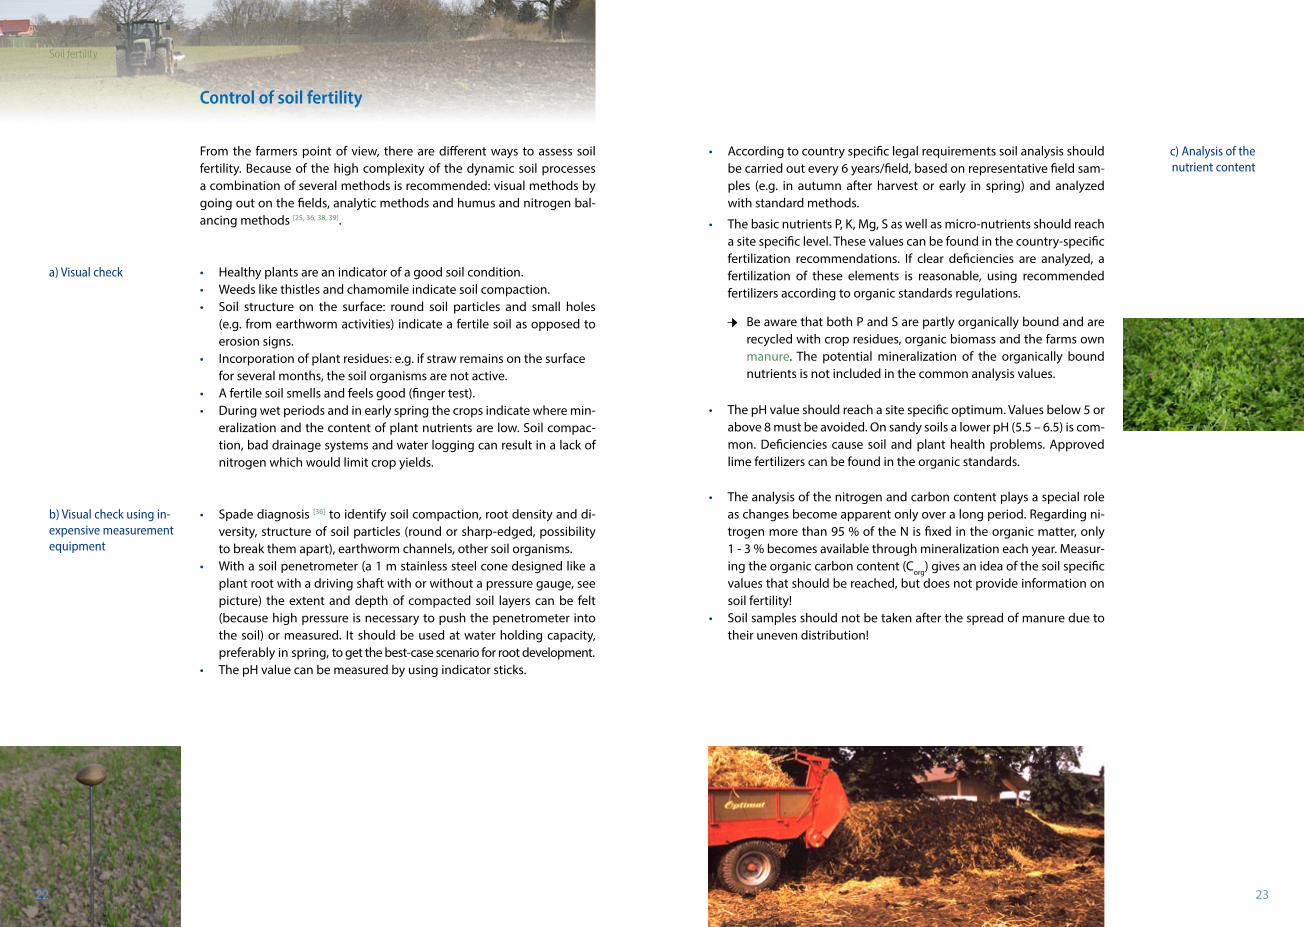
• With a soil penetrometer (a 1 m stainless steel cone designed like a plant root with a driving shaft with or without a pressure gauge, see picture) the extent and depth of compacted soil layers can be felt (because high pressure is necessary to push the penetrometer into the soil) or measured. It should be used at water holding capacity, preferably in spring, to get the best-case scenario for root development.
• The pH value can be measured by using indicator sticks.

Soil fertility
24 25
As an alternative or supplement to the methods previously described, humus balancing methods can be performed under practical conditions using easily available management data [25]. During the last decades there have been a lot of efforts to develop different methods, mainly in Germany [38]. Humus balancing methods are based on the share of humus reducing crops (root crops, silage maize) and humus producing crops (like legumes) in the crop rotation adding the supply of carbon rich substances like manure and straw [25]. Keeping in mind that this method cannot be transfered 1:1 to other countries, the following examples can give an impression about the effects of different cropping systems.
Nutrient balances
In addition to the previous methods, conclusions about nutrient fluxes and their efficiency on the farm level can be made with nutrient balanc-ing methods (at the farm gate, field and stable level). Within the BERAS Implementation project as well as in the former BERAS project the farm gate balances for the involved countries have been calculated using the Swedish method STANK in MIND. Results can be found in several publications [1, 2, 3] .
It is crucial to manage the binding and freeing of N and other nutrients in order to ensure that the level of available nutrients corresponds to the nutritional needs of the plant at any given time [1]. If this balance is achieved, nutrient losses to the environment are very low.
The nutrient balance at the farm gate provides information about the nutrient input from purchased goods (animals, seeds) including the N fixation of legumes. All sold products (crops, animals, milk etc.) are sum-marized as output [1, 5]. Taking nitrogen as an example, the difference between in- and output is an indicator for the farm and the environment:
1. Nitrogen surplus corresponds to potential N losses to the environ-ment.
2. Balanced saldo (plus/minus 20 kg N/ha around zero) indicates a good status. 3. Negative saldo indicates a lack of nitrogen and an insufficient N
supply within the farming system. The deficit needs to be compen-sated for by, e.g. increasing the portion of legumes within the crop rotation.
In case of phosphorus, a deficit of up to 2 kg P/ha seems to be well com-pensated through weathering processes and an uptake from the subsoil through deep rooting plants (e.g. clover and alfalfa) on mineral soils with a good status of non-soluble P stored in the mineral fractions.
Interpretation of the outcomes
Crop rotation A) is based on 40 % legumes and 0.5 LU/ha which results in a positive humus saldo.
Crop rotation B) with 20 % legumes and potatoes plus catch crops and fewer animals has a negative effect on the humus saldo. To compensate for the high humus demanding potatoes, a higher share of legumes and a reduced share of cereals and/or potatoes would be necessary.
A)Humus demand*
Humus supply*Humus saldo*
0.5 LU/ha 4 t manure/ha and yearCatch crops
Farm yard manure
Legume-grass 600 0 0 600
Winter wheat 20 t/ha rotted manure -280 0 800 520
Triticale -280 0 0 -280
Peas 160 0 0 160
Winter rye + legume-grass undersown -280 200 0 -80
Mean value of the crop rotation -16 40 160 184
Although, there is still more research needed for the improvement and adap tion of that method to different site conditions, this method can provide a rough estimation of the effects of various management prac-tices on field level, especially during the conversion phase. The basis for the calculations are humus reproduction coefficients, derived from long-term field experiments [38]. They are recommended in the German Cross Compliance Regulations as one method for evaluating soil fertility. These calculations are integrated in the software tool ROTOR as well.
Humus balances
B) Humus demand*
Humus supply*Humus saldo*
0.25 LU/ha 2 t manure/ha and year Catch crops
Farm yard manure
Legume-grass 600 0 0 600
Winter wheat - 280 0 0 -280
Potatoes 10 t/ha rotted manure - 760 200 400 -160
Triticale - 280 0 0 - 280
Winter rye + legume-grass undersown - 280 200 0 - 80
Mean value of the crop rotation - 200 80 80 - 40
* in kg C/ha and year
Calculation examples

Farm gate balances on ERA farms around the Baltic Sea have shown that nutrient surpluses can be reduced effectively [1, 3]. Moreover, there is a whole range of agronomic measures (see crop rotation, legumes, manure, and phosphorus) to avoid potential losses from leaching with regard to specific site and weather conditions.
A new study based on a comprehensive assessment of 74 studies from pairwise comparisons of organic vs. non-organic farming systems [50]
shows significant higher values of soil organic carbon for organically farmed soils, which means that organic/ERA farming has the potential to accumulate soil carbon.
However, investigations have also shown that nutrient deficiencies can occur [11, 40]. This can be the result of an insufficient share of legumes in the crop rotation or too little or ineffective manure handling. Investi-gations show that especially on specialized crop production farms the amount of legume-grass leys is reduced in order to maximize the share of cash crops. In such cases the necessary N-input could be provided by N-fixing cover or catch crops as well as undersown legumes in cereals. However, in the long run this can lead to a decline in soil fertility and to increasing weed infestation, which again would limit cash crop yields [40]. These are strong arguments for converting to ERA farming with integrat-ed animal and crop production (on each farm or on cooperating farms in close proximity).
The permitted maximal N surplus since 2009 is set at 60 kg N/ha and year, the critical N-load in leaching water corresponds to a mean con-centration of 50 mg nitrate/l [20]. In all countries official nutrient balanc-ing methods are available in order to compare with the legal restrictions according to the Cross Compliance regulations. Ask your adviser for help with these calculations and their interpretations.
Scientific results
Legal restrictions
Soil fertility
26
Crop rotationKarin Stein-Bachinger & Moritz Reckling
Why it matters 28Crop selection 30Rotational characteristics 32Catch crops in ERA crop rotations 34Ten-point plan for crop rotation design� 35Examples of crop rotations 36Review checklist 38

28
Crop rotation
29
Good planning and effective design of crop rotations are essential for ERA farms to ensure high yields and quality products as well as healthy and fertile soils. Legumes, which are deep rooting, nitrogen-fixing, hu-mus and soil fertility building crops, are grown in combination with a balanced share of nitrogen- and humus-demanding crops like cereals and root crops.
The food demand of the growing population in the Nordic countries around the Baltic Sea 150 years ago could be met due to the integra-tion of legumes in combination with the recycling of plant residues and manure. During this period every farm had only as many animals as it could feed from the farm [1]. In the middle of the 20th century, the in-creased use of mineral fertilizer and pesticides as well as the import of fodder from outside the farm led to an excessive simplification of crop sequences, with only a few crops that often did not include legumes. Since the 70s, when the interest in organic farming grew, the awareness of the importance of crop rotations increased as well. Nowadays effec-tive crop rotations are acknowledged as being a foundation of success-ful organic cropping systems [21].
During conversion to ERA farming, crop rotation needs to be adapted to the farm structure, site conditions, market options as well as labour and farm equipment. The main challenge is to ensure the farms profitability by building soil fertility for long-term productivity [8, 21].
The conversion process is started with the establishment of perennial legumes, mainly legume-grass mixtures, which are used as fodder or mulch. In many cases, farmers have more than one rotation sequence on their farm due to field variation and business decisions. However every crop rotation sequence on an ERA farm includes perennial legumes.
How to start?
Why it matters
Basics
Multifunctional benefits of crop rotations [adapted from 58]
Aim and benefits of crop rotations
Most of these effects will be seen over several years and include both the direct effects between crops and the indirect preceding-crop effects through the soil which accumulate over several years.
Definition Crop rotation means the succession of humus-increasing and humus-demanding crops on a field throughout a cycle of several years, while at the same time taking the site and farm specific restrictions into con-sideration.
Product quality
Yield
Labor
Soil fertility
Humus
Soil structure
Pre-crop effect
Process quality
Nature protection
Erosion
Nutrient leaching
Weedinfestation
Pests
Nitrogen supply
Fodder
Nutrients
ensu
resreduces
reduces
minimizes
reproduces
improves
mobilizes
optimizesoptimizes
secures
supp
orts secures
minimizes
stabilis
es
equals out
optimizes
Crop rotation
Main aims of designing crop rotations are to produce:
economically profitable cash crops and high quality feed.
This is achieved by designing economic and agronomic sound rota-tions taking phytosanitary constraints and crop nutrition into account. In addition, well designed crop rotations provide many other benefits to the whole farm. They are the principle means for controlling weeds, pests and diseases, stabilize yields and ensure the quality of products, both food and feed. They also support environmental and nature conservation goals.
History

30
Crop rotation
31
Crop selection
To design sound crop rotations, the economic and agronomic charac-teristics of crops need to be considered carefully. The selection of crops that are well suited to the farming environment and farm structure is the most important aspect for designing a rotation.
The selection of crops is defined by
• the climate and soil type (rainfall distribution, temperature, pH and soil texture)
• the marketing potential and • the feed requirements.
When converting to ERA farming the following steps can be implemented to ensure that the crops selected will fit the new system:
Six steps in the selection of crops when converting to ERA farming [22]
Step Proposed change Criteria for crop selection/ exclusion Crop examples
1 Exclude crops Low marketing potential Sugar beet, rape seed
2 Reduce share of crops
Phytosanitary constraints, diversification of cash crops
Wheat
High weed infestation risk, low internal farm demand
Barley
Nutrient supply difficult, replacement by legume-grass
Silage maize
3Increase share of specific crops
Cover the demand for feed, N-fixation, weed and disease suppression
Legume-grass, grain legumes
4Define share of cash crops
Marketing potential, economics, workload, crop rotation
Wheat, rye, potato
5 Include new cropsMarketing potential (occupy niches), crop diversification, crop rotation, N-fixation
Vegetables, spelt, legume-grass, legume/cereal mixture
6 Increase share of cover cropsIncreasing soil fertility, fodder production, weed suppression, reduction of N-leaching,
Phacelia, rye/vetch, buck-wheat, clover, mustard
The following characteristics need to be considered when selecting crops for inclusion in the crop rotation:
• the demand and supply of N • effects on humus• phytosanitary effects (maximum frequency and minimum breaks) and • the risk of erosion.
The length of the crop rotation is defined by the minimum break and maxi-mum frequency of the crops selected .
Crop characteristics relevant for ERA crop rotation (See also specifications for legumes) [expert assessment]
CropMaximum frequency (%)
Minimum break (years)
Demand of N
Supply of N*Effects on humus
Risk of water erosion**
Forage legumes strong regional differences low very highstrong increase
very low
Grain legumes 20 4 low high increase low
Cereals (general) 75 see specifications in this tablesee specifications in this tableLeaf crops (general) 50
Silage maize 66 0 high low strong decline high
Potato 20 4 high low strong decline high
Oat 25 3 low low decline middle
Wheat, triticale 33 0 high low decline middle
Barley 50 1 low low decline middle
Rye 66 0 low low decline middle
Rape seed 20 4 middle rather high decline middle
Cover crops - - low high increase low
* the N supply describes the residual N effect; ** during the vegetation period
Proposed share of crop types (ha %) for different ERA farm types [adapted from 22]
Farm type Legumes Cereals Root crops Catch cropsDairy farm 30-50 1) 30-50 5-15 20-50Mixed farm (mainly ru-minants)
30-40 2) 40-60 10-20 20-50
Mixed farm (pigs) 30-35 3) 40-60 15-25 40-601) mainly forage legumes, 2) forage and grain legumes, 3) forage or grain legumes, for green manure, sale, clover seed production

Crop rotation
33
Legumes, especially forage legumes are good preceding-crops because of their capacity to
• fix atmospheric nitrogen with the aid of nodule bacteria • supply N to the following crop • improve physical soil characteristics• nurture soil organisms • support accumulation of soil humus • mobilize deep soil nutrient resources through deep roots• supply phosphorus from soil store through mycorrhiza
Root and leaf crops are good preceding-crops because of their capacity to
• reduce weeds due to intensive mechanical cultivation measures• improve physical soil characteristics often leaving crumbly, aerated soil
behind• supply high levels of N to subsequent crops due to low C/N ratio in crop
residues
However they are less good due to their
• heavy decomposition of humus• vulnerability to crop rotation diseases (especially potatoes and sugar beets)
Cereals are less good preceding-crops because they
• have a high C/N ratio in crop residues• increase weed infestation risks and• leave the soil in poor condition.
Note that cereals have a decreasing preceding-crop value from: oat > rye > wheat > spring barley
The preceding-crop effect on yield differs between crops and is influ-enced by the preceding-crop type and soil type. The yield of cereals, e.g. following legumes are 20-30 % higher in comparison to cereal pre-crops. Such effects on the yield of the sub sequent crop need to be con-sidered in the economic calculations and highlight the importance of well-designed crop rotations. The effect on yield is greater on infertile than on fertile soils.
Rotational characteristics
Crops and crop types need to be alternated in order to reduce infesta-tion with problematic weeds, pests and diseases (plant protection). These include leaf and straw crops as well as winter and spring crops.
Bearing in mind the cropping limitations imposed by the farm structure, site conditions, market situation and the crop characteristics, the rota-tional characteristics describe the suitability of different crops in rela-tion to each other. Note that specific details, such as new varieties and catch crops, have not been taken into consideration.
For the suitability of crop combinations in the rotation, defined by one colour combining timing and phytosanitary constraints [23], choose the best combinations!
Combinations of two crops with a very positive preceding-crop effect should be avoided (‘luxury combinations’).
For the establishment of legume-grass different techniques are possible which require specific preceding crops e.g. cereals for undersowing.
N-demanding crops with high economic value, e.g. potato or bread wheat, should be cultivated after legume-grass.
Suitability of different crop combinations in the rotation [adapted from 23]
Preceding-crop effects
Preceding-crop effect on yield
Preceding crop
Following crop
W. wheat
S. wheat
W. barley
S. barley
W. rye, triticale
Spelt Oats Maize Legume-grass
Grain le-gumes
Potato W. rape Sun-flower
W. wheat
S. wheat
W. barley
S. barley
W. rye, triticale
Spelt
Oats
Maize
Legume-grass
Grain legumes
Potato
Winter rape
Sunflower
W. = winter; S. = spring
Suitability of crop combination
Very good Good Unfavorable Not advisable
Note: Plan to include catch crops before spring crops
34
Crop rotation
35
Catch crops in ERA crop rotations
After selecting the main crops in the rotation, catch crops should be included where ever possible.Catch crops like field mustard, rye/vetch, winter rape and legume mix-tures, fulfil several functions in the rotation. These include:• Reduction of nutrient losses through leaching and erosion• Collection and storage of nitrogen (easily available for subsequent
crops)• Additional forage production • Reduction of weed infestation• Formation of additional root biomass• Soil coverage and maintenance of good tilth.
Depending on the farm structure as well as the available vegetation pe-riod between the main crops, catch crops can be established as undersow-ings, or as summer or winter catch crops.
The main factors to be considered when selecting catch crops are the length of the available vegetation period and water availability.
• Undersowings in dry regions and summer or winter catch crops in humid regions.
• Winter-hardy catch crops such as winter rape or rye grass should be used on sandy soils to reduce leaching.
• High infestation with perennial weeds should be controlled with stubble treatment which has priority over the establishment of catch crops.
Share of legumes in rotations
In general the goal for ERA farms is to have at least 30 % legumes in the crop rotation, mainly of perennial clover-grass. Legumes grown in mixtures as main crops should be counted according to the following calculation example. Note that 30 % clover-grass is not the equivalent of 30 % clover in the rotation! Legume catch crops must be accounted less than main legume crops!
Calculation of the amount of legumes in a 6 year crop rotation
Ten-point plan for crop rotation design [7, 8]
1. Select crops according to market potential and prices, feed require-ments, soil type, climate and crop rotation characteristics.
2. A balanced rotation has from 30 % (pure legumes) to 40 % (legume-grass mixtures) legumes, a maximum of 20 % root crops and up to 60 % cereals. In cereal dominated rotations, integrate spring cereals and catch crops.
3. To achieve self-sufficiency in fodder, calculate the fodder require-ments from field crops and arable forage taking the additional supply from permanent grassland into account.
4. To prevent serious soil borne pests and diseases (those with strong agronomic and economic consequences), apply cultivation breaks and maximum frequencies of host crops and crop families e.g. brassi-cas, cereals, grain legumes.
5. To prevent serious weed infestation, alternate between leaf and straw crops and between winter and spring crops and include at least one root crop.
6. Check the P, K, pH and humus status via soil analyses (soil fertility) and plan manure distribution carefully for each field during the crop rotation for best nutrient utilization and soil improvement to secure good yields and product quality, and to prevent nutrient leaching.
7. To determine the amount of cereals calculate the amount of straw needed for bedding.
8. To improve soil structure and the mobilization of nutrients and to as-sist drainage, grow deep rooting crops after shallow rooting crops and minimize soil compaction caused by heavy machinery especially during wet conditions.
9. To even out the work load and promote the germination of different weed species alternate between autumn sown and spring sown crops.
10. To prevent nutrient leaching and erosion minimize periods when soil is bare. Plant cover crops, plant catch crops after spring crops and vice versa, grow undercrops (legumes) and crop mixtures.
And finally: document failures and successes to help redesign the crop rotation for the future!
Do you want to make sure that the crop rotation is sustainable?
Calculate humus balances (soil fertility)
Do you want support for crop rotation planning and evaluation?
Use the software tool ROTOR
Recommendations
Crop mixture % of the crop in the 6 years rotation
Legumes in the mixture (%)
Legumes in the rotation (%)
2 years clover-grass 33 30 10 2 years clover-grass 33 60 20 2 years clover-grass 33 80 25 1 year pea/oat intercropping 17 50 8 1 year grain legumes 17 100 17
To achieve the goal of 30 % legumes in the rotation, 33 % clover-grass in the 6 year crop rotation with more than 60 % clover would be necessary plus 1 year intercropping with legume mixture!If less clover-grass is grown in the rotation, then the goal can only be met, if additional legumes (e.g. grain legumes) are included in the crop rotation!

36
Crop rotation
37
Examples of crop rotations
During the two year period of conversion it is recommended to increase the amount of legumes above 30 % to build up soil fertility. Pig and poultry farms have difficulties to reach such a high share of legumes, because these animals are not fed forage legumes. Instead these farmers should consider growing grain legumes, legume catch crops and legume-grass for mulching.
Note that perennial legume-grass cultivation has a more favourable effect on soil fertility than annual cropping.
Agronomically sound crop rotations from around the Baltic Sea
Arable farms with no livestock are advised to arrange a farm cooperation with nearby livestock farms to exchange feed and manure to ensure nu-trient recycling. Crop rotations differ greatly depending on the fodder requirements of livestock.
In arable farms, grain legumes and legume catch crops should always be part of the crop rotation. Forage legumes can be cultivated for mulching as fodder for a cooperating livestock farm, as biomass for a biogas plant or for seed production. A green fallow period can also be beneficial e.g. using a mixture of field beans, beerseem and persian clover and ryegrass.
Arable farms with no livestock have the following crop rotation options to include legumes:
Production of grain and forage legumes for cooperating dairy, pig or chicken farms
Cultivation of catch crops and green manures (alternating winter and spring crops)
2-years of legume-grass to enhance soil fertility
Legume seed production (grain and forage legumes)
Green fallow period (mulching of legume mixtures)
If there is no animal farm nearby, cooperation with a biogas plant can be an option.
Sweden Finland Germany Latvia Poland Belarus
Year 1
Spring
Clover-grassClover-grass
Clover-grass Clover-grass Clover-grass
Clover-grass
Summer FallWinter
Year 2
Spring Summer Fall
Winter wheat Winter cereal Winter cerealWinter
Year 3
Spring Summer Fall
Winter cereal TriticaleCatch crop Catch crop
Winter
Year 4
Spring Spring cereals Silage maize Silage maize Spring oats
Summer Fall
Fallow Fallow Catch crop Fallow Fallow
Winter triticaleWinter
Year 5
Spring Spring wheat/ clover-grass
(US)Oats and peas Grain legumes
Spring cereal/ grain legume
Spring cereal/ clover-grass
(US)Summer
FallClover-grass Fallow
Winter rye/ clover-grass
(US)Winter cereal
Clover-grass FallowWinter
Year 6
Spring Oats/clover-
grass (US)
Whole crop silage/clover-
grass (US)Summer
FallClover-grass Clover-grass Catch crop Clover-grass
Winter
Year 7
Spring Spring cereal/ clover-grass
(US)Summer
FallClover-grass
Winter
US = undersown; organic manure/compost is applied but not listed in the figure
Legumes Legume-cereals Cereals Root crops Fallow/catch crop
for mixed ERA farms [21, 1, 5]
for ERA farm cooperations

338
Crop rotation
Review checklist [9]
For evaluating the planned crop rotation use the following checklist and discuss it with colleagues and your farm advisor.
Yes No
Do you have at least 30 % legumes in the rotation?
Have you checked the humus and nitrogen status?
Have you checked the market opportunities and the gross margin?
Does the crop rotation meet livestock feed requirements?
Do nitrogen-fixers alternate with high nitrogen-feeders?
Have adequate green manure and catch crops been included to mini-mize erosion and leaching?
Do crops with small root systems alternate with crops with large root systems respectively low and high crop residues?
Do deep-rooted crops follow shallow-rooted crops?
Do weed-suppressing crops precede slow-growing crops?
Have you put breaks between crops to minimise diseases and pests?
Do the crops allow for effective use of the existing farm machinery and labour?
LegumesKarin Stein-Bachinger & Moritz Reckling
Why they matter 40Benefits of legumes 41Basic data on grain and forage legumes 42Methods to estimate the N fixation 44How to increase the N fixation 48Legume cultivation to reduce nutrient leaching 49
40
Legumes
41
For human nutrition (grain legumes)• provide high-protein food (2–3 times higher N-content than cereals) • provide essential amino acids (very valuable complement to cereal
nutrition)• alternative to meat consumption • provide raw material for innovative healthy food.
For the environment (legume-grass and grain legumes)• reduce greenhouse gas emissions
(N2O – laughing gas) and energy consumption by replacing mineral N fertilizers
• enhance biodiversity in and above the soil through diversifi-cation of the crop rotation
• reduce pesticide use through improvement of plant health
• strengthen the local/regional production and reduce de-pendency on imported protein fodder.
For the farm (mainly legume-grass mixtures)• maintain and increase long-term soil fertility • be the most important N-source• grain and forage legumes deliver high-protein fodder• give very positive preceding crop effects • develop deeper soil layers due to an extended root system • mobilize phosphorus through symbiosis with mycorrhizal fungi• reduce intensity of tillage procedures• improve plant health and prevent weeds.
Benefits of legumes
With effective management legumes have the potential to provide the following benefits:
straw
withoutclover-grass
74
72
70
68
66
64
62
60
0
Humus (t/ha)
withoutorgan. fertil.
withoutclover-grass
withoutorgan. fertil.
20 %clover-grass
farmyard manure
withoutclover-grass
farmyard manure
+ 20 %clover-grass
farmyard manure
+ 40 %clover-grass
Increase of humus content in different fertilization and crop rotation systems (long-term trial on sandy-loam, 5 years after trial installation) [15]
Humus content at trial installation
Why they matter
Legumes are the key crops in ERA systems. In ERA farms, 30 % of the crop rotation should be grown with legumes to ensure a sustainable system. In conventional systems the importance of legumes in crop rotations has declined due to an intensive use of mineral N fertilizers and pesti-cides together with a high fodder import. Mainly soy beans are imported from overseas, as a result of the discontinuation of the EU subsidies for grain legumes. The concentration on a few very profitable crops and the neglect of important crop rotation principles (e.g. no legumes but high cereal proportion) has resulted in problems such as a decrease in humus content, soil erosion, nutrient and pesticide release into water bodies etc. Crop rotations that include legumes are able to minimize these risks considerably. Moreover, for ERA farms, legumes ensure high self-suffi-ciency in fodder and nitrogen.
Legumes fix nitrogen from the air with the aid of nodule bacteria living symbiotically at the legumes‘ roots. This is the most important N-source for ERA farms and the precondition for avoiding the use of mineral N fer-tilizers. The amount of N-fixation can be substantial – under favor able conditions it can result in a few hundred kg N/ha and year.
Unique ability to fix nitrogen
Definition
Global aspects
How do you identify active root nodules? By the red colour inside!
Legumes are plants with pods belonging to the systematic family Fabaceae. They are one of the species-richest plant families with about 20,000 (cultivat-ed and wild) species worldwide. They include annual, biennial and perennial herbaceous plants as well as trees and bushes.
A successful management of nitrogen supply through legume culti vation in ERA systems includes:
• the optimization of N-input through symbiotic fixation and• the N-transfer to subsequent crops with minimum losses.

Legumes
43
Instead of harvesting forage legumes they can be ploughed in as green manure delivering, among other things, nitrogen to the soil. Clover and alfalfa are usually cultivated with different grass varieties in the crop rotation. Forage legumes are of tremendous importance for ERA sys-tems as they fix and leave more N in the system than grain legumes and provide high protein feed for ruminants. As ruminants (animal husband-ry) can digest cellulose, there is no competition for food. Furthermore weeds (e.g. thistles and couch grass) can be regulated and suppressed very effectively through perennial cultivation.
Mixture Water supply Soil qualityCultivation
duration (years)Cultivation
break (years)Optimal pH-value
Alfalfa-grass + - 1 - 3 3 6 - 7
Red clover-grass + + 1 - 3 3 5.5 - 7
White clover-grass - - 1 - 3 0 5.2 - 7
Average nutrient removal/ha in harvested forage legumes:1 t/ha of clover-grass (100 % DM) ≈ 25-30 kg N, 3.5 kg P, 2.5 kg KNote: In the first production year the nutrient removal is slightly higher than in the 2nd year.
Forage legumes
Calculation example
Between 25 and 80 t/ha fresh matter (FM) yield can be harvested (with two to four cuts/year), which means 5 – 16 t/ha dry matter (DM) (assum-ing 20 % DM in the fresh material) per year.
Description of selected forage legumes (demands: + = high, - = low ) [4,16]
In practice it is often very difficult to accurately measure the forage legume yield without weighing the trailers or counting the hay/silage bales. On the field, a rough assessment of dense stands is possible using the following rule of thumb [5]:
Mixtures of catch cropsOther legumes or mixtures of clover/alfalfa with cereals can be used as catch crops (crop rotation):
• Winter catch crops: Crimson clover (Trifolium incarnatum L.), Landsberger mixture (winter vetch + crimson clover + annual rye grass)
• Summer catch crops: Crimson clover, Beerseem clover (Trifolium alexandrinum L.), Serradella (Ornithopus sativus Brot.), Persian clover (Trifolium resupinatum L.), Yellow trefoil (Medicago lupulina L.), Subclover (Trifolium subterraneum L.)
Quick yield estimation
Harvested height in cm x 0.1 = t DM/ha
Example: 45 cm growing height minus 5 cm cutting height = 40 cm harvesting height x 0.1 = 4 t DM/ha
This rule of thumb can be used for yield estimation in dense stands of grassland as well.
Basic data on grain and forage legumes A balanced nutrient (P, K, S) and pH level in the soil is essential to maxi-mize growth and N fixation. If a legume is cultivated for the first time or after a long break, seeds should be inoculated with the appropriate strain of Rhizobia (nitrogen-fixing bacteria). They can survive in the soil for several years.
Grain legumes
Water supply
Soil quality
Self-com-patibility
Cultivation break (years)
Optimal pH-value
Yield (t/ha) (poor – rich soils)
Peas + + no 5 6.0 - 7.0 1 – 4.5
Field beans + + no 3-4 6.5 – 7.0 2 – 5
Lupines no 3-4
- yellow - - 5.0 – 6.0 1 – 3.5
- white + + 6.0 – 7.0 2 – 4
- blue + - 5.5 – 7.0 1 – 3.5
Soy beans* + + yes 6.0 – 7.5 1 – 2.5
* Soy beans are short day plants. They require a temperature above 6°C, the vegetation pe-riod has to be 150 to 180 days. Rhizobium inoculation is necessary especially before first seeding. Note: Soy beans must be processed first before being fed to livestock.
Average nutrient removal/ha in harvested grain legumes:1 t/ha of grain (86 % DM) ≈ 35 kg N, 4 kg P, 8 kg KNote: A very efficient recycling of nutrients from grain legumes can be achieved if the grain is used for feeding stock and their manure is returned to the fields!
Grain legumes Grain legumes are an important protein source for food and feed. Com-pared to cereals, they leave very little stubble in the field, the crop resi-dues have a low C:N ratio and decompose quickly. They have the ability to mobilize phosphorus from the soil through the secretion of organic acids in the rhizosphere.
Grain legumes are often mixed with cereals, e.g. field beans with oats, peas with spring barley and rye with vetch. A uniform sowing without segregation within the seed drill and a simultaneously ripening is important.
Mixtures
Disadvantages: a lower concentration of leg-umes results in a lower N-fixation and a lower net-N-input which reduces the positive preceding crop effect.
Advantages: dense rooting; fewer problems with plant diseases; stubble and root residues will be de-composed and mineralised to nitrate more slowly be-cause the C : N ratio of cereals is higher.
Calculation example
Description of selected grain legumes (demands: + = high, - = low ) [4,16]

44
Legumes
45
Rule of thumb for estimating the N fixation by grain legumes:The amount of symbiotic fixed N is comparable to the
amount of N in the harvested grains [10,6].
The average N fixation of forage legumes is roughly 200 kg N/ha/year which is around twice the amount from grain legumes.The estimation of the N fixation is difficult when mixtures with non-legumes like clover-grass are cultivated, because the amount of clo-ver has to be estimated. Field observations before harvesting and the recording of the data are helpful to get an overview.
Legume yield proportion (%)
Scale Arable forage Permanent grassland
very low 1 - 20 1 - 5
low 21 - 40 6 - 20
middle 41 - 60 21 - 40
high 61 - 80 > 40
very high 81 - 100
Legume estimation trainer
As the estimation of the legume pro-portion is difficult and needs prac-tice, you can train yourself with the help of this simple software tool. It shows a variety of swards with dif-ferent shares of legumes and non-leg-umes and allows you to test and train your estimation skills.
Forage legumes
Rule of thumb for estimating the N fixation by forage legumes:35 kg Nfix / 1 t legume yield (dry matter) [63,6]
How to estimate the legume proportion in legume-grass swards?
On a large scale you can use the following table:
Methods to estimate the N fixation
This section gives you examples for a quick and simple estimation and an over-view of the amount of N fixation depending on the legume species in use.
CropYield
Fresh matter (t/ha)N fixation
kg N/t kg N/ha
Field beans 3.5 40 140
Peas 3.0 35 105
Blue Lupine 2.5 40 100
Soy beans 2.5 50 125
Lentils 1.5 40 60
Vetch 2.0 40 80
The following table gives a survey of the symbiotic N fixation by grain legumes, based on recommended calculations in Germany [16]. Note: These are average data and the N-fixation capacity can vary great-ly, e.g. with peas 50 – 300 kg N/ha.
• Selling the seeds of grain legumes means that you are also losing the symbiotic fixed nitrogen! In most cases the net-N-input is zero if the grain is sold. It is also important to note that the N-balance can be negative.
• If the seeds are used as fodder for farm animals the greater part of the fixed N remains within the system if the manure is spread on the fields. Crop farms, especially in horticulture systems, need to use the whole crop for nutrient recycling within the farm.
• When converting to ERA systems, it is necessary to make a rough calculation (both at field and farm level) of how much biomass and manure should be recycled in order to guarantee a well-balanced N budget of the crop rotation (software tools)!
Grain legumes
Be aware that:
this is correct: 59 % dry matter yield (t/ha) fresh matter yield (t/ha)

46
Legumes
47
Level of N fixation by forage catch crops [16]
(Standard values in Germany)
Average yield fresh mattert/ha
N fixationkg/ha
Clover grass (50 : 50) 15 20
Clover 15 38
Serradella (Ornithopus sativus) 15 32
Peas (fodder) 15 38
Vetch (fodder) 15 38
Other annual fodder legumes 15 32
White clover is the most common legume in grassland. Often a general value of 30 kg N/ha is indicated for the amount of N fixation. But just as for forage legumes on arable land, there is a more precise estimation for grassland:
1. For yield estimation use the rule of thumb shown on page 45.
2. The N fixation can also be estimated with the rule of thumb below [14].
How to estimate the legume proportion in grassland?The legume estimation trainer can be used to train and test your estima-tion skills on the proportion of legumes in permanent grassland.
Rule of thumb for estimating the N fixation in grassland:30 kg Nfix / 1 t legume yield (dry matter)
There can be a wide range in the amount of fixed nitrogen depending on the amount of clover in the grassland.
Amount of N fixation on grassland (using the rule of thumb)
Catch crops
Grassland
Crop
The following table shows huge differences in the total amount of N fixa-tion depending on the yield and the legume proportion. A field that gives a total yield of 8 t DM/ha and year will give 168 kg N less with a low legume proportion of 20 % compared to 80 % legumes in the mixture!
Gross yield (t DM/ha and year)
Nfix in kg/ha and year with a legume yield proportion of
20 % 50 % 80 %
4 28 70 112
8 56 140 224
10 70 175 280
Amount of N fixation by clover-grass mixtures (using the rule of thumb)(in relation to the legume yield proportion for Central European conditions)
Examples
Nitrogen-Budget Calculator
To facilitate the calculation of the N-input of forage legumes including a rough overview of the total N-balance of the field, you can use this user-friendly software tool. By changing a few input data according to your farm situation (e.g. yield or harvesting method) you can get an overview of the situation on your fields. An example calculation is shown in the following graph. The example demonstrates that the N-balance by harvesting 3 t/ha of grass-clover as silage with 50 % clover in the mixture would be positive (23 kg N/ha). With only 30 % clover in the mixture, the N budget would be negative (- 15 kg N/ha).
DATA INPUTAverage height [cm] 45Harvesting method [select] silageHarvesting losses [%] 20Legume Proportion [%] 50
RESULTSYield (harvested) [t/ha DM] 3,2
N fixation [kg N/ha] 105
N removal [kg N/ha] 82N budget [kg N/ha] 23
120
100
80
60
40
20
0
-20
-40
Dry
mat
ter y
ield
[ t/
ha]
Nitr
ogen
[ kg
/ha]
12
10
8
6
4
2
0
Yield N fixation N removal N budget
3
10582
23
Gross yield (t DM/ha and
year)
Nfix in kg/ha and year with a white clover proportion of
10 % 20 % 30 % 40 %
4 12 24 36 48
8 24 48 72 96
10 30 60 90 120

48
Legumes
49
Legume-grass
• On sandy soils, tillage operations should be as late as possible (late winter, early spring) in order to reduce the risk of N leaching during winter. Reduction of the number and depth of tillage opera-tions as well as harvesting the last stand before ploughing, de crease N mineralisation before winter.
• Legume mixtures should contain a yield proportion of non-legumes (grass, crucifers) of 20 to 25 % to reduce the leaching risks, because mineralized nitrogen can be caught immediately.
• It is important to note that mulching of legumes can cause ammonia losses (5-15 %).
Grain legumes
• Undersown grass takes up soil N and therefore reduces leaching on sandy soils.
• If spring crops (e.g. maize) are to be grown after grain legumes on sandy soils the cultivation of undersown grass or a winter catch crop is recommended to reduce leaching.
• If a winter crop (e.g. rye) follows the legumes it should be sown directly after the legume stubble is ploughed in.
Legume catch crops
• On sandy soils, legume catch crops should be cultivated only in mix-ture with non-legumes.
• Ploughing in of legume catch crops in the spring is preferable. • On soils with a high potential for nutrient losses, at least one winter-
hardy non-legume should be part of the mixture.
How to increase the N fixation [5,17]
• A balanced P, K and pH level in the soil, a good soil structure and cul-tivation of crops adapted to the environment is advantageous.
• Legume-grass for forage production with a legume proportion be-tween 70 - 80 % will give a positive N field balance.
• Cutting for fodder purposes results in a higher legume proportion as well as a significantly higher N fixation than mulching.
• Vigour growth is achieved if fodder legumes are allowed to blossom once.• Maximum fixation rates are achieved during flowering and pod for-
mation (grain legumes) so harvest and mulching should be carried out afterwards.
• Integrate legume catch crops in the rotation whenever possible.• N fixation depends on both the soil temperature (> 6 °C) and the veg-
etation period. Legume catch crops normally start after 5 weeks with N self-supply. Therefore, they should be sown as early as possible.
• Cultivate grain legumes, especially peas, white lupines and soy beans as they can make phosphorus available which supports the N fixation.
• A mixture of field beans and oats is especially effective in reducing black bean aphids.
• Follow the recommended crop rotation cultivation breaks accord-ing to the different legumes carefully. Care in cultivating legumes is worth the effort.
Examples of nitrogen field balances [17]
The following example gives a rough understanding of the N field balance in different production systems. It is important to note that the sale of grain legumes may lead to a negative N balance. Moreover, forage legumes provide a nitrogen supply to two to three subsequent crops, compared to grain legumes supplying N for only one. Therefore fodder legumes should be cultivated before economically important crops (crop rotation).
With animals Without animalsLegume Red clover Pea Red clover Pea
Kind of utilisation fodder grain fed set-aside grain sold
N-fix total plant 220 90 180 90
N in harvested products
-340 -140 0 -140
N-return with manure 1) 170 70 0 0
Gaseous N-losses from mulching
0 0 -35 0
N-balance + 50 + 20 + 145 -50 1) estimated N-losses through animal refinement, storage and application: 50 %
Legume cultivation to reduce nutrient leaching [5, 7]

Strategies of ploughing grass-clover to avoid nitrate leachingSchematic description of the N content in the soil of different soil types after site-adapted ploughing of clover-grass [18]
Legumes
S O N D J F M A M J J A
Because of grass-clover sward standing over winter
Low risk of nitrate leaching
Because of late stubble breaking and mean field capacity
Low risk of nitrate leaching
Months
Because of high field capacity
Low risk of nitrate leaching
Clover-grass
Clover-grass
Clover-grassPl
ant g
row
thPl
ant g
row
thN
itrat
e dy
nam
ic in
th
e so
ilN
itrat
e dy
nam
ic
in th
e so
ilN
itrat
e dy
nam
ic in
the
soil
Plan
t gro
wth
Spring cereals
Sandy soil
Loamy soil
Heavy soil
Winter cereals
Winter cereals
Spring stubble breaking
Late autumn stubble breaking
Common autumn stubble breaking
ManureKarin Stein-Bachinger
Why manure matters 52Potential nutrient losses (N, P, K) 53Basic data 54Nutrient availability 56How to reduce nutrient losses during storage? 58How to reduce nutrient losses during application? 60Agronomic recommendations for manure handling 61Legal restrictions 62
50

52
Manure
53
In livestock farming systems manure plays a key role in nutrient recy-cling on farm level. It not only contributes nutrients to the soil, it also maintains and increases the soil humus content and fertility (e.g. by im-proving water holding capacity, aeration, drainage and release of en-ergy for increasing microbiological activity). When converting to Ecological Recycling Agriculture (ERA) planning for effective manure storage and handling is essential, as nutrient losses are both a serious pollution problem as well as a waste of valuable nutrients. Manure is the primary source of fertilizer and it can be used very flexibly within the crop rotation. However the amount of manure is limited, because animal production must match the fodder produced within the farm/farm cooperative. In ERA farms, additional fodder from outside the farm should be less than 20 %. About 75-90 % of the nutrients N, P and K that are fed to livestock pass directly through the animal into the manure (animal husbandry). The extent to which they can be returned to the soil and made available to subsequent crops as well as the soils humus building capacity depends on the way the manure is stored and handled. These are crucial issues both for a successful nutrient management on ERA farms as well as for a healthy environment.
Losses of nitrogen (N) can occur from the time the urine hits the bed-ding until it is absorbed by the plant[9]. The losses through volatilisa-tion and/or leaching can vary greatly during the different stages from between 5 % to about 30 % (for each stage) depending on the storage, treatment and application practice.
Definition of three types of manure
Why manure matters
Value of manure for ERA farms
Nutrient recyc ling on farm level (65)
Storage practices
Potassium and phosphorus
Besides N, considerable losses of potassium (K), up to 50 %, can result from leaching and runoff during composting. As for phosphorus (P) the main losses normally occur as a result of soil erosion after the manure is spread on the fields.
The type of stable determines storage practices. Depending on the housing system, farmyard manure can be removed regularly and com-posted in a heap outside the stable or on the field before spreading. In deep litter systems the manure is stored in the stable up to several months, sometimes also in a heap outside before spreading. Slurry and liquid manure are stored in tanks. For advice on storage and application in order to reduce nutrient losses see following pages.
Potential remaining N of manure depending on storage and application [62]
Nitrogen
a) farmyard manure = mixture of animal excrement and straw (or other bedding material)
b) slurry = animal excrement (urine + faeces)
c) liquid manure = animal urine
Potential nutrient losses (N, P, K)
100 kg N/ha/yearStable losses Storage
lossesAmount forapplication
Application losses
Losses inthe field
90 - 95
50 - 85
50 - 75
30 - 80
30 - 70
35 - 70
30- 60
15- 30
15- 30
15- 30
10- 50
10- 20
20 - 40
90 - 95
90 - 95
70 - 80
80 - 90
N-uptake plant / N-accumulation
in the soil
Animals
Manure
SaleSale
Non legumes Legumes Residues
Soil
P, K fertilizer
N2
Fodd
erSt
raw

54
Manure
55
Basic data
Composting
Animals Farmyard manure1) t/year
Slurrym³/year
Liquid manurem³/year
1 cattle (> 2 years)10
(22 % DM)18
(8 % DM)4
(8 % DM)
1 breeding sow with piglets2
(22 % DM)6
(5 % DM)1.5
(5 % DM)
10 porkers8
(22 % DM)19
(6 % DM)6
(6 % DM)
100 laying hens (fresh manure)
6 (22 % DM)
8 (14 % DM)
-
Conversion factors
P x 2.29 = P2O5
K x 1.21 = K2O
P2O5 x 0.44 = P
K2O x 0.83 = K
The amount and the nutrient content of manure can vary widely de-pending on the source materials (kind of animal, type of bedding, diet) and the conditions and duration of storage. It is difficult, in practice, to accurately determine the amount of manure produced per year. The following table provides a rough estimate of the average amounts of manure produced by cattle, pigs and hens per year. For more detailed calculations with regard to specific housing systems consult the general nationwide data bases [4].
Animals Type of manure DM (%) Ntotal P K
Cattle Farmyard manure fresh (kg/t FM1))Farmyard manure compost2) (kg/t FM)
2022
45
1.21.2
4.66.6
Pigs Farmyard manure compost (kg/t FM) 20 6 2.5 5
Poultry Dry chicken dung (kg/t FM) 60 30 10 13
Cattle Slurry (kg/m³ FM) 8 3 0.4 2.5
Pigs Slurry (kg/m³ FM) 6 4 1.5 3
Cattle Liquid manure (kg/m³ FM) 2 2 0.1 3
As there are many different ways to treat farmyard and liquid manure, the nutrient content of the manure that is spread on the fields can vary greatly. Therefore it is advisable to make one‘s own manure analysis in order to get the necessary data. This will make planning easier, help avoid mistakes and save money. If this is not possible then it is important to note that the official recom-mended data [4] tend to show higher nutrient content because they are based on conventional systems, where the nutrient input, e.g. through mineral fertilizer and protein fodder, is higher[6]. The following table pro-vides average data from several organic farms [5,6] (with the exception of the chicken dung) and can serve as an orientation for one‘s own calculations.
Making good compost is an important issue for ERA farms. Usually, farmyard manure consists of manure mixed with livestock bedding, e.g. straw, which has a high carbon to nitrogen ratio (80:1) compared to dairy manure of 20:1. The composting process requires a carbon to nitrogen ratio of 25-35:1(see page 56). The organic matter is decomposed by micro organisms in the presence of oxygen and the temperature of the pile can rise up to about 60-70°C within a week. To destroy pathogens, weed seeds and fly larvae, the temperature needs to be kept at 60°C for at least 15 days. Subsequently the temperature should be lowered to below 50°C. Above this tempera-ture nitrogen is converted to ammonia and lost to the atmosphere [8,9].Red worms are active in the final stages of decomposition, helping to transform the compost into humus. The volume of the fresh manure is reduced by 40 to 60 %, depending on the treatment as well as carbon and nitrogen losses .
Nutrient content
Amount of manure production per animal and year (365 days) [4]
1) at low to average amount of litter: 2-4 kg/LU (livestock unit) and day; DM = dry matter
Because of the volume losses during composting of farmyard manure, the C:N ratio will decrease over time. The storage of farmyard manure in a heap should normally not exceed 6 months.
1) FM = fresh matter 2) composted up to 6 months
Calculation examples
LU/ha (in barn) Manure 1.0 LU/ha (220 days in barn) 6 t/ha and year
1.0 LU/ha (290 days in barn) 8 t/ha and year
0.6 LU/ha (290 days in barn) 4.8 t/ha and year
30 t farmyard manure compost 150 kg N 36 kg P 200 kg K
10 m³ slurry ≈ 30 kg N 4 kg P 25 kg K10 m³ liquid manure ≈ 20 kg N 1 kg P 30 kg K
The amount of manure available for arable land from:
Amount of nutrients from cattle manure per ha:

Manure
5756
The N-efficiency can vary greatly. Up to 90 % of the N in liquid manure can be available to plants, but there is a high risk of gaseous losses. The N-efficiency of farm yard manure is fairly low, but over the long term, up to 70 % of the nitrogen can become available [4,6].
The mineral N (NO3-(nitrate) and NH4
+ (ammonium) in the manure is directly available to plants, the organic N is only available after mineralisation during the course of several years. The higher the ammonium-proportion of the total nitrogen and the lower the C/N-ratio, the higher the direct annual effect.
Nutrient availability
What is the C:N ratio and why is it so important?
Nitrate, ammonium and total N
Nitrogen charac teristic of manure [4]
N
P
K
In contrast, about 50 - 60 % of the total amount of phosphorus is avail-able in the first year. Also most of the potassium is directly available to the plants as it mainly occurs as an inorganic compound. However, there can be considerable losses of K during composting (up to 50 % through percolate) as well as through leaching on sandy soils .
Potential availability of N and P from farmyard manure
Spreading of 30 t/ha/year =
Availability in the first year
Available amount / ha in the first year
150 kg N 20 % 30 kg
36 kg P 50 % 18 kg
Liquid manure
Slurry
Solid manure fresh
Solid manure composted
0 10 20 30 40 50 60 70 80 90 100
organic N ammonia-N25 20 15 10 5 0 5 10 15 20 25Amount NH4-N
(%) of Nt Nt (kg/t)kg Nt /t substrat
Poultry manure (with litter)Dry chicken dung(with subsequent composting)Dry chicken dung* Cattle liquid manurePig liquid manureCattle deep litter manureCattle manure (composted)Pig manure (composted)Chicken slurryCattle slurryPig slurry
40 1050 1450 5090 290 420 510 510 767 950 467 6
All living organisms need relatively large amounts of carbon and small-er amounts of nitrogen. The balance of these elements is called the carbon-nitrogen ratio (C/N ratio). This ratio is an indicator of how easily bacteria are able to decompose organic material.The more carbon in the material relative to nitrogen, the longer the decomposi-tion process will take. In general, woody materials are high in carbon. The optimal proportion used by the bacteria averages about 25 parts carbon to 1 part nitrogen.
Nitrogen efficiency in the first year (%)
Humus reproduction from organic material (in humus-equivalents) [4,25]
Fresh farmyard manure (20 % DM) 28 kg Humus-C/t substratRotted farmyard manure (25 % DM) 40 kg Humus-C/t substratComposted manure (35 % DM) 62 kg Humus-C/t substratPig/cow slurry (8 % DM) 8 kg Humus-C/t substratPoultry slurry (faeces 25 % DM) 22 kg Humus-C/t substrat
Example: 20 t rotted farmyard manure provides 800 kg Humus-C/ha for humus reproduction (soil fertility, ROTOR).
Key figures
* (ventilation of the dropping belt)
Carbon / Nitrogen ratio of different materials (orientation values) [9]
Humus Peat soils Dairy solid manure Poultry manureVegetable wasteLeavesStrawFresh sawdustWood chipsNewspaper
10 – 12 : 110 – 30 : 120 : 110 : 112 - 20 : 145 : 180 : 1500 : 1100 - 500 : 1800 : 1
Calculation examples

58
Manure
59
There are various possibilities to store farmyard manure and use it when it has reached a more mature stage. It can be stored outside the barn in heaps: either on a concrete slab where potential nutrient losses in the form of leachate can be easily gathered, or on field edges where special preconditions have to be fulfilled to avoid leaching to the soil. Slurry and liquid manure are usually stored in tanks (e.g. above ground). To both great attention has to be paid to prevent gaseous losses. There are country specific legal restrictions that have to be taken into consideration!
Dry matter Measure Up to 500 mm precipitation
500 – 1000 mm precipitation
> 1000 mm precipitation
< 25 % Cover
Straw (useful but not necessary)
FleeceFleece or foils after self-heating
Controlled subsurface2) Useful Necessary Necessary1)
> 25 % Cover
Straw (useful but notnecessary)
Straw of fleece Fleece
Controlled subsurface2) Not necessary Useful Necessary
1) plus: pre-composting on a concrete slab 2) e.g. straw or clay minerals like bentonit
With regard to the storage of pig slurry, the covering of the tanks is judged as the most efficient measure to reduce volatile emissions. The covering of tanks containing cattle slurry leads to a lower reduction of emissions, because a natural surface layer is built up [4], but it is still recommended. As raw slurry can lead to pollution problems, a form of composting can be done by aerating the slurry in the tanks. Although there is a high risk of ammonia volatilization, odors from anaerobic conditions can be re-duced as can risks for weeds and pathogens and the slurry is more plant-compatible. The tanks should have a storage capacity to handle at least 6 months of slurry production.
Cover of manure heaps and protection of the subsurface mainly to avoid N and K losses du ring composting [5]
Farmyard manure A random dumping of manure in a heap (and hoping for the best) should be avoided, because it can lead to high nutrient losses, especially through leaching. As described above composting on a concrete slab makes it easier for runoff to be collected. When a conversion plan is made the collection system should include both the silage and manure heaps so that all effluents can be collected [8].
• Check the local zoning regulations • Maximum storage: 6 months, change storage places• Pick up 5-10 cm of the top soil to catch all ‘rest’-nutrients• Distance from water bodies: at least 20 m in flat areas• Position on a slope: only across to the slope• Removal preferably from spring until late summer, if there is no lea-
chate generation
Slurry and liquid manure
Criteria Risk of ammonia emission Measures for improvement
Open tanks (Very) highMaintain surface layer, apply chopped straw
Covered tanks Low
Aeration Very highOmit or reduce aeration, consider tech-nical solution for treatment of used air
Fermentation (biogas production)
LowVery quick incorporation after application
Recommendations for storage [5]
Condition Measures for improvement
Warm, dry, windy Do not turn or move the manure heap
Flat heaps, large surfaces Increase the height of the heap, cover with straw
Self-heating Do not move or turn over
High risk of ammonia losses during composting [5]
How to reduce nutrient losses during storage?
Recommendations for storage on fields [5]

60
Manure
61
How to reduce nutrient losses during application?
Techniques ConditionRisk of ammonia emission
Measures for improvement
Spread on arable fields
Without soil cover Warm, dry, windy High Immediate incorporation
Cool, moist, calm Low Incorporation as soon as possible
With soil cover Warm, dry, windy High Avoid application
Cool, moist, calm Medium Preferably in combination with harrowing
Spread on grassland
Warm, dry, windy High Avoid application
Cool, moist, calm Medium
Agronomic recommendations for manure handling
• Prioritize the application to high nutrient demanding crops, like root crops, (silage) maize, fodder crops and fast growing catch/cover crops.
• Avoid manuring crops that follow crops with high nutrient residues (e.g. legume-grass leys with a high legume content).
• Avoid high amounts of slurry to legumes, as nitrogen fixation will be reduced.
• To improve nutrient mineralization/availability and avoid gaseous losses plough down farmyard manure o on dry sandy soils up to 15-20 cm o on heavy soils up to 10-15 cm.
• The application of slurry and liquid manure is not allowed from 1st November to 31st January!
• Apply manure preferably before tillage to reduce gaseous losses.
• On sandy soils, avoid autumn application to winter cereals or grasslands, because it will increase nitrate losses during winter.
• Use liquid manure to cereals at tillering for increasing the yield, at flush for improving the protein content.
• Especially in spring, a late application of liquid manure to cereals needs special application techniques to avoid ammonia losses.
• Apply slurry to catch/cover crops or winter rape before September to ensure a high nutrient uptake.
• Avoid high manure application to potatoes directly following spring-ploughed legume-grass because of tuber health reasons.
• On meadows, use slurry in spring before the first cut, if the growing height is below 15 cm.
• On pasture, use slurry early in spring at least one month before grazing.
• Whenever possible, incorporate manure directly after the application.
• Use relatively low amounts to improve the nutrient efficiency.
• On grassland, ensure a uniform distribution to avoid sward damages followed by perennial weed infestation.
Manuring plan How to determine the appropriate allocation in the crop rotation? 6 course crop rotation: 1 LU/ha, 290 days in barn:
Hints for application of farmyard manure [6]
Mitigation techniques/measures
LocationEmission decrease % Limitations
Cattle Pig
Drag hose
Arable land-without vegetation-with vegetation (> 30 cm)Grassland-low vegetation (<10 cm)-higher vegetation (> 30 cm)
830
1030
3050
3050
Steep slopes not too strong, size and shape of the field, viscous slurry, vegetation height
Drag shoeArable landGrassland
3040
6060
See above, not on too stony soils
Slurry grubber Arable land >80 >80See above, not on too stony soils, very high traction force, only partly usable on arable land with vegetation
Direct incorporation (within 1 hour)
Arable land 90 90With light machines (harrow) after primary tillage, with grubber/plough after harvest
Dilution Grassland - 30-50 Only on grassland
By law, slurry, liquid manure and poultry dung have to be incorporated into the soil immediately after application on arable soils without vege-tation. The application should be omitted during hot, dry and windy weather and when the soil is not drivable or frozen. Thick slurry should be diluted, it must run off the plants and penetrate into the soil.
As there is a huge range of different technical solutions the following tables gives general guidelines for manure application.
8 t farmyard manure/ha = 48 t/ha over 6 years are available
Distribution in the crop rotation 24 t/ha for each of 2 crops or 16 t/ha for each of 3 crops Amount of N ≈ 120 kg N/ha ≈ 80 kg N/haMinus 20 % losses ≈ 96 kg N/ha ≈ 64 kg N/haAvailability in the first year ≈ 20 % Available N in the first year ≈ 20 kg N/ha ≈ 15 kg N/ha
Take long-term availability over the whole rotation into consideration!
Potential to reduce of ammonia losses after the application of slurry or liquid manure [4]
Where?
When?
How (much)?

Manure
62
• AmountsofNandPneedtobeknownbeforeapplication.
• SlurryorotherliquidmanurewithahighconcentrationofavailableNmustbeincorporatedimmediatelyonarableland.
• A maximum of 170 kg N/ha per year from manure can be spread(onaverageforthetotalfarmlandarea).Be aware that the organic standards of the farmers associations allow only 112 kg N/ha and year.
• Fertilisationhastobedonewithemissionreducingpractices.
• TheapplicationofmanurewithhighcontentsofavailableN(farmyardmanureisexemptedbutnotpoultrydung)isnotallowedfrom:o 1stNovemberto31stJanuaryonarablelando 15thNovemberto31stJanuaryongrassland
• Aminimumdistanceof3mtowaterbodiesmustbemaintained.
• Specialregulationsexistforwaterprotectionareas.
InGermanyseveralregulationsfortheapplicationofmanuremustbetakenintoconsideration,e.g.Düngeverordnunghttp://www.gesetze-im-internet.de/bundesrecht/d_v/gesamt.pdfe.g.§ 3,§ 4,(extract)
Research project within the Baltic Sea Region Programme Baltic MANURE (Baltic Forum for Innovative Technologies for Sustainable Manure Management)
Legal restrictions
Pay attention to country specific legal requirements!
AnimAl husbAndryKatarinaRehnströmandÅsaOdelros
Ecologicalsystemsneedlivestock 64Dairy 65Roughageisthebackboneinwinterdiets 66Lambsandbeefcattle 68Sheep 70Pigs 71Poultry 75

64
Animal husbandry
65
Animal production is an important part of ecological farming that aims at achieving a balanced relationship between the soil, the plants and the animals in a farming system. Organic farming offers many solutions to the challenges posed by climate change and resource depletion, but we must strive continually to improve the local circulation of nutrients to ensure that we are producing food by methods that are both sus-tainable and resilient. This is why the farm acreage and possible feed production is important in deciding about the combination and type of farm animals and herd sizes. The environment and living conditions for ecological farm animals must be designed to suit the specific needs of different species. All animals should also have the possibility to express their natural behaviour.
The great thing about livestock is that they produce food from feed stuff that humans cannot consume. Ruminants turn fiber-rich plant parts into highly concentrated food. Pigs and poultry can utilize waste, spilled grains, worms and insects. Also, domestic animals are not only protein- and fat-producers as their special abilities can also be used in other con-texts. Pigs can serve as cultivators in fields and forests, chickens have the ability to find nutrients and ruminants can select grass and weeds even in such places where it is not possible to harvest.
Ruminants have a central role in resource-conserving farming. The rea-son for that is the important role of pulses and ley in ecological agricul-ture. The monogastric animals, e.g. chickens and pigs, compete for the same food as humans and therefore should not have a front position.
In Sweden in 2010 the share of organic animal husbandry made up more than 19 per cent of the total lamb production, 15 per cent of beef cattle, 11 per cent of dairy, 3 per cent of pigs and 11 percent of layers. The share of certified organic milk cows, other cattle, layers and sheep is increasing every year while the percentage of certified pigs is largely unchanged.
Katarina Rehnström, Åsa Odelros & Moa Larsson Sundgren
The ability of ruminants to turn forage into milk and meat is very impor-tant in ERA farming. A high amount of concentrates in the cow’s diet gives more milk, but it costs about 1.5 - 2 times more energy compared to ecological milk produced with roughage. High proportions of con-centrates have a negative impact on both animal health and milk quali-ty. Cattle cannot utilize all the nutrients in concentrates [59]. The nutrients that are not utilized can be lost to the environment.
The central idea in organic milk production is that cows should be giv-en roughage based feed during the entire lactation period. Pasture is a natural feed for ruminants during the vegetative period, in Sweden from April to September. The possibility to grow, harvest and store win-ter feed of high quality is crucial for the farm economy. Effective feed conversion is important to improve productivity, but also to decrease the environmental impact. That can be achieved through animal health, genotypes, reproduction ability and long life[60]. It is also important that the breeding takes these additional aspects into account as well as the ability to produce as much milk as possible from roughage. Dairy cows can produce 6,000 kg milk/year on good quality roughage, some individuals up to 7,000 kg. Bulls with daughter-groups in conventional and organic systems gave a different ranking of top bulls for high milk yields. The difference shows the importance to select breeding bulls for organic systems [61].Farmers have to continually make the following decision: maximize the milk yield with a high input of concentrate or increase the proportion of roughage with decreased milk yield for a lower feed price. In the end it is all about the production costs of milk that are important to create profitability.
Ecological systems need livestock Dairy
Arable land requirement/cow/year, including heifers and calves, high degree of self-sufficiency (64)
Crop Area
Forage (forage ley + whole crop) 0.75 to 0.95 ha
Grazing (dairy) * 0.15 to 0.25 ha
Cereal 0.25 to 0.40 ha
Pulses 0.15 to 0.25 ha
Rape 0.15 to 0.25 ha
Total 1.45 to 2.10 ha
* assuming that elderly young stock are on natural pasture
Breeding and feeding for high yields is neither environmentally nor animal friendly

66
Animal husbandry
67
The cows should have free access to roughage. This means that you have to accept some residues, 10 – 15 % so that the cows can sort and eat the best parts. Long eating times are important and also that feeding is evenly spread over the day. Select varieties of forage with high energy value and palatability. Timothy, meadow fescue and ryegrass are spe-cies that are tasty and have a high energy value.
Good quality clover silage according to the Nordic standards [64]
30 – 50 % clover11 MJ /kg DM150 – 200 g crude protein / kg DM400 – 500 g NDF / kg DM
Whole crop silage including cereals or mixtures with peas or field beans can to some extent substitute clover silage. Examples of suitable combi-nations are peas with barley and oats whereas field beans mix well with spring wheat.The proportion of peas or field beans in whole crop silage mixtures could constitute 30-70 per cent of the content. Maize silage also works well in combination with clover silage due to its high energy and low protein content.
Diet supplements
If necessary organic on farm grown cereals or protein feed can be added as supplement to the roughage based diet. The maximum daily intake according to recommendations are 5 kg cereals, 3 – 4 kg peas and 1.5 kg rapeseeds. The intake recommendations naturally depend on the cows individual milking capacity and the quality of the roughage. Potatoes are a great addition to cereals. Boiled potatoes contain more digestible energy than raw potatoes. Root vegetables such as fodder beets and tur-nips are counted as forage, which makes them particularly interesting for organic agriculture. They can provide high yields and they are tasty. The energy value corresponds to the grain. The daily ration is limited by the low crude fat and total solids content and should not exceed 25-30 kg root vegetables per day.
Alternative forage
In the old agrarian society leaves for feeding were important in the win-ter time. The nutritional value is good with a high protein content and a good amino acid composition. But leaves also contain several com-pounds that reduce digestibility such as tannins. Leaves from trees like elm, ash, linden, maple, willow, rowan and sell are quite well digested. A modern variant of feeding of leaves could be mixed silage with 10-20 % of the leading shoot of willow. A combined pasture with clover grass and energy forest could also be a possibility.
An example fodder ration for dairy cows [64]
• Go for hay, good quality roughage, whole crop silage is a good complement
• Supplement with cereals + peas/field beans in low- and mid- lactation
• and with rapeseed/lupin in early lactation
Roughage is the backbone in winter diets

68
Animal husbandry
69
Pasture – convenient and cheap
In organic sheep, beef cattle and dairy production systems, it is impor-tant to maximise the quantity of fresh pasture in the diet. This helps us to achieve minimum feeding costs, with feed of maximum nutritive value.
A major part of the animal’s growth is from pasturing and pastures which are the most natural feed for ruminants. About one third of the beef cow’s diet is pasture and also the milk production depends on pas-ture. Grazing is totally ecological, in the meaning of complete recycling though nutrients. The nutrients pass from soil, through the cattle’s or sheep and then back to the land. It is very essential to achieve a good balance in the summer between the supply of grass and the demand in nutrients for the animals.
The growth of the grass swards is very intensive in the beginning of the summer season and later on the growth slows down substantially. A good strategy is to rotate between several fields.
To be efficient in productive capacity, it is very important to plan acreage and the total grazing strategies. It is also a good habit to let the cattle and sheep out grazing as early as possible in the spring season. Also beneficial, especially for sheep are pastures containing a good diversity of herb species. If sheep have a free choice they will select herbs for two thirds of the diet and grass for the rest.
Grazing technique
The animals learn pasture behaviour from each other, to a certain extent even from other species.A youngster grazing together with fully grown individuals, preferably their mother, becomes better in grazing technique. In that aspect, it is not a good idea to leave a young group on pasture without elders teaching them the best technique.
Optimal height of the sward is 5-8 cm for sheep and 8-13 cm for cattle. Accept higher swards towards the end of season.
Lambs and beef cattle
A well suitable production on ERA farms - ecological lambs and beef cattle
There are a few differences between conventional and ecological re-cycling beef and lamb meat production. This type of production is well suited to ecological farming and only minor adjustments in the production strategy are needed. The conventional straw bedded sheep house conforms to organic standards and in cattle housing a straw bedded lying area is essential (the feeding area may be slatted).
Ecological meat production is largely based on fodder from natural pastureland and clover leys.For sheep and beef production the problems to achieve profitable production levels with home grown feed are relatively easy to over-come. From both economic and physiological perspectives, the live-stock will perform better on predominantly forage diets. However, there may be moments in the production cycle when supplementary feed is essential. Home grown pulse crops should be able to provide adequate protein at these times.
The proportion of forage, including grazing, varies between 80 and 100 % according to production model.
Take good care of clover in pastures [64]
High nitrogen fixation secures long
term soil fertility
White clover is more suitable for grazing
The key issue for a profitable organic beef and lamb meat production is to achieve enough intensity and aim for slaughter maturity according to farm strategies and plans. It is impor-tant to learn how to judge the slaughter maturity, weigh the animals and deliver them to the slaughter house in the right moment. The best tool is a very good forage and grazing plan. For winter fodder the qual-ity is very important and also the right volumes of course. Remember to analyse all feedstuff.
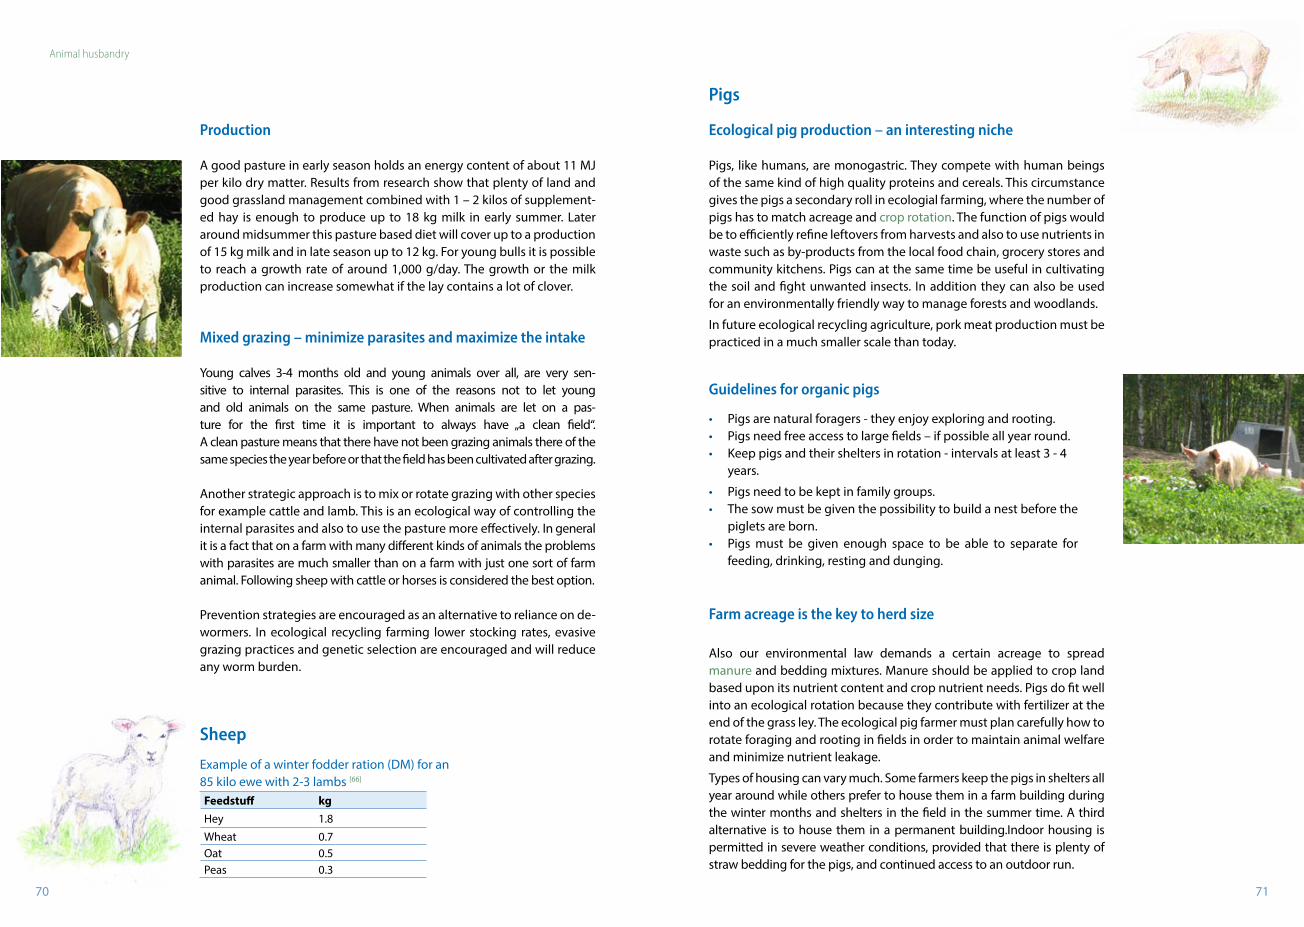
70
Animal husbandry
71
Production
A good pasture in early season holds an energy content of about 11 MJ per kilo dry matter. Results from research show that plenty of land and good grassland management combined with 1 – 2 kilos of supplement-ed hay is enough to produce up to 18 kg milk in early summer. Later around midsummer this pasture based diet will cover up to a production of 15 kg milk and in late season up to 12 kg. For young bulls it is possible to reach a growth rate of around 1,000 g/day. The growth or the milk production can increase somewhat if the lay contains a lot of clover.
Pigs
Ecological pig production – an interesting niche
Pigs, like humans, are monogastric. They compete with human beings of the same kind of high quality proteins and cereals. This circumstance gives the pigs a secondary roll in ecologial farming, where the number of pigs has to match acreage and crop rotation. The function of pigs would be to efficiently refine leftovers from harvests and also to use nutrients in waste such as by-products from the local food chain, grocery stores and community kitchens. Pigs can at the same time be useful in cultivating the soil and fight unwanted insects. In addition they can also be used for an environmentally friendly way to manage forests and woodlands.
In future ecological recycling agriculture, pork meat production must be practiced in a much smaller scale than today.
Guidelines for organic pigs
• Pigs are natural foragers - they enjoy exploring and rooting.• Pigs need free access to large fields – if possible all year round.• Keep pigs and their shelters in rotation - intervals at least 3 - 4
years.
• Pigs need to be kept in family groups.• The sow must be given the possibility to build a nest before the
piglets are born.• Pigs must be given enough space to be able to separate for
feeding, drinking, resting and dunging.
Farm acreage is the key to herd size
Also our environmental law demands a certain acreage to spread manure and bedding mixtures. Manure should be applied to crop land based upon its nutrient content and crop nutrient needs. Pigs do fit well into an ecological rotation because they contribute with fertilizer at the end of the grass ley. The ecological pig farmer must plan carefully how to rotate foraging and rooting in fields in order to maintain animal welfare and minimize nutrient leakage.
Types of housing can vary much. Some farmers keep the pigs in shelters all year around while others prefer to house them in a farm building during the winter months and shelters in the field in the summer time. A third alternative is to house them in a permanent building.Indoor housing is permitted in severe weather conditions, provided that there is plenty of straw bedding for the pigs, and continued access to an outdoor run.
Mixed grazing – minimize parasites and maximize the intake
Young calves 3-4 months old and young animals over all, are very sen-sitive to internal parasites. This is one of the reasons not to let young and old animals on the same pasture. When animals are let on a pas-ture for the first time it is important to always have „a clean field“. A clean pasture means that there have not been grazing animals there of the same species the year before or that the field has been cultivated after grazing.
Another strategic approach is to mix or rotate grazing with other species for example cattle and lamb. This is an ecological way of controlling the internal parasites and also to use the pasture more effectively. In general it is a fact that on a farm with many different kinds of animals the problems with parasites are much smaller than on a farm with just one sort of farm animal. Following sheep with cattle or horses is considered the best option.
Prevention strategies are encouraged as an alternative to reliance on de-wormers. In ecological recycling farming lower stocking rates, evasive grazing practices and genetic selection are encouraged and will reduce any worm burden.
Sheep
Example of a winter fodder ration (DM) for an 85 kilo ewe with 2-3 lambs [66] Feedstuff kgHey 1.8
Wheat 0.7Oat 0.5Peas 0.3

72
Animal husbandry
73
Feedstuff – ecological and on farm grown
Cereal is the main ingredient in ecological pig feed. It is necessary though to add high quality protein to the diet, especially to young pigs. Research work indicates that it is possible to feed older pigs a low pro-tein diet and still maintain good results in growth and meat quality.
In feeding pigs organic, the most difficult stages are to feed lactating sows and newly weaned piglets.
The traditional way of keeping pigs on farms in the old days was based on feeding the animals with waste products. There are many options to supplement the diets with different kinds of alternative feedstuffs: wheat feed, wheat bran, dried sugar beet pulp, molasses, brewers grains, whole or skim milk and so on. Whole milk for example may be available as a by-product from the dairy. It is an excellent and highly digestible feed for pigs of all ages. There are no feeding limitations concerning the amounts used but careful attention is necessary when it comes to feed hygiene. Also different kinds of root crops offer a big variety of feed sup-plementation. Potatoes, carrots, fodder beets, swedes, turnips and sugar beet to mention some. For example, surplus potatoes or those graded unsuitable for the human consumption can be utilized as pig feed. Po-tatoes are an excellent source of energy, protein, essential vitamins and minerals. Approximately 6 kg of raw or 6.5 kg ensiled potato are needed to replace 1 kg barley. For finishing pigs, about 25 % of the diet dry mat-ter can be provided from raw potato, but the performance is likely to be reduced relative to cereal diets. Cooking the potato improves its energy value by 40 % and also inactivates anti-nutritive factors.
Source-separated food waste constitutes a great potential for increasing the flow of urban plant nutrients back to agriculture. This flow can already be approved by certification bodies for use in organic production. Recy-cling systems should place high demands on traceability and low contam-ination in order to safeguard hygiene and environmental requirements.
Pasture and forage utilization depending on age
A pig‘s ability to utilize pasture and forage is related to its age and di-gestive capacity. Forages for pigs need to be leafy, with less stems and straw than a cow would enjoy. Older pigs can handle up to 70 % leafy forages, providing 50 % of their maintenance energy needs. Young pig-lets are unable to consume big amounts of roughage because of their undeveloped digestive tract. They need high quality grain and protein in their ration. However, when the animals grow older, their intake capacity increases. By restricting the amount of concentrate fed to growing pigs forage intake can reach 15 % of dry matter. In such a strategy the growth rate will decrease and result in a leaner carcass.
Pregnant sows have a high intake capacity and can eat and utilise large amounts of low energy forages. However, in lactation the sow need a concentrated diet otherwise she will be loosing weight and have a poor milk production. In this stage forages should be used as supplement.
Pigs are quick to decide about the quality of the pasture. If the pasture is poor the pigs root up the pasture and eat the roots. Some farmers in-clude pigs in their crop rotation and use the pig’s ability for turning in crops and aerating soil. The animals are moved after they eat the crops and weeds and tilt the soil. Pigs will also find worms and insects in the soil, which is a valuable protein complement to the diet. After the pigs are moved only light tillage is needed to prepare the ground for the next crop.

74
Animal husbandry
75
Grazing woodlands
An interesting option is woodland grazing. Pigs are recognised for their valuable contribution to woodland management. Managed carefully they will help to maintain natural habitats by creating better condi-tions for the re-establishment of plants. Woodlands provide shelter and weather protection for the pigs. It is not recommended to put piglets younger than one month of age in woodlands. Pigs kept in forests must respond well to electric fences and they must be offered a dry resting area covered with straw.
An example fodder ration for lactating sows. This example assumes that sows farrow in early summer so that they will benefit from the good quality pasture [66].
Feedstuff %Barley 53.75 Skimmilk 11.75Legume grass pasture 10.1Whole crop silage with peas 10.35Boiled potatoes 3.4Concentrate 10.7
A hen has an excellent ability to search for and to compose a complete diet including all nutrients she needs in proper measure. Poultry have a built in mill and can eat almost everything e.g. seeds, insects and worms. They can be useful in fruit gardens, eating insects. They are also helpful in a mixed grazing system where they contribute to a better utilisation of the pasture by spreading cattle droppings and decreasing the amount of intestinal parasites of other species.
To keep organic layers is quite a challenge compared to conventional egg production. The modern genotypes are bred to produce a large number of eggs and for efficient feed conversion.
Most European organic poultry farms keep hybrids bred for conven-tional conditions. This is in fact one of the reasons why problems occur in feeding and managing the flock. To use a landrace, dual purpose breed or even an original breed is not yet a possibility in commercial production due to a very low production rate.
Farmed poultry and humans compete for the same feed ingredients. Also ecological hens are mainly fed cereals, corn, peas and soy beans and one might say that it is a limiting factor in creating a sustainable nutrient recycling system.
Examples of vegetarian farm grown crops for protein
Field beans Peas Sun flower seeds Rape seeds
New ecological high value protein
Fly larvae mealAlgaeMussel mealHemp cake Sesame cakeFermented amino acid products
Poultry
The challenge of the laying hen in ERA farming
ERA farm recommendations • Rotational grazing
• High quality pasture
• Supplemented with farm grown grains and legumes

76
Animal husbandry
77
Roughage
Experiences from recent years indicate, that poultry to a certain extent is capable of absorbing nutrients in roughage. The roughage also makes the hens calmer and less aggressive, feather pecking is reduced and mortality rate decreases.
In the summer time the intake of roughage should come from the pasture and in the winter time from for example silage or carrots. Hens prefer finely chopped, maximum 5 cm length roughage and whole crop silage. According to a Danish study a hen will eat as much as 50-60 g whole crop silage in one day. Cabbage as roughage is also a possibility. Hens like it and the protein quality is good.
Recycled waste food and by-products
Poultry in small scale holdings were once effective users of waste. Con-verting by-products from “local food chains” e. g. kitchen- and garden scraps and shop wastes into eggs. Laying hens were an important link in recycling. Why do we not use that power today?
There are several by-products that are useful in layer diets, for example dairy products, waste from breweries and bakeries. Recycled food will play an important roll in the future.
The importance of a good start in life
The rearing period is very important and it accounts for more than 60 % of the bird’s production performance on a laying farm. It is important that the conditions in the rearing house, such as housing sys-tem, daylight, access to outdoor run etc. are similar to those on laying farms. It is very important to avoid behavioural disturbances during the rearing period. There has been observed less feather pecking in flocks that are reared with good litter. Presence of good litter remains impor-tant throughout the laying period. There is also more feather pecking in larger groups and in groups with higher bird densities.
Feeding
An ecological layer will eat about 130 grams per day. Cereals such as wheat, barley, oats or maize are the base in layer feed. A thumb rule for cereals is 1/3 of each component. A good protein quality in the diet means a higher proportion of on farm grown cereals in the daily rations. A normal content of cereals in the diet lies between 60-80 percents.
Soy is debated as it often is imported from distant countries and further-more contributes to the destruction of rainforests and grasslands. Fish-meal, commonly used in ecological layer diets in Scandinavia is another debated protein source. New organic high value protein feedstuffs may also be interesting in the future.
Let the hen choose herself
A modern laying hen does not need to show foraging behaviour to ob-tain feed, but she is still highly motivated to do so. In the wild 65 % of the time is spent on ground pecking and scratching. It is indeed a challenge to satisfy the chickens need to express natural behaviour. The poultry farmer has to make sure to keep the flock occupied to avoid outbreaks of feather pecking and cannibalism.If we let hens have a free choice what to eat we can save a great deal of work. Experiments have shown that at least in smaller flocks, about 30 hens, so called cafeteria feeding, is possible.The animals were separately served whole wheat, whole oats, sea shells, fish meal, clover/luzern hay, and grass in the outdoor run in the summer-time. In winter time they were also fed a mixture of mashed cereals, cod liver oil, cabbage and turnips, salt and trace elements.

Animal husbandry
78
Housing
The hen house must be carefully planned. There must be enough space, nest area and perches in the hen house, and plenty of opportunities to dust bathe in fresh litter. Make sure that the hen house is as rodent-proof as possible. Be sure that you can remove the manure on a regular basis, preferably once or twice a week. The hen house housing a large flock must have a good ventilation system while it is possible to achieve a good indoor climate using natural ventilation in a small hen house.
Mobile hen house – a perfect solution
A mobile hen house serves several purposes and is a perfect way to com-bine egg production with crop rotation. Hens fertilize the pasture area, find insects and green plants to eat. By moving the house regularly one will minimize the risks of parasites. It is possible to build a self made mo-bile house or buy a complete house with all equipments for 200 - 1,200 laying hens.
An example vegeterian fodder ration for 20-28 week old layers
Feedstuff %Wheat 16.85 Maize 6.0Sunflower cake 10.8Soybeans 30.57Rape seeds 5.0Hemp seeds 20.63Alfalfa meal 2.0Calcium carbonate 4.5Cryster shells 4.3MCP 0.15
Plant ProtectionStefan Kühne and Sara Preißel
Why it matters 80Principles of organic plant protection 81Preventive Plant Protection 82Habitat management to promote beneficial insects and birds 84Weed management 85Direct Control of Pests and Diseases 86

80
Plant protection
Pesticide-based plant protection in agriculture has led to vast ecological problems for the Baltic Sea as well as other ecosystems. Although the ban of some of the most harmful chemicals has alleviated the situation temporarily[26], pesticide use (especially of herbicides) [30] in the Baltic Sea catchment area has increased since the 1990s, and further increases are projected[28]. Accumulating in river estu aries, agricultural pesticides pose a threat for marine life and humans.
In organic agriculture, and on ERA farms, synthetic plant protection agents are not applied, so none of these pesticides are emitted to the Baltic Sea from such farms. Instead, weeds, pests, and diseases are con-trolled primarily through prevention. This requires thorough knowledge of the biology of pest organisms and their interactions as well as how agricultural operations influence their development.
Past and future issues It is important to establish which specific pests cause significant eco-nomic damage in one’s fields – considering that the conversion to ERA farming changes the set of problems. Due to the wider crop rotations and lower fertilization, long-term organic farmers often experience more diverse but less severe infestations of pests and diseases. For ex-ample, organic farms have fewer problems with soil-borne diseases and aphids. Instead seed-borne diseases (cereals), potato late blight, pests and diseases of grain legumes (sitona weevils, aphids, fungi), mice and wireworms in fodder crops, storage pests, and weeds are often more problematic[29].
Even when all preventive measures are taken, regulatory measures may be necessary. It is important to carry out a close monitoring of pest development (e.g. with the help of sexual pheromone traps in fruit or-chards and grain stores). Also an analysis of the economic and ecologi-cal costs and benefits of control measures needs to be made.Preventive measures are the foundation of plant protection in ERA farming systems.
Why it matters
Rules for ERA farms
What are the biggest challenges
Principles of organic plant protection
Plant protection and
strengthening agents
mechanical, optical, thermal,
and acustic methods
Physical measures
Application of beneficial insects and pheromones
Biological and bio technical measures
Site and variety choice, crop rotation, soil and manure management, promotion of beneficial
insects through habitat managementPreventive agronomic practices
Framework for action
© Julius Kühn-Institut
Concept of Plant Protection for ERA farms
• Ban on synthetic plant protection agents and especially herbicides• Ban on genetically modified organisms
Utilization of Natural Regulatory Mechanisms
Promotion and conservation of beneficial organisms through diverse habitat structures
Biological and Biotechnical Plant Protection
Confusing pests with sexual pheromonesApplication of beneficial insects, e.g. parasitic waspsUse of microorganism (virus, bacteria, fungi)
Plant Protection Agents based on Natural Substances
E.g. from plant extracts (Neem tree, Chrysanthemum) or insecticidal soap
Flower strips promote aphid predators such as Green Lacewings
Pheromone against Codling Moth
Neem extracts against Colorado Potato Beetle

82
Plant protection
83
Preventive Plant Protection [30]
Measure Examples/Specifications
Choice of suitable crop sites and adapted varieties
Plant resistant varietiesE.g. Anthracnose resistant yellow lupineAlternate or mix varieties with different resistance genes Early potato varieties can be harvested before late blight
Choose varieties bred for organic agriculture
E.g. cereal varieties adapted to organic nutrient levels and disease spectrum
Use crop mixtures and variety mixtures that can improve plant health and stabilize yields through compensation
Crop mixtures are common for fodder cropsVariety mixtures with different resistances, e.g. against mildew in barley
Plant certified seed to reduce seed-borne diseases
Organic seeds can be treated with hot water, hot air or natural fungicides
Diverse crop rotations
Alternate cereals and broad-leafed crops
This breaks the chain of infection of soil-borne diseases, e.g. fusarium in cereals, nematodes in broad-leafed crops
Have crop rotations that follow the recommended time intervals for crops
Potato cyst nematodes and late blight, eyespot and take-all in cereals, many legume diseases
Have suitable cover and catch crops during winter
Mustard as catch crop reduces nematode populationsGreen manure and fodder crops reduce weed pressureNote: promotes slugs and mice
A preventive plant protection strategy must consider pests, diseases and weeds as an integrated whole, since there are many interactions between the three. For example, pests can transmit viruses and create an entry points for fungal diseases; weeds create a fungi-friendly microclimate and are hosts for diseases (e.g. mildew, rust fungus). On the other hand, flowering weeds are important for attracting beneficial insects. Select from the measures listed below to design a prevention strategy adapted specifically to address your key pest organisms. Con-tact your local agricultural advisors and agencies for information on suppliers, etc.
Measure Examples/Specifications
Soil cultivation and manure management (soil fertility)
Reduce turning tillage and increase soil cover (mulch, intercropping)
Increased soil life and soil cover reduce soil-borne diseases and weed seedsNote: promotes slugs and mice
Thorough tillageDestroys crop and weed residues that carry pathogens and pest larvae, e.g. corn borer larvae and ear rot in maize, rye blotch
Balanced fertilization Lower amounts of nitrogen fertilization reduce fungal infections
Thorough composting of manure and crop residues
Prevents the spreading of pathogens and weed seeds contained in farmyard manure
Promotion of beneficial insects and birds
Habitat management See next page
Other measures
Adapted crop spacingWider spacing reduces fungal diseases through better aeration (septoria, mildew in cereals, ascochyta in legumes)Wider row spacing facilitates mechanical weed management
Promote fast germination/ seedling development
Pre-sprouted potatoes mature faster and escape potato late blight to a degreePlanting vegetable seedlings instead of seedsOptimal sowing conditions (large seed, shallow depth, optimal timing)
Mulch Straw mulch between potato plants irritates aphid immigration due to its colour and surface structure
Apply plant strengthenersNot regulated by the European Organic Regulations, consult your certifier to find out which substances are approved for your situation
Reduce the weed potential See next pages
Examples for plant strengtheners
• Plant extracts from Stinging Nettle, Field Horsetail, Tansy, Wormwood, Comfrey, Algae...
• Homeopathic preparations• Minerals: Lava meal, alumina, silicate• Microorganisms: Bacillus subtilis

84
Plant protection
85
Weed management
Besides preventive methods like crop rotation etc., weed control in ERA farms relies on mechanical and thermal measures. These measures are most effective on small-sized weeds, the control of larger weeds is cost-ly. Thus, timely weed control is crucial. Perennial weeds such as creeping thistle and couch grass on arable land and dock weed on grassland are difficult to manage and require a combination of measures.
Beneficial insects can be promoted by creating and maintaining flower strips and hedges as biotopes. These provide:
• Winter habitats (e.g. for spiders and ladybird beetles) nectar and pollen (e.g. for parasitic wasps and hoverflies)
• Refuge during and after harvest
The biotopes should be well distributed over the agricultural areas, since the insects move in a ca. 50-300 m radius where they regulate aphids and other pests [31]. Hedges and flowers also provide food, refuge and nesting possibilities for birds supporting the regulation of pests.
Habitat management to promote beneficial insects and birds
On the fields
In fruit orchards
Central points in weed
prevention are[32]:
Annual field ridges Outer 3-8 m of the field Allow multiplication of arable field plants and insects Perennial flower Up to 10 m wide strips at the edge and strips within fields, e.g. sown with annual and perennial wild plantsHedges Establish a ca. 2 m wide strip along hedges, which may be mowed once every 2 years
Nesting cavities are the limiting factor for bird density in fruit orchards. Nest boxes attract songbirds such as tits, tree sparrows and nuthatches. Birds regulate insect pests, e.g. one pair of tits consumes up to 3 kg of insects per year [31].
Nesting boxes Ca. 7 nesting boxes per hafor songbirds Hole size 30 mm (excludes starlings)
• Crop rotation with perennial legume-grass leys• Turning tillage• Stubble cultivation, repeated seedbed preparation (false seedbed),
and pre-emergence weeding• Prevention of seed production and rhizome formation• Dense ground cover using appropriate varieties, variety or crop
mixtures, cover crops, mulch, or under-sown crops• Spacing that allows for efficient mechanical weed control
Weed control [32]
Measure/Tool Application Affected weeds
Harrow False seedbed, before emergence, in young crops (careful in broad-leafed crops)
Small annual weeds
Hoe Between rows (>15 cm spacing), with spe-cial equipment also on ridges
Up to large, well rooted weeds and grasses
Weed burner (High energy costs!) Before emergence or between rows (> 30 cm spacing)
Small annual weeds
Ridger Widely spaced crops, when planting, be-fore emergence, in larger crops (cereals)
Medium-sized weeds
Rotary tiller, Tooth cultivator During bare fallow Rhizomes of perennial weeds are dug up and desiccate
Soil solarisation (High costs!) Bare fallow in summer: sunlight heats up soil covered with plastic sheets
Weed seeds, plants and pathogens
Hand weeding (High costs!) Within rows and after crop canopy closure Large weed plants with imminent seed dispersal
Infestations of mice are especially common on perennial grasslands and in fruit orchards, and to a lower degree on fields. Their numbers can be reduced by providing artificial raised stands from which their natural en-emies, raptors (e.g. buzzard, kestrel) and owls, can hunt. Also martens, weasels, and hedgehogs hunt mice.
Raised stands for 1 stand per ha, 200 m distance from roads, raptors and owls height 2 m, installation September - April Mobile stands facilitate installation and removal
On grassland
Incompletely decomposed cereal residues are a dangerous source of fun-gal infections (Fusarium). The Guettler roll crushes maize stems and thereby destroys the winter habitat of corn borer pupae Solarisation with plastic sheets.
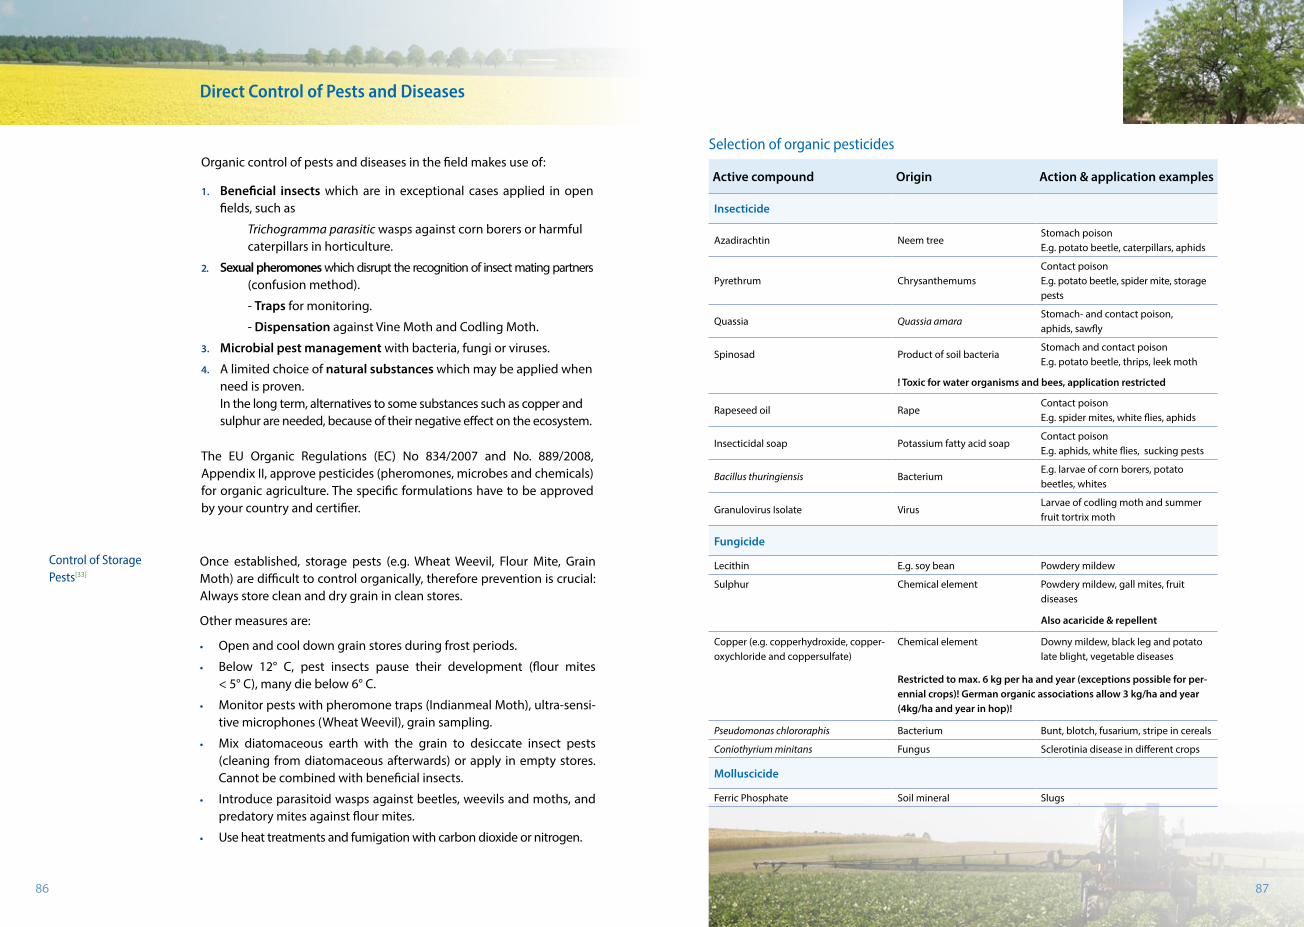
86
Plant protection
87
Direct Control of Pests and Diseases
Organic control of pests and diseases in the field makes use of:
1. Beneficial insects which are in exceptional cases applied in open fields, such as
Trichogramma parasitic wasps against corn borers or harmful caterpillars in horticulture.
2. Sexual pheromones which disrupt the recognition of insect mating partners (confusion method).
- Traps for monitoring.
- Dispensation against Vine Moth and Codling Moth.
3. Microbial pest management with bacteria, fungi or viruses.
4. A limited choice of natural substances which may be applied when need is proven. In the long term, alternatives to some substances such as copper and sulphur are needed, because of their negative effect on the ecosystem.
The EU Organic Regulations (EC) No 834/2007 and No. 889/2008, Appendix II, approve pesticides (pheromones, microbes and chemicals) for organic agriculture. The specific formulations have to be approved by your country and certifier.
Control of Storage Pests[33]
Selection of organic pesticides
Once established, storage pests (e.g. Wheat Weevil, Flour Mite, Grain Moth) are difficult to control organically, therefore prevention is crucial: Always store clean and dry grain in clean stores.
Other measures are:
• Open and cool down grain stores during frost periods.
• Below 12° C, pest insects pause their development (flour mites < 5° C), many die below 6° C.
• Monitor pests with pheromone traps (Indianmeal Moth), ultra-sensi-tive microphones (Wheat Weevil), grain sampling.
• Mix diatomaceous earth with the grain to desiccate insect pests (cleaning from diatomaceous afterwards) or apply in empty stores. Cannot be combined with beneficial insects.
• Introduce parasitoid wasps against beetles, weevils and moths, and predatory mites against flour mites.
• Use heat treatments and fumigation with carbon dioxide or nitrogen.
Active compound Origin Action & application examples
Insecticide
Azadirachtin Neem treeStomach poison E.g. potato beetle, caterpillars, aphids
Pyrethrum ChrysanthemumsContact poison E.g. potato beetle, spider mite, storage pests
Quassia Quassia amaraStomach- and contact poison, aphids, sawfly
Spinosad Product of soil bacteriaStomach and contact poisonE.g. potato beetle, thrips, leek moth
! Toxic for water organisms and bees, application restricted
Rapeseed oil RapeContact poison E.g. spider mites, white flies, aphids
Insecticidal soap Potassium fatty acid soapContact poison E.g. aphids, white flies, sucking pests
Bacillus thuringiensis BacteriumE.g. larvae of corn borers, potato beetles, whites
Granulovirus Isolate VirusLarvae of codling moth and summer fruit tortrix moth
Fungicide
Lecithin E.g. soy bean Powdery mildew
Sulphur Chemical element Powdery mildew, gall mites, fruit diseases
Also acaricide & repellent
Copper (e.g. copperhydroxide, copper-oxychloride and coppersulfate)
Chemical element Downy mildew, black leg and potato late blight, vegetable diseases
Restricted to max. 6 kg per ha and year (exceptions possible for per-ennial crops)! German organic associations allow 3 kg/ha and year (4kg/ha and year in hop)!
Pseudomonas chlororaphis Bacterium Bunt, blotch, fusarium, stripe in cereals
Coniothyrium minitans Fungus Sclerotinia disease in different crops
Molluscicide
Ferric Phosphate Soil mineral Slugs

88
PhosPhorusKarin Stein-Bachinger & Johann Bachinger
Why it matters 90Importance for plant growth 91The story of mycorrhiza 92P on farm level 93How to increase P efficiency 94Legal restrictions 96

90
Phosphorus
91
Why it matters
Phosphorus (P), an essential macro nutrient for plants, is a non-renew-able resource. Soil contains between 0.02 and 0.2 % P. Topsoil with 3 % organic matter contains about 1 ton of P/ha and of this only about 1 % is mineralized during the growing season becoming accessible to plants [44,52]. Phosphorus is always found in combination with other ele-ments in the form of phosphates, it doesn’t occur naturally as an element.
Agriculture is one of the biggest users of phosphorus. The main source is mined rock phosphate most of which comes from Morocco, China and USA. Europe is totally dependent on imports. According to various calculations it can be assumed that the global phosphate reserves will be depleted in 50 - 100 years [41].
During the past decades, P from agricultural runoff and point sources has contributed to a high level of eutrophication and increased algae growth in the Baltic Sea. This in turn has resulted in growing areas of dead sea bottoms and the disappearance of aquatic animals [42]. Especially in farming regions with high animal densities and where production is based on purchased fodder, the potential for P losses is still increasing due to the application of high amounts of slurry [1, 44].
In areas with one-sided and intensive crop production the main path-way for phosphorus into water bodies is water erosion. More than 60 % of the diffuse P-inputs is caused by erosion and in the process arable soil is lost irreversibly. On arable land (e.g. with maize) up to 50 kg phos-phate per ha and year can be washed away [55].
Current situation
Environmental issues
P is an essential component in every cell in all living organisms and cannot be replaced by any other element. P supports many plant processes [9,45] e.g. photosynthesis, microbial activity (especially nitro-gen fixation), fruit formation, winter hardiness and competitiveness (especially of perennial legumes), disease resistance and building stalk strength.
The phosphorus concentration in the soil solution is very low. Therefore a quick and continuous mobilisation of P from the unstable fraction is necessary. As shown in the following figure, the soil microbial biomass is the main source and buffer for phosphorus which is available for the plants [55]
Multifunctional benefits of P
Importance for plant growth
Satellite image of algae in bloom in the Baltic Sea, Summer 2006. Source: NASA (image processed and made available by SMHI).
http://www.smhi.se/kunskapsbanken/oceanografi/algblomningar-i-ostersjon-1.3008
Definition The word phosphorus is derived from the Greek ‚phos‘ meaning ‚light‘ and ‚phorus‘ meaning ‚bringing‘.
Leaching
Fertilisation Shoot
Erosion
unstable inorganic
P
RootMinerals Humus Litter
Phosphate in soil solution
unstable organic
P
stablestable
orga
nic
P
inor
gani
c P
Phosphate in microorganisms
P cycle in the soil with the initial pools of the stable and unstable (labil) fractions (organic and inorganic) and the places of conversion: soil solution, microorganisms and plants [55]

92
Phosphorus
93
The story of mycorrhiza
Beneficial soil microorganisms like symbiotic mycorrhizal fungi help to improve the uptake of nutrients like phosphorus that are difficult to ac-cess in the soil. The mycorrhizal fungi provide the plant with nutrients and moisture. This can happen because the fungi increase the surface absorbing area of the roots and thereby greatly improve the ability of the plant to access soil resources and release enzymes into the soil. These help to dissolve hard-to-capture nutrients, such as organic and mineral phosphorus and micronutrients. The plant utilizes these re-sources to grow and photosynthesize, capturing carbon dioxide from the air and transforming it into carbohydrates, which also provide nour-ishment to the mycorrhizae [46].
Undisturbed soils are full of these beneficial organisms. Intensive tillage and intensive use of readily soluble phosphorus fertilizers, erosion and soil compaction reduce or eliminate these mycorrhizae [46].
Plants living in symbiosis with fungi are more resistant against diseases (e.g. nematodes) and bad weather conditions (e.g. droughts) [55,56]. On the whole, these mycorrhizae provide many direct and indirect services that contribute to increased agricultural productivity, improved water-infiltration and water-holding capacity, and soil carbon sequestration [46]. Therefore, it is essential for ERA farming systems to maximize the presence of mycorrhizal fungi. This can be achieved through, for ex-ample, a diverse crop rotation, minimal soil disturbance and the use of cover crops.
Necessary cooperation [46]
Additional advantages
P on farm level
Usually on ERA farms, the P-balance is either zero or slightly negative (up to – 2 kg P/ha and year) [1, 3]. In general, most farms do not need to apply P because of the high P levels that remain in the soil. Within ERA farms, P is recycled via crop residues and farmyard manure. About 80 % of the harvested phosphorus is used as fodder, which passes through the ani-mals and returns to the soil in the form of manure [2].
P content of different products [4, 5]
1 t cereals or grain legumes 4 – 5 kg P
1 liter milk 1 g P
1 t cattle manure 1.2 kg P
1 t pig manure 2.5 kg P
1 t bone meal 85 kg P
1 t horn meal 10 kg P
Up to 40 % of the P can be taken up from the subsoil [44]. Active nutrient mobilization is accomplished for example by legumes which lower the pH in their root zones. This plays an important role for the P mobilization of calcium phosphates from e.g. raw phosphates [57].
Eventual P deficiencies can be detected through soil analysis or nutrient balance assessments, but it is important to take into account that the potential mineralization of the organic bound nutrients is not included in the common analysis values. A deficit of about 2 kg P/ha and year at farm level seems to be effectively compensated through weathering processes and the uptake from the subsoil through deep rooting plants like clover and alfalfa [1].Deficiency symptoms which might occur include the dark-green older leaves turning red and violet and even stalks turning red in color. To meet P deficiencies, several agronomic options can be considered (see following pages) including fertilization by slowly dissolving fertilizers that meet organic standards.
In many cases it is the oxide form P2O5 that is used in agriculture: 1 kg P ≈ 2.29 kg P2O5
1 kg P2O5 ≈ 0.44 kg P
Definition Mycorrhiza: comes from the ancient Greek words ‘mycor’ = ‘fungus’ and ‘rhiza’ = ‘root’. Most plants like cereals, potatoes, legumes and even weeds can develop a symbiosis with mycorrhizal fungi. Only crucifers like rape, cabbage and mustard do not have the capacity to do so.

94
Phosphorus
95
How to increase P efficiency
Measures to reduce P losses [43]
The greatest positive effects can be achieved by improving the soils‘ ca-pacity to increase water infiltration and prevent soil erosion and surface runoff.
• Increase humus content (soil fertility) and rooting depth.
• Retain vegetation cover (crop rotation) throughout the year (e.g. grow catch crops followed by mulching).
• Reduce tillage operations in endangered sites, till across the slope.
• Reduce soil compaction (also on grassland): avoid cultivation on wet soils, reduce wheel pressure, combine farming operations.
• Apply targeted liming to increase P availability.
• Establish permanent grassland on hills and fields at risk from flooding and on buffer zones around water bodies.
• Replace maize in problematic sites (e.g. hills, fields adjacent to water bodies) with clover-grass.
• Use peat soils only for permanent grassland as there is a high risk for leaching of P.
• Promote incorporation of manure to avoid losses by surface runoff.
• Reduce losses in the food chain.
Measures to increase P recycling [52,53]
• Increase P mobilisation through mycorrhizal root fungi by improving soil fertility and rooting depth.
• Cultivate legumes (red clover, field beans, white lupins) and increase the legume proportion in fodder mixtures (70 - 80 %) to support the mobilisation of P. Legumes lower the pH value in the rhizos phere through proton sequestration (H+) which leads to mobilisation of cal-cium phosphate, e.g. from rock phosphate.
• Cultivate buck wheat and serradella as catch crops to increase the mobilization of organic P reserves.
• Use manure and plant residues to improve the turnover of soil orga-nisms and mobilisation of organic P resources.
• Ensure sufficient storage capacity for slurry to be able to choose the most effective application date at the beginning of the vegetation period in order to maximize nutrient exploitation.
• Use farm gate and field level assessment methods to get an overview of the overall P level within the farm.
With regard to the whole food chain, the main P-losses occur in sewage sludge, organic and green waste and slaughterhouse waste. However, the recycling of these materials is hampered by the contaminates and pollutants they probably contain (see next page).

Phosphorus
96
Legal restrictions
Different regulations for the recycling of bone meal in different countries
The use of bone meal as organic P- and Ca-fertilizer is not allowed in every country in the EU. For instance, in Sweden, special products are allowed for use on organic and ERA farms, whereas in Germany several organic growers’ associations ban these products completely (e.g. Dem-eter, Bioland), while the EU regulations for organic agriculture allow their use. In Denmark, bone meal (e.g. Biogrow) use is allowed by the national regulations; however, the Dairy Association has forbidden the use of bone meal on land used for organic fodder production.
The existing European regulations, such as the Nitrates Directive and the Water Framework Directive, focus on combating the leaching of ni-trogen, not phosphorus [41, 44, 49]. P from agricultural sources as well as P-recycling are not yet subject to European regulations.
ERA farming can help to alleviate the problems of eutrophication (of the Baltic Sea) from P as well as increase recycling of P, a non-renewable re-source.
For further information also see the phosphorus position paper:
http://www.balticcompass.org
Future perspective
Farm cooperationsGustav Alvermann
Initial situation 98Basic models of fodder – manure – cooperation 99Examples of four cooperation types 100Conclusions 104

98
Farm cooperations
99
Initial situation
The ecological as well as the economic stability of organic and ERA farming mainly results from their conceptual versatility. Ruminants are fed forage from legume-grass and their organic manure fertilizes the cereals and other non-legumes in the crop rotation. Some of the produced cereals and other fodder crops are fed to pigs and poultry (animal husbandry) and their manure is returned to the fields to further stabilize the system. A land use system, which includes legume-grass leys, annual cash crops and, ideally, a diversity of animal species, stabilizes the humus content of the soil and helps to reduce weeds and other pests.
However, most of the farms that have converted to organic agriculture since the 1990s are specialized in some way: cereals, row crops, forage crops or specific breeds of e.g. poultry, pigs or cattle. That a certain branch of production is dominant is often the result of one factor of production (e.g. the soil type, the regional market or the skills and in-terests of the farmer) being best suited to a specific kind of production. Through this specialisation a better return on labour and invested capital is achieved. When the farmer converts to ERA production, the specialised production is usually retained. To shift to a flexible mixed-farming system today is not an economic option for most of the farmers as the economic benefits of specialisation are often lost when the farm diversifies. Also many farmers may not have the necessary knowledge and experience to make such a transition.
To bridge these two important characteristics of successful farming - specialisation that gives economic stability and diversity of production that gives ecological stability - cooperation between two or more farms is possible. The specialised crop farmer supplies the specialised livestock farmer with fodder, such as legume-grass or whole crop silage, with grain from cereals or grain legumes and with straw for bedding. In exchange he receives an equivalent of nutrients in the form of organic manure.
On farm recycling
Reasons for specialisation
Way out
There are basically three different models of fodder – manure – cooperation:
1. Forage (legume-grass or whole crop silage) for ruminants or for biogas plants in exchange for manure and slurry.
2. Fodder (cereals and grain legumes) for poultry and pigs in ex-change for pig manure and fresh and dried poultry manure.
3. Straw in exchange for manure or e.g. mushroom compost.
The appropriateness of these different forms of cooperation depends on many factors including the distance between the cooperating farms and the nutrient density of the load. With silage, and even more so, slurry and fluid digestates, it is mainly water that is being transported. Cereals, straw and dried poultry manure have a much higher dry matter content.
Monetary value in € per ton of exchanged products
Legume-grass silage 25 Liquid cattle manure 10
Straw 100 Pig manure 20
Cereals 350 Mushroom compost 25
Grain legumes 400 Dried poultry manure 65
The following forms of cooperation are discussed in more detail:
Cooperation type 1 Legume-grass exchanged for solid or liquid cattle manure
Cooperation type 2 Fodder grains exchanged for (dried) poultry manure
Cooperation type 3 Straw exchanged for manure or mushroom compost
Cooperation type 4 Combining different forms of cooperation
Basic models of fodder – manure – cooperation

100
Farm cooperations
101
Examples of four cooperation types
Cooperation type 1: Legume-grass exchanged for solid or liquid cattle manure
This form of cooperation is the most common in organic farming and therefore recommended for ERA farms since a high amount of legumes, mainly legume-grass in their crop rotation is necessary to maintain soil fertility and control weeds. An arable farmer and a nearby cattle farmer with limited access to land can benefit from that kind of cooperation. Ideally, a dairy farmer and a specialised crop farmer will start the conver-sion to ERA at the same time. Another possibility is when a dairy farmer wishes to expand but land rental costs are prohibitive. In such a situa-tion the motivation for cooperation is positive and stable for both.
Usually, when forage and manure are exchanged no money is trans-ferred. The crop farmer covers the cost for cultivation of the legume-grass. The cattle farmer covers the costs for harvesting and transport-ing the forage and spreading the manure onto the fields. In some cases the cattle farmer may make an additional payment for the legume-grass silage of between € 5 and € 10 per ton. Short distances between farms and a high legume-grass yield ensure that this valuable recycling method is economically feasible.
The cooperation between a farmer and a modern biogas plant is simi-lar. Most biogas plants operate with large quantities to ensure that pay-ments for biomass and charges for slurry are correct. Alternatively the farmer supplies the legume-grass biomass and receives a remuneration of € 30 per ton. In this case the crop farmer covers all costs for harvest-ing, transporting and spreading the slurry on the farm. This remunera-tion of € 30 per ton biomass (33 % dry matter) delivered to the biogas plant is adequate. The harvest and transport of fresh biomass is esti-mated to cost € 15 per 10 kilometres and ton; the transport and spread of slurry on the field would cost about € 5. The expected return from 1 ton of silage is calculated with 0.75 m³ fermented slurry. This gives a return of € 10 per ton of legume-grass silage or € 250 per ha with an estimated harvest of 25 tons of legume-grass per ha and, additionally the indirect fertilisation value of the returned slurry.
How to start?
Economics
Biogas plants
Cooperation type 2: Fodder grains exchanged for (dried) poultry manure
This form of cooperation is less dependent on local structures, due to the higher concentration of dry matter of the exchanged goods. For distances of more than 10 kilometres the transport of the manure by a transport company rather than by the farmer with his own tractor, may be more appropriate. Often this exchange is not direct as the grain passes through a fodder plant where appropriate feed mixtures are pre-pared. Many poultry farmers do not mix their own fodder on their farm.
Hence, the crop farmer supplies fodder cereals and grain legumes to the commercial fodder plant, which then supplies the organic mixed fodder to the poultry farm. In exchange, the crop farmer receives the nutrient equivalents in the form of poultry manure by lorry which will be spread in the spring before planting or in the fall on cereal stubble before sow-ing catch crops. A crucial point is the proper storage of the fresh or dried manure. This can be done at the poultry or the crop farm. Storage facili-ties on the poultry farm should be large enough to hold one lorry load of manure, have a flat and solid base and be able to be covered.
The value of manure received is usually equal to the fodder grains supplied by the crop farmer. The cost for transporting and spreading the manure is paid by the crop farmer. If the distance exceeds 50 km, the costs for transport are shared equally. This exchange is of course most effective when transport distances are short and in such cases it helps the crop farmer to maintain high cereal yields. The main application time of the poultry manure is in spring, when it is ploughed down before sow-ing spring cereals or other spring crops like corn.
How to start?
Interconnection
Economics

102
Farm cooperations
103
Cooperation type 3: Straw exchanged for manure or mushroom compost
In some regions straw has become a scarce resource. This has created a possibility for an exchange of straw for bedding in return for straw enriched with animal dung and urine. Usually horse farms request this exchange. But because manure from horse farms usually has a high con-tent of straw it is often not worth the effort and the crop farmer refuses. One option is to store this material for a time until it is appropriate to use as a supplement in legume production. Through this way nitrogen im-mobilisation can be avoided and the crop system can be strengthened. The costs for harvesting, transport from and back to the field as well as spreading are covered by the farm who receives the straw. Such coop-eration requires a high level of organisation in order to ensure accurate timing for other production processes such as catch crop cultivation or stubble breaking.
Another straw-manure-cooperation more appropriate over longer dis-tances is the exchange of straw for mushroom compost. This is the de-composed organic residue from the production of white mushrooms. It is basically a mixture of straw, poultry manure and the mycelium from mushrooms. Because it contains a lot of macro and micro nutrients and has a good C/N balance it is valuable as a basic fertiliser and can also be used on legumes. In this cooperation model the mushroom produc-ers cover all costs for harvesting and transporting the straw as well as for transporting and spreading the compost on the field. Because straw contains a lot of potassium, maintaining a balance among macro-nutri-ents is an important consideration. With other nutrients, usually a bal-anced intake can be achieved. If appropriate infrastructure is in place for easy transport and loading (onto the lorry) and the distance is not too great, the ‚straw‘ farmer can receive a benefit worth up to between € 50 and €100 per ha from this cooperation.
Option 1
Option 2
As outlined in the examples before, specialised crop farmers have many options to stabilise their farming system by cooperating with other enterprises depending on the specific situation in their area. One positive cooperative experience often leads to additional exchanges. This is exemplified in the following:
1. Local cooperation
25 % of the legume-grass in the crop rotation is delivered to a nearby dairy farm. In exchange separated thinned slurry is spread as a top dressing on winter cereals.
2. Regional cooperation
Fodder cereals are exchanged with a poultry farmer located 30 km away. The dried poultry dung is ploughed down prior to the spring cereal crop.
3. Supra-regional cooperation
All straw from the cereal production is pressed and delivered to a mushroom producer 100 km away. The returned mushroom com-post is used as a basic fertilizer for field beans and legume-grass.
Cooperation type 4: Combining different forms of cooperation
Present situation and trends with regard to distances be-tween farms
It is obvious that these different forms of cooperation are more or less appropriate in different situations. For example, the exchange of fodder for manure and slurry is only possible within limited geographic areas, from 10 to 15 kilometres at most. On the other hand, cereals and grain legumes in exchange for dried poultry manure is possible over a larger geographic area. Regional models of cooperation that operate over dis-tances of up to 50 kilometres and more already exist. The high demand for straw as the basic substrate in commercial mushroom production has led to cooperation and exchanges over distances of more than 100 km. Although there are many individual reasons for starting a cooperation, long distances (>50 km) between cooperating farms are not eligible according to the ERA principles.
Innovative options

104
Farm cooperations
105
Conclusions
There is a consensus that mixed ERA farming (combining diverse crop and animal production) is the most stable and sustainable farming system. However, such farming is not possible in every region or on every farm – certainly it is more difficult to practice today than it was thirty years ago.
For this reason cooperation between ERA farms in close proximity leads to an effective nutrient recycling and can provide an option for special-ised crop and livestock farmers. But it has to be taken into account that the transport distances need to be limited.
In Germany the various organic farming associations have set up recom-mendations regarding the maximum distances allowed between coop-erating farms (e.g. 50 km). For other countries within the Baltic Sea drain-age area, the forms of cooperation that are feasible and eligible need to be assessed.
Ecological Recycling AgricultureGuidelines for Farmers and Advisors
The Box of Guidelines contains
Vol. 1 Farming Guidelines Vol. 2 Economic Guidelines Vol. 3 Marketing GuidelinesVol. 4 Farm Examples
Software Tools

106
�Nitrogen�budget�calculator� 109Legume�estimation�trainer�� 115ROTOR�–�Organic�crop�rotation�planner� 123
Legume estimation trainer
A learning tool for a better estimation of the legume proportion in forages
ROTOR– Organic crop rotation planner
A tool to plan crop rotations in organic farming systems
N-budget calculator
A tool to calculate N-budgets in organic forage systems
ERA Software Tools
ThE ToolS ARE AvAilAblE AT: www. bERAS. Eu

108
NitrogeN budget calculatora tool to calculate N-budgets in organic forage systemsMoritz reckling, Karin Stein-bachinger and Johann bachinger
120
100
80
60
40
20
0
-20
-40
Dry
mat
ter y
ield
[ t/
ha]
Nitr
ogen
[ kg
/ha]
12
10
8
6
4
2
0
Yield N fixation N removal N budget
Why it matters 110How it works 111How to use the tool 112Interpretation of results 113Sample calculations 114
the tool iS available at: www. beraS. eu
era Software tools

110
Software Tools: Nitrogen budget calculator
Why it matters
Ecological recycling agriculture (ERA) aims at effective nutrient recycling through self-sufficiency in fodder and manure production and low levels of external inputs. Legumes play a key role in the crop rotation of ERA farms to balance the N-cycle through N-fixation. To ensure a stable pro-duction with low emissions to the environment, ERA aims for balanced N-budgets over the whole crop rotation.
Importance of N-budgets
Who can use it? The computer tool does not require any prior software skills, nor any in-stallation. It can be used by farmers, advisors, lecturers and students. This manual provides background information, user instructions, assistance for interpretation of results and sample calculations.
Harvesting method
Harvest timingDry matter content (%)
Harvesting losses (% DM)
Gaseous losses (% N)
Green forage Early 20 5 -
Wilted silage Medium 35 20 -
Dry hay Late 85 35 -
Mulching Early 20 - 10
*Standard values can be changed in the 'extended data’ sheet
User interface
The user interface shows the data input and results. The results include the gross yield, total N-fixation, N-removal through crop harvest and the N budget.
The yield is either calculated from the crop height or it is entered as a value. The harvested yield at 5 cm cutting height is calculated using standard values for dry matter and harvest losses. In the case of mulch-ing, the crop yield remains on the field and gaseous losses are assumed to occur. The N-content of the harvested crop is calculated according to the legume to grass ratio with standard values. All standard values can be changed in the ‘extended data’ sheet.Further N-losses (e.g. leaching and denitrification) are assumed to be balanced by the atmospheric deposition and non-symbiotic N-fixation and therefore neglected.
Optional harvesting methods and their characteristics* [4, 13, 14]
How it works
The N budget calculator is designed for arable forage systems with legume-grass mixtures (different species and varieties of grasses, clover and alfalfa). The tool estimates the N input (as biological N fixation) and N output (through crop harvest) to calculate the N budget per ha for one or several cuts.
In organic farming systems, the N-surplus is much lower than in conven-tional systems [2, 7, 11] and below the maximum amount of 60 kg N-surplus allowed by the European Nitrate Directive (91/676/EEC) [20]. However, studies also show negative N-budgets at field level in some organic farms which can result in lower yields [11]. Therefore, field level N-budgeting is recommended on a regular basis to ensure that legume-grass mixtures lead to a net gain of N that can be used by subsequent crops. The N-budget calculator facilitates a quick assessment of N-fluxes in legume-grass mixtures and simulates effects of an adapted manage-ment. In combination with the Legume estimation trainer the effect of the legume proportion is visualized.
Data required
DATA INPUTAverage height [cm] 45Harvesting method [select] silageHarvesting losses [%] 20Legume Proportion [%] 50
RESULTSYield (harvested) [t/ha DM] 3.2
N fixation [kg N/ha] 105
N removal [kg N/ha] 82N budget [kg N/ha] 23
120
100
80
60
40
20
0
-20
-40
Dry
mat
ter y
ield
[ t/
ha]
Nitr
ogen
[ kg
/ha]
12
10
8
6
4
2
0 Yield N fixation N removal N budget
3
10582
23

112
Software Tools: Nitrogen budget calculator
113
How to use the tool
The N-budget calculator is a software tool in Microsoft Excel and works with two data sheets.
• 'N budget calculator' presents calculations based on a small number of input data characterising the legume-grass mixture (e.g. yield, harvesting method and legume proportion).
• 'Extended data': input data and calculation functions can be altered (for use by experts).
Interpretation of results
The N-budget result is positive, balanced or negative. Different management options to increase the N inputs and decrease the outputs are given. Calculation examples provide an indication of which factors have the strongest effects on the N-budget.
Learn about your N budget in 10 steps
1. Open the Excel document2. View the sheet 'N budget calculator'3. Go to the data entry field4. Enter either the average height of the legume-grass mixture at the
harvest time (cm) or the estimated yield (in tons fresh matter) See the method for yield estimates in the chapter Legumes5. Select the harvesting method (green forage, wilted silage, dry hay
or mulching) 6. Enter harvesting losses manually (in %) or use the standard value by
leaving the cell blank7. Enter the estimated legume proportion in the mixture at harvesting
time (in %) Use the Legume estimation trainer to train your observation skills 8. Read the calculated results 9. Change the input data to visualize the effects of management
changes10. To estimate the N-budget for the whole year with several cuts,
calculate the N-budget for each cut separately and add the values together:
Interpretation of N-budget results and possible management options
N-budget (kg N/ha) Interpretation
-10 and lower N-output exceeds the input. N is used from soil re-serves and no N is contributed to the system. This management is not sustainable, leads to a deple-tion of soil N and can result in lower yields in the future.
-10 to +10 Additional N-output equals the input. N fixed by the legumes is removed through the harvest and hardly any N remains in the system.
+10 and higher Additional N-input exceeds the output and leads to a net gain of N to the system which can be used by subsequent crops.
To achieve positive N budgets a change of management is required by
• increasing the legume proportion (legumes)
• increasing the yield
• changing the harvesting method
If your N budget is positive, maintain the condition and ensure that the N is kept in the system until taken up by the subsequent crop (legumes).
What does the N budget tell you?
Microsoft Excel, minimum version 2003 (XLS)Minimum software requirements
Hints for farmersThis calculator provides a quick and rough estimation of the N-budget of your legume-grass fields. Results should not be over interpreted. If nega-tive results occur, check if the N budget calculator can help to improve the situation!
Enjoy experimenting with this ERA software tool! Example 1st cut: - 15 kg N/ha 2nd cut: +10 kg N/ha 3rd cut: +13 kg N/ha
N budget: 8 kg N/ha

114
Sample calculations
You can learn about the effects on the N-budget by changing the input variables e.g. by increasing or decreasing the yield, harvest losses and legume proportion. Note: If the harvesting method cannot be changed, the legume propor-tion remains the key factor influencing the N-budget!
Main factors influencing the N budget on legume-grass fields
• Legume proportion has a major effect and can be influenced by management (Legumes)
• Harvesting method has a major effect, but depends on the feed demand
• Yield has a medium effect and can be influenced by management • Harvesting losses have a minor effect (higher losses mean less N-
removal resulting in a more positive N-budget at field level)
Case A
• Fixed parameter: 40 % average legume proportion in each field
• Variable parameter: different harvesting methods
Compare the effect on the N-budget
Forage Silage Hay Mulching
N b
udge
t [ k
g/ha
]
Harvesting method
60
50
40
30
20
10
0
-10
-20
20 % 40 % 60 % 80 %
N b
udge
t [ k
g/ha
]
Legume proportion (%)
60
40
20
0
-20
-40
-60
Case B
• Fixed parameter: harvesting method (forage)
• Variable parameter: 20 – 80 % legume proportion
Compare the effect on the N-budget
Software Tools: Nitrogen budget calculator
A farmer has four fields of legume-grass each with a gross yield of 3 t/ha (e.g. first cut at 5 cm cutting height). The calculated N-fixation is about 65 kg N/ha in each field.
Question: Under which conditions is the N-budget negative or positive?
Two examples
Legume estimation trainer a learning tool for a better estimation of the legume proportion in forages moritz reckling, Karin stein-Bachinger and Johann Bachinger
era software tools
the tooL is avaiLaBLe at: www. Beras. eu
Why it matters 116How it works 117How to use the tool 118How to estimate in the field (after the training) 119Samples of arable forage 120Samples of permanent grassland 121
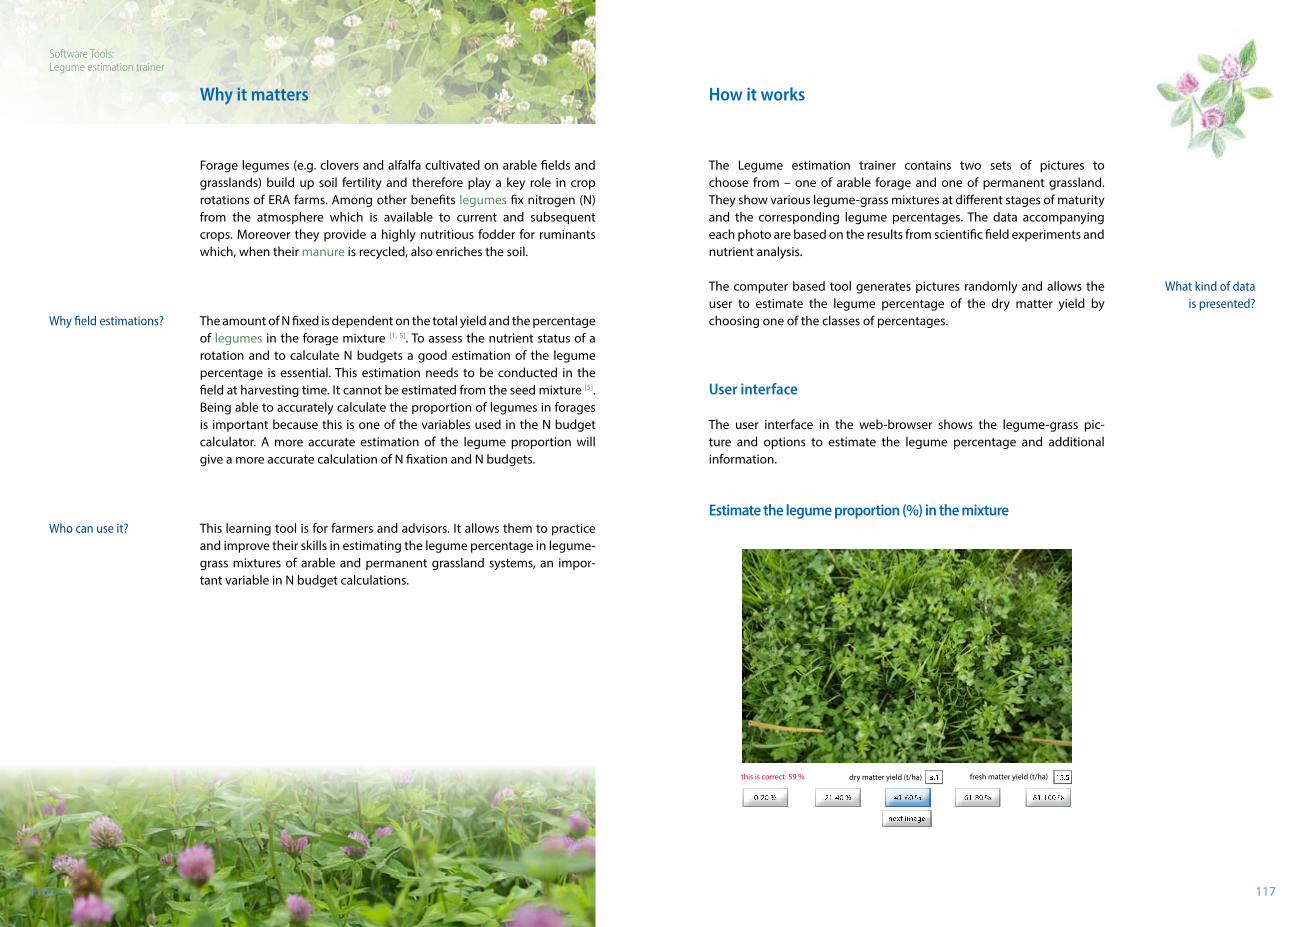
116
Software Tools: Legume estimation trainer
117
Why it matters
Forage legumes (e.g. clovers and alfalfa cultivated on arable fields and grasslands) build up soil fertility and therefore play a key role in crop rotations of ERA farms. Among other benefits legumes fix nitrogen (N) from the atmosphere which is available to current and subsequent crops. Moreover they provide a highly nutritious fodder for ruminants which, when their manure is recycled, also enriches the soil.
Why field estimations?
Who can use it? This learning tool is for farmers and advisors. It allows them to practice and improve their skills in estimating the legume percentage in legume-grass mixtures of arable and permanent grassland systems, an impor-tant variable in N budget calculations.
User interface
The user interface in the web-browser shows the legume-grass pic-ture and options to estimate the legume percentage and additional information.
Estimate the legume proportion (%) in the mixture
The computer based tool generates pictures randomly and allows the user to estimate the legume percentage of the dry matter yield by choosing one of the classes of percentages.
How it works
The Legume estimation trainer contains two sets of pictures to choose from – one of arable forage and one of permanent grassland. They show various legume-grass mixtures at different stages of maturity and the corresponding legume percentages. The data accompanying each photo are based on the results from scientific field experiments and nutrient analysis.
The amount of N fixed is dependent on the total yield and the per centage of legumes in the forage mixture [1, 5]. To assess the nutrient status of a rotation and to calculate N budgets a good estimation of the legume percentage is essential. This estimation needs to be conducted in the field at harvesting time. It cannot be estimated from the seed mixture [5].Being able to accurately calculate the proportion of legumes in forages is important because this is one of the variables used in the N budget calculator. A more accurate estimation of the legume proportion will give a more accurate calculation of N fixation and N budgets.
What kind of data is presented?
this is correct: 59 % dry matter yield (t/ha) fresh matter yield (t/ha)

1 2 3 4
550 -100 m
118
Software Tools: Legume estimation trainer
119
How to use the tool
The Legume estimation trainer can be used with all standard web-browsers and can be started without any prior software skills or instal-lations.
Application of your estimation skills
After the training, your estimation skills will be good enough to estimate the legume percentage in the field. To get a very rough estimation, you can estimate from the tractor or harvester at the time of harvesting. If time allows, a more precise estimation, at least on a few fields, is recom-mended. This can be done by a quick transect walk through the field.
Practice your legume estimation skills in 5 steps
• Open the file ‘start’ (it will appear in your web-browser)
• Choose between ‘arable forage’ and ‘permanent grassland’ and the training will start
• Study the first picture on your screen and read the information on yield below
• Estimate the legume percentage by pressing one of the buttons showing percentages
• If your estimation was correct, the exact percentage will be shown and you can press “next picture”; if not please estimate again.
Your estimation skills will improve with practice, so train regularly and monitor your rate of success. Enjoy the training!
• Estimate 100 pictures and note the no. of errors.
• Repeat this three times and compare the results to check your progress.
• Train until you have less than 20 errors – if you like!
• Use a record book for documenting all data during the field walk
• Walk diagonally through the field (transect)
• Take one sample every 50-100 m (avoid field margins)
• 5 samples for fields with little variation in legume percentage
• 10 samples for fields with high variation in legume percentage
• Estimate one square meter per sample (use a frame or sticks to mark the borders)
• Write the percentage for each sample in the record book and calcu-late the average
• Estimation should be repeated throughout each season since the percentage may vary between fields and cuts and from year to year
How to carry out a transect walk?
Web-browser e.g. Mozilla Firefox, Windows Internet ExplorerMinimum software requirements
Average legume percentage in the
field
Sample %
1 40 2 25 3 20 4 45
5 60 Average 38
Equipment: 0.5 m2 frame made of sticks and a kitchen scale
• Note your estimation on paper and cut the samples (0.5 m2)• Sort the shoots into legumes and non-legumes • Weigh the legume shoots and all shoots; and calculate:
Legume percentage (%) = legume shoots (g) * 100 / all shoots (g)
This can be a group exercise with farmers facilitated by the advisor
Estimation of the legume percentage from the tractor (rough estimation)
Estimation of the legume percentage in the field (more precise estimation)
Monitor your training!
Test your estimation skills by yourself
How to estimate in the field (after the training)

Classification Classification
1-20 % < 6 %
6-20 %
21-40 %
> 40%
21-40 %
41-60 %
61-80 %
> 81 %
120 12194% Legumes / 2.1 t/ha DM / 24 cm
78% Legumes / 2.7 t/ha DM / 42.6 cm
59% Legumes / 3.1 t/ha DM / 51 cm
37% Legumes / 2.6 t/ha DM / 37 cm
11% Legumes / 4.2 t/ha DM / 51 cm
80% Legumes / 2 t/ha DM / 39 cm
73% Legumes / 3 t/ha DM / 46.4 cm
48% Legumes / 3.7 t/ha DM / 42 cm
22% Legumes / 3.8 t/ha DM / 53 cm
4% Legumes / 4.4 t/ha DM / 47 cm
4 % Legumes / 4.2 t/ha DM / 30 cm
18 % Legumes / 3 t/ha DM / 27 cm
5 % Legumes / 2.8 t/ha DM / 45 cm
35 % Legumes / 2.9 t/ha DM / 29 cm
51 % Legumes / 2.1 t/ha DM / 25 cm
11 % Legumes / 2.2 t/ha DM / 37 cm
25 % Legumes / 1.7 t/ha DM / 33 cm
45% Legumes / 3.6 t/ha DM / 60 cm
Samples of arable forage
(Photos: ZALF)
Samples of permanent grassland
(Photos: ZALF and Engel, Aulendorf)

122
We thank Prof. Dr. Martin Elsäßer and Sylvia Engel from the Agricultural Cen-tre Baden-Wuerttemberg, Department of Grassland Management and Forage Production (LAZBW Aulendorf ) for most of the images and samples of per-manent grassland. At the Leibniz Centre for Agricultural Landscape Research (ZALF) in Müncheberg, we thank Gerlinde Stange and the staff at the Institute of Land Use Systems and the ZALF Research Station in Müncheberg for their help and assistance with sample and data processing. The first version of this trainer has been published in the book ‘Nährstoffman-agement im Ökologischen Landbau: Ein Handbuch für Beratung und Praxis mit Anwendungs-CD“ by Stein-Bachinger, K., Bachinger, J. and Schmitt, L. (2004). ISBN 978-3-941583-14-6
ERA Software Tools
ROTOR – ORgAnic cROp ROTATiOn
plAnnERA tool to plan crop rotations in organic farming systems
Moritz Reckling, Johann Bachinger and Karin Stein-Bachinger
Why it matters 124How it works 125How to use the tool 125User interface 126Interpretation of results 128Example evaluation 129
ThE TOOl iS AvAilABlE AT: www. BERAS. Eu
ERA Software Tools
124
Software Tools: ROTOR
125
Why it matters
Ecological Recycling Agriculture (ERA) aims at effective nutrient recy-cling through self- sufficiency in fodder and manure production and low levels of external inputs. Well-planned crop rotations are therefore a key element to successful ERA farming.
Crop rotations should provide sufficient fodder, high yielding cash crops and ensure the long-term productivity as well as sustainability of the system. This includes phytosanitary restrictions, effective weed manage-ment, sufficient nitrogen supply through legumes, stable N- and humus-balance and reduced nitrogen losses.
Why to plan with ROTOR
Planning organic crop rotations requires to consider the management of nutrients, humus, weeds, diseases, cash and fodder crops, catch crops and manure applications.
ROTOR is a static rule-based tool for long-term planning at field level to regulate:• Supplying sufficient fodder
• Regulation of weed infestation
• Taking phytosanitary restrictions into account
• Maximising N-fixation from legumes
• Minimising N-losses via leaching
ROTOR supports advisors to consider all these factors simultaneously. It provides com plementary information to the local knowledge and experiences!
Who can use it? ROTOR requires some previous software skills, and in some cases the in-stallation of software (see software requirements). It has been designed for advisors, but can also be used by farmers, lecturers and students.
How it works
ROTOR calculates on the basis of predefined crop production activi-ties (CPA). These describe all field operations per crop, beginning with stubble tillage and ending with the harvest. Each crop can be cultivated differ ently, therefore different CPA’s exist with varying preceding crops and different field operations i.e. ploughing or non-inverting tillage, undersowing, use of catch crops, manuring, straw harvesting, and me-chanical weed control.
Crop rotations describe a succession of CPA`s which are evaluated with agronomic criteria i.e. N2-fixation, N-removal, N- and humus-balance, N-leaching, phytosanitary restrictions and the weed infestation risks.
How to use the tool
ROTOR has been adapted to specific countries in the Baltic Sea Region. Within a country, different soil types are distinguished.
Results can be used to compare between different crop rotation options.
Absolute values should be taken with care. If you use ROTOR for other countries and sites it needs to be
adapted if this is not done, please handle the results with great care!
Software Microsoft Access, minimum version 2000 requirements

126
Software Tools: ROTOR
127
User interface
The user operates with two interfaces, the data entry form and the re-port of results. The data entry form is shown below.
Evaluate your crop rotation in a few steps
1. Open the Microsoft Access file.
2. The data entry form opens.
3. Select your site data (country and soil quality, mean annual and win-ter precipitation), if your site is not included you may use a compara-ble site or contact the developers.
4. Select the number of years and the crops of the rotation you want to evaluate, starting with a legume-grass mixture.
5. Specify the production measures or leave the standard values (manure, straw harvest, forage use of legume-grass, legume per cen tage in legume-grass, catch crops).
6. Press ‘calculate’ to evaluate the rotation.
7. The report of results will open (this can take a few seconds).
8. If you want to change the crop rotation or other settings please close the report of results and make the changes.
Generate crop rotations
1. Select the number of years of the rotation.
2. In the ‘selection of crops and crop sequences’ you can leave all or sev-eral years blank.
3. Change the settings for crop rotation generation and threshold.
4. Continue with step 6. from the list above.
To sort the report of results
The standard sorting of results is by ‘N surplus’ from lowest to highest; to change this:
1. Open the report of results and go to the ‘draft view’ (right click and select ‘draft view’).
2. Go to ‘grouping and sorting’ (right click and select ‘grouping and sorting’).
3. Find ‘grouped by’ (e.g. bottom of the report) and select a criteria from the list.
4. Define the ranking (from ‘highest to lowest’ or ‘lowest to highest’).

128
Software Tools: ROTOR
129
Interpretation of results
The report of results shows calculated values per crop and per rotation. Several options of crop rotations will be displayed, sorted by the N sur-plus (this can be changed).
Description of crop production activitiesDetails of crop production i.e. catch crops, undersowings, tillage and manure applications.
Yield [t/ha]Dry matter yields calculated specific to soil, rainfall, pre-crop and manure (1 dt = 0.1 t)
N2-fixation [kg N/ha]Nitrogen fixed by legumes as a main crop, undersowings, inter-crops and catch crops
N-leaching [kg N/ha]Annual leaching of nitrogen should be as low as possible
N-removal [kg N/ha]Annual nitrogen removal through the harvest of crops
N-balance [kg N/ha]Mean annual N balance calculating N input – N output should be close to neutral (-10 kg to +10 kg) for long-term sustainability
N-balance % N-input [%]N balance in % from the N input should be close to 0 to ensure long-term sustainability (set thresholds in the data entry form)
Humus reproduction [%]Annual humus reproduction [25] should be more than 100% to ensure a stable humus-balance
Weed infestation risks [score]Negative scores reduce and positive scores increase the infesta-tion risk with perennial, spring and winter annual weeds (score from − 4 to +4) depending on your soil and farming, ensure to keep the infestation risk low and aim for negative values.
Example evaluation
An example crop rotation with two cropping options for a marginal sandy soil in Germany (Brandenburg), soil rating index 25 (sandy soil) Precipitation: 500 mm annual and 225 mm in the winter half
Crop rotation: Legume-grass (mulching) – winter rye – winter rye –lupin – oat
Option A: Undersowing of legume-grass in oats Mean legume percentage set to 50 % in the legume-grass sward
CropYield N2-
fixationN- leaching
N- balance
Weed infestation risk(- reduces, + increases)
Humus repro-duction
[t/ha] [kg N/ha] peren. spring autumn %Legume-grass (50 % leg.) 24 124 3 105 0 -1 -1
Winter rye 2.6 0 20 -57 -1 -1 3Winter rye 2.1 0 14 -44 -1 -1 3Lupin 1.5 76 26 -3 0 3 -1Oat + leg.-grass undersown 1.6 0 33 -54 0 1 -1Mean of crop rotation 40 20 -11 -0.2 0.2 0.6 108
Option B: Inclusion of a catch crop (turnip rape) before oat Increased legume percentage set to 70 % in the legume-grass sward the changes in option B are marked in green
CropYield N2-
fixationN- leaching
N- balance
Weed infestation risk(- reduces, + increases)
Humus repro-duction
[t/ha] [kg N/ha] peren. spring autumn %Legume-grass (70 % leg.) 24 167 12 139 0 -1 -1
Winter rye 2.6 0 20 -57 -1 -1 3Winter rye 2.1 0 14 -44 -1 -1 3Lupin 1.5 76 26 -3 1 3 -1Oat + catch crop + leg.-grass undersown 2.0 0 13 -42 -1 1 -2
Mean of crop rotation 49 17 -1 - 0.4 0.2 0.4 117

130 131
To find out more
1 Granstedt, A. (2012):Farmingforthefuture.WithafocusontheBalticSearegion.COMRECStudiesinEnvironmentandDevelopmentNo.6,BERASImplementationreportsNo.2.SödertonsUniversity,Sweden,pp133.
2 Granstedt, A., Schneider, T., Seuri, P., Thomsson, O. (2008):EcologicalRecyclingAgriculturetoReduceNutrientPollutiontotheBalticSea.BiologicalAgricultureandHorticulture,Vol.26,pp279-307.
3 Larsson, M. & Granstedt, A. (2010):SustainablegovernanceoftheagricultureandtheBalticSea–Agriculturalreforms,foodproductionandcurbedeutrophication.EcologicalEconomics,Vol.69,pp1943-1951.
4 KTBL (2009):FaustzahlenfürdieLandwirtschaft.14.Auflage,Darmstadt,pp.1180.
5 Stein-Bachinger, K. , Bachinger, J., Schmitt, L. (2004):NährstoffmanagementimÖkologischenLandbau.KTBL(KuratoriumfürTechnikundBauweseninderLand-wirtschafte.V.),423,Darmstadt,pp136.
6 Stein-Bachinger, K. & Werner, W. (2007):EffectofManureonCropYieldandQua-lityinanOrganicAgriculturalSystem.BiologicalAgricultureandHorticulture,Vol.14,pp.221-235.
7 Haas, G. (2009): Wasserschutz im Ökologischen Landbau.- BundesprogrammÖkologischerLandbau,pp61.
8 Lampkin, N. (1990):OrganicFarming.FarmingPressBooks,UK,pp70.
9 COG (2001):OrganicFieldCropHandbook.CanadianOrganicGrowersInc.,2ndEdition,pp292.
10 Hauser, S. (1987):SchätzungdersymbiotischfixiertenStickstoffmengevonAcker-bohnen(ViciafabaL.)miterweitertenDifferenzmethoden.Diss.Univ.Göttingen.
11 Kelm, M., Loges, R., Taube, F. (2007): N surpluses of organic and conventionalfarmsinNorthernGermany.ResultsfromtheCOMPASSproject.9.Wiss.TagungÖkologischerLandbau,pp29-32.
12 Stein-Bachinger, K. & Fuchs, S. (2012): Protectionstrategiesforfarmlandbirdsinlegu-me-grassleysastrade-offsbetweennatureconservationandfarmers‘needs.OrganicAgriculture(2),pp145-162.
13 Loges, R. & Taube, F. (2011): Nitratauswaschung, Ertrag und N-Bilanz zweierFruchtfolgen mit unterschiedlichem Leguminosenanteil im mehrjährigen Ver-gleich.11.Wiss.TagungÖkologischerLandbau,pp89-92.
14 Elsäßer, M. (1998):DüngungvonWiesenundWeiden.Merkblätterfürdieumwelt-gerechteLandbewirtschaftung.Nr.13,Ed.LandesanstaltfürPflanzenbau,Forch-heim,Rheinstetten,pp8.
15 Rauhe, K. (1964):MöglichkeitendesHumusersatzesdurchDüngungundPflanze.SitzungsberichtederDeutschenAkademiederLandwirtschaftswissenschaftenzuBerlin;Bd.13,H.6,pp26.
16 LVLF (2008):RichtwertefürdieUntersuchungundBeratungsowiezurfachlichenUmsetzung der Düngeverordnung (DüV). Gemeinsame Hinweise der LänderBrandenburg, Mecklenburg-Vorpommern und Sachsen-Anhalt. www.lelf.bran-denburg.de,pp87.
17 Pietsch, G. & Friedel, J. (2007):WasLeguminosenbringen.BIOAUSTRIA,pp20-21.
18 Faßbender, K., Heß, J., Franken, H. (1993): Sommerweizen, grundwasserscho-nendeAlternativezuWinterweizenaufleichtenBöden.In:Zerger,U.(Hrsg.):For-schungimÖkologischenLandbau.Tagungsbandzur2.WissenschaftstagungzumÖkologischenLandbau,pp139-144.
19 Landesanstalt für Landwirtschaft (2006):StandorttypischeHumusgehaltevonAcker-bödeninBayern.SchriftenreihederBayerischenLandesanstalt16.www.LfL.bayern.de.
Appendices

132 133
20 European Nitrate Directive (91/676/EEC): http://ec.europa.eu/environment/wa-ter/water-nitrates/report.html.
21 Mohler, C.L. & Johnson, S.E. [eds.] (2009): Crop Rotation on Organic Farms – A planning manual. Natural Resource, Agriculture, and Engineering Service (NRAES), 177, www.nraes.org.
22 Freyer, B. (2003): Fruchtfolgen – Konventionell – Integriert – Biologisch. Eugen Ulmer, Stuttgart, pp 230.
23 Kolbe, H. (2006): Fruchtfolgegestaltung im ökologischen und extensiven Land-bau: Bewertung von Vorfruchtwirkungen. Pflanzenbauwissenschaften 10, pp 82-89.
24 Hubendick, B. (1985): Människoekologi. Gidlunds förlag. Stockholm.
25 Hülsbergen, K.-J., Braun, M. & Schmid, H. (2012): Die Bedeutung der Kohlen-stoffversorgung in Böden. Lebendige Erde, 3, pp 12-14 and Leithold, G. und K.-J. Hülsbergen (1998): Humusbilanzierung im ökologischen Landbau. Ökologie und Land bau, 105, pp 32-35.
26 Baltic Sea Now (2012): Our chemicalized Sea. http://www.balticseanow.info
27 Kahnt, G. (1986): Biologischer Pflanzenbau.- Stuttgart, Ulmer, pp 228.
28 Kattwinkel, M., Kühne, J.V., Foit, K., Liess, M. (2011): Climate change, agricultural insecticide exposure, and risk for freshwater communities. Ecological Applications 21: 2068–2081. http://dx.doi.org/10.1890/10-1993.1.
29 BLE (2006): Pflanzenschutz im Ökolandbau. Krankheiten und Schädlinge. Sächsi-sche Landesanstalt für Landwirtschaft, Germany, pp 20.
30 Kühne, S., Burth, U., Marx, P. (2006): Biologischer Pflanzenschutz im Freiland. Pflanzengesundheit im Ökologischen Landbau. Verlag Eugen Ulmer, Germany, pp 304.
31 Schwarz, A. (2009): Nützlingsförderung im Ackerbau. UFA-Revue Mai 2009. Land-wirtschaftliches Zentrum St. Gallen, Switzerland, pp 3.
32 Wageningen UR (2006): Practical weed control in arable farming and outdoor ve-getable cultivation without chemicals. WUR Applied Plant Research, Wageningen, The Netherlands, pp 77.
33 JKI (2012): Vorratsschutz. URL: oekologischerlandbau.jki.bund.de / Vorratsschutz.
34 FAO (2003): World Agriculture: Towards 2015/2030. An FAO perspective. http://www.fao.org/docrep/005/y4252e/y4252e06.htm.
35 Schrimpff, E. (2010): Rahmenbedingungen für einen nachhaltigen (Öl)-Pflanzenbau weltweit. http://www.bv-pflanzenoele.de/pdf/Schrimpff_Rahmenbedingungen.pdf.
36 FIBL et al. (2012): Grundlagen zur Bodenfruchtbarkeit. www.bodenfruchtbarkeit.org/grundlagen. html.
37 Claassen, N. & Jungk, A. (1984): Bedeutung von Kaliumaufnahmerate, Wurzel-wachstum und Wurzelhaaren für das Kaliumaneignungsvermögen verschiedener Pflanzenarten. Z. Pflanzenernähr. Bodenk., 147, pp 276-289.
38 Brock, C. Hoyer, U., Leithold, G., Hülsebergen, K.-J. (2008): A new approach to humus balancing in organic farming. 16th IFOAM Organic World Congress, Mo-dena, pp 40-43.
39 Granstedt, A. & Kjellenberg, L. (2008): Organic and biodynamic cultivation – a possible way to increasing humus capital, improving soil fertility and providing a significant carbon sink in Nordic conditions. 16th IFOAM Organic World Congress, Modena, pp 32-35.
40 Kelm, M., Loges, R. & Taube, F. (2008): Comparative analysis of conventional and organic farming systems: Nitrogen surpluses and losses. 16th IFOAM Organic World Congress, Modena, pp 312-315.
41 Cordell, D., Drangert, J.-O., White, S. (2009): The story of phosphorus: Global food security and food for thought. Global Environmental Change 19, pp 292-305.
42 HELCOM (2013): Approaches and methods for eutrophication targets setting in the Baltic Sea region. Balt. Sea Environ. Proc. No. 133, pp 134.
43 Bayerische Landesanstalt für Bodenkultur und Pflanzenbau (2002): Phosphor-düngung und Gewässerschutz. www.umweltministerium.bayern.de.
44 Scheffer, B. (2010): Schutz der Böden vor Überdüngung. WasserWirtschaft pp 1-2.
45 Efma (2000): Phosphorus essential element for food production. European Fertili-zer Manufactures’ Association, Belgium. www.efma.org.
46 Gantham, A. (2010): Mycorrhiza Matter. www.rodaleinstitute.org www.mycorrhiza.com.
47 Gustafsson, B.G., Schenk, F., Blenckner, T., Eilola, K., Meier, H.E.M., Müller-Karu-lis, B., Neumann, T., Ruoho-Airola, T., Savchuk, O.P., Zorita, E. (2012): Reconstruc-ting the development of Baltic Sea eutrophication 1850 – 2006. Springer, AMBIO, 41: 534–548.
48 Bachinger, J., Zander, P. (2007): ROTOR, a tool for generating and evaluation crop rotations for organic farming systems. Europ. J. Agronomy 26, pp 130-143.
49 Baltic COMPASS (2012): www.balticcompass.org.
50 Gattinger, A. et al. (2012): Enhanced top soil carbon stocks under organic far-ming. www.pnas.org/cgi/doi/10.1073/pnas.1209429109.
51 FIBL, Bio Austria et al. (2012): Soil fertility. ISBN 978-3-03736-208-2.
52 Schnug, E., Rogasik, J. Haneklaus, S. (2003): Die Ausnutzung von Phosphor aus Düngemitteln unter besonderer Berücksichtigung des ökologischen Landbaus. www.fal.de.
53 Amberger, A. (1996): Pflanzenernährung. 4. Auflage, Ulmer Verlag, Stuttgart, pp 319.
54 Schilling, G. (2000): Pflanzenernährung und Düngung. Ulmer Verlag, pp 464.
55 Gisi, U. (1990): Bodenökologie. Thieme Verlag, Stuttgart, pp 304.
56 www.fibl.org, www.bodenfruchtbarkeit.org/504.html.
57 Scheller, E. (2002): Eiweißstoffwechsel im Boden und Humusaufbau. Lebendige Erde 3, pp 40-43.
58 Köpke, U. (2004): Rotation for Organic Farming: Its Aims and Implementation. International Symposium on Organic Agriculture, Korea, pp 1-25. Own adaption.
59 Bertilsson J. (2001): Konferensrapport Ekologiskt lantbruk Ultuna 13-15 November. CUL.
60 Waghorn G. C., Hegarty R. S. (2011): Lowering ruminant methane emissions through improved feed conversion efficiency. Animal Feed Science and Techno-logy 166-167 (2011) 291-301.
61 Nauta, W.J., Veerkamp, R.F., Brascamp, E.W., Bovenhuis, H. (2006): Genotype by environment interaction for milk production traits between organic and con-ventional dairy cattle production in the Netherlands. Journal of Dairy Science 89: 2729-2737.
62 Ministry of Agriculture, Nature Management and Fisheries, NL (1985).
63 Boller, B. & Noesberger, J. (1987): Symbiotically fixed nitrogen from field-grown white and red clover mixed with ryegrass at low levels of N-15-fertilization. Plant and Soil, 104 (2): 219-227.
64 Vägen till ekologisk mjölkproduktion (2010): Jordbruksinformation 1 –. Jord-bruksverket.
65 BÖLW (2006): Nachgefragt: 25 Antworten zum Stand des Wissens rum um Öko-Landbau und Bio-Lebensmittel. www.boelw.de/bioargumente.html
66 Granstedt, A. (1998): Ekologiskt lantbruk - fördjupning. Natur och Kultur/LTs förlag
67 www.luomu.fi/tietoverkko/
68 Edwards, S. (2002): Feeding organic pigs – A handbook of raw materials and re-commendations for feeding practice. University of Newcastle upon Tyne.
134 135
List of abbreviations
a yearAU animal unitC carbonCa calciumcm centimetreC/N Carbon/Nitrogen ratioCO2 carbondioxidCorg organic carbonDM dry matterECM energy corrected milkERA Ecological Recycling Agriculturee.g. for exampleFM fresh matterg gramH+ hydrogenha hectareK potassiumkg kilogramkm kilometrel litreLU livestock unitm meterm3 square metreMCP monocalcium phosphateMJ mega joulemm millimeterN nitrogenNt total nitrogenNDF non digestible fiberNfix nitrogen fixationNH4 ammoniaNO3 nitrateP phosphorusROTOR ROTation ORganicS sulfurSOM soil organic mattert tonUS undersown°C degree centigrade
Addresses of editors and authors
Editors
Dr. Karin Stein-Bachinger, Moritz Reckling and Johannes HufnagelLeibniz Centre for Agricultural Landscape Research (ZALF) e.V. Institute of Land Use SystemsEberswalder Str. 84, 15374 Müncheberg, [email protected]@[email protected]
Associate Professor Dr. Artur GranstedtSödertörn University, 14189 Stockholmand Biodynamic Research Institute 153 91 Järna, Sweden [email protected]
The Leibniz Centre for Agricultural Landscape Research (ZALF) in Germany explores ecosystems in agricultural landscapes and develops ecologically and economically tenable land use systems while taking into account societal demands. The Institute of Land Use Systems focuses on the assessment and further development of sustainable farming systems, including organic farming. www.zalf.de
Södertörn University in Sweden is lead partner of the EU project BERAS Implementation. The University conducts education and research to develop and disseminate knowledge on how human activities affect the natural world, as well as how to create the right conditions for environmental, social and economic sustainable deve-lopment.
The Biodynamic Research Institute in Sweden works with long term on-farm studies to develop ecological and bio-dynamic agriculture for Nordic conditions with a focus on soil fertility, the environment and food quality.
Corresponding authors
Gustav AlvermannAckerbauberatung, Scharberg 1a23847 Westerau, [email protected]
Prof. Dr. Artur GranstedtKulturcentrum 13, 15931 Järna, [email protected]
Prof. Dr. Stefan KühneFederal Research Centre for Cultivated PlantsJulius Kühn-Institut (JKI) Stahnsdorfer Damm 81 14532 Kleinmachnow, [email protected]
Moritz RecklingZALF e.V., Institute of Land Use SystemsEberswalder Str. 84, 15374 MünchebergE-mail: [email protected]
Katarina RehnströmGamla Kustvägen 254 B10 600 Ekenäs, [email protected]
Dr. Karin Stein-BachingerZALF e.V., Institute of Land Use SystemsEberswalder Str. 84, 15374 MünchebergE-mail: [email protected]
Photographers
© Johann Bachinger, Moritz Reckling, Karin Stein- Bachinger, Åsa Odelros, Katarina Rehnström, Stefan Kühne, Carlo Horn, Gustav Alvermann, Johannes Hufnagel, Gerlinde Stange, Frank Gottwald, Klaus-Peter Wilbois (p 40 ), Martin Elsäßer (p 51 right below, p 60), Nikola Acuti

136
SWEDEN
Södertörn University www.sh.se
The Biodynamic Research Insti-tute, www.jdb.se/sbfi
Södertälje Municipality www.sodertalje.se
Swedish Rural Network www.landsbygdsnatverket.se
Swedish Rural Economy and Agri-cultural societies, Gotland http://hs-i.hush.se. Kalmar, hs-h.hush.se
FINLAND
MTT Agrifood Research www.mtt.fi
Centre for Economic Develop-ment, Transport and the Environ-ment for Uusimaa, www.ely-keskus.fi/uusimaa
Finnish Environment Institute www.environment.fi/syke
University of Helsinki, Depart-ment of Agricultural Sciences www.helsinki.fi
ESTONIA
Estonian University of Life Sciences www.emu.ee
Estonian Organic Farming Foun-dation (EOFF) www.maheklubi.ee
LATVIA
Latvian Rural Advisory and Train-ing Centrewww.llkc.lv
LITHUANIA
Aleksandras Stulginskis Universitywww.lzuu.lt/pradzia/lt
Baltic Foundation HPI www.heifer.lt; www.heifer.org
Kaunas District Municipality www.krs.lt
POLAND
Institute of Soil Science and Plant Cultivation – National Research Institute www.iung.pulawy.pl
Kujawsko-Pomorski Agricultural Advisory Centre in Minikowo, www.kpodr.pl
Polish Ecological Club in Krakow, City of Gliwice Chapter www.pkegliwice.pl
Independent Autonomous As-sociation of Individual Farmers ‘Solidarity’www.solidarnoscri.pl
Pomeranian Agricultural Advisory Center in Gdańsk www.podr.pl
GERMANY
Leibniz-Centre for Agricultural Landscape Research, www.zalf.de
DENMARK
The Danish Ecological Council www.ecocouncil.dk
BELARUS
International Public Association of Animal Breeders “East-West”
Project partners
PuRPoSE
The environment of the Baltic Sea is endangered. Input of plant nutrients from highly intensive and specialized agriculture are a main source. BERAS Implemen-tation can solve this problem through a systemic shift to Ecological Recycling Agriculture in association with the whole food chain from farmer to consumer.
Who can uSE thE guidElinES?
The guidelines will help farmers and advisers to practice and develop Ecological Recycling Agriculture. This type of agriculture will improve the environmental conditions of the Baltic Sea. They can be equally used for educational purposes, by decision makers and by politicians.
contEntS
The guidelines consist of four books that cover the following topics:
The Farming Guidelines give basic practical recommendations for implemen-ting ERA and present proven agronomic measures and optimization strategies for effective nutrient recycling within the farm and between different farm types during and after conversion. Included are Software Tools that help to assess and improve sustainable crop rotation planning and nitrogen fluxes on a farm level.
The Economic Guidelines give advice and support to farmers how to plan the conversion process and highlight how the changes to ERA farming will affect farm economy.
In the Marketing Guidelines farmers can find support and ideas on how to more effectively promote and sell organic and ERA products.
The Farm Examples provide a personal presentation of different farms around the Baltic Sea, mainly farms in conversion to ERA, their challenges and future plans.
The books are available at www. beras. eu in digital form.
Ecological REcycling agRicultuREGuidelines for farmers and advisors Vol I - IV
Stei
n-Ba
chin
ger
Reck
ling
gra
nste
dt
Eco
log
ica
l RE
cyc
lin
g a
gRi
cult
uRE
Vol
i Fa
Rmin
g g
uid
Elin
ES
Vol i: FaRming guidElinESKarin Stein-Bachinger, Moritz Reckling, Artur Granstedt
Farming guidelines
Economicguidelines
Marketingguidelines
Farmexamples
Part-financed by the European Union (European Regional Development Fund
and European Neighbourhood and Partnership Instrument)
PartfinancedbytheEuropeanUnion(EuropeanRegionalDevelopmentFund
andEuropeanNeighbourhoodandPartnershipInstrument)
Biodynamic Research Institute