1
4 Year Experience Of Belimumab, a Fully Human Monoclonal Antibody, in the Treatment Of Systemic Lupus Erythematosus (SLE) J. T. Merrill 1 , R. Furie 2 , D. J. Wallace 3 , J. McKay 4 , E. M. Ginzler 5 , F. Wellborne 6 , C. Aranow 7 , M. Burnette 8 , N. Mishra 9 , L. Pineda 10 , J. Zhong 10 , D. Hough 10 , W. Freimuth 10 , LBSL02/99 Study Group 11 1 Oklahoma Medical Research Foundation, Oklahoma City, OK; 2 North Shore-Long Island Jewish Health System, Lake Success, NY; 3 Cedars-Sinai UCLA, Los Angeles, CA; 4 Oklahoma Center for Arthritis Therapy & Research, Tulsa, OK; 5 State University of New York, Downstate, Brooklyn, NY; 6 Houston Institute for Clinical Research, Houston, TX; 7 Feinstein Institute for Medical Research, Manhasset, NY; 8 Tampa Medical Group, Tampa, FL; 9 Wake Forest University, Winston-Salem, NC; 10 Human Genome Sciences, Rockville, MD; 11 USA/Canada ABSTRACT (Updates shown in italics) Purpose: To provide 4 year results of belimumab in SLE patients. Methods: 449 SLE patients enrolled in a phase 2, placebo-controlled, 52-week trial of belimumab (1, 4, 10 mg/kg, monthly) plus standard background SLE therapy. In the 24-week extension, placebo subjects switched to belimumab 10 mg/kg, and belimumab patients remained on the same dose or could be increased to 10 mg/kg at the discretion of the investigator. After 76 weeks, all remaining patients (n=296) re- ceived belimumab 10 mg/kg. Safety was monitored monthly. The 4-year safety dataset was divided into eight 6-month intervals for reporting adverse event (AE) rates. Interval 1 includes the initial belimumab treat- ment which for placebo patients began in the extension period. Disease activity assessments using SELENA SLEDAI (SS), Physician’s Global Assessment (PGA) and BILAG were conducted every 4 to 8 weeks. Post- hoc analyses identified a subgroup of serologically active patients for which belimumab was efficacious. Results: By 4 years, overall belimumab exposure was 1,143 patient- years. The incidence rates (per 100 patient years) of all AE categories in- cluding serious AEs, and overall and serious infections decreased over 4 years. At week 52, serologically active patients on belimumab had significantly greater improvements in mean SS scores (29% vs 14% placebo, p=0.0435) and in PGA (33% vs 11% placebo, p=0.0011) from baseline. After 4 years, SS and PGA both improved 44% from baseline. In placebo to belimumab patients, SS and PGA improved 38% and 31%, respectively, from baseline. (The data contained in the abstract table are presented below.) Conclusions: Belimumab was generally well tolerated with background SLE therapy during long-term exposure. In serologically active patients, belimumab treatment resulted in sustained improvement in SLE disease activity over 4 years. INTRODUCTION SLE is a chronic multisystem autoimmune disorder, characterized by increased B- and T-cell activation 1 , with a broad range of symptoms. Although it can be life-threatening when major organs are affected, SLE more commonly results in debilitating health For patients with SLE, there is an unmet medical need for additional treatment options that manage or suppress disease activity without further compromising patient health B-lymphocyte stimulator (BLyS) is an immunomodulatory protein that promotes B-cell survival (inhibits apoptosis), B-cell differentiation, and Ig class switching 2-4 High levels of BLyS may relax B-cell selection and contribute to elevated production of autoantibodies, exacerbating the SLE disease state Elevated BLyS cytokine levels are a key contributory factor in SLE and correlate with increased SLE disease activity 4 Inhibition of BLyS can result in apoptosis of B cells at certain stages of maturity 5,6 BLyS inhibition does not affect secondary immune responses or vaccine antibody titers in the murine model 7 Belimumab is a BLyS-specific inhibitor that selectively targets and inhibits the BLyS cytokine 2,8 Preclinical and primate trials demonstrated that belimumab reduced the levels of peripheral and tissue B cells with an acceptable safety and tolerability profile 2 4 year safety and efficacy data from the belimumab phase 2 SLE trial (52- week double-blind and continuation) are presented here RESULTS Figure 1. Phase 2 SLE Trial Design (LBSL02/LBSL99) Placebo 1 Belimumab 1 1 mg/kg Belimumab 1 4 mg/kg Belimumab 1 10 mg/kg Belimumab 1 1 mg/kg 2 Belimumab 1 4 mg/kg 2 Belimumab 1 10 mg/kg Belimumab 1 10 mg/kg Weeks 0-52 (Year 0-1) N=449 Weeks 56-76 (Year 1-1.5) N=345 (77%) Weeks 80-208 (Year 1.5-4) N=296 (66%) Extension R A N D O M I Z E Double-blind 72% (214/296) remain on treatment as of 19-May-09 Long-term Continuation 449 patients with active SLE (US & Canada) SELENA-SLEDAI ≥4 Met ACR criteria with history of measurable autoantibodies Severe active CNS lupus or lupus nephritis excluded All patients remained on standard of care. Adjustments in immunosuppressants and glucocorticoids permitted per protocol Efficacy and safety assessments performed every 4 to 8 weeks in the first 76 weeks SLE disease activity indices (DAIs) SELENA-SLEDAI (SS), SLE Flare Index (SFI) 3 , PGA, BILAG Classic 2000 Trial extension/continuation assessments SS and biomarkers every 4 to 8 weeks in the extension, and every 8 to 16 weeks in the long-term continuation Adverse events recorded every visit. Safety labs every 8 weeks 1 All treatments included standard of care. 2 Belimumab dose could be increased to 10 mg/kg at the discretion of each investigator. 3 Modified so that change only in SS >12 was not counted as severe flare. BILAG = British Isles Lupus Assessment Group; PGA = Physician’s Global Assessment Serologically active patients (defined as ANA ≥1:80 and/or ≥30 IU/mL) represented 71% of the patient population and tended to be younger and have higher SLE disease activity at baseline The baseline median SS score of enrolled patients was 9.6, with the majority of patients having a score ≥ 8, indicative of moderate disease activity (Table 1) Table 1. Patient Demographics Characteristic (N=449) Characteristic (N=449) Sex (female), % 93 SS score, mean 9.6 Age (years), mean 42 PGA, mean 1.5 Race White, % 70 BILAG, % patients with 68 ≥1 A flare or 2 B flares Black, % 24 Hispanic or Latino origin, % 19 Positive autoantibodies, % ANA 1 72 Anti-dsDNA 2 50 Anti-RNP 47 Anti-Ro/SSA 39 Anti-cardiolipin 28 Anti-Sm 19 Disease duration (years), mean 8.8 Daily prednisone use All doses, % 69 >7.5 mg, % 36 Immunosuppressant use, % 50 C4 below LLN 3 ,% 41 1 ANA ≥1:80; 2 anti-dsDNA ≥30 IU/mL; 3 C4 <16 mg/dL BILAG = British Isles Lupus Assessment Group; PGA = Physician’s Global Assessment; ANA = anti-nuclear antibodies; anti-dsDNA= anti-double-stranded DNA antibodies; LLN = lower limit of normal Safety During the Double-blind Trial As there was no dose response observed in the 52-week double-blind treatment period, all 3 belimumab doses (1, 4, 10 mg/kg) were combined (n=336) and compared with placebo (n=113). AEs and infection rates were similar for both belimumab and placebo during the double-blind period (Table 2) Table 2. The Incidence Rates of AEs and Infections Were Similar in Belimumab- and Placebo-Treated Patients During the 52-Week Double-Blind Period 1st 6-months 2nd 6-months 1 Placebo n=113 Belimumab n=336 Placebo n=108 Belimumab n=318 AE Incidence Rate per 100 Patient-Years 2 Overall AEs 188 194 158 158 Overall serious AEs 20 21 21 14 Overall infections 114 118 96 99 Serious infections 4 7 3 5 Malignant neoplasms 0 0 2 1 Discontinuation due to AE 9 6 3 7 Discontinuation due to serious AE 4 2 3 4 1 End of 52-week treatment; includes a follow-up period of 8 weeks after last dose of study agent 2 Number of patients starting a given AE in a given interval/total patient-years in a given interval Safety Including the Extension and Continuation Trials The 4-year safety dataset was divided into eight 6-month treatment intervals for reporting the rate of adverse events (AEs) (Figure 2). Interval 1 includes the initial belimumab treatment which for placebo patients began in the extension period at week 56 References 1 Rahman A et al. N Engl J Med. 2008;358:929-939; 2 Halpern W et al. Toxicol Sci. 2006;91:586-599; 3 Avery DT et al. J Clin Invest. 2003;112:286-298; 4 Do RKG et al. J Exp Med. 2000;192:953-964; 5 Zhang J et al. J Immunol. 2001;166:6-10; 6 Petri M et al. Arthritis Rheum. 2008;58:2453-2459; 7 Scholz JL et al. PNAS; 105(40): 15517-22; 8 Baker KP et al. Arthritis Rheum. 2005;48:3253-3265. Disclosures Supported by Human Genome Sciences and GlaxoSmithKline CONCLUSIONS Serologically active patients treated with belimumab and standard of care had sustained improvement in SLE disease activity and the SLE Responder Index (SRI) over 4 years The frequency of overall and severe flares as measured by the SELENA SLEDAI SLE Flare Index as well as new BILAG A or 2B flares decreased over 4 years The overall AE, SAE and infection rates decreased or stabilized over 4 years of exposure to belimumab The data suggest that belimumab was generally well tolerated and may be safely administered long-term with standard of care therapy in patients with SLE Poster presented at the EULAR 2009 Congress, June 10–13, 2009, in Copenhagen, Denmark THU0245 Figure 2. Belimumab Treatment (by 6-month Interval) Time Belimumab Placebo Interval 1 0-0.5 y Interval 2 0.5-1 y Interval 3 1-1.5 y Interval 4 1.5-2 y Interval 5 2-2.5 y Interval 6 2.5-3 y Interval 1 0-0.5 y Interval 2 0.5-1 y Interval 3 1-1.5 y Interval 4 1.5-2 y Interval 5 2-2.5 y Interval 6 2.5-3 y 0-0.5 y 0.5-1 y Placebo Belimumab 1 mg/kg Belimumab 4 mg/kg Belimumab 10 mg/kg Legend + Standard of Care 52-wk Double- Blind Period Placebo Patients on Belimumab 10 mg/kg Time 52-wk Double- 24-wk Extension Period Blind Period All Patients on Belimumab 10 mg/kg Interval 7 3 -3.5 y Interval 8 3.5-4 y Interval 7 3-3.5 y Interval 8 3.5-4 y The most frequent serious infections were cellulitis, pneumonia, acute bronchitis, and bacterial pneumonia; each occurred in < 1% of patients Figure 3. The Incidence Rates of Overall and Serious Adverse Events and Infections Decreased or Stabilized During the 4-Year Treatment Period* 80 100 120 140 160 180 200 0 10 20 Intervals Rate Per 100 Patient-Years* 1 2 3 4 5 6 7 8 0 102 173 2.9 4.8 16.5 119 194 4.8 6.8 20.8 Overall AE Serious AE Overall Infection Serious Infection Discontinued due to AE * Rate = (100 X Number of subjects starting a given AE in a given interval)/(total subject years in a given interval) The incidence rates of AEs by system organ class stabilized over 4 years of treatment (Table 3) Malignancies: 2 squamous cell CA; 3 basal cell CA (2 patients); 1 breast CA; 1 multiple myeloma; 2 B-cell lymphoma; 1 bronchial malignant neoplasm Table 3. Incidence Rates of Adverse Events by System Organ Class Stabilized or Decreased Over Time Interval 1 1 N=424 [207] 2 2 N=398 [183] 3 N=353 [166] 4 N=314 [147] 5 N=284 [136] 6 N=261 [128] 7 N=252 [122] 8 N=237 [103] Number of Patients (Rate per 100 Patient-Years) 3,4 Blood and lymphatic 51 (24.7) 27 (14.7) 25 (15.1) 14 (9.5) 13 (9.6) 13 (10.2) 10 (8.2) 7 (6.8) Cardiac disorders 18 (8.7) 26 (14.2) 10 (6.0) 8 (5.4) 11 (8.1) 7 (5.5) 11 (9.0) 4 (3.9) Gastrointestinal 172 (83.3) 117 (63.9) 104 (62.8) 80 (54.4) 61 (44.8) 58 (45.4) 40 (32.7) 35 (33.9) Musculoskeletal 222 (107.5) 158 (86.3) 144 (86.9) 128 (87.0) 102 (74.9) 86 (67.3) 78 (63.8) 64 (62.0) Nervous 136 (65.9) 102 (55.7) 78 (47.1) 67 (45.5) 47 (34.5) 47 (36.8) 48 (39.3) 27 (26.2) Psychiatric 61 (29.6) 35 (19.1) 44 (26.6) 24 (16.3) 25 (18.4) 18 (14.1) 19 (15.5) 9 (8.7) Renal 46 (22.3) 24 (13.1) 19 (11.5) 10 (6.8) 11 (8.1) 7 (5.5) 7 (5.7) 4 (3.9) Respiratory 121 (58.6) 90 (49.1) 63 (38.0) 59 (40.1) 61 (44.8) 44 (34.5) 38 (31.1) 35 (33.9) Skin 174 (84.3) 95 (51.9) 92 (55.5) 68 (46.2) 60 (44.1) 45 (35.2) 46 (37.6) 33 (32.0) Vascular 44 (21.3) 37 (20.2) 23 (13.9) 18 (12.2) 16 (11.8) 10 (7.8) 15 (12.3) 8 (7.8) Malignant neoplasms 0 (0.0) 1 (0.5) 3 (1.8) 2 (1.4) 0 (0.0) 1 (0.8) 1 (0.9) 2 (2.1) 1 Data include patients who originally took placebo, then were switched to belimumab after the 52-week double-blind period 2 N = total patients [total patient-years] 3 Number of patients starting a given AE in a given interval 4 Rate = (100 × number of patients starting a given AE in a given interval)/(total patient-years in a given interval) The incidence rates of the most common AEs (arthralgia, fatigue, headache, nausea and urinary tract infection) declined substantially with continued treatment (Figure 4) Figure 4. The Incidence Rates of the Most Common AEs Decreased or Stabilized During the 4-Year Treatment Period* 0 10 20 30 40 50 0 1 2 3 4 5 6 7 8 Intervals Rate Per 100 Patient Years* 44.6 34.4 33.4 32.5 28.1 22.3 Arthralgia Headache Upper respiratory tract infection Urinary tract infection Fatigue Nausea 38.8 22.3 9.7 9.7 7.8 7.8 * Rate = (100 × number of patients starting a given AE in a given interval)/(total patient-years in a given interval) Efficacy Post-hoc SLE Responder Index (SRI) defined as improvement in SS (≥ 4-pt decrease), and no new BILAG A or 2 B flares, and no worsening in PGA (< 0.3 pt increase) vs baseline SRI response rates increased for all serologically active patients taking belimumab through week 76, then stabilized through week 208 (57%). Placebo- to-belimumab patients also improved over time Figure 5. SRI Responder Rate was Significantly Higher in Serologically Active Patients Treated with Belimumab* Responder Rate (%) 4 20 36 52 68 84 116 148 180 208 10 20 30 40 50 60 70 Visit Week Placebo Belimumab (1, 4, 10 mg/kg) Belimumab 10 mg/kg Placebo to Belimumab 10 mg/kg *Last observation carried forward (LOCF) Analysis At week 52, serologically active patients on belimumab had greater improvements in mean SS scores (29% vs 14% placebo, p=0.0435) and in PGA (33% vs 11% placebo, p=0.0011) (Figure 6) After 4 years, SS and PGA both improved 44% from baseline. In subjects originally randomized to placebo who switched to belimumab after 52 weeks, SS and PGA improved 38% and 31%, respectively, from baseline (Figure 6) Figure 6. Serologically Active Patients on Belimumab Treatment had Greater Improvements in Mean PGA Over Time* 10 Visit Week Mean Percent Change from Baseline in PGA 0 16 32 48 64 80 96 128 160 192 208 -40 -30 -20 -10 0 Placebo Belimumab (1, 4, 10 mg/kg) Belimumab 10 mg/kg Placebo to Belimumab 10 mg/kg *Last observation carried forward (LOCF) Analysis In serologically active belimumab-treated patients, the frequency of flares (as measured by the modified SS SLE Flare Index), in 6-month intervals, decreased from 72% in the first 6 months to 62% after 1 year, vs placebo at 76% and 73%, respectively. The overall frequency of flares in the serologically active patients on belimumab declined progressively to 16% at 4 years of therapy. The frequency of severe flares declined from 8% at 1 year to 1% at 4 years (Figure 7) In serologically active patients treated with belimumab, the frequency of patients with a new A or 2 BILAG B flares decreased from 30% in the first 6 months to 23% after 1 year of therapy, vs placebo 33% and 25%, respectively. At 4 years, the frequency declined to 5% Figure 7. The Frequency of SLE Flares* Decreased Over Time in Serologically Active Patients Treated With Belimumab** 0.5 1.0 1.5 2.0 2.5 3.0 3.5 4.0 0 10 20 30 40 50 60 70 80 90 100 76 72 73 62 55 34 27 29 35 16 Subjects with Flares (%) 0.5 1.0 1.5 2.0 2.5 3.0 3.5 4.0 0 10 20 9 13 8 11 4 2 3 2 5 1 Years Subjects with Severe Flares (%) Placebo Belimumab (1, 4, 10 mg/kg) * Flares measured by modified SELENA SLEDAI SLE Flare Index (mild-moderate and/or severe) ** Data for belimumab group after 1 year includes patients originally randomized to placebo who began receiving belimumab 10 mg/kg at week 56 Figure 8. The Frequency of New BILAG A/2B Flares Decreased Over Time in Serologically Active Patients Treated With Belimumab* 0.5 1.0 1.5 2.0 2.5 3.0 3.5 4.0 0 5 10 15 20 25 30 35 33 30 25 23 17 9 6 5 7 5 Years Subjects with New A/2B BILAG Flares (%) Placebo Belimumab (1, 4, 10 mg/kg) * Data for belimumab group after 1 year includes patients originally randomized to placebo who began receiving belimumab 10 mg/kg at week 56

BENLYSTA - EULAR 2009

Embed Size (px)

Citation preview

4 Year Experience Of Belimumab, a Fully Human Monoclonal Antibody, in the Treatment Of Systemic Lupus Erythematosus (SLE) J. T. Merrill1, R. Furie2, D. J. Wallace3, J. McKay4, E. M. Ginzler5, F. Wellborne6, C. Aranow7, M. Burnette8, N. Mishra9, L. Pineda10, J. Zhong10, D. Hough10, W. Freimuth10, LBSL02/99 Study Group11

1Oklahoma Medical Research Foundation, Oklahoma City, OK; 2North Shore-Long Island Jewish Health System, Lake Success, NY; 3Cedars-Sinai UCLA, Los Angeles, CA; 4Oklahoma Center for Arthritis Therapy & Research, Tulsa, OK; 5State University of New York, Downstate, Brooklyn, NY; 6Houston Institute for Clinical Research, Houston, TX; 7Feinstein Institute for Medical Research, Manhasset, NY; 8Tampa Medical Group, Tampa, FL; 9Wake Forest University, Winston-Salem, NC; 10Human Genome Sciences, Rockville, MD; 11USA/Canada

ABSTRACT (Updates shown in italics)Purpose: To provide 4 year results of belimumab in SLE patients.

Methods: 449 SLE patients enrolled in a phase 2, placebo-controlled, 52-week trial of belimumab (1, 4, 10 mg/kg, monthly) plus standard background SLE therapy. In the 24-week extension, placebo subjects switched to belimumab 10 mg/kg, and belimumab patients remained on the same dose or could be increased to 10 mg/kg at the discretion of the investigator. After 76 weeks, all remaining patients (n=296) re-ceived belimumab 10 mg/kg. Safety was monitored monthly. The 4-year safety dataset was divided into eight 6-month intervals for reporting adverse event (AE) rates. Interval 1 includes the initial belimumab treat-ment which for placebo patients began in the extension period. Disease activity assessments using SELENA SLEDAI (SS), Physician’s Global Assessment (PGA) and BILAG were conducted every 4 to 8 weeks. Post-hoc analyses identified a subgroup of serologically active patients for which belimumab was efficacious.

Results: By 4 years, overall belimumab exposure was 1,143 patient-years. The incidence rates (per 100 patient years) of all AE categories in-cluding serious AEs, and overall and serious infections decreased over 4 years. At week 52, serologically active patients on belimumab had significantly greater improvements in mean SS scores (29% vs 14% placebo, p=0.0435) and in PGA (33% vs 11% placebo, p=0.0011) from baseline. After 4 years, SS and PGA both improved 44% from baseline. In placebo to belimumab patients, SS and PGA improved 38% and 31%, respectively, from baseline.

(The data contained in the abstract table are presented below.)

Conclusions: Belimumab was generally well tolerated with background SLE therapy during long-term exposure. In serologically active patients, belimumab treatment resulted in sustained improvement in SLE disease activity over 4 years.

INTRODUCTION•SLE is a chronic multisystem autoimmune disorder, characterized by increased

B- and T-cell activation1, with a broad range of symptoms. Although it can be life-threatening when major organs are affected, SLE more commonly results in debilitating health

•For patients with SLE, there is an unmet medical need for additional treatment options that manage or suppress disease activity without further compromising patient health

•B-lymphocyte stimulator (BLyS) is an immunomodulatory protein that promotes B-cell survival (inhibits apoptosis), B-cell differentiation, and Ig class switching2-4

•High levels of BLyS may relax B-cell selection and contribute to elevated production of autoantibodies, exacerbating the SLE disease state

•Elevated BLyS cytokine levels are a key contributory factor in SLE and correlate with increased SLE disease activity4

•Inhibition of BLyS can result in apoptosis of B cells at certain stages of maturity5,6

•BLyS inhibition does not affect secondary immune responses or vaccine antibody titers in the murine model7

•Belimumab is a BLyS-specific inhibitor that selectively targets and inhibits the BLyS cytokine2,8

•Preclinical and primate trials demonstrated that belimumab reduced the levels of peripheral and tissue B cells with an acceptable safety and tolerability profile2

•4 year safety and efficacy data from the belimumab phase 2 SLE trial (52-week double-blind and continuation) are presented here

RESULTSFigure 1. Phase 2 SLE Trial Design (LBSL02/LBSL99)

Placebo1

Belimumab1

1 mg/kg

Belimumab1

4 mg/kg

Belimumab1

10 mg/kg

Belimumab1

1 mg/kg2

Belimumab1

4 mg/kg2

Belimumab1

10 mg/kg

Belimumab1

10 mg/kg

Weeks 0-52(Year 0-1)

N=449

Weeks 56-76(Year 1-1.5)

N=345 (77%)

Weeks 80-208(Year 1.5-4)

N=296 (66%)

ExtensionRANDOMIZE

Double-blind

72% (214/296) remain on treatment as of 19-May-09

Long-termContinuation449 patients with active SLE

(US & Canada)

SELENA-SLEDAI ≥4

Met ACR criteria with history ofmeasurable autoantibodies

Severe active CNS lupus or lupusnephritis excluded

All patients remained onstandard of care. Adjustments inimmunosuppressants and glucocorticoids permitted per protocol

•Efficacy and safety assessments performed every 4 to 8 weeks in the first 76 weeks — SLE disease activity indices (DAIs)•SELENA-SLEDAI (SS), SLE Flare Index (SFI)3, PGA, BILAG Classic 2000

•Trial extension/continuation assessments — SS and biomarkers every 4 to 8 weeks in the extension, and every 8 to 16 weeks in

the long-term continuation — Adverse events recorded every visit. Safety labs every 8 weeks

1All treatments included standard of care. 2 Belimumab dose could be increased to 10 mg/kg at the discretion of each investigator. 3ModifiedsothatchangeonlyinSS>12wasnotcountedassevereflare.BILAG=BritishIslesLupusAssessmentGroup;PGA=Physician’sGlobalAssessment

•Serologically active patients (defined as ANA ≥1:80 and/or ≥30 IU/mL) represented 71% of the patient population and tended to be younger and have higher SLE disease activity at baseline

•The baseline median SS score of enrolled patients was 9.6, with the majority of patients having a score ≥ 8, indicative of moderate disease activity (Table 1)

Table 1. Patient DemographicsCharacteristic (N=449) Characteristic (N=449)Sex(female),% 93 SSscore,mean 9.6Age(years),mean 42 PGA,mean 1.5

RaceWhite,% 70 BILAG,%patientswith 68

≥1Aflareor2BflaresBlack,% 24HispanicorLatinoorigin,% 19 Positiveautoantibodies,%

ANA1 72 Anti-dsDNA2 50 Anti-RNP 47 Anti-Ro/SSA 39 Anti-cardiolipin 28 Anti-Sm 19

Diseaseduration(years),mean 8.8

Dailyprednisoneuse Alldoses,% 69 >7.5mg,% 36

Immunosuppressantuse,% 50 C4belowLLN3,% 411ANA≥1:80;2anti-dsDNA≥30IU/mL;3C4<16mg/dLBILAG=BritishIslesLupusAssessmentGroup;PGA=Physician’sGlobalAssessment;ANA=anti-nuclearantibodies;anti-dsDNA=anti-double-strandedDNAantibodies;LLN=lowerlimitofnormal

Safety During the Double-blind Trial

•As there was no dose response observed in the 52-week double-blind treatment period, all 3 belimumab doses (1, 4, 10 mg/kg) were combined (n=336) and compared with placebo (n=113). AEs and infection rates were similar for both belimumab and placebo during the double-blind period (Table 2)

Table 2. The Incidence Rates of AEs and Infections Were Similar in Belimumab- and Placebo-Treated Patients During the 52-Week Double-Blind Period

1st6-months 2nd6-months1

Placebon=113

Belimumabn=336

Placebon=108

Belimumabn=318

AE Incidence Rate per 100 Patient-Years2

Overall AEs 188 194 158 158Overall serious AEs 20 21 21 14Overall infections 114 118 96 99Seriousinfections 4 7 3 5Malignant neoplasms 0 0 2 1Discontinuation due to AE 9 6 3 7Discontinuation due to serious AE 4 2 3 4

1 Endof52-weektreatment;includesafollow-upperiodof8weeksafterlastdoseofstudyagent2 NumberofpatientsstartingagivenAEinagiveninterval/totalpatient-yearsinagiveninterval

Safety Including the Extension and Continuation Trials

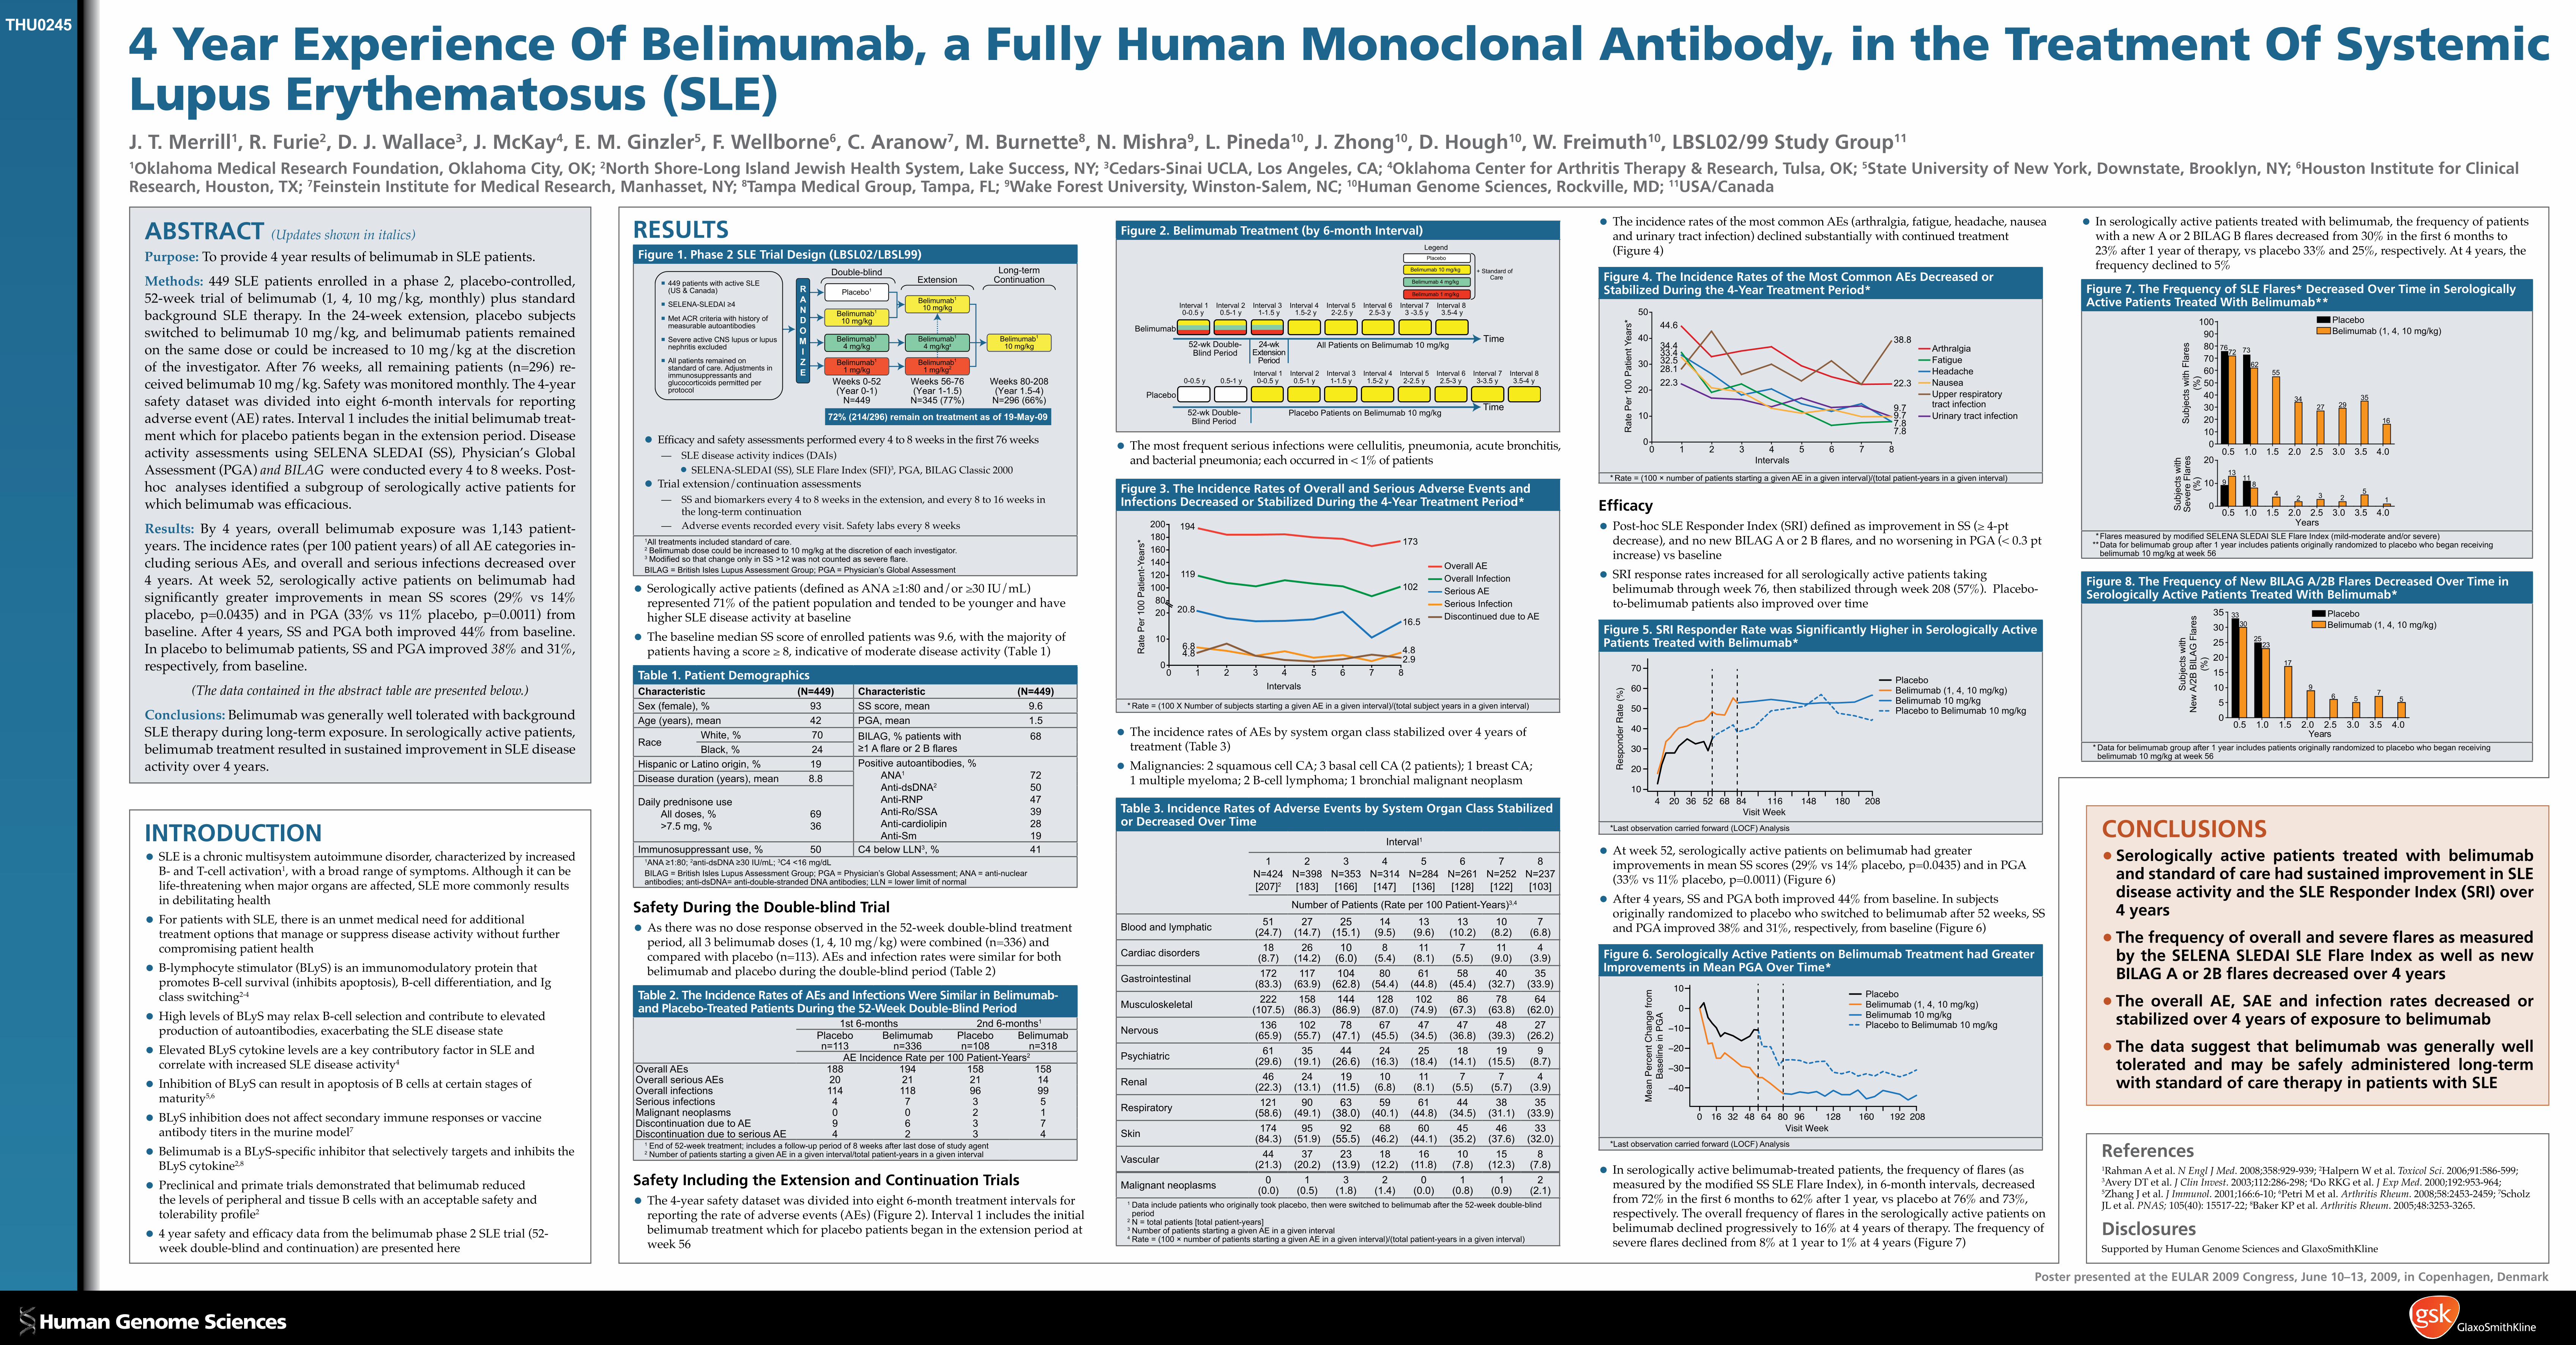
•The 4-year safety dataset was divided into eight 6-month treatment intervals for reporting the rate of adverse events (AEs) (Figure 2). Interval 1 includes the initial belimumab treatment which for placebo patients began in the extension period at week 56

References 1Rahman A et al. N Engl J Med. 2008;358:929-939; 2Halpern W et al. Toxicol Sci. 2006;91:586-599;

3Avery DT et al. J Clin Invest. 2003;112:286-298; 4Do RKG et al. J Exp Med. 2000;192:953-964; 5Zhang J et al. J Immunol. 2001;166:6-10; 6Petri M et al. Arthritis Rheum. 2008;58:2453-2459; 7Scholz JL et al. PNAS; 105(40): 15517-22; 8Baker KP et al. Arthritis Rheum. 2005;48:3253-3265.

Disclosures Supported by Human Genome Sciences and GlaxoSmithKline

CONCLUSIONS•Serologically active patients treated with belimumab

and standard of care had sustained improvement in SLE disease activity and the SLE Responder Index (SRI) over 4 years

•The frequency of overall and severe flares as measured by the SELENA SLEDAI SLE Flare Index as well as new BILAG A or 2B flares decreased over 4 years

•The overall AE, SAE and infection rates decreased or stabilized over 4 years of exposure to belimumab

•The data suggest that belimumab was generally well tolerated and may be safely administered long-term with standard of care therapy in patients with SLE

Poster presented at the EULAR 2009 Congress, June 10–13, 2009, in Copenhagen, Denmark

THU0245

Figure 2. Belimumab Treatment (by 6-month Interval)

Time

Belimumab

Placebo

Interval 10-0.5 y

Interval 20.5-1 y

Interval 31-1.5 y

Interval 41.5-2 y

Interval 52-2.5 y

Interval 62.5-3 y

Interval 10-0.5 y

Interval 20.5-1 y

Interval 31-1.5 y

Interval 41.5-2 y

Interval 52-2.5 y

Interval 62.5-3 y0-0.5 y 0.5-1 y

Placebo

Belimumab 1 mg/kg

Belimumab 4 mg/kg

Belimumab 10 mg/kg

Legend

+ Standard ofCare

52-wk Double-Blind Period

Placebo Patients on Belimumab 10 mg/kg

Time52-wk Double- 24-wkExtension

PeriodBlind Period

All Patients on Belimumab 10 mg/kg

Interval 73 -3.5 y

Interval 83.5-4 y

Interval 73-3.5 y

Interval 83.5-4 y

•The most frequent serious infections were cellulitis, pneumonia, acute bronchitis, and bacterial pneumonia; each occurred in < 1% of patients

Figure 3. The Incidence Rates of Overall and Serious Adverse Events and Infections Decreased or Stabilized During the 4-Year Treatment Period*

80100120140160180200

0

10

20

Intervals

Rat

e P

er 1

00 P

atie

nt-Y

ears

*

1 2 3 4 5 6 7 80

102

173

2.94.8

16.5

119

194

4.86.8

20.8

Overall AE

Serious AEOverall Infection

Serious InfectionDiscontinued due to AE

* Rate=(100XNumberofsubjectsstartingagivenAEinagiveninterval)/(totalsubjectyearsinagiveninterval)

•The incidence rates of AEs by system organ class stabilized over 4 years of treatment (Table 3)

•Malignancies: 2 squamous cell CA; 3 basal cell CA (2 patients); 1 breast CA; 1 multiple myeloma; 2 B-cell lymphoma; 1 bronchial malignant neoplasm

Table 3. Incidence Rates of Adverse Events by System Organ Class Stabilized or Decreased Over Time

Interval1

1 N=424 [207]2

2 N=398 [183]

3 N=353 [166]

4 N=314 [147]

5 N=284[136]

6 N=261[128]

7 N=252 [122]

8 N=237 [103]

NumberofPatients(Rateper100Patient-Years)3,4

Bloodandlymphatic 51(24.7)

27(14.7)

25(15.1)

14 (9.5)

13 (9.6)

13 (10.2)

10 (8.2)

7 (6.8)

Cardiac disorders 18 (8.7)

26(14.2)

10 (6.0)

8 (5.4)

11 (8.1)

7 (5.5)

11 (9.0)

4 (3.9)

Gastrointestinal 172(83.3)

117(63.9)

104(62.8)

80(54.4)

61(44.8)

58(45.4)

40(32.7)

35(33.9)

Musculoskeletal 222 (107.5)

158(86.3)

144(86.9)

128(87.0)

102 (74.9)

86(67.3)

78(63.8)

64(62.0)

Nervous 136(65.9)

102 (55.7)

78(47.1)

67(45.5)

47(34.5)

47(36.8)

48(39.3)

27(26.2)

Psychiatric 61(29.6)

35(19.1)

44(26.6)

24(16.3)

25(18.4)

18(14.1)

19(15.5)

9 (8.7)

Renal 46(22.3)

24(13.1)

19(11.5)

10 (6.8)

11 (8.1)

7 (5.5)

7 (5.7)

4 (3.9)

Respiratory 121 (58.6)

90(49.1)

63(38.0)

59(40.1)

61(44.8)

44(34.5)

38(31.1)

35(33.9)

Skin 174(84.3)

95(51.9)

92(55.5)

68(46.2)

60(44.1)

45(35.2)

46(37.6)

33 (32.0)

Vascular 44(21.3)

37(20.2)

23 (13.9)

18(12.2)

16(11.8)

10 (7.8)

15(12.3)

8 (7.8)

Malignant neoplasms 0 (0.0)

1 (0.5)

3 (1.8)

2 (1.4)

0 (0.0)

1 (0.8)

1 (0.9)

2 (2.1)

1 Dataincludepatientswhooriginallytookplacebo,thenwereswitchedtobelimumabafterthe52-weekdouble-blindperiod

2N=totalpatients[totalpatient-years]3 Number of patients starting a given AE in a given interval4Rate=(100×numberofpatientsstartingagivenAEinagiveninterval)/(totalpatient-yearsinagiveninterval)

•The incidence rates of the most common AEs (arthralgia, fatigue, headache, nausea and urinary tract infection) declined substantially with continued treatment (Figure 4)

Figure 4. The Incidence Rates of the Most Common AEs Decreased or Stabilized During the 4-Year Treatment Period*

0

10

20

30

40

50

0 1 2 3 4 5 6 7 8Intervals

Rat

e P

er 1

00 P

atie

nt Y

ears

* 44.6

34.433.432.528.122.3

Arthralgia

Headache

Upper respiratorytract infectionUrinary tract infection

Fatigue

Nausea

38.8

22.3

9.79.77.87.8

*Rate=(100×numberofpatientsstartingagivenAEinagiveninterval)/(totalpatient-yearsinagiveninterval)

Efficacy

•Post-hoc SLE Responder Index (SRI) defined as improvement in SS (≥ 4-pt decrease), and no new BILAG A or 2 B flares, and no worsening in PGA (< 0.3 pt increase) vs baseline

•SRI response rates increased for all serologically active patients taking belimumab through week 76, then stabilized through week 208 (57%). Placebo-to-belimumab patients also improved over time

Figure 5. SRI Responder Rate was Significantly Higher in Serologically Active Patients Treated with Belimumab*

Res

pond

er R

ate

(%)

4 20 36 52 68 84 116 148 180 20810

20

30

40

50

60

70

Visit Week

PlaceboBelimumab (1, 4, 10 mg/kg)Belimumab 10 mg/kgPlacebo to Belimumab 10 mg/kg

*Lastobservationcarriedforward(LOCF)Analysis

•At week 52, serologically active patients on belimumab had greater improvements in mean SS scores (29% vs 14% placebo, p=0.0435) and in PGA (33% vs 11% placebo, p=0.0011) (Figure 6)

•After 4 years, SS and PGA both improved 44% from baseline. In subjects originally randomized to placebo who switched to belimumab after 52 weeks, SS and PGA improved 38% and 31%, respectively, from baseline (Figure 6)

Figure 6. Serologically Active Patients on Belimumab Treatment had Greater Improvements in Mean PGA Over Time*

10

Visit Week

Mea

n Pe

rcen

t Cha

nge

from

Base

line

in P

GA

0 16 32 48 64 80 96 128 160 192 208

−40

−30

−20

−10

0PlaceboBelimumab (1, 4, 10 mg/kg)Belimumab 10 mg/kgPlacebo to Belimumab 10 mg/kg

*Lastobservationcarriedforward(LOCF)Analysis

•In serologically active belimumab-treated patients, the frequency of flares (as measured by the modified SS SLE Flare Index), in 6-month intervals, decreased from 72% in the first 6 months to 62% after 1 year, vs placebo at 76% and 73%, respectively. The overall frequency of flares in the serologically active patients on belimumab declined progressively to 16% at 4 years of therapy. The frequency of severe flares declined from 8% at 1 year to 1% at 4 years (Figure 7)

•In serologically active patients treated with belimumab, the frequency of patients with a new A or 2 BILAG B flares decreased from 30% in the first 6 months to 23% after 1 year of therapy, vs placebo 33% and 25%, respectively. At 4 years, the frequency declined to 5%

Figure 7. The Frequency of SLE Flares* Decreased Over Time in Serologically Active Patients Treated With Belimumab**

0.5 1.0 1.5 2.0 2.5 3.0 3.5 4.00

102030405060708090

100

7672 73

6255

3427 29

35

16Sub

ject

s w

ith F

lare

s(%

)

0.5 1.0 1.5 2.0 2.5 3.0 3.5 4.00

10

20

913

811

42 3 2

51

Years

Sub

ject

s w

ithS

ever

e Fl

ares

(%)

PlaceboBelimumab (1, 4, 10 mg/kg)

*FlaresmeasuredbymodifiedSELENASLEDAISLEFlareIndex(mild-moderateand/orsevere) **Dataforbelimumabgroupafter1yearincludespatientsoriginallyrandomizedtoplacebowhobeganreceiving

belimumab10mg/kgatweek56

Figure 8. The Frequency of New BILAG A/2B Flares Decreased Over Time in Serologically Active Patients Treated With Belimumab*

0.5 1.0 1.5 2.0 2.5 3.0 3.5 4.005

101520253035 33

30

2523

17

96 5

75

Years

Sub

ject

s w

ithN

ew A

/2B

BIL

AG

Fla

res

(%)

PlaceboBelimumab (1, 4, 10 mg/kg)

*Dataforbelimumabgroupafter1yearincludespatientsoriginallyrandomizedtoplacebowhobeganreceivingbelimumab10mg/kgatweek56