Embed Size (px)
Citation preview
1st GLOBAQUA CONFERENCE: Managing The Effects Of Multiple Stressors On Aquatic Ecosystems Under Water Scarcity
11–12 January 2016, Freising, Germany.
*Hassan II Institute of Agronomy and Veterinary Medicine,
Morocco
Benlouali Hajar*, Redouane Choukr-Allah, Harrouni Moulay Cherif,
Mohamed Fallah
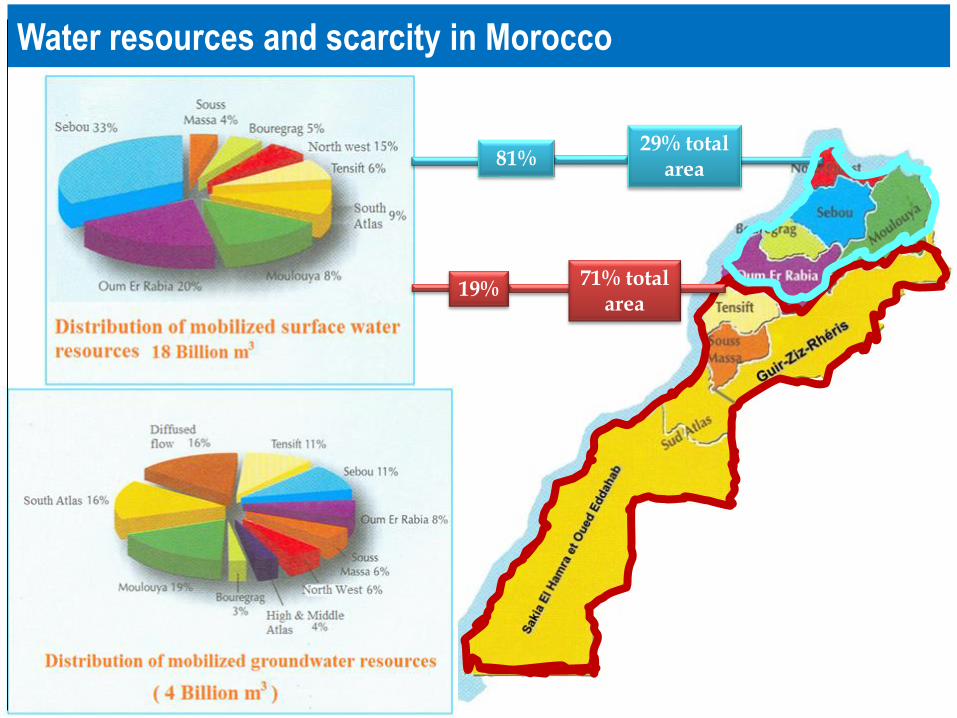
Water resources and scarcity in Morocco
81%29% total
area
19%71% total
area
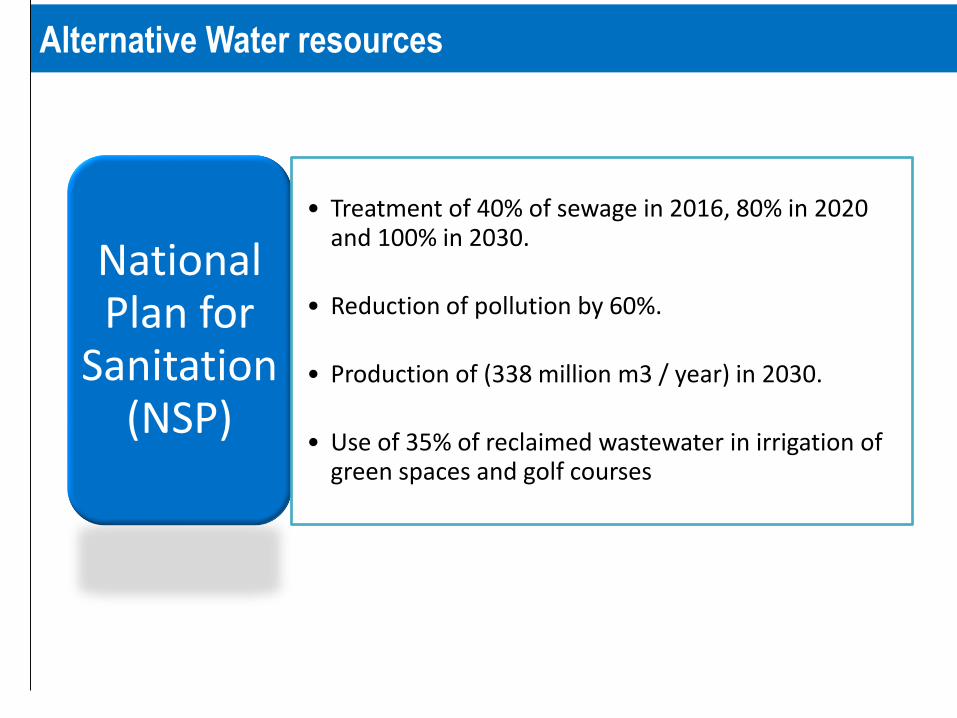
Alternative Water resources
National Plan for
Sanitation(NSP)
• Treatment of 40% of sewage in 2016, 80% in 2020 and 100% in 2030.
• Reduction of pollution by 60%.
• Production of (338 million m3 / year) in 2030.
• Use of 35% of reclaimed wastewater in irrigation of green spaces and golf courses
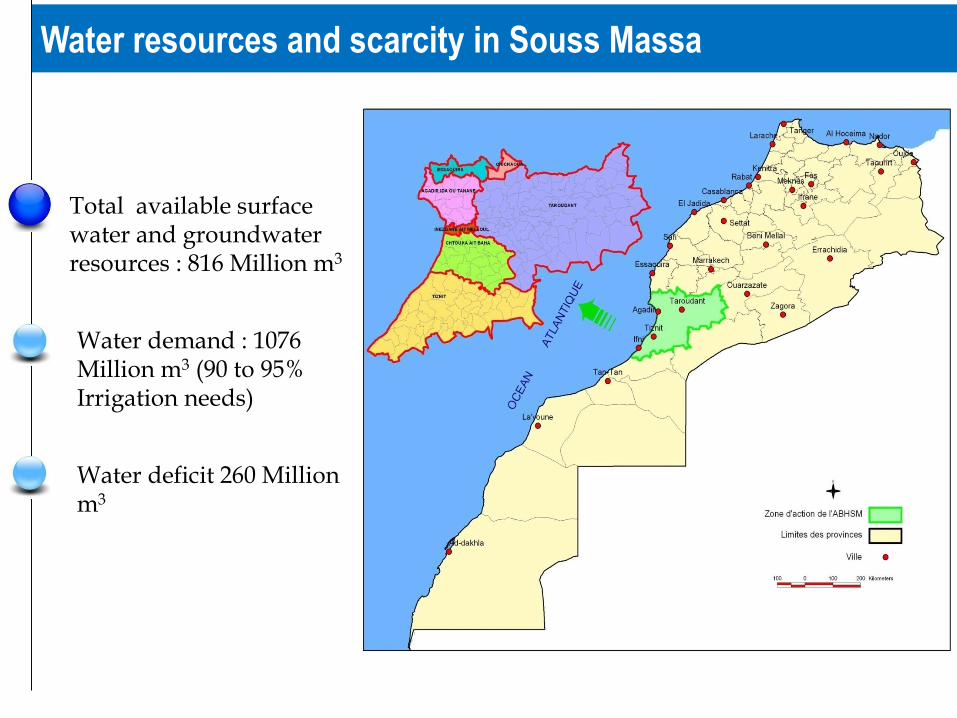
Water resources and scarcity in Souss Massa
Total available surface water and groundwater resources : 816 Million m3
Water demand : 1076 Million m3 (90 to 95% Irrigation needs)
Water deficit 260 Million m3
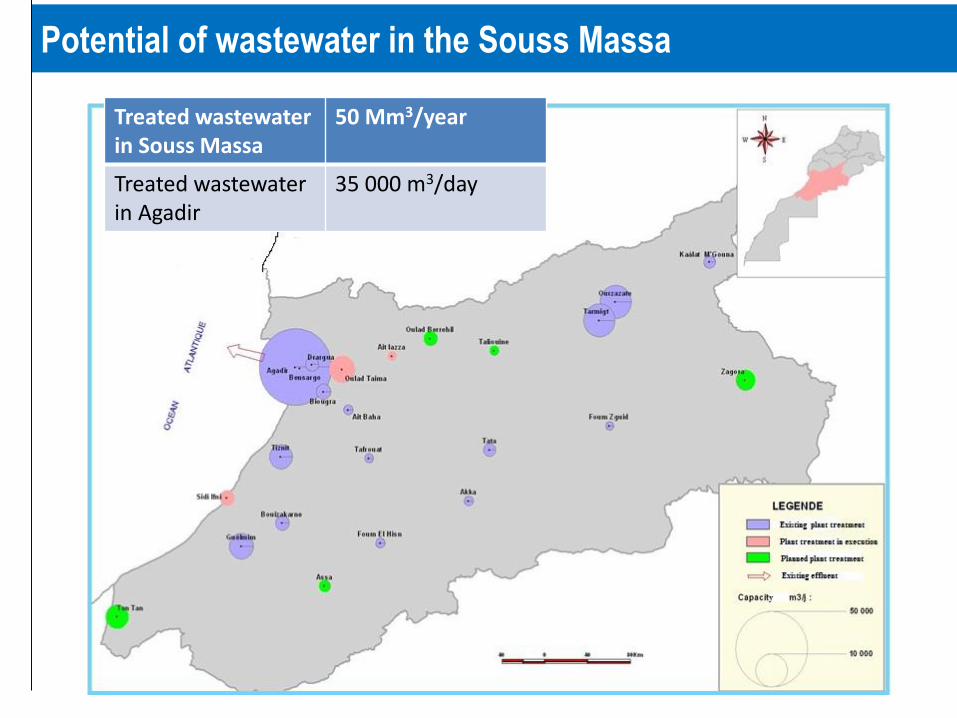
Potential of wastewater in the Souss Massa
Treated wastewater in Souss Massa
50 Mm3/year
Treated wastewaterin Agadir
35 000 m3/day
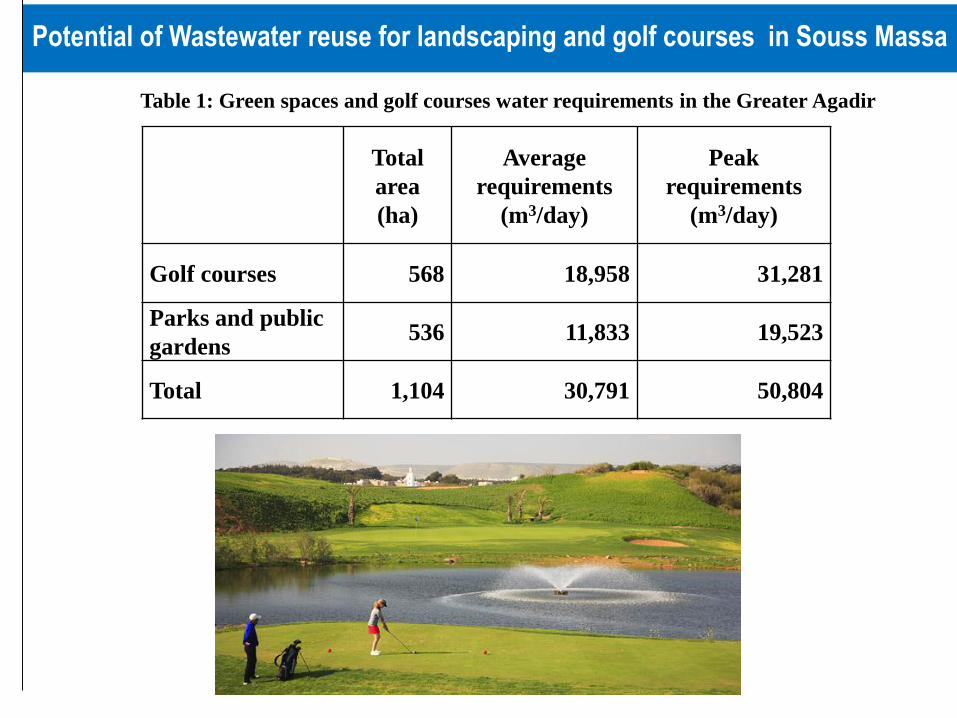
Potential of Wastewater reuse for landscaping and golf courses in Souss Massa
Total
area
(ha)
Average
requirements
(m3/day)
Peak
requirements
(m3/day)
Golf courses 568 18,958 31,281
Parks and public
gardens536 11,833 19,523
Total 1,104 30,791 50,804
Table 1: Green spaces and golf courses water requirements in the Greater Agadir
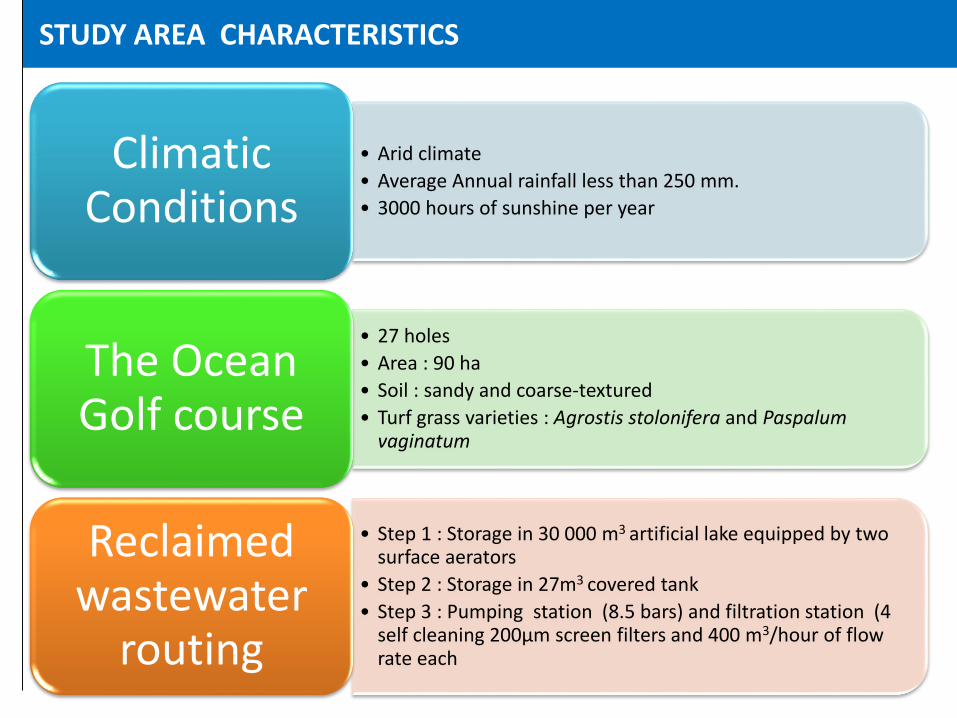
STUDY AREA CHARACTERISTICS
• Arid climate
• Average Annual rainfall less than 250 mm.
• 3000 hours of sunshine per year
Climatic Conditions
• 27 holes
• Area : 90 ha
• Soil : sandy and coarse-textured
• Turf grass varieties : Agrostis stolonifera and Paspalumvaginatum
The OceanGolf course
• Step 1 : Storage in 30 000 m3 artificial lake equipped by two surface aerators
• Step 2 : Storage in 27m3 covered tank
• Step 3 : Pumping station (8.5 bars) and filtration station (4 self cleaning 200μm screen filters and 400 m3/hour of flow rate each
Reclaimedwastewater
routing
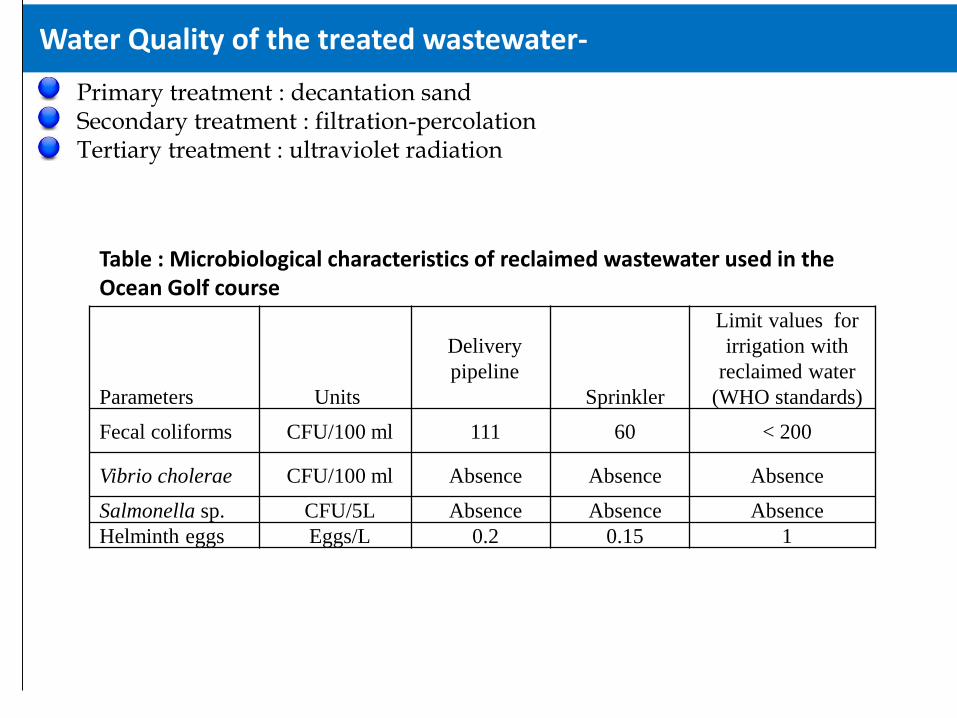
Water Quality of the treated wastewater-
Primary treatment : decantation sand Secondary treatment : filtration-percolationTertiary treatment : ultraviolet radiation
Parameters Units
Delivery
pipeline
Sprinkler
Limit values for
irrigation with
reclaimed water
(WHO standards)
Fecal coliforms CFU/100 ml 111 60 < 200
Vibrio cholerae CFU/100 ml Absence Absence Absence
Salmonella sp. CFU/5L Absence Absence Absence
Helminth eggs Eggs/L 0.2 0.15 1
Table : Microbiological characteristics of reclaimed wastewater used in the Ocean Golf course
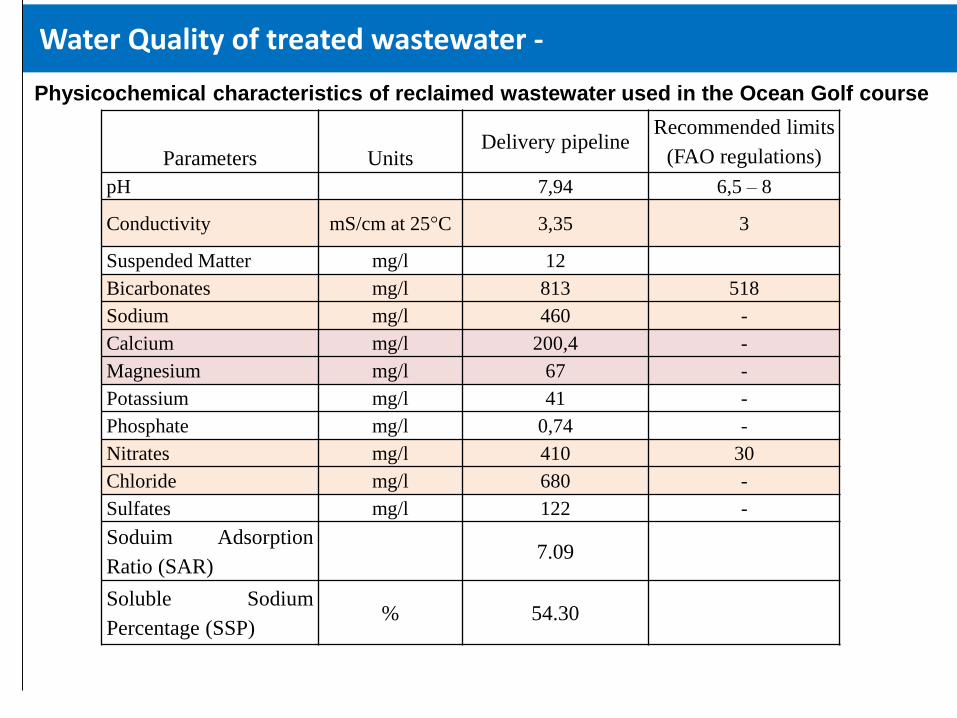
Water Quality of treated wastewater -
Parameters UnitsDelivery pipeline
Recommended limits
(FAO regulations)
pH 7,94 6,5 – 8
Conductivity mS/cm at 25°C 3,35 3
Suspended Matter mg/l 12
Bicarbonates mg/l 813 518
Sodium mg/l 460 -
Calcium mg/l 200,4 -
Magnesium mg/l 67 -
Potassium mg/l 41 -
Phosphate mg/l 0,74 -
Nitrates mg/l 410 30
Chloride mg/l 680 -
Sulfates mg/l 122 -
Soduim Adsorption
Ratio (SAR)7.09
Soluble Sodium
Percentage (SSP)% 54.30
Physicochemical characteristics of reclaimed wastewater used in the Ocean Golf course
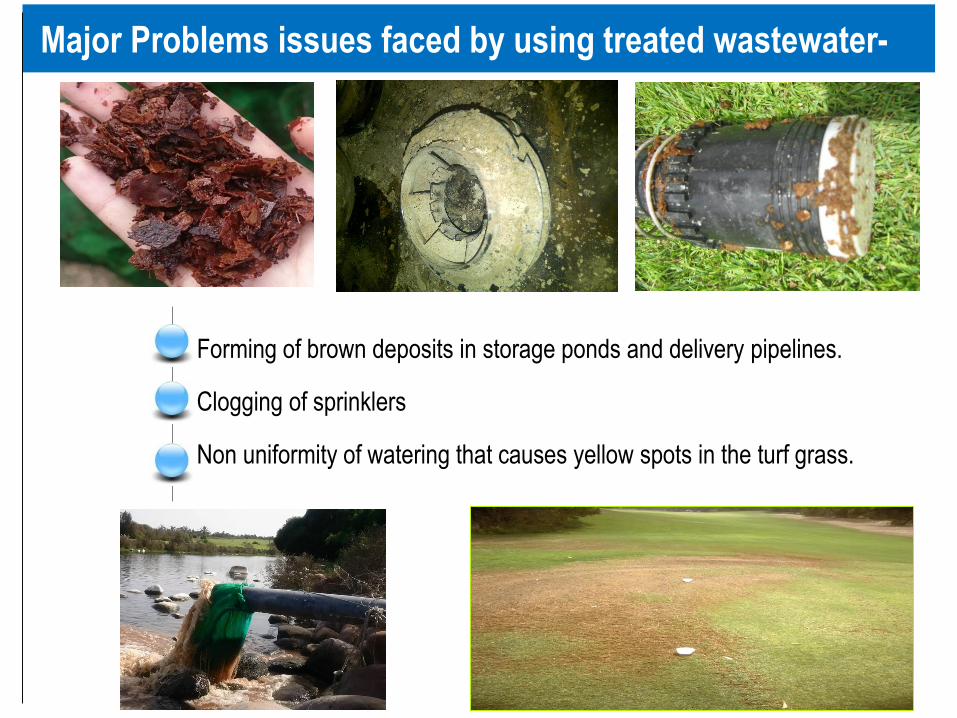
Major Problems issues faced by using treated wastewater-
Forming of brown deposits in storage ponds and delivery pipelines.
Clogging of sprinklers
Non uniformity of watering that causes yellow spots in the turf grass.
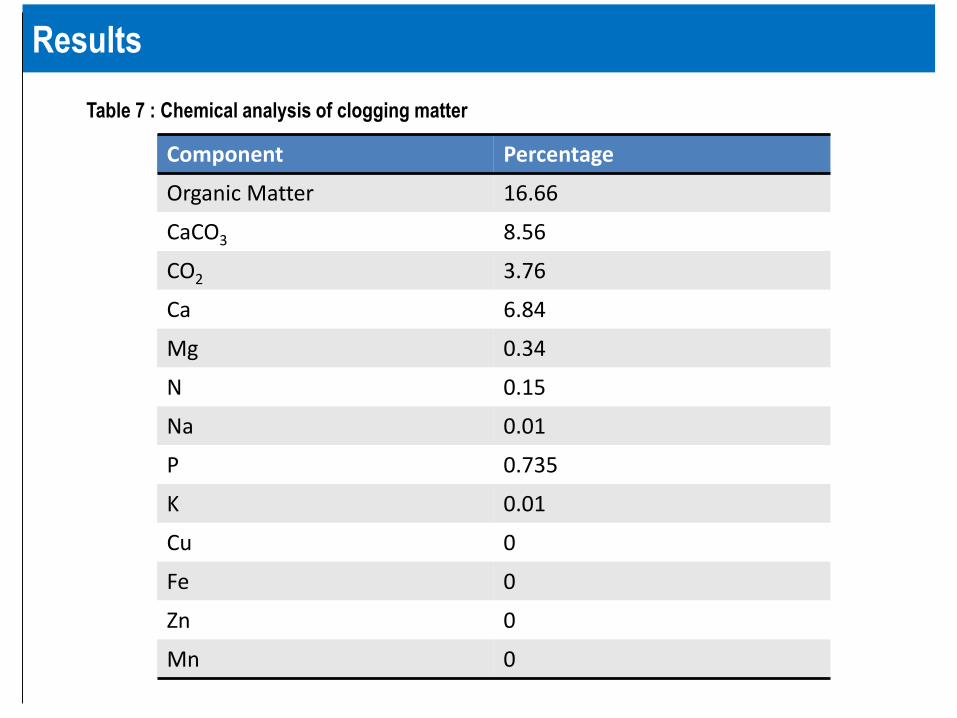
Results
Table 7 : Chemical analysis of clogging matter
Component Percentage
Organic Matter 16.66
CaCO3 8.56
CO2 3.76
Ca 6.84
Mg 0.34
N 0.15
Na 0.01
P 0.735
K 0.01
Cu 0
Fe 0
Zn 0
Mn 0
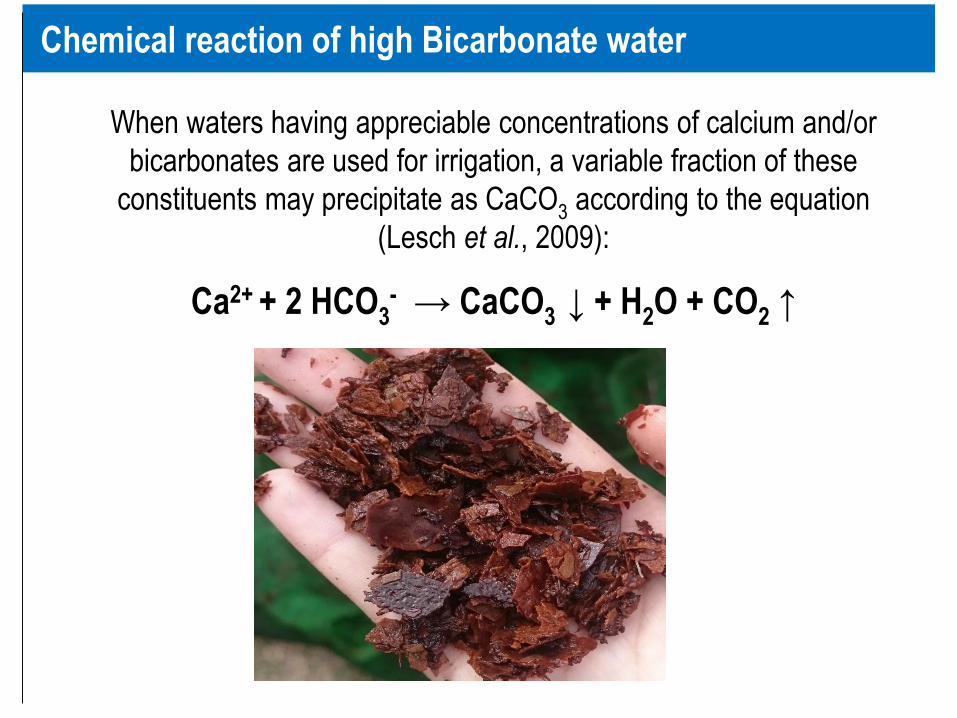
Chemical reaction of high Bicarbonate water
When waters having appreciable concentrations of calcium and/or
bicarbonates are used for irrigation, a variable fraction of these
constituents may precipitate as CaCO3 according to the equation
(Lesch et al., 2009):
Ca2+ + 2 HCO3- → CaCO3 ↓ + H2O + CO2 ↑
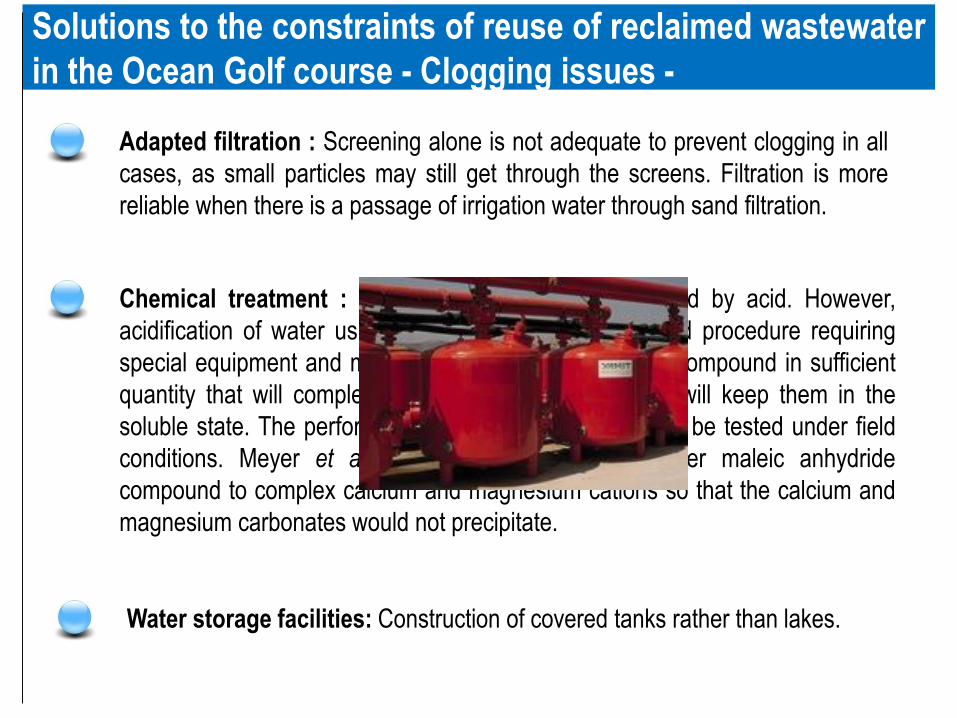
Solutions to the constraints of reuse of reclaimed wastewater
in the Ocean Golf course - Clogging issues -
Adapted filtration : Screening alone is not adequate to prevent clogging in all
cases, as small particles may still get through the screens. Filtration is more
reliable when there is a passage of irrigation water through sand filtration.
Chemical treatment : Lime precipitation can be treated by acid. However,
acidification of water using acid injection is a specialized procedure requiring
special equipment and may be costly. Theoretically any compound in sufficient
quantity that will complex other ions with low solubility will keep them in the
soluble state. The performance of such compounds must be tested under field
conditions. Meyer et al. (1991) used the homopolymer maleic anhydride
compound to complex calcium and magnesium cations so that the calcium and
magnesium carbonates would not precipitate.
Water storage facilities: Construction of covered tanks rather than lakes.
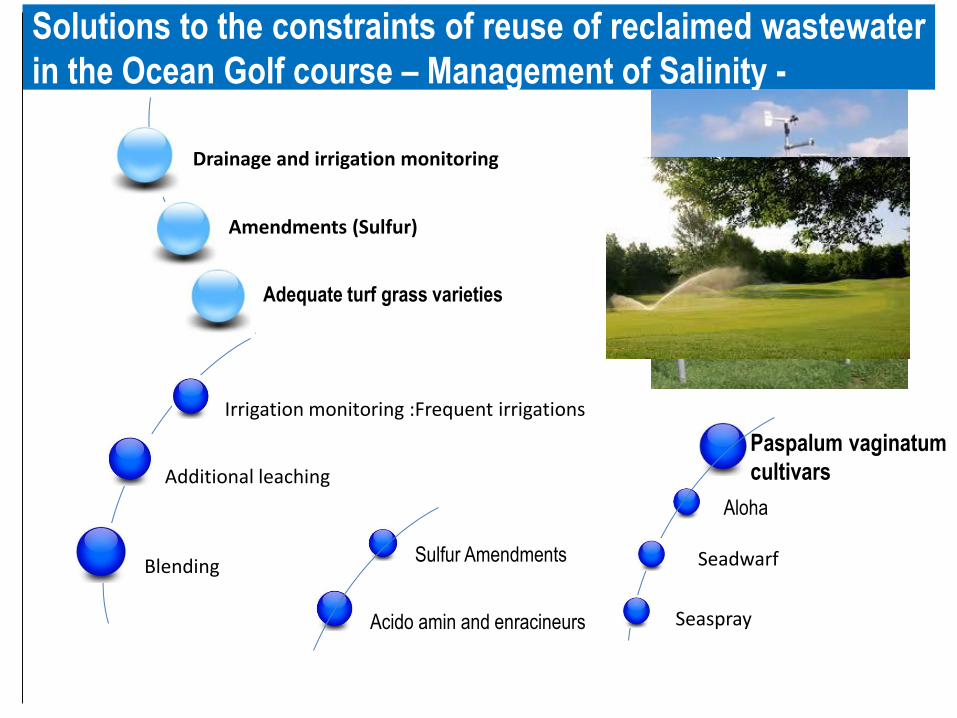
Solutions to the constraints of reuse of reclaimed wastewater
in the Ocean Golf course – Management of Salinity -
Drainage and irrigation monitoring
Irrigation monitoring :Frequent irrigations
Additional leaching
Blending
Amendments (Sulfur)
Sulfur Amendments
Acido amin and enracineurs
Adequate turf grass varieties
Paspalum vaginatum
cultivars
Aloha
Seadwarf
Seaspray
Thanks for your attention !
1st GLOBAQUA CONFERENCE: Managing The Effects Of Multiple Stressors On Aquatic Ecosystems Under Water Scarcity
11–12 January 2016, Freising, Germany.
Globaqua Conference Freising , 11-12 Jan 2016
Participative valuation of
ecosystem services
Philippe Ker Rault, Joke Luttik (WP10)
How do stakeholders perceive
ecosystem services and functioning
at the river basin level?
Globaqua Conference 11-12 Jan 2016
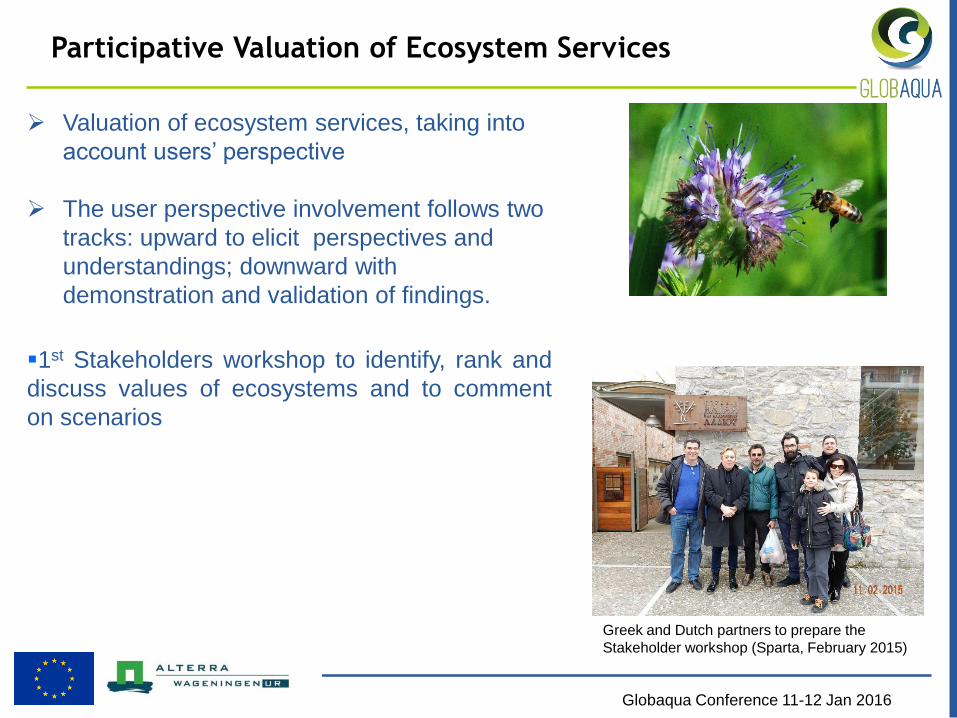
Participative Valuation of Ecosystem Services
Valuation of ecosystem services, taking into
account users’ perspective
The user perspective involvement follows two
tracks: upward to elicit perspectives and
understandings; downward with
demonstration and validation of findings.
1st Stakeholders workshop to identify, rank and
discuss values of ecosystems and to comment
on scenarios
Greek and Dutch partners to prepare the
Stakeholder workshop (Sparta, February 2015)
Globaqua Conference 11-12 Jan 2016
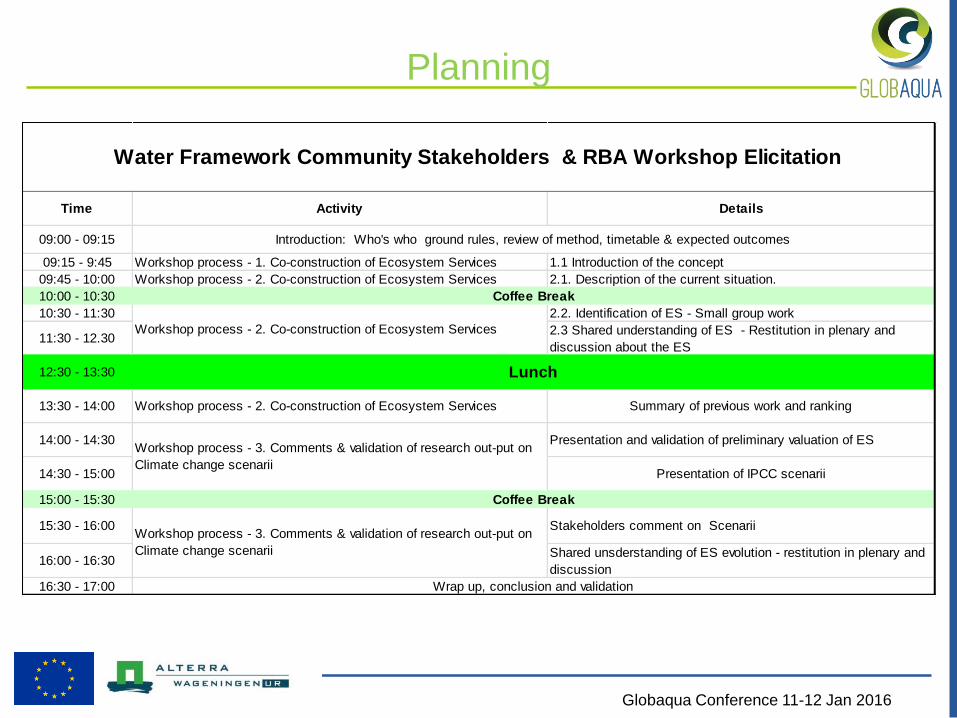
Planning
Time Activity Details
09:00 - 09:15
09:15 - 9:45 Workshop process - 1. Co-construction of Ecosystem Services 1.1 Introduction of the concept
09:45 - 10:00 Workshop process - 2. Co-construction of Ecosystem Services 2.1. Description of the current situation.
10:00 - 10:30
10:30 - 11:30 2.2. Identification of ES - Small group work
11:30 - 12.302.3 Shared understanding of ES - Restitution in plenary and
discussion about the ES
12:30 - 13:30
13:30 - 14:00 Workshop process - 2. Co-construction of Ecosystem Services Summary of previous work and ranking
14:00 - 14:30 Presentation and validation of preliminary valuation of ES
14:30 - 15:00 Presentation of IPCC scenarii
15:00 - 15:30
15:30 - 16:00 Stakeholders comment on Scenarii
16:00 - 16:30Shared unsderstanding of ES evolution - restitution in plenary and
discussion
16:30 - 17:00 Wrap up, conclusion and validation
Water Framework Community Stakeholders & RBA Workshop Elicitation
Introduction: Who's who ground rules, review of method, timetable & expected outcomes
Coffee Break
Workshop process - 2. Co-construction of Ecosystem Services
Lunch
Workshop process - 3. Comments & validation of research out-put on
Climate change scenarii
Coffee Break
Workshop process - 3. Comments & validation of research out-put on
Climate change scenarii
Globaqua Conference 11-12 Jan 2016
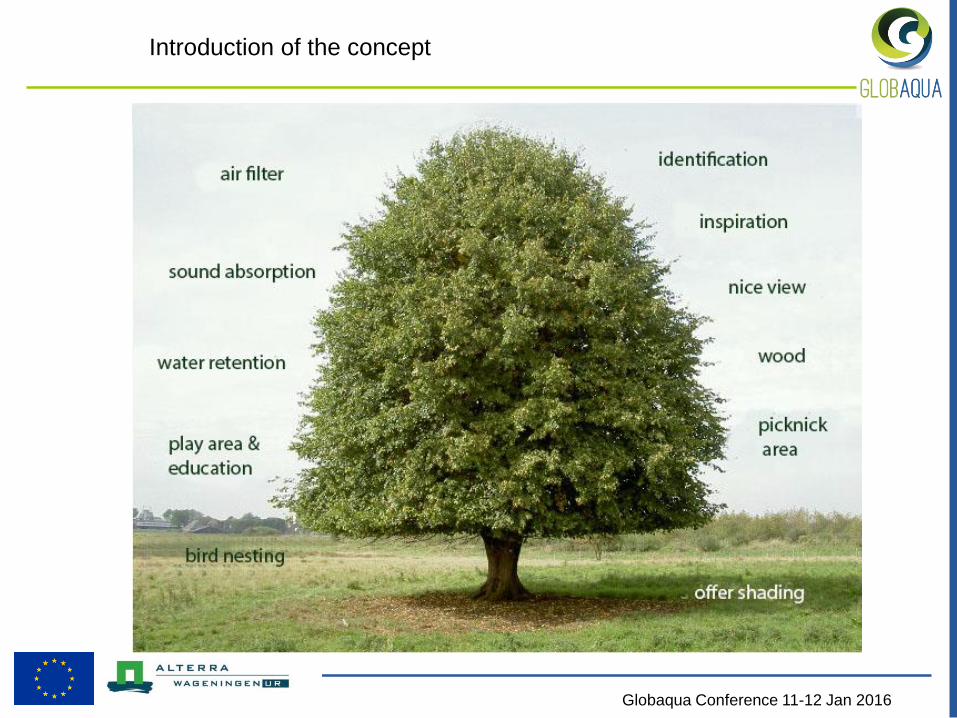
Introduction of the concept
Globaqua Conference 11-12 Jan 2016
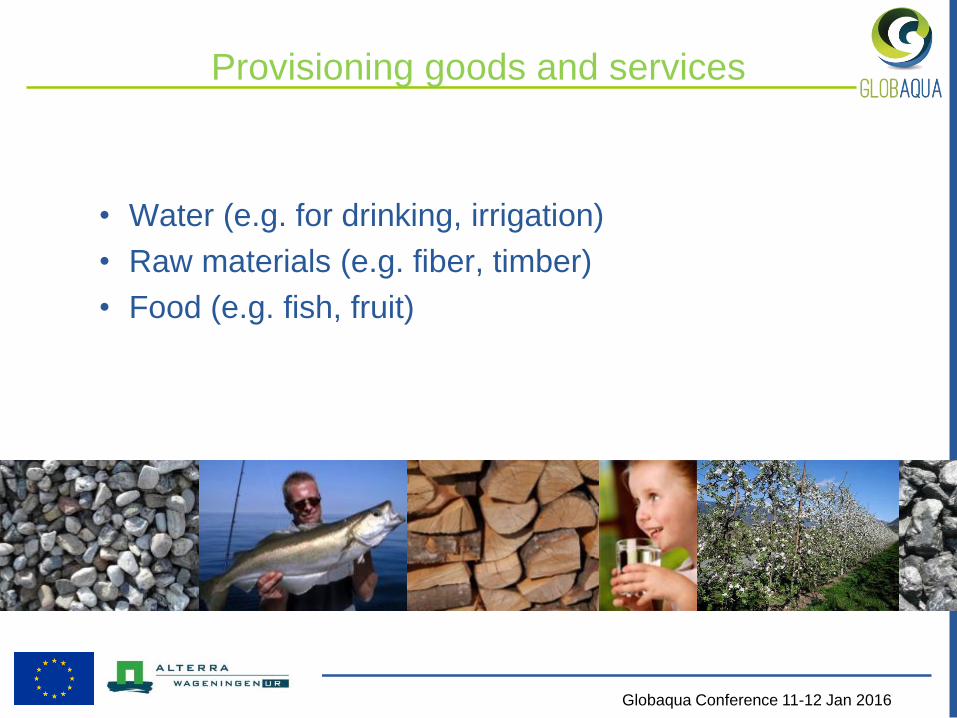
Provisioning goods and services
• Water (e.g. for drinking, irrigation)
• Raw materials (e.g. fiber, timber)
• Food (e.g. fish, fruit)

Globaqua Conference 11-12 Jan 2016
Regulating services
• Climate regulation – global and local level
• Moderation of extreme events (floods & droughts)
• Regulation of water flows
• Waste treatment
• Soil erosion prevention
• Many more....
• Climate regulation
• Moderation of extreme events
• Regulation of water flows
• Waste treatment
• Erosion prevention
• Maintenance of soil fertility
• Pollination
Globaqua Conference 11-12 Jan 2016
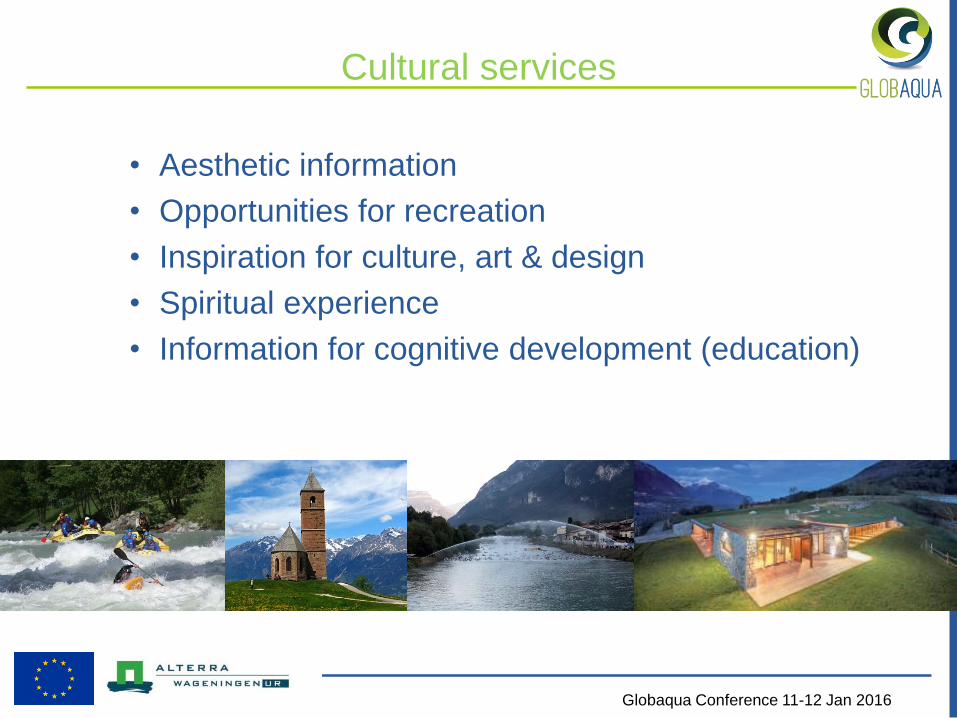
Cultural services
• Aesthetic information
• Opportunities for recreation
• Inspiration for culture, art & design
• Spiritual experience
• Information for cognitive development (education)
Globaqua Conference 11-12 Jan 2016
Globaqua Conference 11-12 Jan 2016
Monetary valuation
• Builds on biophysical information on the services provided by
ecosystems to derive values
• E.g. a change in carbon storage in wetland (t CO2/km2) can be
converted to values by multiplying it by the carbon price in
international markets
• Prices from other studies (benefit transfers), where possible refined
with data collected in case study areas (in a participatory approach)
Globaqua Conference 11-12 Jan 2016
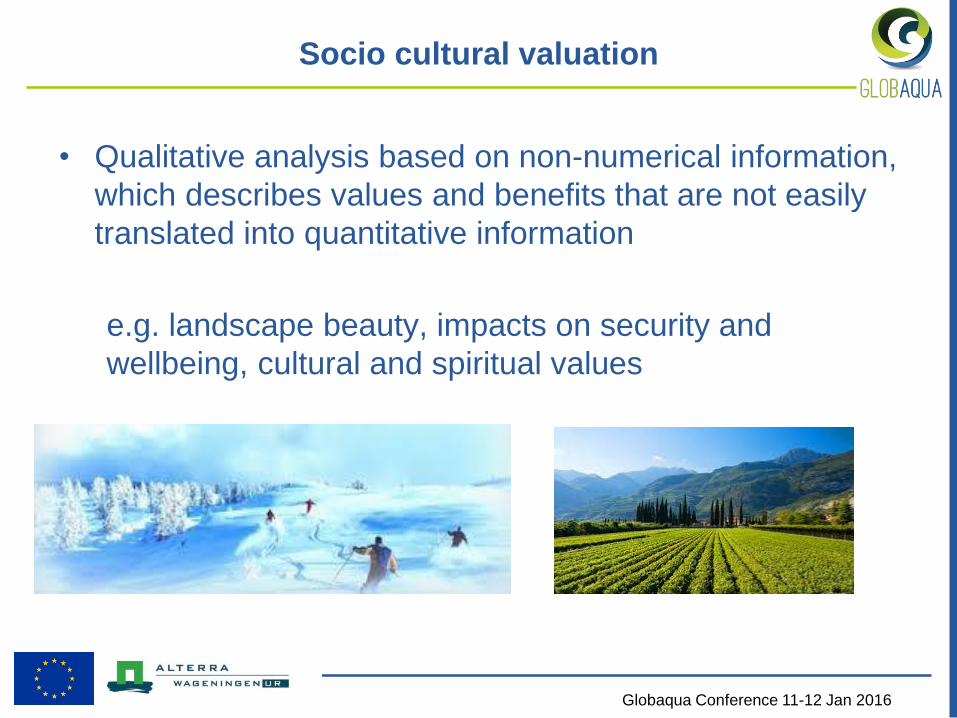
Socio cultural valuation
• Qualitative analysis based on non-numerical information,
which describes values and benefits that are not easily
translated into quantitative information
e.g. landscape beauty, impacts on security and
wellbeing, cultural and spiritual values
Globaqua Conference 11-12 Jan 2016
Stakeholders & ecosystem services valuation
• Identification of important ecosystem services in case
study areas by key stakeholders
• The outcome of the valuation process depends on what
the various stakeholders value, whose values count,
who benefits ...
• Valuation reveals multiple benefits and reveals
opportunities for co-operation between stakeholders
• Communication tool
Globaqua Conference 11-12 Jan 2016
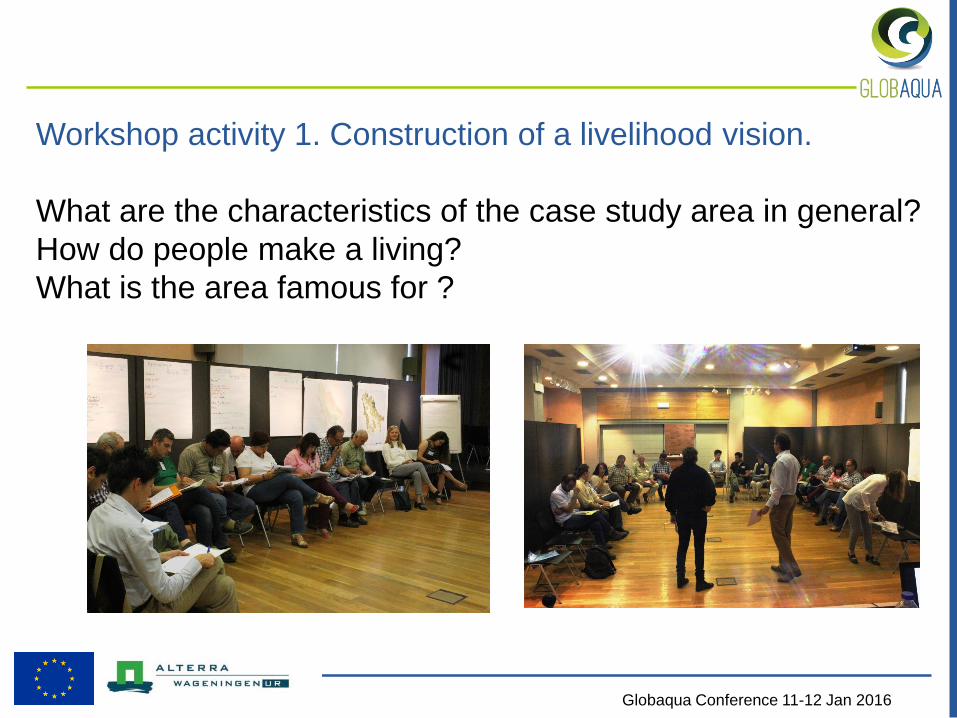
Workshop activity 1. Construction of a livelihood vision.
What are the characteristics of the case study area in general?
How do people make a living?
What is the area famous for ?
Globaqua Conference 11-12 Jan 2016
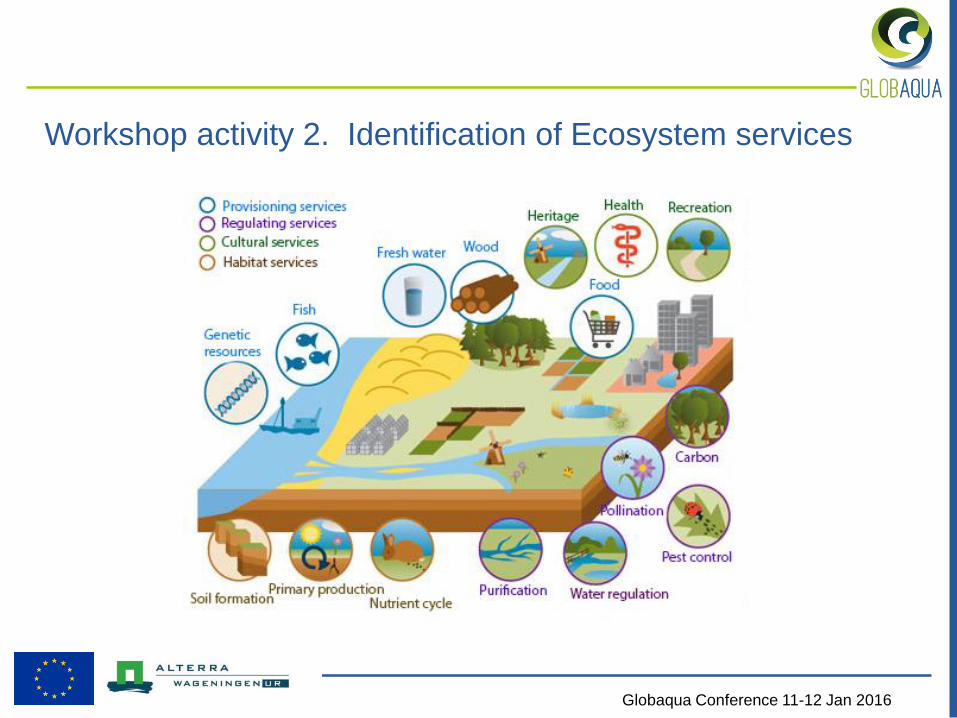
Workshop activity 2. Identification of Ecosystem services
Globaqua Conference 11-12 Jan 2016
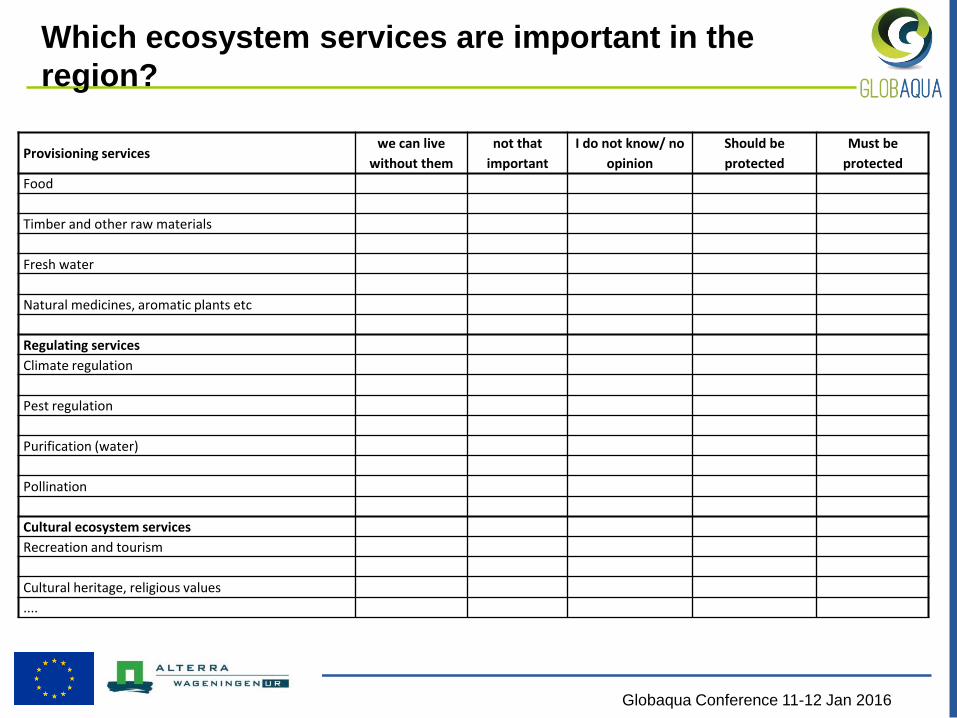
Which ecosystem services are important in the
region?
Provisioning services we can live
without them
not that
important
I do not know/ no
opinion
Should be
protected
Must be
protected
Food
Timber and other raw materials
Fresh water
Natural medicines, aromatic plants etc
Regulating services
Climate regulation
Pest regulation
Purification (water)
Pollination
Cultural ecosystem services
Recreation and tourism
Cultural heritage, religious values
....
Globaqua Conference 11-12 Jan 2016
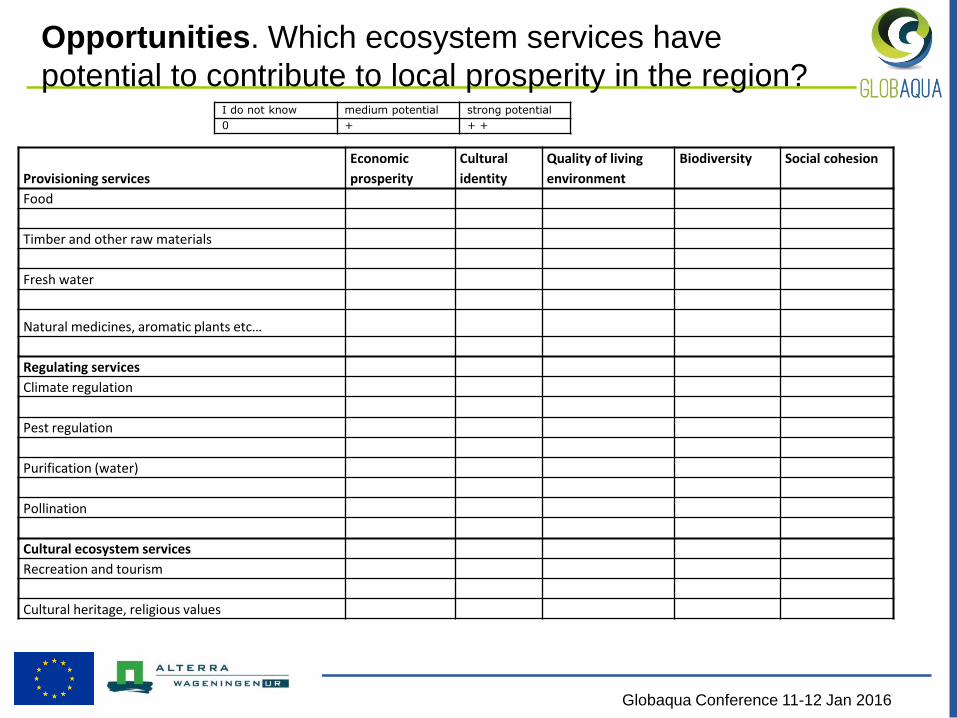
Opportunities. Which ecosystem services have
potential to contribute to local prosperity in the region? I do not know medium potential strong potential
0 + + +
Provisioning services
Economic
prosperity
Cultural
identity
Quality of living
environment
Biodiversity Social cohesion
Food
Timber and other raw materials
Fresh water
Natural medicines, aromatic plants etc…
Regulating services
Climate regulation
Pest regulation
Purification (water)
Pollination
Cultural ecosystem services
Recreation and tourism
Cultural heritage, religious values
Globaqua Conference 11-12 Jan 2016
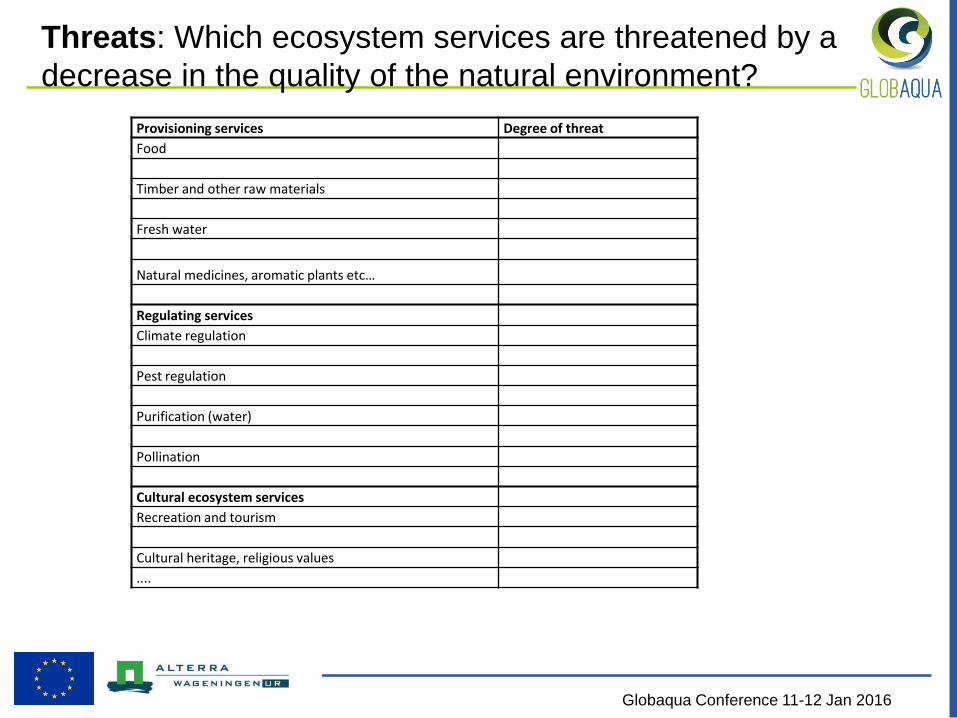
Threats: Which ecosystem services are threatened by a
decrease in the quality of the natural environment?
Provisioning services Degree of threat
Food
Timber and other raw materials
Fresh water
Natural medicines, aromatic plants etc…
Regulating services
Climate regulation
Pest regulation
Purification (water)
Pollination
Cultural ecosystem services
Recreation and tourism
Cultural heritage, religious values
....
Globaqua Conference 11-12 Jan 2016
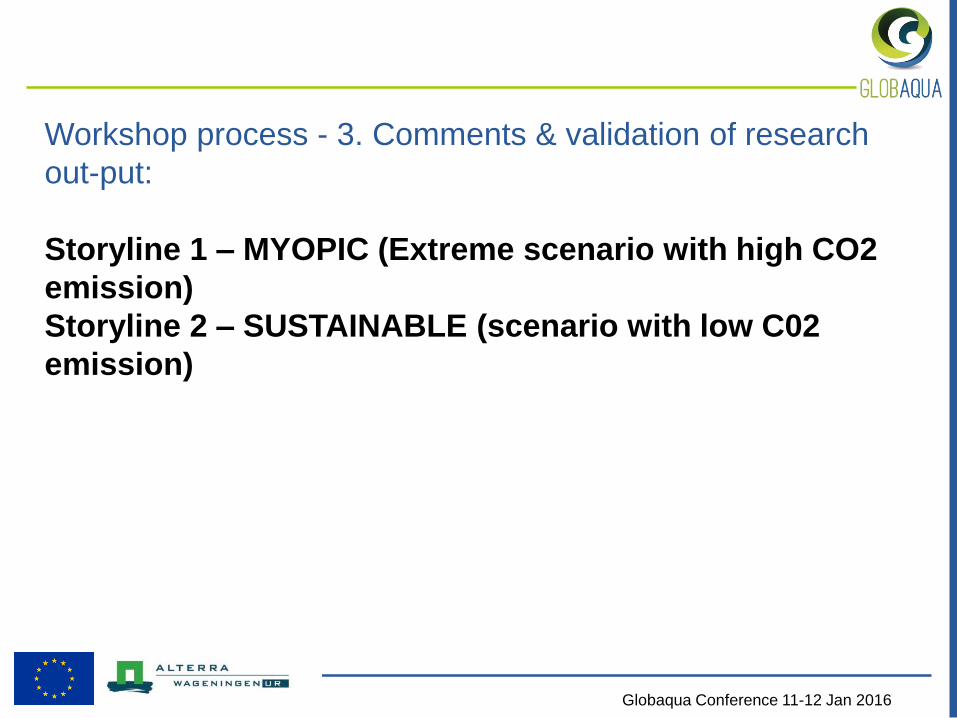
Workshop process - 3. Comments & validation of research
out-put:
Storyline 1 – MYOPIC (Extreme scenario with high CO2
emission)
Storyline 2 – SUSTAINABLE (scenario with low C02
emission)
Globaqua Conference 11-12 Jan 2016
THANK YOU
1st GLOBAQUA International Conference
Change in terrestrial and aquatic habitat quality in South-European river basins
under future irrigation scenarios
Marta Terrado, Laura Vergoñós, Sergi Sabater, Leonidas Vardakas, Momir Paunović and Vicenç Acuña
Catalan Institute for Water Research (ICRA), Girona, SpainHellenic Center for Marine Research, Attica, GreeceUniversity of Belgrade, Serbia
1st GLOBAQUA International Conference
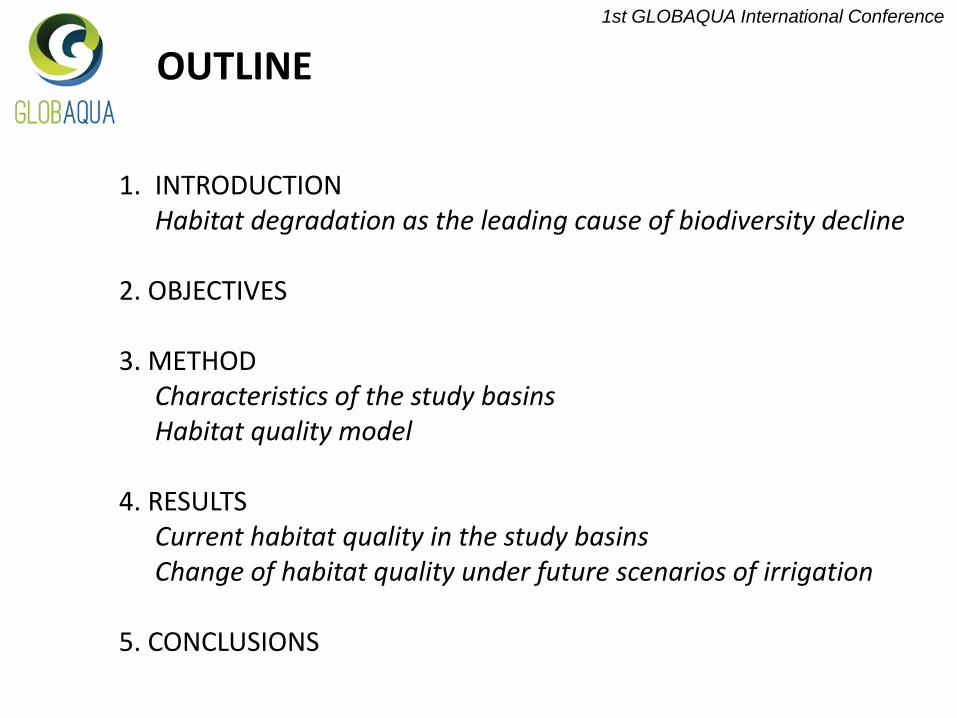
OUTLINE
1. INTRODUCTIONHabitat degradation as the leading cause of biodiversity decline
2. OBJECTIVES
3. METHODCharacteristics of the study basinsHabitat quality model
4. RESULTSCurrent habitat quality in the study basinsChange of habitat quality under future scenarios of irrigation
5. CONCLUSIONS
1st GLOBAQUA International Conference
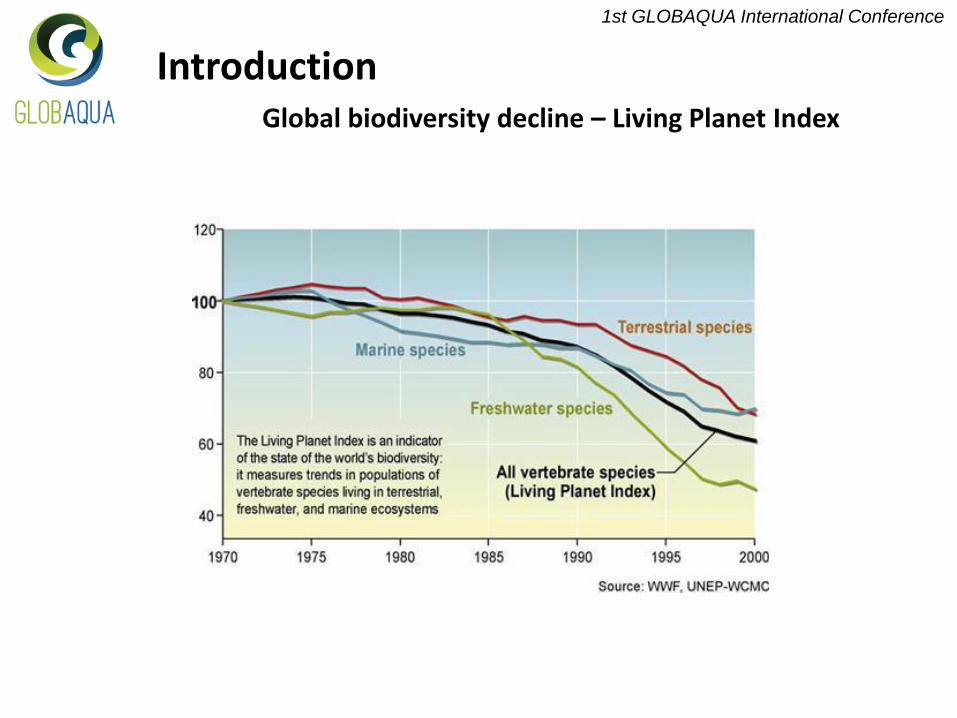
IntroductionGlobal biodiversity decline – Living Planet Index
1st GLOBAQUA International Conference
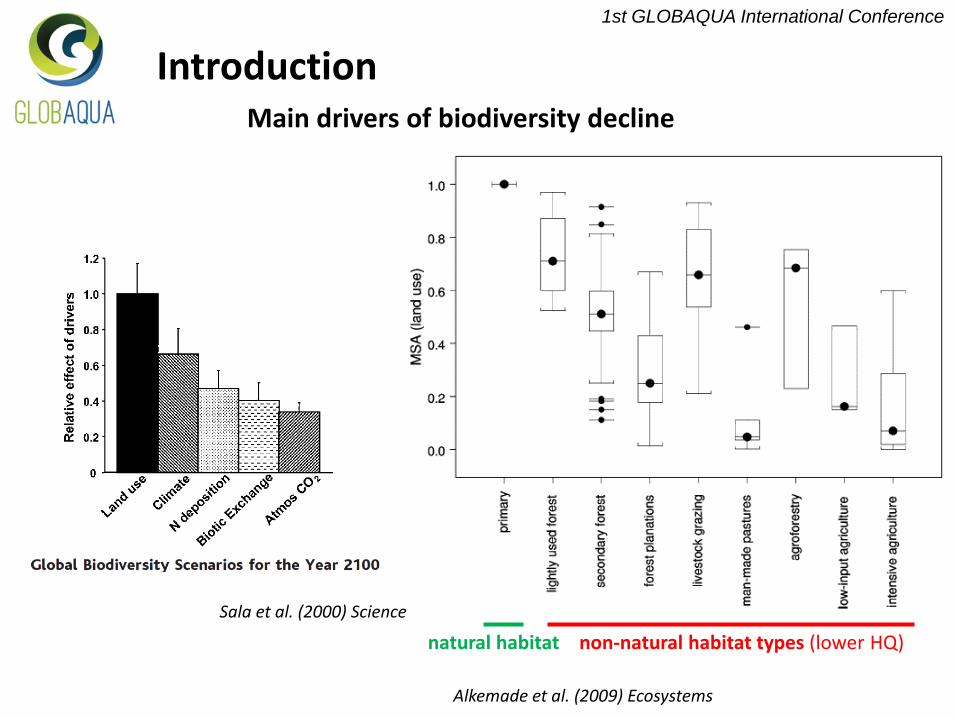
Main drivers of biodiversity decline
Introduction
Alkemade et al. (2009) Ecosystems
non-natural habitat types (lower HQ)natural habitat
Sala et al. (2000) Science
1st GLOBAQUA International Conference
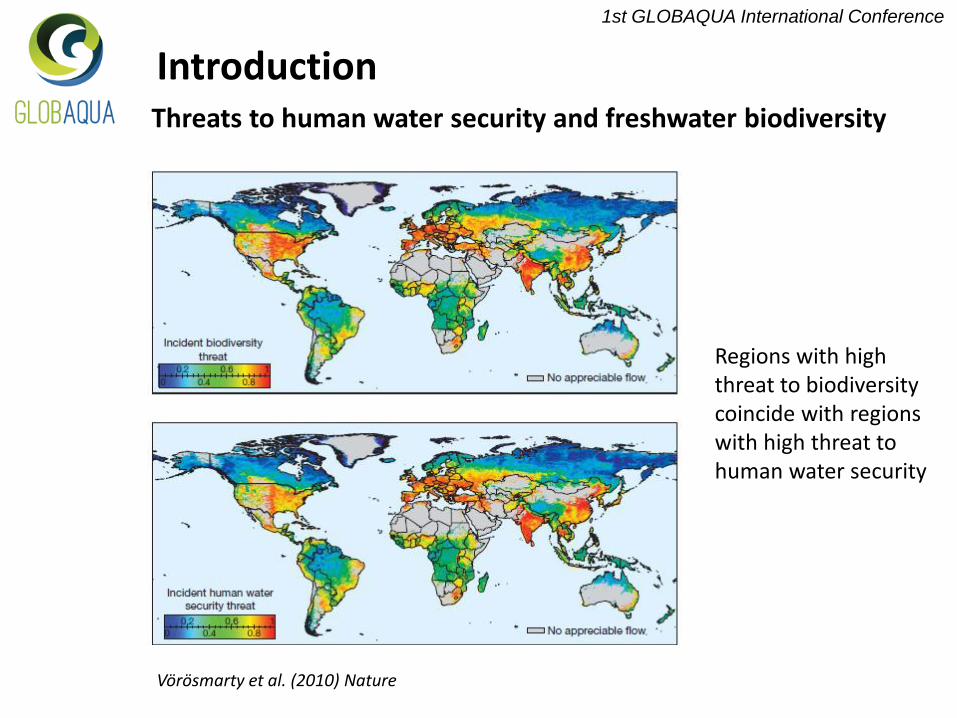
Threats to human water security and freshwater biodiversity
Introduction
Vörösmarty et al. (2010) Nature
Regions with high threat to biodiversity coincide with regions with high threat to human water security
1st GLOBAQUA International Conference
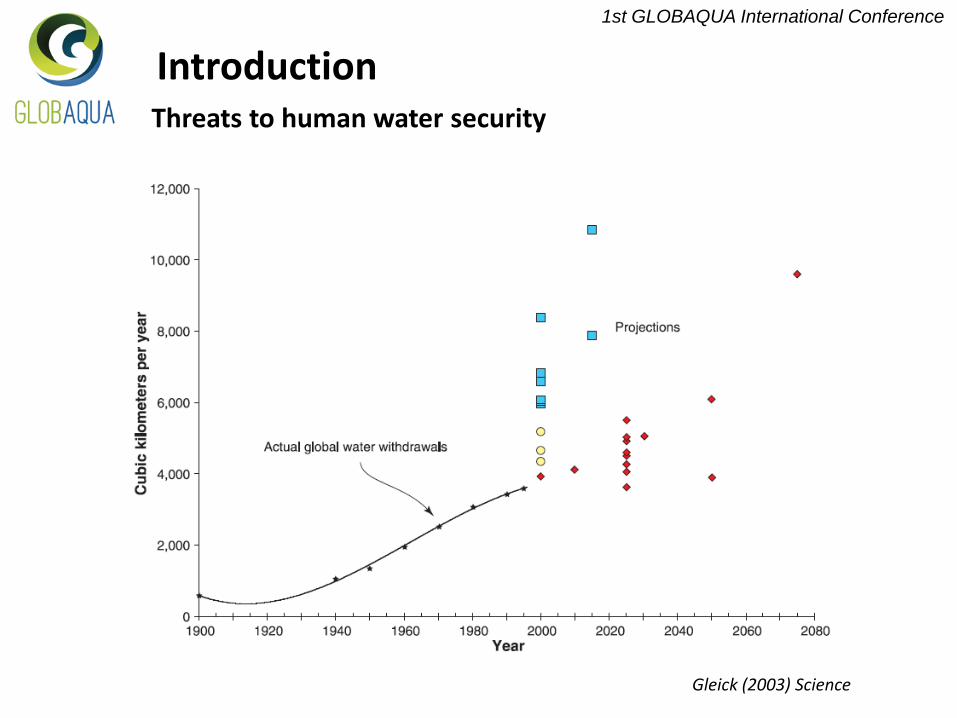
Threats to human water security
Introduction
Gleick (2003) Science
1st GLOBAQUA International Conference
Objectives
1. Assess the current habitat quality in river basins affected by different levels of threats
2. Identify which type of regions are expected to be more vulnerable to habitat degradation under future scenarios (i.e. level of water scarcity, irrigated areas…), and therefore, more prone to biodiversity loss
1st GLOBAQUA International Conference
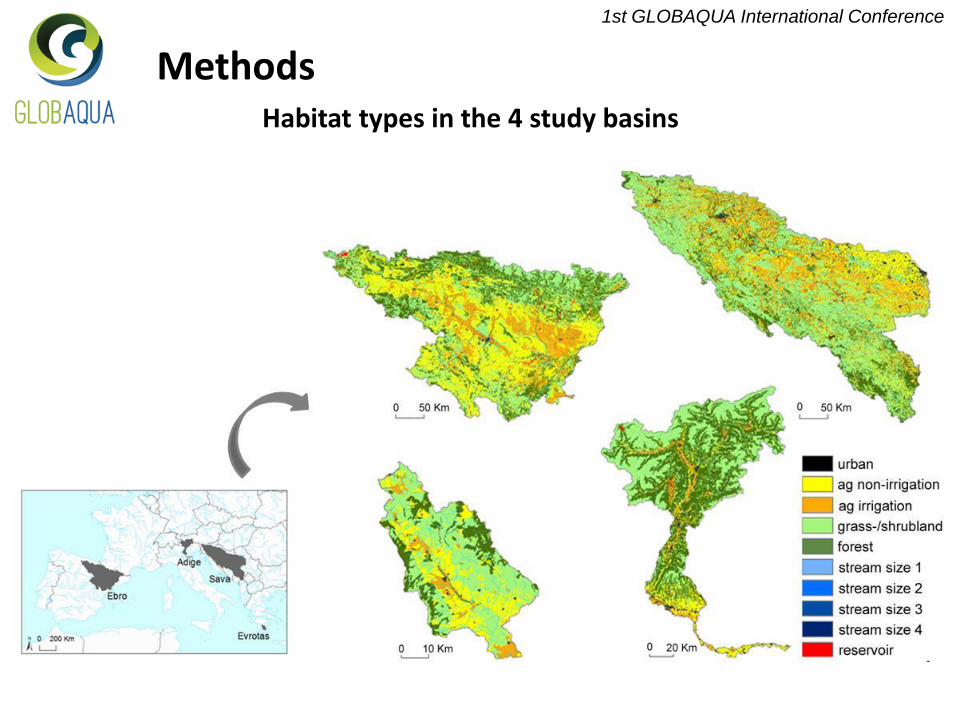
MethodsHabitat types in the 4 study basins
1st GLOBAQUA International Conference
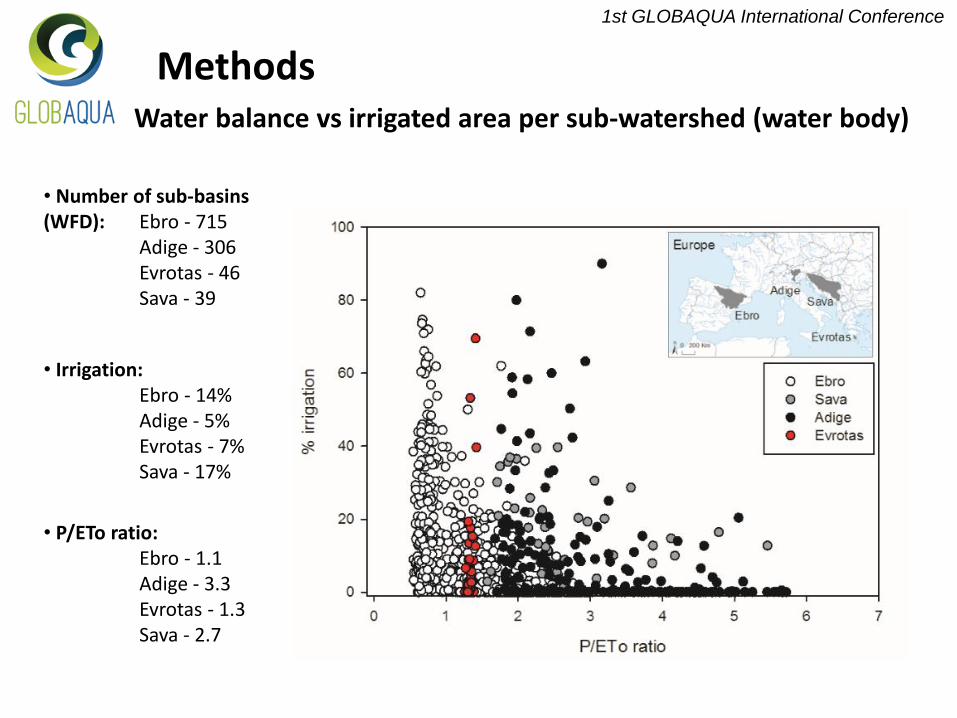
MethodsWater balance vs irrigated area per sub-watershed (water body)
• Irrigation: Ebro - 14%Adige - 5%Evrotas - 7%Sava - 17%
• Number of sub-basins (WFD): Ebro - 715
Adige - 306Evrotas - 46Sava - 39
• P/ETo ratio: Ebro - 1.1Adige - 3.3Evrotas - 1.3Sava - 2.7
1st GLOBAQUA International Conference
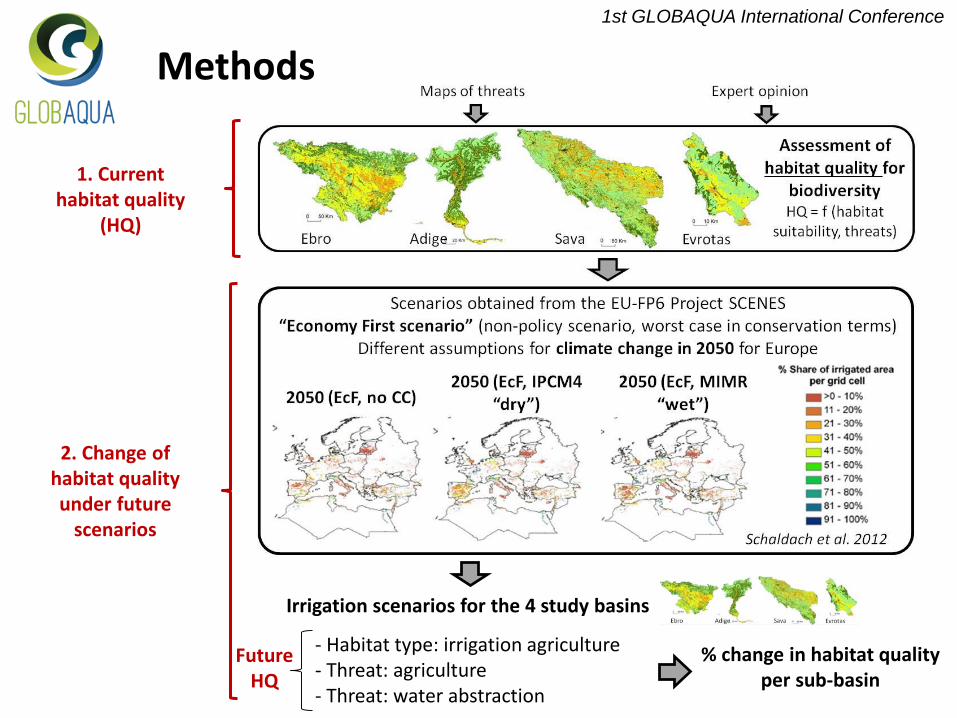
Methods
1. Currenthabitat quality
(HQ)
% change in habitat qualityper sub-basin
2. Change of habitat qualityunder future
scenarios
- Habitat type: irrigation agriculture- Threat: agriculture- Threat: water abstraction
Irrigation scenarios for the 4 study basins
FutureHQ
1st GLOBAQUA International Conference
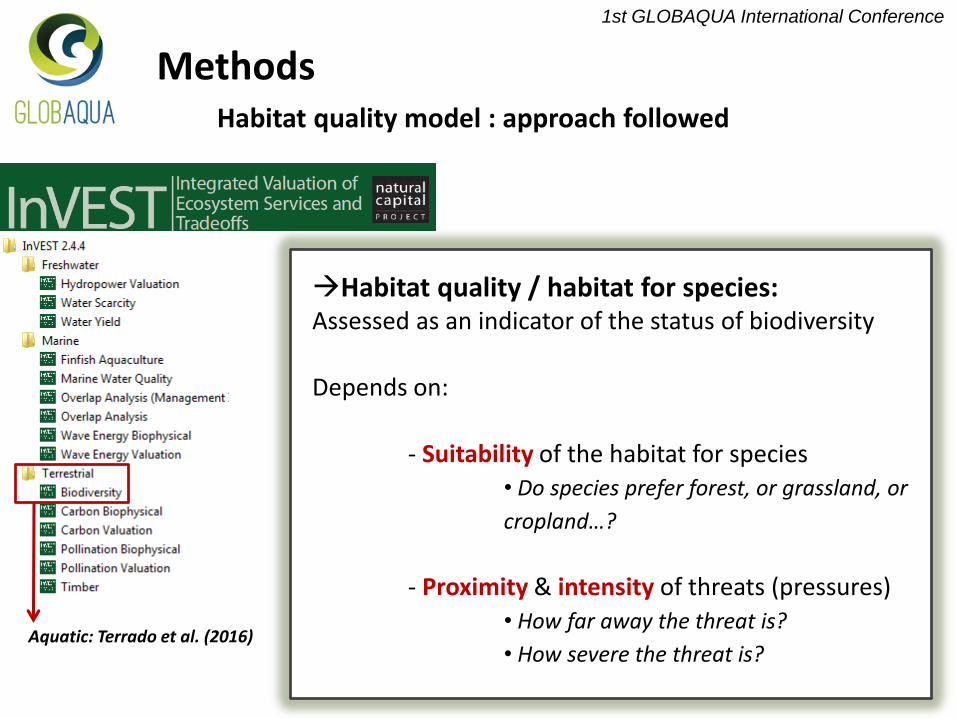
MethodsHabitat quality model : approach followed
Habitat quality / habitat for species: Assessed as an indicator of the status of biodiversity
Depends on:
- Suitability of the habitat for species• Do species prefer forest, or grassland, or
cropland…?
- Proximity & intensity of threats (pressures)
• How far away the threat is?
• How severe the threat is?Aquatic: Terrado et al. (2016)
1st GLOBAQUA International Conference
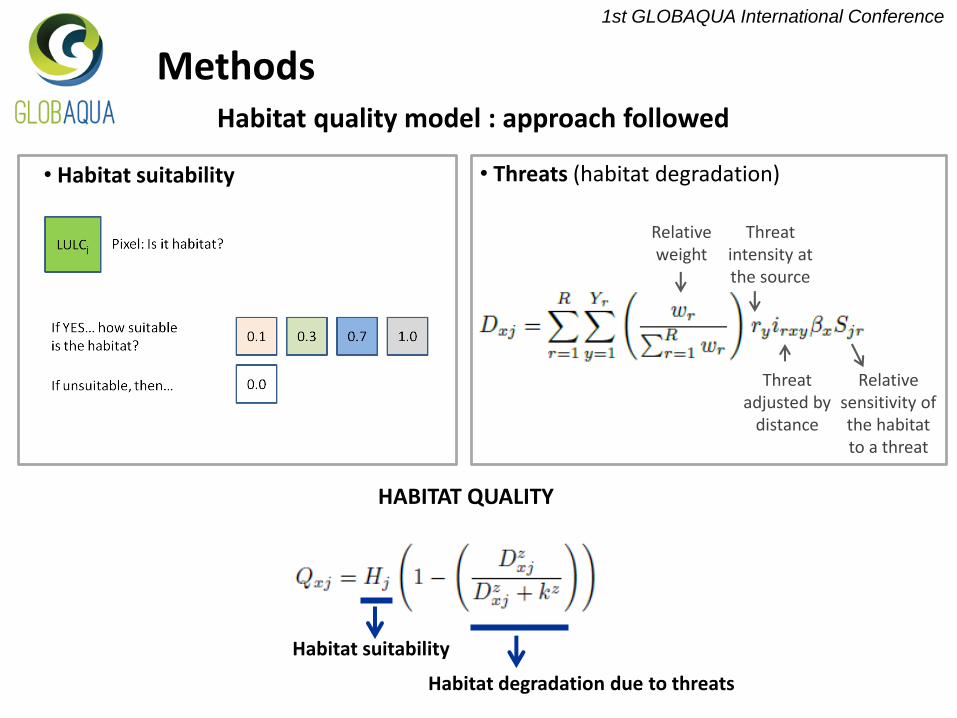
Methods
• Habitat suitability • Threats (habitat degradation)
Relative weight
Threat intensity at the source
Threat adjusted by
distance
Relative sensitivity of the habitat to a threat
HABITAT QUALITY
Habitat suitability
Habitat degradation due to threats
Habitat quality model : approach followed
1st GLOBAQUA International Conference
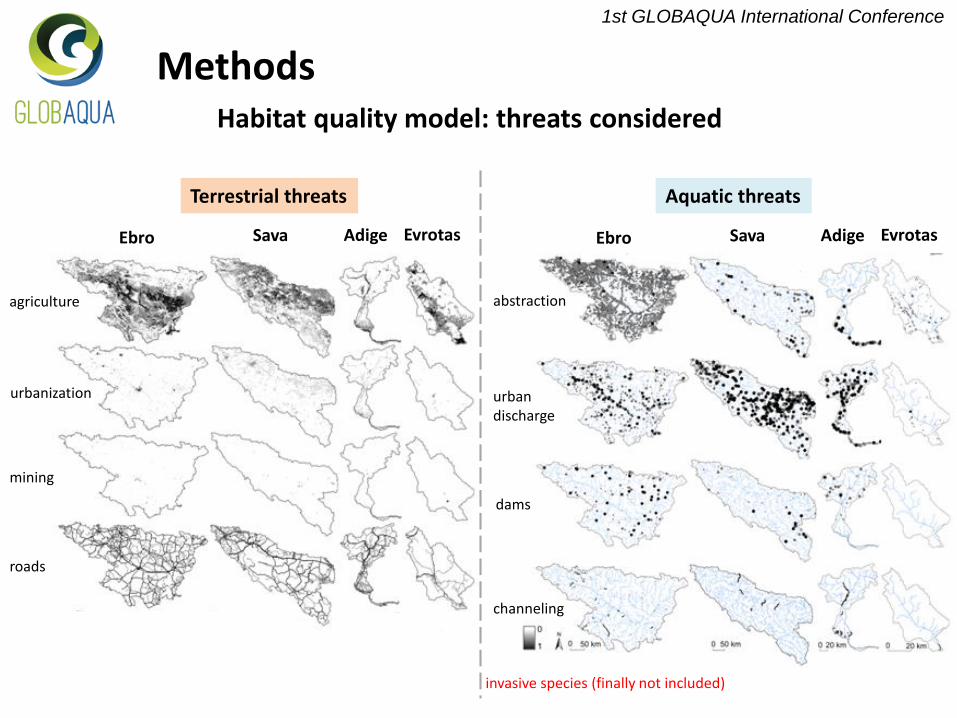
MethodsHabitat quality model: threats considered
Ebro Sava Adige Evrotas
Terrestrial threats
agriculture
urbanization
mining
roads
Ebro Sava Adige Evrotas
Aquatic threats
abstraction
urban discharge
dams
channeling
invasive species (finally not included)
1st GLOBAQUA International Conference
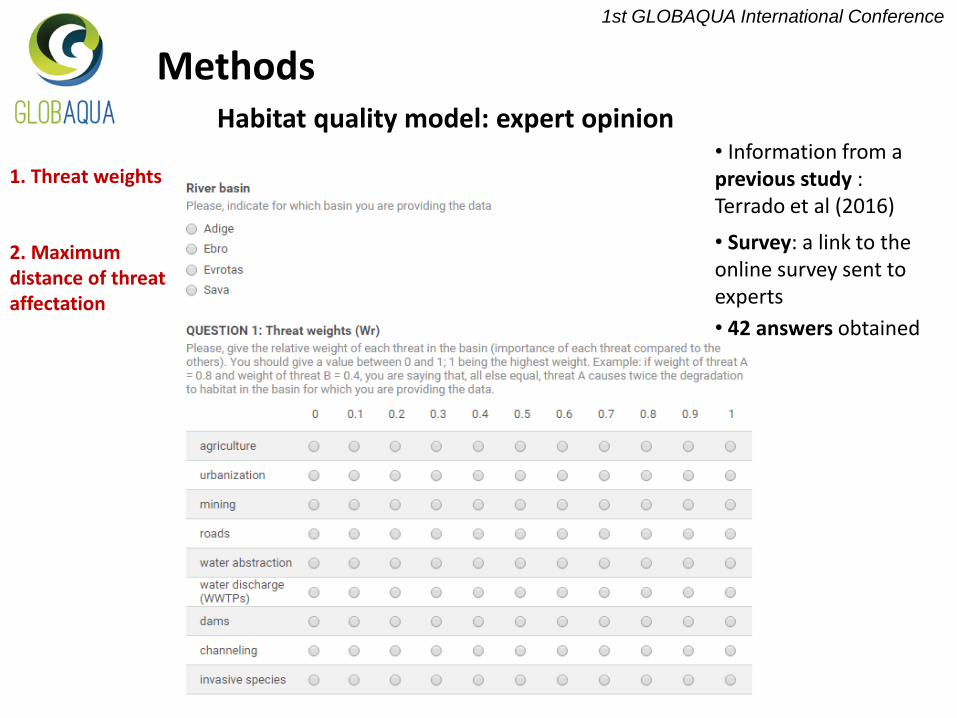
MethodsHabitat quality model: expert opinion
1. Threat weights
2. Maximumdistance of threataffectation
• Survey: a link to theonline survey sent toexperts
• 42 answers obtained
• Information from a previous study : Terrado et al (2016)
1st GLOBAQUA International Conference
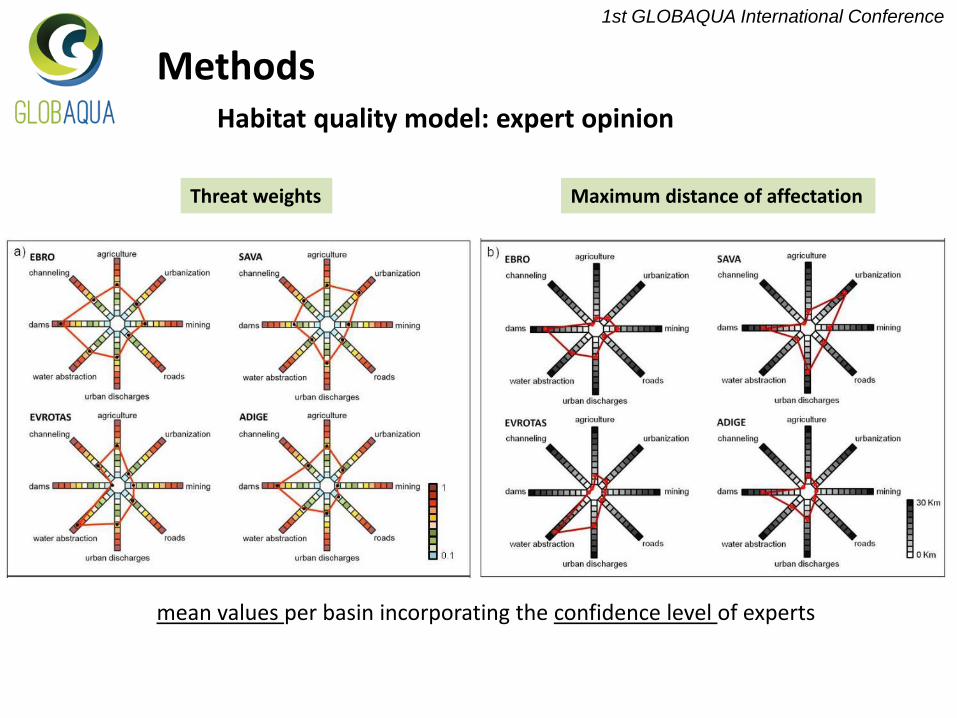
Methods
Maximum distance of affectationThreat weights
mean values per basin incorporating the confidence level of experts
Habitat quality model: expert opinion
1st GLOBAQUA International Conference
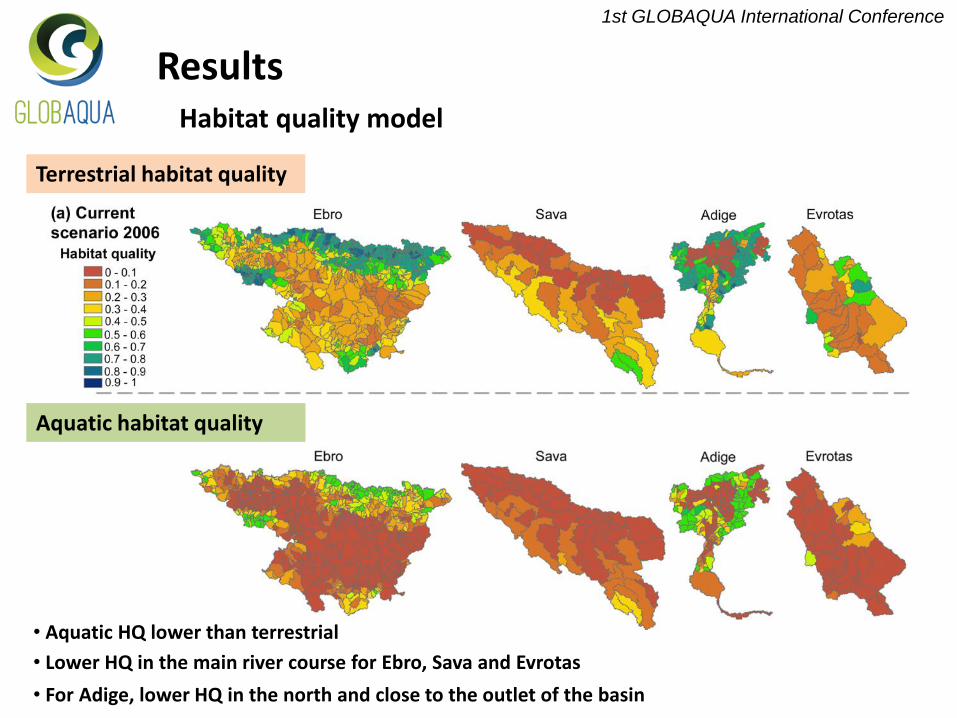
Results
Terrestrial habitat quality
Aquatic habitat quality
Habitat quality model
• For Adige, lower HQ in the north and close to the outlet of the basin
• Aquatic HQ lower than terrestrial
• Lower HQ in the main river course for Ebro, Sava and Evrotas
1st GLOBAQUA International Conference
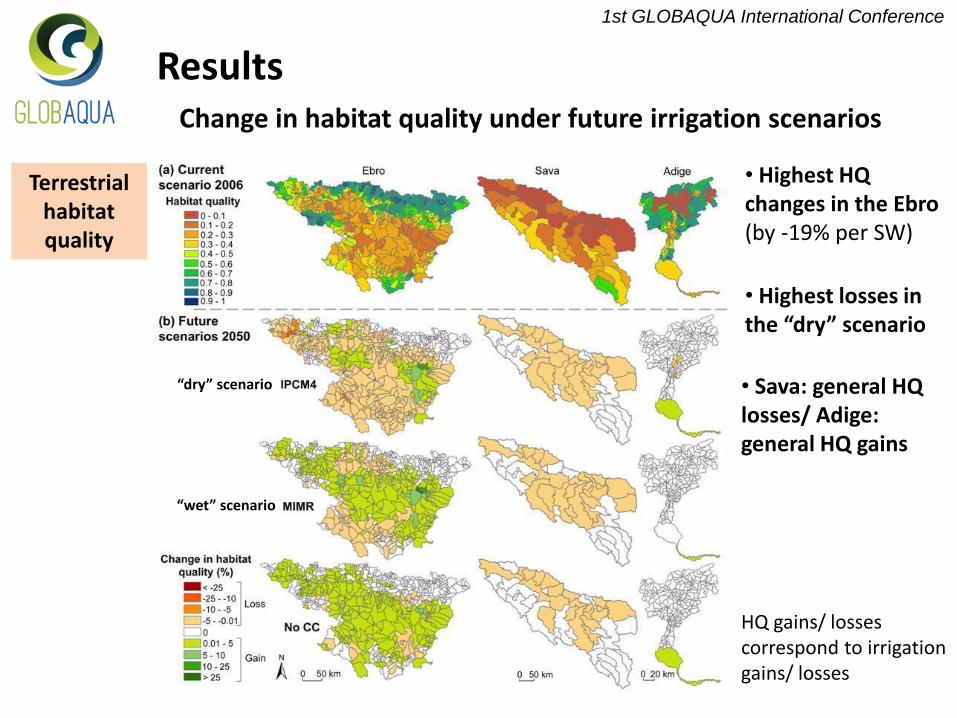
ResultsChange in habitat quality under future irrigation scenarios
Terrestrial habitat quality
• Highest HQ changes in the Ebro (by -19% per SW)
• Highest losses in the “dry” scenario
• Sava: general HQ losses/ Adige: general HQ gains
HQ gains/ losses correspond to irrigation gains/ losses
“dry” scenario
“wet” scenario
1st GLOBAQUA International Conference
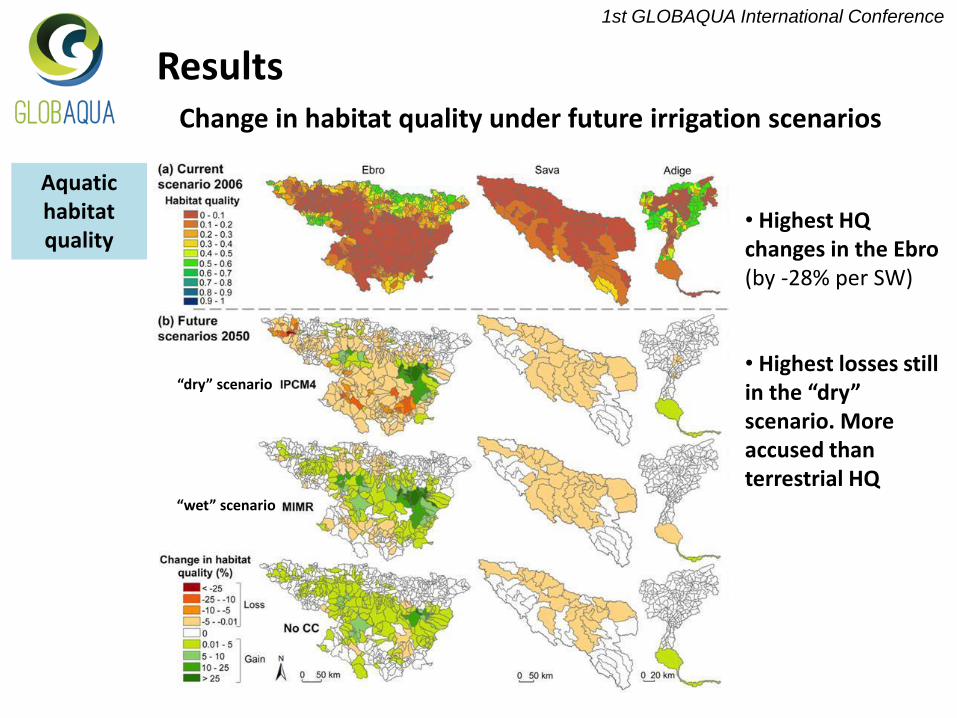
ResultsChange in habitat quality under future irrigation scenarios
Aquatic habitat quality
• Highest HQ changes in the Ebro (by -28% per SW)
• Highest losses still in the “dry” scenario. More accused than terrestrial HQ
“dry” scenario
“wet” scenario
1st GLOBAQUA International Conference
Conclusions
-Regions with low water balance and important areas devoted to irrigation are among the most threatened under future scenarios of global change
-Regions with higher water balances are identified to be vulnerable to habitat degradation when their percentage of irrigation is high, although in a lower extent
-Aquatic habitat quality is lower than terrestrial habitat quality and is predicted to experience higher decreases in the future
-In all cases, the loss of habitat quality is exacerbated under dry climate scenarios as a result of a higher water stress, especially in regions where irrigated areas are expected to increase
1st GLOBAQUA International Conference
Thanks!!