Embed Size (px)
Citation preview
Benjamin Franklin: Statesman scientist
By many, Benjamin Franklin is remem- bered primarily as a statesman, but it is appropriate on the bicentenary of his death (17 April 1790) to recall also his achievements as a scientist and inventor - varying from electrostatics to oceanography, domestic heating to meteorology, furniture to spectacles.
Franklin's father, Josiah, emigrated from Britain in 1683 and established himself in Boston as a tallow-chandler and soap boiler. He had a large family, seventeen children in all, of whom Ben- jamin, born in 1706, was the fifteenth, the tenth by Josiah's second wife. Understandably, Josiah needed all the help he could get to support his large brood, and at ten years of age Benjamin was removed from his grammar school, after only one year, in order to help at home. Nevertheless, he not only learnt to read but spent what little pocket money he had on books. With this evidence of a literary bent it seemed reasonable to apprentice him to his half-brother James, a printer. In 1721 the latter founded the New England Courant to which Benjamin contributed anonymously. When James was impris- oned as a dissident in 1722 he continued to produce the paper, with much suc- cess. On James' return, however, there was a quarrel and Benjamin set out for Philadelphia, working for another prin- ter. He attracted the notice of the Gov- ernor of Pennsylvania, Sir William Keith, who sent him to London to ac- quire equipment and make contacts as a preliminary to setting up a joint printing business in America. However, Keith's support proved fickle and it was two years before he made his way back to Philadelphia.
Thereafter, he prospered greatly. He acquired the influential Pennsylvania Gazette and founded his highly success- ful Poor Richard's Almanac, noted for its witty aphorisms. A leading citizen, he helped to found the American Philo- sophical Society (1743) and the Phi- ladelphia Academy (1751).
With ample means, and an assured place in society, Franklin could indulge his long-felt interest in science. Despite his lack of formal education, he was no dilettante. He was familiar with the works of the leading natural philo- sophers of the age, not only the physi- cists such as Newton and Boyle, but chemists such as Boerhaave. He was
Endeavour, New Series, Volume 14, No. 1, 1990. 0160-9327/90 $3.00 + 0.00. (~) 1990. Pergamon Press plc. Printed in Great Britain.
also an ingenious experimentalist, mak- ing much of his apparatus himself. His interest in electricity seems to have been aroused by lectures given in Bos- ton and Philadelphia in 1743/4 by Adam Spencer, and with a few like-minded enthusiasts he began a long series of researches both on artificially generated electricity - using the newly invented Leyden jar, Musschenbroek's 'wonder- ful bottle ' - and the natural electricity of the lightning flash, which had a particu- lar fascination for him.
His study of frictional electricity led him to the concept of an electric fluid, the flow of which left surfaces negative- ly or positively charged. This one-fluid theory was the antithesis of the two- fluid theory advanced by C. F. De L. Dufay in France in the 1730s. So far as the Leyden jar was concerned, he con- cluded that the inner and outer surfaces have charges of equal magnitude but opposite sign and thus that the electrical force resided in the glass itself.
Franklin had established a rela- tionship with Peter Collinson, an En- glish horticulturist and Fellow of the Royal Society, who had business rela- tionships with America, and to him he communicated in 1750 his 'Opinions and Conjectures concerning the Prop- erties and Effects of the Electrical Mat- t e r . . . ' . This, and other papers, Collin- son compiled to form a book, Experi- ments and Observations in Electricity, made at Philadelphia in America, pub- lished in London in 1751. A French edition was published in the following year and thus Franklin's views became widely known on both sides of the Atlantic.
The book included some early con- clusions about the nature of lightning discharges, which he subsequently in- vestigated in greater detail. Some of his experiments were decidedly hazardous. In one series he used an insulated sen- try-box, in which a man might stand, with an iron rod extending ten metres into the air: thus an electrical charge might be drawn from a passing cloud. The reality of the danger was demons- trated in 1753 when G. W. Richmann, carrying ou t similar experiments in St Petersburg, failed to observe the neces- sary precautions and was electrocuted. Later, and better known, are Franklin's experiments in which electricity was drawn from thunderclouds with the aid of a kite.
Franklin's investigations of electricity earned him international fame. The
Royal Society of London elected him to Fellowship in 1756, and in 1773 the Royal Academy of Sciences in Paris elected him one of their eight foreign associates. With justification, his chief biographer, Carl van Doren, remarked that 'he found electricity a curiosity and left it a science'.
From 1757 Franklin devoted himself largely to supporting the movement for American independence. Over the period 1757-75 he represented Amer- ican interests in London, where he was lionized in both social and scientific circles, and with John Adams and Tho- mas Jefferson drafted the Declaration of Independence in 1776. In that same year he was sent to Paris as one of three commissioners charged with negotiating a peace settlement. In 1787-8 he was a member of the convention which drew up the US Constitution.
Despite these demanding duties, Franklin never lost his catholic interest in matters scientific and technical. In the 1740s he devised the Pennsylvania Fireplace and Holland Stove, designed to improve the thermal efficiency of heating appliances. Furniture, too, ex- ercised his ingenuity. Around 1760 he designed a sprung rocking chair and twenty years later a library chair which could be converted into a low step ladder. He also invented, about 1756, bifocal spectacles to avoid the need for two pairs.
The sea always had a keen interest for him: he was brought up in a great seaport and made the Atlantic crossing eight times. He was familiar with the practice of spreading oil on rough wa- ters to calm them but seems to have been the first to investigate it scien- tifically. In 1770, he dropped oil on the surface of the pond in Clapham Com- mon, London, and noted 'with particu- lar surprise' how widely a small quantity would spread. Another maritime in- terest, arising from his position as De- puty Postmaster (1753-74) was in the Gulf Stream. In this capacity, he re- ceived complaints that it took two weeks longer for the mail boats to reach Boston from England than the majority of merchant ships. From Nantucket whalers he learnt that they sailed along the edge of the stream, whales not being found within it, whereas the mailboats - heading straight for their des t ina t ion - lost speed by sailing against it. On the basis of information from the whalers he compiled, and had printed, a map showing the course Of the stream.
Surface melting Joost W. M. Frenken
J u s t b e l o w t h e m e l t i n g p o i n t , s o l i d s c a n b e c o a t e d w i t h a l i q u i d l i k e f i lm w h i c h is s o t h i n t h a t o n l y t h e
m o s t a d v a n c e d t e c h n i q u e s e n a b l e us to o b s e r v e i t a t a l l . N o w a d a y s t h e s u r f a c e s o f s o l i d s a n d
s u r f a c e - m e l t i n g p h e n o m e n a c a n b e s t u d i e d o n t h e a t o m i c s c a l e . I n s p i t e o f i ts e x t r e m e t h i n n e s s , t h e
l i q u i d l i k e f i lm is t h o u g h t t o p l a y a c r u c i a l r o l e in t h e m e l t i n g b e h a v i o u r o f t h e e n t i r e s o l i d . B y p r e v e n t i n g
i ts f o r m a t i o n , o n e m a y e v e n b e a b l e t o b r i n g s o l i d s a b o v e t h e i r n o r m a l m e l t i n g t e m p e r a t u r e .
I t is well-known that solids melt when supplied with a sufficient amount of heat. However, very little is known about the microscopic details of the melting process. We learn in physics that above a well-defined temperature - the melting temperature - the solid can no longer sustain its crystalline struc- ture. Thermal vibrations become strong enough to break down the solid, leaving a chaotic jumble of atoms: a liquid. Yet recent research has shown that this pic- ture is not entirely correct, since it ignores the important role played by the surface of the solid. Nowadays, surfaces can be studied with a degree of sensitiv- ity and precision which has never before been achieved. In particular, we can now examine the surface of a solid on the atomic scale, close to its melting point. The results indicate that surface behaviour directly influences the melt- ing of the solid as a whole. Contrary to what one might expect, at many sur- faces melting turns out not to occur at one given temperature, but to proceed continually from temperatures well be- low the 'normal ' melting point. It starts at the surface of the solid and slowly progresses inwards, one atomic layer after the other. As the temperature approaches the melting point, a 'thi~k' iiquidlike (or quasiliquid) film covers the surface: when finally the 'normal ' melting temperature is reached, the melt front rushes in further, transform- ing the entire solid into liquid.
One may wonder why very sophisti- cated techniques were needed to observe this phenomenon, which is, af- ter all, conceptually quite simple. The
Joost W. M. Frenken
Is a physicist at the FOM-Institute for Atomic and Molecular Physics, Amsterdam, the Netherlands. He was awarded the Nottingham Prize in 1985 for his work on surface melting.
EURO-ARTICLE. (see page ii) This article is published in association with La Recherche, France.
Endeavour, New Series, Volume 14, No. 1, 1990. 0160-9327/90 $3.00 + O.00. (~ 1990. Pergamon Press plc. Printed in Great Britain.
reason for this is that the liquidlike surface films remain extremely thin - no more than just a few atomic layers - until immediately below the melting point. Apart from a few favourable exceptions, these films are therefore quite difficult to detect.
The notion of melting surfaces is not entirely new. Surface melting was prop- osed already more than a century ago by the British physicist Michael Faraday to explain some special properties of ice [1]. He suggested that ice is covered by a thin watery layer which would make it slippery and would cause two pieces of ice in contact with each other to merge (sintering). Faraday's views on ice were contested at the time, but recent experi- ments prove him right; precision measurements have revealed that ice crystals are indeed covered with a wat- ery film. This film may be as thick as 0.1 micron at a temperature of - I ° C ! The ice surface shows its first signs of melt- ing already several tens of degrees be- low zero. Usually, surface-melting effects are not as strong as on ice. Water molecules line up with each other quite easily, even in the liquid phase, which makes the watery films on ice extra thick. To verify the general occurrence of surface melting, physicists have re- cently turned to much simpler solids than water, namely those consisting of only one type of atom.
How can one follow in detail what happens during the melting transition? We shall explore several experimental methods, ranging from more or less conventional to quite sophisticated techniques, and see how these supply us with a spectrum of results from which a detailed picture of melting at a surface emerges.
A standard approach in the study of phase transitions such as melting, soli- dification, and evaporation is to mea- sure the specific heat of the material; that is, the heat which has to be sup- plied to one gram of the substance in order to raise its temperature by I°C. As with most phase transitions, addi- tional energy is necessary to make a solid melt. To keep water on the boil, for example, one has to provide heat, even though the temperature remains
fixed at 100°C. Similarly, when an ice cube melts, its temperature remains 0°C and the supplied heat serves to turn the ice into water. Obviously, this extra heat, involved in a phase transition, leads to an abrupt variation of the spe- cific heat. On the curve of the specific heat as a function of temperature this results in a very prominent, narrow peak, precisely at the transition temper- ature. Conversely, one may use the position of this peak to locate the transi- tion temperature. If the surface already begins to melt below the normal melting point, the specific heat also should be- gin to rise already before this point.
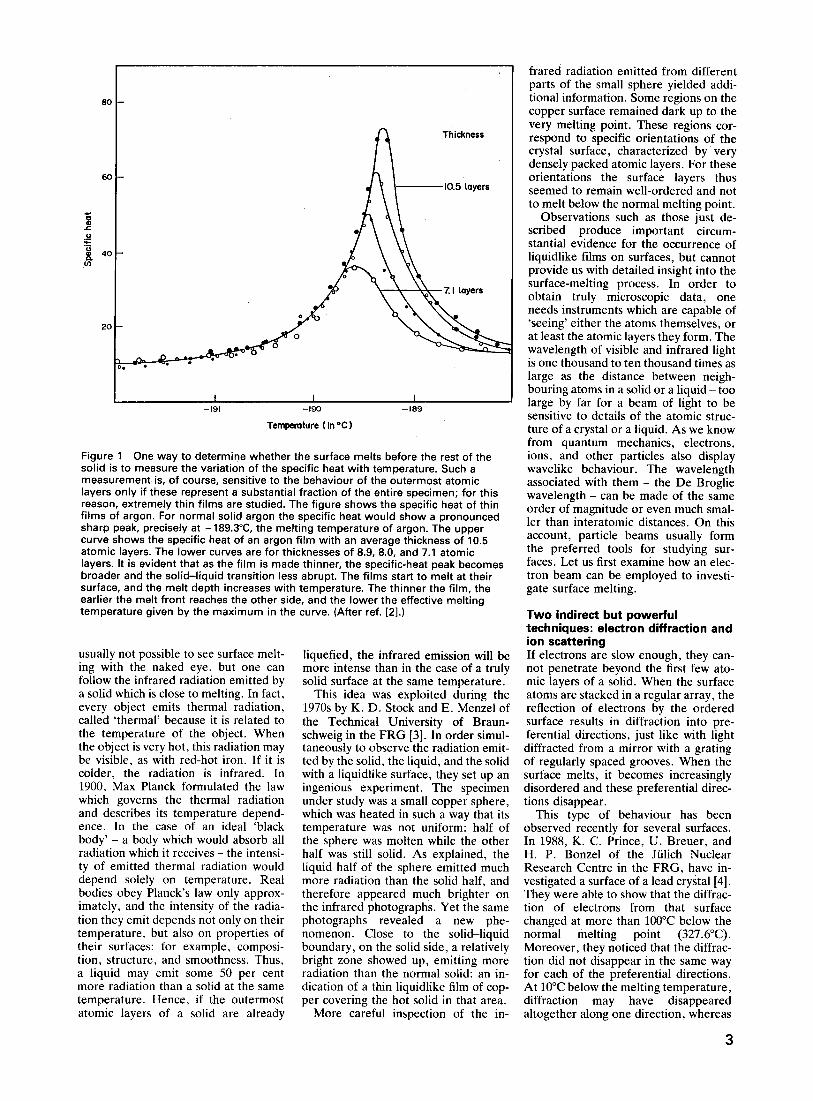
Here, however, a serious experi- mental problem presents itself. The surface atoms constitute only a minute fraction of the total number of atoms in the solid (typically about one in ten million), and the variation in the spe- cific heat due to the melting of a few layers of surface atoms is usually totally imperceptible. This problem was over- come very elegantly by J. G. Dash's group at the University of Washington in Seattle in the USA [2]. In order to give the surface an appreciable effect in the specific-heat measurements, they used crystals in the form of extremely thin films, consisting of no more than a dozen atomic layers. These films (made up of argon atoms in these experiments) were deposited on a graphite substrate. The specific-heat measurements around the melting temperature yielded quite unusual results. Instead of exhibiting a perfectly narrow peak, familiar for melting of a normal crystal, the specific heat of the thin argon films increases gradually with temperature and passes through a maximum before the normal melting temperature of argon (figure 1). Melting of thin films of argon atoms is thus a continuous rather than an abrupt transition, with a melt front propagating inwards from the surface. The thinner the film, the earlier this front reaches the other side.
Watching melting begin Measuring the specific heat may seem a rather indirect way to observe the sur- face-melting phenomenon. Why not simply try to see it? Certainly, it is
40 (/)
8 0 - -
20
• o
,5 Layers
I I I -191 -190 --189
T e r n p e m t u r e ( in *C )
Figure 1 One way to determine whether the surface melts before the rest of the solid is to measure the variation of the specific heat with temperature. Such a measurement is, of course, sensitive to the behaviour of the outermost atomic layers only if these represent a substantial fraction of the entire specimen; for this reason, extremely thin films are studied. The figure shows the specific heat of thin films of argon. For normal solid argon the specific heat would show a pronounced sharp peak, precisely at -189.3°C, the melting temperature of argon. The upper curve shows the specific heat of an argon fi lm with an average thickness of 10.5 atomic layers. The lower curves are for thicknesses of 8.9, 8.0, and 7.1 atomic layers. It is evident that as the fi lm is made thinner, the specific-heat peak becomes broader and the sol id-l iquid transition less abrupt. The films start to melt at their surface, and the melt depth increases with temperature. The thinner the film, the earlier the melt front reaches the other side, and the lower the effective melting temperature given by the maximum in the curve. (After ref. [2].)
usually not possible to see surface melt- ing with the naked eye, but one can follow the infrared radiation emitted by a solid which is close to melting. In fact, every object emits thermal radiation, called 'thermal' because it is related to the temperature of the object. When the object is very hot, this radiation may be visible, as with red-hot iron. If it is colder, the radiation is infrared. In 1900, Max Planck formulated the law which governs the thermal radiation and describes its temperature depend- ence. In the case of an ideal 'black body' - a body which would absorb all radiation which it receives - the intensi-
• ty of emitted thermal radiation would depend solely on temperature. Real bodies obey Planck's law only approx- imately, and the intensity of the radia- tion they emit depends not only on their temperature, but also on properties of their surfaces: for example, composi- tion, structure, and smoothness. Thus, a liquid may emit some 50 per cent more radiation than a solid at the same temperature. Hence, if the outermost atomic layers of a solid are already
liquefied, the infrared emission will be more intense than in the case of a truly solid surface at the same temperature.
This idea was exploited during the 1970s by K. D. Stock and E. Menzel of the Technical University of Braun- schweig in the FRG [3]. In order simul- taneously to observe the radiation emit- ted by the solid, the liquid, and the solid with a liquidlike surface, they set up an ingenious experiment. The specimen under study was a small copper sphere, which was heated in such a way that its temperature was not uniform: half of the sphere was molten while the other half was still solid. As explained, the liquid half of the sphere emitted much more radiation than the solid half, and therefore appeared much brighter on the infrared photographs. Yet the same photographs revealed a new phe- nomenon. Close to the solid-liquid boundary, on the solid side, a relatively bright zone showed up, emitting more radiation than the normal solid: an in- dication of a thin liquidlike film of cop- per covering the hot solid in that area:
More careful inspection of the in-
flared radiation emitted from different parts of the small sphere yielded addi- tional information. Some regions on the copper surface remained dark up to the very melting point. These regions cor- respond to specific orientations of the crystal surface, characterized by very densely packed atomic layers. For these orientations the surface layers thus seemed to remain well-ordered and not to melt below the normal melting point.
Observations such as those just de- scribed produce important circum- stantial evidence for the occurrence of liquidlike films on surfaces, but cannot provide us with detailed insight into the surface-melting process. In order to obtain truly microscopic data, one needs instruments which are capable of 'seeing' either the atoms themselves, or at least the atomic layers they form. The wavelength of visible and infrared light is one thousand to ten thousand times as large as the distance between neigh- bouring atoms in a solid or a liquid - too large by far for a beam of light to be sensitive to details of the atomic struc- ture of a crystal or a liquid. As we know from quantum mechanics, electrons, ions, and other particles also display wavelike behaviour. The wavelength associated with them - the De Broglie wavelength - can be made of the same order of magnitude or even much smal- ler than interatomic distances. On this account, particle beams usually form the preferred tools for studying sur- faces. Let us first examine how an elec- tron beam can be employed to investi- gate surface melting.
T w o indirect but power fu l techn iques: e lectron di f fract ion and ion scatter ing If electrons are slow enough, they can- not penetrate beyond the first few ato- mic layers of a solid. When the surface atoms are stacked in a regular array, the reflection of electrons by the ordered surface results in diffraction into pre- ferential directions, just like with light diffracted from a mirror with a grating of regularly spaced grooves. When the surface melts, it becomes increasingly disordered and these preferential direc- tions disappear.
This type of behaviour has been observed recently for several surfaces. In 1988, K. C. Prince, U. Breuer, and H. P. Bonzel of the J~lich Nuclear Research Centre in the FRG, have in- vestigated a surface of a lead crystal [4]. They were able to show that the diffrac- tion of electrons from that surface changed at more than 1000C below the normal melting point (327.6°C). Moreover, they noticed that the diffrac- tion did not disappear in the same way for each of the preferential directions. At 10°C below the melting temperature, diffraction may have disappeared altogether along one direction, whereas
(a) ~ / (b)
• • • • • •
• • • • • O / ~
• . . • • "//O~l " " " "
• • • .
" " " " / ' / - t ' , , • * " " / ' / " "
• " * / * / " * I' o e o , o / o o o I ) - ~
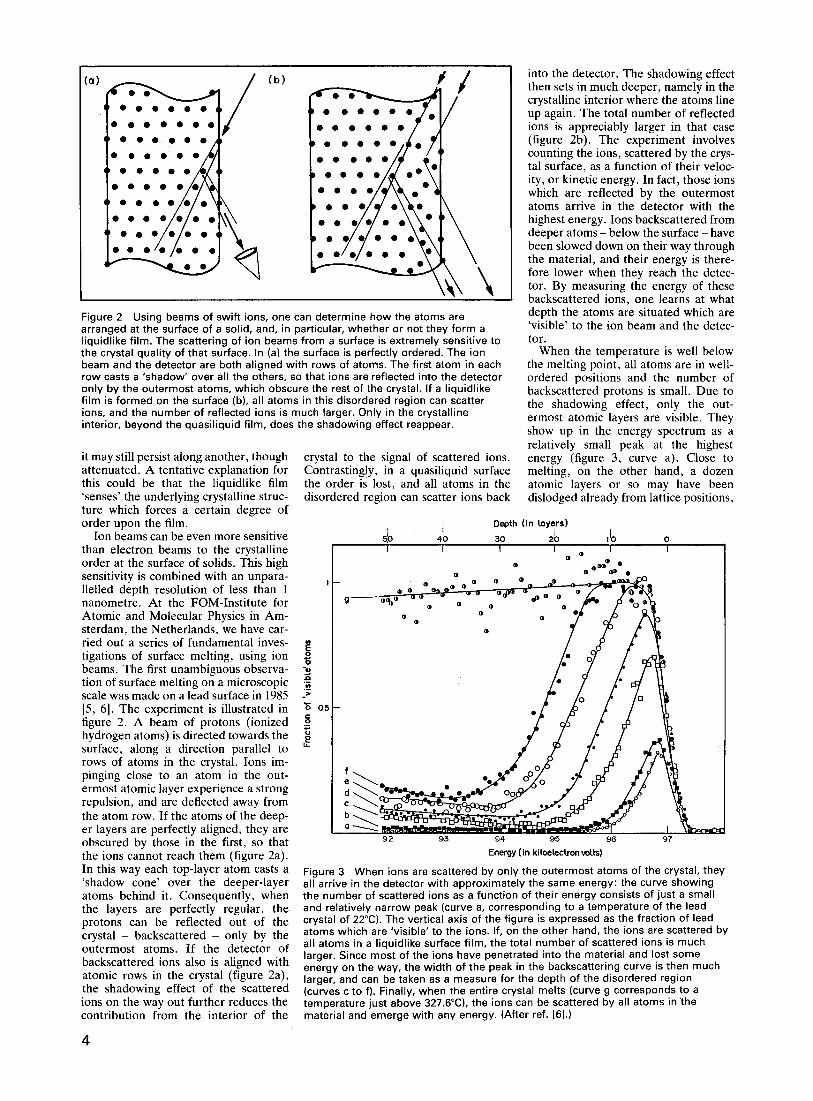
\ Figure 2 Using beams of swift ions, one can determine how the atoms are arranged at the surface of a solid, and, in particular, whether or not they form a liquidlike film. The scattering of ion beams from a surface is extremely sensitive to the crystal quality of that surface. In (a) the surface is perfectly ordered. The ion beam and the detector are both aligned with rows of atoms. The first atom in each row casts a 'shadow' over all the others, so that ions are reflected into the detector only by the outermost atoms, which obscure the rest of the crystal. If a l iquidlike fi lm is formed on the surface (b), all atoms in this disordered region can scatter ions, and the number of reflected ions is much larger. Only in the crystalline interior, beyond the quasil iquid fi lm, does the shadowing effect reappear.
it may still persist along another, though attenuated. A tentative explanation for this could be that the liquidlike film 'senses' the underlying crystalline struc- ture which forces a certain degree of order upon the film.
Ion beams can be even more sensitive than electron beams to the crystalline order at the surface of solids. This high sensitivity is combined with an unpara- llelled depth resolution of less than 1 nanometre. At the FOM-Institute for Atomic and Molecular Physics in Am- sterdam, the Netherlands, we have car- ried out a series of fundamental inves- tigations of surface melting, using ion beams. The first unambiguous observa- tion of surface melting on a microscopic scale was made on a lead surface in 1985 [5, 6]. The experiment is illustrated in figure 2. A beam of protons (ionized hydrogen atoms) is directed towards the surface, along a direction parallel to rows of atoms in the crystal. Ions im- pinging close to an atom in the out- ermost atomic layer experience a strong repulsion, and are deflected away from the atom row. If the atoms of the deep- er layers are perfectly aligned, they are obscured by those in the first, so that the ions cannot reach them (figure 2a). In this way each top-layer atom casts a 'shadow cone' over the deeper-layer atoms behind it. Consequently, when the layers are perfectly regular, the protons can be reflected out of the crystal - backscattered - only by the outermost atoms. If the detector of backscattered ions also is aligned with atomic rows in the crystal (figure 2a), the shadowing effect of the scattered ions on the way out further reduces the contribution from the interior of the
crystal to the signal of scattered ions. Contrastingly, in a quasiliquid surface the order is lost, and all atoms in the disordered region can scatter ions back
into the detector. The shadowing effect then sets in much deeper, namely in the crystalline interior where the atoms line up again. The total number of reflected ions is appreciably larger in that case (figure 2b). The experiment involves counting the ions, scattered by the crys- tal surface, as a function of their veloc- ity, or kinetic energy. In fact, those ions which are reflected by the outermost atoms arrive in the detector with the highest energy. Ions backscattered from deeper atoms - below the surface - have been slowed down on their way through the material, and their energy is there- fore lower when they reach the detec- tor. By measuring the energy of these backscattered ions, one learns at what depth the atoms are situated which are 'visible' to the ion beam and the detec- tor.
When the temperature is well below the melting point, all atoms are in well- ordered positions and the number of backscattered protons is small. Due to the shadowing effect, only the out- ermost atomic layers are visible. They show up in the energy spectrum as a relatively small peak at the highest energy (figure 3, curve a). Close to melting, on the other hand, a dozen atomic layers or so may have been dislodged already from lattice positions,
o "6
~6
Depth (in Layers) 5!0 4~o 30 21o ,1o O
92 95 9q 95 96 97 Energy ( in kitoetectron votts)
Figure 3 When ions are scattered by only the outermost atoms of the crystal, they all arrive in the detector with approximately the same energy: the curve showing the number of scattered ions as a function of their energy consists of just a small and relatively narrow peak (curve a, corresponding to a temperature of the lead crystal of 22°C). The vertical axis of the figure is expressed as the fraction of lead atoms which are 'visible' to the ions. If, on the other hand, the ions are scattered by all atoms in a liquidlike surface fi lm, the total number of scattered ions is much larger. Since most of the ions have penetrated into the material and lost some energy on the way, the width of the peak in the backscattering curve is then much larger, and can be taken as a measure for the depth of the disordered region (curves c to f). Finally, when the entire crystal melts (curve g corresponds to a temperature just above 327.6°C), the ions can be scattered by all atoms in "the material and emerge with any energy. (After ref. [6].)
4
r
III ~ ~
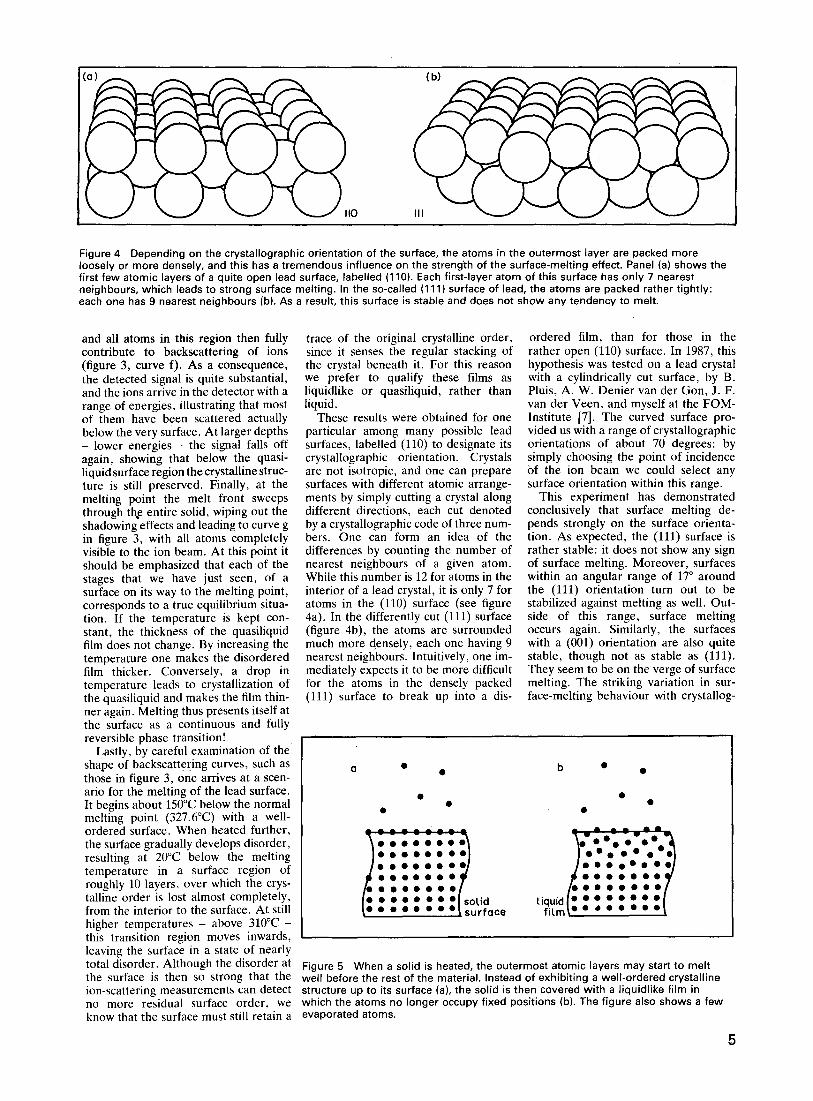
Figure 4 Depending on the crystallographic orientation of the surface, the atoms in the outermost layer are packed more loosely or more densely, and this has a tremendous influence on the strength of the surface-melting effect. Panel (a) shows the first few atomic layers of a quite open lead surface, labelled (110). Each first-layer atom of this surface has only 7 nearest neighbours, which leads to strong surface melting. In the so-called (111) surface of lead, the atoms are packed rather tightly: each one has 9 nearest neighbours (b). As a result, this surface is stable and does not show any tendency to melt.
and all atoms in this region then fully contribute to backscattering of ions (figure 3, curve f). As a consequence, the detected signal is quite substantial, and the ions arrive in the detector with a range of energies, illustrating that most of them have been scattered actually below the very surface. At larger depths - lower energies - the signal falls off again, showing that below the quasi- liquid surface region the crystalline struc- ture is still preserved. Finally, at the melting point the melt front sweeps through the entire solid, wiping out the shadowing effects and leading to curve g in figure 3, with all atoms completely visible to the ion beam. At this point it should be emphasized that each of the stages that we have just seen, of a surface on its way to the melting point, corresponds to a true equilibrium situa- tion. If the temperature is kept con- stant, the thickness of the quasiliquid film does not change. By increasing the temperature one makes the disordered film thicker. Conversely, a drop in temperature leads to crystallization of the quasiliquid and makes the film thin- ner again. Melting thus presents itself at the surface as a continuous and fully reversible phase transition!
Lastly, by careful examination of the shape of backscattering curves, such as those in figure 3, one arrives at a scen- ario for the melting of the lead surface. It begins about 150°C below the normal melting point (327.6°C) with a well- ordered surface. When heated further, the surface gradually develops disorder, resulting at 20°C below the melting temperature in a surface region of roughly 10 layers, over which the crys- talline order is lost almost completely, from the interior to the surface. At still higher temperatures - above 310°C - this transition region moves inwards, leaving the surface in a state of nearly total disorder. Although the disorder at the surface is then so strong that the ion-scattering measurements can detect no more residual surface order, we know that the surface must still retain
trace of the original crystalline order, since it senses the regular stacking of the crystal beneath it. For this reason we prefer to qualify these films as liquidlike or quasiliquid, rather than liquid.
These results were obtained for one particular among many possible lead surfaces, labelled (110) to designate its crystallographic orientation. Crystals are not isotropic, and one can prepare surfaces with different atomic arrange- ments by simply cutting a crystal along different directions, each cut denoted by a crystallographic code of three num- bers. One can form an idea of the differences by counting the number of nearest neighbours of a given atom. While this number is 12 for atoms in the interior of a lead crystal, it is only 7 for atoms in the (110) surface (see figure 4a). In the differently cut (111) surface (figure 4b), the atoms are surrounded much more densely, each one having 9 nearest neighbours. Intuitively, one im- mediately expects it to be more difficult for the atoms in the densely packed (111) surface to break up into a dis-
ordered film, than for those in the rather open (110) surface. In 1987, this hypothesis was tested on a lead crystal with a cylindrically cut surface, by B. Pluis, A. W. Denier van der Gon, J. F. van der Veen, and myself at the FOM- Institute [7]. The curved surface pro- vided us with a range of crystallographic orientations of about 70 degrees: by simply choosing the point of incidence of the ion beam we could select any surface orientation within this range.
This experiment has demonstrated conclusively that surface melting de- pends strongly on the surface orienta- tion. As expected, the (111) surface is rather stable: it does not show any sign of surface melting. Moreover, surfaces within an angular range of 17 ° around the (111) orientation turn out to be stabilized against melting as well. Out- side of this range, surface melting occurs again. Similarly, the surfaces with a (001) orientation are also quite stable, though not as stable as (111). They seem to be on the verge of surface melting. The striking variation in sur- face-melting behaviour with crystallog-
n • • b • •
• • • • • •
~ s o L i d t iquid ~w w u ,w ,, ,, ,, " l s u r f a c e f i l . m E . _ . . . . . .
Figure 5 When a solid is heated, the outermost atomic layers may start to melt well before the rest of the material. Instead of exhibiting a well-ordered crystalline structure up to its surface (a), the solid is then covered with a liquidlike film in which the atoms no longer occupy fixed positions (b). The figure also shows a few
a evaporated atoms.
I Maniputator - . t l
aL
beom t
~,% Vacuum \ ~ _ pump .~,d
e,e'~X~ " ~ " ~-f,o~
incident I beam crys~,oL detector
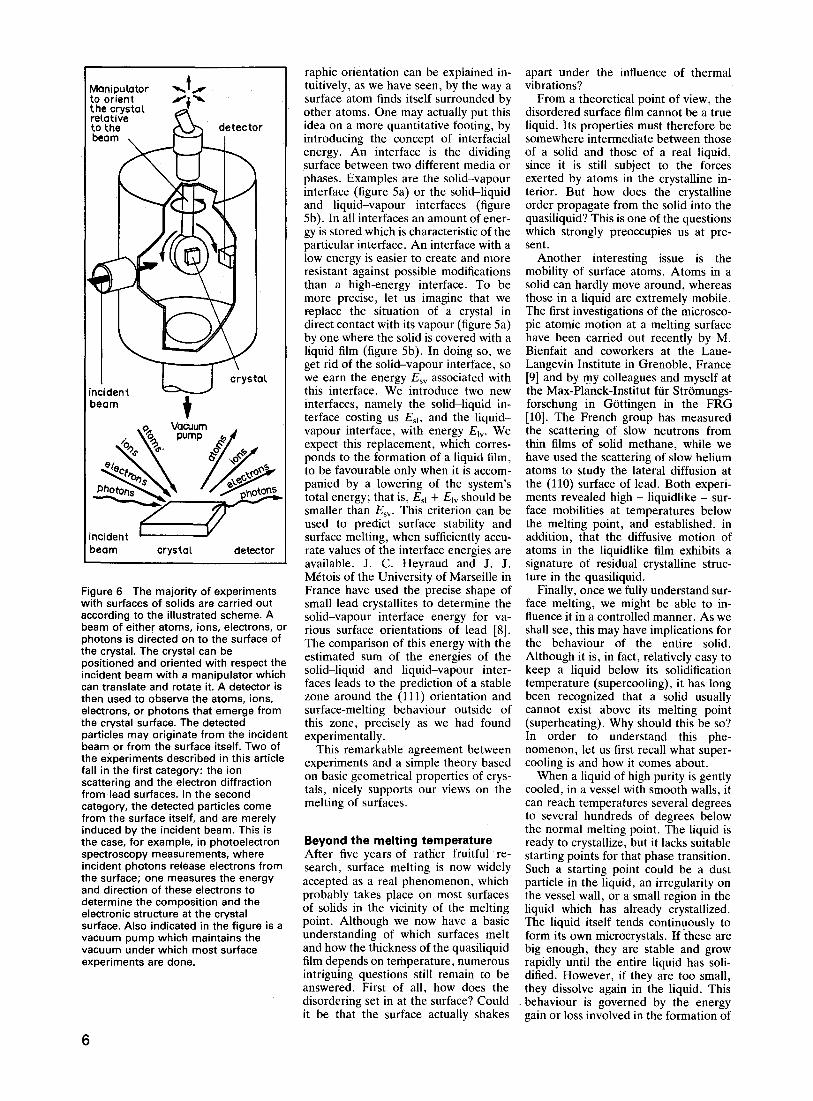
Figure 6 The majority of experiments with surfaces of solids are carried out according to the illustrated scheme. A beam of either atoms, ions, electrons, or photons is directed on to the surface of the crystal. The crystal can be positioned and oriented with respect the incident beam with a manipulator which can translate and rotate it. A detector is then used to observe the atoms, ions, electrons, or photons that emerge from the crystal surface. The detected particles may originate from the incident beam or from the surface itself. Two of the experiments described in this article fall in the first category: the ion scattering and the electron diffraction from lead surfaces. In the second category, the detected particles come from the surface itself, and are merely induced by the incident beam. This is the case, for example, in photoelectron spectroscopy measurements, where incident photons release electrons from the surface; one measures the energy and direction of these electrons to determine the composition and the electronic structure at the crystal surface. Also indicated in the figure is a vacuum pump which maintains the vacuum under which most surface experiments are done.
raphic orientation can be explained in- tuitively, as we have seen, by the way a surface atom finds itself surrounded by other atoms. One may actually put this idea on a more quantitative footing, by introducing the concept of interfacial energy. An interface is the dividing surface between two different media or phases. Examples are the solid-vapour interface (figure 5a) or the solid-liquid and liquid-vapour interfaces (figure 5b). In all interfaces an amount of ener- gy is stored which is characteristic of the particular interface. An interface with a low energy is easier to create and more resistant against possible modifications than a high-energy interface. To be more precise, let us imagine that we replace the situation of a crystal in direct contact with its vapour (figure 5a) by one where the solid is covered with a liquid film (figure 5b). In doing so, we get rid of the solid-vapour interface, so we earn the energy Esv associated with this interface. We introduce two new interfaces, namely the solid-liquid in- terface costing us Esl, and the l iquid- vapour interface, with energy Ely. We expect this replacement, which corres- ponds to the formation of a liquid film, to be favourable only when it is accom- panied by a lowering of the system's total energy; that is, Esl + Ely should be smaller than E~v. This criterion can be used to predict surface stability and surface melting, when sufficiently accu- rate values of the interface energies are available. J. C. Heyraud and J. J. M6tois of the University of Marseille in France have used the precise shape of small lead crystallites to determine the solid-vapour interface energy for va- rious surface orientations of lead [8]. The comparison of this energy with the estimated sum of the energies of the solid-liquid and liquid-vapour inter- faces leads to the prediction of a stable zone around the (111) orientation and surface-melting behaviour outside of this zone, precisely as we had found experimentally.
This remarkable agreement between experiments and a simple theory based on basic geometrical properties of crys- tals, nicely supports our views on the melting of surfaces.
Beyond the me l t ing tempera tu re After five years of rather fruitful re- search, surface melting is now widely accepted as a real phenomenon, which probably takes place on most surfaces of solids in the vicinity of the melting point. Although we now have a basic understanding of which surfaces melt and how the thickness of the quasiliquid film depends on temperature, numerous intriguing questions still remain to be answered. First of all, how does the disordering set in at the surface? Could it be that the surface actually shakes
apart under the influence of thermal vibrations?
From a theoretical point of view, the disordered surface film cannot be a true liquid. Its properties must therefore be somewhere intermediate between those of a solid and those of a real liquid, since it is still subject to the forces exerted by atoms in the crystalline in- terior. But how does the crystalline order propagate from the solid into the quasiliquid? This is one of the questions which strongly preoccupies us at pre- sent.
Another interesting issue is the mobility of surface atoms. Atoms in a solid can hardly move around, whereas those in a liquid are extremely mobile. The first investigations of the microsco- pic atomic motion at a melting surface have been carried out recently by M. Bienfait and coworkers at the Laue- Langevin Institute in Grenoble, France [9] and by rny colleagues and myself at the Max-Planck-Institut fiir Str6mungs- forschung in G6ttingen in the FRG [10]. The French group has measured the scattering of slow neutrons from thin films of solid methane, while we have used the scattering of slow helium atoms to study the lateral diffusion at the (110) surface of lead. Both experi- ments revealed high - liquidlike - sur- face mobilities at temperatures below the melting point, and established, in addition, that the diffusive motion of atoms in the iiquidlike film exhibits a signature of residual crystalline struc- ture in the quasiliquid.
Finally, once we fully understand sur- face melting, we might be able to in- fluence it in a controlled manner. As we shall see, this may have implications for the behaviour of the entire solid. Although it is, in fact, relatively easy to keep a liquid below its solidification temperature (supercooling), it has long been recognized that a solid usually cannot exist above its melting point (superheating). Why should this be so? In order to understand this phe- nomenon, let us first recall what super- cooling is and how it comes about.
When a liquid of high purity is gently cooled, in a vessel with smooth walls, it can reach temperatures several degrees to several hundreds of degrees below the normal melting point. The liquid is ready to crystallize, but it lacks suitable starting points for that phase transition. Such a starting point could be a dust particle in the liquid, an irregularity on the vessel wall, or a small region in the liquid which has already crystallized. The liquid itself tends continuously to form its own microcrystals. If these are big enough, they are stable and grow rapidly until the entire liquid has soli- dified. However, if they are too small, they dissolve again in the liquid. This behaviour is governed by the energy gain or loss involved in the formation of
a small crystallite. For a spherical crys- tallite of radius R, the energy gain is proportional to its volume, or the cube of its radius. It might seem, at this stage, that crystallization is always favoured, but this would ignore the formation of the solid-liquid interface between the crystallite and the sur- rounding liquid. As we have seen, such an interface costs energy, the amount being proportional to the area of the crystallite, or the square of its radius. It is the difference between these two energies that we have to consider. For sufficiently large crystallites the term proportional to the cube of the radius would win, and the spheres would grow further. However, such large crystallites are not available. For the small crystal- lites which are generated spontaneously in the liquid, the interface energy is too costly and the small spheres all dissolve again. In this paradoxical way, crystal- lization is nipped in the bud!
Let us return to melting. This seems straightforward now. We could simply rephrase the entire preceding paragraph and interchange the words liquid and crystal, solidification and melting, and conclude that for small liquid inclusions in the solid, the formation energy of the liquid-solid interface is too high and cannot be counter-balanced by the gain in volume energy. Melting of the solid would then be prevented. We would, for this reason, expect to be able to keep solids above their normal melting temperature with relative ease. In prac- tice, however, such a phenomenon is virtually never observed. What causes this difference? The solution of this mysterious asymmetry in nature lies in the very surface of solids. As we now know, the surface of a solid can melt below the normal melting temperature. As the temperature rises, the thickness of the liquidlike film grows, until the entire solid melts, precisely at the melt- ing point. In other words, the quasili- quid surface provides the solid in a natural way with a large amount of liquid, which initiates the normal melt- ing at the melting point. This mechan- ism has an important consequence: we should be able to superheat solids above
the melting temperature after all, by suppressing the melting of their sur- faces. Among the various reported observations of solids above their melt- ing point, probably the first was made by J. Tyndall on an Alpine glacier around 1856. By focusing sunlight in the ice with a burning glass, the interior of the ice could be heated, while the sur- face remained well below 0°C. The uni- que patterns (now known as 'Tyndall stars'), which formed in the ice as the interior of the ice melted, revealed that this melting actually took place slightly above 0°C.
The most elegant observation of the phenomenon of superheating was re- cently performed by J. Daeges ~nd H. Gleiter of the University of Saarbrtick- en in the FRG and J. H. Perepezko of the University of Wisconsin in the USA [H] . They used small silver spheres which they coated completely with a thin film of gold. Gold atoms have almost precisely the same size as silver atoms, and the gold coating therefore fits around the silver sphere like a straight-jacket. But the melting temper- ature of gold (1064°C) is higher than that of silver (961°C). Although it is practically impossible to prevent silver from melting at 961°C, Daeges, Gleiter, and Perepezko succeeded in superheat- ing the coated spheres 25°C above this temperature, without melting them. By preventing the silver surface from be- coming disordered, the gold coating simultaneously keeps the whole silver sphere from melting.
The role of the surface in the melting of the entire solid strikingly illustrates how the microscopic world of the out- ermost few atomic layers may influence the macroscopic behaviour of solids. Scientists know several such macrosco- pic effects which originate from the surface of a solid or the interface be- tween two solids, and use them in ap- plications such as heterogeneous cataly- sis and microelectronic devices.
Melting is a phase transition which, although extensively studied, still re- mains far from completely understood. By confronting theoretical predictions on phase transitions in semi-infinite sys-
tems, such as a crystal with a surface, with our experimental results on surface melting, we are now trying to inventory which atomic interactions govern the character and behaviour of the liquid- like surface and the solid-quasiliquid interface. The solid-quasiliquid inter- face near a molten surface is expected to be very similar to the solid-liquid interface between bulk solid and bulk liquid at the melting point. The atomic- scale insight that we are now acquiring on melting surfaces is therefore also important for the microscopic under- standing of processes like the growth of crystals from their own melt.
Finally, by forcing surface atoms to stay in place, as has been accomplished by depositing gold on silver, we may preclude surface melting and investigate the properties of solids at temperatures above the normal melting point: a pros- pect which thrills the solid-state scien- fist!
References [1] Faraday, M. Proc. R. Soc, Lond. 10,
440, 1860. [2] Zhu, D.-M. and Dash, J. G. Phys. Rev.
Lett. 57, 2959, 1986. [3] Stock, K. D. Surface Sci. 91,655, 1980. [41 Prince, K. C. et al., Phys. Rev. Lett. 60,
1146, 1988. [5] Frenken, J. W: M. and van der Veen, J.
F. Phys. Rev. Lett. 54, 134, 1985. [6] Frenken, J. W. M. et al., Phys. Rev.
B34, 7506, 1986. [7] Pluis, B. et al., Phys. Rev. Lett. 59,
2678, 1987. [8] Heyraud, J. C. and Mrtois, J. J. Surface
Sci. 128, 334, 1983. [9] Bienfait, M. et al., Surface Sci. 182,557,
1987. [10] Frenken, J. W. M. et al., Phys. Rev.
Lett. 60, 1727, 1988. [11] Daeges, J. et al., Phys. Lett. All9, 79,
1986.
Bibliography 1. van der Veen, J. F. et al., in Chemistry
and Physics of Solid Surfaces, Vol. VII, p. 455. Springer-Verlag, 1988.
2. Dash, J. G. Contemporary Physics 30, 89, 1989.
3. Woodruff, D. P. The Solid-Liquid Inter- face. Cambridge University Press, 1973.
7