Embed Size (px)
Citation preview
Benjamin Blandford, PhDUniversity of Kentucky
Kentucky Transportation [email protected]
Michael Shouse, PhDUniversity of Southern Illinois – Edwardsville
Department of [email protected]
Kentucky Transportation Centerwww.ktc.uky.edu
GIS-Based Predictive Habitat Model
Expert-systems modeling for threatened and endangered species
Kentucky Transportation Centerwww.ktc.uky.edu
• Research Background• Aquatic species considered:• Kentucky arrow darter
• Methods• Model Results• Discussion• Other species considered (time permitting)• Blackside dace
Overview
Kentucky Transportation Centerwww.ktc.uky.edu
• NEPA• Threatened and Endangered Species Act• KYTC must conduct species sampling in
areas of potential T&E habitat• Model designed to be a tool for
biologists to use when assessing a stream
Research Background
Kentucky Transportation Centerwww.ktc.uky.edu
• Methodology adapted and modified from a previous predictive archaeological model developed by KYTC/KTC.
• Designed to harness the existing knowledge of experts in the subject area to create a spatially explicit model of likelihood
• Not a “biologist in a box”
Research Background
Kentucky Transportation Centerwww.ktc.uky.edu
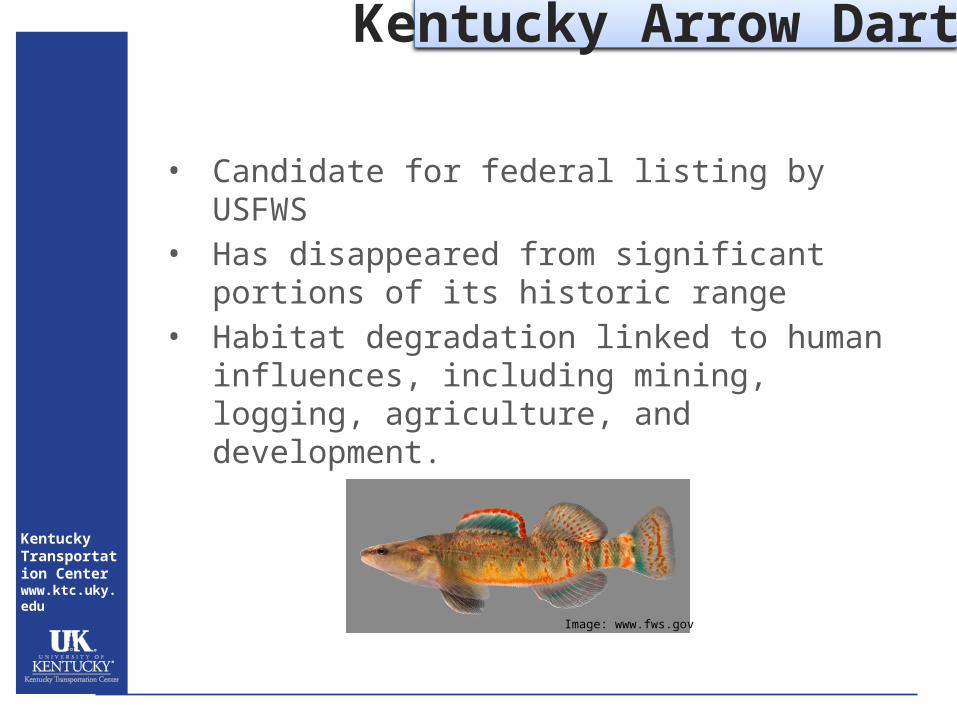
Image: www.fws.gov
• Candidate for federal listing by USFWS• Has disappeared from significant portions of its
historic range• Habitat degradation linked to human influences,
including mining, logging, agriculture, and development.
Kentucky Arrow Darter
Kentucky Transportation Centerwww.ktc.uky.edu
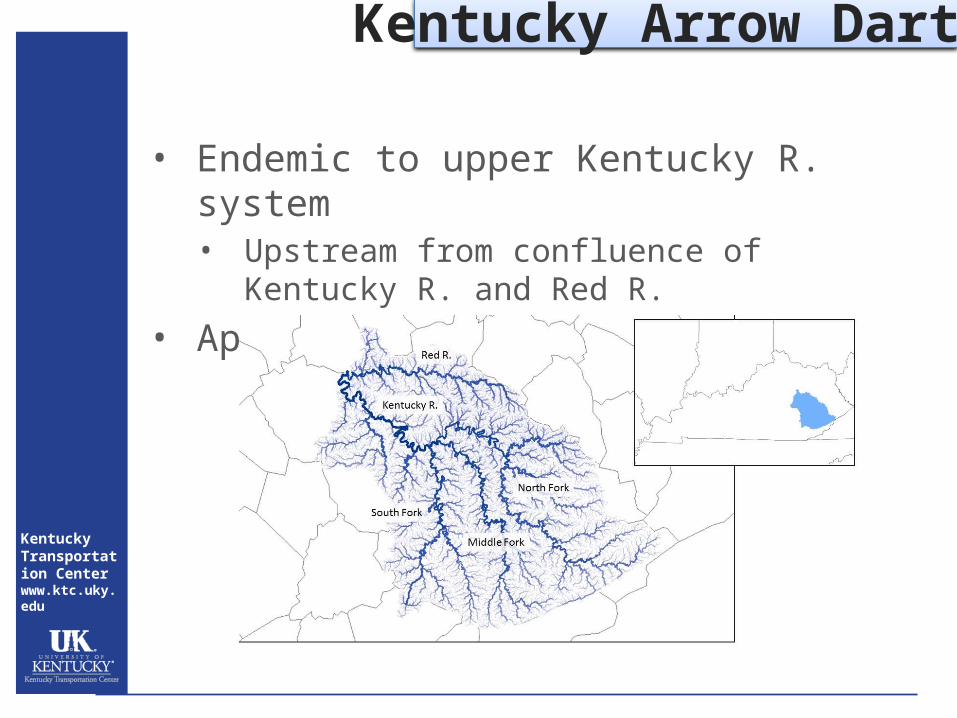
• Endemic to upper Kentucky R. system• Upstream from confluence of Kentucky R. and Red R.
• Appx. 13,600 km of streams
Kentucky Arrow Darter
Kentucky Transportation Centerwww.ktc.uky.edu
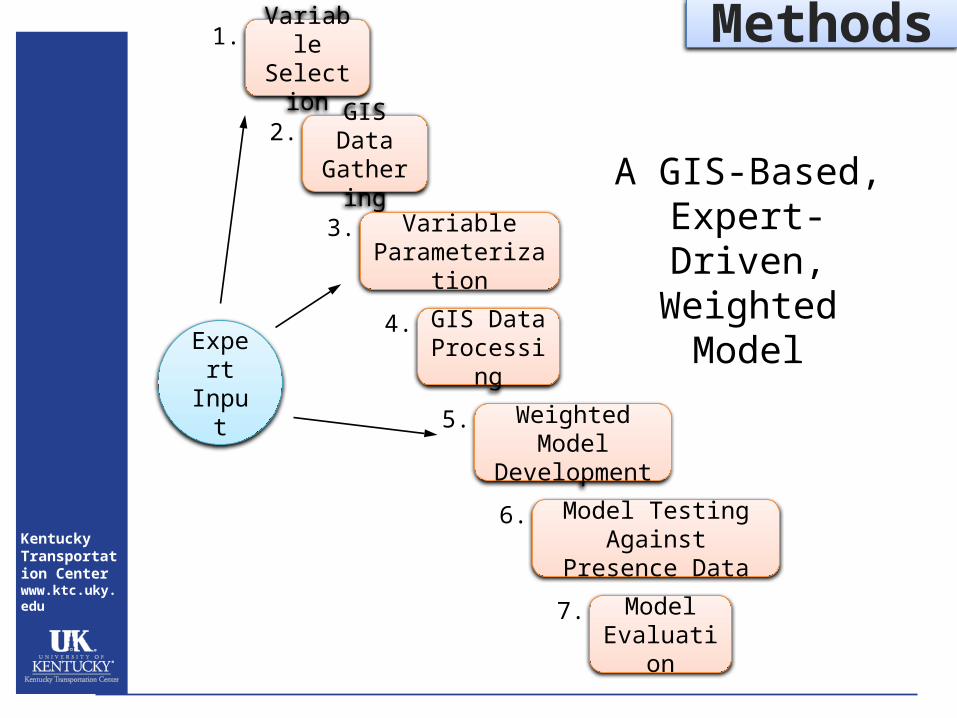
Expert Input
MethodsVariable Selection
1.
GIS Data Gathering
2.
Variable Parameterization
3.
GIS Data Processing
4.
Weighted Model Development
5.
Model Testing Against Presence Data
6.
Model Evaluation
7.
A GIS-Based, Expert-Driven,
Weighted Model
Kentucky Transportation Centerwww.ktc.uky.edu
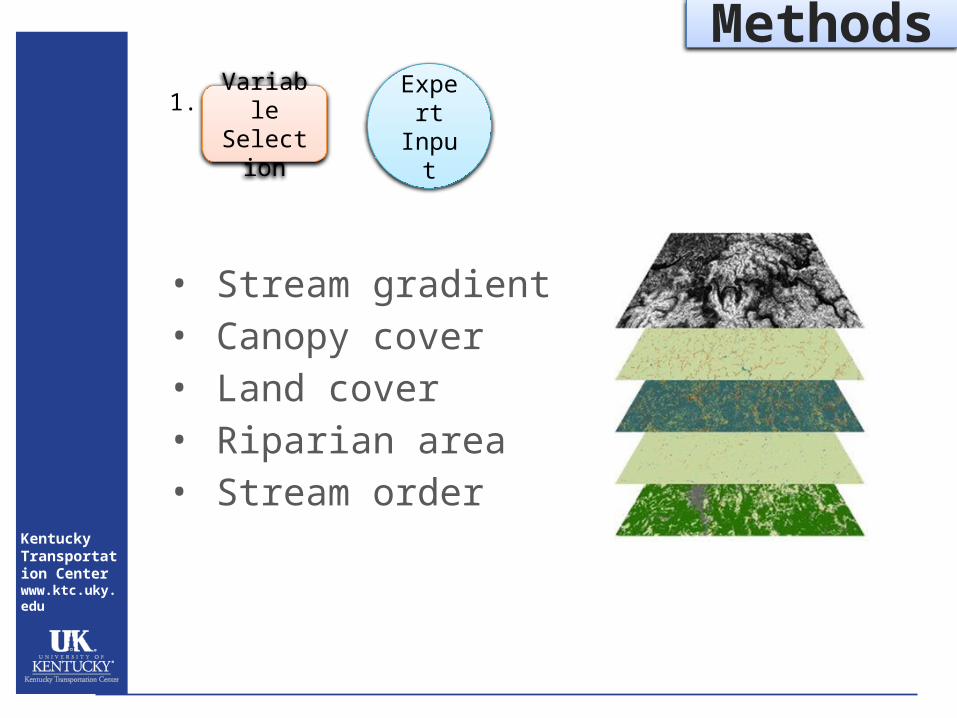
• Stream gradient• Canopy cover• Land cover• Riparian area• Stream order
MethodsVariable Selection
1. Expert Input
Kentucky Transportation Centerwww.ktc.uky.edu
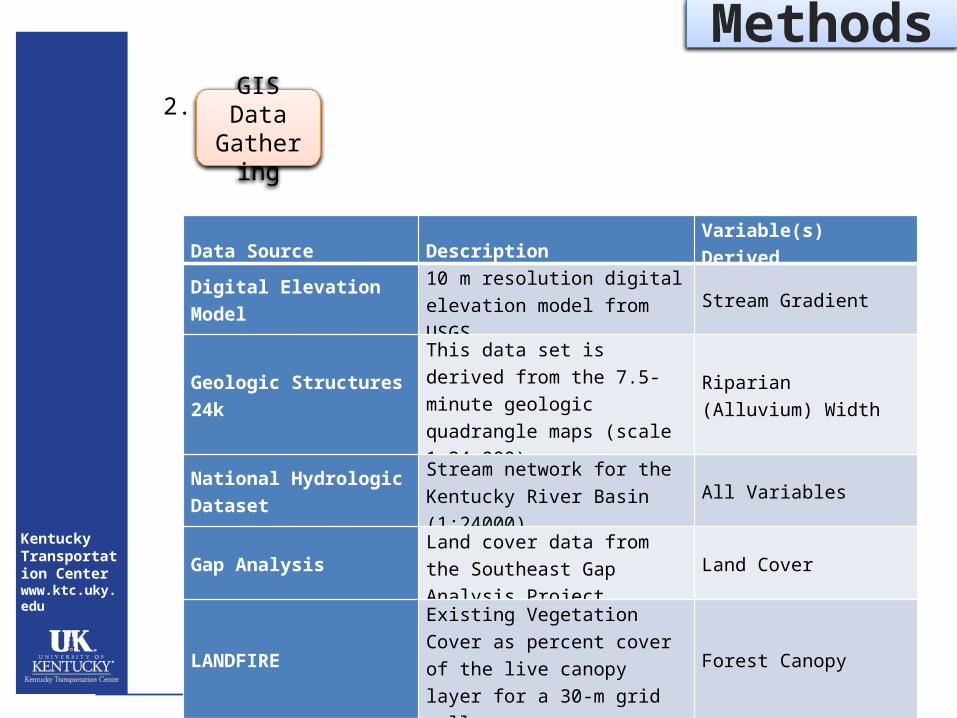
MethodsGIS Data
Gathering
2.
Data Source Description Variable(s) Derived
Digital Elevation Model 10 m resolution digital elevation model from USGS Stream Gradient
Geologic Structures 24kThis data set is derived from the 7.5-minute geologic quadrangle maps (scale 1:24,000)
Riparian (Alluvium) Width
National Hydrologic Dataset Stream network for the Kentucky River Basin (1:24000) All Variables
Gap Analysis Land cover data from the Southeast Gap Analysis Project Land Cover
LANDFIREExisting Vegetation Cover as percent cover of the live canopy layer for a 30-m grid cell.
Forest Canopy
Kentucky Transportation Centerwww.ktc.uky.edu
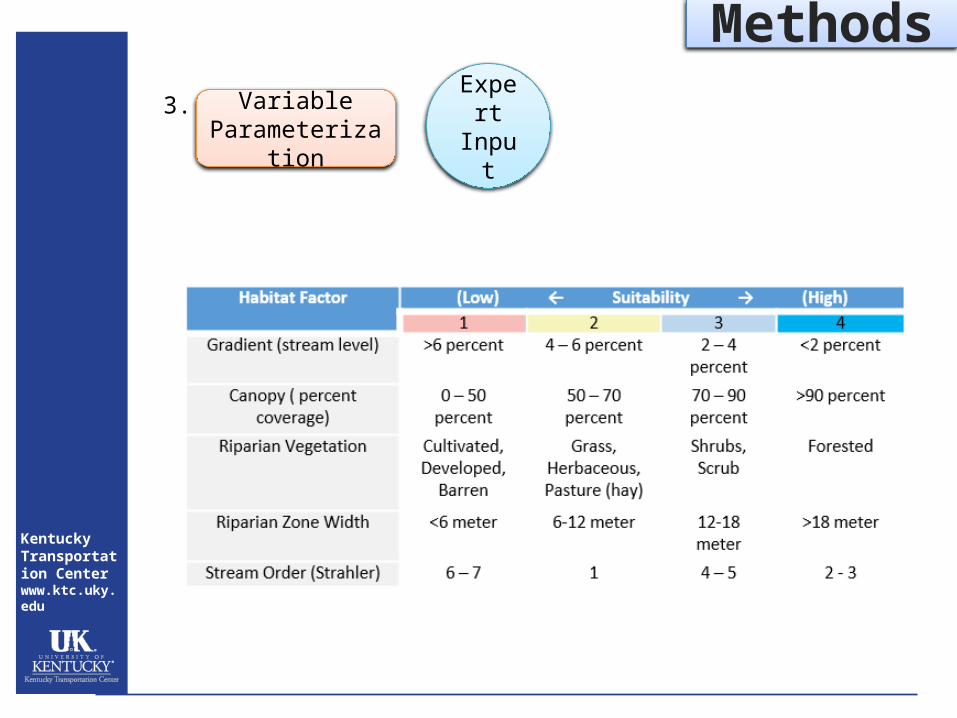
MethodsExpert Input
Variable Parameterization
3.
Kentucky Transportation Centerwww.ktc.uky.edu
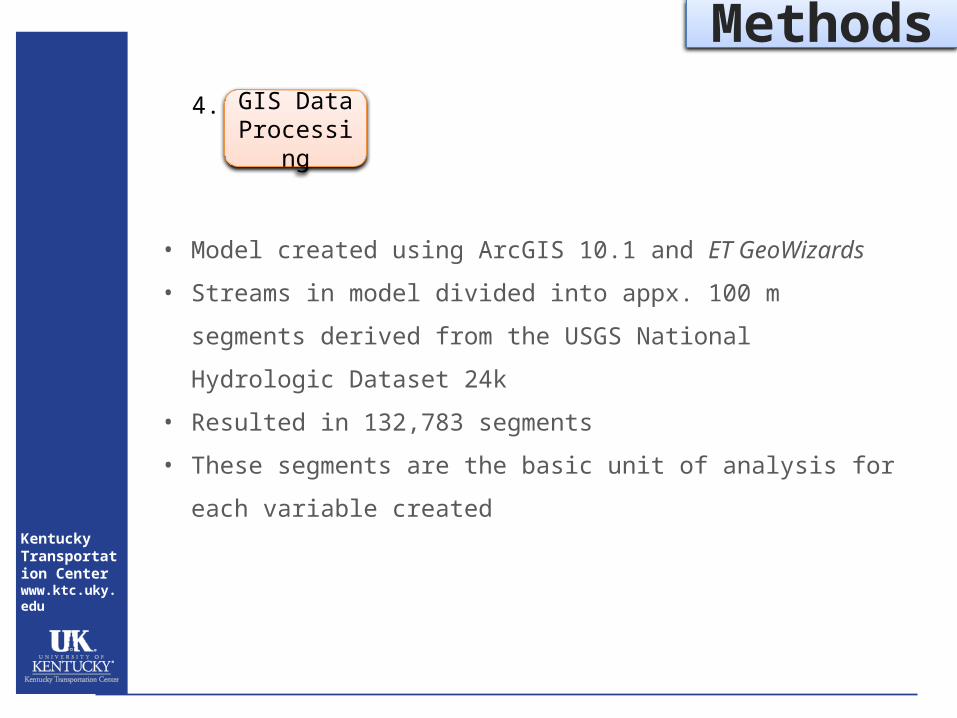
Methods
GIS Data Processing
4.
• Model created using ArcGIS 10.1 and ET GeoWizards
• Streams in model divided into appx. 100 m segments derived from the
USGS National Hydrologic Dataset 24k
• Resulted in 132,783 segments
• These segments are the basic unit of analysis for each variable created
Kentucky Transportation Centerwww.ktc.uky.edu
Methods
GIS Data Processing
4.
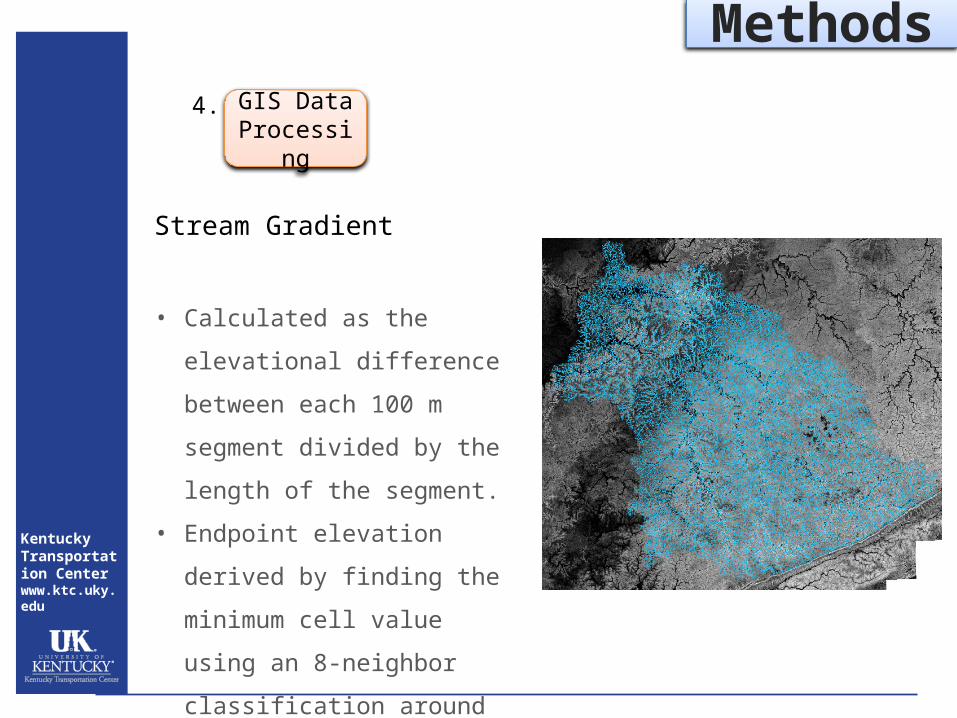
Stream Gradient
• Calculated as the elevational
difference between each 100 m
segment divided by the length of
the segment.
• Endpoint elevation derived by
finding the minimum cell value
using an 8-neighbor classification
around each endpoint location.
Kentucky Transportation Centerwww.ktc.uky.edu
Methods
GIS Data Processing
4.
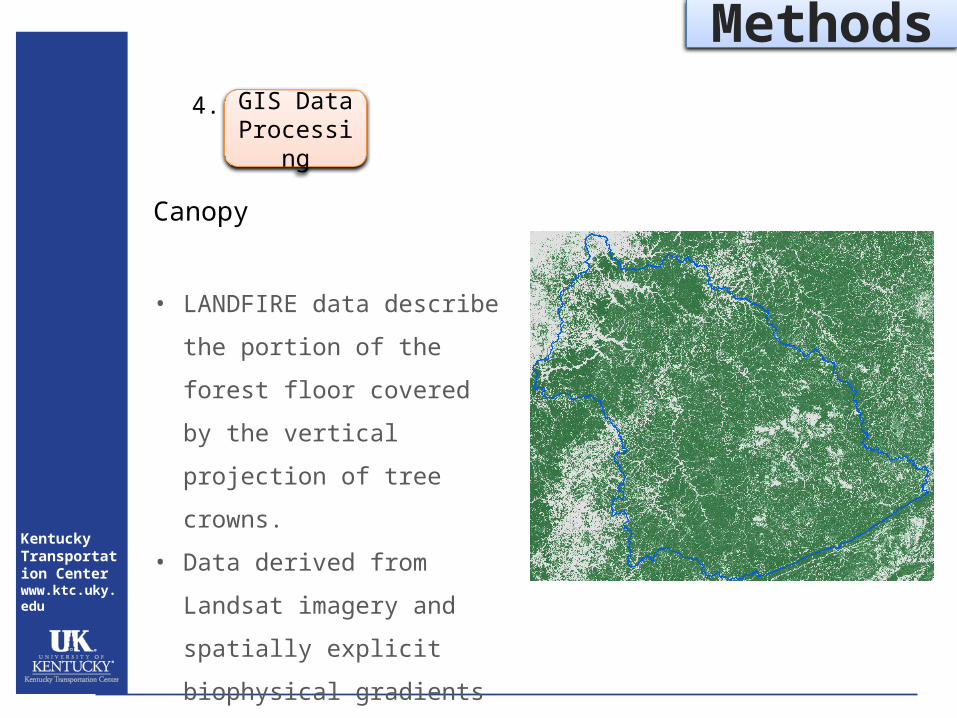
Canopy
• LANDFIRE data describe the
portion of the forest floor
covered by the vertical projection
of tree crowns.
• Data derived from Landsat
imagery and spatially explicit
biophysical gradients to generate
a percent canopy cover at 30 m
resolution.
Kentucky Transportation Centerwww.ktc.uky.edu
Methods
GIS Data Processing
4.
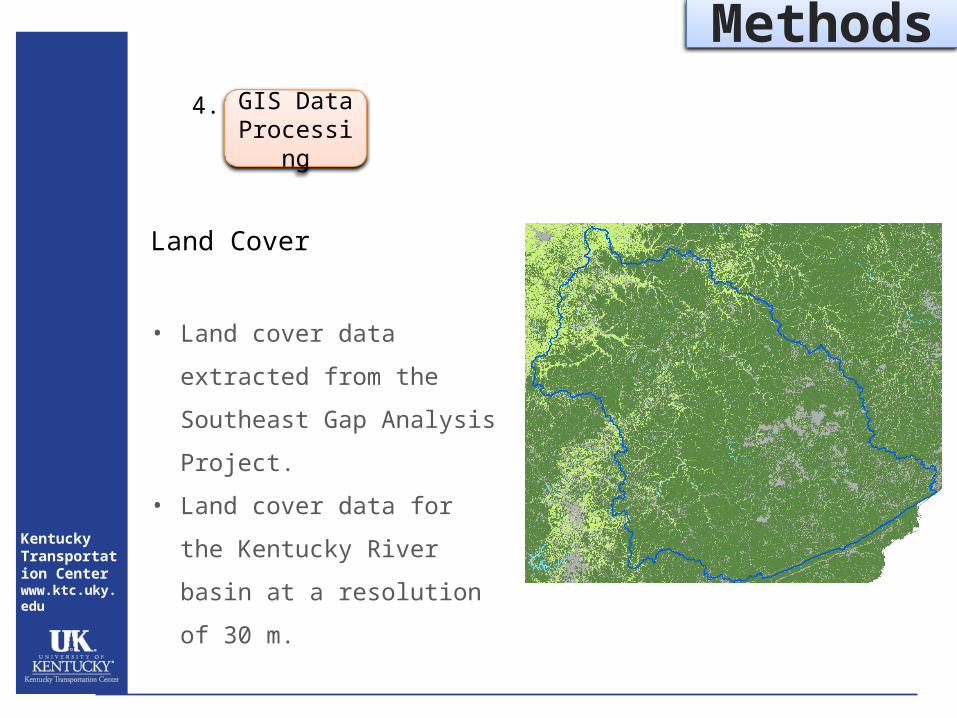
Land Cover
• Land cover data extracted from
the Southeast Gap Analysis
Project.
• Land cover data for the Kentucky
River basin at a resolution of 30
m.
Kentucky Transportation Centerwww.ktc.uky.edu
Methods
GIS Data Processing
4.
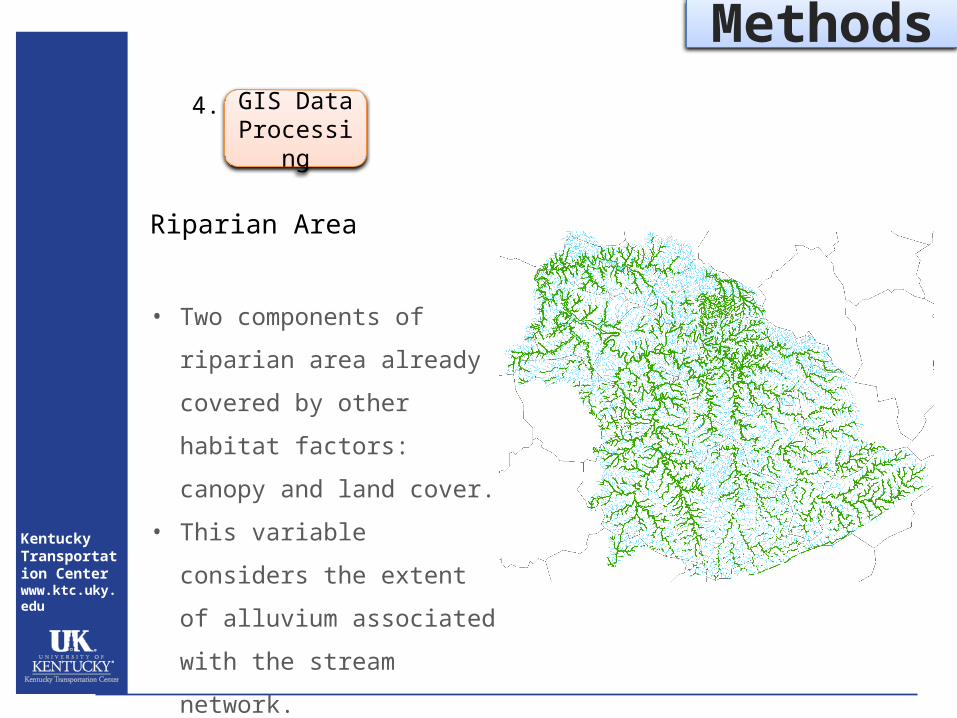
Riparian Area
• Two components of riparian area
already covered by other habitat
factors: canopy and land cover.
• This variable considers the extent
of alluvium associated with the
stream network.
• Average alluvium width
calculated for each 100 m stream
segment.
Kentucky Transportation Centerwww.ktc.uky.edu
Methods
GIS Data Processing
4.
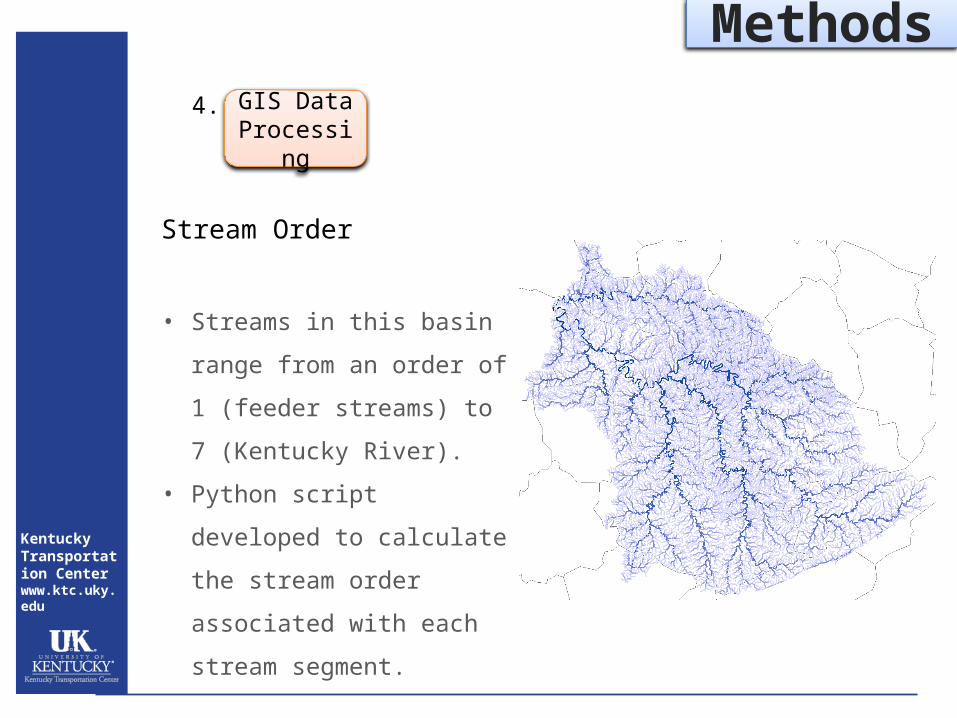
Stream Order
• Streams in this basin range from
an order of 1 (feeder streams) to
7 (Kentucky River).
• Python script developed to
calculate the stream order
associated with each stream
segment.
Kentucky Transportation Centerwww.ktc.uky.edu
MethodsExpert Input
Weighted Model Development
5.
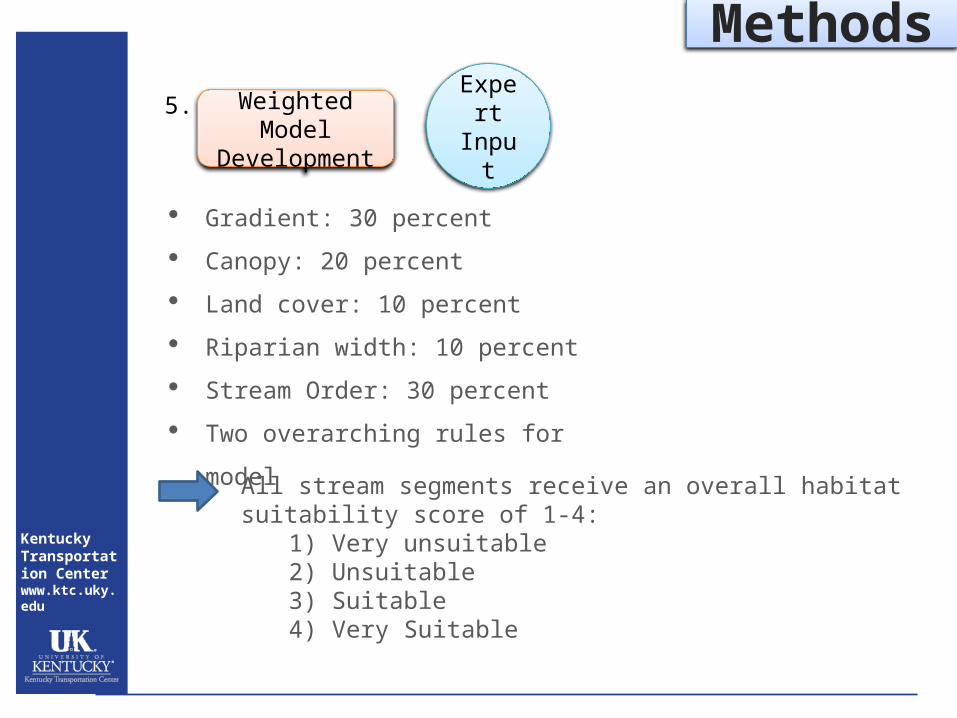
Gradient: 30 percent
Canopy: 20 percent
Land cover: 10 percent
Riparian width: 10 percent
Stream Order: 30 percent
Two overarching rules for model
All stream segments receive an overall habitat suitability score of 1-4:1) Very unsuitable2) Unsuitable3) Suitable4) Very Suitable
Kentucky Transportation Centerwww.ktc.uky.edu
Methods
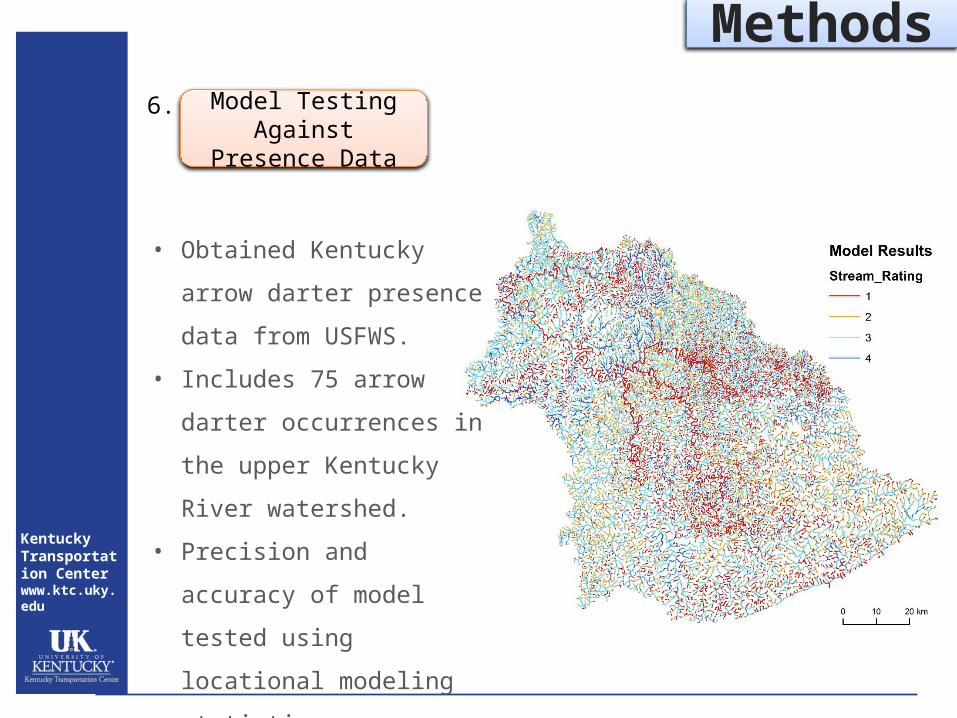
• Obtained Kentucky arrow
darter presence data from
USFWS.
• Includes 75 arrow darter
occurrences in the upper
Kentucky River watershed.
• Precision and accuracy of
model tested using locational
modeling statistics
Model Testing Against Presence Data
6.
Kentucky Transportation Centerwww.ktc.uky.edu
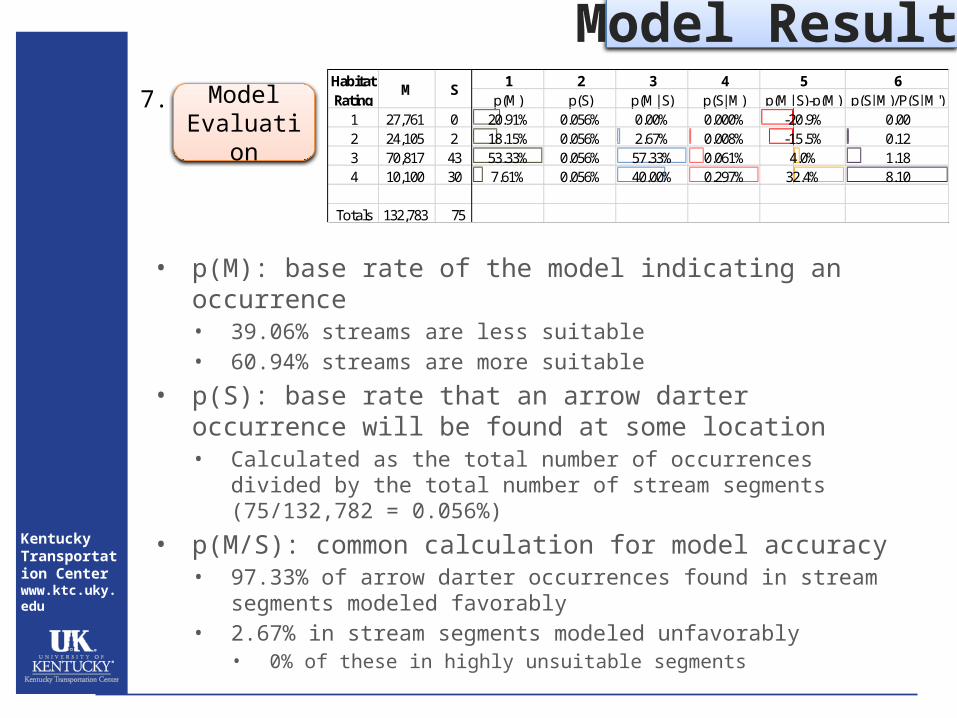
• p(M): base rate of the model indicating an occurrence• 39.06% streams are less suitable• 60.94% streams are more suitable
• p(S): base rate that an arrow darter occurrence will be found at some location• Calculated as the total number of occurrences divided by the
total number of stream segments (75/132,782 = 0.056%)
• p(M/S): common calculation for model accuracy• 97.33% of arrow darter occurrences found in stream
segments modeled favorably• 2.67% in stream segments modeled unfavorably
• 0% of these in highly unsuitable segments
1 2 3 4 5 6p(M) p(S) p(M|S) p(S|M) p(M|S)-p(M) p(S|M)/P(S|M')
1 27,761 0 20.91% 0.056% 0.00% 0.000% -20.9% 0.002 24,105 2 18.15% 0.056% 2.67% 0.008% -15.5% 0.123 70,817 43 53.33% 0.056% 57.33% 0.061% 4.0% 1.184 10,100 30 7.61% 0.056% 40.00% 0.297% 32.4% 8.10
Totals 132,783 75
Habitat Rating
M S
Model ResultsModel
Evaluation
7.
Kentucky Transportation Centerwww.ktc.uky.edu
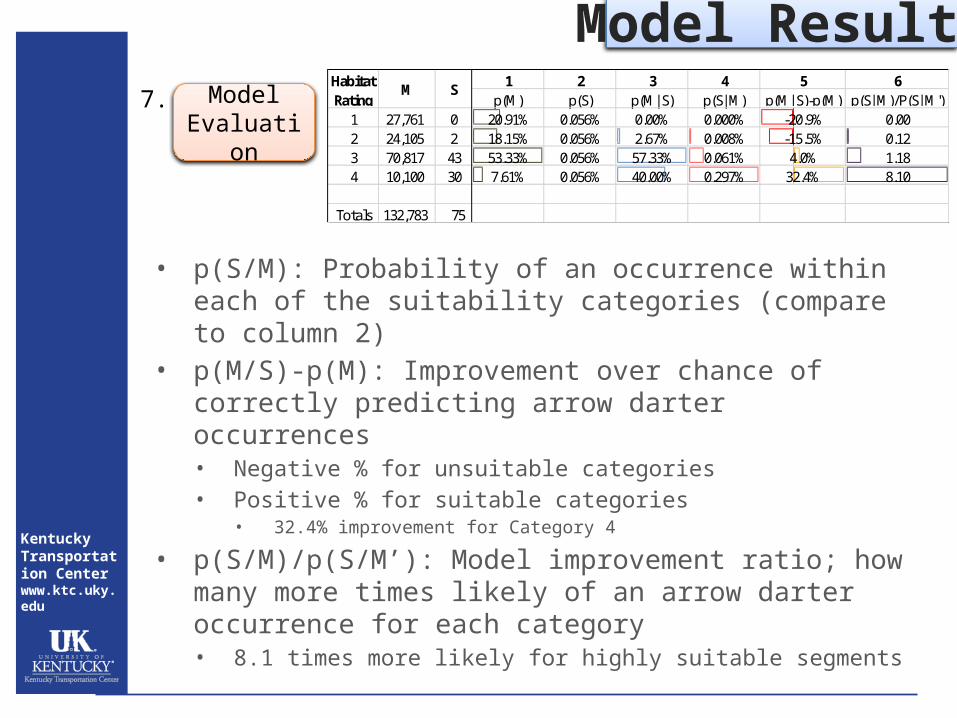
• p(S/M): Probability of an occurrence within each of the suitability categories (compare to column 2)
• p(M/S)-p(M): Improvement over chance of correctly predicting arrow darter occurrences• Negative % for unsuitable categories• Positive % for suitable categories
• 32.4% improvement for Category 4
• p(S/M)/p(S/M’): Model improvement ratio; how many more times likely of an arrow darter occurrence for each category• 8.1 times more likely for highly suitable segments
1 2 3 4 5 6p(M) p(S) p(M|S) p(S|M) p(M|S)-p(M) p(S|M)/P(S|M')
1 27,761 0 20.91% 0.056% 0.00% 0.000% -20.9% 0.002 24,105 2 18.15% 0.056% 2.67% 0.008% -15.5% 0.123 70,817 43 53.33% 0.056% 57.33% 0.061% 4.0% 1.184 10,100 30 7.61% 0.056% 40.00% 0.297% 32.4% 8.10
Totals 132,783 75
Habitat Rating
M S
Model ResultsModel
Evaluation
7.
Kentucky Transportation Centerwww.ktc.uky.edu
• 40% of the independent presence data were located in the top suitability category, which only contained 7.61 percent of stream segments.
• When the model is divided into two categories of unsuitable (1-2) and suitable (3-4), appx. 60% of streams are identified as suitable.
• 97% of dace occurrences found here• 60% of streams as suitable as overfit?
• Arrow darter is candidate for federal protection; need for range expansion
• Model results identify potential for suitable habitat as an avoidance measure for state transportation agencies
Discussion
Kentucky Transportation Centerwww.ktc.uky.edu
• Model results demonstrate this methodology’s ability to identify suitable habitat• Simply intended to be a tool that maps an expert’s
knowledge of the subject
• GIS-based expert systems methodology is transferable:• To other aquatic species• Potential for terrestrial threatened and endangered species?• Flora and fauna?
• Methodology is transferable across disciplines:• Originated as a predictive model for archaeologists
Discussion
Kentucky Transportation Centerwww.ktc.uky.edu
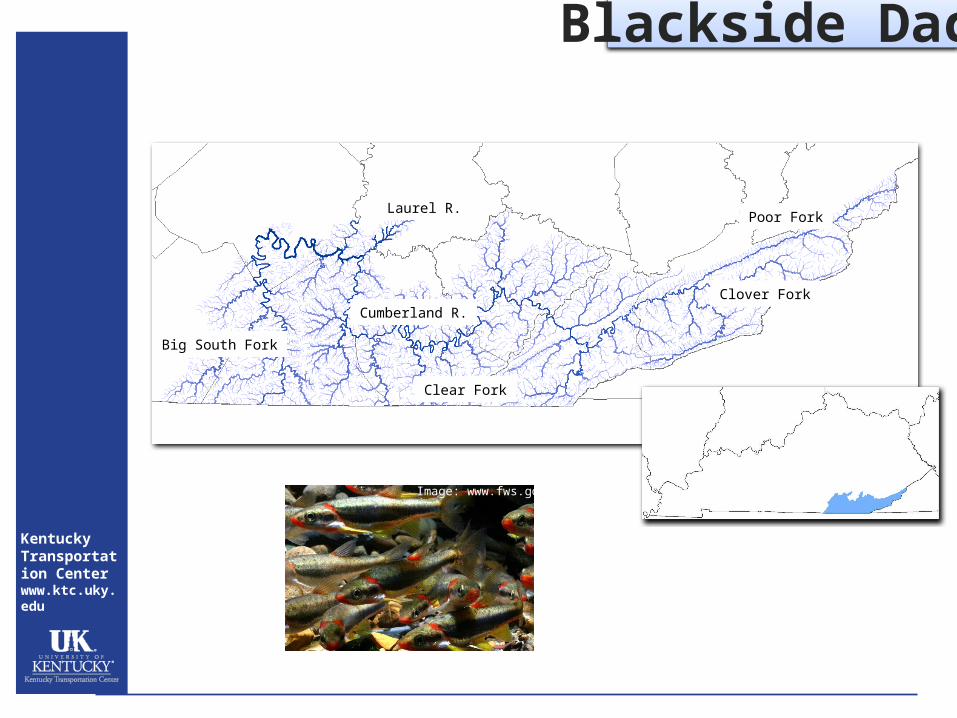
Big South Fork
Laurel R.
Clear Fork
Poor Fork
Clover ForkCumberland R.
Blackside Dace
Image: www.fws.gov

Kentucky Transportation Centerwww.ktc.uky.edu
Blackside Dace