Embed Size (px)
Citation preview
Preliminary draft
Benevolent Autocrats1
William Easterly
NYU, NBER, BREAD
May 2011
Abstract: Benevolent autocrats are leaders in non-democratic polities who receive credit for high growth. This paper asks two questions: (1) do theory and evidence support the concept of “benevolent autocrats”? (2) Regardless of the answer to (1), why is the “benevolent autocrats” story so popular? This paper’s answer to (1) is no. Most theories of autocracy portray it as a system of strategic interactions rather than simply the unconstrained preferences of the leader. The principal evidence for benevolent vs. malevolent autocrats is the higher variance of growth under autocracy than under democracy. However, the variance of growth within the terms of leaders swamps the variance across leaders, and more so under autocracy than under democracy. The empirical variance of growth literature has identified many correlates of autocracy as equally plausible determinants of high growth variance. The growth effects of exogenous leader transitions under autocracy are too small and temporary to provide much support for benevolent autocrats. This paper addresses question (2) by analyzing the political economy of development ideas that makes benevolent autocrats a politically convenient concept. It also identifies cognitive biases that would tend to bias perceptions in favor of benevolent autocrats. The answers to (2) do not logically disqualify the benevolent autocrats story, but combined with (1) they suggest much greater skepticism about many claims for benevolent autocrats.
1 I am grateful to Steven Pennings for research assistance, and to Michael Clemens, Alejandro Corvalan, Janet Currie, Angus Deaton, Adam Martin, Steven Pennings, Lant Pritchett, Shanker Satyanath, Alastair Smith, and Claudia Williamson for comments.
Benevolent autocrats are a perpetually popular concept in economic development discussions. Some of the largest successes in development, such as China, Singapore, South Korea, Taiwan, and Hong Kong, are associated with autocrats. Some plausible interpretations of these successes are that countries at low levels of education and income are not ready for democracy, that autocrats are necessary to take difficult decisions that pay off in the long run but democracies would not choose in the short run, or that development benefits from expert technical knowledge that the ruler must be free to implement without democratic checks and balances.
Today, benevolent autocrats appear in many discussions of development in the popular press, in more formal policy discussions, and in the academic literature. The New York Times columnist Thomas Friedman said in 2010:
One-party autocracy certainly has its drawbacks. But when it is led by a reasonably enlightened group of people, as China is today, it can also have great advantages. That one party can just impose the politically difficult but critically important policies needed to move a society forward in the 21st century.
Notable development intellectuals Nancy Birdsall and Frank Fukuyama (2011, p. 51) noted the effect of the current crisis on ideas favoring autocracy (they make clear they are summarizing others’ views, not their own view):
Leaders in both the developing and the developed world have marveled at China’s remarkable ability to bounce back after the crisis, a result of a tightly managed, top-down policymaking machine that could avoid the delays of a messy democratic process. In response, political leaders in the developing world now associate efficiency and capability with autocratic political systems.
Some have even suggested that a “Beijing Consensus” is replacing the old “Washington Consensus” of the World Bank and IMF, suggesting “how China's authoritarian model will dominate the twenty-first century” (Halper 2010).
Benevolent autocrats also appear in the academic literature:
Democracies may be able to prevent the disastrous economic policies of Robert Mugabe in Zimbabwe or Samora Machel in Mozambique; however, they might also have constrained the successful economic policies of Lee-Kwan Yew in Singapore or Deng Xiaoping in China. (Jones and Olken (2005))
Glaeser, La Porta, Lopez de Silanes, and Shleifer (2004) similarly argue that
Although nearly all poor countries in 1960 were dictatorships, some of them managed to get out of poverty, while others stayed poor. This kind of evidence is at least suggestive that it is the choices made by the dictators, rather than the constraints on them , that have allowed some poor countries to emerge from poverty.
An earlier reference is Sah 1991:

Highly centralized societies … may get a preceptor like Lee Kwan Yu of Singapore or the late Chung Hee Park of South Korea, who have been viewed as having made substantial contributions to their societies. By the same token, such a society may get a preceptor like Idi Amin of Uganda, with correspondingly opposite consequences. … an effect of human fallibility is that more centralized societies will have more volatile performances.
On the border between policymaking and academia was a major report called the Growth Commission Report (2008), sponsored by the World Bank but involving contributions by many academics and led by Nobel Laureate Michael Spence. One of the strongest conclusions in the report, after studying rapid growth success stories, was that
“Growth at such a quick pace, over such a long period, requires strong political leadership.”2
The report did not define very precisely what was “strong leadership.” However, almost all of the successes it studied were autocracies, so “strong leadership” does seem close to the “benevolent autocrat” concept. The operational definition of a benevolent autocrat implied by much of the discussion in both policymaking and academic circles is simply the coexistence of autocracy with high growth, with the high growth attributed to the autocratic leader. The attribution implies an autocrat who prefers high to low growth (this is what defines “benevolent”) and is knowledgeable and powerful enough to realize these preferences.
This paper asks two questions: (1) what is the current state of theory and evidence on benevolent autocrats? (2) why is the concept of benevolent autocrats as popular as it is?3
This paper is somewhere in between a survey and original work, as open questions in the survey will be further developed by this paper’s empirics. Although Question (2) is about the policy makers’ and media’s reception of the benevolent autocrat concept, it should still be of interest to an academic audience. There has recently been increased discussion about the political economy of the link between research and policy, such as the discussion as to whether randomized controlled trials are superior for
Of course, if (1) theory and evidence confirm the benevolent autocrat idea, then there is no automatic puzzle about (2). However, even then benevolent autocrat policy discussions often make little reference to any academic theory or evidence. And as we will see, support for benevolent autocrats from (1) is in fact weak or nonexistent, making question (2) all the more relevant.
2 This conclusion may have reflected strong priors as well as evidence assembled in the case studies done by the Commission. The “Framework for Case Studies” prepared before the Case Studies were done, made the statement that “economic growth requires: Leadership.” 3 This would include claims that democracy or democratic transitions could lead to violence or economic disruption, as in Collier (2009); I don’t attempt to survey the extensive literature but note Rodrik and Wacziarg (2005) as an introduction (they themselves find no evidence for economic disruption).
influencing policy to other forms of evidence (Duflo and Kremer, Banerjee). The benevolent autocrat concept lends itself well to a case study in this important area.
First, this paper discusses theory and evidence on benevolent autocrats. The benevolent autocrat idea goes together with the first generation of theory on autocracy. Today’s theories of autocracy, however, stress autocratic systems rather than individuals, and consider strategic interaction between the leader and others in which outcomes do not in general conform to the unconstrained preferences of the leader.
The evidence for benevolent autocrats initially consisted of a simple stylized fact: (1) autocrats sometimes obtain very high economic growth, while democrats rarely do. However, further work explained (1) with: (2) the variance of growth is higher under autocracy than under democracy. (2) could still be driven by benevolent vs. malevolent autocrats. This paper adds a general survey of the literature on determinants of growth variance, which finds a large number of other variance-producing factors, most of them strongly correlated with autocracy. Autocracy is not in general robust as a determinant of growth variance when these other controls are considered. Hence the key stylized fact (2) turns out to be much weaker, if not nonexistent, than previously acknowledged.
The most rigorous work supporting benevolent autocrats is (3) Olken and Jones’(2005) finding that accidental deaths of leaders cause growth to shift under autocracy, but not under democracy. However, the magnitudes and transitoriness of their growth effect is not sufficient to explain the usual “benevolent autocrat” outcome. There is also some distance between showing a growth effect of an accidental succession in an autocratic system to verifying the benevolent autocrat story.
Second, the paper describes the history of the benevolent autocrat concept and shows how the concept’s popularity may reflect not only academic testing but also attitudes toward developing societies and political interests. This history does not automatically discredit the concept. At the same time, however, priors should not be influenced unduly by the popularity of the concept if this popularity partly exists for non-academic reasons.
Third, the paper suggests that a number of cognitive biases identified in the behavioral economics literature would support beliefs in benevolent autocrats even if they did not really exist. The paper discusses how cognitive biases affect the interpretations of the stylized facts identified in the first section, usually in the direction of greater belief in benevolent autocrats. Again, showing how cognitive biases matter does not constitute any sort of disproof of benevolent autocrats, but this does suggest the need for critical academic scrutiny of these beliefs is even greater than before.
I. Theory and Evidence
Although much of the discussion on benevolent autocrats seems to be driven by very simple models and stylized facts, it is worth examining the concept from the viewpoint of the more formal literature on the theory and evidence on autocracy.
1. Theory of autocracy
Policy-makers’ discussions of benevolent autocrats assume a very simple theory where the autocrat chooses policies and then implements them. In other words, they assume an omnipotent autocrat, so that the outcomes observed under autocracy reflect the intentions of the autocrat. There is hardly space here to do a general survey of the theory of autocracy, but a few examples will illustrate how these theories relate to the idea of the unconstrained autocrat who realizes his own preferences. The classic book by Bueno de Mesquita et al. (2003) introduced the concept of a “selectorate” that chooses an autocratic leader and can remove him. Although they identify situations in which the autocrat has a lot of discretionary power, there are other situations in which he is heavily constrained by the selectorate. Acemoglu and Robinson (2005) have a similar idea, with the key dimension of an autocracy not the absence of an electorate but a much smaller one limited to the elite, but whom still hold the autocrat accountable to their interests. An additional constraint on the autocrat in Acemoglu and Robinson is the threat of revolution by those excluded from the “selectorate,” so some autocratic choices reflect concessions to potential rebels rather than the desired policies of the autocrat. Besley and Kudamatsu (2009) develops these stories further. Factors like inequality, natural resource revenues, and institutional rules followed by the selectorate influence the political economy outcome under autocracy, although space prevents spelling this out in detail. One prediction that is ironic for the “benevolent autocrat” idea is that autocracy performs best when the individual who occupies the leadership position matters least. Besley, for example, shows theoretically how “autocratic government works well when the power of the selectorate does not depend on the existing leader remaining in office.” These stories make it unlikely that outcomes correspond to the intentions of the individual autocratic leader. The outcomes will also reflect the constraints imposed by the selectorate and by the threat of revolution. Moreover, these theories raise the possibility that even if intentions of the leader did coincide with outcomes, there may be other explanations than simply the effect of direct actions by the leader. A system that produces a well-intentioned autocrat may have many other positive features that affect outcomes. Similarly, if a particularly destructive and evil leader is in power, this could be a symptom of a system that has toxic characteristics that may themselves directly affect outcomes. Chaves and Robinson (2010) address similar issues about preferences and outcomes concerning civil war. The analogous simple model is that civil war is a contest between two parties with different preferences, so the outcome will reflect the preferences of the winning side. Chaves and Robinson 2010 discuss (both theoretically and in case studies of Sierra Leone and Colombia) how the outcome may not reflect the initial preferences of either side, since the war mobilizes new groups who may alter the outcome. This principle of unintentional consequences has long been known in historical studies of civil wars. More eloquently, Abraham Lincoln said about the US Civil War, “Neither party expected for the war, the magnitude, or the duration, which it has already attained…Each looked for an easier triumph, and a result less fundamental and astounding.”
Similarly, the outcome under autocracy is the endogenous general equilibrium result of a complicated game among many diverse players, and there are many possibilities for outcomes to diverge from intentions of any one player. As Kenneth Arrow said, “[T]he notion that through the workings of an entire system effects may be very different from, and even opposed to, intentions is surely the most important intellectual contribution that economic thought has made to the general understanding of social processes.”
Earlier theories of autocracy had been closer to the simplest model in which the autocrat is unconstrained (Olson 2000). Yet even these theories had the autocrat maximizing in response to circumstances. Conditions under which the autocrat could expect to remain in power (the “stationary bandit”) led to better choices than those in which his tenure would be short (the “roving bandit”). These theories of autocracy are helpful in explaining under what situations autocracy could be consistent with rapid growth. The benevolent autocrat concept instead stresses benevolent intentions of individual personalities rather than situational factors. Why does it matter whether a successful autocracy is the result of intentions or circumstances? In the former case, one trusts the autocrat to do good things no matter what the circumstances. In the latter case, the effect of any action by others could alter circumstances in either direction. For example, foreign aid donors trust the “benevolent individual” to use the money wisely. But aid could instead make the donor less accountable to the selectorate or potential revolutionaries, and thus lead to worse political economy outcomes. To give another example of policy implications, the benevolent individual model may see any ill-chosen policy as the result of ignorance, and so the answer is simply more expert advice and education. For example, the World Bank Growth Commission (2010) announced on the back cover of one of its most recent reports: “The Commission’s audience is the leaders of developing countries.” Aid agency and think tank studies often seem geared to finding the ideal advice for an unconstrained leader, with little or no consideration of the political economy of decision-making or of leader selection.
2. Knowledge problems
The naïve discussion of benevolent autocrats seems to assume omniscience as well as omnipotence. If we assume the outcome of high growth reflects the intention of the autocrat, he must also know HOW to raise growth. Even if the problem is simply “educating the autocrat,” what is going to be on the syllabus? The last decade has been marked by an increasing number of economists admitting that we have little reliable knowledge on how to increase growth. For example, Harberger 2003 says “There aren’t too many policies that we can say with certainty … affect growth.” A forum called the Barcelona Development Agenda (2004) –which included academic economists like Blanchard, Calvo, Fischer, Frankel, Gali, Krugman, Rodrik, Sachs, Stiglitz, Velasco, Ventura, and Vives -- said “there is no single set of policies … to ignite sustained growth.”4
4
Rodrik 2007 confessed “experience …frustrated the expectations
http://www.bcn.es/forum2004/english/desenvolupament.htm

…{that} we had a good fix on the policies that promote growth.” Banerjee (2009) suggests “it is not clear that the best way to get growth is to do growth policy of any form. Perhaps making growth happen is ultimately beyond our control. … Perhaps we will never learn where {growth} will start or what will make it continue.” The same Growth Commission report that stressed enlightened leadership also confessed ignorance about how to raise growth:
This report is the product of two years of inquiry and debate, led by experienced policy makers, business people and two Nobel prize-winning academics, who heard from leading authorities on everything from macroeconomic policy to urbanization. If there were just one valid growth doctrine, we are confident we would have found it.
Instead the report said: “It is hard to know how the economy will respond to a policy, and the right answer in the present moment may not apply in the future.” The uncertainty surrounding policy recommendations by economists has been getting new attention from the profession outside of development and growth. Manski (2011) notes that “Analyses of public policy regularly express certitude about the consequences of alternative policy choices. Yet policy predictions often are fragile…” The financial crisis since 2008 also caused many doubts about confident policy recommendations by economists. Lo and Mueller (2010) note the various levels of uncertainty possibly afflicting general equilibrium outcomes, and suggested “model uncertainty”as a major problem: “we are in a casino that may or may not be honest, and the rules tend to change from time to time without notice.” Caballero (2010) criticizes the “pretense-of-knowledge syndrome” in macroeconomics today, in which the precision of the model is confused with that of the real world. If economists don’t know how to raise growth, then on what basis does the autocrat know how? Some of those who make the above “general ignorance” statements recommend instead a context-specific set of ideas on how to raise growth. But the knowledge problem is even more severe if general rules cannot be tested in a large sample, but there is a different rule for every observation. Of course, democratic leaders have similar knowledge problems at the center. Moreover, voters choosing policies and leaders have their own well-known incentives to under-invest in knowledge of public policy, as well as the possibility of systematic biases (Caplan 2007) – including cognitive biases. A full discussion of the democratic alternative is beyond the scope of this paper. I will only suggest the difference is arguably that a democracy does not require as much centralized decision-making, because democratic rights make possible a decentralized system of feedback and accountability for many government actions. Getting back to centralized knowledge, the Growth Commission suggested an experimental approach might work, as does Rodrik (2005). Learning what raises the permanent growth rate by trial and error is going to be difficult, however, when the annual growth rates contain a large transitory component (as we will see below). The growth rate feedback each year from the experimental approach is going to contain

little signal relative to noise. Moreover, there is only one aggregate outcome and many things are changing at once in any real world policy change. Another way to think of the knowledge problem is to assume that there are a few benevolent autocrats, such as Lee Kuan Yew in Singapore or Park Chung-Hee in South Korea. Would this help solve the knowledge problem of any other would-be benevolent autocrats? There have been many attempts at executing the advice “just be like Korea (Singapore),” without obvious success. Part of the problem is that economists and other observers have large disagreements, if we continue to assume for illustration that Lee and Park were responsible for success, on what exactly they did in Korea or Singapore. Some economists use them as paragons of free markets and free trade, while others cite them as interveners using massive industrial policies. It is very unclear how an aspiring benevolent autocrat would solve any of the above knowledge problems.
3. Evidence on benevolent autocrats This section reviews the stylized facts and more formal evidence on benevolent autocrats.
a. Autocracy and growth The general result in the empirical growth literature is that there is no robust effect either way of autocracy on growth. This is notable since there is now agreed to have been some specification searching and publication bias in the empirical growth literature, so much so that 145 different variables were found to be significant at different times (Durlauf et al. 2005). At the same time, there is a robust stylized fact that very high growth occurs principally among autocracies and not among democracies.
b. Autocracy and variance of growth Another well known finding is that the variance of growth is higher under autocracies than under democracies (Weede, 1996; Rodrik,2000; Almeida and Ferreira, 2002 Quinn and Woolley, 2001, Acemoglu et al., 2003; Mobarak, 2005, Yang 2008). Variance here can mean either cross-section variance among autocracies compared to democracies, or average within country variance for autocracies relative to democracies. The high variance under autocracy is the obvious explanation for the two stylized facts in the previous section. As many authors have put it, autocracy is a gamble that could either yield a Lee Kuan Yew or a Mobutu. Here we update and further document these results. This paper will use the standard Polity IV measure from -10 to 10, the most common measure in empirical economics for autocracy.

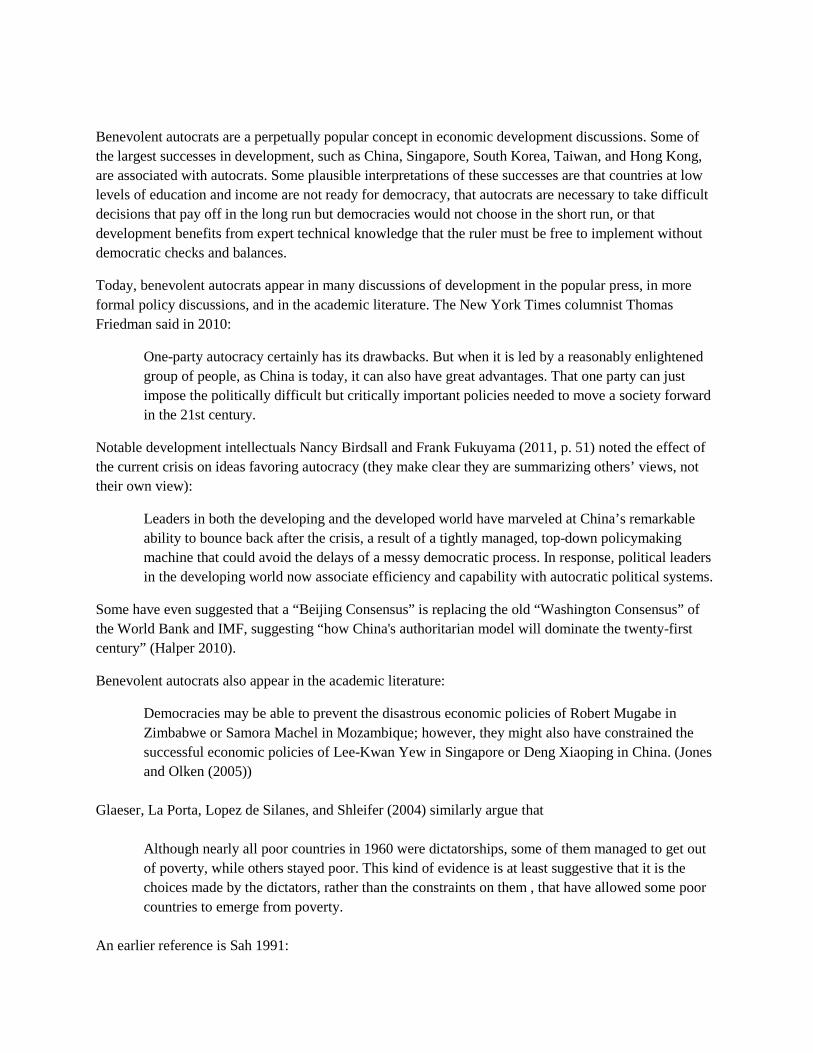
Figure 1: Cross section averages of per capita growth and average Polity score from Autocracy (-10) to Democracy (10), 1960-2008
CHN TAW BWAKORBTN
SGPOMN VNM
THA CYPMYS IRLJPNIDNLAO MUSPRT LVATUN GRCESP LKAHUNEGY DOM IND NORFINLSO ISRAUTSWZESTPAK ITACHL BELTTOUGA PAN TUR SVK NLDJOR FRABGR BRA CRISWEDNKCANSYR MNG GBRUSAMAR COLMOZ DEUMEX AUSALBIRN PRYGAB ECUROMBFA URYPHL CHEGTMMLI FJIBGDBHR COG HNDARGSDN NZLSLVNPL GEOPERKEN NGADZA ZAFPNGETH GUYMWISAU MRTRWA JAMGINCMR NAMTGO GMBBEN BOLSLEGHABDI VENTCD NICZWECIV SEN COMGNBSOMZMB MDGCAF
NER
ARE
ZAR
KWT LBR
-.04
-.02
0.0
2.0
4.0
6gr
ow61
08
-10 -5 0 5 10polity6008
Note that the reduction in cross-section variance mainly occurs for countries at a very high level of democracy (8,9, or 10). We will use this fact in what follows.
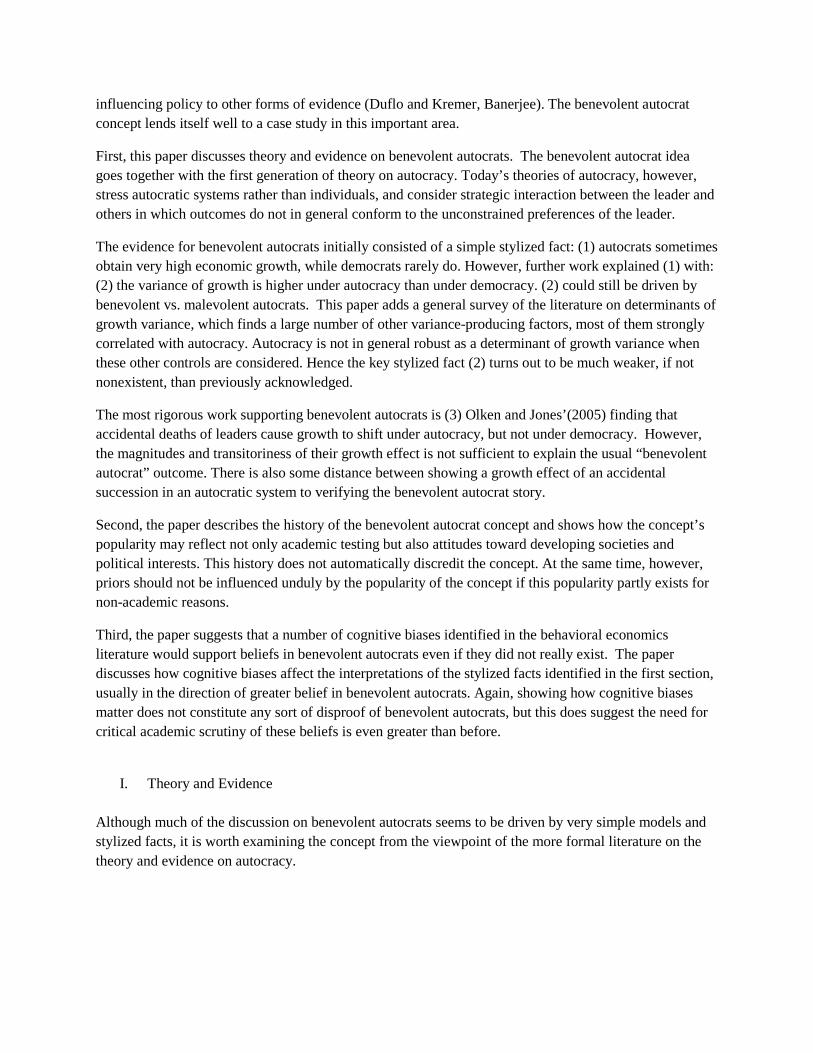
Figure 2 shows the within-country standard deviation of growth rates graphed against average polity score, 1960-2008. 5
5 In order to show better the variation in the bulk of the sample, the graph omits one outlier consistent with the inverse relationship: Liberia (Polity=-3.2040, Standard deviation of growth=.182518).
The simple correlation is -.58. Once again, the variance is strikingly lower at the very highest values of Polity close to 10.
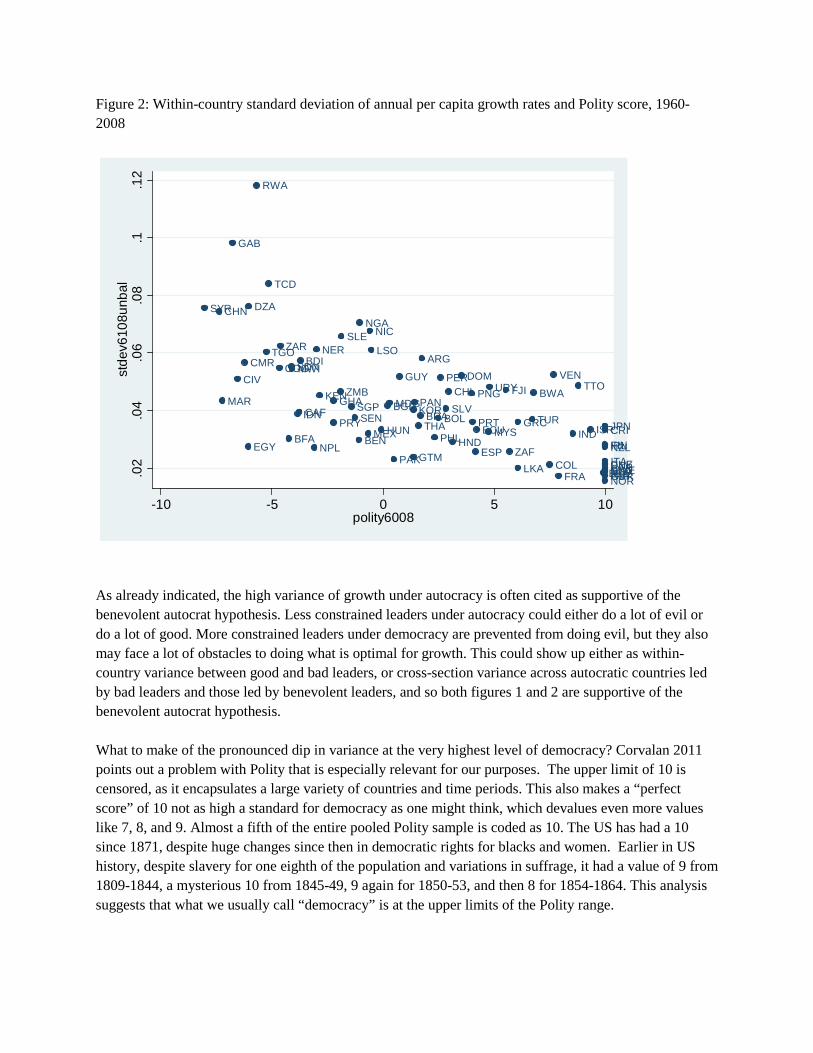
Figure 2: Within-country standard deviation of annual per capita growth rates and Polity score, 1960-2008
CHN
BWAKORSGP
THA MYSIRL
JPNIDN
PRT GRC
ESPLKA
HUNEGY
DOM
IND
NOR
FIN
LSO
ISR
AUTPAK ITA
CHL
BEL
TTOPAN
TUR
NLDFRA
BRACRI
SWEDNKCAN
SYR
GBRUSA
MAR
COL
MEXPRY
GAB
ECUBFA
URY
PHL
CHEGTM
FJIBGD
COG
HND
ARGSDN
NZL
SLV
NPL
PER
KEN
NGADZA
ZAF
PNGGUY
MWI
RWA
CMRTGO
BEN
BOL
SLE
GHA
BDIVEN
TCD
NIC
CIV
SEN
ZMBMDG
CAF
NERZAR
.02
.04
.06
.08
.1.1
2st
dev6
108u
nbal
-10 -5 0 5 10polity6008
As already indicated, the high variance of growth under autocracy is often cited as supportive of the benevolent autocrat hypothesis. Less constrained leaders under autocracy could either do a lot of evil or do a lot of good. More constrained leaders under democracy are prevented from doing evil, but they also may face a lot of obstacles to doing what is optimal for growth. This could show up either as within-country variance between good and bad leaders, or cross-section variance across autocratic countries led by bad leaders and those led by benevolent leaders, and so both figures 1 and 2 are supportive of the benevolent autocrat hypothesis. What to make of the pronounced dip in variance at the very highest level of democracy? Corvalan 2011 points out a problem with Polity that is especially relevant for our purposes. The upper limit of 10 is censored, as it encapsulates a large variety of countries and time periods. This also makes a “perfect score” of 10 not as high a standard for democracy as one might think, which devalues even more values like 7, 8, and 9. Almost a fifth of the entire pooled Polity sample is coded as 10. The US has had a 10 since 1871, despite huge changes since then in democratic rights for blacks and women. Earlier in US history, despite slavery for one eighth of the population and variations in suffrage, it had a value of 9 from 1809-1844, a mysterious 10 from 1845-49, 9 again for 1850-53, and then 8 for 1854-1864. This analysis suggests that what we usually call “democracy” is at the upper limits of the Polity range.
A few exercises for this paper will be performed using a binary split for democracy and autocracy. Since the point of this paper is to skeptically re-examine the Benevolent Autocrat idea, it makes sense to choose a binary split that gives the strongest version of the democracies-have-lower-variance stylized fact that is one of the principal pieces of evidence in favor of Benevolent Autocrats. I first want to make the case as strong as possible for that hypothesis and then see if it fails other tests.
Hence, I chose >7.5 on Polity as the cutoff for democracy. Now, to analyze the variances for autocracies and democracies a bit more formally, consider a standard decomposition of the annual growth rates for country i and period t into a permanent (µi) and transitory (εit )component for a panel of countries, along with year dummies (γt):
(1) git = µi +γt+ εit Using fixed effects for a balanced panel of 84 countries 1960-2008, we can estimate the standard error of the permanent and transitory components:
Table 1: Fixed effects regression for GDP per capita growth, balanced sample, annual data 1960-2008 (controlling for year dummies)
Autocracy Democracy Standard error of μ(i) 0.0175 0.0076 Standard error of ε(i,t) 0.0537 0.0256 # countries 65 21
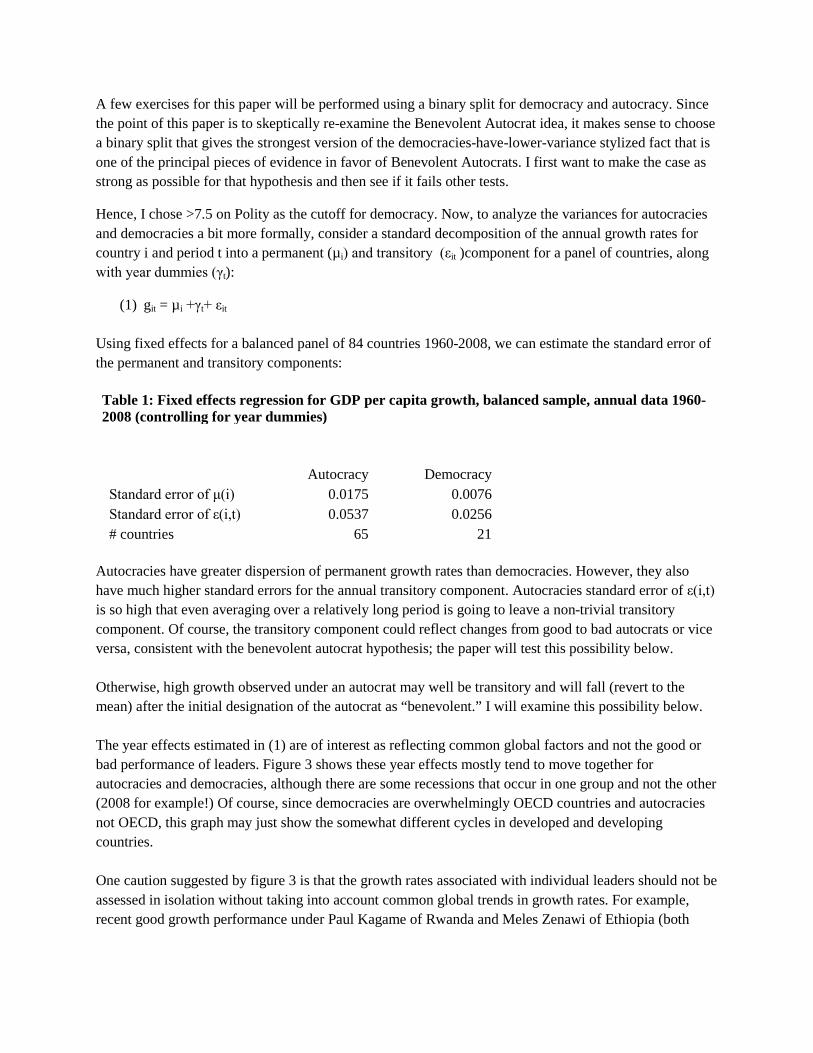
Autocracies have greater dispersion of permanent growth rates than democracies. However, they also have much higher standard errors for the annual transitory component. Autocracies standard error of ε(i,t) is so high that even averaging over a relatively long period is going to leave a non-trivial transitory component. Of course, the transitory component could reflect changes from good to bad autocrats or vice versa, consistent with the benevolent autocrat hypothesis; the paper will test this possibility below. Otherwise, high growth observed under an autocrat may well be transitory and will fall (revert to the mean) after the initial designation of the autocrat as “benevolent.” I will examine this possibility below. The year effects estimated in (1) are of interest as reflecting common global factors and not the good or bad performance of leaders. Figure 3 shows these year effects mostly tend to move together for autocracies and democracies, although there are some recessions that occur in one group and not the other (2008 for example!) Of course, since democracies are overwhelmingly OECD countries and autocracies not OECD, this graph may just show the somewhat different cycles in developed and developing countries. One caution suggested by figure 3 is that the growth rates associated with individual leaders should not be assessed in isolation without taking into account common global trends in growth rates. For example, recent good growth performance under Paul Kagame of Rwanda and Meles Zenawi of Ethiopia (both
often described as benevolent autocrats) should take into account (but usually does not) the good growth performance of all autocracies/developing countries in 2003-2008. Figure 3: Common year effects for per capita growth in Autocracies and Democracies
In what follows, I do some exercises to see where these two other sources of variance (cross country and within country) are coming from.
c. Decomposing variance into leader effects
One test of the benevolent autocrat hypothesis is whether a major part of the cross country and within country variance under autocracies is explained by the variance across leaders – as opposed to variance within leader’s time in office. The results can be compared with the same exercise for democratic leaders as a benchmark.6
The paper first estimates this equation:
(2) gijt = µij +γt+ εijt where i indexes countries, j indexes leaders, and t indexes time. This specification allows leader effects to explain both cross country and within country variance. It will be estimated separately for autocracies and
6 I am grateful to Alejandro Corvalan for suggesting the broad outlines of this exercise, although of course as usual the author bears responsibility for any errors.
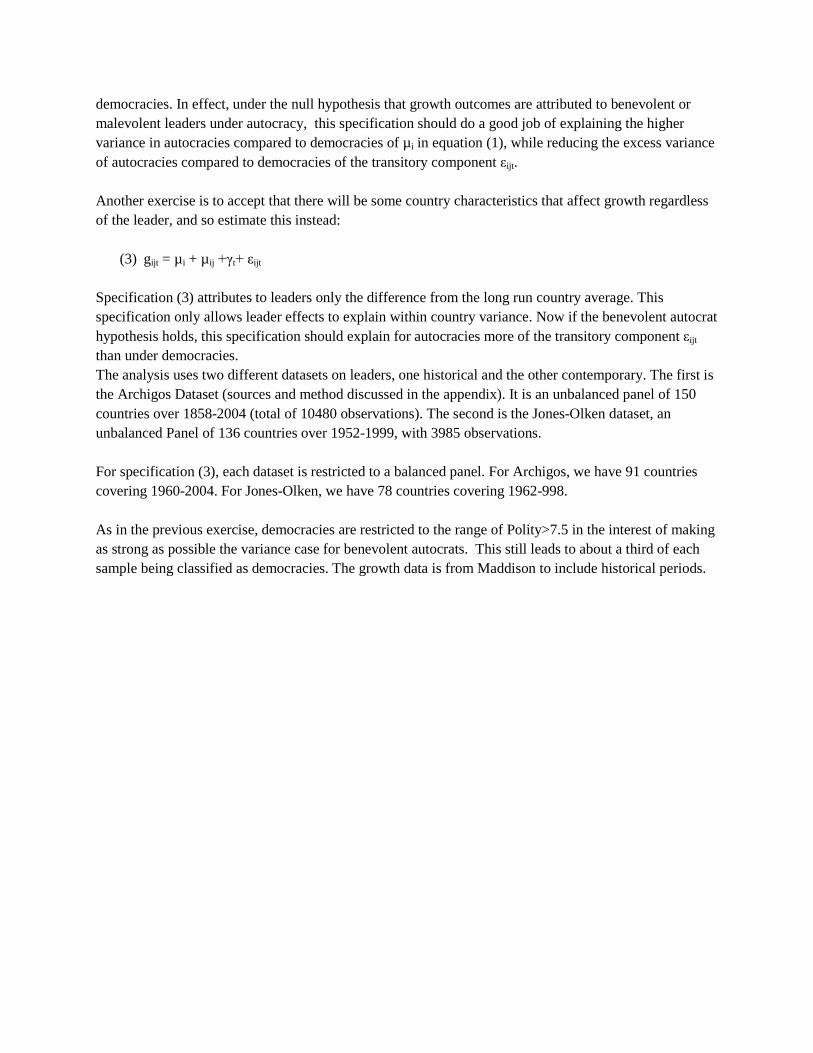
democracies. In effect, under the null hypothesis that growth outcomes are attributed to benevolent or malevolent leaders under autocracy, this specification should do a good job of explaining the higher variance in autocracies compared to democracies of µi in equation (1), while reducing the excess variance of autocracies compared to democracies of the transitory component εijt. Another exercise is to accept that there will be some country characteristics that affect growth regardless of the leader, and so estimate this instead:
(3) gijt = µi + µij +γt+ εijt Specification (3) attributes to leaders only the difference from the long run country average. This specification only allows leader effects to explain within country variance. Now if the benevolent autocrat hypothesis holds, this specification should explain for autocracies more of the transitory component εijt than under democracies. The analysis uses two different datasets on leaders, one historical and the other contemporary. The first is the Archigos Dataset (sources and method discussed in the appendix). It is an unbalanced panel of 150 countries over 1858-2004 (total of 10480 observations). The second is the Jones-Olken dataset, an unbalanced Panel of 136 countries over 1952-1999, with 3985 observations. For specification (3), each dataset is restricted to a balanced panel. For Archigos, we have 91 countries covering 1960-2004. For Jones-Olken, we have 78 countries covering 1962-998. As in the previous exercise, democracies are restricted to the range of Polity>7.5 in the interest of making as strong as possible the variance case for benevolent autocrats. This still leads to about a third of each sample being classified as democracies. The growth data is from Maddison to include historical periods.
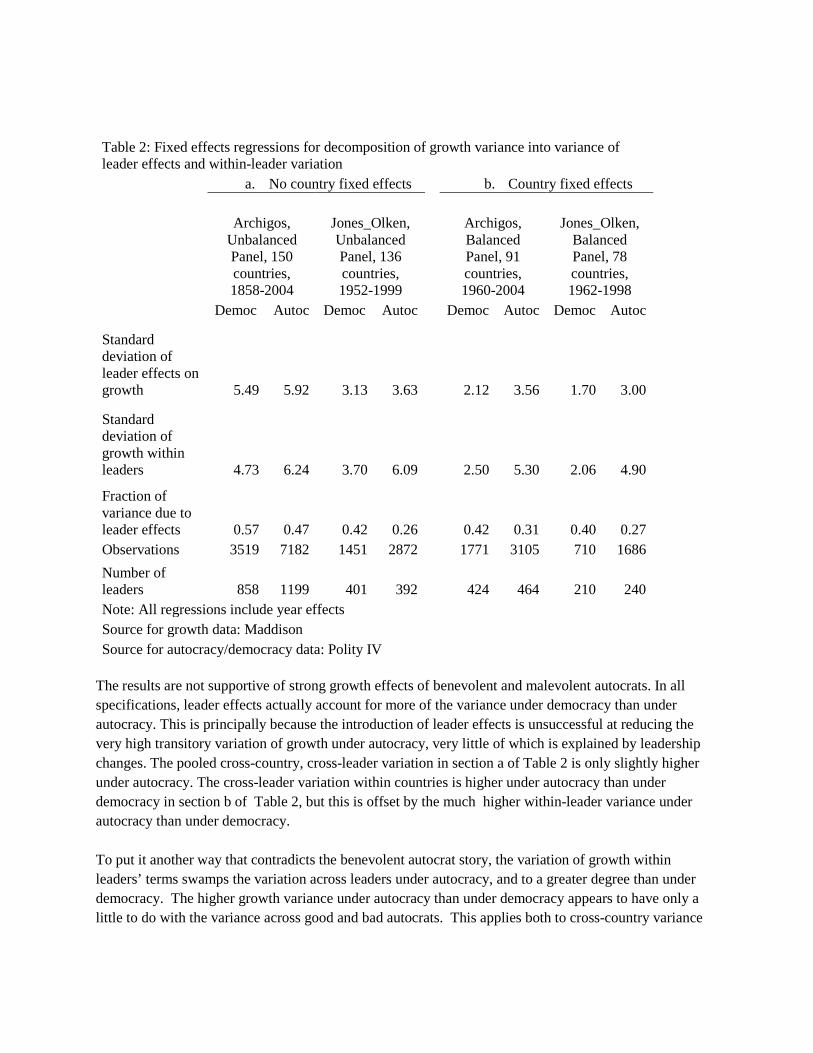
Table 2: Fixed effects regressions for decomposition of growth variance into variance of leader effects and within-leader variation
a. No country fixed effects
b. Country fixed effects
Archigos, Unbalanced Panel, 150 countries, 1858-2004
Jones_Olken, Unbalanced Panel, 136 countries, 1952-1999
Archigos, Balanced Panel, 91 countries, 1960-2004
Jones_Olken, Balanced Panel, 78 countries, 1962-1998
Democ Autoc Democ Autoc
Democ Autoc Democ Autoc
Standard deviation of leader effects on growth 5.49 5.92 3.13 3.63
2.12 3.56 1.70 3.00
Standard deviation of growth within leaders 4.73 6.24 3.70 6.09
2.50 5.30 2.06 4.90
Fraction of variance due to leader effects 0.57 0.47 0.42 0.26
0.42 0.31 0.40 0.27
Observations 3519 7182 1451 2872
1771 3105 710 1686 Number of leaders 858 1199 401 392
424 464 210 240
Note: All regressions include year effects Source for growth data: Maddison Source for autocracy/democracy data: Polity IV
The results are not supportive of strong growth effects of benevolent and malevolent autocrats. In all specifications, leader effects actually account for more of the variance under democracy than under autocracy. This is principally because the introduction of leader effects is unsuccessful at reducing the very high transitory variation of growth under autocracy, very little of which is explained by leadership changes. The pooled cross-country, cross-leader variation in section a of Table 2 is only slightly higher under autocracy. The cross-leader variation within countries is higher under autocracy than under democracy in section b of Table 2, but this is offset by the much higher within-leader variance under autocracy than under democracy. To put it another way that contradicts the benevolent autocrat story, the variation of growth within leaders’ terms swamps the variation across leaders under autocracy, and to a greater degree than under democracy. The higher growth variance under autocracy than under democracy appears to have only a little to do with the variance across good and bad autocrats. This applies both to cross-country variance
(Table 2 section a without country fixed effects) and within-country variance (Table 2 section b with country fixed effects).
d. Considering the general growth variance literature
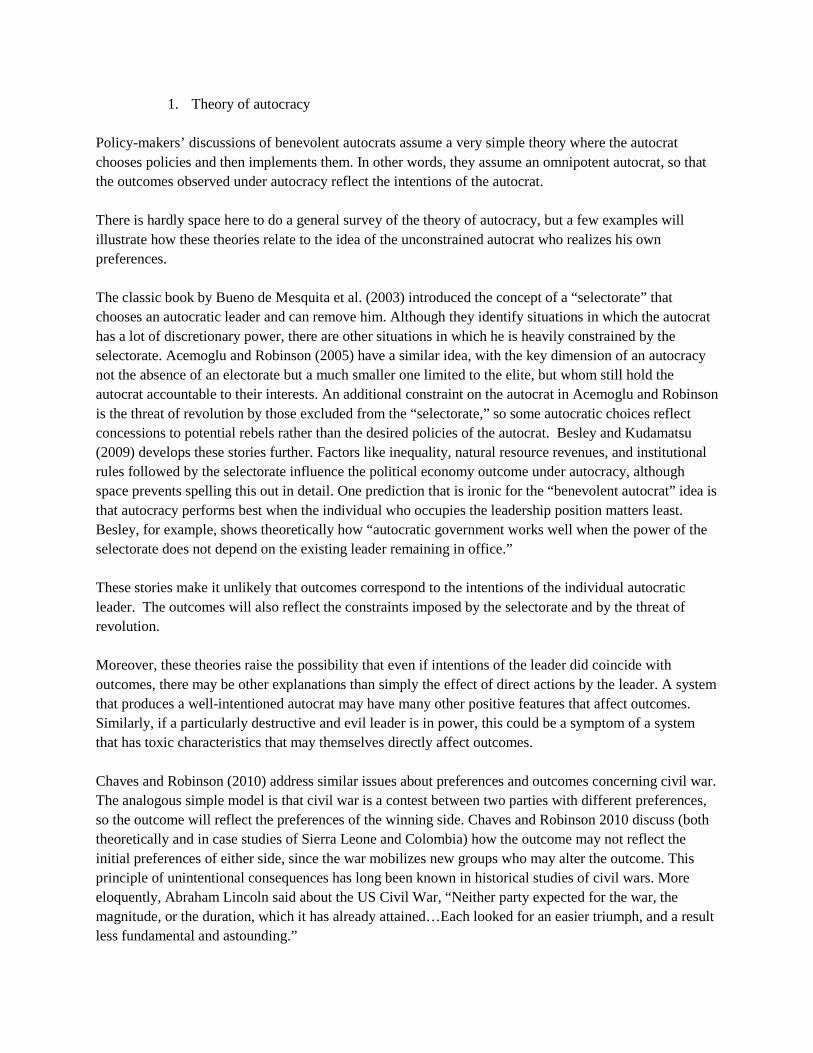
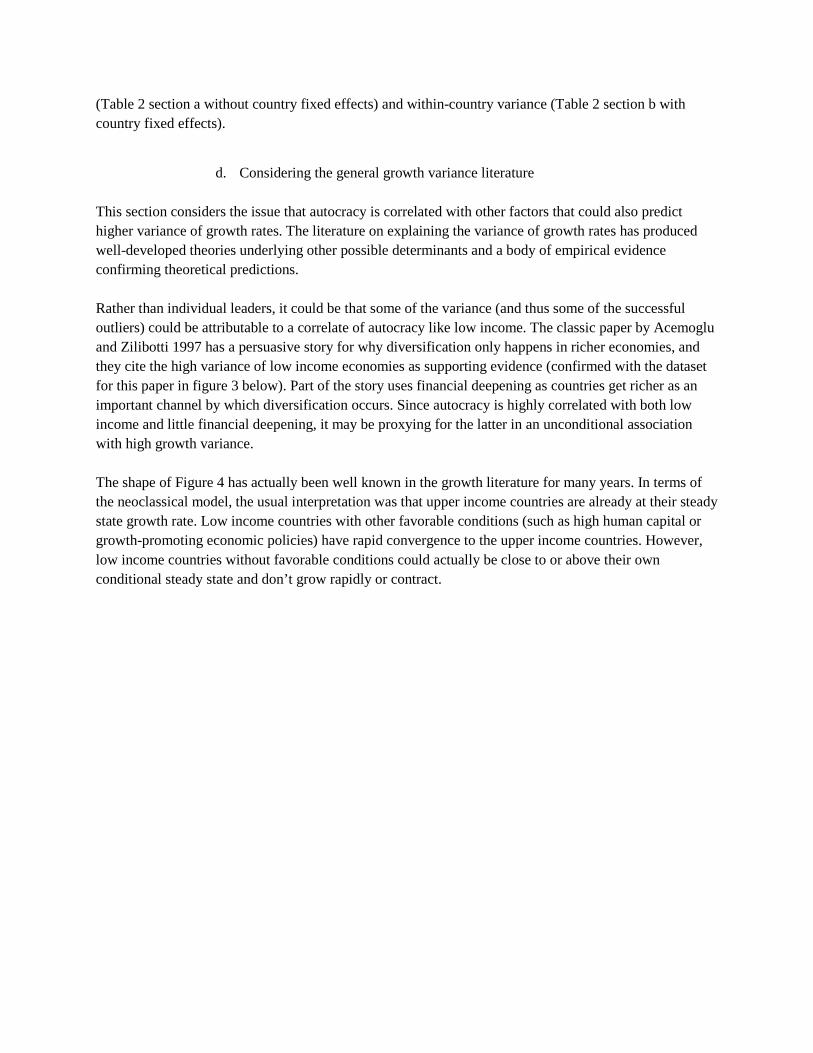
This section considers the issue that autocracy is correlated with other factors that could also predict higher variance of growth rates. The literature on explaining the variance of growth rates has produced well-developed theories underlying other possible determinants and a body of empirical evidence confirming theoretical predictions. Rather than individual leaders, it could be that some of the variance (and thus some of the successful outliers) could be attributable to a correlate of autocracy like low income. The classic paper by Acemoglu and Zilibotti 1997 has a persuasive story for why diversification only happens in richer economies, and they cite the high variance of low income economies as supporting evidence (confirmed with the dataset for this paper in figure 3 below). Part of the story uses financial deepening as countries get richer as an important channel by which diversification occurs. Since autocracy is highly correlated with both low income and little financial deepening, it may be proxying for the latter in an unconditional association with high growth variance. The shape of Figure 4 has actually been well known in the growth literature for many years. In terms of the neoclassical model, the usual interpretation was that upper income countries are already at their steady state growth rate. Low income countries with other favorable conditions (such as high human capital or growth-promoting economic policies) have rapid convergence to the upper income countries. However, low income countries without favorable conditions could actually be close to or above their own conditional steady state and don’t grow rapidly or contract.

Figure 4: Initial Income, 1960, and Growth Rates, 1960-2008
CHNBWAKOR
SGPOMN
THACYPMYS IRLJPNIDN MUSPRTLVATUN GRCESPLKA HUNEGYDOMIND NORFINLSO ISR AUTSWZPAK ITACHL BELTTOPANTUR NLDJOR FRABRACRI SWEDNKCANSYR GBR USAMAR COL DEUMEX AUSIRNPRY GABECUBFA URYPHL CHEGTMMLI FJIBGD COGHND ARGSDN NZLSLVNPL GEO PERKENNGA DZA ZAFPNGGUYMWIMRTRWA JAMGINCMRTGOGMBBEN BOLSLEGHABDI VENTCD NICZWE CIVSENGNBZMBMDGCAF
NER
ZAR
LBR
-.04
-.02
0.0
2.0
4.0
6gr
ow61
08
0 5000 10000 15000 20000y1960
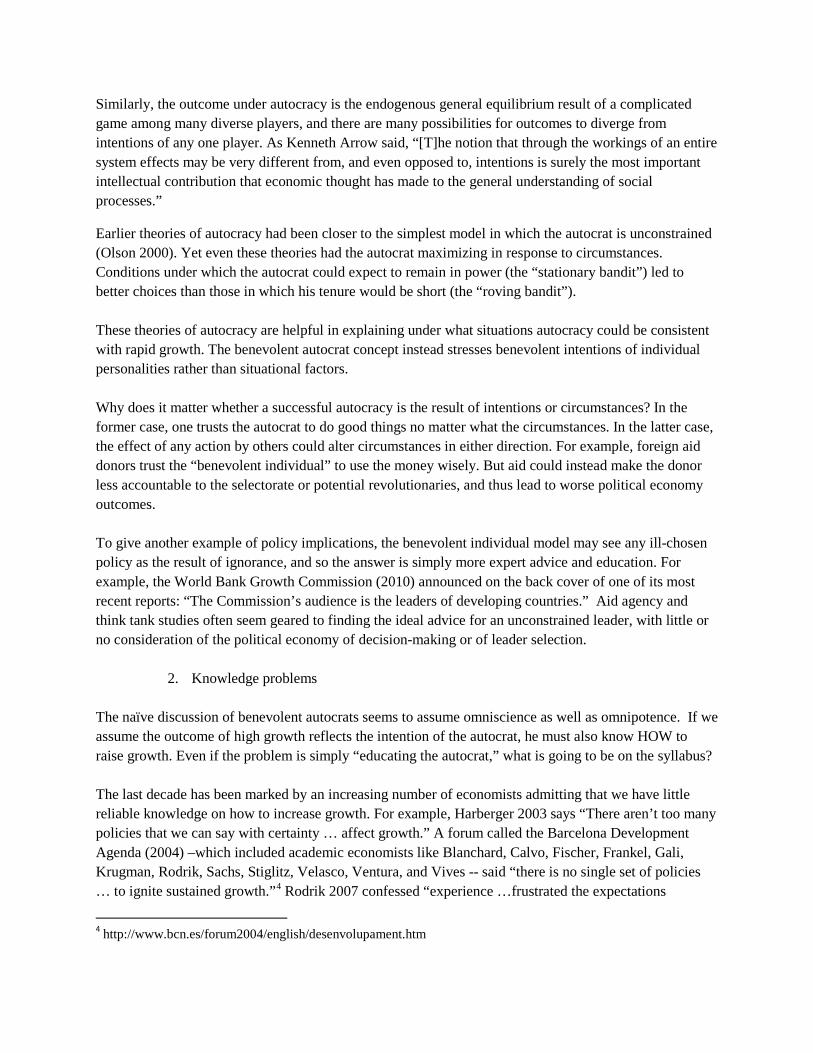
For what’s it worth, the empirical literature on variance of autocracies does control for per capita income, and they find the autocracy effect robust and the income effect weak (Weede 1996, Rodrik 2000, Acemgolu et al. 2003). Yang 2008 found also that the democracy effect on variance depends on ethnic heterogeneity. However, we will see later that the robustness does not survive a fuller set of tests. The problem is that there are many other variables besides income that are correlated with autocracy and predict high variance. For example, another seldom discussed stylized fact is that data quality is worse at low income. Using Summers-Heston’s 4-point grading system, Figure 5 shows (unsurprisingly) how lower quality data on growth has higher cross-section variance of growth outcomes. Taiwan and Bhutan are successes with the worst quality data, Zaire and Liberia are disasters in the same category. Taiwanese success and Liberian disaster are certainly not a pure artifact of bad data, but the success and disaster could be exaggerated.
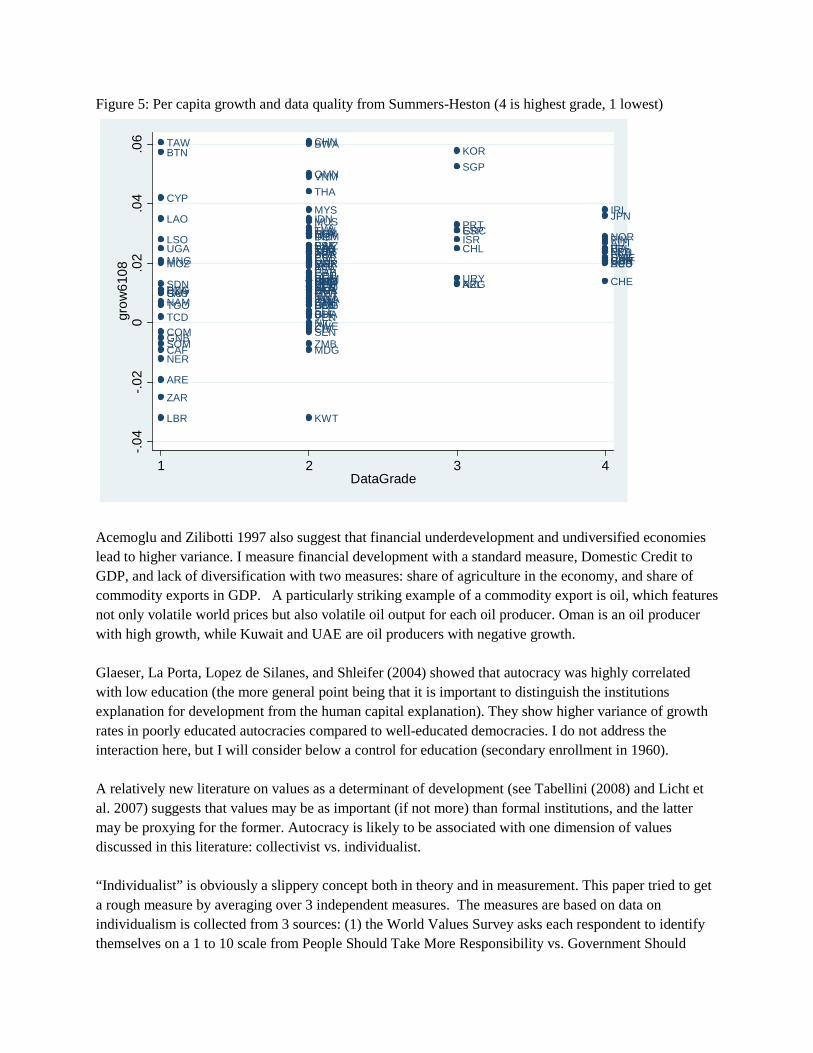
Figure 5: Per capita growth and data quality from Summers-Heston (4 is highest grade, 1 lowest)
CHNTAW BWAKORBTNSGP
OMNVNMTHACYPMYS IRLJPNIDNLAO MUS PRTLVATUN GRCESPLKAHUNEGYDOMIND NORFINLSO ISR AUTSWZESTPAK ITACHL BELTTOUGA PANTURSVK NLDJOR FRABGRBRACRI SWEDNKCANSYRMNG GBRUSAMARCOLMOZ DEUMEX AUSALBIRNPRYGABECUROMBFA URYPHL CHEGTMMLIFJIBGDBHRCOGHND ARGSDN NZLSLVNPLGEOPERKENNGADZA ZAFPNG ETHGUY MWISAU MRTRWAJAMGINCMRNAMTGO GMBBENBOLSLEGHABDIVENTCD NICZWECIVSENCOMGNBSOM ZMBMDGCAF
NER
ARE
ZAR
KWTLBR
-.04
-.02
0.0
2.0
4.0
6gr
ow61
08
1 2 3 4DataGrade
Acemoglu and Zilibotti 1997 also suggest that financial underdevelopment and undiversified economies lead to higher variance. I measure financial development with a standard measure, Domestic Credit to GDP, and lack of diversification with two measures: share of agriculture in the economy, and share of commodity exports in GDP. A particularly striking example of a commodity export is oil, which features not only volatile world prices but also volatile oil output for each oil producer. Oman is an oil producer with high growth, while Kuwait and UAE are oil producers with negative growth. Glaeser, La Porta, Lopez de Silanes, and Shleifer (2004) showed that autocracy was highly correlated with low education (the more general point being that it is important to distinguish the institutions explanation for development from the human capital explanation). They show higher variance of growth rates in poorly educated autocracies compared to well-educated democracies. I do not address the interaction here, but I will consider below a control for education (secondary enrollment in 1960). A relatively new literature on values as a determinant of development (see Tabellini (2008) and Licht et al. 2007) suggests that values may be as important (if not more) than formal institutions, and the latter may be proxying for the former. Autocracy is likely to be associated with one dimension of values discussed in this literature: collectivist vs. individualist. “Individualist” is obviously a slippery concept both in theory and in measurement. This paper tried to get a rough measure by averaging over 3 independent measures. The measures are based on data on individualism is collected from 3 sources: (1) the World Values Survey asks each respondent to identify themselves on a 1 to 10 scale from People Should Take More Responsibility vs. Government Should
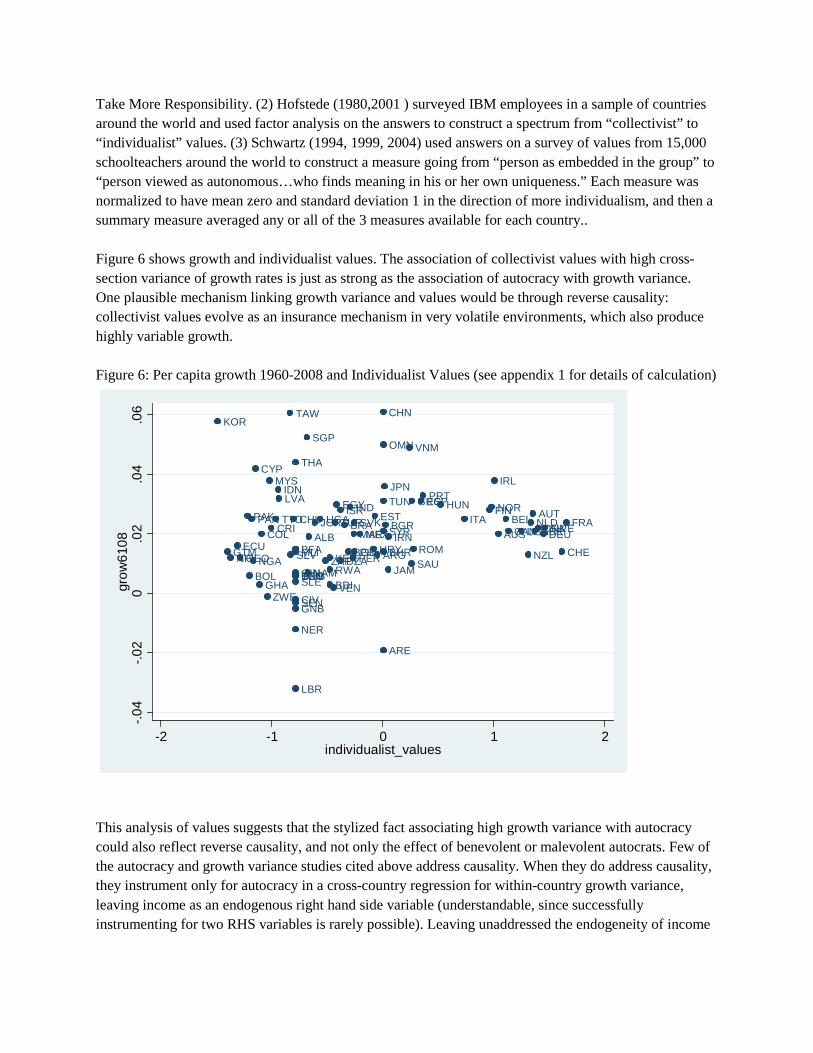
Take More Responsibility. (2) Hofstede (1980,2001 ) surveyed IBM employees in a sample of countries around the world and used factor analysis on the answers to construct a spectrum from “collectivist” to “individualist” values. (3) Schwartz (1994, 1999, 2004) used answers on a survey of values from 15,000 schoolteachers around the world to construct a measure going from “person as embedded in the group” to “person viewed as autonomous…who finds meaning in his or her own uniqueness.” Each measure was normalized to have mean zero and standard deviation 1 in the direction of more individualism, and then a summary measure averaged any or all of the 3 measures available for each country.. Figure 6 shows growth and individualist values. The association of collectivist values with high cross-section variance of growth rates is just as strong as the association of autocracy with growth variance. One plausible mechanism linking growth variance and values would be through reverse causality: collectivist values evolve as an insurance mechanism in very volatile environments, which also produce highly variable growth. Figure 6: Per capita growth 1960-2008 and Individualist Values (see appendix 1 for details of calculation)
CHNTAWKOR
SGPOMN VNM
THACYPMYS IRLJPNIDN PRTLVA TUN GRCESPHUNEGYIND NORFINISR AUTESTPAK ITACHL BELTTO UGAPAN TURSVK NLDJOR FRABGRBRACRI SWEDNKCANSYR GBRUSAMARCOL DEUMEX AUSALB IRN
ECU ROMBFA URYPHL CHEGTM MLI BGD BHRARG NZLSLVNPLGEO PERKENNGA DZAZAF SAURWA JAMGINNAMTGOGMBBENBOL SLEGHA BDIVENZWE CIVSENGNB
NER
ARE
LBR
-.04
-.02
0.0
2.0
4.0
6gr
ow61
08
-2 -1 0 1 2individualist_values
This analysis of values suggests that the stylized fact associating high growth variance with autocracy could also reflect reverse causality, and not only the effect of benevolent or malevolent autocrats. Few of the autocracy and growth variance studies cited above address causality. When they do address causality, they instrument only for autocracy in a cross-country regression for within-country growth variance, leaving income as an endogenous right hand side variable (understandable, since successfully instrumenting for two RHS variables is rarely possible). Leaving unaddressed the endogeneity of income

(which may be proxying for other variables correlated with income), however, still leaves unresolved the identification of the causal parameter from autocracy to growth variance. So far we have been discussing economic volatility, but what about political volatility? Low income countries are not only likely to be autocratic, but also to feature political instability like civil wars (or there may be a direct link from autocracy to these). Civil wars often feature steep economic declines during the war, followed by rapid growth after the end of the war. The timing of the war and its end during the period we are considering (1960-2008) could produce rapid growth for wars that end earlier in the period but negative growth for countries that are at war for most of the period or in the latter half of the period. Cyprus and China are coded as having a civil war in the first half of the period, followed by rapid growth (obviously not the only factor in China, but neither should it be ignored). Liberia and Democratic Republic of the Congo are in the reverse position of having a civil war in the latter part of the period. Finally, Easterly and Kraay (2000) have a completely unsurprising insight into high growth variance: small countries have higher variance than large countries. This could be a purely mechanical effect: if sectors or sub-sectors have fixed start-up costs and/or gains from specialization (as surely they do), then small economies will have fewer sectors and sub-sectors, i.e. be less diversified, and thus will be more volatile in response to industry-specific shocks. Easterly and Kraay link the higher variance also to greater openness of small states and greater sensitivity to terms of trade shocks. It is notable that some of the famous success stories (Hong Kong and Singapore) are small, as are some less famous succeses (Bhutan and Cyprus), while some of the disasters (Liberia, Guinea-Bissau and Niger) are also small. This survey of the variance literature for developing countries is far from complete. As an example, Easterly, Islam, and Stiglitz 2002 suggest that low income countries have far more variable macroeconomic policies (budget deficits, money growth, and inflation) than richer countries. A related finding by Bruno and Easterly (1998) shows that very high inflations are associated with negative growth, while stabilization from high inflation goes with high positive growth; virtually all of their examples of high inflations are from poor (mostly autocratic) countries. The classic paper by Ramey and Ramey (1995) also related output volatility to the volatility of government spending (higher in poor countries). Having already a long list of correlates of low income associated with the variance of growth, I refrain from following up on this macro literature in the rest of the paper.
e. Robustness checks for within-country variance regressions This section examines the simple and partial correlations of autocracy and the other determinants of variance mentioned above with growth variance. It will focus only on the within-country variance of per capita growth, the next section will shed some light on the cross-section variance. I consider measures of the variables mentioned above. Table 3 gives summary statistics and descriptions of the variables.
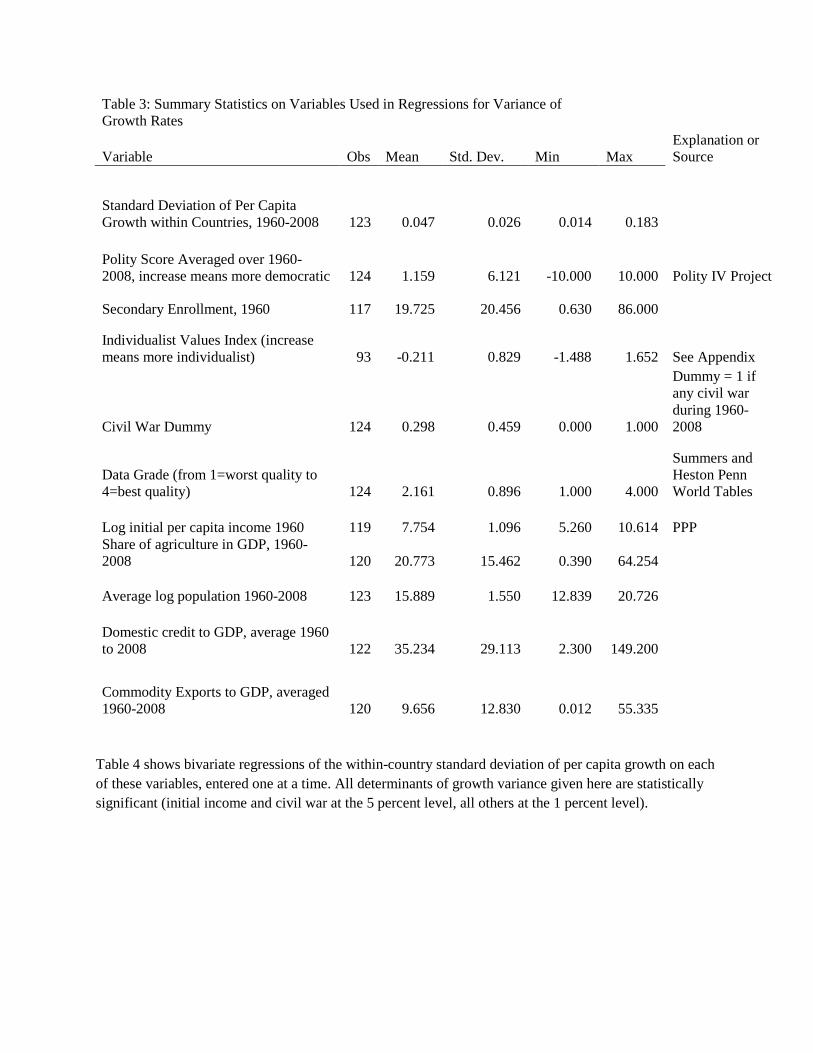
Table 3: Summary Statistics on Variables Used in Regressions for Variance of Growth Rates
Variable Obs Mean Std. Dev. Min Max
Explanation or Source
Standard Deviation of Per Capita Growth within Countries, 1960-2008 123 0.047 0.026 0.014 0.183
Polity Score Averaged over 1960-2008, increase means more democratic 124 1.159 6.121 -10.000 10.000 Polity IV Project
Secondary Enrollment, 1960 117 19.725 20.456 0.630 86.000
Individualist Values Index (increase means more individualist) 93 -0.211 0.829 -1.488 1.652 See Appendix
Civil War Dummy 124 0.298 0.459 0.000 1.000
Dummy = 1 if any civil war during 1960-2008
Data Grade (from 1=worst quality to 4=best quality) 124 2.161 0.896 1.000 4.000
Summers and Heston Penn World Tables
Log initial per capita income 1960 119 7.754 1.096 5.260 10.614 PPP Share of agriculture in GDP, 1960-2008 120 20.773 15.462 0.390 64.254
Average log population 1960-2008 123 15.889 1.550 12.839 20.726
Domestic credit to GDP, average 1960 to 2008 122 35.234 29.113 2.300 149.200
Commodity Exports to GDP, averaged 1960-2008 120 9.656 12.830 0.012 55.335
Table 4 shows bivariate regressions of the within-country standard deviation of per capita growth on each of these variables, entered one at a time. All determinants of growth variance given here are statistically significant (initial income and civil war at the 5 percent level, all others at the 1 percent level).

Table 4: Bivariate Regressions of Standard Deviation of Per Capita Growth within Countries, 1960-2008 on Right Hand Side Variables Shown, One at a Time
VARIABLES Coefficient and Standard Error Observations
R-squared
Polity Score Averaged over 1960-
2008 -0.00204*** 123 0.231
(0.000337)
Secondary Enrollment, 1960 -0.000457*** 116 0.151
(8.17e-05)
Individualist Values Index (increase means more individualist) -0.0114*** 92 0.115
(0.00265)
Civil War Dummy 0.0145** 123 0.065
(0.00592)
Data Grade (from 1=worst quality to 4=best quality) -0.0135*** 123 0.213
(0.00194)
Log initial income 1960 -0.00504** 118 0.045
(0.00222)
Share of agriculture in GDP, 1960-2008 0.000507*** 120 0.089
(0.000174)
Average log population 1960-2008 -0.00430*** 123 0.065
(0.00152)
Domestic credit to GDP, average 1960 to 2008 -0.000346*** 122 0.150
(6.76e-05)
Commodity Exports to GDP, averaged 1960-2008 0.000952*** 120 0.219
(0.000270)
Constant term included in each regression, not shown Robust standard errors in parentheses
*** p<0.01, ** p<0.05, * p<0.1
The large literature on growth regressions has demonstrated that there is no easy answer to separating out the partial correlation of one particular variable from a long list of other equally plausible variables (see

Durlauf et al. 2005, Levine and Renelt 1992). The scope for specification searching leads to results that are not credible. The same situation holds here. Indeed, it is not hard with the above variables to produce regressions either showing autocracy to be statistically significant with other controls or statistically insignificant. Table 5 shows that autocracy is (unsurprisingly) insignificant when adding all of the (very collinear) controls above, and continues to be insignificant as the most insignificant alternative controls are dropped. However, it is also possible to eventually drop enough insignificant controls to attain significance for autocracy. For example, Regression 7 shows growth variance driven by a plausible and statistically significant combination of autocracy, civil war, small population, and commodity exporting. Unfortunately, there are many other plausible and statistically significant combinations, some of which do not include autocracy. This table in the end has little useful information about whether autocracy is robustly significant or not relative to other determinants of variance. It clearly fails Levine and Renelt’s (1992) Extreme Bounds Analysis (from Leamer). It could do better on the Bayesian Model Averaging suggested by Sala-i-Martin et al. 2004, but this method has been shown to be itself not robust relative to small changes in datasets (Ciccone 2010).

Table 5: Multivariate regressions of standard deviation of per capita growth 1960-2008 on RHS Variables shown 1 2 3 4 5 6 7
Polity Score -0.000762 -0.000945 -0.000947 -0.00116* -0.000720 -0.000826 -
0.00127***
(0.000697) (0.000683) (0.000680) (0.000587) (0.000616) (0.000582) (0.000365)
Civil War Dummy 0.0103* 0.00916 0.00895 0.00850* 0.0115** 0.0121** 0.0149**
(0.00567) (0.00574) (0.00566) (0.00483) (0.00577) (0.00553) (0.00624)
Average log population -0.00178 -0.00208 -0.00195 -0.00176 -0.00303** -0.00340**
-0.00401***
(0.00152) (0.00150) (0.00156) (0.00131) (0.00148) (0.00133) (0.00131)
Commodity Exports to GDP 0.000824* 0.000777* 0.000777* 0.000688* 0.000716** 0.000733** 0.000570**
(0.000457) (0.000428) (0.000426) (0.000371) (0.000354) (0.000344) (0.000287)
Share of agriculture in GDP 0.000582 0.000610* 0.000588* 0.000362 0.000264 0.000314
(0.000377) (0.000345) (0.000317) (0.000273) (0.000254) (0.000238)
Data Grade -
0.00775** -0.00733* -0.00714* -0.00230 -0.00222
(0.00387) (0.00387) (0.00370) (0.00279) (0.00271)
Secondary Enrollment 0.000185* 0.000246** 0.000262* 0.000127
(0.000107) (0.000122) (0.000135) (0.000113)
Individualist Values Index 0.00452 0.00389 0.00388
(0.00416) (0.00364) (0.00365) Domestic credit
to GDP 5.80e-05 3.56e-05
(8.70e-05) (8.89e-05)
Log initial income 7.21e-05
(0.00393) Constant 0.0638 0.0688*** 0.0678*** 0.0606*** 0.0851*** 0.0849*** 0.102***
(0.0426) (0.0239) (0.0250) (0.0218) (0.0242) (0.0243) (0.0212)
Observations 82 83 83 111 118 118 120 R-squared 0.545 0.528 0.527 0.477 0.419 0.416 0.401 Robust standard errors in parentheses
*** p<0.01, ** p<0.05, *p<0.1
f. Evidence that Leaders Matter
Jones and Olken (2005, 2009) have produced some of the most important and careful evidence of the exogenous effects of individual autocrats. The random death of an autocratic leader changes the five-year average growth rate by a significant amount (either positively or negatively). Deaths of democratic leaders have no statistically significant effect. Successful assassination of an autocrat raises the probability of a transition to democracy by 13 percent. Assassination is obviously endogenous but they achieve identification through the exogenous difference between successful and failed assassination attempts. So what is this effect actually measuring? As described in the introduction, Jones and Olken (2005) mostly seem to interpret their results as reflecting a change in intentions and actions of different autocrats, consistent with the benevolent autocrat hypothesis. Democracy prevents bad autocrats from acting on their intentions but also may prevent benevolent autocrats from achieving their intentions of high growth. More generally, the authors cast their findings in terms of a large debate:
this research also informs a separate and very old literature in history and political science that considers the role of national leaders in shaping events. Deterministic views suggest that leaders have little or no influence, while the Great Man view of history, at the other extreme, sees history as the biographies of a small number of individuals. Tolstoy believed this debate methodologically impossible to settle [Tolstoy 1869]. Using exogenously-timed leader deaths, the analysis in this paper presents a methodology for analyzing the causative impact of leaders. We reject the hypothesis that leaders are incidental. We find that leaders do matter, and they matter to something as significant as national economic growth.
Jones and Olken (2009) repeat the message: “our findings suggest ‘agency at the top.’” In a subsequent survey, Jones (2009) suggests that their findings reflect intentional choices that are fully realized: “leaders can be actively good for growth – e.g. …choosing pro-growth trade policies… Lee Kwan Yew of Singapore might suggest such a view” and “Since leaders matter, the decisions they make – i.e., their policies – appear to matter.” However, the above theories of autocracy suggest some alternative views. What they are measuring may be the effect of an unexpected transition on the systemic outcome. According to the illustrative theories mentioned above, the systemic effects include the selectorate interacting with each other and with potential new leaders, a change in the selectorate, or a change in the threat of revolution and the response to such a threat. Hence, the Jones-Olken finding does not necessarily correspond to the change in intentions from the previous autocrat to his successor. Moreover, the systemic effect of an accidental transition could either change the outcome relative to the counterfactual of no leader death, or simply change the timing of an outcome that would have happened anyway. More generally, the autocrat is one player in a game of many players reacting to each others’ moves. To take one example stressed by Jones and Olken (2005), there was a dramatic change from the growth under Samora Machel in Mozambique, who first took power in 1975, to the growth under his successors after
his death in 1986. However, even a cursory list of other players during Machel’s reign would include the Portuguese settlers who dominated the colonial economy but left en masse in 1975, the RENAMO rebels who engaged in systematic destruction after 1975, the regimes of Rhodesia and South Africa supporting RENAMO, the Soviet Union who supported Machel, the end of the white majority regimes in Rhodesia and South Africa diminishing support for the rebels which led to the end of the civil war in 1992, the World Bank and IMF becoming important supporters of Machel in 1983-84 while Soviet aid ended, and all foreign aid donors sharply increasing aid after 1987 first to 30 percent of GDP and peaking at 81 percent of GDP in 1992. (This author is skeptical of growth effects of aid, but is just pointing out that there are many claimants to Mozambique’s growth success, including aid donors.) To take what is probably the most compelling example, the authors detect a large increase in China’s growth rates from Mao Tsetung to Deng Xiaoping. However, an alternative narrative to the autocrat mattering personally would stress the selectorate rather than the individual. Mao seems to be a clear example where the previous selectorate lost power on Mao’s death (e.g. the downfall of “the Gang of Four”), the type of autocracy where Besley (2010) predicted worse outcomes. Although Jones and Olken also show Deng’s death later was associated with a fall in growth, it was temporary. Another possible narrative is that China after Mao switched to a selectorate that does not change with individual leaders – satisfying the Besley and Kudamatsu (2009) condition for better performance of an autocracy. Aside from this discussion, are the magnitudes in Jones-Olken (2005) enough to explain the “benevolent autocrat” outcomes? The magnitudes of the effects they find are non-trivial – “a one standard deviation change in leader quality leads to a growth change of 1.5 percentage points.” This is from the five year period preceding the leader’s accidental death to the five years after, controlling for year and country effects. Assessing this magnitude depends on the degree to which the growth effect of the leader death is temporary or permanent. As discussed above, growth under autocracy has a large transitory component. To examine how important regression to the mean might be in the database after leader deaths, this paper uses the Jones-Olken data set of leader deaths and growth rates to assess the relationship between g(t,t+5) and g(t+5,t+10), where t marks the date of the leader’s accidental death. Regressing the second on the first across the set of episodes of leader deaths, there is a statistically significant coefficient of .35, implying that .65 of the growth deviation from the world mean disappears in the following five year period. Their result was a change (in absolute value) of 1.5 percentage points from g(t-5,t) to g(t,t+t+5); the results in this paragraph suggest that this effect would fade out fairly rapidly. It thus falls short of explaining much of the frequently-cited “benevolent autocrat” observations in figure 1 above, where growth is 3-4 percentage points higher than the world mean over a period of 48 years. This survey of formal theory and evidence finds little robust support for the benevolent autocrat idea. The paper turns next to an analysis of why the benevolent autocrat idea is so popular in non-academic development discussions.

II. The political economy of the benevolent autocrat idea
There is increased interest in the political economy of ideas in development, as economists debate which type of research is more likely to influence policy, and whether that might be affected by political motivations for adopting ideas (see the literature on the idea of cash transfers in the Progresa program in Mexico, or just the general debate on the policy impacts of randomized trials versus macroeconomic research).
The benevolent autocrat idea has been around for a long time. Its long popularity could certainly be partly explained by its political convenience for those in power. It is hard to see how it could be otherwise – autocrats and those whose interests are aligned with autocrats are not bound by academic rules for accepting and promoting ideas, and it would be hard to imagine they would be neutral on a theory that helps justify their hold on power. Similarly, the acceptance of the benevolent autocrat idea is also going to be influenced by the perceived need for paternalistic intervention, which reflects attitudes towards the would-be subjects of the autocrat. The point is NOT that the idea of benevolent autocrats should be disqualified by association with colonialism, racism, or political motivations. Rather, the point is that the concept’s popularity in the policy community does not reflect ONLY rigorous scientific testing (so such testing is even more important).
A convenient historical starting place is John Stuart Mill in his classic On Liberty (1869), which argued strongly for democratic rights for the individual. However, he made an exemption for what we would today call developing countries:
We may leave out of consideration those backward states of society in which the race itself may be considered as in its nonage. Despotism is legitimate … in dealing with barbarians, provided the end be their improvement… Liberty has no application to any {such} state of things.”
The concept of the benevolent autocrat appeared from the beginning in development economics. The modern field of development economics arose in the 1940s before the end of the colonial era. A British colonial official named Lord Hailey in 1941 conceived of development as a justification for the autocratic colonial power: “A new conception of our relationship…may emerge as part of the movement for the betterment of the backward peoples of the world.” Hailey made a distinction between economic rights for colonial subjects (good) and political rights (not so good). The idea of an autocrat granting “economic freedom” but not “political freedom” has had enduring appeal up to the present.
Jan Smuts, the Prime Minister of South Africa in a speech to the UN Founding Conference in 1945 described colonial subjects as “dependent peoples, still unable to look after themselves.” Although we now know colonialism ended only a few years later, this was not the expectation at the time.
Despite the end of colonialism – and a welcome backlash against the racism implicit in the previous statements -- a new justification for autocracy arose in the need for a coordinated plan to end poverty. Only the latter would satisfy the political demand for rapid progress. For example, later Nobel Laureate Gunnar Myrdal said in 1956:
Central planning …HAS to be staged by underdeveloped countries with weak administrative apparatus and a largely illiterate and apathetic citizenry…the alternative to making the heroic
attempt is continued acquiescence in economic stagnation which is politically impossible …this is why [planning] is unanimously endorsed by experts in the advanced countries.
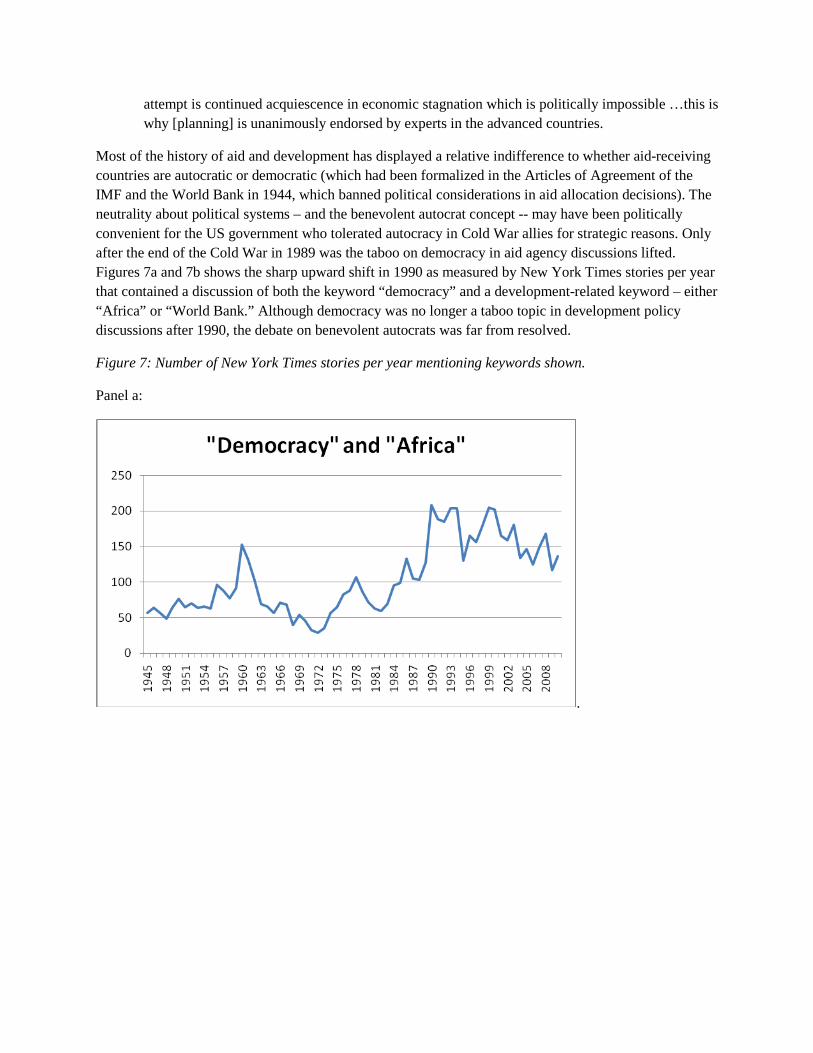
Most of the history of aid and development has displayed a relative indifference to whether aid-receiving countries are autocratic or democratic (which had been formalized in the Articles of Agreement of the IMF and the World Bank in 1944, which banned political considerations in aid allocation decisions). The neutrality about political systems – and the benevolent autocrat concept -- may have been politically convenient for the US government who tolerated autocracy in Cold War allies for strategic reasons. Only after the end of the Cold War in 1989 was the taboo on democracy in aid agency discussions lifted. Figures 7a and 7b shows the sharp upward shift in 1990 as measured by New York Times stories per year that contained a discussion of both the keyword “democracy” and a development-related keyword – either “Africa” or “World Bank.” Although democracy was no longer a taboo topic in development policy discussions after 1990, the debate on benevolent autocrats was far from resolved.
Figure 7: Number of New York Times stories per year mentioning keywords shown.
Panel a:
.
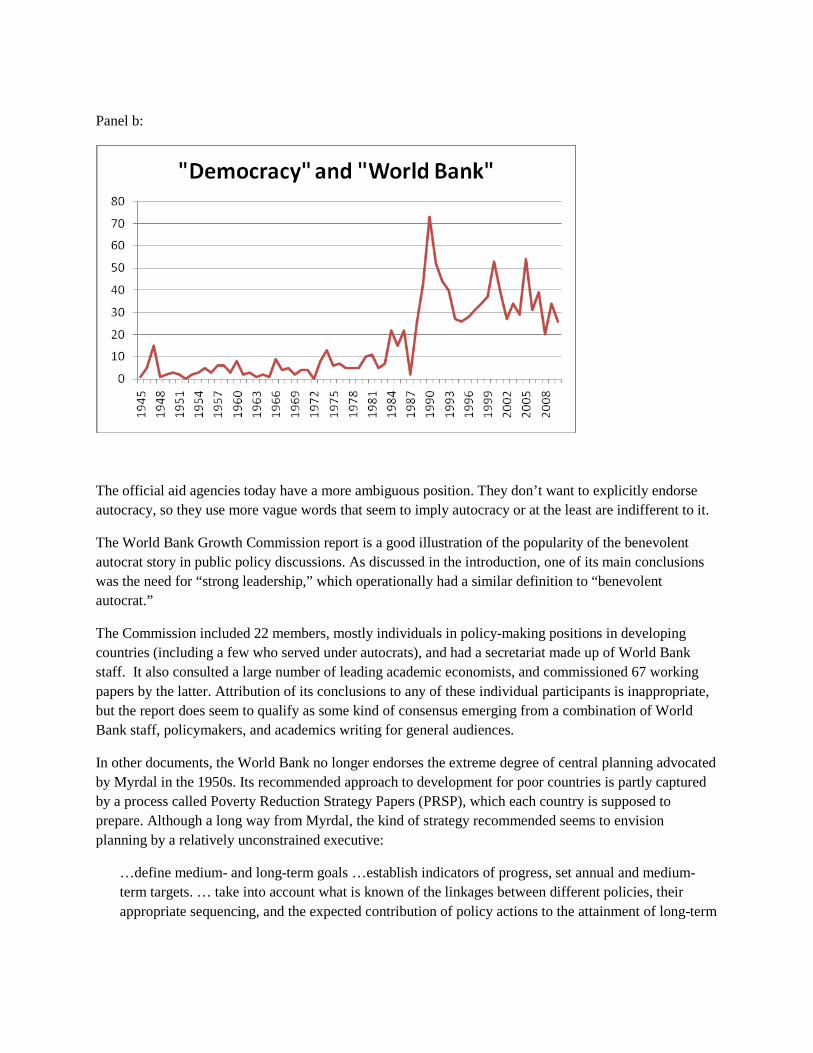
Panel b:
The official aid agencies today have a more ambiguous position. They don’t want to explicitly endorse autocracy, so they use more vague words that seem to imply autocracy or at the least are indifferent to it.
The World Bank Growth Commission report is a good illustration of the popularity of the benevolent autocrat story in public policy discussions. As discussed in the introduction, one of its main conclusions was the need for “strong leadership,” which operationally had a similar definition to “benevolent autocrat.”
The Commission included 22 members, mostly individuals in policy-making positions in developing countries (including a few who served under autocrats), and had a secretariat made up of World Bank staff. It also consulted a large number of leading academic economists, and commissioned 67 working papers by the latter. Attribution of its conclusions to any of these individual participants is inappropriate, but the report does seem to qualify as some kind of consensus emerging from a combination of World Bank staff, policymakers, and academics writing for general audiences.
In other documents, the World Bank no longer endorses the extreme degree of central planning advocated by Myrdal in the 1950s. Its recommended approach to development for poor countries is partly captured by a process called Poverty Reduction Strategy Papers (PRSP), which each country is supposed to prepare. Although a long way from Myrdal, the kind of strategy recommended seems to envision planning by a relatively unconstrained executive:
…define medium- and long-term goals …establish indicators of progress, set annual and medium-term targets. … take into account what is known of the linkages between different policies, their appropriate sequencing, and the expected contribution of policy actions to the attainment of long-term

goals and intermediate indicators. …in light of the diagnosis, the targets, their estimated costs, available resources. (Sourcebook on World Bank PRSP web site today)
Since the end of the Cold War, USAID and some bilateral agencies have given aid to programs in some countries under the rubric of “democratization.” Yet even these agencies seem to have a split personality, as aid agencies continue to give a lot of aid to regimes classified by most indices as autocracies. Table 5 shows the largest flows to autocracies over 2004-2008 by donor and by recipient:7
Table 6: Examples of Aid Going to Autocracies
Sum 2004-2008, Billion US$
Donors Recipients United States $46 China $15 Japan $23 Vietnam $12 Germany $16 Sudan $10 World Bank (IDA) $14 Egypt $9 France $14 Cameroon $9 United Kingdom $10 Rwanda $5 EC $9 Tunisia $3
The “benevolent autocrat” idea is convenient in many ways for aid agencies and other supporters of aid. Most aid-receiving nations are autocratic, and thinking of the autocrat as mostly “benevolent” (another common euphemism is “developmental”) takes the focus off autocracy and puts it back on a more appealing image such as the needy populations of those nations. In turn, opponents of aid might find it convenient to promote the idea of “malevolent autocrats,” to imply that the autocrat is the cause of poverty and that aid would do little good. As in the classic analysis of Deborah Stone (1989), the non-academic policy community are warring over alternative “causal stories” that lead to their preferred policy recommendations. Once again, this does not automatically discredit either side, but it is useful to look out for political interests as one possible source of the non-academic popularity or unpopularity of ideas.
Another well-known phenomenon in the political economy of official aid is for aid agencies to disburse all of their lending budget every year. Not only that, but aid has never been able to resolve what to do about needy people unlucky enough to have a dictatorial government. The concept of “benevolent autocrat” removes the quandary and opens the door to lending.
Economists today are increasingly discussing political motivations that influence acceptance or rejection of ideas in the public policy arena. (See Boettke (2010) and Zingales (2009), for example, for a discussion of why Keynesian ideas are politically popular.)
Ideas about development policies in rich democratic countries are particularly vulnerable to political influences, as the costs of mistaken ideas fall on non-voting populations of poor countries, while the benefits are concentrated on issue lobby groups in the rich countries who have political power (for
7 Sudan is a strange case here as donors like the US government obviously do not approve of the Bashir regime. The aid is flowing as part of the peace agreement with Southern Sudan.

example, either pro-aid or anti-aid lobbying groups). Moreover, the mapping from issue lobbies to ideas may lead politicians to embrace and promote ideas as a way of signaling that they share the concerns of a particularly potent issue lobby, regardless of the merits of the idea itself or even whether the politicians themselves accept the idea. Attempts to superficially “educate the politicians” may have little effect without an appreciation of these deeper incentives.
III. Cognitive biases and benevolent autocrats
Another source of popularity of benevolent autocrats is that many cognitive biases documented in behavioral economics (following the seminal work of Kahneman and Tversky) tend to reinforce beliefs in benevolent autocrats, even if benevolent autocrats did not exist. Of course, it does not logically follow that any belief in benevolent autocrats is the result of a cognitive bias (such an unfounded conclusion would itself reflect the cognitive bias discussed in section a below). Cognitive biases are only one of the possible explanations for such beliefs; another possibility is that theory and evidence support the benevolent autocrat hypothesis, as was considered above.
This section will reiterate the stylized facts already mentioned above and discuss the way they are interpreted. The fallacies discussed below are very well known to academic economists, so this section is primarily discussing how these cognitive biases affect the non-academic audience (which is hopefully itself still of interests to academics).
a. Reversing conditional probabilities
This well known bias confuses the conditional probabilities P(A|B) and P(B|A). Another way of putting it is that individuals violate Bayes’ theorem relating these conditional probabilities by neglecting P(A) --also known as the “neglecting base rate bias” (Tversky and Kahneman 1982c, 1982d). Bayes’ theorem shows how the bias is most extreme when P(A) is low relative to P(B):
( ))(
)()|(|BP
APABPBAP =
In the non-probabilistic world of deductive logic, this is the fallacy of affirming the consequent. The fallacious reasoning goes: if A then B, I observe B, therefore A.
To take an example already mentioned from the World Bank Growth Commission “Growth at such a quick pace, over such a long period, requires strong political leadership.” The Growth Commission was observing a high probability P(Strong leadership|Rapid Growth). But of course, this is not the relevant probability if one wants to know whether to recommend strong leadership – one needs instead to know the probability P(Rapid Growth|Strong Leadership), which turns out to be very different.
Commentators throughout development history have observed that big successes like South Korea, Singapore, Taiwan, and China had or have strong autocrats during their successful periods (as measured by rapid growth), which reinforces a belief in benevolent autocrats.
Let’s illustrate how the flawed Bayesians go astray. A big growth success is defined as more than 4 percent per capita over 1960-2008, and a big growth failure as less than -0.5 percent average growth over
the same period (the first dividing line picks out the usual suspects as successes, the second makes the number of big failures equal to the number of big successes).
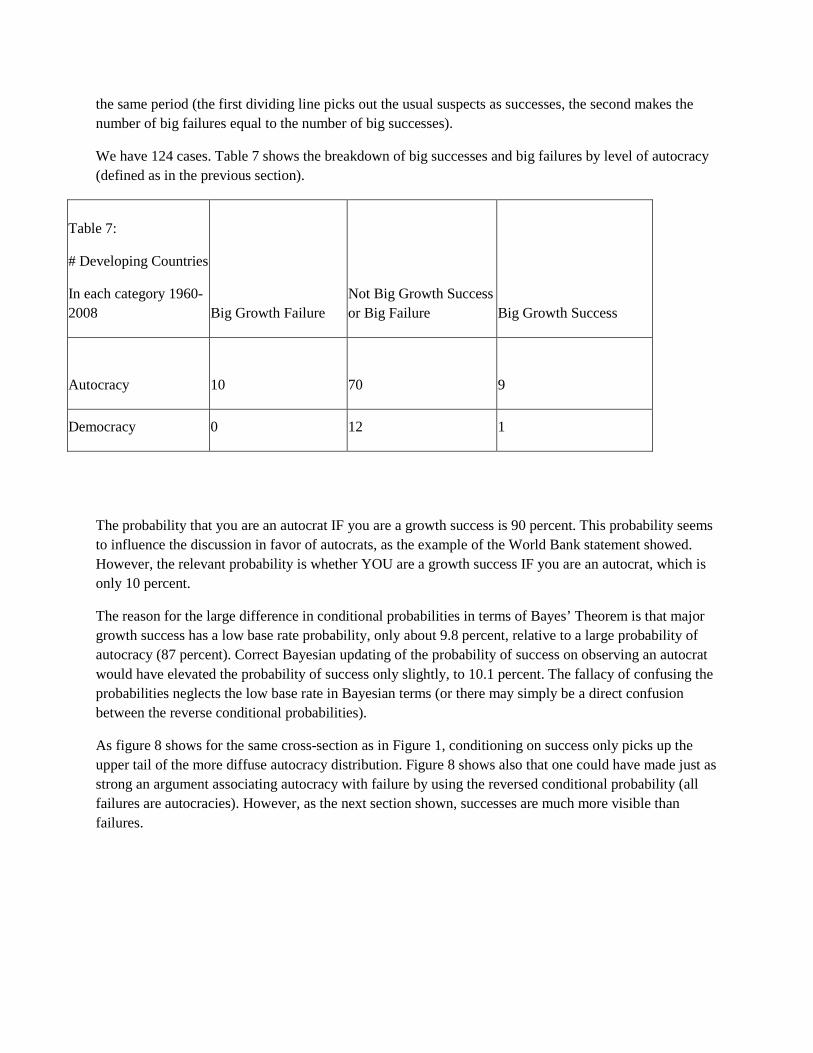
We have 124 cases. Table 7 shows the breakdown of big successes and big failures by level of autocracy (defined as in the previous section).
Table 7:
# Developing Countries
In each category 1960-2008 Big Growth Failure
Not Big Growth Success or Big Failure Big Growth Success
Autocracy 10 70 9
Democracy 0 12 1
The probability that you are an autocrat IF you are a growth success is 90 percent. This probability seems to influence the discussion in favor of autocrats, as the example of the World Bank statement showed. However, the relevant probability is whether YOU are a growth success IF you are an autocrat, which is only 10 percent.
The reason for the large difference in conditional probabilities in terms of Bayes’ Theorem is that major growth success has a low base rate probability, only about 9.8 percent, relative to a large probability of autocracy (87 percent). Correct Bayesian updating of the probability of success on observing an autocrat would have elevated the probability of success only slightly, to 10.1 percent. The fallacy of confusing the probabilities neglects the low base rate in Bayesian terms (or there may simply be a direct confusion between the reverse conditional probabilities).
As figure 8 shows for the same cross-section as in Figure 1, conditioning on success only picks up the upper tail of the more diffuse autocracy distribution. Figure 8 shows also that one could have made just as strong an argument associating autocracy with failure by using the reversed conditional probability (all failures are autocracies). However, as the next section shown, successes are much more visible than failures.
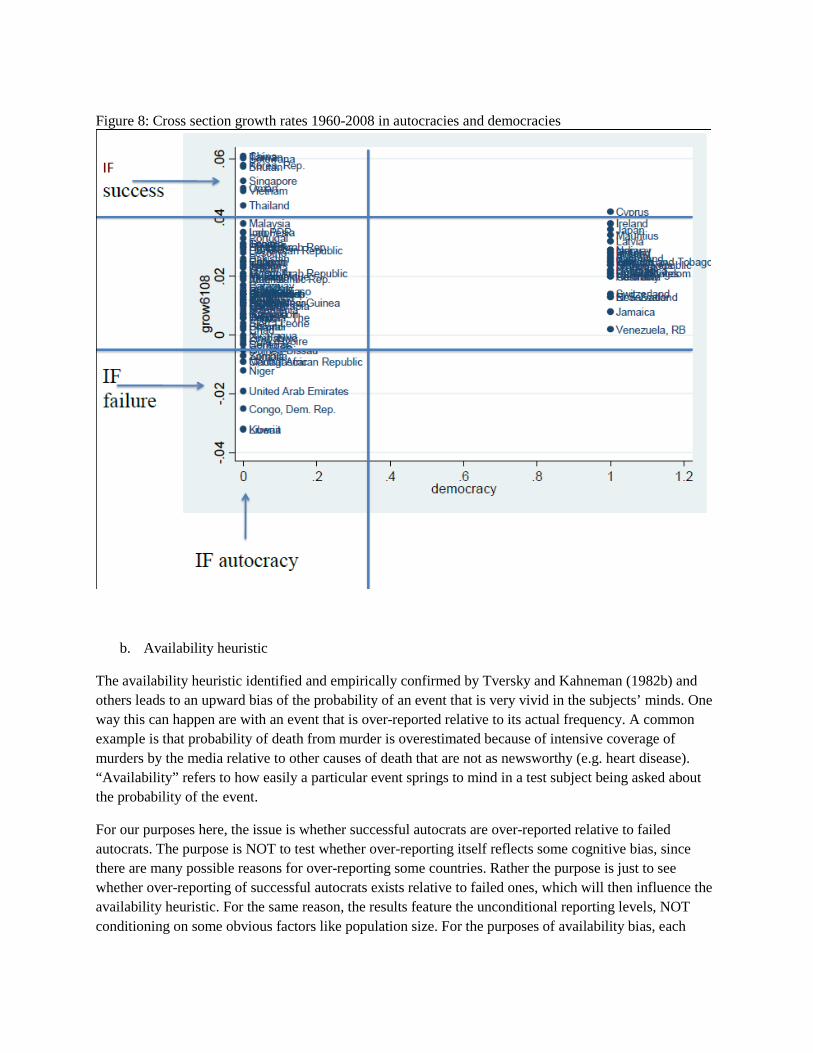
Figure 8: Cross section growth rates 1960-2008 in autocracies and democracies
b. Availability heuristic
The availability heuristic identified and empirically confirmed by Tversky and Kahneman (1982b) and others leads to an upward bias of the probability of an event that is very vivid in the subjects’ minds. One way this can happen are with an event that is over-reported relative to its actual frequency. A common example is that probability of death from murder is overestimated because of intensive coverage of murders by the media relative to other causes of death that are not as newsworthy (e.g. heart disease). “Availability” refers to how easily a particular event springs to mind in a test subject being asked about the probability of the event.
For our purposes here, the issue is whether successful autocrats are over-reported relative to failed autocrats. The purpose is NOT to test whether over-reporting itself reflects some cognitive bias, since there are many possible reasons for over-reporting some countries. Rather the purpose is just to see whether over-reporting of successful autocrats exists relative to failed ones, which will then influence the availability heuristic. For the same reason, the results feature the unconditional reporting levels, NOT conditioning on some obvious factors like population size. For the purposes of availability bias, each
country is treated as an equally weighted experiment in autocracy and success, it does not matter WHY there is over-reporting of some of these experiments relative to others.
This paper constructed a database of number of mentions of countries in both popular media and academic journals, as well as using an existing database by Das et al. (2010). The tables below report the results for developing countries only.
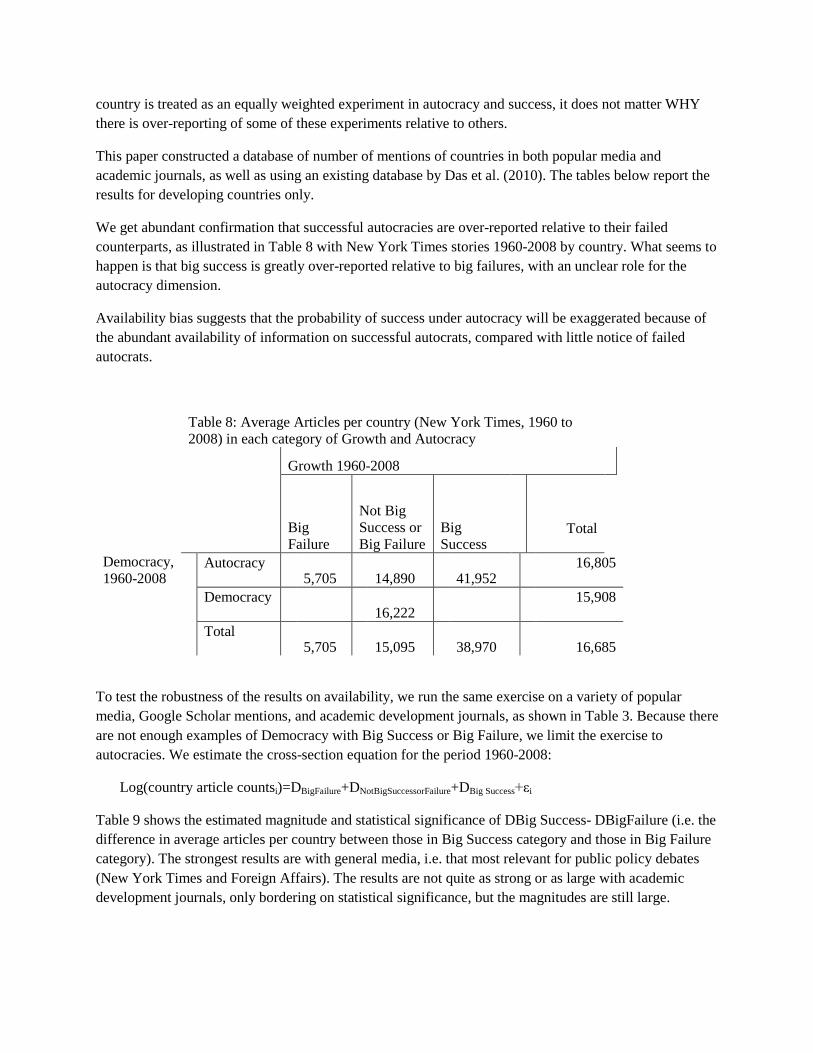
We get abundant confirmation that successful autocracies are over-reported relative to their failed counterparts, as illustrated in Table 8 with New York Times stories 1960-2008 by country. What seems to happen is that big success is greatly over-reported relative to big failures, with an unclear role for the autocracy dimension.
Availability bias suggests that the probability of success under autocracy will be exaggerated because of the abundant availability of information on successful autocrats, compared with little notice of failed autocrats.
Table 8: Average Articles per country (New York Times, 1960 to 2008) in each category of Growth and Autocracy
Growth 1960-2008
Big Failure
Not Big Success or Big Failure
Big Success
Total
Democracy, 1960-2008
Autocracy 5,705
14,890
41,952
16,805
Democracy
16,222
15,908
Total
5,705
15,095
38,970
16,685
To test the robustness of the results on availability, we run the same exercise on a variety of popular media, Google Scholar mentions, and academic development journals, as shown in Table 3. Because there are not enough examples of Democracy with Big Success or Big Failure, we limit the exercise to autocracies. We estimate the cross-section equation for the period 1960-2008:
Log(country article countsi)=DBigFailure+DNotBigSuccessorFailure+DBig Success+εi
Table 9 shows the estimated magnitude and statistical significance of DBig Success- DBigFailure (i.e. the difference in average articles per country between those in Big Success category and those in Big Failure category). The strongest results are with general media, i.e. that most relevant for public policy debates (New York Times and Foreign Affairs). The results are not quite as strong or as large with academic development journals, only bordering on statistical significance, but the magnitudes are still large.

Table 9: Results for article counts mentioning country names, by country in set of growth successes and failures in sample of all autocracies, 1960-2008
Log(# articles 1960-2008, except where otherwise noted)
Log difference in number of articles between success and failure
Standard Error P-Value
Obser- vations
Multiple by which average articles on success are more numerous than articles on failure
New York Times 1.406 0.647 0.033 84 4.1
Foreign Affairs, keyword search, 1960-Present 1.276 0.623 0.044 86 3.6
Foreign Affairs, topic search, 1960-Present/1 1.462 0.664 0.030 89 4.3 Journal of Development Economics 0.921 0.411 0.028 86 2.5 Journal of Development Economics (keyword "Growth") 0.831 0.424 0.053 86 2.3 World Development 0.787 0.403 0.054 86 2.2 World Development (keyword: "Growth") 0.799 0.410 0.055 87 2.2
World Bank count of academic articles by country 1985-2005 1.851 0.957 0.057 85 6.4 /1 This category had some zeroes, so the log transformation is log(1+#articles)
c. Leadership attribution bias
A large literature on the “fundamental attribution error” finds that test subjects tend to attribute an outcome too much to individual personality, intentions, and skill and not enough to situational factors. Some of the early examples of finding were Jones and Harris 1967, who ran an experiment assigning individuals randomly to write pro-Castro or anti-Castro letters. The test subjects observing this said that the pro-Castro letter writers already intended to be more pro-Castro even though they knew assignment was random.
That even random outcomes are attributed to intentions or skill is a striking feature of many experiments. Another early experiment showed the performance of actors doing a task in view of test subjects (Lerner 1965). The test subjects were told that payments would be given randomly to the actors, unrelated to performance, and the experimenter designed it so that performance was equivalent between all actors. Test subjects gave a higher performance rating to those actors receiving payments, even though they knew the payments were random.
Langer (1982) further surveyed and confirmed observers’ tendency to view uncontrollable outcomes (including chance) as if they were controlled by the agents (sometimes the agents are the observers themselves) in psychological experiments. She called this the “illusion of control.”
This bias specifically shows also in attributing too much of a group outcome to a leader rather than characteristics of the group. Weber et al. (2001) ran an experiment of two groups trying to solve coordination problems in which one of each group was randomly designated the “leader.” One of the groups was larger than the other, and this was the true cause of differential success at solving coordination problems. However, observers spuriously attributed the different outcomes to “leadership effectiveness.”
Wolfers (2007) shows a similar bias in how voters attribute outcomes to governors of US states. Incumbents are blamed even for outcomes that are obviously beyond their control, such as a fall in oil prices in an oil-producing state. Patty and Weber (2007) have a similar result that “voters over-emphasize outcomes relative to the actual ability of the leader to influence outcomes.” (Of course, this kind of voter irrationality could itself be an argument in favor of autocracy, which will be discussed more below. For the moment, take this as a large scale experiment confirming leadership attribution bias.)
Another related literature regards the excessive attribution of team success or failure in sports to the coach. Here there has been a long, entertaining, and often not very rigorous literature that finds this attribution is mostly spurious, as most studies show that firing coaches fails to improve team performance (Allen et al. 1979, Brown 1982, Gamson and Scotch (1964), Fabianic 1994, Koning 2003, Mcteer et al. 1995) Another large literature discusses the same question regarding CEOs of corporations. Fisman et al. (2010) find that again there is excessive attribution of corporate success to CEOs, as firing the CEO fails to improve performance.
d. The “Hot Hand” fallacy
The “Hot Hand” fallacy (Gilovich, Vallone, and Tversky 2002) is the false percerption that a basketball player who has just made a string of baskets is more likely to make the next basket than his average skill would predict. It is another form of attribution bias, in that it attributes the streak to a shift in the player’s skill rather than recognizing that random sequences feature streaks. The counterpart story for benevolent autocrats is that even if a streak of high growth were random, it would likely be attributed to the skill of somebody involved in the outcome. Given the leadership attribution bias, this is likely to be the leader in power at the time.
Another way of stating this bias is that it fails to appreciate regression to the mean (Kahneman and Tversky 1982d) – that unusually good performance is temporary and will like revert to average performance. Easterly, Kremer, Pritchett, and Summers 1993 and Hausmann, Rodrik, Pritchett 2007 showed growth rates to feature low persistence and high mean reversion. If current and past growth is attributed to an autocrat, the Hot Hand fallacy will make things even worse by giving him credit for the spuriously predicted high growth in the future as well. Of course, the same will work in reverse with the malevolent autocrat with a string of bad growth rates. This bias tends to exaggerate the difference between “good” and “bad” autocrats.

The degree of mean reversion is approximately the same for democracies as for autocracies. The only difference is that autocracies were more likely to be on the extreme right or left in Figure 9, and so have farther to fall (rise).
Figure 9: Change in decade growth rates against previous decade’s growth average, 1965-2005, for sample of autocracies
DZA
ARG
AUSAUT
BGD
BEL
BLZ
BEN
BOL BWA
BRA
BFA
BDI
CMR
CAF
TCD
CHL CHN
COL
ZAR
COG
CRI
CIV
DNK
DOM
ECU
EGY
SLV
FINFRAGHA
GRCGTM
GUY
HTI HND
HKG
HUN
ISLIND
IDN
IRL
ISR
ITA
JPNKEN
KOR
LSO
LBR
LUX
MDG MWI
MYS
MLT
MRT MEXMAR
MMR
NPL
NLD
NZL
NIC
NER
NGA
NOR
PAK
PAN
PNG
PRY
PERPHL
PRT
RWA
SEN SYC
SLE
SGPZAF
ESP
LKA
VCT
SDNSWE
CHE
SYR
THA
TGO
TTOGBRUSA
URYVEN
ZMB
ZWEDZA
ARG
AUSAUTBGDBEL
BLZ
BEN
BOL
BWA
BRABFA
BDI
CMR
CAFTCD
CHL
CHNCOL
ZAR
COG
CRI
CIVDNK
DOMECU
EGY
SLV
FIN
FRA
GAB
GHA
GRC
GTM
GUY
HTI
HNDHKG
HUNISL
INDIDN
IRLISR
ITAJPNKEN
KOR
LSO
LUXMDG
MWI
MYS
MLT
MRT
MEXMAR
MMR
NPLNLDNZL
NIC
NER
NGA
NORPAKPAN
PNG
PRY
PERPHL PRT
RWA
SEN SYC
SLE
SGP
ZAF
ESP
LKA
VCT
SDN
SWECHE
SYR
THA
TGO
TTO
GBRUSA
URYVEN
ZMBZWE
DZA
ARGAUS
AUT
BGD
BEL
BLZ
BEN
BOLBWA
BRA
BFA
BDI
CMR
CAF
TCD
CHL
CHN
COL
ZAR
COG
CRI
CIV
DNK
DOM
ECU EGY
SLV
FIN
FRAGAB GHA
GRC
GTMGUY
HTI
HND
HKG
HUN
ISL
IND
IDN
IRL
ISRITAJPN
KEN
KOR
LSO LUX
MDGMWI
MYSMLT
MRT
MEXMAR
MMR
NPLNLD
NZL
NIC
NERNGA
NORPAK
PAN
PNG
PRY
PERPHL
PRT
RWA
SEN
SYC
SLE
SGP
ZAF
ESPLKA
VCT
SDNSWECHE
SYR
THA
TGO
TTO
GBRUSA
URY
VEN
ZMB
ZWE
-.1-.0
50
.05
.1dg
-.1 -.05 0 .05 .1gdecadelag
e. The “Law of Small Numbers”
A closely related issue is what Tversky and Kahneman (1982a) called the “Law of Small Numbers.” In contrast to reliance on the Law of Large Numbers to obtain precision on averages, the “Law of Small Numbers” draws conclusions prematurely on too small a sample. This will be worse with autocracy than with democracies, as the former have a larger transitory component to their growth rates. It is common practice to declare a country a “growth miracle” after a few years of high growth. For example, Chile under Pinochet was declared a “growth miracle” twice: first from 1977-1981, and again from 1984-89 (in between the two was a severe financial crisis and recession), with about 6 percent per capita growth in both periods. The transitory component of a five year average under autocracy has the 95% confidence interval {-.063,.063}. Flexibly selecting on any short interval of high growth under autocracy as a “growth miracle” is likely to capture a high transitory realization. Calling it a “miracle” ignores this problem, apparently suffering from the “Law of Small Numbers.”
These results help understand why short periods of rapid growth are both surprisingly common and surprisingly inexplicable. As the Hausmann, Pritchett, Rodrik (2005) study of “Growth accelerations”
found, “Of the 110 countries included in the sample, 60 have had at least one acceleration ….” And yet “most growth accelerations are not preceded or accompanied by major changes in economic policies, institutional arrangements, political circumstances, or external conditions…those determinants do a very poor job of predicting the turning points.” They define a growth acceleration as being a change of 2 percentage points per capita from one seven year period to the next, and found 81 of them in the data. While they found both democratic and autocratic growth accelerations, this paper finds the latter in their database (using the classification of autocracy in this paper) to be larger: an acceleration of 5.2 percentage points, compared to 3.2 percentage points for democracies. This is the stuff of mostly spurious popular reports of “growth miracles.”
Surprisingly, this is still a non-trivial problem even with much longer time periods. The World Bank Growth Commission identified the successes that it would study as those that had high growth over any 25 year period, creating a selection bias towards having a large transitory component (not only by country, but also by endogenous selection of time period). Since autocracies have larger transitory variance than democracies, this procedure was very likely to pick out autocratic successes. Indeed, only one of the thirteen successes in the Growth Commission report fit the definition of democracy used in this paper (Japan, 1950-1983)8
. The 25 year average of the transitory component for autocracies has a 95% confidence interval of (-.023.023).
f. Action bias The action bias has an amusing demonstration in one very narrow circumstance by how soccer goalkeepers defend against penalty kicks (Bar-Eli et al. 2007). Empirically, the most successful strategy is for the goalkeeper not to act at all: to stay unmoving in the middle. However, a surprisingly large number of goalkeepers prefer to act instead, guessing which way the ball is going and diving to that side. This provides very partial confirmation for the widespread anecdotes in political economy about how action in response to a tragic problem is preferred to inaction regardless of the evidence for payoff from action. Another possible reason for some preferences for benevolent autocrats is that they seem to provide a way to act forcefully on development outcomes. An autocrat with a plan for development will be more appealing to professionals who urgently wish for the end of poverty, much more than a democratic system that doesn’t have much role for expert planning – see the Myrdal quote above. In general, technocratic views of development give action-oriented experts much more of an active role. However, if experts already know the answer, then there is not much room left for democratic determination of economic policy. Hence, anyone who considers themselves as an expert advisor may have a bias towards autocrats. As James Buchanan said, policy-oriented economists and other public intellectuals may prefer to be “proffering policy advice as if they were employed by a benevolent despot.”
8 Hong Kong and Malta were successes that Polity IV does not cover. Freedom House coverage begins in 1973. Freedom House classified Malta (whose successful period was identified as 1963-1994) as “partly free” from 1982-1987, otherwise “free”; Malta became independent in 1964. Hong Kong was never independent but appears on Freedom House’s list of territories, where it was classified as “partly free” in all periods except a “free” classification in 1975-1979.

James C. Scott in his classic Seeing Like A State refers to top-down technocratic approach to development as “high modernism.” He concurs that such a view prefers autocrats: “Political interests can only frustrate the social solutions devised by specialists with scientific tools adequate to their analysis. As individuals, high modernists might well hold democratic views…but such convictions are external to, and often at war with, their high-modernist convictions.” (p. 94)
IV. Conclusion
This paper has suggested a number of cautions about jumping too quickly to benevolent autocrat explanations of growth successes. Formal theory and evidence provides little or no basis on which to believe the benevolent autocrat story. The benevolent autocrat story has been around for a long time and has proved very adaptable to many different political motivations. The interaction between well-known cognitive biases and stylized facts would predict beliefs in benevolent autocrats even if they did not exist.
This paper has repeatedly cautioned that these arguments do not automatically disprove the benevolent autocrat story. People who have certain political motivations and cognitive biases are likely to believe in benevolent autocrats. It does not follow that people who believe in benevolent autocrats have political motivations and cognitive biases. (Equating the two is itself the reversing conditional probabilities cognitive bias.)
The benevolent autocrat story for any ONE autocrat and growth outcome is ultimately non-falsifiable: there is just one observation and many possible stories. Those with strong priors in favor of benevolent autocrats are still likely to go with that story.
The point of this paper is that such strong priors exist for many bad reasons as well as good ones, and that economists should retain their traditional skepticism for stories that have little good theory or empirics to support them.

Bibliography Acemoglu, D., Johnson, S., Robinson, J., Thaicharoen, Y., 2003. Institutional causes, macroeconomic
symptoms: volatility, crises and growth. J. Monetary Econ. 50, 49–123. Acemoglu, Daron and James Robinson, 2005, Economic Origins of Dictatorship and Democracy,
Cambridge University Press, Cambridge UK Acemoglu, Daron and Fabrizio Zilibotti, Was Prometheus Unbound by Chance? Risk, Diversification,
and Growth. The Journal of Political Economy, Volume 105, Issue 4, August 1997, 709-751. Aghion, Philippe, George-Marios Angeletos, Abhijit V. Banerjee and Kalina Manova, (2007), ―Volatility and Growth: Credit Constraints and Productivity-Enhancing Investment, MIT mimeo. Almeida, H., Ferreira, D., 2002. Democracy and the variability of economic performance. Econ. Polit. 14,
225–245. Bar-Eli, Michael Ofer H. Azar, Ilana Ritov, Yael Keidar-Levin, Galit Schein, Action bias among elite
soccer goalkeepers: The case of penalty kicks, Journal of Economic Psychology, Volume 28, Issue 5, October 2007, Pages 606-621
Besley, Timothy and Masa Kudamatsu, “Making Autocracy Work”, in Elhanan Helpman (ed) Institutions
and Economic Performance, Cambridge: Harvard University Press, 2009. Birdsall, Nancy and Francis Fukuyama, The Post-Washington Consensus: Development After the Crisis,
Foreign Affairs, March-April 2011, pp. 45-53. Boettke, Peter. Economics for Yesterday, Today, and Tomorrow. Adam Smith Lecture from The
Association of Private Enterprise Education, April 2010 Bruno, Michael and William Easterly, Inflation Crises and Long-run Growth, Journal of Monetary
Economics, 41, (February 1998): 3-26.. Bueno de Mesquita, Bruce, Alastair Smith, Randolph M. Siverson, and James D. Morrow, The Logic of
Political Survival, Cambridge, MASS: MIT Press, 2003. Chaves, Isaías N. and James A. Robinson, The Political Consequences of Civil Wars, mimeo, Harvard
University, November 2010. Caballero, Ricardo J. Macroeconomics after the Crisis: Time to Deal with the Pretense-of-Knowledge
Syndrome, forthcoming Journal of Economic Perspectives, September 2010 Caplan, Bryan. The Myth of the Rational Voter: Why Democracies Choose Bad Policies. 2007.
Princeton, NJ: Princeton University Press. Collier, Paul. 2009. Wars, Guns, and Votes: Democracy in Dangerous Places. Harper 2009. Corvalan, Alejandro. From Income to Democracy, December 2010, NYU mimeo
Denizer, Cevdet A., Murat F. Iyigun, and Ann Owen (2002), ―Finance and Macroeconomic Volatility, Contributions to Macroeconomics, 2 (1, Article 7), 1-30. Easterly, William and Aart Kraay, Small states, small problems? Income, growth, and volatility in small
states, World Development Vol. 28, No. 11, pp. 2013±2027, 2000 Easterly, William, Roumeen Islam, and Joseph E. Stiglitz (2002), ―Shaken and Stirred: Explaining
Growth Volatility,‖ in Annual World Bank Conference on Development Economics edited by Boris Pleskovic and Nicholas Stern, World Bank and Oxford University Press, Washington, D.C., 191-211.
Gilovich, Thomas, Robert Vallone, and Amos Tversky, “The Hot Hand in Basketball: On the
Misperception of Random Sequences”, in Thomas Gilovich, Dale Griffin, and Daniel Kahneman, Heuristics and Biases: The Psychology of Intuitive Judgment, Cambridge University Press: Cambridge UK, 2002.
Halper, Stefan. The Beijing consensus: how China's authoritarian model will dominate the twenty-first
century, Basic Books, 2010 Hofstede, Geert H., 1980. Culture’s Consequences: International Differences in Work-Related Values. Sage, Thousand Oaks, CA. Hofstede, Geert H., 2001. Culture’s Consequences: Comparing Values, Behaviors, Institutions, and Organizations Across Nations, second ed. Sage, Thousand Oaks, CA. Jones, E. E. and Harris, V. A. (1967). The attribution of attitudes. Journal of Experimental Social
Psychology, 3, 1-24 Kahneman, Daniel and Amos Tversky, “On the psychology of prediction,” in Daniel Kahneman, Paul
Slovic, and Amos Tversky, editors, Judgment under uncertainty: heuristics and biases, Cambridge University Press: Cambridge UK, 153-160,1982
Langer, Ellen J. “The illusion of control,” in Daniel Kahneman, Paul Slovic, and Amos Tversky, editors,
Judgment under uncertainty: heuristics and biases, Cambridge University Press: Cambridge UK, 231-238,1982
Lerner, Melvin J., Evaluation of performance as a function of performer's reward and attractiveness,
Journal of Personality and Social Psychology, Volume 1, Issue 4, April 1965, Pages 355-360 Licht, Amir N., Chanan Goldschmidt, and Shalom H. Schwartz (2007), Culture rules: The foundations of
the rule of law and other norms of governance, Journal of Comparative Economics, 35 659–688 Lo, Andrew W. and Mark T. Mueller, WARNING: Physics Envy May Be Hazardous To Your Wealth!
Mimeo, MIT, March 2010 Manski, Charles F. ,POLICY ANALYSIS WITH INCREDIBLE CERTITUDE, Department of
Economics and Institute for Policy Research, Northwestern University, February 2011 Olsen, Mancur. Power and Prosperity: Outgrowing Communist and Capitalist Dictatorships, Oxford
University Press, 2000

PERSSON, TORSTEN AND GUIDO TABELLINI, Democratic capital: The nexus of political and economic change, American Economic Journal: Macroeconomics, 2010.
Ramey, Garey and Valerie Ramey, Cross Country Evidence on the Link between Volatility and Growth
American Economic Review, Dec. 1995. Rodrik, Dani "Institutions for High-Quality Growth: What They Are and How to Acquire Them," Studies
in Comparative International Development, vol. 35, no.3, Fall 2000. NBER Working Paper version
Rodrik, Dani “Growth Strategies,” in P. Aghion and S. Durlauf, eds., Handbook of Economic Growth,
vol. 1A, North-Holland, 2005. RODRIK, DANI AND ROMAIN WACZIARG, Do Democratic Transitions Produce Bad Economic
Outcomes? American Economic Review Papers and Proceedings, Vol. 95, No. 2, May 2005. Sah, R.K., 1991. Fallibility in human organizations and political systems. J. Econ. Perspect. 5, 67–88. Scott, James C. Seeing Like A State: How Certain Schemes to Improve the Human Condition have
Failed. Yale University Press: New Haven, 1999. Schwartz, Shalom H., 1999. Cultural value differences: Some implications for work. Applied Psychology
International Review 48, 23–47. Schwartz, Shalom H., 1994. Beyond individualism/collectivism: new cultural dimensions of values. In:
Uichol, Kim,Triandis, Harry C., Kagitcibasi, Cigdem, Choi, Sang-Chin, Yoon, Gene (Eds.), Individualism and Collectivism: Theory, Method, and Applications. Sage, Thousand Oaks, CA.
Silva, Gisele Ferreira da (2002), ―The Impact of Financial System Development onBusiness Cycles
Volatility: Cross-Country Evidence,‖ Journal of Macroeconomics, 24(2), 23 3-53. Stone, Deborah A. 1989. Causal Stories and the Formation of Policy Agendas, Political Science
Quarterly, Vol. 104, No. 2. (Summer, 1989), pp. 281-300. Tabellini, Guido, “The Scope of Cooperation: Values and Incentives,” Quarterly Journal of Economics,
Vol. 123, 2008, pp. 905–950. Tversky, Amos and Daniel Kahneman, “Belief in the Law of Small Numbers,” in Daniel Kahneman, Paul
Slovic, and Amos Tversky, editors, Judgment under uncertainty: heuristics and biases, Cambridge University Press: Cambridge UK, 23-31,1982a
Tversky, Amos and Daniel Kahneman, “Availability: A heuristic for judging frequency and probability,”
in Daniel Kahneman, Paul Slovic, and Amos Tversky, editors, Judgment under uncertainty: heuristics and biases, Cambridge University Press: Cambridge UK, 163-178,1982b
Tversky, Amos and Daniel Kahneman, “Evidential impact of base rates,” in Daniel Kahneman, Paul
Slovic, and Amos Tversky, editors, Judgment under uncertainty: heuristics and biases, Cambridge University Press: Cambridge UK, 153-160,1982c
Weede, E., 1996. Political regime type and variation in economic growth rates. Constitutional Polit. Econ.
7, 167–176.

World Bank Growth Commission, The Growth Commission Report, Washington DC, 2008. Yang, Benhua. Does democracy lower growth volatility? A dynamic panel analysis, Journal of
Macroeconomics 30 (2008) 562–574
Appendix 1: Measuring Individualist Values Schwartz: “Embeddedness/Autonomy: This dimension concerns the desirable relationship between the individual and the group. Embeddedness refers to a cultural emphasis on the person as embedded in the group and committed to maintaining the status quo, propriety, and restraint of actions or inclinations that might disrupt group solidarity or the traditional order. The opposite pole of autonomy describes cultures in which the person is viewed as an autonomous, bounded entity who finds meaning in his or her own uniqueness.” In earlier work, Schwartz developed an inventory of 57 items intended to include all the motivationally distinct values likely to be recognized across cultures. A survey questionnaire asking respondents to rate each of these value items as “a guiding principle in MY life” was administered to respondents on every inhabited continent, anonymously, in their native language. Separate multidimensional scaling analyses of the value items established that 45 items have reasonably equivalent meanings in each country. Only these items are used as markers for cultural orientations. This is critical in order to avoid a situation in which apparent differences might be due to different understandings of the concepts across groups. Means of ratings of each of the 45 value items within each sample were computed. A multidimensional scaling analysis of the correlations between the sample means confirmed the presence of the cultural orientations and their link to the value items selected a priori to represent each orientation. Orientation scores are the average importance of the value items that represent each orientation. For cross-national comparisons, sample differences in scale use were eliminated by centering the importance ratings of all seven orientations within each sample around its mean. Crucially, the analyses are at the country (culture) level, not the individual level—individuals are unaware of the societal average value emphases (for more detail see Schwartz, 1999, 2004; Smith et al., 2006). Culture scores in the present study are based on a sample of over 15,000 urban teachers who teach the full range of subjects in grades 3–12 in the most common type of school system, surveyed in 1988–1998. Hofstede: Hofstede’s (1980, 2001) study originated in an audit of company morale among the employees of the IBM corporation around the world at two points of time: around 1968 and around 1972. Factor analysis of country mean scores in 50 countries and three regions produced the four dimensions mentioned above. Hofstede asserts that comparing IBM subsidiaries shows national culture differences with unusual clarity because they were so homogeneous in terms of employer, kind of work, and education level (Hofstede, 2001).