Embed Size (px)
Citation preview

Benefits and Costs of Power Plant Carbon Emissions Pricing in New YorkA Dynamic, Simulation-Based Analysis
Daniel Shawhan, Paul Picciano, and Karen Palmer
FINAL REPORTJULY 18, 2019

Overview
• Study Motivation and Research Questions
• Summary of Study Design, Assumptions and Results
• Modeling Approach and Key Assumptions
• Simulation Results
2
Note: This analysis was conducted as part of RFF’s Future of Power Initiative. It does not represent the opinions of the NYISO Environmental Advisory Council. The authors wish to acknowledge funding from the Hewlett Foundation and the Heising-Simons Foundation.

MotivationWe examine the proposed NY Carbon Pricing Policy (“Carbon Adder”) that would be implemented in the wholesale electricity market in NY state.
• How does the NY Carbon Pricing Policy proposal interact with the RGGI allowance market? Will pricing carbon at its social cost in the NYISO markets trigger the RGGI Emissions Containment Reserve?
• What are the impacts on electricity sector emissions of CO2 in NY? In RGGI? In the Eastern Interconnection?
• How does the Policy affect NY REC and ZEC prices?
• How will the Policy affect both location-based marginal prices and retail prices in New York?
• How does the Policy affect social economic welfare and its components, including damages from other pollutants?
3

• Employ a detailed power sector model, the E4ST model of the Eastern Interconnection, to project effects of the NY Carbon Pricing Policy in 2025
• Simulate Business-as-Usual (BAU) and the proposed Carbon Pricing Policy
• Our BAU scenario includes only the policies in place as of 2018, notably RGGI, a NY RPS of 12% for new wind and solar (Tier 1) in 2025 and the NY ZEC policy. Relative to that BAU, the proposed Policy not only reduces the emission intensity of fossil generation in NY but also increases non-emitting NY generation. Consequently, our analysis applies primarily to situations in which the proposed Policy does that.
• If the BAU had such aggressive and successful requirements for non-emitting NY generation that the Carbon Pricing Policy would not increase non-emitting generation, the Policy would still reduce emissions relative to the BAU, by smaller amounts.
4
Basic Study Plan and Applicability

We Use Two Sets of Cost Assumptions
We estimate the effects of the proposed Carbon Pricing Policy under two sets of assumptions regarding wind and solar technology costs and natural gas prices:
• “Low”: Relatively lower solar & wind costs, leads to lower RGGI prices• NREL ATB 2018 Mid (medium) cost assumptions for wind & solar facilities
• Fuel prices from AEO 2019 high oil and gas resource and technology case (Appendix shows assumed average gas prices by NYISO zone)
• “High”: Relatively higher solar & wind costs, leads to higher RGGI prices• Higher wind & solar costs (midpoint between recent costs and NREL ATB Mid)
• Lower NG fuel prices, based on NYMEX futures market (but still reflecting the fact that NG price varies with location and buyer)
Even though the “Low” scenarios use medium wind & solar cost assumptions, the time and expense for siting in New York state could make the “High” scenarios more likely representations of 2025. In that case, the “Low” scenarios might represent a later year well.
5

Key Changes in Assumptions from Our Earlier Analysis of the Proposed Policy Presented to IPPTF
6
Assumption This Analysis IPPTF Presentation
Capital Costs NREL ATB 2018 [Lower solar & wind cost than in AEO] AEO 2017
Regional Fuel Prices/Demand
Forecast
AEO 2019 (except “High” case bases NG prices
on NYMEX futures)
AEO 2017 except NG price based on NYMEX futures
RPS Requirements LBNL RPS spreadsheet (policies as of Nov. 2018)
LBNL RPS spreadsheet (policies as of July 2017)
Price Responsive Load (PRL)
Load in each hour responds to annual average retail price that reflects rebates No PRL
NY RGGI Coverage > 15 MW > 25 MW
RGGI Cap for VA ~ 28 M Tons ~ 32 M Tons
Ontario NuclearNo longer planned retirement of
Bruce A/B facilities (per S&P Global)
Planned retirement of Bruce A/B facilities
(per S&P Global)
E4ST Generator Placement
Ensured only generators directly serving NY are assigned to NY nodes in our model
(necessary due to border flow constraints)

Key Elements of NYISO Carbon Pricing Straw Proposal and Draft Recommendations
• Small NY generators (<15 MW) that are exempt from RGGI are charged Gross Social Cost of Carbon (SCC).
• We assume a SCC of $51 / short ton in 2025 (2013$), from US Inter-Agency Working Group (2015).
• NY generators subject to RGGI are charged the SCC minus the RGGI price (endogenously determined in our simulation analysis).
• “Apply carbon charges to external transactions such that they compete with internal resources as if the NYISO was not applying a carbon charge to internal suppliers.”
• NY Carbon Pricing proceeds returned to NY electricity end-users. We assume that 75% is rebated to end-users as reduction in retail volumetric rates, and the other 25% in some way that benefits end-users $1 per $1 rebated but does not significantly affect the quantity of electricity consumed.
7

Summary of Key Results in 2025 (1)• In our simulation results, NYISO’s proposed Carbon Pricing Policy has
important impacts on CO2 emissions:
• It reduces CO2 emissions from electricity generation in NY State;
• There is less than 100 percent emission leakage to RGGI due to ECR;
• It reduces total Eastern Interconnection emissions more than NY emissions (negative emission leakage) because it reduces NY and RGGI net imports.
• The Policy reduces the number of RGGI allowances sold, which reduces gov’t revenue.
• The Policy drives NY REC and ZEC prices to zero in both cases we consider.
• The Policy increases zonal average wholesale electricity prices in New York by $20 to $24; however, the revenue is rebated to end-users and the Policy reduces some other charges, so the average cost of the Policy to end-users is $0.09 to $1.21 per MWh ($0.0009 to $0.00121 per kWh), equal to about 0.1% to 1.1% of average retail price.
8

Summary of Key Results in 2025 (2)
• The Policy can decrease or increase the total profit of privately owned generators in NY.
• The Policy has a positive impact on global social welfare, $108 million to $691 million per year. (All our $ values are in 2013 dollars.)
• There is a set of potentially very important additional effects that a power system model is not well suited to estimating. See slide near end about this.
9

Methodology & Assumptions
10

11
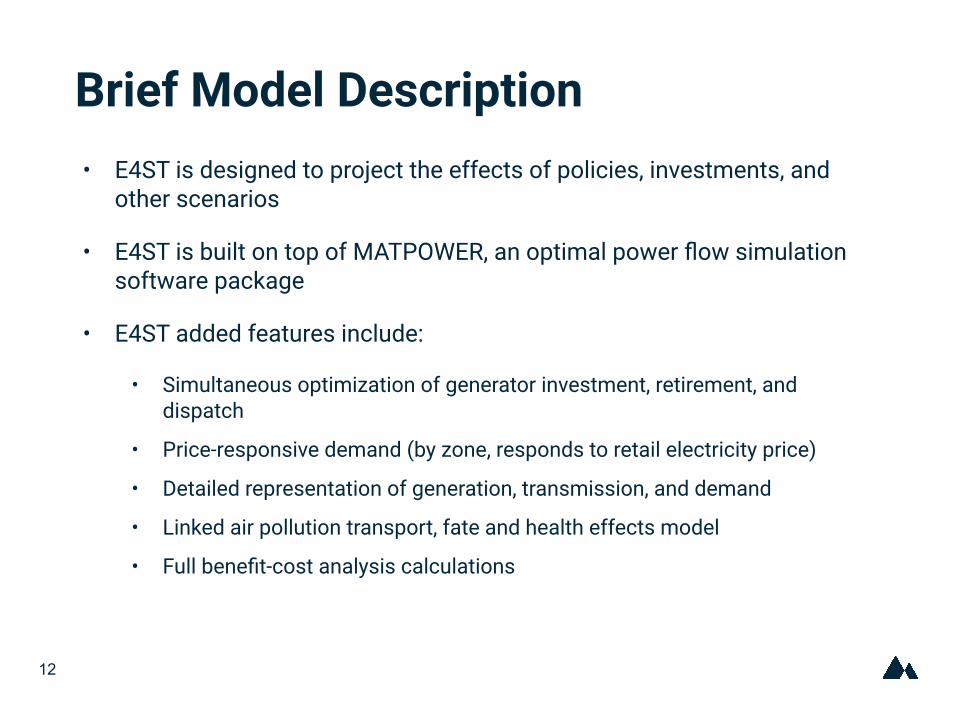
Brief Model Description• E4ST is designed to project the effects of policies, investments, and
other scenarios
• E4ST is built on top of MATPOWER, an optimal power flow simulation software package
• E4ST added features include:
• Simultaneous optimization of generator investment, retirement, and dispatch
• Price-responsive demand (by zone, responds to retail electricity price)
• Detailed representation of generation, transmission, and demand
• Linked air pollution transport, fate and health effects model
• Full benefit-cost analysis calculations
12

E4ST Model Physical DetailThe Models Preserves All High-Voltage (>200 kV) Transmission Lines and Aggregates Lower-Voltage Lines (via “Ward Reduction”)
For example, our Eastern Interconnection model
contains 14,225 transmission segments, 5,222 nodes, and 8,190
generators.
•
We also have models of the Western and Texas
interconnections – covering all of the
contiguous US and all of Canada except the isolated far north.
13
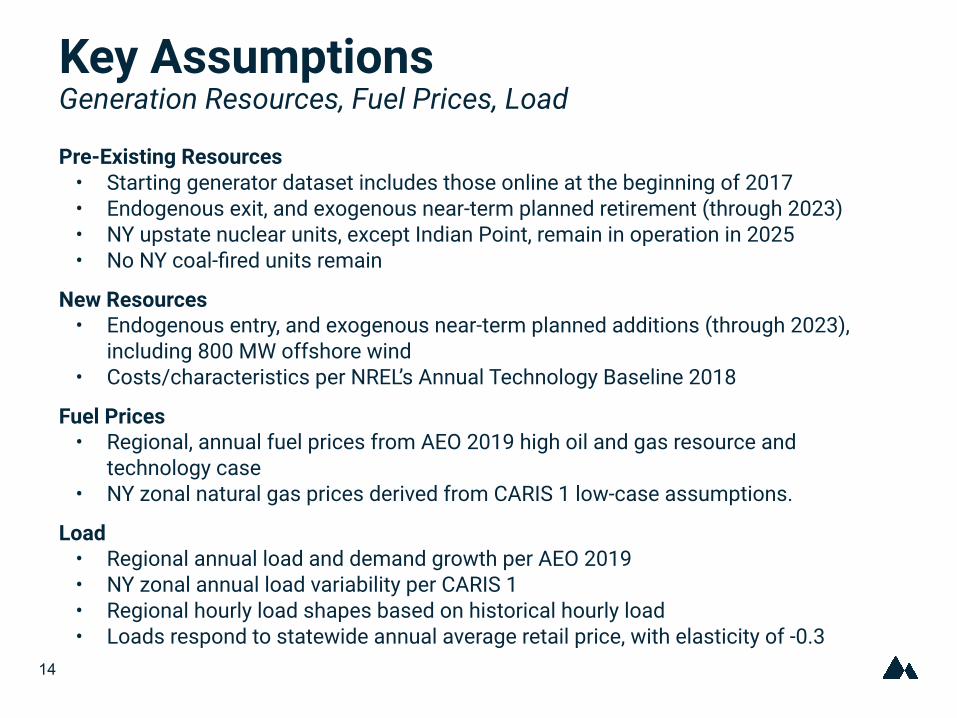
Key AssumptionsGeneration Resources, Fuel Prices, Load
Pre-Existing Resources• Starting generator dataset includes those online at the beginning of 2017• Endogenous exit, and exogenous near-term planned retirement (through 2023)• NY upstate nuclear units, except Indian Point, remain in operation in 2025• No NY coal-fired units remain
New Resources• Endogenous entry, and exogenous near-term planned additions (through 2023),
including 800 MW offshore wind• Costs/characteristics per NREL’s Annual Technology Baseline 2018
Fuel Prices• Regional, annual fuel prices from AEO 2019 high oil and gas resource and
technology case• NY zonal natural gas prices derived from CARIS 1 low-case assumptions.
Load• Regional annual load and demand growth per AEO 2019• NY zonal annual load variability per CARIS 1• Regional hourly load shapes based on historical hourly load• Loads respond to statewide annual average retail price, with elasticity of -0.3
14

Key AssumptionsPolicies/Regulations in BAU (1)Regional Greenhouse Gas Initiative (RGGI)
• Implemented as cap-and-trade program for power generators >15 MW in NY and > 25 MW in the other RGGI states (RGGI allowance price is endogenous)
• Cost Containment Reserve (CCR), Emissions Containment Reserve (ECR), and Minimum Reserve Price, per RGGI Model Rule
• NJ and VA assumed to join by 2025
15
“Steps” in the RGGI annual allowance supply curve (2013$):
When the program is on a horizontal portion of the supply curve (DHORZ), RGGI is a CO2 price (exogenous allowance price).
When the program is on a vertical portion of the supply curve (DVERT), RGGI is a CO2 cap (exogenous emission quantity).
In practice, the RGGI allowance supply function is multi-year, and reflects a blend of expectations of vertical and horizontal in the various years.

Renewable Portfolio Standards (RPS)
• NY Tier 1 RPS: New capacity to satisfy remaining obligations assumed to be entirely wind & solar PV within NY (modeled requirement of 11.8% in 2025 for resources online as of 2017).
• Regional, aggregate RPSs applied in rest of the Eastern Interconnection
Installed Capacity Requirements (ICAP)
• Imposed in each NERC sub-region, including New York
• Assumed capacity credits of 38% for solar, 13% for wind, and 90% for other (source: RPM Base Residual Auction Results).
Interface Flow Constraints
• Individual line limits supplemented with internal and external interface flow constraints applied per NYISO
16
Key AssumptionsPolicies/Regulations in BAU (2)

Carbon Pricing Draft Recommendations (NYISO for IPPTF 2018): “apply carbon charges to external transactions such that they compete with internal resources as if the NYISO was not applying a carbon charge to internal suppliers.”
We apply this to each of four borders, one with each neighbor. We use constraints, which is equivalent to using prices, but more direct. Each constraint is that net imports across each border in each hour equal what they would be if the carbon adder were suddenly removed. The constraints create the prices ― specifically, the prices that make the flows equal what they would be if the carbon adder were suddenly removed.
Iteration required, repeating these steps:
• Simulate 2025 without border prices, and observe hourly net imports for each border.
• Simulate 2025 again, constraining hourly net imports to equal those in (1).
17
Representing the Border Flow Price

Representing the Border Flow Price with the Carbon Pricing PolicyIterate to equilibrium of hourly border flows (prices) and generator investment/retirement
18
Hourly border flows w/ price
suddenly removed
Generator investment &
retirement

Representing the Border Flow Price with the Carbon Pricing PolicyIterate to equilibrium of hourly border flows (prices) and generator investment/retirement
19
Iteration Adder from Hourly net imports from
Starting EGUs from
Endogenous Investment & Retirement?
1 None Endogenous 2020 Y
2 1 from 1 2020 Y
3 None Endogenous from 2 N
4 2 from 3 2020 Y
5 None Endogenous from 4 N
6 4 from 5 2020 Y
7 None Endogenous from 6 N
8 6 from 7 2020 Y
9 None Endogenous from 8 N
10 8 from 9 2020 Y
Equilibrium indicated by results 10 = results 8 almost exactly.

Key Differences from Brattle Analysis
Brattle and the NYISO, using MAPS, conducted a study of the more direct effects of the policy, with a scope similar to ours. But there are some differences. The following describe our analysis:
• Generator investment and retirement are endogenous, that is, they are predicted, based on profitability, as part of the simulation
• Border flows in each hour are held to what they would be if the carbon adder were removed suddenly (which we believe is the Policy), rather than to what they would be if the carbon adder had never been implemented. Consequently, the Policy can substantially affect the NY generation fleet and NY border flows.
• Our two sets of natural gas and technology cost projections do not match the sets used in Brattle study.
20

Results
21

Effects of Policy on CO2 EmissionsChange from BAU in 2025 (Thousand Short Tons)
The Policy reduces CO2 emissions in New York and reduces them even more in the Eastern Interconnection (EI) as a whole (negative leakage).
22
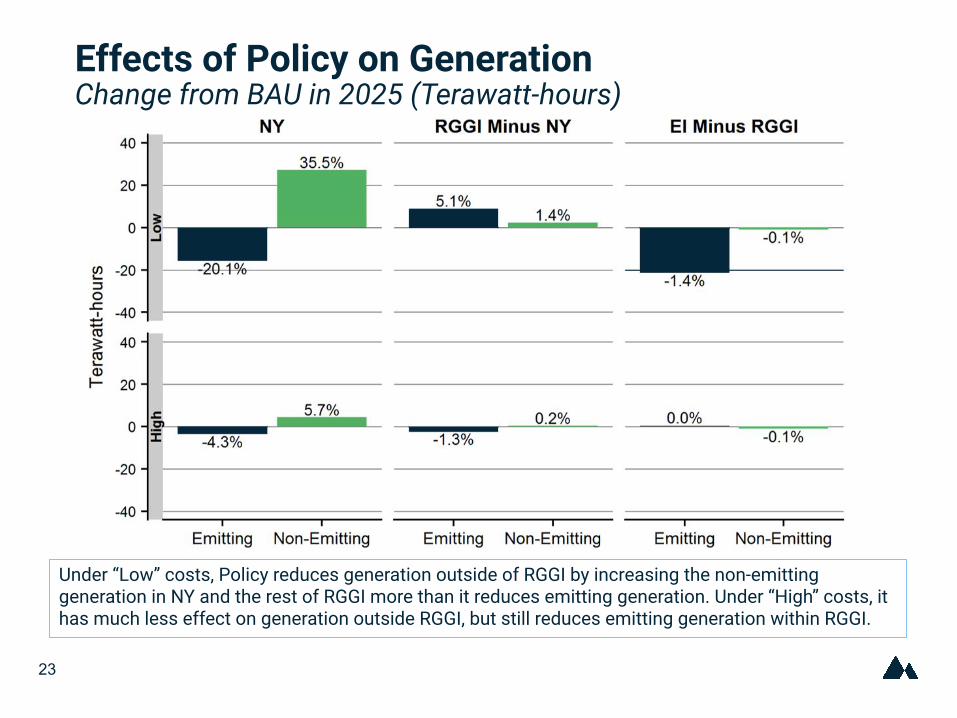
Effects of Policy on GenerationChange from BAU in 2025 (Terawatt-hours)
Under “Low” costs, Policy reduces generation outside of RGGI by increasing the non-emitting generation in NY and the rest of RGGI more than it reduces emitting generation. Under “High” costs, it has much less effect on generation outside RGGI, but still reduces emitting generation within RGGI.
23

Effects of Policy on NY Generation MixBAU and Policy in 2025 (Terawatt-hours)
Under “Low” costs, Policy increases solar and wind generation
and offsets both pre-existing and new
natural gas generation more than under the
“High” costs.
The Policy increases renewable and
non-fossil generation to 46% and 64%
respectively under “Low” costs. And to 33% and 52% under
“High” costs.
24
% Renewable 32% 46% 31% 33%
% Non-Fossil 51% 64% 49% 52%
Effects on Emission Intensity
• In addition to reducing NY fossil generation, the Policy also reduces the CO2-equivalent emission intensity of NY fossil generation by about 4% in both cases.
• An additional reason the NY Policy reduces Eastern Interconnection CO2, SO2, and NOX emissions outside of RGGI is that it changes the temporal distribution of wholesale electricity prices outside of RGGI in a way that slightly reduces the number of hours in which operation of coal-fueled generators is profitable. This correspondingly reduces the emission intensity of generation outside of RGGI.
25
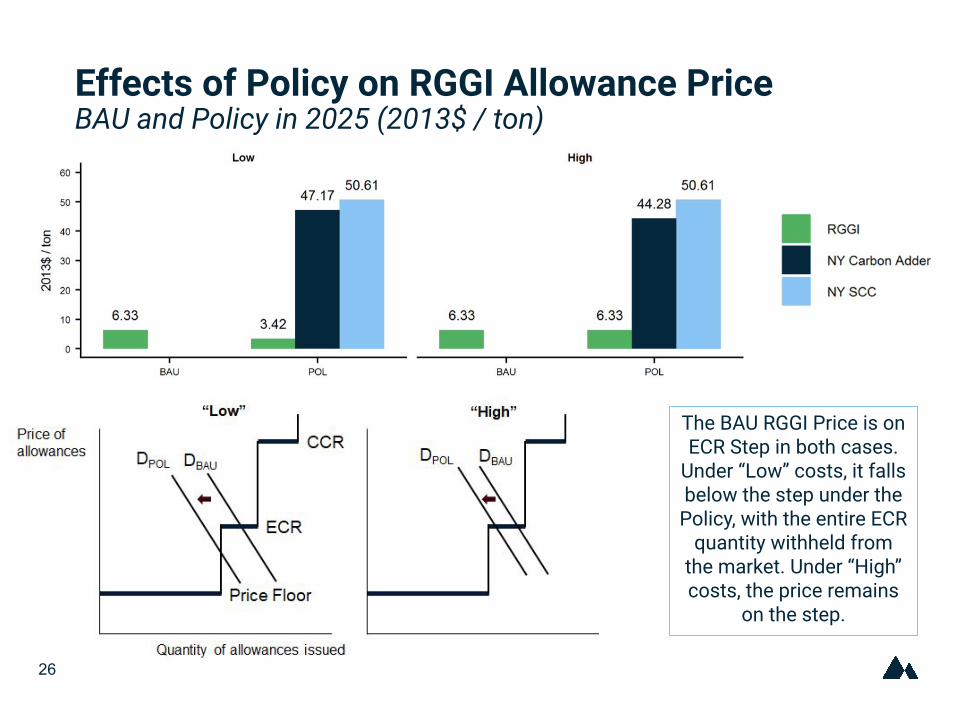
26
Effects of Policy on RGGI Allowance PriceBAU and Policy in 2025 (2013$ / ton)
The BAU RGGI Price is on ECR Step in both cases.
Under “Low” costs, it falls below the step under the
Policy, with the entire ECR quantity withheld from
the market. Under “High” costs, the price remains
on the step.

Effects of Policy on NY REC and ZEC PricesBAU and Policy in 2025 (2013$ / MWh)
The NY Carbon Pricing Policy drives ZEC and REC prices to zero under both cases.
27
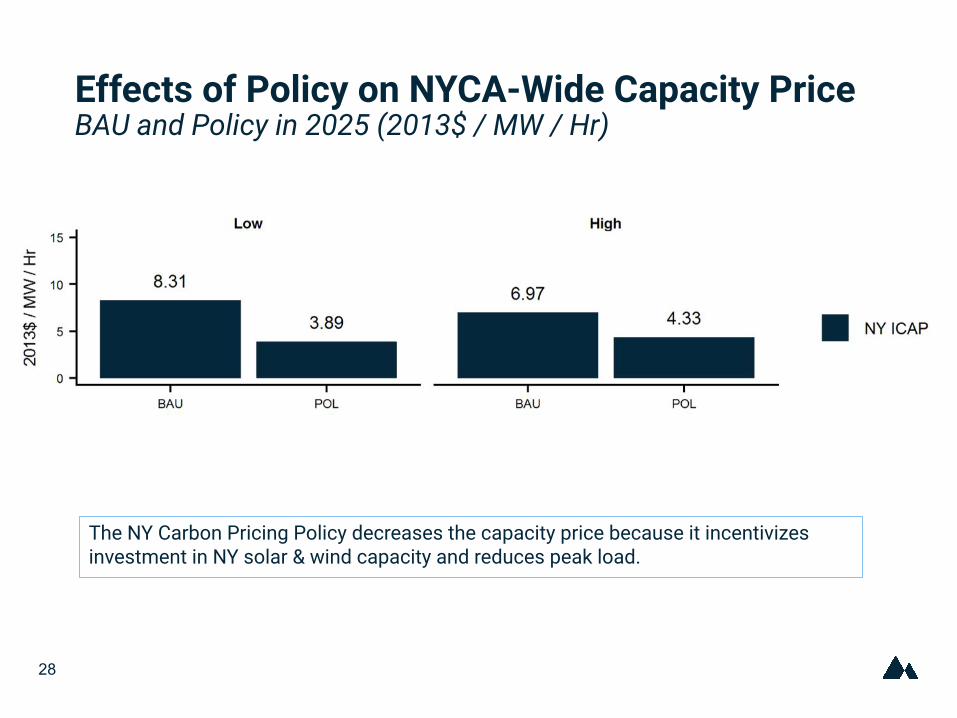
Effects of Policy on NYCA-Wide Capacity PriceBAU and Policy in 2025 (2013$ / MW / Hr)
The NY Carbon Pricing Policy decreases the capacity price because it incentivizes investment in NY solar & wind capacity and reduces peak load.
28

Effects of Policy on Wholesale Electricity PricesBAU and Policy in 2025 (2013$ / MWh)
The Policy drives up location-based marginal prices of electricity in New York by $20 to $24 (average effect within each zone). However, the revenue is rebated to end-users and the Policy reduces some other charges, so the average cost of the Policy to end-users is much smaller than this. A later slide shows this.
29
BAU Policy Change BAU Policy Change
A $30.01 $50.33 $20.32 $26.72 $48.50 $21.77
B $30.70 $50.13 $19.43 $28.84 $48.79 $19.95
C $27.27 $47.29 $20.02 $24.45 $46.59 $22.14
D $24.37 $43.96 $19.59 $22.10 $44.42 $22.32
E $26.91 $46.55 $19.64 $24.13 $46.34 $22.21
F $28.19 $48.08 $19.89 $25.30 $47.75 $22.45
G $28.47 $47.85 $19.38 $25.36 $47.47 $22.11
H $28.87 $48.71 $19.85 $25.70 $48.29 $22.60
I $30.06 $50.64 $20.58 $26.75 $49.98 $23.23
J $36.86 $59.99 $23.13 $31.09 $55.35 $24.26
K $30.09 $51.20 $21.12 $26.88 $50.16 $23.29
NY-Wide $32.0 $53.3 $21.2 $28.1 $51.0 $22.9
EI-Wide $29.0 $29.7 $0.6 $26.7 $27.6 $1.0
HighLow

30
Effects of Policy on Welfare Originating in New YorkChange from BAU in 2025 (2013$ millions)
“End-User Benefits” (called “End-User Net Benefits” on the next slide) are direct pocketbook & profit effects (“non-env. end-user surplus”). The env. benefits shown here are from reduction of NY emissions. Approx. 90% of the env. benefits are from CO2 & methane reductions, the rest from SO2 & NOX reductions. For CO2 & methane the global benefits are counted; for SO2 & NOX only the US benefits are counted. The reduction in gov’t revenue is primarily from reduced RGGI allowance prices (Low case) and RGGI allowance sales (both cases).
Under “Low” Cost Assumptions Under “High” Cost Assumptions
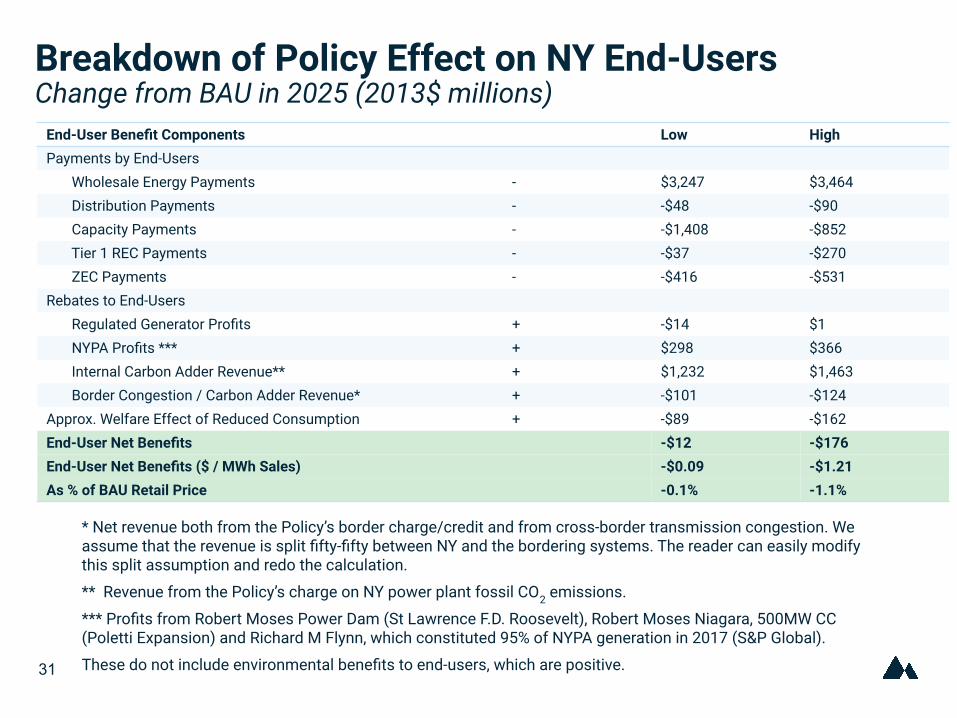
Breakdown of Policy Effect on NY End-Users Change from BAU in 2025 (2013$ millions)
* Net revenue both from the Policy’s border charge/credit and from cross-border transmission congestion. We assume that the revenue is split fifty-fifty between NY and the bordering systems. The reader can easily modify this split assumption and redo the calculation.
** Revenue from the Policy’s charge on NY power plant fossil CO2 emissions.
*** Profits from Robert Moses Power Dam (St Lawrence F.D. Roosevelt), Robert Moses Niagara, 500MW CC (Poletti Expansion) and Richard M Flynn, which constituted 95% of NYPA generation in 2017 (S&P Global).
These do not include environmental benefits to end-users, which are positive.31
End-User Benefit Components Low HighPayments by End-Users Wholesale Energy Payments - $3,247 $3,464 Distribution Payments - -$48 -$90 Capacity Payments - -$1,408 -$852 Tier 1 REC Payments - -$37 -$270 ZEC Payments - -$416 -$531Rebates to End-Users Regulated Generator Profits + -$14 $1 NYPA Profits *** + $298 $366 Internal Carbon Adder Revenue** + $1,232 $1,463 Border Congestion / Carbon Adder Revenue* + -$101 -$124Approx. Welfare Effect of Reduced Consumption + -$89 -$162End-User Net Benefits -$12 -$176End-User Net Benefits ($ / MWh Sales) -$0.09 -$1.21As % of BAU Retail Price -0.1% -1.1%

Effects of Policy on Welfare in Eastern InterconnectionChange from BAU in 2025 (2013$ millions)
The environmental benefits are 85% from CO2 and methane emission reductions, and the rest from SO2 and NOX emission reductions. The other comments from the “Effects of Policy on Welfare Originating in New York” slide apply to this figure as well, except that this figure shows benefits of the NY adder that originate anywhere in the Eastern Interconnection.
32
Under “Low” Cost Assumptions Under “High” Cost Assumptions

Indirect and Later Effects that We Do Not Estimate
We do not examine these because they are regulatory decisions or changes in policy or investor confidence that our model does not predict, or because they would happen only in later years:
• Could prevent FERC from requiring application of “minimum offer price rule” to clean generators in NY. That rule would likely prevent them from receiving capacity payments.
• By example - could persuade other states to adopt CO2 emission prices;
• By reducing the RGGI allowance price, could convince RGGI states to make the RGGI program more stringent in the future than it otherwise would be;
• Could continue to reward nuclear plants for their zero emissions beyond the potential end of ZEC policy, and that could encourage a more stringent RGGI program in the future;
• Could affect investor confidence (positively or negatively);
• Could reduce the amount of energy efficiency investments funded by RGGI revenues, which could persuade RGGI to reduce the program stringency.
33

Thank you.• Find out more about RFF online: www.rff.org• Follow us on Twitter: @rff• Subscribe to receive updates:
rff.org/subscribe

Appendix
35

Applications of the E4 Simulation Tool to Date
Project short-run and long-run effects, costs, and benefits of the following:
• CO2, SO2, & NOX cap-and-trade, rate limits & fees
• Renewable energy standards and cost changes
• Different fuel price paths and demand growth paths
• Different price responsiveness of demand
• Nuclear and coal retirements, including the DOE NOPR
• Offshore wind farms off east and west coasts
• Added DC transmission lines
• Interactions of the above
See later slide for list of publications.
36
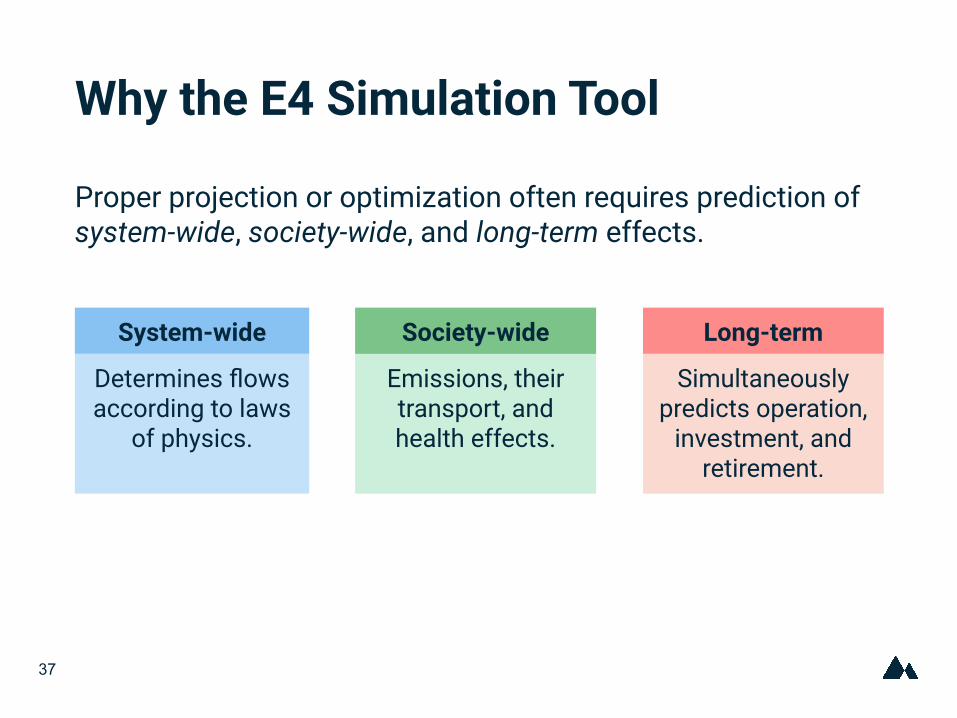
Why the E4 Simulation Tool
Proper projection or optimization often requires prediction of system-wide, society-wide, and long-term effects.
37
System-wide Society-wide Long-term
Determines flows according to laws
of physics.
Emissions, their transport, and health effects.
Simultaneously predicts operation,
investment, and retirement.

Other Strengths of the E4 Simulation Tool
• Demand function at each node (and growth)
• Can be used with model of any grid
• Software and US & Canadian data are transparent, publicly available, & modifiable
38

The Simulation Objective
Like a system operator, E4ST finds the combination of plant construction, retirement, and operation that maximizes consumer benefits minus subject to meeting load and respecting network constraints.
39
Other Annual
fixed costs
Operating costs
Annualized construction
costs
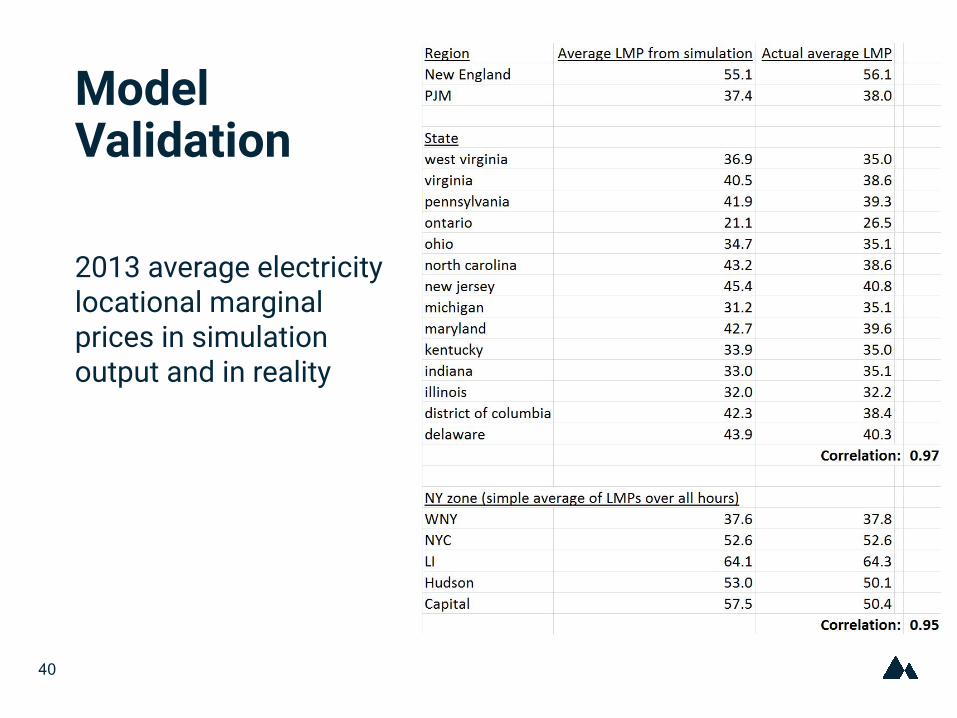
Model Validation
2013 average electricity locational marginal prices in simulation output and in reality
40
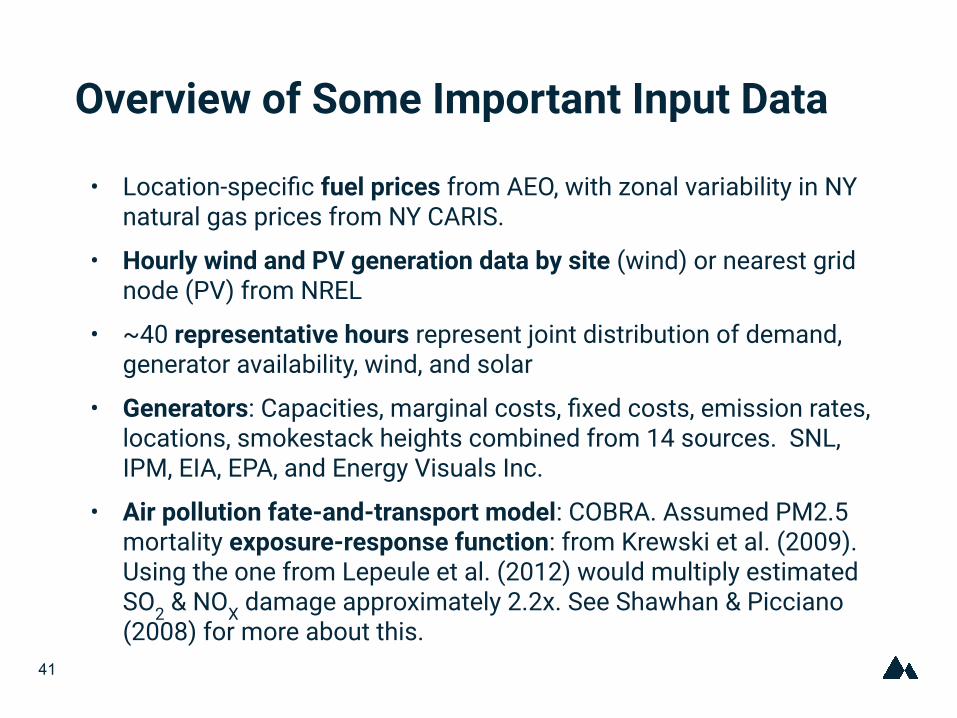
Overview of Some Important Input Data
• Location-specific fuel prices from AEO, with zonal variability in NY natural gas prices from NY CARIS.
• Hourly wind and PV generation data by site (wind) or nearest grid node (PV) from NREL
• ~40 representative hours represent joint distribution of demand, generator availability, wind, and solar
• Generators: Capacities, marginal costs, fixed costs, emission rates, locations, smokestack heights combined from 14 sources. SNL, IPM, EIA, EPA, and Energy Visuals Inc.
• Air pollution fate-and-transport model: COBRA. Assumed PM2.5 mortality exposure-response function: from Krewski et al. (2009). Using the one from Lepeule et al. (2012) would multiply estimated SO2 & NOX damage approximately 2.2x. See Shawhan & Picciano (2008) for more about this.
41

Cost Data for New GeneratorsTechnology-specific capital costs, heat rates, fixed/variable costs across 22 regions (AEO 2018)
42

Assumed Average Natural Gas Prices to Generators in 2025, by NY zone
Source: Proportional to CARIS 1 2025 NG prices, but scaled to be consistent with assumed NY-wide natural gas price under each case.
43

Most Recently Completed WorksD. Shawhan and P. Picciano, “Costs and Benefits of Saving Unprofitable Generators: A Simulation
Case Study for US Coal and Nuclear Power Plants.” Energy Policy, Volume 124, 2019, Pages 383-400, https://doi.org/10.1016/j.enpol.2018.07.040. Working paper version at http://www.rff.org/research/publications/costs-and-benefits-saving-unprofitable-generators-simulation-case-study-us. Cited in Federal Energy Regulatory Commission ruling document on the “Grid Resiliency Pricing Rule.” Cited in The New York Times, The Houston Chronicle, The Washington Post, The Globe and Mail, The Washington Examiner, VOX, Axios Generate, and other publications.
Shawhan, Daniel, and Paul Picciano. "Retirements and Funerals: The Emission, Mortality, and Coal-Mine Employment Effects of a Two-Year Delay in Coal and Nuclear Power Plant Retirements." Resources for the Future working paper 18-18, July 5, 2018. http://www.rff.org/research/publications/retirements-and-funerals-emission-mortality-and-coal-mine-employment-effects. Cited in Bloomberg, The Houston Chronicle, The Columbus Dispatch, Axios, The Washington Examiner, Utility Dive, and other publications.
D. Shawhan, “Co-Emission and Welfare Effects of Electricity Policy and Market Changes: Results from the EMF 32 Model Intercomparison Project.” Energy Economics, Volume 73, June 2018, Pages 380-392. https://doi.org/10.1016/j.eneco.2018.03.034.
C. Fischer, B. Mao, and D. Shawhan, “Trade between Mass- and Rate-Based Regulatory Regimes: Bad for Emissions?” Energy Economics, Volume 73, June 2018, Pages 326-336. https://doi.org/10.1016/j.eneco.2018.04.031.
44
Bistline, John, Daniel Shawhan, Geoffrey Blanford, Francisco de la Chesnaye, Biao Mao, Nidhi Santen, Ray Zimmerman, Alan Krupnick, “Systems Analysis in Electric Power Sector Modeling: Evaluating Model Complexity for Long-Range Planning.” Electric Power Research Institute and Resources for the Future, October 2017. http://www.rff.org/research/publications/systems-analysis-electric-power-sector-modeling-evaluating-model-complexity.
Biao Mao, Daniel Shawhan, Ray Zimmerman, Jubo Yan, Yujia Zhu, William Schulze, Richard Schuler, Daniel Tylavsky. “The Engineering, Economic and Environmental Electricity Simulation Tool (E4ST): Description and an Illustration of its Capability and Use as a Planning/Policy Analysis Tool.” Proceedings of the 49th Hawaii International Conference on System Sciences (HICSS), Koloa, HI, 2016, pp. 2317-2325. (peer review information at http://www.hicss.org/components.htm) DOI: 10.1109/HICSS.2016.290 Won best paper award in the Electric Energy Systems track.
Yujia Zhu; Tylavsky, D., “An optimization based network reduction method with generator placement,” in North American Power Symposium (electronic journal), pp.1-6, 4-6 Oct. 2015. DOI: 10.1109/NAPS.2015.7335172
Di Shi; Tylavsky, D.J., “A Novel Bus-Aggregation-Based Structure-Preserving Power System Equivalent,” in Power Systems, IEEE Transactions on, vol.30, no.4, pp.1977-1986, July 2015.DOI: 10.1109/TPWRS.2014.2359447
45
Selected Publications (2)
Selected Publications (3)Lamadrid, A.J.; Shawhan, D.L.; Murillo-Sanchez, C.E.; Zimmerman, R.D.; Yujia Zhu; Tylavsky, D.J.;
Kindle, A.; Dar, Z., “Economic cost-benefit analysis for power system operations with environmental considerations,” in PowerTech, 2015 IEEE Eindhoven, pp.1-6, June 29-July 2, 2015. DOI: 10.1109/PTC.2015.7232802
Alberto J. Lamadrid, Daniel L. Shawhan, Carlos Murillo-Sanchez, Ray D. Zimmerman, Yujia Zhu, Daniel J. Tylavsky, Andrew G. Kindle, and Zamiyad Dar, “Stochastically Optimized, Carbon-Reducing Dispatch of Storage, Generation, and Controllable Loads.” IEEE Transactions on Power Systems, Vol. 30, Issue 2, March 2015, pp. 1064–1075.DOI: 10.1109/TPWRS.2014.2388214
J. Taber, D. Shawhan, R. Zimmerman, C. Marquet, M. Zhang, W. Schulze, R. Schuler, S. Whitley, “Mapping Energy Futures Using The SuperOPF Planning Tool: An Integrated Engineering, Economic and Environmental Model.” Proceedings of the 46th Annual Hawaii International Conference on System Sciences, Computer Society Press, January 2013, pages 2020-2029. (peer review information at http://www.hicss.org/components.htm)DOI: 10.1109/HICSS.2013.391.
D. Shi, D. Shawhan, N. Li, D. J. Tylavsky, J. Taber, R. Zimmerman, “Optimal Generation Investment Planning: Part 1: Network Equivalents,” North American Power Symposium (electronic journal), Champaign, Illinois, September 2012, 6 pages. DOI: 10.1109/NAPS.2012.6336375.
46
N. Li, D. Shi, D. Shawhan, D. J. Tylavsky, J. Taber, R. Zimmerman, “Optimal Generation Investment Planning: Part 2: Application to the ERCOT System,” North American Power Symposium (electronic journal), Champaign, Illinois, September 2012, 6 pages.DOI: 10.1109/NAPS.2012.6336374
Y. Qi, D. Shi, D. J. Tylavsky, “Impact of Assumptions on DC Power Flow Accuracy,” North American Power Symposium (electronic journal), Champaign, Illinois, September 2012, 6 pages.DOI: 10.1109/NAPS.2012.6336395
D. Shi, D. J. Tylavsky, “An Improved Bus Aggregation Technique for Generating Network Equivalents,” 2012 IEEE Power Engineering Society General Meeting, San Diego, CA, Jul. 2012, 8 pages.DOI: 10.1109/PESGM.2012.6344668
R. D. Zimmerman, C. E. Murillo-Sánchez, and R. J. Thomas, “MATPOWER: Steady-State Operations, Planning and Analysis Tools for Power Systems Research and Education,” Power Systems, IEEE Transactions on, vol. 26, no. 1, pp. 12-19, Feb. 2011.DOI: 10.1109/TPWRS.2010.2051168
47
Selected Publications (4)