Embed Size (px)
Citation preview
Benefits of Relationship Banking: Evidence from Consumer Credit Markets
Sumit Agarwala, Souphala Chomsisengphetb, Chunlin Liuc, and Nicholas S. Soulelesd
December, 2007
Abstract This paper empirically examines the benefits of relationship banking to banks, in the context of the credit card market. Using a unique panel dataset that contains rich information about the relationships between a large bank and its credit card customers, we estimate the effects of relationship banking on the customers’ default, attrition, and usage behavior. We find that relationship accounts exhibit lower probabilities of default and attrition, and have higher utilization rates, compared to non-relationship accounts. Such effects become more pronounced with increases in various measures of the strength of the relationships, such as relationship length, breath, depth, and proximity. Moreover, dynamic information about changes in the behavior of a customer’s other accounts at the bank help predict and thus monitor the behavior of the credit card account over time. These results imply significant benefits of relationship banking to banks in the retail credit market. JEL Classification: Key Words: Relationship Banking; Credit Cards, Consumer Credit, Deposits, Investments; Household Finance.
The authors would like to thank Jim Papadonis and Joanne Maselli for their support of this research project. We would also like to thank Bert Higgins for helpful comments. We are grateful to Diana Andrade, Ron Kwolek, and Greg Pownell for excellent research assistance. The views expressed in this paper are those of the authors alone, not those of the Office of the Comptroller of the Currency or the Federal Reserve Bank of Chicago. Corresponding author: Nicholas Souleles at [email protected] a Federal Reserve Bank of Chicago b Office of the Comptroller of the Currency c Finance Department, University of Nevada - Reno d Finance Department, University of Pennsylvania and NBER
1
1. Introduction
According to recent theories of financial intermediation, one of the main roles of a bank
is as a relationship lender.1 As a bank provides more and more services to a customer, it creates a
stronger relationship with the customer and gains more private information about him or her.
Such relationships can potentially benefit both banks and their customers. For instance,
relationship banking can help banks in monitoring the default behavior of borrowers, providing
the banks with a comparative advantage in lending.2 Relationship lending can also lower banks’
overall cost of information gathering over multiple products. Depending on the competitiveness
of the banking sector, these benefits to banks can lead to increased credit supply to customers,
through either greater quantities and/or lower prices of credit (e.g., Boot and Thakor, 1994).3
Empirical studies of the benefits of the relationship banking have largely focused on the
benefits to customers, corporate customers in particular. Early studies documented that the
existence of a bank relationship increases the value of a firm (e.g., Billett et al., 1985; Slovin et
al., 1993). Subsequent studies have sought to measure the effects of relationships on credit
supply to firms. These studies have emphasized different aspects of relationships, such as their
length, proximity, breadth (e.g., number of services provided), and exclusivity. However, the
results of the studies have been mixed. For example, Petersen and Rajan (1994) find that
relationship lending affects the quantity of credit more than the price, while other studies find
that customers get either lower future contract prices (e.g., Burger and Udell, 1995; Chakravarty
and Scott, 1999) or higher future contract prices (e.g., Ongena and Smith, 2002).
1 Boot (2000) provides an excellent review of the literature on relationship banking. 2 However, others point out that relationship lending can potentially create a moral hazard problem, in that the customer can exploit the relationship in bad times (Dewatripont and Maskin, 1995; and Bolton and Scharfstein, 1996). 3 For example, relationship lending can potentially create a “hold-up” problem providing a bank with an information monopoly that would allow it to price contracts at non-competitive terms (Sharpe, 1990; Rajan, 1992; and Wilson, 1993).

2
There has been limited empirical research on the underlying benefits of relationships to
banks. Mester, Nakamura, and Renault (2005) use a sample of 100 Canadian small-business
borrowers to investigate the benefits of particular relationship information in monitoring the risk
of corporate loans. They find that information about customers’ collateral, in particular their
inventory and accounts receivable, which might not be available to banks outside of a
relationship, is useful for loan monitoring. Also, changes in transaction account balances are
informative about changes in this collateral.
While the above studies analyze relationship lending in the context of firm-lender
relationships, it can also potentially matter for consumer-lender relationships. Using the Survey
of Consumer Finance [SCF], Chakravarty and Scott (1999) conclude that relationship lending
not only lowers the probability of credit rationing but also lowers the price of credit for consumer
loans. While this study provides evidence that banks pass on some the benefits of relationship
lending to consumers, it does not directly measure the underlying benefit to the banks in the first
place. We fill this gap in the literature by analyzing the economic significance of relationship
banking to banks, in the context of credit card lending.
Credit cards provide a good setting for analyzing retail relationship lending. Credit cards
are consumers’ most important source of unsecured credit, in addition to being one of the most
important means of payment. By the late 1990s, almost three-fourths of U.S. households had at
least one credit card, and of these households about three-fifths were borrowing on their cards
(1998 SCF). Aggregate credit card balances are large, currently amounting to about $900 billion
(Federal Reserve Board 2007). Another advantage of the credit card market is that credit card
issuers have largely automated the management of their credit card accounts, relying very
heavily on credit-risk scores (e.g., Moore, 1996). The scores are the issuers’ own summary

3
statistics for the default risk and profitability of each account. As we discuss below, there are two
main types of scores, based on different sets of information available to the issuers, both public
and private. Hence we can use the scores to conveniently summarize all the public and private
information used by the issuers. Such comprehensive summaries of banks’ information have not
been available in previous studies of bank lending (especially in markets where unobserved
“soft” information can be important).
In this study, we examine the impact of bank relationships on the default, attrition and
other usage behavior of credit-card holders. We utilize a unique, representative dataset of about a
hundred thousand credit card accounts, linked to information about the other relationships that
the account-holders have with their credit card bank. Previous studies (Gross and Souleles, 2002)
analyzed the usefulness of other, non-relationship types of information in predicting consumer
default, including macroeconomic and geographic-average demographic variables, “public”
credit bureau information that is available to all potential lenders, and “private” within-account
(as opposed to across-account) information about the past behavior of the account (or other
product) at issue. The key contribution of this study is to use the cross-account relationship
information, to test whether the bank’s private information regarding the behavior of the other
accounts held by the same consumer at the bank provides additional predictive power regarding
the account at issue. Since our dataset samples credit card accounts, we focus on predicting
credit card utilization, default, and attrition. The cross-account relationship information that we
use is quite rich and comprehensive. It includes measures of the proximity of the relationship
(distance from a branch), breadth of the relationship (number of relationships), types of
relationships (e.g., deposit, investment, and loan accounts), length of relationships (age in
months), and depth of relationships (balances in dollars).
4
This dataset allows us to estimate some of the most important potential benefits of such
relationships to retail banks. First, we examine if the various measures of relationships can help
banks better predict the default behavior of credit card accounts. Second, we also examine the
effects of relationships on attrition and utilization rates. To our knowledge, this is the first
comprehensive analysis of relationships in the retail banking market.
Previewing the results, we find substantial benefits from relationship banking, through
lower credit risk, lower attrition, and increased utilization. Using Cox proportional hazard
models, the relationship information is found to significantly help predict default and attrition,
above and beyond all the other variables used by the bank – both public information and private
non-relationship information based only on the behavior of the credit card account. For example,
for credit card accounts with at least one other relationship with the bank, the marginal
probabilities of default and attrition are about 13% and 11% lower than those of non-relationship
accounts, ceteris paribus. More generally, the benefits to the bank tend to increase with the
various measures of the strength of the relationships, such as relationship breadth, depth, length,
and proximity. Also, explicitly dynamic information about changes in the behavior of the
account-holders’ other relationships at the bank help predict the behavior of the credit card
account over time. This suggests that one important advantage of relationships is that they can
help improve the monitoring of borrowers. Further, we find that relationship banking is
associated with higher utilization rates. For instance, relationship accounts have a 5 percentage
point higher utilization rate compared to non-relationship accounts, ceteris paribus. Taken
together, the results imply that relationship lending can provide significant benefits to retail
lenders.

5
The remainder of the paper is organized as follows. Section 2 describes the data. Section
3 discusses the empirical methodology and results. Section 4 concludes.
2. Data
We use a unique, proprietary panel dataset of credit card accounts with associated
relationship information, from a large, national financial institution. The dataset contains a
representative sample of about a hundred thousand accounts open as of October 2001, followed
monthly for the next 24 months. The credit card data contains the main billing information listed
on each account's monthly statement, including total payments and spending, APR, balances,
debt, as well as the credit limit.
The dataset also includes the two key credit-risk scores for each account, which are
lenders’ traditional summary statistics for the risk and profitability of the account. The “external”
credit score (the industry standard FICO score) is estimated based on all available credit-bureau
data. While the credit bureaus contain some information about the full range of a consumer’s
credit relationships, across all lenders, the individual lenders report only a subset of their own
information about each relationship to the bureaus. The external scores summarize this public
information available to all potential lenders. The “internal” credit score is estimated by the
lenders using their private, in-house information. Traditionally (and true for our sample), that
information has been limited to the behavior of the individual account in question -- here the
sample credit-card accounts -- not the other accounts or relationships the account-holder has at
the same bank. Thus the two scores conveniently summarize the (non-relationship) information
used by the bank in managing its credit cards.
6
This credit-card data has been augmented with a rich array of other data sources. First,
and most importantly for our purposes, the dataset was linked to a systematic summary of all of
the other main accounts the credit-card account-holders have at the bank. Specifically, we have
information about the following eight types of deposit, investment, and loan relationships: (i)
checking; (ii) savings; (iii) CD’s; (iv) mutual funds; (v) brokerage; (vi) mortgages; (vii) home
equity loans (second mortgages); and (viii) home equity lines of credit.4 For each relationship
type, we know the length of the relationship (age in months) and the depth of the relationship
(balances in dollars).5 This relationship information is updated monthly over the sample period.
Second, in addition to the external credit score, which summarizes the credit-bureau
information, the dataset also includes some of the underlying credit-bureau information also
available to banks: the total number of secured and of unsecured credit lines held by the account-
holder, from all lenders; total balances on student loans, auto loans, and mortgage loans,
respectively; total secured (home equity line of credit) and unsecured (credit cards) credit limits.
The credit bureau variables are updated quarterly. These variables represent all the credit-bureau
data that the bank collected from the credit-bureaus for managing its credit-card portfolio.
Third, as in Gross and Souleles (2002), this credit data is augmented with
macroeconomic and geographic-average demographic information based on each account-
holder’s location, including the county unemployment rate, average state income, the state
divorce rate, the fraction of people in the state lacking healthcare coverage, and the state
bankruptcy filing rate (which captures other common local effects, including hard-to-measure
4 The dataset does not include a few smaller relationships, such as student loans, personal loans, and auto loans. Thus our results represent a lower bound of the total possible value of relationships, though some of this information (auto loans and student loans) will be partly captured by the credit bureau data that we use. 5 The exception is that the balances information is not available for brokerage accounts.

7
effects like changes in stigma).6 Some of these variables are updated quarterly while others are
updated annually. The dataset also includes an account-holder specific estimate of wealth (coded
as “high”, “medium”, or “low”), as of the time of the origination of the credit-card account.
The sample includes only credit card accounts that were open as of the start of the sample
period in October 2001.7 To focus on the effects of relationships and minimize any potential
endogeneity, for credit-card account-holders with other relationships, in the reported results we
require that these other relationships have been opened before the credit-card account; that is, we
exclude account-holders that initiated new relationships subsequent to opening the credit card
account.
Table 1 provides summary statistics for the key variable used below, averaged over the
two years of the sample period. The table distinguishes “relationship accounts,” which have at
least one other relationship (56% of the sample), and “non-relationship accounts,” which have no
other relationships (43.7%). Notably, the relationship accounts have somewhat higher external
and internal credit scores. Thus, based on the public credit bureau data, and the private within-
account information, the relationship accounts appear to be somewhat less risky than the non-
relationship accounts. (The scores are calibrated such that higher scores correspond to lower
probabilities of default.)
The next section undertakes a multivariate analysis of the accounts’ behavior,
emphasizing the effects of the private, cross-account relationship variables, conditional on
controlling for the other covariates like the credit scores.
6 The demographic and macroeconomic data was collected from various governmental websites: divorce (www.cdc.gov/nchs/nvss.htm); unemployment (www.bls.gov); income (www.bea.doc.gov/bea/regional/sqpi.html); bankruptcy (www.abiworld.org/stats/bustate.html); and health insurance (www.census.gov/hhes/www/hlthins.html). 7 That is, accounts that are closed at the start of the sample, due to attrition (including fraud/death) or default (including bankruptcy and delinquency), have been excluded. As discussed in Gross and Souleles (2002), this also makes the data stationary. Furthermore, to simplify the analysis of account age, we also exclude accounts that originated before October 1999.
8
3. Empirical Results
3.1 Relationship Lending and Credit Card Default and Attrition
3.1.1 Methodology
To test if relationship lending can help banks in assessing the default and attrition
probabilities of credit card loans, we estimate Cox proportional hazard models for default and for
attrition.8 We use a standard industry definition of default as going bankrupt or three months
delinquent, whichever comes first (e.g., as in Gross and Souleles, 2002). Attrition is based on
account closing without default.
The Cox model allows for a non-parametric baseline hazard rate as well as potentially
time-varying explanatory variables. We estimate specifications of the following form:
),(lationshipReauCreditBure
manceLoanPerforMacroDemoesStateDummiTimeY
ititt,i
t,it,iitt,i
16665
646321
where Yi,t is a dummy variable indicating whether account i defaulted (or, in other specifications,
attrited) in month t. We group the main explanatory variables into six categories: Timet
represents a complete set of month dummies, one for each month in the sample period.
StateDummiesi represents a set of dummy variables corresponding to the state in which account-
holder i lives. MacroDemoi,t-6 represents time-varying, macroeconomic and demographic
characteristics, including the county unemployment rate and, at the state level, average income,
the fraction of people without health insurance, the divorce rate, and the bankruptcy filing rate;
plus the account-holder specific estimate of wealth.9,10 LoanPerformancei,t-6 includes measures of
8 We also estimated a multinomial logit model and the results were qualitatively similar. 9 The time-varying variables in MacroDemo, LoanPerformance, CreditBureau, and Relationship are lagged by six months to minimize endogeneity, as in Gross and Souleles (2002). For instance, by the time an account is already three months delinquent, its credit score would have already severely deteriorated, potentially leading to reverse causality.
9
the performance of the sample credit card account over the sample period, including monthly
debt and purchases, and the credit limit, interest rate, and the internal (within-account) credit-risk
score. CreditBureaui,t-6 represents the external credit scores and the other variables from the
credit bureaus: the number of secured and unsecured trade lines, total credit limits for secured
and unsecured trade lines, and total mortgage, auto, and student loan balances.
Such variables (other than Relationship) have been studied before. Gross and Souleles
(2002) show that the external scores are very powerful predictors of default. Even given these
scores, the internal scores are also very powerful predictors, which implies that credit-card
issuers’ private within-account information is valuable. Nonetheless, even given the two scores,
macroeconomic and demographic characteristics are also predictive, albeit much less so. This
suggests that the issuers are not using all potentially available information (perhaps due to
regulatory or reputational concerns).
The key innovation of this study comes in estimating the effects of Relationshipi,t-6, which
represents various measures of the account-holders’ relationships. Relationship measure R1
simply uses a dummy variable to identify the credit card account-holders that have at least one
other relationship at the bank at origination (the omitted, baseline category is non-relationship
accounts). R2 focuses on the proximity of the relationship, using dummy variables to distinguish
account-holders that have a relationship and reside in states with bank branches, and account-
holders that have a relationship but do not reside in states with bank branches (omitting non-
relationship accounts). R3 measures the breadth of the relationship, using dummy variables for
the number of relationships (1 to 6+, omitting 0 relationships). R4 focuses on the types of
relationship, grouping the relationships into three broad categories (again using dummy
10 Four states (California, Colorado, Indiana, and Louisiana) do not publish divorce statistics and so our baseline specification omits the divorce rate. If instead we include the divorce rate but drop observations in these states, the

10
variables): deposit relationships, investment relationships, and loan relationships. R5 identifies
the types of relationships more finely (8 categories): checking and savings accounts (deposit
relationships); CDs, brokerage, and mutual fund accounts (investment relationships); and
mortgages, home equity loans, and home equity lines (loan relationships). R6 measures the
length (age) of the relationships (months since opening), for each of the eight relationship
categories separately. R7 measures the depth of the relationship by the balances of each of the
relationship categories (with the noted exception that we do not have balance information for
brokerage accounts). R8 considers salient combinations of the previous measures, including
relationship breadth, type, depth, and length simultaneously. Finally, R9 considers the effect of
changes in the various types of balances (between t-6 and t-5), in addition to the level of
balances in R7. This dynamic information emphasizes more specifically the advantage of
relationships in ongoing monitoring of loans, which has often been emphasized in the theoretical
literature.
We also considered a number of additional specifications. For instance, we also
interacted the measures of relationship type and length.11 In all reported results, the standard
errors are clustered to adjust for heteroscedasticity across accounts and serial correlation within
accounts.
3.1.2 Results
To start, we first show how the baseline hazard rates vary with the number of
relationships, without controlling for other covariates. Figure 1a shows the associated survival
curves for (lack of) default. The survival curves are monotonically increasing with the number of
divorce rate is statistically significant but does not change our other key conclusions. 11 We also considered legal variables at the state level, such as homestead, personal property, and garnishment levels.
11
relationships. For example, for accounts with just one other relationship, the probability of not
defaulting within 48 months is below 96%. But for accounts with six or more relationships, that
probability significantly rises, to over 99%. Figure 2 shows the analogous survival curves for
(lack of) attrition. Again, the curves substantially and monotonically increase with the number of
relationships.
We now estimate the full multivariate Cox model, following equation (1). We begin by
briefly discussing the results for the macroeconomic-demographic, loan performance, and credit
bureau variables (for brevity, not reported). Many of the coefficients are significant. For
instance, the probability of default increases with the local unemployment rate; with lack of
health insurance; and with the lagged state bankruptcy rate. The effects for attrition generally
have the opposite sign. The probability of both default and attrition monotonically decline with
wealth.
Turning to the credit variables, higher debt is associated with increased probabilities of
default and attrition. The external and internal scores are both significantly negatively related to
default and significantly positively related to attrition. Their implied marginal effects are
economically significant. A decline of 20 points in the external score or the internal score results
in a 14% and 14% increase in the probability of credit card default, respectively. Thus, the public
information from the credit bureaus is quite predictive, and even given this information the
bank’s private within-account information is also quite predictive. Many of the individual credit
bureau variables are also predictive, albeit less so. The probability of default generally increases
with total balances on other loans (mortgage, auto, student loans) and the number of unsecured
credit lines. Overall, these results are generally consistent with prior research (Gross and
Souleles, 2002).

12
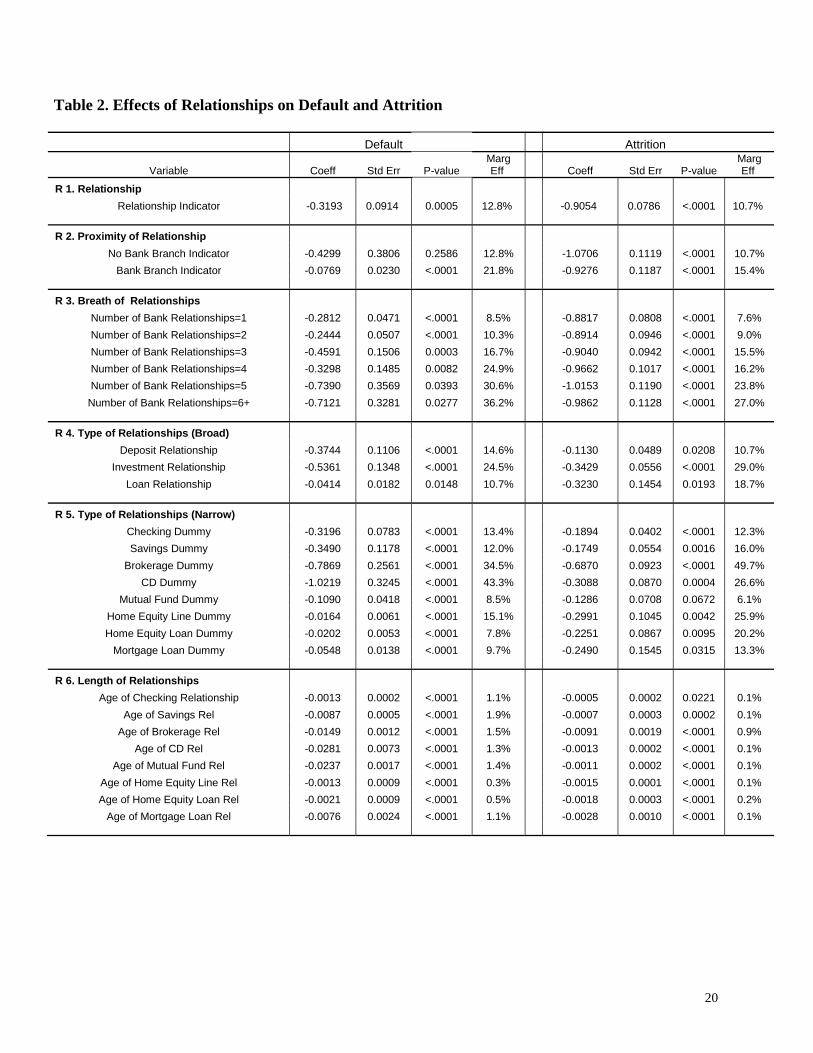
Table 2 presents our main results for the various measures of relationships, for default
and attrition respectively. Each horizontal panel in the table shows the estimated coefficients
from the Cox model, plus the implied marginal effects, from separate specifications using each
of the relationship measures R1 to R9. R1 begins with just the indicator variable for having any
other relationship. This relationship variable is statistically significant. The corresponding
marginal effects imply that relationship accounts have a 13% lower probability of default, and a
11% lower probability of attrition, relative to non-relationship accounts. These effects are
economically significant, even given the rich set of other covariates, including both the public
information and private within-account information. Thus the results compellingly demonstrate
the value of cross-account relationship information.
The remaining specifications explore different aspects of the relationships. Relationship
measure R2 focuses on proximity. While relationship accounts that reside in states without
branches have a lower probability of default and attrition than non-relationship accounts,
relationship accounts that reside near branches have even lower probabilities of default and
attrition. Even given the other covariates controlling for local conditions, proximity to the bank
matters (Petersen and Rajan, 2002). R3 measures relationship breadth according to the number of
relationships. As in Figure 1, the probabilities of default and attrition significantly and
monotonically decline with the number of relationships. E.g., the marginal probability of default
decreases by 9% for the first relationship, and by 36% for the sixth (or more) relationship. The
marginal probability of attrition decreases by 8% for the first relationship and 27% for the sixth
relationship. These are substantial effects.
Relationship measure R4 considers the effects of different types of relationships. The
existence of any of the three broad relationship types is associated with lower probabilities of
13
default and attrition. The magnitudes of the effects are largest for investment relationships: The
probability of default decreases by 24% for investments relationships, versus 15% for deposit
relationships and 11% for loan relationships. The results for attrition are similar. R5 uses a finer
partition of the types of relationships. Within investment accounts, brokerage and CD
relationships have especially large negative effects on default and attrition. All the other
relationships also have significant, albeit smaller, negative effects.
Measure R6 focuses on the length of the other relationships (age in months). For each
additional month, the probability of default generally declines by about 1% to 2%. The
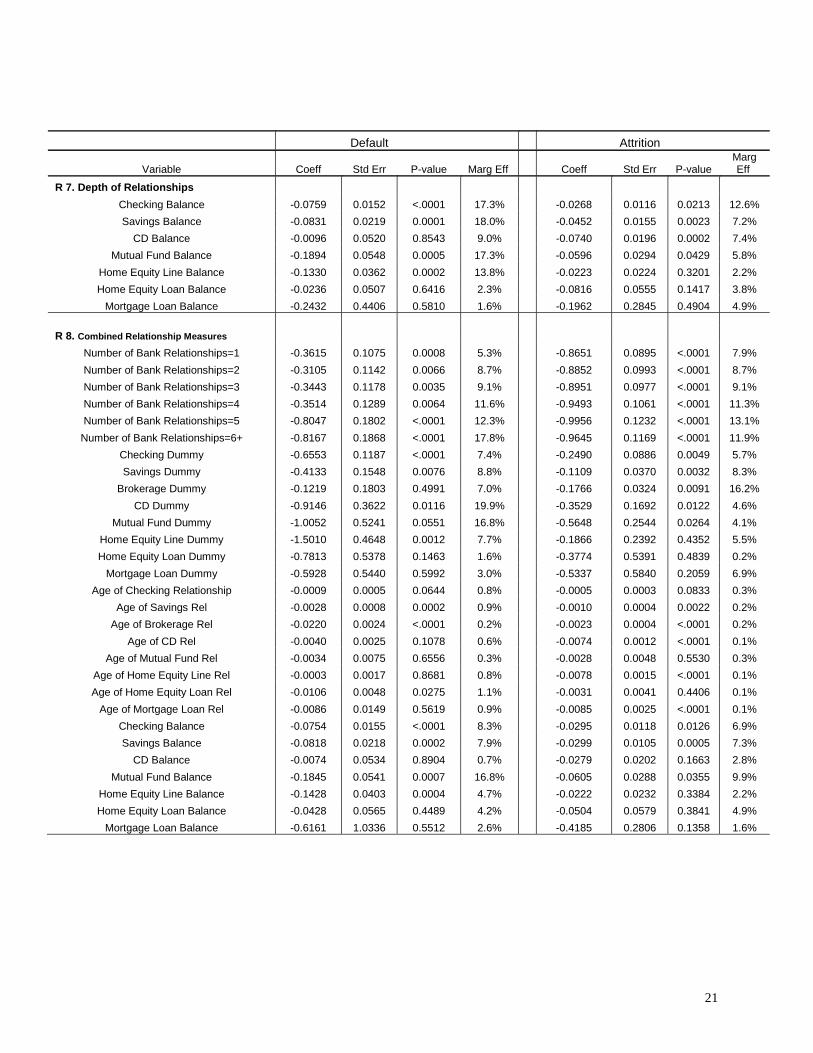
probability of attrition also declines, though the magnitudes are smaller. R7 focuses instead on
relationship depth, using ln(balances + $1). (The specification also includes the indicator
variables for having the corresponding relationship, as in R5.) For all relationships, larger
balances at the bank are associated with smaller probabilities of default (controlling for total loan
balances from the credit bureaus and the measure of total wealth), with the majority of the
coefficients being statistically significant. The results for attrition are generally similar, with
larger balances associated with less attrition.
R8 simultaneously considers the breadth, type, length, and depth of the relationships. The
general pattern of results is similar to that above, though some of the effects are somewhat less
significant and smaller in magnitude, presumably reflecting the greater number of partially
correlated relationship measures.
In sum, under all the various measures of relationship, relationship accounts have lower
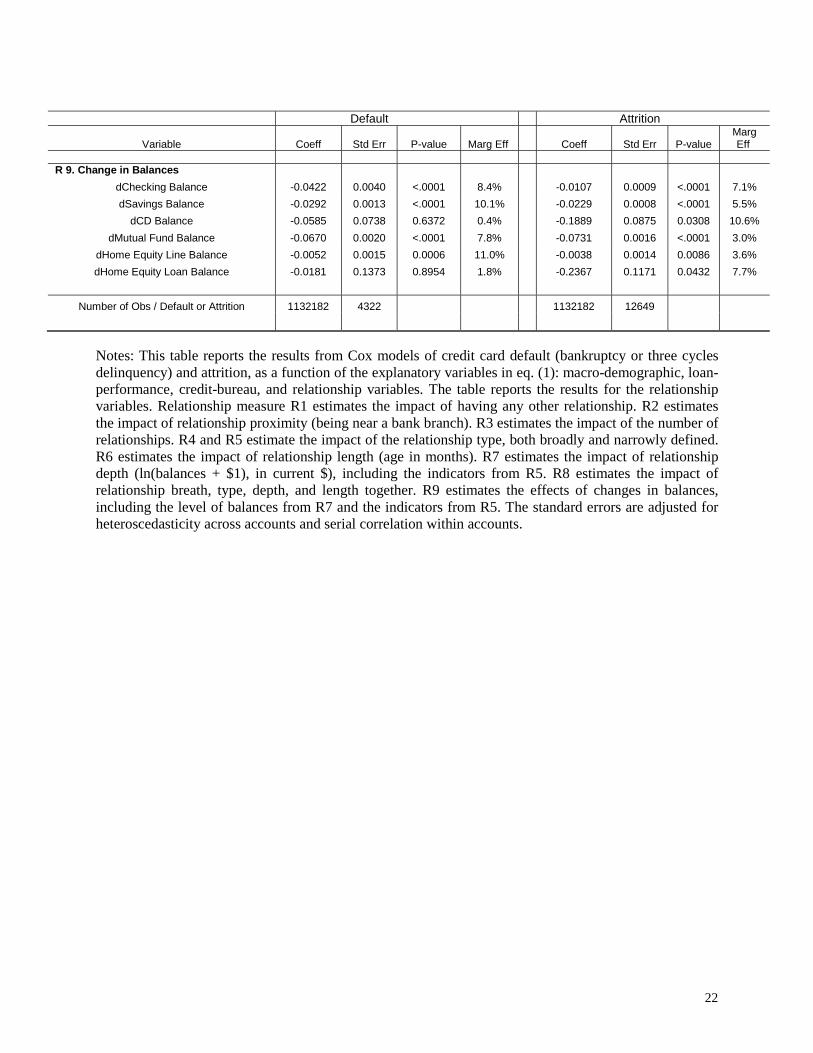
probabilities of default and attrition, ceteris paribus. Relationship measure R9 includes explicitly
dynamic information, namely the change in relationship balances (in addition to the level of
balances from R7 and the indicators from R5). The specification also includes the corresponding

14
changes in the external and internal credit scores. Starting with default, the changes in scores
have negative, statistically and economically significant coefficients. As expected, upwards
revisions in the scores reflect the arrival of (public and private) within-account information
indicating a reduction in default risk. Even controlling for this and the rich set of other
covariates, the changes in balances all have negative coefficients, most of which are significant.
Thus increases in relationship balances are associated with decreased default risk, ceteris paribus.
The results for attrition are generally similar. These results show the value of relationships
specifically in the ongoing monitoring of loans.
3.2 Relationship Lending and Credit Card Utilization
3.2.1 Methodology
In this section we consider the effects of relationships on account utilization rates, i.e.
account balances relative to the account limit. For consistency, we generally use the same
covariates as in equation (1), but replace the dependent variable Yi,t with the utilization rate of
account i in month t.12 We estimate by OLS, allowing for heteroscedasticity across accounts and
serial correlation within accounts.
3.2.2 Results
We begin by briefly noting some of results for the macroeconomic-demographic, credit
bureau, and loan performance variables. Not surprisingly, higher utilization is associated with
lower credit scores. Higher utilization is also associated with higher wealth, and higher total
balances on other forms of debt.
12 Unlike equation (1), we exclude the account limit and debt as independent variables, since they are closely related to the dependent variable.
15
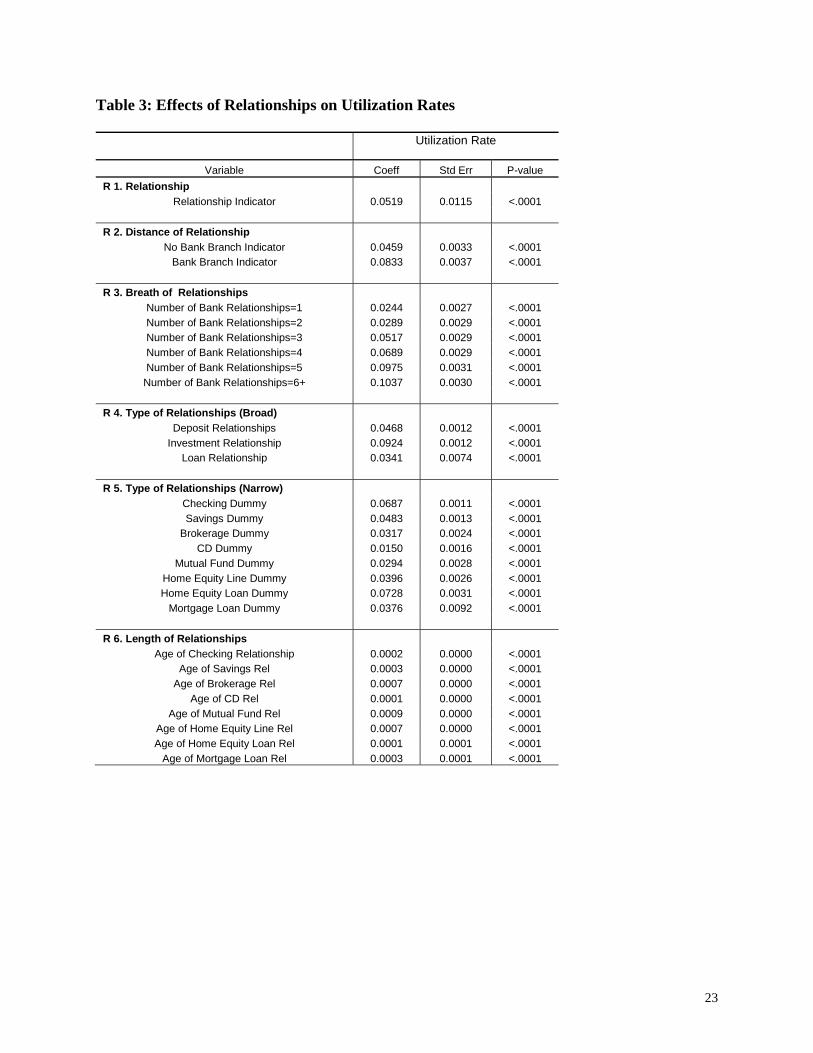
Table 3 reports the results for the relationship variables. Relationship measure R1 shows
that relationship accounts have significantly higher utilization rates, by 5 percentage points
(p.p.), which is a substantial amount. Using measure R2, utilization significantly increases with
the proximity of the relationship: While relationship accounts that are not near a branch exhibit a
larger utilization rate than non-relationship accounts, relationship accounts that are near a branch
exhibit almost twice the increase in utilization. Using R3, utilization significantly and
monotonically increases with the number of relationships. The utilization rate increases by 2 p.p.
for accounts with one other relationship, and 10 p.p. for accounts with at least six relationships.
Under measures R4 and R5, utilization increases with most types of relationship. Home equity
loans and checking accounts have the largest effects.
Measure R6 considers relationship age. The estimated effects are positive and significant
for all of the relationship types. Under R7, utilization -- and thus usage of the sample account --
is positively associated with relationship balances (given the other controls, such as total credit
bureau balances). Combining the various relationship measures in R8 leads to generally similar
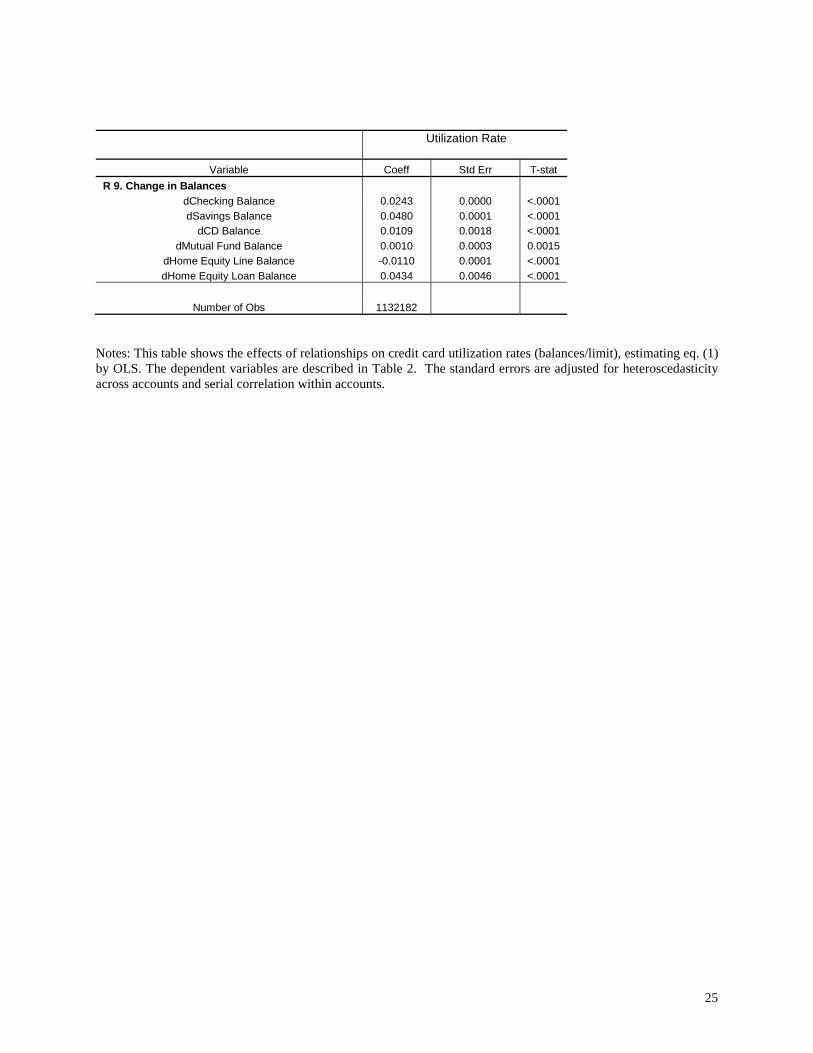
results as those above. Overall, relationship accounts tend to have greater utilization rates, ceteris
paribus. Incorporating the change in relationship balances in R9, most of the coefficients are
positive, so utilization tends to rise with increases in relationship balances. The exception is that
increases in home equity line balances have a negative coefficient, which is consistent with a
degree of substitutability between HELOC and credit card credit.
4. Conclusion
This study provided direct evidence of the benefits of relationship banking to retail banks.
The results indicate that, even controlling for other sources of bank information (both public and

16
private, within-account information, in particular as summarized by the credit scores) and other
variables, credit card account-holders with other relationships at the bank tend to have higher
utilization rates yet lower default and attrition rates. In particular, dynamic information about
changes in the behavior of an account-holder’s other relationships help predict and thus monitor
the behavior of the credit card account over time.
17
References
Agarwal, S., B. W. Ambrose, and C. Liu, 2004, “Credit lines and credit utilization,” Journal of Money, Credit and Banking (forthcoming). Avery, R. B., P. S. Calem, and G. B Canner, 2004, “Consumer credit scoring: Do situational circumstances matter?” Journal of Banking and Finance, forthcoming. Bennett, P., R. Peach, and S. Peristiani, 2001, “Structural change in the mortgage market and the propensity to refinance," Journal of Money, Credit, and Banking, 33(4), 955-975 Berger, A. N., L. F. Klapper, and G. F. Udell, 2001, “The ability of banks to lend to informationally opaque small businesses,” Journal of Banking and Finance, 25 (12), 2127-2167 Berger, A. N., and G. F. Udell, 1995, “Relationship lending and lines of credit in small firm finance,” Journal of Business 68(3), 351-381 Billet, M. T., and M. J. Flannery, and J. A. Garfinkel, 1995, “The effect of lender identity on a borrowing firm’s equity return,” Journal of Finance, 50(2), 699-718 Bolton, P., and D. S. Scharfstein, 1996, “Optimal debt structure and the number of creditors,” Journal of Political Economy, 104, 1-25 Boot, A., 2000, “Relationship banking: What do we know?” Journal of Financial Intermediation, 9, 7-25 Boot, A., and A. V. Thakor, 1994, “Moral hazard and secured lending in an infinitely repeated credit market game, International Economic Review, 35, 899-920 Chakravarty, S., and J. S. Scott, 1999, “Relationships and rationing in consumer loans,” Journal of Business, 72(4), 523-544 Cole, R. A., 1998, “The importance of relationships to the availability of credit,” Journal of Banking and Finance, 22, 959-977 Degryse, H., and P. V. Cayseele, 2000, “Relationship lending within a bank-based system: Evidence from European small business data,” Journal of Financial Intermediation 9, 90-109 Dewatripont, M., and E. Maskin, 1995, “Credit and efficiency in centralized and decentralized economies,” Review of Economic Studies, 62, 541-555 Gross, D., and N. S. Souleles, 2002, “An empirical analysis of personal bankruptcy and delinquency,” Review of Financial Studies 15(1), 319-347 Machauer, A., and M. Weber, 2000, “Number of bank relationships: An indicator of competition, borrower quality, or just size?” Working Paper, University of Mannheim.
18
Mester, L. J., L. I. Nakamura, and M. Renault, 2005, “Checking accounts and bank monitoring,” Working Paper, Federal Reserve Bank of Philadelphia. Moore, Mary, 1996, “Credit Scoring’s Uses Expand as It Gains Acceptance,” The American Banker, 4A. Ongena, S., and D. Smith, 2002, “Empirical evidence on the duration of banking relationships,” forthcoming, Journal of Financial Economics. Petersen, M. A., and R. G. Rajan, 1994, “The benefits of lending relationships: Evidence from small business data” Journal of Finance, 49(1), 3-37 Petersen, M. A., and R. G. Rajan, 2002, “Does distance still matter? The information revolution in small business lending,” forthcoming, Journal of Finance Rajan, R. G., 1992, “Insiders and outsiders: The choice between informed and arms length debt, Journal of Finance, 47, 1367-1400 Scott, J. A. and W. C. Dunkelberg, 1999, “Bank consolidation and small business lending: A small firm perspective,” in Business Access to Capital and Credit. Edited by J. L. Blanton, A. Williams, and S. L. W. Rhine, A Federal System Research Conference, 328-361 Sharpe, S., 1990, “Asymmetric information, bank lending and implicit contracts: A stylized model of customer relationships, Journal of Finance, 45, 1069-1366 Shovin, M. B., M. E. Sushka, J. A. Polocheck, 1993, “The value of bank durability: Borrowers as bank stakeholders, Journal of Finance, 48, 247-266 Wilson, P. F., 1993, “The pricing of loans in a bank-borrower relationship, Working Paper, Indiana University.

19
Table 1. Descriptive Statistics [To be added]
20
Table 2. Effects of Relationships on Default and Attrition
Default Attrition
Variable Coeff Std Err P-value Marg Eff Coeff Std Err P-value
Marg Eff
R 1. Relationship
Relationship Indicator -0.3193 0.0914 0.0005 12.8% -0.9054 0.0786 <.0001 10.7%
R 2. Proximity of Relationship
No Bank Branch Indicator -0.4299 0.3806 0.2586 12.8% -1.0706 0.1119 <.0001 10.7%
Bank Branch Indicator -0.0769 0.0230 <.0001 21.8% -0.9276 0.1187 <.0001 15.4%
R 3. Breath of Relationships
Number of Bank Relationships=1 -0.2812 0.0471 <.0001 8.5% -0.8817 0.0808 <.0001 7.6%
Number of Bank Relationships=2 -0.2444 0.0507 <.0001 10.3% -0.8914 0.0946 <.0001 9.0%
Number of Bank Relationships=3 -0.4591 0.1506 0.0003 16.7% -0.9040 0.0942 <.0001 15.5%
Number of Bank Relationships=4 -0.3298 0.1485 0.0082 24.9% -0.9662 0.1017 <.0001 16.2%
Number of Bank Relationships=5 -0.7390 0.3569 0.0393 30.6% -1.0153 0.1190 <.0001 23.8%
Number of Bank Relationships=6+ -0.7121 0.3281 0.0277 36.2% -0.9862 0.1128 <.0001 27.0%
R 4. Type of Relationships (Broad)
Deposit Relationship -0.3744 0.1106 <.0001 14.6% -0.1130 0.0489 0.0208 10.7%
Investment Relationship -0.5361 0.1348 <.0001 24.5% -0.3429 0.0556 <.0001 29.0%
Loan Relationship -0.0414 0.0182 0.0148 10.7% -0.3230 0.1454 0.0193 18.7%
R 5. Type of Relationships (Narrow)
Checking Dummy -0.3196 0.0783 <.0001 13.4% -0.1894 0.0402 <.0001 12.3%
Savings Dummy -0.3490 0.1178 <.0001 12.0% -0.1749 0.0554 0.0016 16.0%
Brokerage Dummy -0.7869 0.2561 <.0001 34.5% -0.6870 0.0923 <.0001 49.7%
CD Dummy -1.0219 0.3245 <.0001 43.3% -0.3088 0.0870 0.0004 26.6%
Mutual Fund Dummy -0.1090 0.0418 <.0001 8.5% -0.1286 0.0708 0.0672 6.1%
Home Equity Line Dummy -0.0164 0.0061 <.0001 15.1% -0.2991 0.1045 0.0042 25.9%
Home Equity Loan Dummy -0.0202 0.0053 <.0001 7.8% -0.2251 0.0867 0.0095 20.2%
Mortgage Loan Dummy -0.0548 0.0138 <.0001 9.7% -0.2490 0.1545 0.0315 13.3%
R 6. Length of Relationships
Age of Checking Relationship -0.0013 0.0002 <.0001 1.1% -0.0005 0.0002 0.0221 0.1%
Age of Savings Rel -0.0087 0.0005 <.0001 1.9% -0.0007 0.0003 0.0002 0.1%
Age of Brokerage Rel -0.0149 0.0012 <.0001 1.5% -0.0091 0.0019 <.0001 0.9%
Age of CD Rel -0.0281 0.0073 <.0001 1.3% -0.0013 0.0002 <.0001 0.1%
Age of Mutual Fund Rel -0.0237 0.0017 <.0001 1.4% -0.0011 0.0002 <.0001 0.1%
Age of Home Equity Line Rel -0.0013 0.0009 <.0001 0.3% -0.0015 0.0001 <.0001 0.1%
Age of Home Equity Loan Rel -0.0021 0.0009 <.0001 0.5% -0.0018 0.0003 <.0001 0.2%
Age of Mortgage Loan Rel -0.0076 0.0024 <.0001 1.1% -0.0028 0.0010 <.0001 0.1%
21
Default Attrition
Variable Coeff Std Err P-value Marg Eff Coeff Std Err P-value Marg Eff
R 7. Depth of Relationships
Checking Balance -0.0759 0.0152 <.0001 17.3% -0.0268 0.0116 0.0213 12.6%
Savings Balance -0.0831 0.0219 0.0001 18.0% -0.0452 0.0155 0.0023 7.2%
CD Balance -0.0096 0.0520 0.8543 9.0% -0.0740 0.0196 0.0002 7.4%
Mutual Fund Balance -0.1894 0.0548 0.0005 17.3% -0.0596 0.0294 0.0429 5.8%
Home Equity Line Balance -0.1330 0.0362 0.0002 13.8% -0.0223 0.0224 0.3201 2.2%
Home Equity Loan Balance -0.0236 0.0507 0.6416 2.3% -0.0816 0.0555 0.1417 3.8%
Mortgage Loan Balance -0.2432 0.4406 0.5810 1.6% -0.1962 0.2845 0.4904 4.9%
R 8. Combined Relationship Measures
Number of Bank Relationships=1 -0.3615 0.1075 0.0008 5.3% -0.8651 0.0895 <.0001 7.9%
Number of Bank Relationships=2 -0.3105 0.1142 0.0066 8.7% -0.8852 0.0993 <.0001 8.7%
Number of Bank Relationships=3 -0.3443 0.1178 0.0035 9.1% -0.8951 0.0977 <.0001 9.1%
Number of Bank Relationships=4 -0.3514 0.1289 0.0064 11.6% -0.9493 0.1061 <.0001 11.3%
Number of Bank Relationships=5 -0.8047 0.1802 <.0001 12.3% -0.9956 0.1232 <.0001 13.1%
Number of Bank Relationships=6+ -0.8167 0.1868 <.0001 17.8% -0.9645 0.1169 <.0001 11.9%
Checking Dummy -0.6553 0.1187 <.0001 7.4% -0.2490 0.0886 0.0049 5.7%
Savings Dummy -0.4133 0.1548 0.0076 8.8% -0.1109 0.0370 0.0032 8.3%
Brokerage Dummy -0.1219 0.1803 0.4991 7.0% -0.1766 0.0324 0.0091 16.2%
CD Dummy -0.9146 0.3622 0.0116 19.9% -0.3529 0.1692 0.0122 4.6%
Mutual Fund Dummy -1.0052 0.5241 0.0551 16.8% -0.5648 0.2544 0.0264 4.1%
Home Equity Line Dummy -1.5010 0.4648 0.0012 7.7% -0.1866 0.2392 0.4352 5.5%
Home Equity Loan Dummy -0.7813 0.5378 0.1463 1.6% -0.3774 0.5391 0.4839 0.2%
Mortgage Loan Dummy -0.5928 0.5440 0.5992 3.0% -0.5337 0.5840 0.2059 6.9%
Age of Checking Relationship -0.0009 0.0005 0.0644 0.8% -0.0005 0.0003 0.0833 0.3%
Age of Savings Rel -0.0028 0.0008 0.0002 0.9% -0.0010 0.0004 0.0022 0.2%
Age of Brokerage Rel -0.0220 0.0024 <.0001 0.2% -0.0023 0.0004 <.0001 0.2%
Age of CD Rel -0.0040 0.0025 0.1078 0.6% -0.0074 0.0012 <.0001 0.1%
Age of Mutual Fund Rel -0.0034 0.0075 0.6556 0.3% -0.0028 0.0048 0.5530 0.3%
Age of Home Equity Line Rel -0.0003 0.0017 0.8681 0.8% -0.0078 0.0015 <.0001 0.1%
Age of Home Equity Loan Rel -0.0106 0.0048 0.0275 1.1% -0.0031 0.0041 0.4406 0.1%
Age of Mortgage Loan Rel -0.0086 0.0149 0.5619 0.9% -0.0085 0.0025 <.0001 0.1%
Checking Balance -0.0754 0.0155 <.0001 8.3% -0.0295 0.0118 0.0126 6.9%
Savings Balance -0.0818 0.0218 0.0002 7.9% -0.0299 0.0105 0.0005 7.3%
CD Balance -0.0074 0.0534 0.8904 0.7% -0.0279 0.0202 0.1663 2.8%
Mutual Fund Balance -0.1845 0.0541 0.0007 16.8% -0.0605 0.0288 0.0355 9.9%
Home Equity Line Balance -0.1428 0.0403 0.0004 4.7% -0.0222 0.0232 0.3384 2.2%
Home Equity Loan Balance -0.0428 0.0565 0.4489 4.2% -0.0504 0.0579 0.3841 4.9%
Mortgage Loan Balance -0.6161 1.0336 0.5512 2.6% -0.4185 0.2806 0.1358 1.6%
22
Default Attrition
Variable Coeff Std Err P-value Marg Eff Coeff Std Err P-value Marg Eff
R 9. Change in Balances
dChecking Balance -0.0422 0.0040 <.0001 8.4% -0.0107 0.0009 <.0001 7.1%
dSavings Balance -0.0292 0.0013 <.0001 10.1% -0.0229 0.0008 <.0001 5.5%
dCD Balance -0.0585 0.0738 0.6372 0.4% -0.1889 0.0875 0.0308 10.6%
dMutual Fund Balance -0.0670 0.0020 <.0001 7.8% -0.0731 0.0016 <.0001 3.0%
dHome Equity Line Balance -0.0052 0.0015 0.0006 11.0% -0.0038 0.0014 0.0086 3.6%
dHome Equity Loan Balance -0.0181 0.1373 0.8954 1.8% -0.2367 0.1171 0.0432 7.7%
Number of Obs / Default or Attrition 1132182 4322 1132182 12649
Notes: This table reports the results from Cox models of credit card default (bankruptcy or three cycles delinquency) and attrition, as a function of the explanatory variables in eq. (1): macro-demographic, loan-performance, credit-bureau, and relationship variables. The table reports the results for the relationship variables. Relationship measure R1 estimates the impact of having any other relationship. R2 estimates the impact of relationship proximity (being near a bank branch). R3 estimates the impact of the number of relationships. R4 and R5 estimate the impact of the relationship type, both broadly and narrowly defined. R6 estimates the impact of relationship length (age in months). R7 estimates the impact of relationship depth (ln(balances + $1), in current $), including the indicators from R5. R8 estimates the impact of relationship breath, type, depth, and length together. R9 estimates the effects of changes in balances, including the level of balances from R7 and the indicators from R5. The standard errors are adjusted for heteroscedasticity across accounts and serial correlation within accounts.
23
Table 3: Effects of Relationships on Utilization Rates
Utilization Rate
Variable Coeff Std Err P-value
R 1. Relationship
Relationship Indicator 0.0519 0.0115 <.0001
R 2. Distance of Relationship
No Bank Branch Indicator 0.0459 0.0033 <.0001 Bank Branch Indicator 0.0833 0.0037 <.0001
R 3. Breath of Relationships
Number of Bank Relationships=1 0.0244 0.0027 <.0001
Number of Bank Relationships=2 0.0289 0.0029 <.0001 Number of Bank Relationships=3 0.0517 0.0029 <.0001
Number of Bank Relationships=4 0.0689 0.0029 <.0001
Number of Bank Relationships=5 0.0975 0.0031 <.0001
Number of Bank Relationships=6+ 0.1037 0.0030 <.0001
R 4. Type of Relationships (Broad)
Deposit Relationships 0.0468 0.0012 <.0001
Investment Relationship 0.0924 0.0012 <.0001 Loan Relationship 0.0341 0.0074 <.0001
R 5. Type of Relationships (Narrow)
Checking Dummy 0.0687 0.0011 <.0001
Savings Dummy 0.0483 0.0013 <.0001 Brokerage Dummy 0.0317 0.0024 <.0001
CD Dummy 0.0150 0.0016 <.0001
Mutual Fund Dummy 0.0294 0.0028 <.0001
Home Equity Line Dummy 0.0396 0.0026 <.0001 Home Equity Loan Dummy 0.0728 0.0031 <.0001
Mortgage Loan Dummy 0.0376 0.0092 <.0001
R 6. Length of Relationships
Age of Checking Relationship 0.0002 0.0000 <.0001 Age of Savings Rel 0.0003 0.0000 <.0001
Age of Brokerage Rel 0.0007 0.0000 <.0001
Age of CD Rel 0.0001 0.0000 <.0001
Age of Mutual Fund Rel 0.0009 0.0000 <.0001 Age of Home Equity Line Rel 0.0007 0.0000 <.0001
Age of Home Equity Loan Rel 0.0001 0.0001 <.0001
Age of Mortgage Loan Rel 0.0003 0.0001 <.0001

24
Utilization Rate
Variable Coeff Std Err T-stat
R 7. Depth of Relationships Checking Balance 0.03470 0.00038 <.0001
Savings Balance 0.08060 0.00051 <.0001
CD Balance 0.02290 0.00053 <.0001
Mutual Fund Balance 0.02290 0.00074 <.0001 Home Equity Line Balance 0.05890 0.00068 <.0001
Home Equity Loan Balance 0.01426 0.00223 <.0001
Mortgage Loan Balance 0.06480 0.00817 <.0001
R 8. Combined Relationship Measures
Number of Bank Relationships=1 0.0268 0.0036 <.0001
Number of Bank Relationships=2 0.0298 0.0037 <.0001 Number of Bank Relationships=3 0.0213 0.0037 <.0001
Number of Bank Relationships=4 0.0177 0.0039 <.0001
Number of Bank Relationships=5 0.0164 0.0041 <.0001
Number of Bank Relationships=6+ 0.0114 0.0040 0.0041 Checking Dummy 0.0239 0.0031 <.0001
Savings Dummy 0.0498 0.0044 <.0001
Brokerage Dummy -0.0125 0.0038 0.0010
CD Dummy 0.0119 0.0048 0.0131 Mutual Fund Dummy 0.0150 0.0086 <.0001
Home Equity Line Dummy 0.0652 0.0079 <.0001
Home Equity Loan Dummy 0.0263 0.0022 <.0001
Mortgage Loan Dummy -0.0187 0.0014 <.0001 Age of Checking Relationship 0.0000 0.0000 0.3351
Age of Savings Rel 0.0000 0.0000 0.9349
Age of Brokerage Rel 0.0001 0.0000 0.0937
Age of CD Rel 0.0001 0.0000 0.0010 Age of Mutual Fund Rel 0.0001 0.0001 0.6351
Age of Home Equity Line Rel 0.0002 0.0001 <.0001
Age of Home Equity Loan Rel 0.0010 0.0001 <.0001
Age of Mortgage Loan Rel 0.0003 0.0002 0.1653 Checking Balance 0.0350 0.0004 <.0001
Savings Balance 0.0179 0.0005 <.0001
CD Balance 0.0023 0.0005 <.0001
Mutual Fund Balance 0.0020 0.0007 0.0074 Home Equity Line Balance 0.0072 0.0007 <.0001
Home Equity Loan Balance 0.0167 0.0023 <.0001
Mortgage Loan Balance 0.0138 0.0113 0.2203
25
Utilization Rate
Variable Coeff Std Err T-stat
R 9. Change in Balances
dChecking Balance 0.0243 0.0000 <.0001
dSavings Balance 0.0480 0.0001 <.0001 dCD Balance 0.0109 0.0018 <.0001
dMutual Fund Balance 0.0010 0.0003 0.0015
dHome Equity Line Balance -0.0110 0.0001 <.0001
dHome Equity Loan Balance 0.0434 0.0046 <.0001
Number of Obs 1132182
Notes: This table shows the effects of relationships on credit card utilization rates (balances/limit), estimating eq. (1) by OLS. The dependent variables are described in Table 2. The standard errors are adjusted for heteroscedasticity across accounts and serial correlation within accounts.

26
Figure 1a Survival Curves for Number of Relationships (Default)
0.93
0.94
0.95
0.96
0.97
0.98
0.99
1.00
0 8 11 14 17 20 23 26 29 32 35 38 41 44 47
Age
Su
rviv
al R
ate
One Rel Two Rel Three Rel
Four Rel Five Rel Six Rel
Figure 1b Survival Curves for Number of Relationships (Attrition)
0.800.820.840.860.880.900.920.940.960.981.00
0 8 11 14 17 20 23 26 29 32 35 38 41 44 47
Age
Su
rviv
al R
ate
One Rel Two Rel Three RelFour Rel Five Rel Six Rel