Embed Size (px)
Citation preview
IntroductIonUltrahigh-performance chromatographic separations are increasingly accepted as a key approach to getting more analytic information in less time, even for complex sample mixtures. However, there are some challenges; not only is the chromatography system required to handle higher pressures (600 bar or more), the detection systems must keep pace with the increasing speed of the analysis. Whereas UV detectors can generally cope with this, fluorescence detectors are more difficult to optimize. This is especially true with regards to wavelength switching; this technique is used to achieve maximum sensitivity with fluorescence detection by switching the excitation and emission wavelengths to best match the spectral properties of the separated analytes. In practice, it implies a certain delay during data acquisition due to the mechanical inertia of the equipment.
Benefits of High-Speed Wavelength Switching in UHPLC Methods Using Fluorescence Detection
Markus Martin, Holger Franz, Frank Steiner, and Fraser McLeod Dionex Corporation, Germering, Germany
Now so
ld un
der th
e
Therm
o Scie
ntific
bran
d
As a consequence, marginally resolved and narrow analyte bands with different wavelength setting requirements could not be detected by fluorescence in the past. The total switching time was a summation of both wavelength switching times and the delay caused by the detector response time. To overcome these limitations and provide ultrafast separations in combination with fluorescence detection, a new generation of detectors encompassing simultaneous, ultrafast switching of the optics and fluidics was required with the following criteria:
• Highdatacollectionratesandsmallvolumeflowcells• Ultrahighsensitivity(fluorescencedetectionistypicallyusedfor
trace analysis)• Ultrafastchangingoftheexcitationandemissionwavelengthsto
account for correct integration, even with barely baseline-resolved peak groups
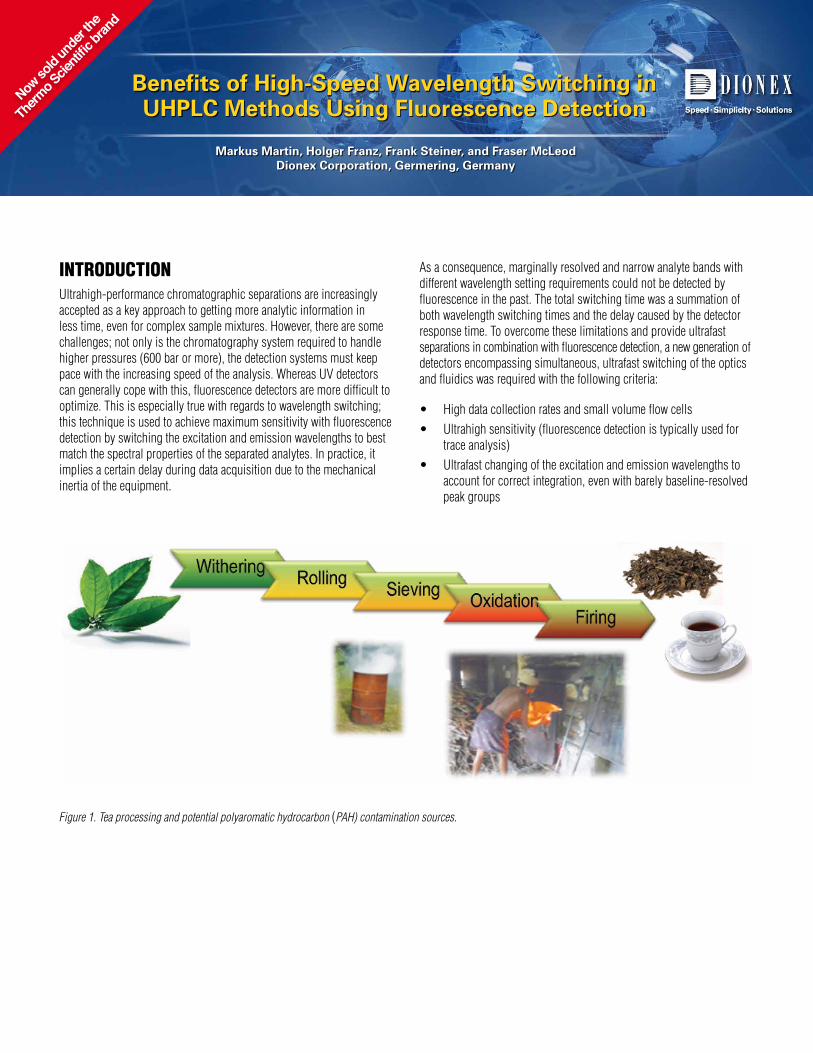
Figure 1. Tea processing and potential polyaromatic hydrocarbon (PAH) contamination sources.
2 Benefits of High-Speed Wavelength Switching in UHPLC Methods Using Fluorescence Detection
A challenging field of application is the determination of polyaromatic hydrocarbon (PAH) contamination in foodstuffs, e.g., tea samples. After water, tea is the most widely consumed beverage in the world. While tea has the reputation of being healthy due to many pharmaceutically active ingredients and antioxidants, tea leaves also act as a perfect enrichment matrix for environmental pollutants. In particular, PAHs are a critical class of contaminants requiring careful and sensitive monitoring. Green, black, and oolong tea are all processed using a multistep procedure (Figure 1) that exposes them to manifold sources for PAHs. Using the high-performance Thermo Scientific Dionex FLD-3100/3400RS Fluorescence Detector for UHPLC determination of PAHs in different tea samples achieves run times of less than 6 min, thus ensuring high sample throughput.
ultrafast Wavelength sWItchIngTo illustrate the high-speed switching capabilities of the Dionex FLD-3100/3400RS detectors, a simple five-component sample consisting of uracil, naphthalene, biphenyl, anthracene, and fluoranthene was separated using a 3 × 75 mm, 3 µm column (see Table 1 for gradient and detection parameter switching).
SystemThermo Scientific Dionex UltiMate® 3000 Quaternary Analytical LC System consisting of the following modules:
SR-3000 Solvent Rack
LPG-3400RS Quaternary Rapid Separation (RS) Pump
WPS-3000RS RS Well Plate Sampler
TCC-3000RS Thermostatted Column Compartment
FLD-3400RS Fluorescence Detector
Third-party FLD with analytical flow cell
All modules are connected with 0.005 in. (0.13 mm) i.d. Thermo Scientific Dionex Viper™ fingertight fittings.
LC ConditionsEluent A: WaterEluent B: AcetonitrileColumn: Thermo Scientific Dionex Acclaim® 120 C18, 3 × 75 mm, 3 µmFlow: 1.1 mL/minInj. Volume: 1 µLColumn Temp.: 40 °CData Collection Rate: 100 HzResponse Time: 0.02 sLamp Mode: High powerPhotomultiplier Tube: 1 (FLD-3400RS), third-party detector with only one PMT installedAnalyte Concentrations: 8–114 pg/µL in water/methanol/acetonitrile 1/1/2 (v/v/v)
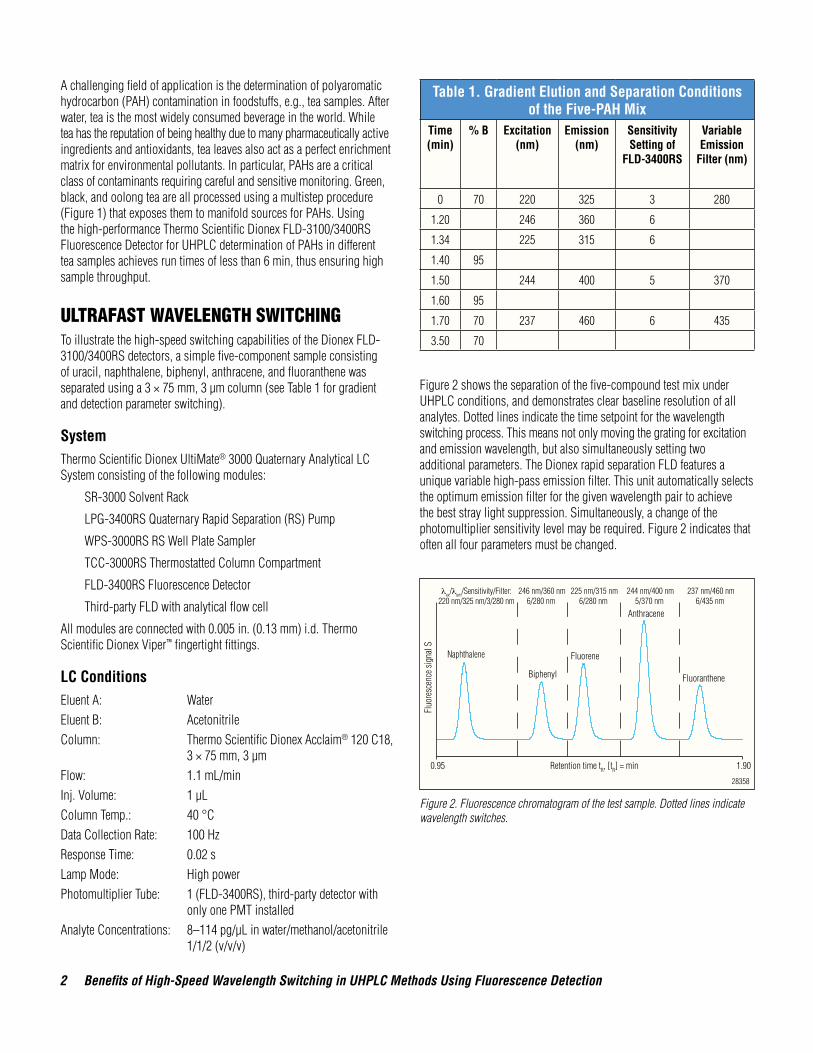
Figure 2 shows the separation of the five-compound test mix under UHPLC conditions, and demonstrates clear baseline resolution of all analytes. Dotted lines indicate the time setpoint for the wavelength switching process. This means not only moving the grating for excitation and emission wavelength, but also simultaneously setting two additional parameters. The Dionex rapid separation FLD features a unique variable high-pass emission filter. This unit automatically selects the optimum emission filter for the given wavelength pair to achieve the best stray light suppression. Simultaneously, a change of the photomultiplier sensitivity level may be required. Figure 2 indicates that often all four parameters must be changed.
Table 1. Gradient Elution and Separation Conditions of the Five-PAH Mix
Time (min)
% B Excitation (nm)
Emission (nm)
Sensitivity Setting of
FLD-3400RS
Variable Emission
Filter (nm)
0 70 220 325 3 280
1.20 246 360 6
1.34 225 315 6
1.40 95
1.50 244 400 5 370
1.60 95
1.70 70 237 460 6 435
3.50 70
Figure 2. Fluorescence chromatogram of the test sample. Dotted lines indicate wavelength switches.
28358
Fluo
resc
ence
sign
al S
Naphthalene
Biphenyl
Fluorene
Anthracene
Fluoranthene
0.95 1.90
246 nm/360 nm6/280 nm
225 nm/315 nm6/280 nm
244 nm/400 nm5/370 nm
237 nm/460 nm6/435 nm
Retention time tR, [tR] = min
λex/λem/Sensitivity/Filter:220 nm/325 nm/3/280 nm
3
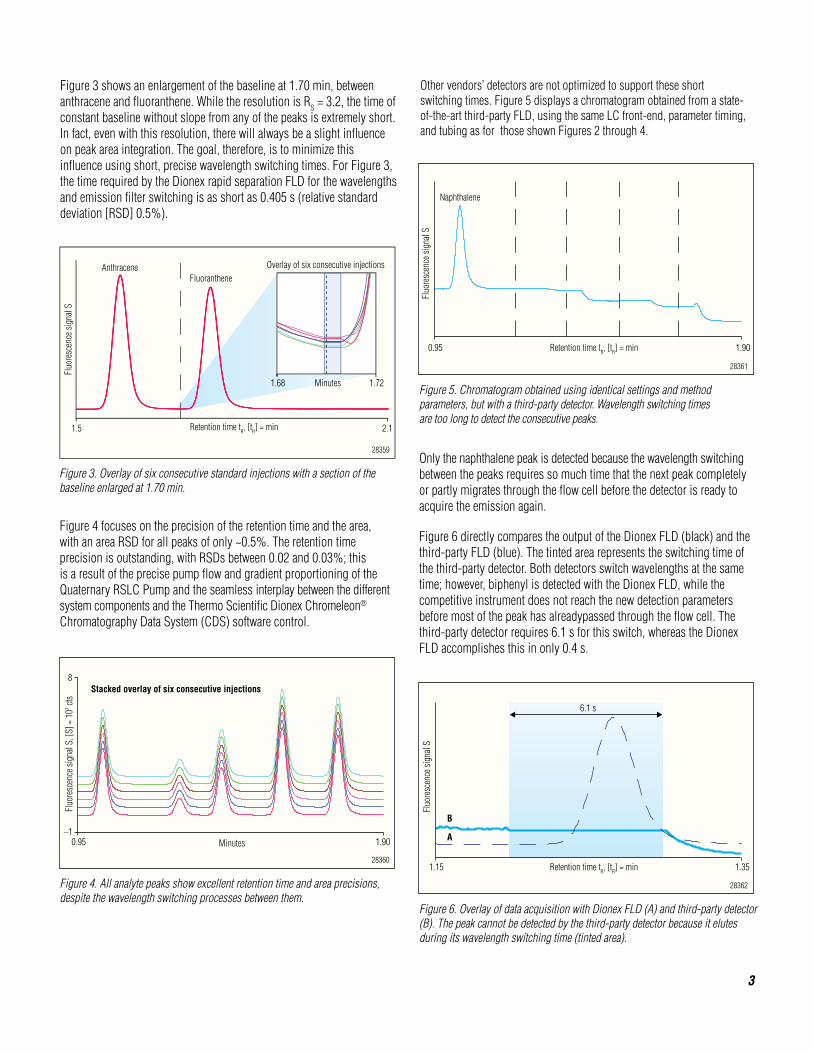
Figure 3 shows an enlargement of the baseline at 1.70 min, between anthracene and fluoranthene. While the resolution is RS = 3.2, the time of constant baseline without slope from any of the peaks is extremely short. In fact, even with this resolution, there will always be a slight influence on peak area integration. The goal, therefore, is to minimize this influence using short, precise wavelength switching times. For Figure 3, the time required by the Dionex rapid separation FLD for the wavelengths and emission filter switching is as short as 0.405 s (relative standard deviation [RSD] 0.5%).
Figure 4 focuses on the precision of the retention time and the area, with an area RSD for all peaks of only ~0.5%. The retention time precision is outstanding, with RSDs between 0.02 and 0.03%; this is a result of the precise pump flow and gradient proportioning of the Quaternary RSLC Pump and the seamless interplay between the different system components and the Thermo Scientific Dionex Chromeleon® Chromatography Data System (CDS) software control.
Other vendors’ detectors are not optimized to support these short switching times. Figure 5 displays a chromatogram obtained from a state-of-the-art third-party FLD, using the same LC front-end, parameter timing, and tubing as for those shown Figures 2 through 4.
Figure 3. Overlay of six consecutive standard injections with a section of the baseline enlarged at 1.70 min.
Figure 4. All analyte peaks show excellent retention time and area precisions, despite the wavelength switching processes between them.
Figure 5. Chromatogram obtained using identical settings and method parameters, but with a third-party detector. Wavelength switching times are too long to detect the consecutive peaks.
Only the naphthalene peak is detected because the wavelength switching between the peaks requires so much time that the next peak completely or partly migrates through the flow cell before the detector is ready to acquire the emission again.
Figure 6 directly compares the output of the Dionex FLD (black) and the third-party FLD (blue). The tinted area represents the switching time of the third-party detector. Both detectors switch wavelengths at the same time; however, biphenyl is detected with the Dionex FLD, while the competitive instrument does not reach the new detection parameters before most of the peak has alreadypassed through the flow cell. The third-party detector requires 6.1 s for this switch, whereas the Dionex FLD accomplishes this in only 0.4 s.
Figure 6. Overlay of data acquisition with Dionex FLD (A) and third-party detector (B). The peak cannot be detected by the third-party detector because it elutes during its wavelength switching time (tinted area).
28359
1.68 1.72
1.5 2.1
AnthraceneFluoranthene
Fluo
resc
ence
sign
al S
Overlay of six consecutive injections
Retention time tR, [tR] = min
Minutes
28360
0.95 1.90–1
8Stacked overlay of six consecutive injections
Fluo
resc
ence
sign
al S,
[S] =
107 ct
s
Minutes
28361
0.95 1.90
Naphthalene
Fluo
resc
ence
sign
al S
Retention time tR, [tR] = min
28362
Fluo
resc
ence
sign
al S
6.1 s
1.15 1.35Retention time tR, [tR] = min
B
A
4 Benefits of High-Speed Wavelength Switching in UHPLC Methods Using Fluorescence Detection
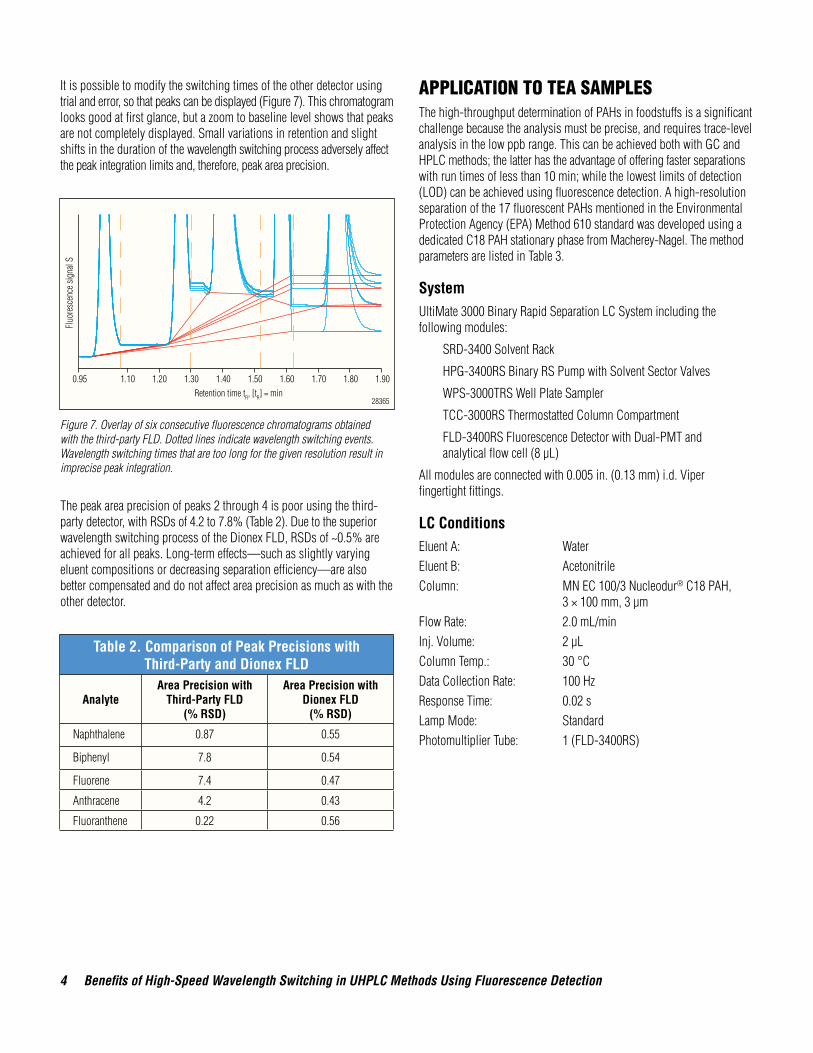
It is possible to modify the switching times of the other detector using trial and error, so that peaks can be displayed (Figure 7). This chromatogram looks good at first glance, but a zoom to baseline level shows that peaks are not completely displayed. Small variations in retention and slight shifts in the duration of the wavelength switching process adversely affect the peak integration limits and, therefore, peak area precision.
Figure 7. Overlay of six consecutive fluorescence chromatograms obtained with the third-party FLD. Dotted lines indicate wavelength switching events. Wavelength switching times that are too long for the given resolution result in imprecise peak integration.
The peak area precision of peaks 2 through 4 is poor using the third-party detector, with RSDs of 4.2 to 7.8% (Table 2). Due to the superior wavelength switching process of the Dionex FLD, RSDs of ~0.5% are achieved for all peaks. Long-term effects—such as slightly varying eluent compositions or decreasing separation efficiency—are also better compensated and do not affect area precision as much as with the other detector.
Table 2. Comparison of Peak Precisions with Third-Party and Dionex FLD
AnalyteArea Precision with
Third-Party FLD (% RSD)
Area Precision with Dionex FLD
(% RSD)
Naphthalene 0.87 0.55
Biphenyl 7.8 0.54
Fluorene 7.4 0.47
Anthracene 4.2 0.43
Fluoranthene 0.22 0.56
applIcatIon to tea samplesThe high-throughput determination of PAHs in foodstuffs is a significant challenge because the analysis must be precise, and requires trace-level analysis in the low ppb range. This can be achieved both with GC and HPLC methods; the latter has the advantage of offering faster separations with run times of less than 10 min; while the lowest limits of detection (LOD) can be achieved using fluorescence detection. A high-resolution separation of the 17 fluorescent PAHs mentioned in the Environmental Protection Agency (EPA) Method 610 standard was developed using a dedicated C18 PAH stationary phase from Macherey-Nagel. The method parameters are listed in Table 3.
SystemUltiMate 3000 Binary Rapid Separation LC System including the following modules:
SRD-3400 Solvent Rack
HPG-3400RS Binary RS Pump with Solvent Sector Valves
WPS-3000TRS Well Plate Sampler
TCC-3000RS Thermostatted Column Compartment
FLD-3400RS Fluorescence Detector with Dual-PMT and analytical flow cell (8 µL)
All modules are connected with 0.005 in. (0.13 mm) i.d. Viper fingertight fittings.
LC ConditionsEluent A: WaterEluent B: AcetonitrileColumn: MN EC 100/3 Nucleodur® C18 PAH, 3 × 100 mm, 3 µmFlow Rate: 2.0 mL/minInj. Volume: 2 µLColumn Temp.: 30 °CData Collection Rate: 100 HzResponse Time: 0.02 sLamp Mode: StandardPhotomultiplier Tube: 1 (FLD-3400RS)
28365
Fluo
resc
ence
sign
al S
0.95 1.10 1.20 1.30 1.40 1.50 1.60 1.70 1.80 1.90Retention time tR, [tR] = min
5
Table 3. Gradient Elution and Separation Conditions of the EPA Method 610 PAH Mix (17 Fluorescent PAHs)
Time (min) % B Excitation
(nm)Emission
(nm)Variable Emission
Filter (nm)
0 45 255 315 280
0.500 45
2.560 244 360 280
2.750 244 400 370
2.970 237 460 435
3.150 237 385 370
3.400 277 376 280
3.762 90
4.050 255 420 370
4.275 95
4.800 300 415 370
5.264 250 495 435
5.288 95
5.523 45
5.650 225 315 280
6.169 45 237 460 435
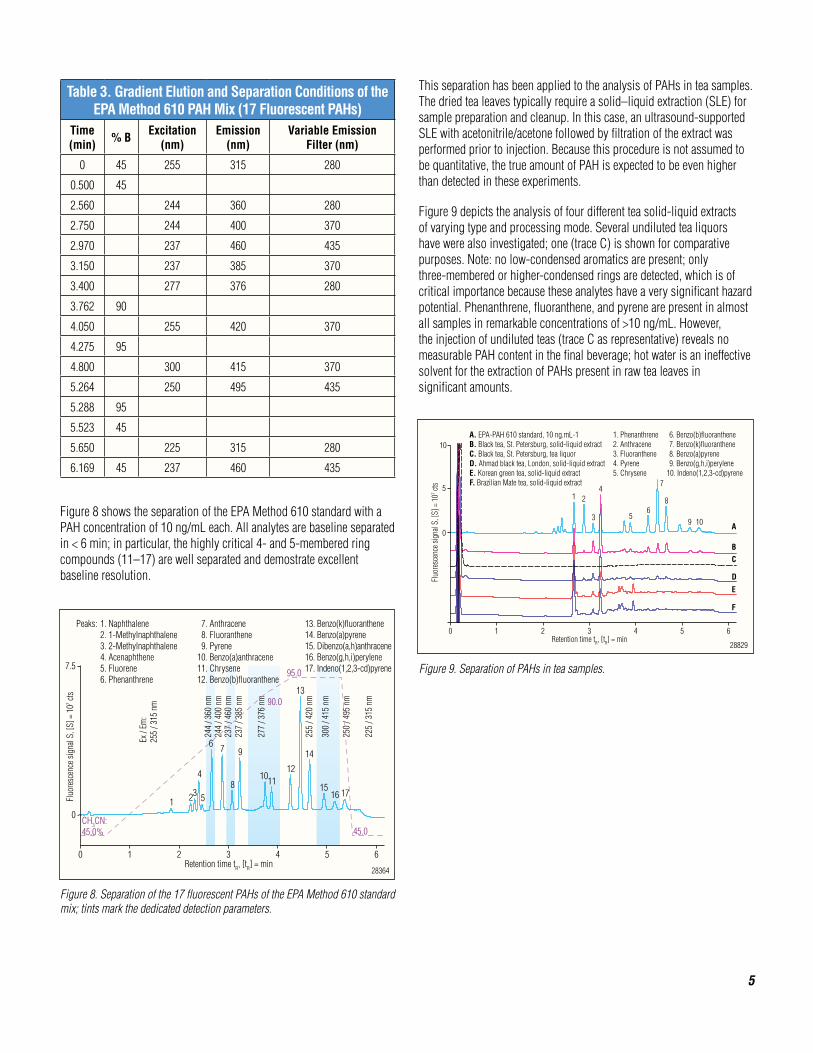
Figure 8 shows the separation of the EPA Method 610 standard with a PAH concentration of 10 ng/mL each. All analytes are baseline separated in < 6 min; in particular, the highly critical 4- and 5-membered ring compounds (11–17) are well separated and demostrate excellent baseline resolution.
Figure 8. Separation of the 17 fluorescent PAHs of the EPA Method 610 standard mix; tints mark the dedicated detection parameters.
This separation has been applied to the analysis of PAHs in tea samples. The dried tea leaves typically require a solid–liquid extraction (SLE) for sample preparation and cleanup. In this case, an ultrasound-supported SLE with acetonitrile/acetone followed by filtration of the extract was performed prior to injection. Because this procedure is not assumed to be quantitative, the true amount of PAH is expected to be even higher than detected in these experiments.
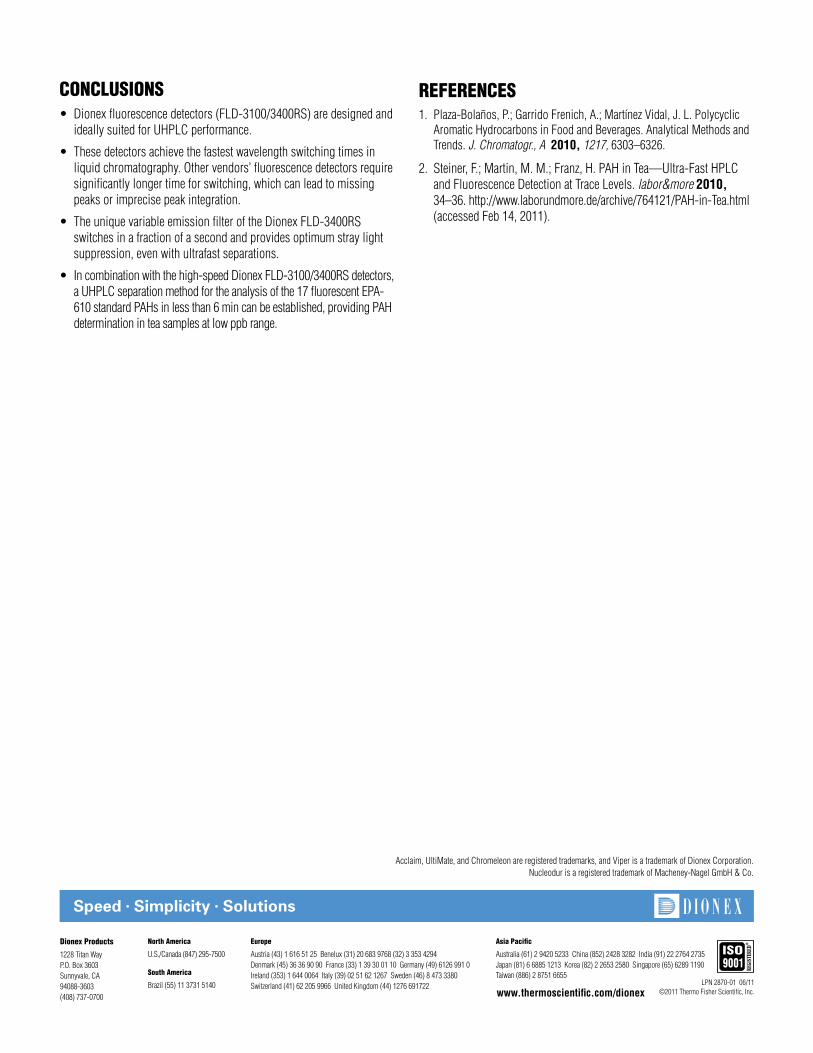
Figure 9 depicts the analysis of four different tea solid-liquid extracts of varying type and processing mode. Several undiluted tea liquors have were also investigated; one (trace C) is shown for comparative purposes. Note: no low-condensed aromatics are present; only three-membered or higher-condensed rings are detected, which is of critical importance because these analytes have a very significant hazard potential. Phenanthrene, fluoranthene, and pyrene are present in almost all samples in remarkable concentrations of >10 ng/mL. However, the injection of undiluted teas (trace C as representative) reveals no measurable PAH content in the final beverage; hot water is an ineffective solvent for the extraction of PAHs present in raw tea leaves in significant amounts.
Figure 9. Separation of PAHs in tea samples.
28364
0 1 2 3 4 5 6
244
/ 360
nm
244
/ 400
nm
237
/ 460
nm
237
/ 385
nm
277
/ 376
nm
255
/ 420
nm
300
/ 415
nm
250
/ 495
nm
CH3CN: 45.0%
90.0
95.0
45.0
0
7.5
2 3
4
5
6 7
8
9
10 11 12
13
14
15 16 17
1
Ex /
Em:
255
/ 315
nm
225
/ 315
nm
Fluo
resc
ence
sign
al S,
[S] =
107 ct
s
13. Benzo(k)fluoranthene14. Benzo(a)pyrene15. Dibenzo(a,h)anthracene16. Benzo(g,h,i)perylene17. Indeno(1,2,3-cd)pyrene
7. Anthracene 8. Fluoranthene 9. Pyrene 10. Benzo(a)anthracene 11. Chrysene 12. Benzo(b)fluoranthene
Retention time tR, [tR] = min
Peaks: 1. Naphthalene 2. 1-Methylnaphthalene 3. 2-Methylnaphthalene 4. Acenaphthene 5. Fluorene 6. Phenanthrene
28829
0 1 2 3 4 5 6
0
5
10
1 2
3
4
5 6
7
8
9 10
Retention time tR, [tR] = min
Fluo
resc
ence
sign
al S,
[S] =
107 ct
s
A
B
D
E
F
C
A. EPA-PAH 610 standard, 10 ng.mL-1B. Black tea, St. Petersburg, solid-liquid extractC. Black tea, St. Petersburg, tea liquorD. Ahmad black tea, London, solid-liquid extractE. Korean green tea, solid-liquid extractF. Brazilian Mate tea, solid-liquid extract
6. Benzo(b)fluoranthene 7. Benzo(k)fluoranthene 8. Benzo(a)pyrene 9. Benzo(g,h,i)perylene 10. Indeno(1,2,3-cd)pyrene
1. Phenanthrene2. Anthracene3. Fluoranthene4. Pyrene5. Chrysene
6 Benefits of High-Speed Wavelength Switching in UHPLC Methods Using Fluorescence Detection
north america
U.S./Canada (847) 295-7500 south america
Brazil (55) 11 3731 5140
europe
Austria (43) 1 616 51 25 Benelux (31) 20 683 9768 (32) 3 353 4294 Denmark (45) 36 36 90 90 France (33) 1 39 30 01 10 Germany (49) 6126 991 0 Ireland (353) 1 644 0064 Italy (39) 02 51 62 1267 Sweden (46) 8 473 3380 Switzerland (41) 62 205 9966 United Kingdom (44) 1276 691722
asia pacific
Australia (61) 2 9420 5233 China (852) 2428 3282 India (91) 22 2764 2735 Japan (81) 6 6885 1213 Korea (82) 2 2653 2580 Singapore (65) 6289 1190Taiwan (886) 2 8751 6655
dionex products
1228 Titan Way P.O. Box 3603 Sunnyvale, CA 94088-3603 (408) 737-0700 www.thermoscientific.com/dionex
LPN 2870-01 06/11©2011 Thermo Fisher Scientific, Inc.
Acclaim, UltiMate, and Chromeleon are registered trademarks, and Viper is a trademark of Dionex Corporation. Nucleodur is a registered trademark of Macheney-Nagel GmbH & Co.
Speed • Simplicity • Solutions
conclusIons• Dionexfluorescencedetectors(FLD-3100/3400RS)aredesignedand
ideally suited for UHPLC performance.
• Thesedetectorsachievethefastestwavelengthswitchingtimesinliquid chromatography. Other vendors’ fluorescence detectors require significantly longer time for switching, which can lead to missing peaks or imprecise peak integration.
• TheuniquevariableemissionfilteroftheDionexFLD-3400RSswitches in a fraction of a second and provides optimum stray light suppression, even with ultrafast separations.
• Incombinationwiththehigh-speedDionexFLD-3100/3400RSdetectors,a UHPLC separation method for the analysis of the 17 fluorescent EPA-610 standard PAHs in less than 6 min can be established, providing PAH determination in tea samples at low ppb range.
references1. Plaza-Bolaños, P.; Garrido Frenich, A.; Martínez Vidal, J. L. Polycyclic Aromatic Hydrocarbons in Food and Beverages. Analytical Methods and Trends. J. Chromatogr., A 2010, 1217, 6303–6326.
2. Steiner, F.; Martin, M. M.; Franz, H. PAH in Tea—Ultra-Fast HPLC and Fluorescence Detection at Trace Levels. labor&more 2010, 34–36. http://www.laborundmore.de/archive/764121/PAH-in-Tea.html (accessed Feb 14, 2011).