Embed Size (px)
Citation preview

www.TheCIE.com.au
Benefit–cost analysis:
National Heavy Vehicle Regulator (NHVR) model law
Prepared for
National Transport Commission
Centre for International Economics Canberra & Sydney
4 February 2011
The Centre for International Economics is a private economic research agency that
provides professional, independent and timely analysis of international and domestic
events and policies.
TheCIE’s professional staff arrange, undertake and publish commissioned economic
research and analysis for industry, corporations, governments, international agencies
and individuals.
© Centre for International Economics 2011
This work is copyright. Persons wishing to reproduce this material should contact
the Centre for International Economics at one of the following addresses.
Canberra
Centre for International Economics
Ground Floor, 11 Lancaster Place
Majura Park
Canberra ACT 2609
GPO Box 2203
Canberra ACT Australia 2601
Telephone +61 2 6245 7800
Facsimile +61 2 6245 7888
Email [email protected]
Website www.TheCIE.com.au
Sydney
Centre for International Economics
Suite 1, Level 16, 1 York Street
Sydney NSW 2000
GPO Box 397
Sydney NSW Australia 2001
Telephone +61 2 9250 0800
Facsimile +61 2 9250 0888
Email [email protected]
Website www.TheCIE.com.au
Disclaimer
While TheCIE endeavours to provide reliable analysis and believes the material it
presents is accurate, it will not be liable for any party acting on such information.

BENEFIT–COST ANALYSIS: NATIONAL HEAVY VEHICLE REGULATOR (NHVR) MODEL LAW 3
www.TheCIE.com.au
Contents
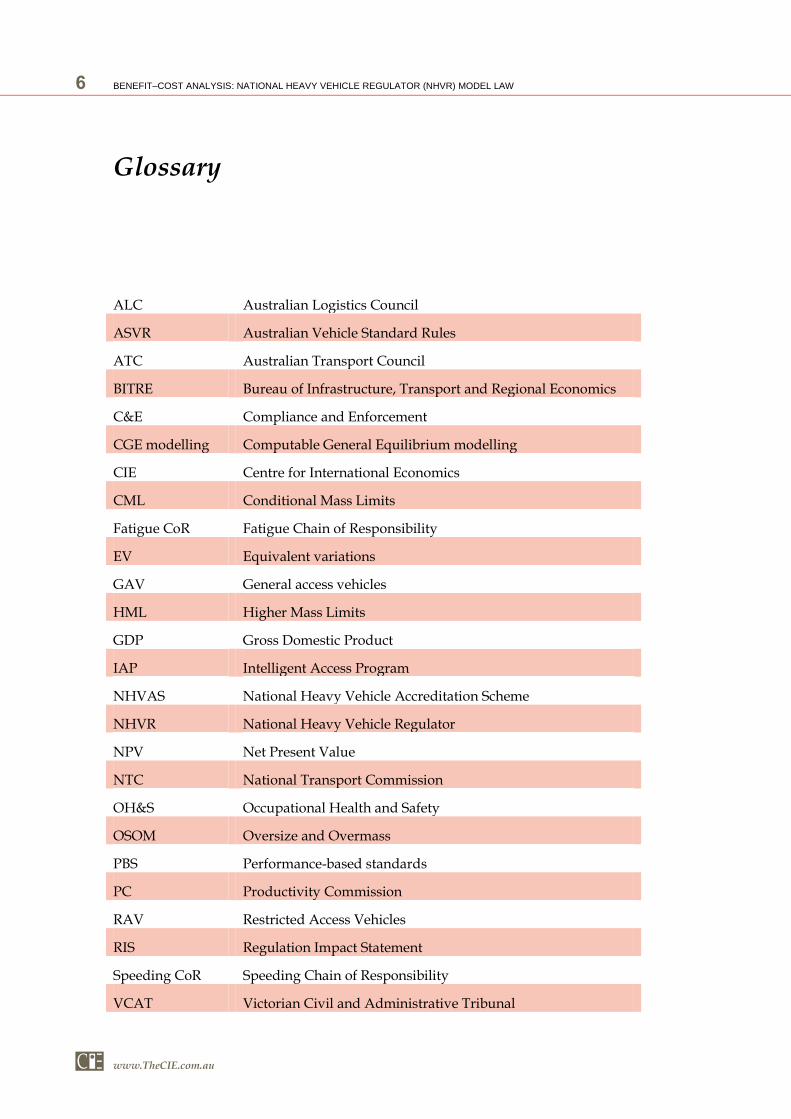
Glossary 6
1 Background 7
2 Nature and size of the problem 9
Productivity Commission Report: at least $12 billion of gains 9
Performance Based Standards RIS: $3.6 billion in gains 10
Compliance and Enforcement Gains: $1.7 billion improvement 10
Higher Mass Limits: $4.1 billion and only half achieved 10
Driver Fatigue: $2.2 billion in increased safety 11
Adding up the potential gains from a national approach to heavy vehicle law 11
3 Importance of 34 changes: top-down 13
Nature of economic impacts 13
An indication of the gains possible and areas of doubt 14
Costs of the Regulator 20
Summary 21
Areas for closer scrutiny: item requiring a mini-RIS 21
4 New decision making frameworks 23
The benefits of a new decision making framework 25
Approach to measuring benefits 26
The extent to which better access would improve productivity 26
Benefits from HML 36
Benefits from OSOM 37
Adding up the benefits 38
The costs of the new decision making framework 41
Benefit to cost ratios 44
Summary 44
5 Spray suppression devices 45
Impact of proposed regulatory change 45
Conclusion 48
6 Inspections 50
The cost of annual inspections 50
Benefits of annual inspections 51

4 BENEFIT–COST ANALYSIS: NATIONAL HEAVY VEHICLE REGULATOR (NHVR) MODEL LAW
www.TheCIE.com.au
Conclusion 52
7 Advanced Fatigue Management ‘outer limits’ 53
Impact of proposed regulatory changes 53
Conclusions 59
8 Unpaid fines 61
Impacts 61
Conclusions 62
9 Summing up 63
Top-down results 63
Bottom-up results 64
Key uncertainties and questions 65
References 66
APPENDIX 67
A GTAP modelling 69
The transport sector 69
Simulations 69
Results 69
B Assumptions 72
Chapters 2 and 3 72
Chapter 4 72
Chapter 5 73
Chapter 6 74
Chapter 7 74
Boxes, charts and tables
3.1 Areas of regulatory change and considerations under the RIS 13
3.2 Indicative net benefits of NHVR and 34 main reconciliations in 20 year NPV terms ($ billion) 15
3.3 Seventy per cent of benefits expected from 10 per cent of variations 16
3.4 Relative magnitude of net benefits by economic areas: indicative 17
3.5 Relative magnitude of net benefits by regulatory areas: indicative 17
4.1 Australian Trucking Association truck impact, June 2010 28
4.2 Examples of PBS vehicle substitution 29
4.3 Assumed PBS productivity increase: national fleet 30
4.4 Net benefits of the PBS scheme: net present value terms 32
4.5 Assumed RAV productivity increase: national fleet 33
4.6 Optimistic and pessimistic scenarios for RAV 35
4.7 Assumed HML productivity increase: national fleet 37

BENEFIT–COST ANALYSIS: NATIONAL HEAVY VEHICLE REGULATOR (NHVR) MODEL LAW 5
www.TheCIE.com.au
4.8 Assumed productivity increase for all areas: national fleet 38
4.9 Indicative relative gains: cumulative benefits in NPV terms over 20 years 39
4.10 Range of potential net benefits: annual present value in year 5 40
4.11 Range of potential net benefits: annual present value in year 10 40
4.12 Estimated administration costs 42
4.13 Benefit to cost comparison 44
5.1 Compliance costs associated with spray suppression devices 46
5.2 Cost of road crashes involving trucks, 2006 48
5.3 Summary of benefits (2011 to 2030) 49
6.1 Cost to the community of road crashes involving heavy vehicles, 2006 51
6.2 Average cost of road crashes per vehicle 51
7.1 Re-allocated driving hours due to fatigue management requirements 55
7.2 Potential cost savings from AFM 57
7.3 New fatigue system — approximate costs 57
7.4 Average cost of road crashes 58
7.5 Example of where the benefits of increasing AFM outer limits exceed the cost 59
A.1 Macroeconomic impacts, (per cent) 70
A.2 Percentage changes in sectoral output 70
6 BENEFIT–COST ANALYSIS: NATIONAL HEAVY VEHICLE REGULATOR (NHVR) MODEL LAW
www.TheCIE.com.au
Glossary
ALC Australian Logistics Council
ASVR Australian Vehicle Standard Rules
ATC Australian Transport Council
BITRE Bureau of Infrastructure, Transport and Regional Economics
C&E Compliance and Enforcement
CGE modelling Computable General Equilibrium modelling
CIE Centre for International Economics
CML Conditional Mass Limits
Fatigue CoR Fatigue Chain of Responsibility
EV Equivalent variations
GAV General access vehicles
HML Higher Mass Limits
GDP Gross Domestic Product
IAP Intelligent Access Program
NHVAS National Heavy Vehicle Accreditation Scheme
NHVR National Heavy Vehicle Regulator
NPV Net Present Value
NTC National Transport Commission
OH&S Occupational Health and Safety
OSOM Oversize and Overmass
PBS Performance-based standards
PC Productivity Commission
RAV Restricted Access Vehicles
RIS Regulation Impact Statement
Speeding CoR Speeding Chain of Responsibility
VCAT Victorian Civil and Administrative Tribunal

BENEFIT–COST ANALYSIS: NATIONAL HEAVY VEHICLE REGULATOR (NHVR) MODEL LAW 7
www.TheCIE.com.au
1 Background
The Australian Transport Council (ATC) has determined to create a National Heavy
Vehicle Regulator (NHVR) based on model laws developed over the last few years.
National Model laws are currently implemented to varying degrees by State and
Territory jurisdictions. The National Transport Commission (NTC) has undertaken a
stocktake of the jurisdictional-based variations and found there are around 368 areas
where laws require harmonisation to facilitate a national approach to heavy vehicle
regulation.
The variations to model law represent inconsistencies that cause fragmentation in the
regulation of heavy vehicles in Australia and they are thought to be holding back
economic gains originally targeted by the national approach to heavy vehicle
regulation. Most of the 368 divergences from the model laws are relatively minor
technical issues, but around 34 of these have been deemed to have potentially
medium or major economic impacts. As such they require investigation through a
Regulatory Impact Statement.
The purpose of this report is to conduct a benefit–cost analysis of reconciling these
divergences to a single, national approach. The approach used acknowledges the
difficulty of evaluating so many (368) changes by conducting both a ‘top-down’ and
‘bottom-up’ analysis. The top-down approach involves an attribution exercise. It
builds a framework to add up the benefits and costs of previous studies in a
consistent and economically meaningful way. This is appropriate as the impacts of
the model laws have already been assessed through previous Regulatory Impact
Statements (RIS).
Additional information is used to attribute net benefits to the 368 changes in total
and the 34 with the most potential for impact. Attribution is assisted by decomposing
impacts and considering six different types of net benefits that might be achieved
across 13 different areas of regulatory change. A matrix of net benefit by these
(6 x 13) elements is derived to illustrate the distribution of net benefits. This provides
an indication of which elements of change are most important as well as showing the
overall net benefits that might be expected from the 368 changes in total.
The ‘bottom-up’ exercise considers five (of the 34) changes in detail to help verify
aspects of the top-down exercise. It considers in detail the sorts of productivity
potential that might be achieved from several changes that make up an important
initiative relating to new decision making frameworks. This helps to illustrate the
nature of economic gains possible. Four other changes are considered to illustrate a

8 BENEFIT–COST ANALYSIS: NATIONAL HEAVY VEHICLE REGULATOR (NHVR) MODEL LAW
www.TheCIE.com.au
wider range of impacts that might occur. A computable general equilibrium (CGE)
model is used to estimate the economy-wide impacts of productivity changes
anticipated. Welfare measures of gross domestic product (GDP) and ‘equivalent
variation’ (EV)1 are estimated and various sensitivity tests are conducted.
The top-down exercise is contained in chapters 2 and 3. The bottom-up exercise is
conducted over several chapters, with one area of change considered in each chapter.
It should be noted that this cost benefit analysis is solely concerned with the impact
of the laws and not with the Regulator itself. However, the anticipated benefits of the
national regulator will not be realised unless it has nationally consistent laws to
administer. It should also be noted that any departure from the national law
instituted by the states and territories will erode the benefits articulated in this cost
benefit analysis.
1 Equivalent variation is the income that you need to take away from an individual to make him equivalently worse off or better off following a productivity change.
BENEFIT–COST ANALYSIS: NATIONAL HEAVY VEHICLE REGULATOR (NHVR) MODEL LAW 9
www.TheCIE.com.au
2 Nature and size of the problem
Previous studies have provided support for the case for a national approach to heavy
vehicle regulation, suggesting the net economic payoffs could be large.
Productivity Commission Report: at least $12 billion of gains
In 2006, the Productivity Commission argued that regulatory fragmentation across
Australian jurisdictions is a major factor impeding the uptake of productivity
improvements in trucking.
Finding 11.2 was that: To realise the benefits of a national road freight transport market,
it is important that road freight operators not be subjected to additional and unnecessary
compliance costs and burdens arising from regulatory variations across jurisdictions. All
remaining regulatory inconsistencies, overlaps or duplication between jurisdictions should
be identified and further efforts made to develop nationally consistent and coordinated
approaches (p.306).
Productivity gains of between 2 and 16 per cent might be possible from a full suite
of reforms (p.G26).
A 5 per cent productivity gain in road transport would be worth around 0.2 per
cent of GDP a year equal to around $2.6 billion a year (recent CIE estimates using
a similar methodology confirm this — see appendix A) or $35 billion in net
present value (NPV) terms over the next 20 years at a discount rate of 7 per cent.
The $35 billion is attributable to several areas of reform, including:
– replacing prescriptive regulations with performance-based regulations;
– reducing regulatory fragmentation and improving the appropriateness of
regulation; and
– improving existing road funding and investment decision making.
The regulatory changes covered by this benefit-cost study are aimed at reducing
regulatory fragmentation, although the proposed new framework for road access
decisions will also encourage greater uptake of PBS vehicles. If the benefits were
distributed evenly across each of the three areas of reform, reducing regulatory
fragmentation alone might deliver 33 per cent of the $35 billion gain (around $12
billion). This provides one indicator of the potential gains from a national approach
to heavy vehicle regulation. But this is likely to be a conservative estimate because
under a national regulator, reducing fragmentation is likely to open the way to

10 BENEFIT–COST ANALYSIS: NATIONAL HEAVY VEHICLE REGULATOR (NHVR) MODEL LAW
www.TheCIE.com.au
achieve other reforms such as those relating to prescriptive standards and
appropriateness of regulation. In time gains larger than $12 billion (NPV) might
plausibly be expected. It is also likely to be conservative because the $12 billion is in
2006 dollar terms and little or any of these gains have been taken up since the
Productivity Commission report.
Performance Based Standards RIS: $3.6 billion in gains
Earlier this year, NTC (2010) reported potentially large economic gains from
reforming standards regulating heavy vehicle road access from a prescriptive-based
regime to one based on performance (performance-based standards PBS). PBS is
designed to enable continuous productivity gains and technological improvements.
Such gains can be prevented by prescriptive-based standards which potentially lock
the industry in a regulatory straight jacket fashioned on earlier technologies. The
study (a consultation RIS):
found potential economic gains of $5.37 billion in NPV terms over the next 20
years2 from a properly implemented PBS; and
attributed $3.63 billion NPV of the gain (67 per cent) to the PBS being imple-
mented under an effective national assessment and access framework — this
would be equivalent to $500 million a year once fully taken up (see page 30 for
explanation of derivation of PBS gains).
Compliance and Enforcement Gains: $1.7 billion improvement
In 2009, Castalia (2009) in a submission for NatRoad to the regulation impact
statement on the heavy vehicle regulator reported potential economic gains in
reduced compliance and administrative costs of regulation of $1.7 billion in NPV
terms (over 20 years) from replacing the current fragmented regulatory system with
one national regulator. It attributed:
$1.3 billion to reductions in compliance costs to industry; and
$0.4 billion to reductions in administrative and enforcement costs to regulators.
In total, $1.7 billion in NPV benefits is equal to around $120 million a year.
Higher Mass Limits: $4.1 billion and only half achieved
In 1998, a NTC Regulatory Impact Statement on the impacts of increased mass limits
for road-friendly heavy vehicles estimated net economic benefits to Australia in NPV
2 The document reports gains with and without down-stream impacts. The $5.3 billion
includes down-stream benefits as reported in appendix A of the NTC report.

BENEFIT–COST ANALYSIS: NATIONAL HEAVY VEHICLE REGULATOR (NHVR) MODEL LAW 11
www.TheCIE.com.au
terms of $2.9 billion ($4.1 billion in 2010 dollar terms) under the best case scenario.
The gains were mainly from productivity gains in the freight task, while cost would
be incurred in improving bridges to carry heavier loads. The RIS suggested that
$75 million of new funding over 8–10 years would be required for upgrades to bridge
infrastructure.
However, a review by NTC in 2006 found that ten years after their development,
approximately half of the mass and loading provisions and only a third of the
oversize and overmass provisions devised to realise such gains had been
implemented in a consistent manner (Keatsdale Pty Ltd; Review of heavy vehicle
mass and loading, oversize and overmass and restricted access regulations, NTC,
May 2006).
The current fragmented regulatory system is preventing full realisation of such
economic gains.
Driver Fatigue: $2.2 billion in increased safety
In 2002, a NTC RIS on the impacts of improving heavy vehicle driver fatigue to base
regulation on a scientific understanding of the problem found potential net economic
benefits of $1.7 billion NPV ($2.2 billion in 2010 dollar terms), mainly due to reduced
costs of accidents. However, in 2009 the Department of Infrastructure, Transport,
Regional Development and Local Government (Regulation Impact Statement: A
National Framework for Regulation, Registration and Licensing of Heavy Vehicles)
found that the heavy vehicle fatigue laws designed to realise these gains were not
being consistently implemented across the various jurisdictions, and implying gains
were not being fully realised.
Adding up the potential gains from a national approach to heavy vehicle law
Only the Productivity Commission estimate can be interpreted as an indicator of the
potential overall net benefits of national heavy vehicle regulation. The other studies
provide estimates of various areas of improved regulation that could be achieved
under the body of national law. As such the Productivity Commission estimates
cannot be added to the findings of the other studies. Further, the proportion of gains
estimated in the other studies that is attributable to the creation of a national
regulator is only defined in the PBS RIS. Nonetheless, in that RIS 66 per cent of gain
is attributed to implementation under an effective assessment and national access
framework. Were this true for all estimates cited, adding the net benefits of each of
12 BENEFIT–COST ANALYSIS: NATIONAL HEAVY VEHICLE REGULATOR (NHVR) MODEL LAW
www.TheCIE.com.au
the component studies gives an estimate of $9.0 billion3 which is not that much less
than that inferred from the Productivity Commission estimates at around $12 billion.
Although there may be some double counting in adding the mass limits findings
to those of performance based standards, the component studies referred to do
not include all areas of regulatory improvement that might be achieved under a
national approach.
On this basis there may be a case to argue for net economic gains that would
exceed $12 billion in net present value terms over the next 20 years.
3 (5.37 + 1.7 + 4.1 + 2.2) x 5.37
3.63

BENEFIT–COST ANALYSIS: NATIONAL HEAVY VEHICLE REGULATOR (NHVR) MODEL LAW 13
www.TheCIE.com.au
3 Importance of 34 changes: top-down
The 368 divergences to the model law fall under 13 headings and main areas. The
divergences are set out in table 3.1 according to the area of regulatory change
(registration law etc). The total number of divergences (as well as those expected to
have medium or large economic impacts and requiring investigation in this RIS) are
also indicated in table 3.1.
3.1 Areas of regulatory change and considerations under the RIS
Areas of regulatory change Abbreviations
No. of regulatory
changes proposed
No. of regulatory
changes proposed with
medium/large impact
Count Count
Registration Law Registration Law 30 7
Australian Vehicle Standard Rules AVSR’s 24 1
Mass and Loading Mass & Loading 17 1
Restricted Access Vehicles RAV’s 22 2
Intelligent Access Program IAP 33 4
National Heavy Vehicle Accreditation Scheme NHVAS 12 2
Compliance and Enforcement C&E 72 6
Fatigue Chain of Responsibility Fatigue CoR 68 6
Speeding Chain of Responsibility Speeding CoR 16 0
Oversize and Overmass OSOM 43 3
Conditional Mass Limits CML 4 0
Higher Mass Limits HML 13 2
Other business Other business 12 0
Total 368 34
Source: TheCIE.
Nature of economic impacts
The economic impacts expected from returning the legal variations to a single,
national law include the following:
reductions in compliance costs to trucking operators;
reductions in administrative and enforcement costs to regulators;
reductions in road injuries and fatalities;
decreases in noise and carbon emissions; and
14 BENEFIT–COST ANALYSIS: NATIONAL HEAVY VEHICLE REGULATOR (NHVR) MODEL LAW
www.TheCIE.com.au
increases in productivity due to more consistent application of ATC approved
policy, for example around PBS and HML.
In some cases, increases in cost may occur where regulatory changes cause
compromises to productivity.
An indication of the gains possible and areas of doubt
Table 3.2 sets out in matrix form, the major areas of economic impact from
reconciling jurisdictional differences to a single, national approach. The potential
benefits attributed to each area are based on the findings of studies such as those
cited in chapter 2 as well as NTC judgements about the relative importance and
potential in each area. They are presented in net present value terms (NPV). This
represents the cumulative annual net benefits that might be achieved over the next
20 years discounted at 7 per cent. It also allows for growth in the heavy vehicle
trucking task and for a period over which changes might be phased in.
The table shows the six main areas of economic gain expected from 13 areas of
regulatory change. It also shows the number of changes in each area as well as the
variations being considered in the Regulatory Impact Statement (368 in total with
34 RIS variations). The RIS variations are a subset of the total variations. The total
expected net benefits for a regulatory area are set out in bold while the proportion of
the total attributed to the RIS variations alone is set out in italics. So for instance, the
30 changes to registration law are expected to deliver benefits of $NPV 0.2 billion
with the seven RIS variations expected to deliver $NPV 0.047 billion of these gains.
Some regulatory areas will provide particular economic gains but not others. For
instance, regulation law changes will help provide savings in compliance costs for
industry and enforcement and administrative costs for regulators, but will not
directly contribute to safety, environmental or productivity benefits. On the other
hand, changes in RAV regulations that increase access have the potential to
contribute to all six economic benefits identified.
Several of the RISs already conducted by the NTC provide estimates of total net
benefits listed in the sum column and other studies provide estimates of total net
benefits in the total row at the bottom. For instance the Castalia Report (2009) referred
to in the previous chapter is the main reference for compliance and administrative
cost savings. The column totals and the blank cells of the matrix suggest that if
identified net benefits in each regulatory area are roughly proportional to the column
totals, the net gains in each active cell would be as reported in the matrix. The
proportionality of sum column and total row implies an apportionment of the
compliance and enforcement costs for instance. The division between the 34 RIS
variations and the rest is based on NTC judgement and assessment based first on an
ordinal ranking and then later on cardinal rankings. Internal consistency and cross-
checking is aided by the need for row and column sums to add and the reasonable

BENEFIT–COST ANALYSIS: NATIONAL HEAVY VEHICLE REGULATOR (NHVR) MODEL LAW 15
www.TheCIE.com.au
certainty about the empty cells helps logically concentrate the attribution exercise to
the most relevant areas.
3.2 Indicative net benefits of NHVR and 34 main reconciliations in 20 year NPV terms ($ billion)
Legal issues Count Economic impacts Sum
Savings
Compliance
cost
Enforcement
admin cost Safety Environment Productivity
On
industry
On
regulators Noise C02e
$NPVb $NPVb $NPVb $NPVb $NPVb $NPVb $NPVb
Registration law 30 0.150 0.050 0.200d
RIS variation 7 0.035 0.012 0.047
AVSR's 24 0.075 0.025 0.100d
RIS variation 1 0.068 0.023 0.090
Mass & loading 17 0.075 0.025 0.100d
RIS variation 1 0.004 0.001 0.006
RAV's 22 0.840 0.210 0.140 0.070 0.140 5.700 7.000e
RIS variation 2 0.720 0.180 0.120 0.060 0.120 4.800 6.000
IAP 33 0.139 0.035 0.023 0.012 0.023 0.924 1.156f
RIS variation 4 0.093 0.023 0.015 0.008 0.015 0.619 0.774
NHVAS 12 0.099 0.033 0.198 0.330g
RIS variation 2 0.008 0.003 0.017 0.028
C & E 74 0.050 0.013 0.125 0.063 0.250g
RIS variation 6 0.005 0.001 0.013 0.006 0.025
Fatigue CoR 68 0.200 0.050 0.500 0.250 1.000h
RIS variation 6 0.020 0.005 0.050 0.025 0.100
Speeding CoR 16 0.050 0.013 0.125 0.063 0.250g
OSOM 43 0.042 0.011 0.007 0.238 0.298f
RIS variation 3 0.021 0.005 0.004 0.119 0.149
CML 4
HML 13 0.210 0.053 0.035 0.018 0.035 1.400 1.750f
RIS variation 2 0.180 0.045 0.030 0.015 0.030 1.200 1.500
Other business 12
TOTAL 1 - 368 1.930a 0.516
a 0.955
b 0.099
b 0.198
b 8.735
c 12.433
RIS variations 34 1.154 0.298 0.231 0.083 0.165 6.786 8.718
a Based on Castalia (2009). bBased on NTC (2010) PBS RIS proportions. c Based on conservative interpretation of Productivity
Commission (2006) numbers. d Based on NTC (personal communication) distribution of Castalia (2009) estimates. e Based on NTC
(2010) PBS RIS estimates being a subset of potential RAV impacts and assumed to be double the PBS estimates. f Proportionally
smaller than RAV NTC (personal communication). g Proportionally smaller than Fatigue NTC (personal communication). h Based on
NTC Fatigue RIS (2002).
Source: TheCIE.
16 BENEFIT–COST ANALYSIS: NATIONAL HEAVY VEHICLE REGULATOR (NHVR) MODEL LAW
www.TheCIE.com.au
Although it is difficult to be precise about such net benefits, they are provided as
indicative and they are consistent with the sort of potential that has been identified
through a variety of studies over several years.
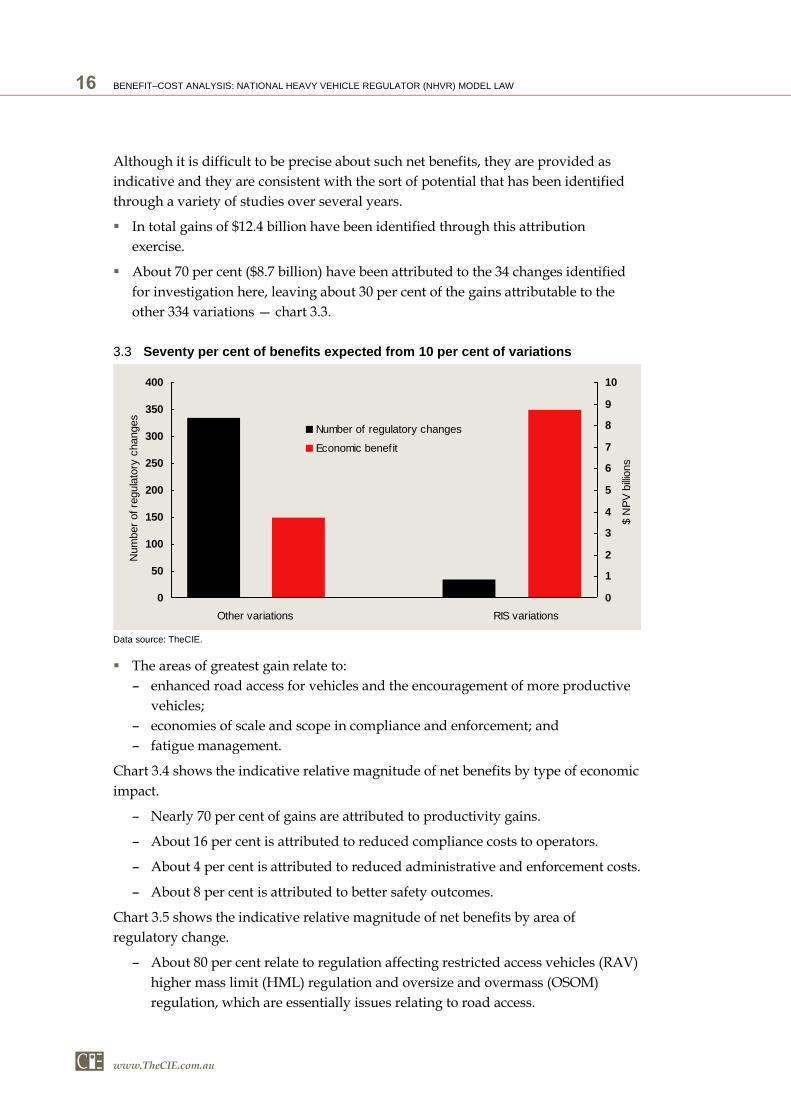
In total gains of $12.4 billion have been identified through this attribution
exercise.
About 70 per cent ($8.7 billion) have been attributed to the 34 changes identified
for investigation here, leaving about 30 per cent of the gains attributable to the
other 334 variations — chart 3.3.
3.3 Seventy per cent of benefits expected from 10 per cent of variations
0
50
100
150
200
250
300
350
400
Num
ber
of re
gula
tory
changes
0
1
2
3
4
5
6
7
8
9
10
Number of regulatory changes
Economic benefit
Other variations RIS variations$ N
PV
billio
ns
Data source: TheCIE.
The areas of greatest gain relate to:
– enhanced road access for vehicles and the encouragement of more productive
vehicles;
– economies of scale and scope in compliance and enforcement; and
– fatigue management.
Chart 3.4 shows the indicative relative magnitude of net benefits by type of economic
impact.
– Nearly 70 per cent of gains are attributed to productivity gains.
– About 16 per cent is attributed to reduced compliance costs to operators.
– About 4 per cent is attributed to reduced administrative and enforcement costs.
– About 8 per cent is attributed to better safety outcomes.
Chart 3.5 shows the indicative relative magnitude of net benefits by area of
regulatory change.
– About 80 per cent relate to regulation affecting restricted access vehicles (RAV)
higher mass limit (HML) regulation and oversize and overmass (OSOM)
regulation, which are essentially issues relating to road access.

BENEFIT–COST ANALYSIS: NATIONAL HEAVY VEHICLE REGULATOR (NHVR) MODEL LAW 17
www.TheCIE.com.au
– About 10 per cent relates to fatigue and speeding.
– The remainder relate to a series of issues designed to assure the effectiveness of
the National Regulator.
3.4 Relative magnitude of net benefits by economic areas: indicative
0
1
2
3
4
5
6
7
8
Environment Enforcement cost Safety Compliance cost Productivity
$ b
illio
n N
PV
Data source: TheCIE.
3.5 Relative magnitude of net benefits by regulatory areas: indicative
0.0
1.0
2.0
3.0
4.0
5.0
6.0
7.0
8.0
RAV
's
HM
LIA
P
Fatig
ue C
oR
NHVA
S
OSO
M
C &
E
Speed
ing C
oR
Reg
istra
tion
law
AVSR
's
Mas
s & lo
ading
CM
L
$ b
illio
ns N
PV
Data source: TheCIE.
Restricted Access Vehicles: access and productivity
The single largest area of gain ($7.0 NPV billion) is expected in the area of restricted
access vehicles regulation. The gains from PBS ($3.6 NPV billion) reported in the PBS
RIS are a subset of these gains. Additional gains are expected in considering a wider
range of access issues for heavy vehicles. Of the 22 variations being considered, there

18 BENEFIT–COST ANALYSIS: NATIONAL HEAVY VEHICLE REGULATOR (NHVR) MODEL LAW
www.TheCIE.com.au
are two expected to deliver most of the gains ($6.0 billion). These relate to removing
impediments to restricted access vehicles in obtaining permits to operate and these
are of consideration in this RIS.
One relates to moving to the Queensland model in the granting of permits to
operate to remove restrictions over who can be granted a permit. This is expected
to simplify and increase access.
The other relates to new decision making frameworks that will promote greater
consistency and transparency in the application of ATC approved policy and
thereby lead to greater access.
The greatest gains are expected to come from productivity gains derived from
consistent application of national policy decisions. Small gains to safety, noise and
carbon emissions will come from the use of larger vehicles conducting fewer trips.
Higher Mass Limits: access and productivity
The next largest area of gain is expected to derive from applying the model law as it
relates to higher mass limits (HML). HML are expected to increase road access for
heavy vehicles and the size of their loads and to overcome restrictions often applying
to the last mile of a trip where restrictions around delivery points apply. However,
the productivity gains they will deliver are expected to be only about quarter those
relating to RAV regulations.
With the proposed changes and the creation of a national regulator more complete
implementation of the mass and loading provision of the model law are expected.
These will deliver direct productivity gains in terms of larger and fewer vehicle
movements. With productivity gains will come some gains to safety, noise and
carbon emissions. The costs of compliance in some areas may decline. Of the 13 areas
of change, two are expected to deliver around 86 per cent of the benefits and these
are among the subjects of review in this RIS.
One relates to minor changes to the HML policy.
The other relates to new decision making frameworks that will promote greater
consistency and transparency in the application of ATC approved policy and
thereby lead to greater access
Intelligent Access Program: access and productivity
Another area relating to access likely to produce potential gains is intelligent access
programs. The model law around IAP is expected to increase the road access for
heavy vehicles but not to the extent that RAV and HML regulations will. To some
extent IAP regulations may have the potential to bolster access through RAV. By
adhering to IAP requirements, additional road access may be granted to heavy
vehicles enabling them to achieve productivity gains if current costs of IAP can be
BENEFIT–COST ANALYSIS: NATIONAL HEAVY VEHICLE REGULATOR (NHVR) MODEL LAW 19
www.TheCIE.com.au
lowered. With productivity gains will come some gains to safety, noise and carbon
emissions. Although the costs of compliance in some areas may decline, meeting the
conditions required under IAP may compromise productivity in some areas,
suggesting there may be cost as well as benefits.
About two thirds of the gains are expected to be derived from four of the 33 changes
in this area.
Two of the changes are designed to add to the audit integrity of the IAPs.
The other two relate to new decision making frameworks that will promote
greater consistency and transparency in the application of ATC approved policy
and thereby lead to greater access.
Oversize Overmass Regulations: access and productivity
Another area expected to deliver economic gains relating to road access applies to
oversize and overmass regulations applying to special vehicles such as mobile
cranes. The gains are likely to be similar in nature to those applying to RAV
regulations, but because they relate to non-regular heavy vehicle movements, the
value of heavy vehicle tasks are considerably less — less than a tenth of the task
affected by RAV regulations. The three variations of the total of 33 in this area under
review here are likely to account for around half the gains.
Two relate to:
– special purpose trailers which may enhance productivity; and
– administration and enforcement and deals with issues required to underpin
the integrity of the regulator on the matter of pilot and escort vehicles.
The other relates to new decision making frameworks that will promote greater
consistency and transparency in the application of ATC approved policy and
thereby lead to greater access.
Fatigue Chain of Responsibility: safety and productivity
Despite national heavy vehicle laws designed to address fatigue issues on a more
systematic and scientific basis, consistent implementation has not occurred leaving
considerable potential for gains to be achieved by a national regulator. Perhaps half
the gains (around $1.0 billion) are still to be achieved. Mostly these gains will be
safety related, although some gain will occur in areas of compliance, enforcement
and productivity as well. In total there are 68 changes being proposed in the area of
fatigue. Six are of interest in this RIS and they may account for around 10 per cent of
the potential gains.
Two relate to codes of conduct and accreditation which link directly to achieving
safety benefits.
20 BENEFIT–COST ANALYSIS: NATIONAL HEAVY VEHICLE REGULATOR (NHVR) MODEL LAW
www.TheCIE.com.au
Two others relate to harmonising state regulations to find workable solutions and
relate to regulation under OH&S and the outer limits of times drivers can travel.
Each of these raise safety and productivity issues, some of which may be
compromised.
The others relate to addressing the low uptake of Advanced Fatigue Management
(AFM) to date.
Compliance and enforcement regulation: safety
These regulations have the potential to bolster fatigue and speeding regulations
however their contribution is considered to be a fraction of the gains likely from
fatigue and speeding. There are 72 changes in total, of which six are of interest in this
RIS. Mostly, these relate to issues designed to underpin the integrity and
effectiveness of the national regulator and relate to things such as sanctions and
penalties and procedural issues.
Registration, Vehicle Standards, Mass and Loading: compliance and enforcement
These are issues relating closely to compliance and enforcement costs. They are areas
required to help establish the functionality of the national regulator. Although
expected to deliver some gains in terms of economies of scale and scope in
regulation, they, alone, are not expected to deliver large productivity or safety gains.
Across these three areas there are 71 changes proposed of which nine are of interest
to this RIS. They are assessed to perhaps deliver gains in the order of $150 million
which is small relative to other areas. The changes relate to transfers of registration,
inspections, customised plates, defect notices and unpaid fines. In some cases they
deal with harmonising state regulations to find workable solutions. These are
necessary to underpin the integrity of the national regulator and to make it
functional, although in some cases they may require compromises to productivity
and the efficiency of the national regulator.
Costs of the Regulator
As noted earlier, this cost benefit analysis is concerned with the impacts of
reconciling state-based variations from the model laws back to a single, national
approach. However, there will be costs which will relate to compliance and
enforcement in some areas. One indicator of the magnitude of compliance and
enforcement costs is included in the forecast costs of establishing and maintaining
the National Heavy Vehicle Regulator.
KPMG undertook a costing of the Regulator and, on the basis of currently available
evidence, deduced that:

BENEFIT–COST ANALYSIS: NATIONAL HEAVY VEHICLE REGULATOR (NHVR) MODEL LAW 21
www.TheCIE.com.au
Total development costs inclusive of NHVR policy and projects review and
amendment of existing laws and governance would be $23 417 000. There was
considered to be ‘semi-strong’ evidence for 96 per cent of these costs.
A total estimated implementation cost inclusive of functions such as registration,
OSOM, RAV, HML and vehicle standards is $60 764 000. There was considered to
be ‘semi-strong’ evidence for 66 per cent of these costs. It is important to note that
most jurisdictions were not able to forecast implementation costs in relation to IT
systems and that IT costs would largely be additional to the $60.7 million
identified.
Forecast ongoing costs inclusive of 21 standardised functions would be around
$171 million per year. There is considered to be ‘strong’ evidence for 62 per cent of
these costs. Of the forecast ongoing costs, NSW accounts for almost 44 per cent.
Therefore, total development and implementation costs are currently estimated at
around $84 million with ongoing costs of around $171 million per year. However,
these costs do not include the reduction in costs to jurisdictions from not having to
conduct various functions once a national regulator is established. Economies of scale
and scope in regulation might logically be expected to deliver net benefits. The report
cited earlier by Castalia (2009), seems to confirm this. The exact ongoing costs will
become clearer as the operational model is refined.
Summary
Of the 368 divergences to the model law that require harmonisation to deliver a
national approach, about 90 per cent are of a relatively minor technical nature. They
are important to help underpin the sorts of economic gains likely from establishing a
single, national set of heavy vehicle laws. Based on the attribution exercise presented
here, harmonising the differences is considered necessary to achieve around a third
(30 per cent) of expected gains.
Reconciling the other 34 divergences (10 per cent) is needed to more directly open the
way for the substantial productivity gains expected from removing the problems
associated with fragmented regulation of the heavy vehicle sector. Based on the
attribution exercise, returning these differences to a single, national approach may be
responsible for nearly two thirds of the potential gains (70 per cent). However, of
these 34 divergences, perhaps half (17) are responsible for most of these gains.
Areas for closer scrutiny: item requiring a mini-RIS
Among the greatest areas of potential gain are those relating to new decision
frameworks that would see greater consistency and transparency in the application
of nationally agreed policy, especially around road access. Given the importance of
22 BENEFIT–COST ANALYSIS: NATIONAL HEAVY VEHICLE REGULATOR (NHVR) MODEL LAW
www.TheCIE.com.au
the proposed changes, closer scrutiny of the benefits and costs of changes and
alternatives is warranted as part of the regulation impact statement process.
Among the remaining 34 changes four others were examined. These have identifiable
and in some cases measurable impacts, over and above the benefits associated with
greater harmonisation across jurisdictions. These relate to the following.
Spray suppression devices — it is proposed that the requirement for B-doubles to
have spray suppression devices fitted is removed from the model law. While this
will reduce compliance costs on operators, it could potentially have safety
implications which need to be considered. A cost-benefit study is therefore
necessary to ensure the benefits of this regulatory change outweigh the costs.
Regular inspections — states differ in the frequency that they require heavy
vehicles to undergo a safety inspection. As with spray suppression devices,
reducing the frequency of inspections reduces the compliance cost on operators,
but may compromise safety. It is important to fully understand this trade-off.
Advanced Fatigue Management ‘outer limits’ — the model law stipulates an
‘advanced fatigue management’ outer limit of 16 hours in 24 hours. Some states
are arguing for this to be reduced to 15 hours. However, the Expert Panel has
proposed an entirely new approach to AFM to secure the benefits articulated in
the Fatigue RIS.
Unpaid fines — it is recommended that the model law be amended to allow states
to use registration sanctions as a penalty for unrelated unpaid fines. This will
increase the administrative burden on the national regulator, so it is important to
understand whether there are any benefits to offset these costs.

BENEFIT–COST ANALYSIS: NATIONAL HEAVY VEHICLE REGULATOR (NHVR) MODEL LAW 23
www.TheCIE.com.au
4 New decision making frameworks
Registering authorities and allied bodies such as road managers (where they are
separate) are required to make important decisions about access to the road
network — granting registration, allowing concessions, specifying routes and vehicle
conditions and issuing permits or notices. These decisions have a significant impact
on freight productivity (as well as downstream effects throughout the economy),
road safety, infrastructure maintenance, public amenity and compliance costs.
The model laws provide for review of decisions in relation to registration, heavy
vehicle driver fatigue and alternative compliance schemes. However, a frequently
levelled criticism of the existing system is that the evaluative process and evidentiary
basis on which access decisions are made can lack transparency, is sometimes
inconsistent with agreed ATC and COAG policy and is not subject to review.
Operators seeking a permit may be unclear as to who is the relevant decision maker
and with whom to lodge their application. The form and point of application varies
within and between states and it is often difficult to know the status of an application
or when a decision will be made. Operators may not be given reasons for decisions
which can impede their ability to plan and confidently invest. Furthermore, they may
wait for unreasonably long periods of time for determinations.
Operators report many frustrations with inconsistent decisions such as:
inconsistent decisions between road authorities, relating to the same vehicle and
the same type of road; and
inconsistent decisions by the same road authority on access for vehicles that
would have the same impact on the same road.
Given that road managers are not required to give a reason for their decisions, it is
difficult to tell whether decisions to reject permit applications or impose conditions
are being made for legitimate reasons. Furthermore, looking at past decisions does
not provide any information on the extent to which the inconsistent and ad hoc
nature of road access decision making is deterring operators from submitting permit
applications in the first place.
Experience with the PBS scheme illustrates the point to some extent. The intent of
PBS is that if a vehicle design is considered by the Review Panel to be consistent with
the policy articulated by the ATC and COAG then it should be granted access to the
road network. In practice, vehicles built entirely consistent with PBS guidelines have
no guarantee of access to the road network once those vehicles are operational. Of
24 BENEFIT–COST ANALYSIS: NATIONAL HEAVY VEHICLE REGULATOR (NHVR) MODEL LAW
www.TheCIE.com.au
the 75 PBS Review Panel approved vehicles, access was initially denied or additional
operating conditions were applied to 45 per cent of them. Access was denied to PRP
approved designs due to state based regulations such as the application of non-ATC
approved ‘blueline’ pavement vertical loading standards and inclusion of side
buckles in the width measurement. Only after concerted effort from SCOT/TACE
representatives in re-enforcing the nationally agreed position was additional access
achieved.
Operators currently have no means to contest access decisions or prompt a formal
review. ‘As many of the vehicles built using the PBS process are unable to be used
outside of the PBS scheme, the failure to gain access represents significant losses to
the owners of the vehicles, not only in vehicle costs (which may run into hundreds of
thousands of dollars) but also in wasted time and PBS assessment and certification
fees’.4 Whilst some Agencies do have internal review mechanisms, none have formal
administrative review procedures inclusive of external review such as by the
Victorian Civil Administrative Tribunal.
The absence of a review mechanism understandably makes operators wary of further
investment in innovative schemes like PBS.
The disconnection between nationally agreed policy and on-the-ground application
arises for several reasons: some fiscal, some technical and others cultural. If an
important asset is degraded in the course of its use, the cost of upgrade may fall to
the road manager (often a local council) while the benefits of access accrue solely to
the operator and their customers. The council may not be in a financial position to
repair and upgrade infrastructure. This quandary may only be fully addressed
through a comprehensive pricing reform mechanism which is beyond the scope of
this RIS.5 Expertise in highly technical matters such as pavement analysis and bridge
formulae may not be available in house to local councils and may be costly to
purchase. Even where expertise does exist the engineers providing advice may feel
personally and even legally responsible if an asset to which they have granted access
is subsequently damaged. Councils may also emphasise rate payers’ public amenity
concerns over operators’ access requirements.
The end result is a tension between a ‘protect and preserve’ mentality and a ‘use and
extend’ motivation. A carefully thought-out and consistently applied evaluative
framework can go some way to addressing this tension.
The NTC have proposed two options:
the status quo remains; or
4 NTC, Performance Based Standards Draft Regulatory Impact Statement, March 2010, p. 27.
5 Pricing reform is being pursued through the COAG Road Reform Plan.
BENEFIT–COST ANALYSIS: NATIONAL HEAVY VEHICLE REGULATOR (NHVR) MODEL LAW 25
www.TheCIE.com.au
a new decision making framework is instituted consisting of evaluation tools for
the initial decision and a review process for reconsideration of the initial decision
where requested by industry.
Under the second option a new decision making framework would be developed
consisting of a suite of evaluative tools for initial decisions (particularly around
access) and a review process for reconsideration of those decisions when desired by
industry. The evaluative tools would be developed by the Regulator and made
available to Road Managers. These evaluative tools would include ATC approved
comprehensive network maps, bridge formulae, vehicle categorisation processes and
pavement analysis. They would also include national guidelines on a range of factors
that need to be considered when granting access, thereby broadening the assessment
context beyond the local boundary.
It is proposed that, in the first instance, the review mechanism work as follows: all
decisions regarding registration, accreditation and vehicle conditions would be
subject to internal review and external scrutiny. Road manager decisions would be
open to internal review only.
This option is likely to promote greater industry confidence than the status quo as an
aggrieved party will have access to an independent, external arbiter for matters
within the purview of the regulator. Internal review of road manager decisions
represents an advantage over the existing system in that reasons for decisions will be
given within set timeframes (three months is proposed in the NHVL).
The benefits of a new decision making framework
The benefit of new decision making frameworks is likely to be more consistently
applied national policy around vehicle access and transparency in the reasons why
access is refused. The magnitude of the benefits depends on:
the extent that access refusal will continue to be a barrier to productivity growth
in the absence of an external review mechanism;
the extent to which the new decision making framework will improve levels of
access:
– some existing decisions may be fully rational where the costs to safety,
infrastructure damage or amenity values clearly outweigh wider community
gains in terms of cheaper transport solutions — these should not change;
– others may appear rational to communities incurring the costs, but may be
irrational once wider community concerns about safety, infrastructure and
cheaper transport are considered — these would deliver economy-wide
benefits if changed;
– yet others may clearly be against the national interest but are made due to lack
of expertise or good governance processes; and

26 BENEFIT–COST ANALYSIS: NATIONAL HEAVY VEHICLE REGULATOR (NHVR) MODEL LAW
www.TheCIE.com.au
the extent to which improved road access will increase productivity.
Approach to measuring benefits
To assess the benefits from an effective decision making framework, it is necessary
to:
establish the magnitude of technically possible productivity improvements that
might be achieved by substituting currently restricted high productivity vehicles
for lower productivity vehicles used at present;
determine the share of vehicles and freight task that might be affected;
assess the uptake of such opportunities by freight operators;
convert all above quantitative measures into average national labour, capital and
variable input productivity improvements for the heavy vehicle sector; and
assess the impacts of these on industry income and national GDP using a
computable general equilibrium model to take account of direct and down-stream
benefits to the whole economy.6
This is the approach used here.
Access for PBS vehicles is a subset of the wider access issue being addressed by new
decision making frameworks. The previous PBS RIS identifies some of those
important parameters mentioned above for PBS vehicles. These are used as a starting
point to the approach used here. These parameters and findings help define a base
case for this exercise and PBS parameters have been aggregated to fit the
methodology used here. Results of the PBS RIS (NTC 2010) have been duplicated to
verify the approach used here. In turn, parameters affecting RAV, HML and OSOM
access are considered in the same manner that the PBS access issue have been to help
quantify net benefits.
The extent to which better access would improve productivity
Decision making frameworks that lead to increased road access are likely to improve
productivity in two ways:
Encouraging operators to invest in larger more productive vehicles, such as PBS
vehicles — using vehicles with a larger payload reduces the number of kilometres
travelled for a given freight task. In addition to the productivity benefits to
operators and their customers, there are a range of other benefits, including:
6 An alternative measure of welfare in a CGE context is the Equivalent Variation, which is
conceptually closer to the consumer surplus measure used in partial equilibrium analysis.
For the simulations used in this study, the Equivalent Variation is around 83 per cent of
GDP.

BENEFIT–COST ANALYSIS: NATIONAL HEAVY VEHICLE REGULATOR (NHVR) MODEL LAW 27
www.TheCIE.com.au
– less damage to road infrastructure;
– fewer greenhouse gas emissions; and
– fewer accidents and therefore fatalities.
Allowing Restricted Access Vehicles, Higher Mass Limit Vehicles, Oversize and
Overmass Vehicles to travel on more efficient routes, such as by avoiding first
mile and last mile issues.
Examples of potential productivity gains
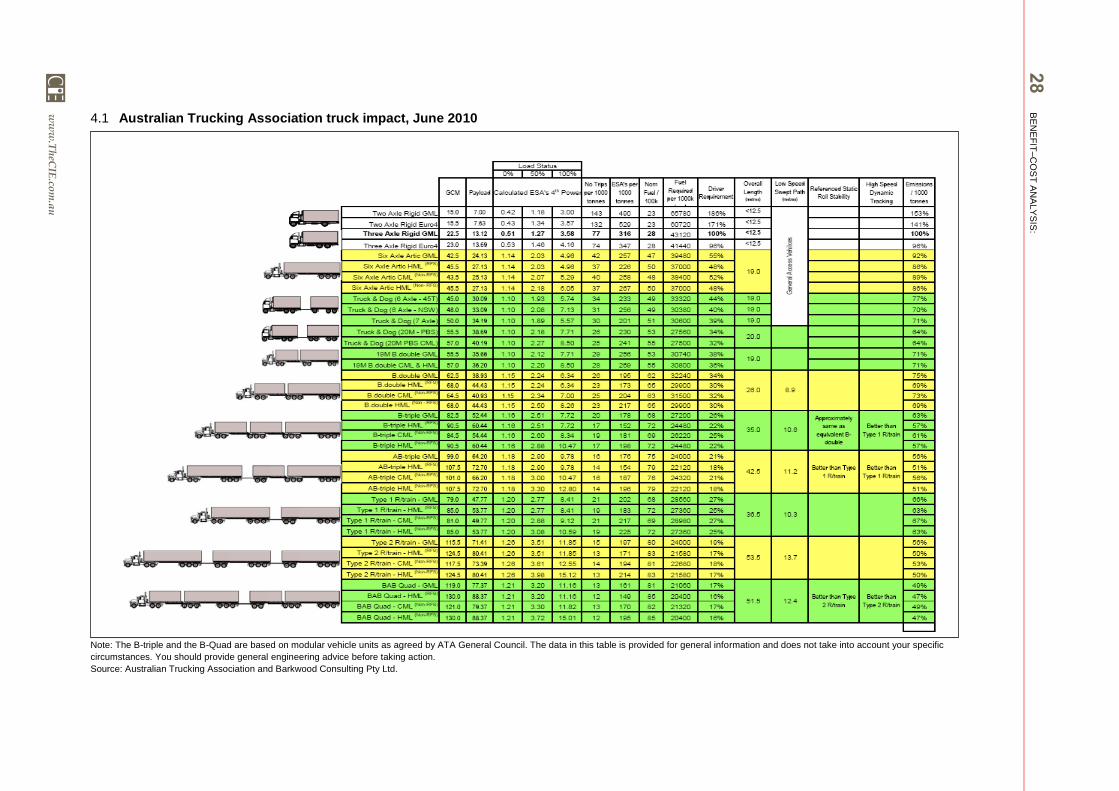
The nature and size of potential gains in productivity can be gleaned from ATA and
Barkwood Consulting (2010). They calculate the productivity of a range of vehicles as
set out in table 4.1.
Allowing a Restricted Access Vehicle such as a B-double HML with a payload of 44.4
tonnes to carry the load of a Six Axle Artic GML with a payload of 24 tonnes would
result in:
a 45 per cent increase in labour productivity;
a 45 per cent reduction in the number of trips to conduct a particular freight task
with a concomitant increase in capital productivity;
a 25 per cent reduction in fuel use to conduct a particular freight task with an
equivalent reduction in carbon emissions; and
a 33 per cent reduction in equivalent standard axle damage to roads.
Similar productivity gains could be achieved by using a BAB Quad-HML with a
payload of 88.4 tonnes to carry the loads of a B-double HML. That said, the average
productivity gain for the industry might be lower than for the example above,
because starting point unit costs of operations will be lower.
Although the potential productivity gains are large in a purely technical sense, the
opportunities to take up such opportunities depend on the suitability of particular
vehicles for particular tasks and on the nature and extent of regulatory restrictions
constraining use. Now a key issue in assessing the benefits that might flow from
evaluative tools that promote access is to assess how this would affect the rate of
uptake of higher productivity vehicles.
An example of the size of economic gains: findings of the PBS RIS
Under an effective PBS scheme, wider use of larger, more productive vehicles
(SMART vehicles) would lift productivity. The PBS RIS identified potential
productivity gains from substituting more productive (SMART vehicles) for existing
ones. The range of substitutions for existing vehicle combinations considered is set
out in table 4.2 (PBS is a subset of wider gains that might arise from decisions about
ww
w.T
heC
IE.co
m.a
u
28
B
EN
EF
IT–C
OS
T A
NA
LY
SIS
:
4.1 Australian Trucking Association truck impact, June 2010
Note: The B-triple and the B-Quad are based on modular vehicle units as agreed by ATA General Council. The data in this table is provided for general information and does not take into account your specific
circumstances. You should provide general engineering advice before taking action.
Source: Australian Trucking Association and Barkwood Consulting Pty Ltd.

BENEFIT–COST ANALYSIS: NATIONAL HEAVY VEHICLE REGULATOR (NHVR) MODEL LAW 29
www.TheCIE.com.au
RAV, HML and OSOM). Although it is a subset of gains subsequently considered
under RAV it is appropriate to look first at the PBS RIS (NTC 2010) because it
implicitly considers decision making frameworks as an adjunct to enhanced
productivity).
4.2 Examples of PBS vehicle substitution
PBS vehicle Existing vehicle Type of work
Longer (by 1 metre) rigid trucks not in
combination:
2 axle; and
3 axles
Existing length rigid truck
combinations
Urban
B-triple B-doubles Long distance to outer-
suburban freight parks
and depot to depot trips
Super B-double Single semi-trailer Urban container work
A-double B-double Intra-capital city single
articulated kilometre
task
Single semi-trailer (19 metres in length) Single semi-trailer (20 metres in
length)
All single semi-trailer
operations
Higher mass rigid trucks in combination:
2 axle rigid truck and trailer combinations
3 axle rigid truck and trailer combinations
4 axle rigid truck and trailer combinations
Existing mass rigid trucks in
combination:
2 axle rigid truck and trailer
combinations
3 axle rigid truck and trailer
combinations
4 axle rigid truck and trailer
combinations
Existing rigid truck and
dog operations
Longer rigid trucks not in combination:
2 axle volumetric trucks
3 axle rigid truck
Existing length rigid trucks not in
combination:
2 axle volumetric trucks
3 axle rigid truck
Existing 2 and 3 axle
rigid operations
Articulated buses containing an extra 30
seats
Non-articulated buses Passenger transport
Pocket double road-trains B-double Long distance freight
Source: TheCIE and NTC (2010).
Productivity gains identified from the substitutions were large ranging from 12 to
50 per cent with averages around 25 per cent.
The Productivity Commission (2006, p.22) mentions potential productivity gains
of 37 per cent from SMART trucks and fleet reductions of 20 per cent.
However, the overall uptake of this potential will depend on the extent to which PBS
vehicles are granted road access.
Two of the options considered by the PBS RIS were:
maintain the status quo in which the current PBS arrangement would continue
(option 1); and

30 BENEFIT–COST ANALYSIS: NATIONAL HEAVY VEHICLE REGULATOR (NHVR) MODEL LAW
www.TheCIE.com.au
a national access regime, which includes the NHVR operating as a one-stop shop
for operators on road access issues, ‘as of right’ access for PBS approved vehicles
on mapped roads (i.e. application of ATC approved policy) and a review
mechanism. The decision making framework being considered in this RIS is
largely implicit in this option (option 2).
Uptake of PBS vehicles was expected to be only around 1 per cent of the vehicle fleet
by 2030 if current arrangements continue (option 1) due to the restrictive nature of
achieving road access for PBS vehicles. These vehicles would conduct about 2 per
cent of national fleet-kilometres travelled and more than 2 per cent of the tonnes
kilometre freight task. However, based on consultation with heavy vehicle operators,
uptake of PBS vehicles was expected (conservatively) to more than treble by 2030 to
more than 3 per cent of the vehicle fleet by 2030 under a national assessment and
access framework. These vehicles would undertake around 6.5 per cent of national
fleet kilometres travelled and more than 6.5 per cent of the national tonne kilometre
freight task.
Indicators of economic benefits
An interpretation of the PBS RIS results is set out in table 4.3. The table sets out
indicative shares of the heavy vehicle transport task measured in terms of kilometres
travelled (these are consistent with table 4, appendix 1 of the PBS RIS). This is used as
an indicator of the relative values of the transport task. Using tonnes kilometres
provides a better indication of the volumetric freight task, but not the relative values
of the task which is of most interest here. The transport task is broken into the three
areas identified in the PBS RIS as having the biggest differences in terms of
productivity gains or rates of uptake. Productivity gains are consistent with those
reported in table 10, appendix 1, and uptake rates are consistent, in aggregate, with
those reported in figure 5 and relativities are consistent with table 11, appendix 1 of
the PBS RIS.
4.3 Assumed PBS productivity increase: national fleet
Current vehicle class
Share of
km
travelled
Indicative
productivity
gain
Uptake % share km
travelled
Effective %
productivity gain:
national HV fleet
% % Option 1 Option 2 Option 1 Option 2
General access vehicles:
Small 4.5 <12 tonne 30 20 1 2 0.06 0.12
Large>12 <50 tonne 50 25 3 10 0.38 1.25
Restricted access
vehicles 20 25
1 5
0.05 0.25
100 2.0 6.5 0.49 1.62
Adjusted 0.37 1.23
Source: TheCIE and NTC (2010).
BENEFIT–COST ANALYSIS: NATIONAL HEAVY VEHICLE REGULATOR (NHVR) MODEL LAW 31
www.TheCIE.com.au
Although not calculated in the RIS, the indicative productivity gains and rates of
uptake imply national level productivity gains for the heavy vehicle sector of around
0.5 per cent under option 1 and 1.62 per cent under a well functioning decision
making framework. Increased road access typically provides higher productivity
gains for labour and capital than for variable inputs such as fuel. ATA and Barkwood
consulting (2010) data suggests productivity gains in fuel and other variable inputs
occur at about half the rate of labour and capital gains. Based on input shares, this
might suggest productivity gains of 0.4 per cent for option 1 and 1.23 per cent for
option 2.
Using a 58 sector CGE (Computable General Equilibrium) model of the Australian
economy (see appendix A), a 1.23 per cent productivity gain in the heavy vehicle
road transport sector would increase the sector’s income by around $160 million a
year and generate down-stream benefits to other sectors in terms of lower transport
costs and increased output of around $390 million and so increase GDP annually by
around $550 million in current value terms. Using a different method, NTC estimate
annual direct and down-stream GDP gains in present value terms (when the full
productivity gains are achieved) of $487 million a year. Being able to roughly
replicate the results of the PBS RIS makes it possible to use a similar approach to
determine wider gains that might arise under an effective national assessment and
access framework also affecting other RAVs, HML and OSOM vehicles.
Other benefits and costs
Other benefits and costs were found to be associated with the productivity benefits.
The PBS RIS found additional benefits in terms of road safety and reduced carbon
emissions associated with fewer trips being conducted by larger vehicles. It also
found that there would be some increase in compliance and administrative cost.
Nonetheless, the net benefits of option 2 were found to be large. The net benefits of
the PBS under both options were found to be large (table 4.4). Table 4.4 presents
gains in net present value terms over the period 2011 to 2030 using a discount rate of
7 per cent, a fleet growth factor and a phased uptake rate.
As a result of this higher uptake, the benefits of the PBS scheme were estimated to be
significantly higher under option 2 than under current arrangements (option 1). This
implies that the net benefit of more certainty in access to roads could be around
$3.6 billion (in present value terms) over the period from 2011 to 2030 (table 4.4).
Attribution of gains to the decision making framework
Without a decision making framework that promotes consistent application of
national policy, the full benefits identified in the PBS RIS will not be realised. It is
likely that a significant proportion of these benefits can be attributed to the new
decision making framework. Some industry stakeholders indicated that in the

32 BENEFIT–COST ANALYSIS: NATIONAL HEAVY VEHICLE REGULATOR (NHVR) MODEL LAW
www.TheCIE.com.au
absence of a new decision making framework, there is not a significant change from
existing arrangements.
4.4 Net benefits of the PBS scheme: net present value terms
Current
National
access regime Difference
Option 1 Option 2
$ billion $ billion $ billion
Financial savings 1.01 3.09
Fatality savings 0.06 0.22
CO2 savings 0.02 0.09
Flow on effects 0.65 1.97
Compliance and enforcement costs -0.05 -0.07
Net savings 1.69 5.30 3.61
Source: NTC 2010, appendix 1.
Benefits from improved decision making frameworks and RAV
As reviewed above from the ATA and Barkwood Consulting (2010) data, potentially
large productivity gains could arise from granting other (non-PBS) Restricted Access
Vehicles greater access to the road network. Road access considerations are unlikely
to be preventing small general access vehicles from being replaced by more
productive vehicles. There is already alternative higher productivity general access
vehicle options open for these freight tasks. This implies that these current vehicles
are the most appropriate for those particular freight tasks. However, for larger
general access vehicles there are potential options to use higher productivity vehicles
(RAVs) some of which may presently be precluded by conservative access decisions.
This is important because it is these types of vehicles that are currently conducting
the majority of the kilometres travelled. Earlier indicative productivity gains were
reported as 45 per cent for labour and capital and 25 per cent for variable inputs such
as fuel. In table 4.5, they are conservatively included at 40 and 20 per cent.
Although high productivity gains may also be possible from substituting higher
productivity RAVs for lower productivity RAV vehicles, due to diminishing returns,
average productivity gains may be less than the 40 and 20 per cent considered above.
The productivity potential for RAVs may therefore be less than for large general
access vehicles as indicated in table 4.5. Further, many of these benefits (such as
substituting from B-doubles to A-doubles or B-triples) will have already been
included in the PBS estimates above. There may however, be some benefits to be
gained from switching from an existing RAV, such as a B-double to a higher
productivity (non-PBS) RAV.
BENEFIT–COST ANALYSIS: NATIONAL HEAVY VEHICLE REGULATOR (NHVR) MODEL LAW 33
www.TheCIE.com.au
Potential rates of uptake
In terms of uptake, even without a new decision making framework (option 1), some
progress in access is likely to be made. It is difficult to be precise about this, but
operators consulted suggest it is likely to be small. The ATA makes the following
observation that: ‘… the current governance framework is prohibiting optimal decision
making and seriously constraining successful implementation of transparent processes for
government oversight of infrastructure provision and network access decisions.’ In table 4.5
it is assumed that uptake will be similar to that assumed in the PBS RIS — 3 and 1
per cent respectively for the two active categories. By comparison, operators
consulted are optimistic that were a rational, consistent decision making framework
in place (option 2) access would expand considerably because so many decisions
currently being made are not in the national interest. Moreover, given the high
productivity gains to be achieved, uptake would be strong and rapid. Some
operators consulted indicated uptake rates above 60 per cent for their operations.
Relative to option 1, access could potentially expand 10 fold under option 2 and an
optimistic scenario about the operational effectiveness of the framework.
Economic benefits
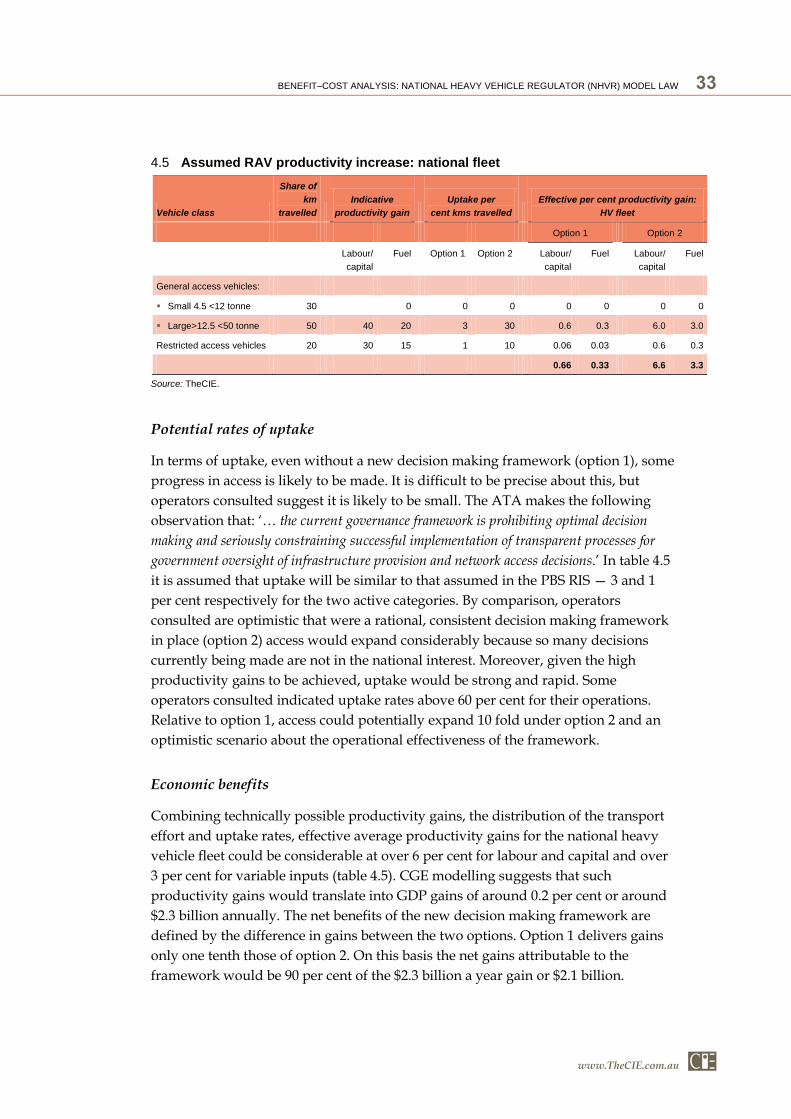
Combining technically possible productivity gains, the distribution of the transport
effort and uptake rates, effective average productivity gains for the national heavy
vehicle fleet could be considerable at over 6 per cent for labour and capital and over
3 per cent for variable inputs (table 4.5). CGE modelling suggests that such
productivity gains would translate into GDP gains of around 0.2 per cent or around
$2.3 billion annually. The net benefits of the new decision making framework are
defined by the difference in gains between the two options. Option 1 delivers gains
only one tenth those of option 2. On this basis the net gains attributable to the
framework would be 90 per cent of the $2.3 billion a year gain or $2.1 billion.
4.5 Assumed RAV productivity increase: national fleet
Vehicle class
Share of
km
travelled
Indicative
productivity gain
Uptake per
cent kms travelled
Effective per cent productivity gain:
HV fleet
Option 1 Option 2
Labour/
capital
Fuel Option 1 Option 2 Labour/
capital
Fuel Labour/
capital
Fuel
General access vehicles:
Small 4.5 <12 tonne 30 0 0 0 0 0 0 0
Large>12.5 <50 tonne 50 40 20 3 30 0.6 0.3 6.0 3.0
Restricted access vehicles 20 30 15 1 10 0.06 0.03 0.6 0.3
0.66 0.33 6.6 3.3
Source: TheCIE.
34 BENEFIT–COST ANALYSIS: NATIONAL HEAVY VEHICLE REGULATOR (NHVR) MODEL LAW
www.TheCIE.com.au
Although these are large indicative benefits they are consistent with other estimates.
In 2006, the Productivity Commission suggested that productivity gains of between 5
and 10 per cent were plausible (up to 0.4 per cent of GDP or $5 billion annually) for
heavy vehicle road transport from improved regulation of the sector. As well as
referring to the potential of the PBS Scheme, the Productivity Commission mentions
regulatory problems relating to inappropriate regulation and the need for systematic
review.
It is important that any decision to regulate road freight operators is justified: that is, regulation needs
to be demonstrated to be necessary, cost-effective and in the public interest. Where regulation is
necessary, decisions on the most appropriate regulatory instrument should be made only after full
consideration of alternatives. At the same time, there should be a process in place for the systematic
review of existing regulation impacting on the road transport sector, in line with COAG’s recent
commitment that all governments undertake targeted annual public reviews of existing regulations to
identify priority areas for reform (page 307).
Although potential gains are large, they are unlikely to be achieved instantly.
Although the framework may bring greater transparency to decision making, it is not
clear the extent to which the internal review process and proposed infrastructure
upgrade will improve access straight away. However, what should be noted is that
the net benefits estimated here are expected to come largely from improved use of
existing roads. In time, continual improvements in roads (more dual carriageways)
will deliver additional productivity gains not accounted for here. That said, an
effective and centralised review mechanism may provide the added advantage of
helping to identify (and provide) worthwhile infrastructure changes needed to fully
realise such gains.
Effectiveness of the new decision making framework
The extent to which these potential benefits are realised depends on the effectiveness
of the new decision making framework.
At one extreme, greater access to evaluative expertise and infrastructure funding
could encourage road managers to take full account of the productivity benefits
for heavy vehicle operators.
At the other extreme, road managers could pay lip service to the internal review
process but may be reluctant to risk infrastructure degradation or reductions in
public amenity, which would result in no better road access.
The actual outcome may lie somewhere between these two extremes. A new
decision making framework that includes a full national interest test and an external
review body with the power to overturn the decisions made by road managers is
likely to achieve an outcome closer to the former scenario. However, the outcomes
from an internal review mechanism may fall short of this. Outcomes may depend on

BENEFIT–COST ANALYSIS: NATIONAL HEAVY VEHICLE REGULATOR (NHVR) MODEL LAW 35
www.TheCIE.com.au
the influence of the national regulator and the pressure applied by various interest
groups.
Plausible scenarios
It is difficult to predict how effective the new decision making framework will be in
promoting greater road access and, in turn, affecting the uptake rates. It is possible to
envisage two scenarios.
At one extreme, closer consideration of all the economic factors affecting access
that also leads to greater access to evaluative expertise and infrastructure funding
could encourage road managers to take full account of the productivity benefits
for heavy vehicle operators.
At the other extreme, road managers could pay lip service to the internal review
process but may be reluctant to risk infrastructure degradation or reductions in
public amenity, which would result in no better road access.
How the net payoffs from option two might be affected by the take-up rate is shown
in chart 4.6.
4.6 Optimistic and pessimistic scenarios for RAV
0.00
0.20
0.40
0.60
0.80
1.00
1.20
1.40
1.60
1.80
2011 2013 2015 2017 2019 2021 2023 2025 2027 2029
$ b
illio
n/y
ear
dis
counte
d
Optimistic scenario (NPV ∑$23.07 billion)
Pessimistic scenario (NPV ∑$6.69 billion)
Best bet scenario (NPV ∑$14.87 billion)
Data source: TheCIE.
Under the optimistic (high) scenario, maximum annual gains are achieved by the
seventh year and decline in present value terms after that. The net present value
under this scenario is estimated at around $23 billion over the next 20 years. It is
assumed that the road haulage task expands at a rate of 3.5 per cent a year and the
discount rate is 7 per cent.
Under the pessimistic (low) scenario, the gains grow slowly over the entire
period. The same freight task growth rate and discount rates are assumed but the

36 BENEFIT–COST ANALYSIS: NATIONAL HEAVY VEHICLE REGULATOR (NHVR) MODEL LAW
www.TheCIE.com.au
net present value is considerably less at around $7 billion, less than a third of the
expected payoff under the optimistic scenario.
Although the payoff is high even under the pessimistic scenario, the difference
between the scenarios also helps to highlight the importance of ensuring the decision
making framework is as effective as possible.
Apart from the observation that even the pessimistic outcome indicates a large
economic gain, a realistic mid-point estimate or (perhaps) best-bet (mid-range)
scenario would sit at around double this at $15 billion NPV.
Benefits from HML
Comparisons of the productivity of higher mass limit vehicles with general mass
limit vehicles in table 4.1 point to potential labour and productivity gains of between
7 and 15 per cent and perhaps fuel saving half this level. A report by ALC (2009)
indicates similar potential gains. Indicative average productivity gains might
reasonably be represented at around 10 per cent for labour and capital and 5 per cent
for variable inputs such as fuel.
As with RAVs, HML restrictions are unlikely to apply to smaller general access
vehicles. As with RAVs they are more likely to restrict the large general access
vehicles (GAVs) than the RAVs. It is difficult to be precise about the percentage of
vehicles that might be able to benefit from better decisions about HML regulations,
but most indicators are that it is likely to be more like the PBS uptake rate than that
for RAV.
The potential productivity gains are not as large and so the incentives for uptake
are smaller.
Uptake of RAV opportunities will lead to the uptake of HML vehicle
opportunities which have already been considered above, leaving only those
opportunities of increasing from GML to HML within the same vehicle
configuration.
Some states have already allowed a relatively high uptake of HML opportunities.
On this basis, effective industry wide productivity increases for large GAVs and
RAVs have been estimating assuming take up rates similar to PBS rates (table 4.7).
Combining technically possible productivity gains, the distribution of the transport
effort and uptake rates, effective average productivity gains for the national heavy
vehicle fleet could be around 0.6 per cent for labour and capital and 0.3 per cent for
variable inputs (table 4.5). CGE modelling suggests that such productivity gains
would translate into GDP gains of around $0.2 billion annually. The net benefits of
the new decision making framework are defined by the difference in gains between

BENEFIT–COST ANALYSIS: NATIONAL HEAVY VEHICLE REGULATOR (NHVR) MODEL LAW 37
www.TheCIE.com.au
the two options. On this basis the net gains attributable to the new mechanism would
be $0.16 billion a year.
Taking account of possible phase-in periods and using the optimistic and pessimistic
scenarios described for the RAV estimates, the net present value of better national
assessments and access mechanisms for HML access could sum to between $0.6 and
$1.8 billion over the 20 years to 2030.
Benefits from OSOM
ABS (2009) report that there are around 22 000 non-freight carrying trucks described
as: specialist motor vehicles or motor vehicles fitted with special purpose equipment, and
having little or no goods carrying capacity (for example ambulances, cherry pickers, fire
trucks and tow trucks). Not all these vehicles will be large and confront oversize
overmass (OSOM) issues. Were a quarter of them OSOM vehicles, this class of
vehicle would represent around 1 per cent of the heavy vehicle fleet. That they do not
carry freight means they do not contribute to the national freight task so their value
cannot be measured in kilometres travelled or tonnes moved. However, what is
certain is that each kilometre travelled is likely to be considerably more economically
valuable than each kilometre travelled by a freight carrying vehicle. It is plausible
that each kilometre travelled could be 5 or 10 times as valuable. If so, the economic
value of these vehicles may be equivalent to between 5 and 10 per cent of the national
heavy vehicle fleet.
The potential productivity gains from decisions that allow increased access for
oversize overmass vehicles (OSOM) come from a variety of sources. It may be that
one special OSOM vehicle could do the work of two non OSOM vehicles. A special
purpose OSOM vehicle that carries large poles and has an in-built crane for delivery
and placement could replace one crane and one articulated truck for instance. Such a
vehicle could offer large productivity increases.
4.7 Assumed HML productivity increase: national fleet
Vehicle class
Share of
km
travelled
Indicative
productivity gain
Uptake per
cent kms travelled
Effective per cent productivity gain:
HV fleet
Option 1 Option 2
Labour/
capital
Fuel Option 1 Option 2 Labour/
capital
Fuel Labour/
capital
Fuel
% % % % % % % %
General access vehicles:
Small <12 tonne 30 0 0 0 0 0 0 0
Large <50 tonne 50 10 5 3 10 0.15 0.075 0.5 0.25
Restricted access vehicles 20 10 5 1 5 0.02 0.010 0.1 0.05
0.17 0.085 0.6 0.30
Source: TheCIE.

38 BENEFIT–COST ANALYSIS: NATIONAL HEAVY VEHICLE REGULATOR (NHVR) MODEL LAW
www.TheCIE.com.au
Given the variety of vehicles it is not possible to be precise about the sort of
productivity gains that might be achieved, but were they the average of the PBS,
RAV and HML gains already considered they may provide labour and capital
productivity gains in the order of 25 per cent. Moreover, because the distances they
travel are less, their variable input costs are likely to be a smaller proportion of total
costs, so productivity gains are more likely to represent labour and capital gains
rather than fuels cost gains.
Were we to assume that productivity gains of 25 per cent were possible (the same as
for PBS vehicles) for perhaps 10 per cent of the OSOM vehicles and that the economic
value of their activity was 7.5 per cent that of the heavy vehicle road freight task,
effective productivity gains equivalent to about 0.2 per cent are derived. These are
similar in magnitude to those for HML and economic (GDP) gains concomitant with
HML could also be expected.
Adding up the benefits
In total, the productivity gains for all classes of vehicles for options 1 and 2 are set
out in table 4.8 along with the net productivity increase (the difference between
options 1 and 2). Net benefits (the difference between options 1 and 2) for these
aggregate benefits are presented in chart 4.9 for the same three plausible scenarios
discussed previously for RAVs (pessimistic or low, optimistic or high and best-bet or
mid-range). They show a potential range of cumulative NPV benefits from $9.0
billion for the pessimistic scenario to $31 billion for the optimistic scenario. The best-
bet is $20 billion.
4.8 Assumed productivity increase for all areas: national fleet
Area of benefit Effective productivity regime Net productivity
Option 1 Option 2 increase
Labour/
capital
Fuel Labour/
capital
Fuel Labour/
capital
Fuel
% % % % % %
RAV 0.66 0.33 6.60 3.30 5.94 2.97
PBS 0.490 0.11 1.620 0.81 1.13 0.70
HML 0.17 0.085 0.6 0.30 0.43 0.22
OSOM 0.17 0.085 0.6 0.30 0.43 0.22
TOTAL 1.49 0.61 9.42 4.71 7.93 4.11
Source: TheCIE.
Other benefits and costs do not change the result much
The results presented in chart 4.9 do not include other benefits and costs associated
with greater road access. The PBS RIS identified additional benefits from increased
road safety and reduced carbon emissions arising from fewer kilometres travelled. If
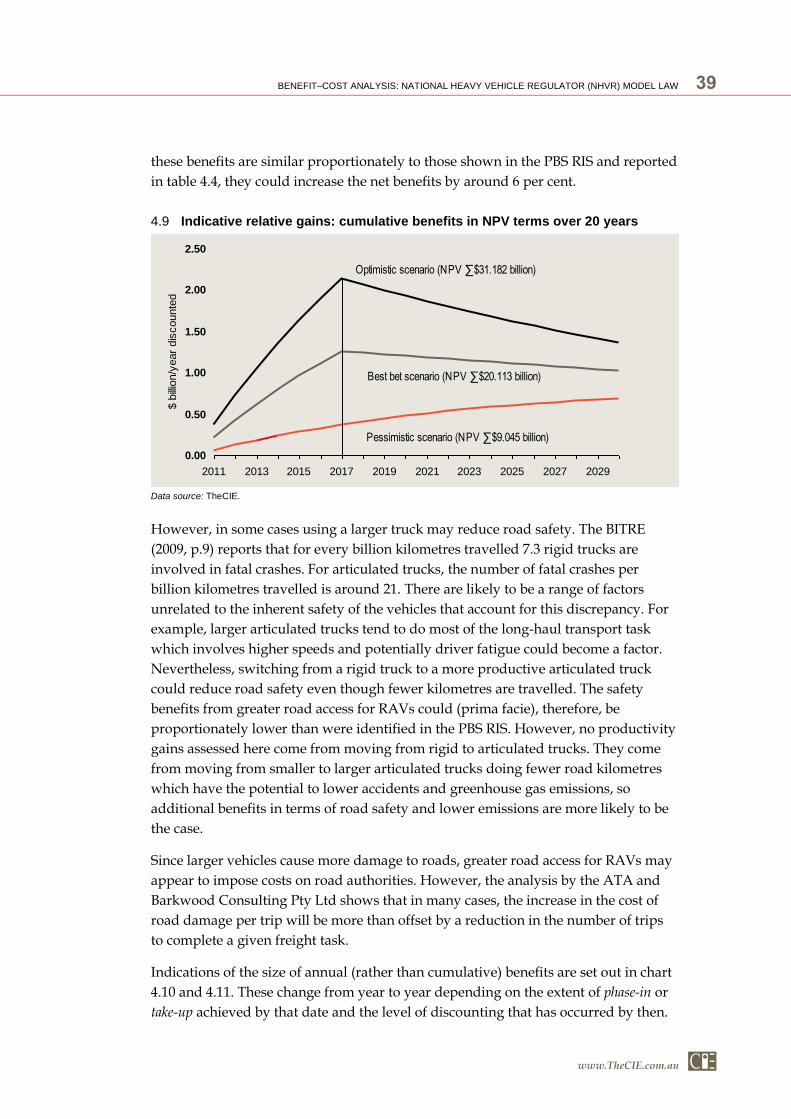
BENEFIT–COST ANALYSIS: NATIONAL HEAVY VEHICLE REGULATOR (NHVR) MODEL LAW 39
www.TheCIE.com.au
these benefits are similar proportionately to those shown in the PBS RIS and reported
in table 4.4, they could increase the net benefits by around 6 per cent.
4.9 Indicative relative gains: cumulative benefits in NPV terms over 20 years
0.00
0.50
1.00
1.50
2.00
2.50
2011 2013 2015 2017 2019 2021 2023 2025 2027 2029
$ b
illio
n/y
ear
dis
counte
d
Optimistic scenario (NPV ∑$31.182 billion)
Pessimistic scenario (NPV ∑$9.045 billion)
Best bet scenario (NPV ∑$20.113 billion)
Data source: TheCIE.
However, in some cases using a larger truck may reduce road safety. The BITRE
(2009, p.9) reports that for every billion kilometres travelled 7.3 rigid trucks are
involved in fatal crashes. For articulated trucks, the number of fatal crashes per
billion kilometres travelled is around 21. There are likely to be a range of factors
unrelated to the inherent safety of the vehicles that account for this discrepancy. For
example, larger articulated trucks tend to do most of the long-haul transport task
which involves higher speeds and potentially driver fatigue could become a factor.
Nevertheless, switching from a rigid truck to a more productive articulated truck
could reduce road safety even though fewer kilometres are travelled. The safety
benefits from greater road access for RAVs could (prima facie), therefore, be
proportionately lower than were identified in the PBS RIS. However, no productivity
gains assessed here come from moving from rigid to articulated trucks. They come
from moving from smaller to larger articulated trucks doing fewer road kilometres
which have the potential to lower accidents and greenhouse gas emissions, so
additional benefits in terms of road safety and lower emissions are more likely to be
the case.
Since larger vehicles cause more damage to roads, greater road access for RAVs may
appear to impose costs on road authorities. However, the analysis by the ATA and
Barkwood Consulting Pty Ltd shows that in many cases, the increase in the cost of
road damage per trip will be more than offset by a reduction in the number of trips
to complete a given freight task.
Indications of the size of annual (rather than cumulative) benefits are set out in chart
4.10 and 4.11. These change from year to year depending on the extent of phase-in or
take-up achieved by that date and the level of discounting that has occurred by then.

40 BENEFIT–COST ANALYSIS: NATIONAL HEAVY VEHICLE REGULATOR (NHVR) MODEL LAW
www.TheCIE.com.au
Annual benefits at the 5 and 10 year mark range from around $300 million to $1.9
billion a year depending on the scenario.
Although uncertain, the evidence presented here suggests that while a number of
outcomes are plausible, in all cases, the potential gains from establishing a decision
making framework are likely to be very large.
Additional gains are possible from increased road safety and reduced carbon
emissions. As indicated in considering PBS and RAV gains these are likely to be
relatively small but positive. They could increase the net benefits by around 6 per
cent. That said, using GDP as a welfare indicator may over state net economic gains.
Using an alternative welfare measure known as equivalent variations would reduce
4.10 Range of potential net benefits: annual present value in year 5
0.00
0.20
0.40
0.60
0.80
1.00
1.20
1.40
1.60
1.80
Low scenario Medium scenario High scenario
Annual b
enefit
s (
$billio
n)
Data source: TheCIE.
4.11 Range of potential net benefits: annual present value in year 10
0.00
0.50
1.00
1.50
2.00
2.50
Low scenario Medium scenario High scenario
$ b
illio
n
Data source: TheCIE.

BENEFIT–COST ANALYSIS: NATIONAL HEAVY VEHICLE REGULATOR (NHVR) MODEL LAW 41
www.TheCIE.com.au
estimated economic benefits by up to 17 per cent. Nonetheless, even with an 11 per
cent (17–6 per cent) downward adjustment, estimated benefits under all scenarios are
large in a macroeconomic sense. This is not entirely surprising given the importance
of transport to virtually all areas of the economy.
The costs of the new decision making framework
The new decision making framework will incur cost in four significant ways.
Costs of developing, updating and communicating the evaluative tools that will
underpin the decision making framework.
Costs of internal and external review for decisions made by the Regulator.
Costs of internal review for decisions made by the Road Manager.
Costs of upgrading infrastructure that may be required to promote access.
In 1998 when increased mass limits for road friendly heavy vehicles were first
assessed, the RIS went some way to costing the evaluative and technical tools
required to support increased mass limits in general. The types of costs considered
included:
bridge design checks;
bridge load testing;
bridge approach upgrading;
replacement of narrow bridges;
placing speed and load limit signs on local road bridges; and
bridge condition monitoring.
The upfront implementation costs were estimated at $58.7 million for rural areas and
$5.1 million for urban areas, with the significant amount of the costs falling on local
government. Estimated ongoing administration and implementation costs were
$6.1 million for rural areas and $2 million for urban areas each year. Inflating these
costs to 2010 dollars using the national CPI7 implies costs of $196.6 million in net
present value terms over 20 years (using a discount rate of 7 per cent).
Because the 1998 cost estimates were for increased mass limits in general, there is no
reason to believe they are not still applicable in general. That said, since 1998, some of
these activities are likely to have been increased, but due to the relatively slow rate of
7 The CPI is the preferred inflator due to the uncertain applicability of other inflators and
their relative variation. The CPI inflator over the period is around 42 per cent while the
Public Gross Capital Formation Inflator is 23 per cent and the Private New-engineering
Construction Gross Capital Formation inflator is 54 per cent. The appropriate inflator is
likely to be a mix of the two capital formation inflators but it is difficult to be certain about
the mix. The CPI lies roughly at the average between these two.

42 BENEFIT–COST ANALYSIS: NATIONAL HEAVY VEHICLE REGULATOR (NHVR) MODEL LAW
www.TheCIE.com.au
uptake of change in the area of increased mass limits, it is unlikely that all of these
costs have been incurred. Although some may have already been incurred, were we
to assume none have, and that all additional increases in mass limits are likely to
incur these costs, we would be erring on the side of conservatism for the purposes of
this benefit cost analysis.
Costs for internal and external review will depend on the volume of reviews that are
requested by industry and this will be driven by the extent to which industry has
confidence in the original decision making process. A ‘worst case’ cost scenario
would see every RAV (inclusive of PBS), HML and OSOM decision subject to
internal review. In the cost analysis undertaken by KPMG the jurisdictions estimated
their combined transitional (implementation) costs for these areas as set out in table
4.12.
4.12 Estimated administration costs
Type of vehicle Cost
$’000
Oversize and overmass 2 309
Restricted Access Vehicles 2 050
Higher Mass Limits 1 990
Total 6 349
Source: KPMG p5.
Under the ‘worst case’, if all of these decisions were subject to review the costs could
double to around $12.7 million per year, implying an increase in costs of $6.3 million
annually or around $59.6 million over 20 years in net present value terms (using a
discount rate of 7 per cent). If 20 per cent of decisions were subject to internal review
the cost would increase by around $1.2 million ($11.9 million in net present value
terms) and if 50 per cent were subject to review the cost would increase by around
$3.2 million ($29.8 million in net present value terms). These additional costs would
need to be funded by the Regulator and jurisdictions. There will conceivably be a
relationship between the perceived robustness of the initial decision and the volume
of internal review which makes a strong case for solid up-front investment in the
evaluative tools.
As with internal review, the volume of external reviews requested will be influenced
by the perceived adequacy of the initial decision making framework. Where an
external review is triggered it is general practice that the Agency whose decisions are
under review contributes to this cost. This will impact Agency budgets. As an
indicator of the costs of external review, the Victorian Civil and Administrative
Tribunal (VCAT) has an annual budget of around $37 million and hears around
85 000 cases. This translates to an average per case cost of around $435. There are
around 567 000 heavy vehicles in Australia in 2010. As a general rule, new
registrations are not particularly contentious, but suppose that 10 per cent of these
BENEFIT–COST ANALYSIS: NATIONAL HEAVY VEHICLE REGULATOR (NHVR) MODEL LAW 43
www.TheCIE.com.au
decisions were subject to external review that would represent a cost of around
$24.6 million per year. In net present value terms, the cost could potentially be
$231.7 million over the period 2011 to 2030 (using a discount rate of 7 per cent).
While most of the benefits of the new decision making framework will be derived
from better access to the existing road network, some infrastructure upgrades may be
necessary to realise the full benefits. The 1998 RIS estimated the cost of upgrading
bridges to support higher mass limits was estimated $75 million per annum over a
period of about 8 to 10 years. Inflating these costs to 2010 dollars using the national
CPI8 implies infrastructure costs of around $803.8 million in net present value terms
(using a discount rate of 7 per cent) for the potential benefits to be fully realised. The
upgrading project was agreed to by the ATC subject to bridges on national highways
and local government bridges being entirely funded by the Commonwealth and
bridges on state/arterial roads being funded equally by the states/territories and the
Commonwealth. It appears that the funding model was not endorsed. To date, not a
lot of changes have occurred, but with a faster rate of increase in mass limits and
access some upgrades in some areas are likely. It is reasonable to assume, therefore,
that the investment is still required to facilitate access. Assuming all of it needs to still
occur and that it will be necessary is another deliberately conservative assumption.
In summary the costs imposed on the Regulator and jurisdictions in a worst case
scenario could be close to $0.49 billion over 20 years in net present value terms (using
a discount rate of 7 per cent)9. If infrastructure costs are included, the costs increase
to around $1.29 billion.
Although the costs presented here are based on previous studies and several
assumptions about their relevance to the current exercise, deliberately conservative
assumptions have been made that probably over state the costs in total. For instance,
it is not clear the gains estimated will require the level of infrastructure spending
assumed as most gains are expected to come from better access to the existing road
network. Nonetheless, they provide an indication of the broad orders of magnitude
of costs that can be compared against benefits.
8 See footnote 5.
9 NTC (2010) found that administration and compliance costs for PBS access would be
around 2.9 per cent of benefits in the low (pessimistic) scenario and 1.25 per cent in the
high (optimistic) scenario. Applying these percentages to the low and high benefits
identified in chart 4.9 would imply NPV costs of between $264 million and $390 million.
Although lower, these are not dissimilar in orders of magnitude to those costs estimated
here.
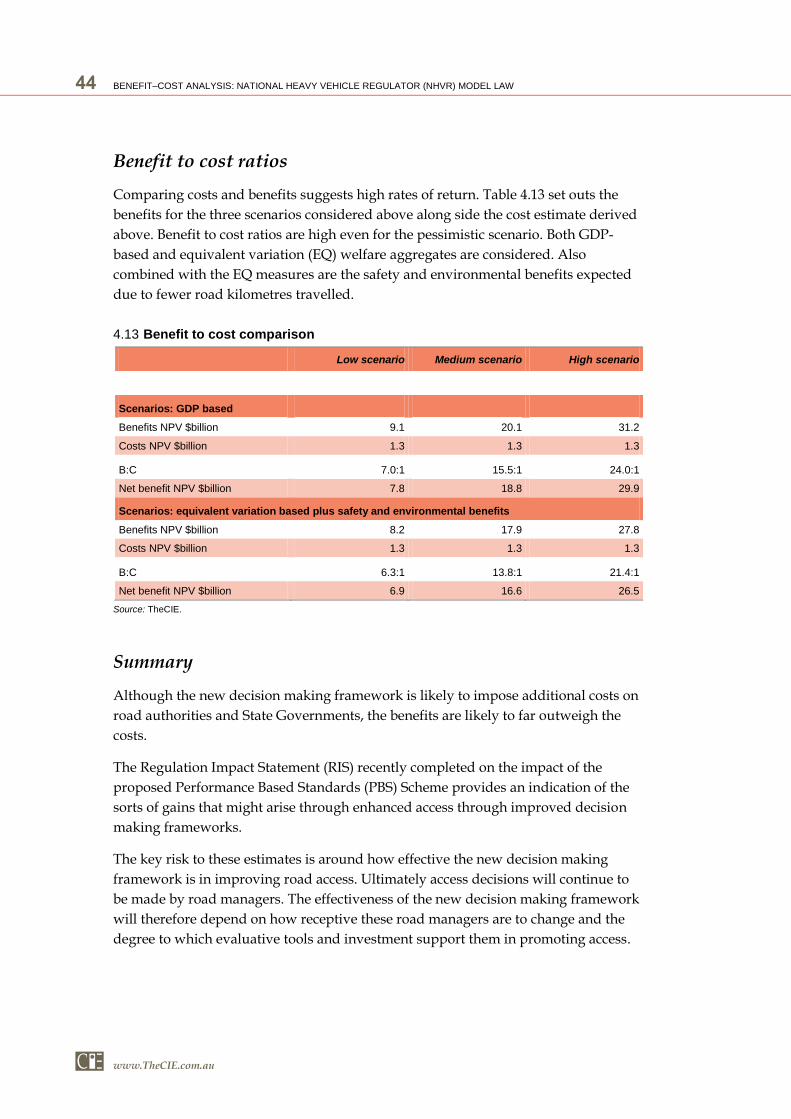
44 BENEFIT–COST ANALYSIS: NATIONAL HEAVY VEHICLE REGULATOR (NHVR) MODEL LAW
www.TheCIE.com.au
Benefit to cost ratios
Comparing costs and benefits suggests high rates of return. Table 4.13 set outs the
benefits for the three scenarios considered above along side the cost estimate derived
above. Benefit to cost ratios are high even for the pessimistic scenario. Both GDP-
based and equivalent variation (EQ) welfare aggregates are considered. Also
combined with the EQ measures are the safety and environmental benefits expected
due to fewer road kilometres travelled.
4.13 Benefit to cost comparison
Low scenario Medium scenario High scenario
Scenarios: GDP based
Benefits NPV $billion 9.1 20.1 31.2
Costs NPV $billion 1.3 1.3 1.3
B:C 7.0:1 15.5:1 24.0:1
Net benefit NPV $billion 7.8 18.8 29.9
Scenarios: equivalent variation based plus safety and environmental benefits
Benefits NPV $billion 8.2 17.9 27.8
Costs NPV $billion 1.3 1.3 1.3
B:C 6.3:1 13.8:1 21.4:1
Net benefit NPV $billion 6.9 16.6 26.5
Source: TheCIE.
Summary
Although the new decision making framework is likely to impose additional costs on
road authorities and State Governments, the benefits are likely to far outweigh the
costs.
The Regulation Impact Statement (RIS) recently completed on the impact of the
proposed Performance Based Standards (PBS) Scheme provides an indication of the
sorts of gains that might arise through enhanced access through improved decision
making frameworks.
The key risk to these estimates is around how effective the new decision making
framework is in improving road access. Ultimately access decisions will continue to
be made by road managers. The effectiveness of the new decision making framework
will therefore depend on how receptive these road managers are to change and the
degree to which evaluative tools and investment support them in promoting access.

BENEFIT–COST ANALYSIS: NATIONAL HEAVY VEHICLE REGULATOR (NHVR) MODEL LAW 45
www.TheCIE.com.au
5 Spray suppression devices
The model law currently requires all B-doubles to be fitted with a spray suppression
device. The NTC has proposed to remove this requirement from the model law.
Impact of proposed regulatory change
Spray suppression devices are designed to reduce the amount of spray generated by
B-doubles and therefore improve safety for drivers and other road users. This
requirement, however, imposes a range of compliance costs on operators. The costs
and benefits of the proposed regulatory change are estimated below.
The NTC’s proposal to remove the requirement that B-doubles be fitted with a spray
suppression device is assessed against the alternative option of retaining the
requirement.
Benefits
The main benefit associated with the proposed regulatory change is the reduction in
compliance costs for operators. These compliance costs include:
the upfront capital cost of fitting the spray suppression device;
the cost of maintaining the device; and
the opportunity costs associated with having the vehicle off the road for
unscheduled maintenance related to spray suppression devices.
The upfront cost of a spray suppression device is estimated at around $1500. Since all
existing B-doubles (except in Western Australia and the Northern Territory) will
have already incurred this cost the cost saving would therefore apply only to new B-
doubles acquired after the proposed law changes have been made.
The direct cost of maintaining the spray suppression devices is estimated at around
$250 per year. These cost savings would be enjoyed by all B-double operators.
Maintenance of spray suppression devices is typically done as part of the regular
vehicle maintenance regime. However, there are also occasions when spray
suppression devices need to be fixed outside of scheduled maintenance, such as
when a defect notice is issued for a defective spray suppression device. Based on
consultation with operators, each B-double could spend an additional quarter of a
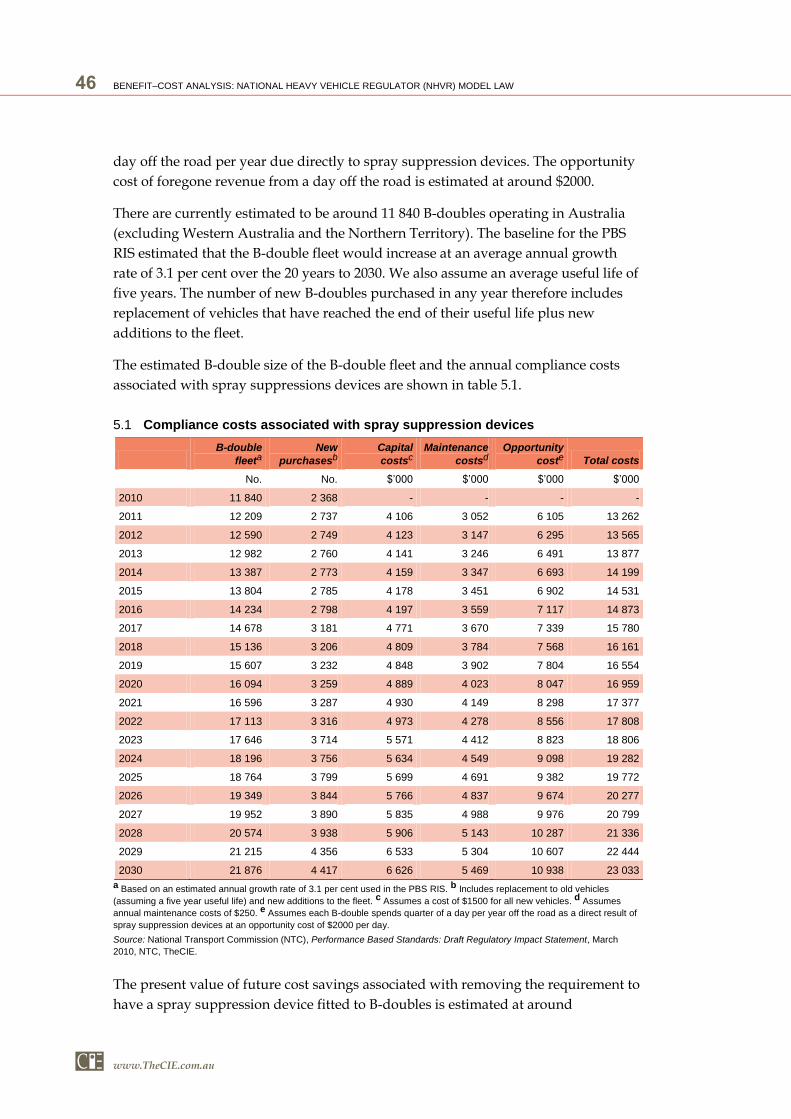
46 BENEFIT–COST ANALYSIS: NATIONAL HEAVY VEHICLE REGULATOR (NHVR) MODEL LAW
www.TheCIE.com.au
day off the road per year due directly to spray suppression devices. The opportunity
cost of foregone revenue from a day off the road is estimated at around $2000.
There are currently estimated to be around 11 840 B-doubles operating in Australia
(excluding Western Australia and the Northern Territory). The baseline for the PBS
RIS estimated that the B-double fleet would increase at an average annual growth
rate of 3.1 per cent over the 20 years to 2030. We also assume an average useful life of
five years. The number of new B-doubles purchased in any year therefore includes
replacement of vehicles that have reached the end of their useful life plus new
additions to the fleet.
The estimated B-double size of the B-double fleet and the annual compliance costs
associated with spray suppressions devices are shown in table 5.1.
5.1 Compliance costs associated with spray suppression devices
B-double
fleeta
New
purchasesb
Capital
costsc
Maintenance
costsd
Opportunity
coste Total costs
No. No. $’000 $’000 $’000 $’000
2010 11 840 2 368 - - - -
2011 12 209 2 737 4 106 3 052 6 105 13 262
2012 12 590 2 749 4 123 3 147 6 295 13 565
2013 12 982 2 760 4 141 3 246 6 491 13 877
2014 13 387 2 773 4 159 3 347 6 693 14 199
2015 13 804 2 785 4 178 3 451 6 902 14 531
2016 14 234 2 798 4 197 3 559 7 117 14 873
2017 14 678 3 181 4 771 3 670 7 339 15 780
2018 15 136 3 206 4 809 3 784 7 568 16 161
2019 15 607 3 232 4 848 3 902 7 804 16 554
2020 16 094 3 259 4 889 4 023 8 047 16 959
2021 16 596 3 287 4 930 4 149 8 298 17 377
2022 17 113 3 316 4 973 4 278 8 556 17 808
2023 17 646 3 714 5 571 4 412 8 823 18 806
2024 18 196 3 756 5 634 4 549 9 098 19 282
2025 18 764 3 799 5 699 4 691 9 382 19 772
2026 19 349 3 844 5 766 4 837 9 674 20 277
2027 19 952 3 890 5 835 4 988 9 976 20 799
2028 20 574 3 938 5 906 5 143 10 287 21 336
2029 21 215 4 356 6 533 5 304 10 607 22 444
2030 21 876 4 417 6 626 5 469 10 938 23 033
a Based on an estimated annual growth rate of 3.1 per cent used in the PBS RIS. b Includes replacement to old vehicles
(assuming a five year useful life) and new additions to the fleet. c Assumes a cost of $1500 for all new vehicles. d Assumes
annual maintenance costs of $250. e Assumes each B-double spends quarter of a day per year off the road as a direct result of
spray suppression devices at an opportunity cost of $2000 per day.
Source: National Transport Commission (NTC), Performance Based Standards: Draft Regulatory Impact Statement, March
2010, NTC, TheCIE.
The present value of future cost savings associated with removing the requirement to
have a spray suppression device fitted to B-doubles is estimated at around
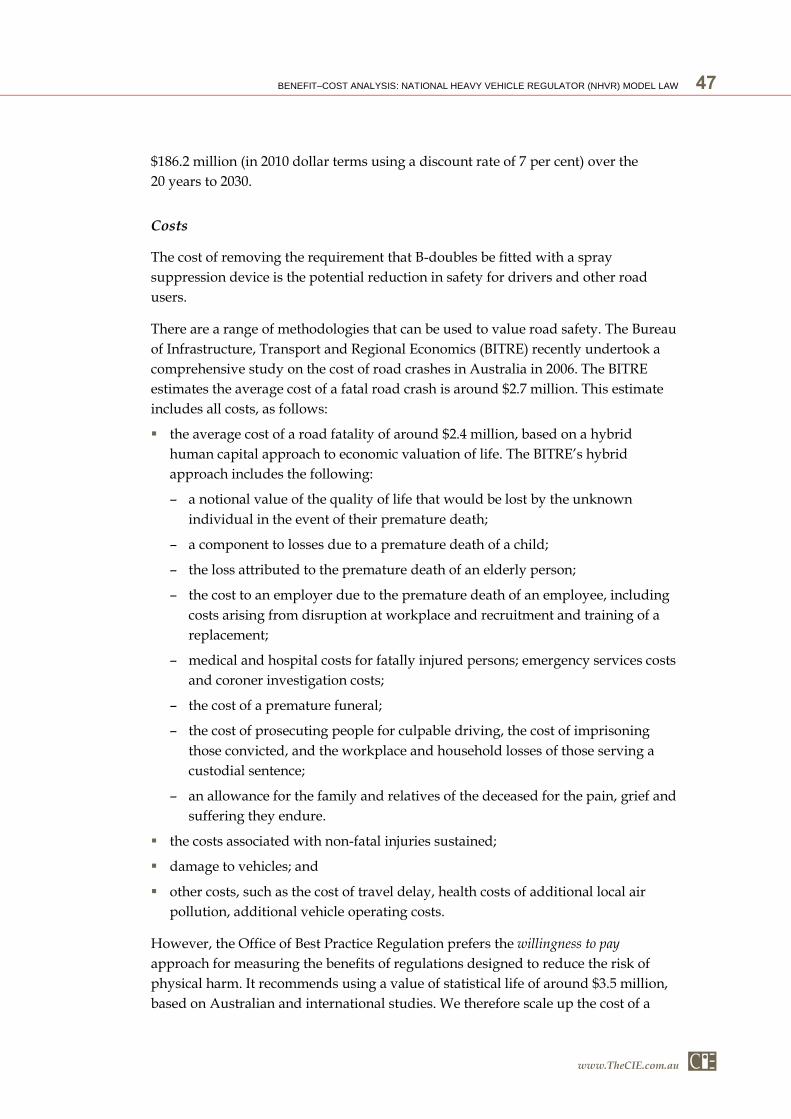
BENEFIT–COST ANALYSIS: NATIONAL HEAVY VEHICLE REGULATOR (NHVR) MODEL LAW 47
www.TheCIE.com.au
$186.2 million (in 2010 dollar terms using a discount rate of 7 per cent) over the
20 years to 2030.
Costs
The cost of removing the requirement that B-doubles be fitted with a spray
suppression device is the potential reduction in safety for drivers and other road
users.
There are a range of methodologies that can be used to value road safety. The Bureau
of Infrastructure, Transport and Regional Economics (BITRE) recently undertook a
comprehensive study on the cost of road crashes in Australia in 2006. The BITRE
estimates the average cost of a fatal road crash is around $2.7 million. This estimate
includes all costs, as follows:
the average cost of a road fatality of around $2.4 million, based on a hybrid
human capital approach to economic valuation of life. The BITRE’s hybrid
approach includes the following:
– a notional value of the quality of life that would be lost by the unknown
individual in the event of their premature death;
– a component to losses due to a premature death of a child;
– the loss attributed to the premature death of an elderly person;
– the cost to an employer due to the premature death of an employee, including
costs arising from disruption at workplace and recruitment and training of a
replacement;
– medical and hospital costs for fatally injured persons; emergency services costs
and coroner investigation costs;
– the cost of a premature funeral;
– the cost of prosecuting people for culpable driving, the cost of imprisoning
those convicted, and the workplace and household losses of those serving a
custodial sentence;
– an allowance for the family and relatives of the deceased for the pain, grief and
suffering they endure.
the costs associated with non-fatal injuries sustained;
damage to vehicles; and
other costs, such as the cost of travel delay, health costs of additional local air
pollution, additional vehicle operating costs.
However, the Office of Best Practice Regulation prefers the willingness to pay
approach for measuring the benefits of regulations designed to reduce the risk of
physical harm. It recommends using a value of statistical life of around $3.5 million,
based on Australian and international studies. We therefore scale up the cost of a
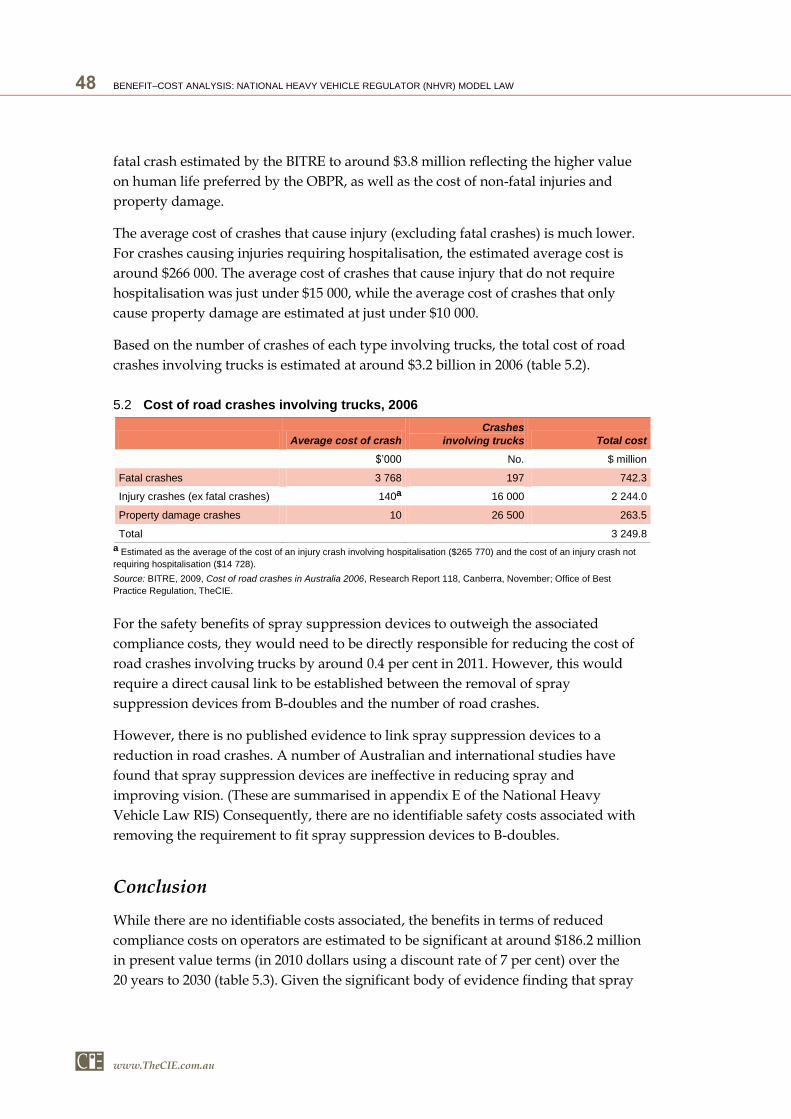
48 BENEFIT–COST ANALYSIS: NATIONAL HEAVY VEHICLE REGULATOR (NHVR) MODEL LAW
www.TheCIE.com.au
fatal crash estimated by the BITRE to around $3.8 million reflecting the higher value
on human life preferred by the OBPR, as well as the cost of non-fatal injuries and
property damage.
The average cost of crashes that cause injury (excluding fatal crashes) is much lower.
For crashes causing injuries requiring hospitalisation, the estimated average cost is
around $266 000. The average cost of crashes that cause injury that do not require
hospitalisation was just under $15 000, while the average cost of crashes that only
cause property damage are estimated at just under $10 000.
Based on the number of crashes of each type involving trucks, the total cost of road
crashes involving trucks is estimated at around $3.2 billion in 2006 (table 5.2).
5.2 Cost of road crashes involving trucks, 2006
Average cost of crash
Crashes
involving trucks Total cost
$’000 No. $ million
Fatal crashes 3 768 197 742.3
Injury crashes (ex fatal crashes) 140a 16 000 2 244.0
Property damage crashes 10 26 500 263.5
Total 3 249.8
a Estimated as the average of the cost of an injury crash involving hospitalisation ($265 770) and the cost of an injury crash not
requiring hospitalisation ($14 728).
Source: BITRE, 2009, Cost of road crashes in Australia 2006, Research Report 118, Canberra, November; Office of Best
Practice Regulation, TheCIE.
For the safety benefits of spray suppression devices to outweigh the associated
compliance costs, they would need to be directly responsible for reducing the cost of
road crashes involving trucks by around 0.4 per cent in 2011. However, this would
require a direct causal link to be established between the removal of spray
suppression devices from B-doubles and the number of road crashes.
However, there is no published evidence to link spray suppression devices to a
reduction in road crashes. A number of Australian and international studies have
found that spray suppression devices are ineffective in reducing spray and
improving vision. (These are summarised in appendix E of the National Heavy
Vehicle Law RIS) Consequently, there are no identifiable safety costs associated with
removing the requirement to fit spray suppression devices to B-doubles.
Conclusion
While there are no identifiable costs associated, the benefits in terms of reduced
compliance costs on operators are estimated to be significant at around $186.2 million
in present value terms (in 2010 dollars using a discount rate of 7 per cent) over the
20 years to 2030 (table 5.3). Given the significant body of evidence finding that spray
BENEFIT–COST ANALYSIS: NATIONAL HEAVY VEHICLE REGULATOR (NHVR) MODEL LAW 49
www.TheCIE.com.au
suppression devices are ineffective, the benefits of the proposed regulatory change
significantly outweigh the costs without compromising safety.
5.3 Summary of benefits (2011 to 2030)
Estimated value
$m
Present value of benefits 186.2
Present value of costs 0.0
Net present value 186.2
Note: Estimates in 2010 dollars using a discount rate of 7 per cent.
Source: TheCIE.

50 BENEFIT–COST ANALYSIS: NATIONAL HEAVY VEHICLE REGULATOR (NHVR) MODEL LAW
www.TheCIE.com.au
6 Inspections
Inspection regimes vary significantly across states. Although the preliminary view of
the expert panel is that there should be no immediate change to the current
arrangements, an obvious alternative is to remove the requirement for annual
inspections. Currently, annual inspections of trucks and trailers are required in New
South Wales, Victoria (buses only), Queensland and the Northern Territory.
The purpose of regular inspections is to ensure the roadworthiness of the vehicle and
therefore improve safety outcomes. However, regular inspections also impose
compliance costs on operators and in some cases enforcement costs on registration
authorities. If these compliance costs outweigh the safety benefits then the States that
require an annual inspection should re-consider this requirement.
The cost of annual inspections
Annual inspections impose compliance costs on operators, as well as enforcement
costs on registration authorities. Compliance costs include:
the direct cost of the inspection; and
the opportunity cost associated with having the vehicle off the road for the
inspection as well as scheduling difficulties caused by the inspection.
The cost of inspections and the method of delivery vary significantly across states.
Inspection costs range from nearly $600 in South Australia (for a full inspection of a
B-double) to around $100 in other states. Inspection may be carried out by a
government inspection officer, or outsourced to private inspectors.
We assume that inspection fees are charged on a cost recovery basis. The inspection
fees are therefore effectively an offsetting transfer from the operator to the inspector.
If annual inspection requirements were relaxed, there may be some longer-term
benefit from the resources used for annual inspections being re-allocated to more
productive uses. However, we ignore these potential benefits, as they are likely to be
small.
More significant are the opportunity costs for operators in terms of revenue foregone
while the vehicle is off the road while it is being inspected. Operators report that the
inspection involves the vehicle being off the road for a full day, suggesting an
opportunity cost of around $2000. However, the opportunity cost can be even higher,
particularly in regional areas. Operators are typically required to book the inspection
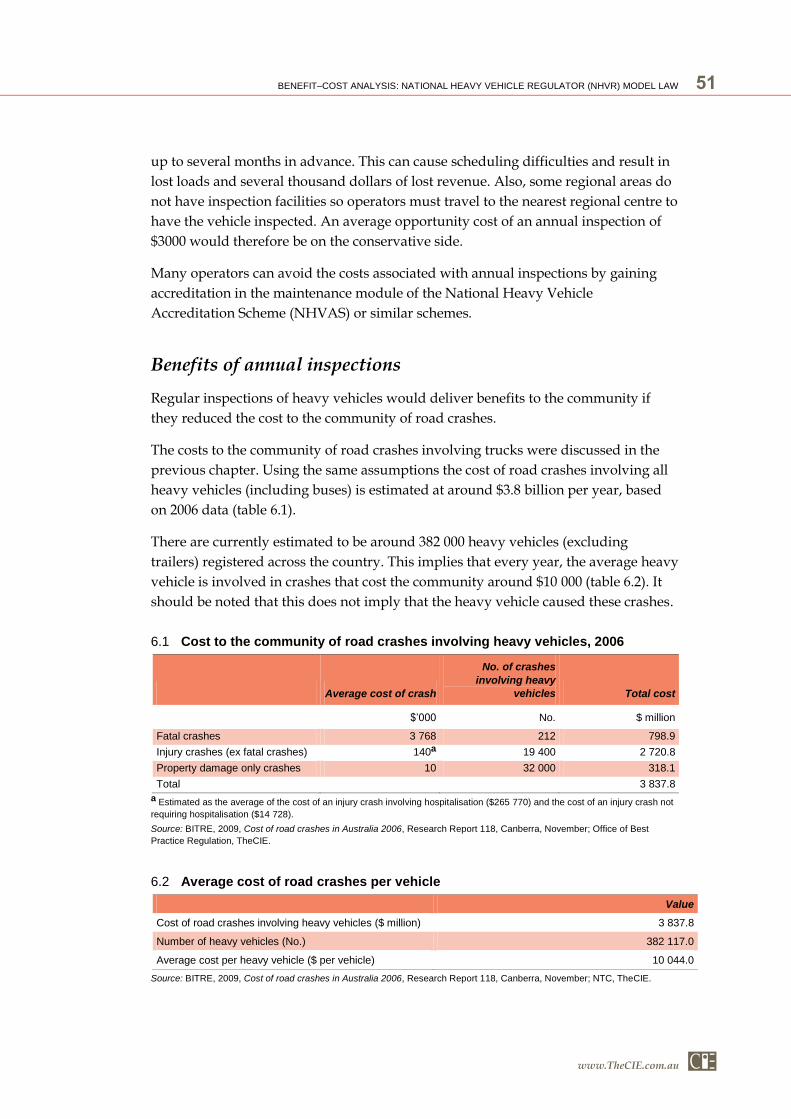
BENEFIT–COST ANALYSIS: NATIONAL HEAVY VEHICLE REGULATOR (NHVR) MODEL LAW 51
www.TheCIE.com.au
up to several months in advance. This can cause scheduling difficulties and result in
lost loads and several thousand dollars of lost revenue. Also, some regional areas do
not have inspection facilities so operators must travel to the nearest regional centre to
have the vehicle inspected. An average opportunity cost of an annual inspection of
$3000 would therefore be on the conservative side.
Many operators can avoid the costs associated with annual inspections by gaining
accreditation in the maintenance module of the National Heavy Vehicle
Accreditation Scheme (NHVAS) or similar schemes.
Benefits of annual inspections
Regular inspections of heavy vehicles would deliver benefits to the community if
they reduced the cost to the community of road crashes.
The costs to the community of road crashes involving trucks were discussed in the
previous chapter. Using the same assumptions the cost of road crashes involving all
heavy vehicles (including buses) is estimated at around $3.8 billion per year, based
on 2006 data (table 6.1).
There are currently estimated to be around 382 000 heavy vehicles (excluding
trailers) registered across the country. This implies that every year, the average heavy
vehicle is involved in crashes that cost the community around $10 000 (table 6.2). It
should be noted that this does not imply that the heavy vehicle caused these crashes.
6.1 Cost to the community of road crashes involving heavy vehicles, 2006
Average cost of crash
No. of crashes
involving heavy
vehicles Total cost
$’000 No. $ million
Fatal crashes 3 768 212 798.9
Injury crashes (ex fatal crashes) 140a 19 400 2 720.8
Property damage only crashes 10 32 000 318.1
Total 3 837.8
a Estimated as the average of the cost of an injury crash involving hospitalisation ($265 770) and the cost of an injury crash not
requiring hospitalisation ($14 728).
Source: BITRE, 2009, Cost of road crashes in Australia 2006, Research Report 118, Canberra, November; Office of Best
Practice Regulation, TheCIE.
6.2 Average cost of road crashes per vehicle
Value
Cost of road crashes involving heavy vehicles ($ million) 3 837.8
Number of heavy vehicles (No.) 382 117.0
Average cost per heavy vehicle ($ per vehicle) 10 044.0
Source: BITRE, 2009, Cost of road crashes in Australia 2006, Research Report 118, Canberra, November; NTC, TheCIE.

52 BENEFIT–COST ANALYSIS: NATIONAL HEAVY VEHICLE REGULATOR (NHVR) MODEL LAW
www.TheCIE.com.au
Based on this analysis, an annual inspection would need to reduce the cost of road
crashes involving each heavy vehicle by around 23 per cent for the benefits to match
the costs.
However, there is no definitively established link between annual inspections of
heavy vehicles and road safety. A recent Austroads study that included both light
and heavy vehicles found that vehicle defects are likely to be the cause of only a
small percentage of crashes, with tyres likely to be the cause of more than 50 per cent
of crashes involving a defective vehicle (Austroads 2010). This finding is consistent
with other studies conducted in Australia and internationally. Austroads used this
evidence to argue that different inspection regimes across states are unlikely to have
any influence on crash causation.
There are a number of reasons why annual inspections may not be effective in
reducing road accidents, including:
heavy vehicle operators already have a strong incentive to keep their vehicles in
good order;
vehicle inspectors may not be able to identify defects;
vehicle inspectors can only identify defects on the day of inspection — many
heavy vehicles travel long distances and therefore require significant ongoing
maintenance throughout the year. An annual inspection may be able to identify
faults only on the particular day it is inspected; but it cannot identify defects that
emerge during the year; and
most heavy vehicles would be inspected at least annually as part of the roadside
inspection regime.
Conclusion
A conservative estimate of the compliance costs associated with annual inspections is
around $3000. This is largely the opportunity cost of revenue foregone from having
the vehicle off the road during the inspection, as well as potential lost loads
associated with scheduling difficulties associated with the inspection.
While the cost to the community of road crashes involving heavy vehicles is large,
there is no evidence linking annual inspections to better road safety outcomes. An
annual inspection regime would need to reduce the cost of road crashes by more
than 20 per cent for the benefits to outweigh the costs. This seems highly unlikely.
The costs of an annual inspection regime are therefore likely to outweigh the
benefits.

BENEFIT–COST ANALYSIS: NATIONAL HEAVY VEHICLE REGULATOR (NHVR) MODEL LAW 53
www.TheCIE.com.au
7 Advanced Fatigue Management ‘outer limits’
The national model law currently specifies outer limits of 16 hours driving in any
24 hour period, for Advanced Fatigue Management (AFM) accredited operators.
However, NSW and Victoria have both specified AFM outer limits of 15 hours in any
24 hour period. It must be noted that Western Australia and the Northern Territory
have their own fatigue management systems and do not operate under the AFM
system as it stands. Previous Regulatory Impact Statements on fatigue have
proceeded on the assumption that WA and the NT would probably continue to
operate their own systems.
Four options have been proposed to reconcile these jurisdictional differences:
1. remove the model clause so that the national law does not specify an outer limit,
but conserve the Victorian and New South Wales outer limit of 15 hours by
administrative means (that is, not approve AFM hours with more than 15 hours
per 24);
2. have the national law specify an outer limit of 15 hours. Extensions to the limit
will be allowable under the aegis of a productivity variation for those jurisdictions
who so require it;
3. adopt the model clause in its current guise (16 hours); or
4. introduce an entirely new approach to AFM as per the Independent Expert
Panel’s recommendations.
Impact of proposed regulatory changes
There are two approaches that can be taken in assessing the likely impact of each
option:
assess the impact of changes to the model law as written; or
assess the actual impact of each option against the status quo, taking into account
existing deviations from the model law and what we know about the likely
response from each state to changes to the model law.
The second approach is more realistic. Under this approach, option 1 or option 2,
would retain the status quo even though a change to the model law is required. NSW
and Victoria would retain the outer limit of 15 hours.

54 BENEFIT–COST ANALYSIS: NATIONAL HEAVY VEHICLE REGULATOR (NHVR) MODEL LAW
www.TheCIE.com.au
Although option 3 represents no change to the model law, it would involve a change
from the status quo, as NSW and Victoria would be required to increase the AFM
outer limits from 15 to 16 hours. Option 4 would also represent a change from the
status quo.
Regardless of the option pursued, changes to AFM outer limits isolated from further
fatigue reform are unlikely to have a significant impact. Currently, very few
operators are AFM accredited. The take-up of AFM was expected to be in the order
of 11 300 drivers in 5500 fleets.10 In fact, only 21 operators have been approved for
AFM to date — not even 1 per cent of the anticipated take up rate.
The Independent Expert Panel identified the following barriers to higher AFM
uptake:
high cost of entry;
uncertainty regarding approvals;
long wait times for decisions;
operators and regulators dissatisfied hence policy variations; and
high safety risk due to inadequate risk management systems.
These barriers to AFM uptake were confirmed by operators. While these
impediments to AFM accreditation remain, uptake is expected to remain very low.
The impact of any changes to AFM outer limits are therefore close to zero.
Option 4, however, is proposing a more fundamental change to the AFM system that
could be expected to increase the uptake of AFM. We therefore have a closer look at
the potential benefits of option 4. We also look at the potential benefits of option 3,
which involves increasing the AFM ‘outer limits’ in NSW and Victoria.
Option 4 — new approach to AFM
The benefits and costs of the fatigue management system, including BFM and AFM
have been examined in previous Regulatory Impact Statements. Although the
previous RIS does not explicitly report the productivity benefits of BFM and AFM
compared to Standard Hours, they are implicitly taken into account in the analysis.
The RIS argued that prior to the implementation of the new fatigue management
system some drivers were exceeding Standard Hours. This excess work would need
to be re-allocated to new drivers, which would impose additional costs on operators.
These additional costs were estimated in the RIS, but were partly mitigated by
assuming that some of the drivers working excess hours would continue to do so
under BFM or AFM. These cost savings for operators are the benefits from moving
10 NTC, Heavy Vehicle Driver Fatigue Final Regulatory Impact Statement, December 2006, p. 103.

BENEFIT–COST ANALYSIS: NATIONAL HEAVY VEHICLE REGULATOR (NHVR) MODEL LAW 55
www.TheCIE.com.au
from Standard Hours to BFM or AFM. We can back out the expected cost savings
from AFM uptake from the analysis in the RIS.
The previous RIS estimated that 116 200 hours per week would need to be re-
allocated to new drivers as a result of the new fatigue management system. Based on
a 72 hour week, this would require 1 614 new drivers (see the first column in
table 7.1). These estimates were based on:
survey evidence that 25 per cent of the 83 000 long-distance drivers worked an
additional four hours per week in excess of Standard Hours;
– 50 per cent of these drivers were expected to use AFM or BFM.
10 per cent of long-distance drivers being affected by the night driving
requirements in the new fatigue management system, such that 12 hours per week
would need to be re-allocated to new drivers.
– 25 per cent of these drivers were expected to use AFM or BFM.
To estimate the potential cost savings for operators as a result of AFM, we recalculate
the number of new drivers required in the absence of BFM or AFM uptake (see the
third column of table 7.1). With no AFM or BFM uptake, operators would need to
employ an additional 2536 drivers as a result of the new fatigue management system.
This implies that operators would need to employ 922 fewer drivers as a result of
AFM and BFM.
7.1 Re-allocated driving hours due to fatigue management requirements
RIS Adjusted No AFM
No. No. No.
Drivers working excess hours
Drivers affected a 20 750 20 750 20 750
Drivers using AFM/BFM 10 375b 9 440c -
Remaining drivers 10 375 11 310 20 750
Hours re-allocatedd 41 500 45 240 83 000
Night driving requirements
Drivers affectede 8 300 8 300 8 300
Drivers using AFM/BFM 2 075f 1 888c -
Remaining drivers 6 225 6 412 8 300
Hours re-allocatedg 74 700 76 944 99 600
Total
Total hours re-allocated 116 200 122 184 182 600
Number of new driversh 1 614 1 697 2 536
a Based on survey evidence that around 25 per cent of the total of 83 000 long distance drivers working excess hours. b Assumes 50 per cent of affected drivers would use AFM or BFM. c Scaled down so that total AFM uptake is 11 328,
consistent with the uptake used to estimate compliance costs elsewhere in the RIS. d Assumes that drivers were working 4
extra hours per week. e Based on 10 per cent of the 83 000 long-distance drivers that would be affected by the night driving
requirements. f Assumes 25 per cent of drivers would use AFM or BFM. g Assumes that drivers were driving 12 hours a week
that would need to be re-allocated. h Assumes a 72 hour week.
Source: NTC, Heavy Vehicle Driver Fatigue: Updated Draft Regulatory Impact Statement, August 2006; TheCIE.
56 BENEFIT–COST ANALYSIS: NATIONAL HEAVY VEHICLE REGULATOR (NHVR) MODEL LAW
www.TheCIE.com.au
However, we are interested in the cost savings as a result of only AFM. The RIS does
not distinguish between BFM and AFM when estimating the cost of employing
additional drivers. The above uptake assumption imply 12 450 drivers would use
BFM or AFM. This contradicts uptake assumptions elsewhere in the RIS; compliance
cost estimates were based on BFM uptake of 13 200 across 5808 fleets and AFM
uptake of 11 328 drivers in 5567 fleets. We therefore adjust the above estimates, such
that 11 328 driver take up AFM (see the second column of table 7.1).
Since AFM offers greater flexibility than BFM, the productivity benefits are
potentially higher. However, most operators gaining AFM accreditation are likely to
have switched from BFM. The productivity benefits of moving from BFM to AFM are
therefore likely to be similar as to moving from Standard Hours to BFM.
To estimate the cost savings, the previous RIS estimates that:
The upfront cost of employing a new driver is $10 000 to cover training, induction,
supervision etc.
The recurrent costs depend on whether the drivers are paid by the hour (or load)
or are salaried:
– the recurrent annual cost to the operator from employing an additional rate-
based driver is estimated at $5000 to cover over-heads (around 75 per cent of
drivers are paid on a rate basis); and
– the recurrent annual cost to the operator from employing an additional
salaried driver is $44 832 made up of $39 832 in salary (based on the Transport
Workers (Long Distance) Award 2000) and $5 000 in overheads (around 25 per
cent of drivers are salaried).
Based on these assumptions, the potential cost savings from AFM were estimated at
around $8.4 million in upfront costs and $12.6 million in recurrent costs (table 7.2). In
net present value terms, the potential cost savings are estimated at around
$150.7 million over 20 years (using a discount rate of 7 per cent). This excludes any
additional AFM compliance costs.
However, these potential benefits envisaged in the previous RIS have not been
realised. Only 21 operators have gained AFM accreditation to date, well short of the
5500 uptake estimated in the RIS. This suggests that the costs associated with AFM
accreditation exceed the benefits for most operators.
It is difficult to robustly predict the costs that the new AFM system as recommended
by the expert panel will incur as it remains in the developmental stages. Once
operational details have been finalised the new system will need to be subject to a
separate RIS.
Nonetheless, on the basis of what is known at the moment, indicative costs of the
new system are as follows (table 7.3).

BENEFIT–COST ANALYSIS: NATIONAL HEAVY VEHICLE REGULATOR (NHVR) MODEL LAW 57
www.TheCIE.com.au
7.2 Potential cost savings from AFM
Rate-based driversa Salaried driversb Total
AFM uptake from RIS (adjusted)
New drivers (No.) 1273 424 1 697
Upfront costs ($m)c 12.7 4.2 17.0
Recurrent costs ($m) 6.4d 19.0e 25.4
No AFM uptake
New drivers (No.) 1,902 634 2,536
Upfront costs ($m) 19.0 6.3 25.4
Recurrent costs ($m) 9.5 28.4 37.9
Cost savings from AFM
Upfront costs ($m) 8.4
Recurrent costs ($m) 12.6
Total cost saving ($m NPV)f 150.7
a Around 75 per cent of drivers are paid on a rate basis. b Around 25 per cent of drivers are paid a set salary. c The upfront cost
of hiring a new driver is estimated at $10 000 to cover training, induction, supervision etc. d The recurrent annual cost for each
additional rate-based driver is estimated at $5 000 for overheads. e The recurrent annual cost of each additional salaried driver
is estimated at $44 832, including $39 832 in salary (based on the Transport Workers (Long Distance) Award 2000 plus $5 000
for overheads. f Net present value over a 20 year period, using a discount rate of 7 per cent.
Source: NTC, Heavy Vehicle Driver Fatigue: Updated Draft Regulatory Impact Statement, August 2006; TheCIE.
7.3 New fatigue system — approximate costs
New fatigue system Cost
$
Development and implementation
Fatigue experts to develop templates & other materials 10 000
Review of NHVAS (Fatigue) standards, Accreditation Guides & Business Rules to ensure
consistency with new approach 64 000
Review of units of competence to ensure consistency with new approach 250 000
Selection and constitution of FEG (administration, correspondence etc) 10 000
Reconstitution of Accrediting Bodies through the NHVR 10 000
Advice and communication to industry stakeholders including Guidelines, industry forum etc 50 000
Advice and communication to other stakeholders (registered fatigue experts, Fatigue Authorities
Panel etc) 20 000
Research and development of RIS 114 000
Total development and implementation costs 558 000
Recurrent (per annum)
Jurisdictional costs 30 000
FEG fatigue expert costs 16 000
Template update and library expansion 10 000
Total recurrent costs 56 000
Total
Net present valuea 1 136 793
a Over 20 years using a discount rate of 7 per cent.
Source: NTC.

58 BENEFIT–COST ANALYSIS: NATIONAL HEAVY VEHICLE REGULATOR (NHVR) MODEL LAW
www.TheCIE.com.au
Option 3 — increasing the AFM outer limits in NSW and Victoria
While the impact of option 3 will be close to zero due to the very low uptake of AFM,
we examine the potential costs and benefits of increasing the AFM outer limits in
NSW and Victoria.
Potential costs
As detailed in previous chapters, road crashes can impose significant costs on the
community. Estimates of the average cost of different types of road crashes are
shown in table 7.4.
The risk of a crash increases significantly after 12 hours and is likely to continue
increasing significantly for every hour driven thereafter. On the face of it, there may
be significant safety costs involved in increasing the outer limits from 15 to 16 hours.
However, it is unlikely that increasing the outer limits from 15 hours to 16 hours will
compromise safety to any significant extent because AFM accredited operators will
be required to develop systems that do not increase the risk of accident above
standard hours.
7.4 Average cost of road crashes
Average cost
$’000
Fatal crash 3 768
Injury crash involving hospitalisation (excluding fatal crashes) 266
Injury crash not involving hospitalisation (excluding fatal crashes 15
Non-injury crash 10
Source: BITRE, 2009, Cost of road crashes in Australia 2006, Research Report 118, Canberra, November; Office of Best
Practice Regulation, TheCIE.
A simple example of a situation where reducing the outer limit from 16 to 15 hours is
unlikely to have a safety benefit is shown in box 7.5. This is just one example of
where less restrictive outer limits have no obvious cost in terms of safety outcomes.
Potential benefits
There are potentially benefits in terms of reduced compliance costs for operators and
drivers associated with increasing AFM outer limits from 15 hours to 16 hours within
any 24 hours period. Less restrictive outer limits may increase productivity.
In the simple example shown in box 7.5, the driver would be required to take a
further one hour break, just an hour from the destination in order to comply with a
15 hour outer limit. However, under the less restrictive 16 hour outer limit, the driver
would be able to complete the return trip. This would mean the return trip would
take nine rather than eight hours, representing a 12.5 per cent improvement in the
productivity of labour and capital.

BENEFIT–COST ANALYSIS: NATIONAL HEAVY VEHICLE REGULATOR (NHVR) MODEL LAW 59
www.TheCIE.com.au
7.5 Example of where the benefits of increasing AFM outer limits exceed the cost
A simple example of a situation where increasing the outer limits from 15 hours to
16 hours reduces compliance costs for operators with little to no cost in terms of
reduced safety is:
a driver completes an eight hour trip;
he then sleeps for eight hours; and
he then wants to complete the return journey.
Under the 15 hour limit, the driver would be unable to complete the journey.
Within an hour from home, he would be required to rest for an hour, before
completing the journey, in order to comply with the 15 hour limit. However,
under a 16 hour outer limit, the driver would be able to complete the return
journey, assuming no delays.
Given the driver is fully rested after eight hours sleep when he commences the
return journey, the risk of being involved in a road crash would increase only
after 12 hours (assuming no other risk mitigation measures are taken), not seven
or eight. In these circumstances there would appear to be no safety benefit in
forcing the driver to take a break during the return journey.
Also, under a 16 hour outer limit, the return journey would take eight rather than
nine hours. This represents a 12.5 per cent increase in the productivity of labour
and capital on the return journey.
Conclusions
Since there are very few operators with AFM accreditation, the benefits and costs of
changes to outer limits will be close to zero, while other impediments to AFM
accreditation remain in place.
Options 1 and 2 effectively preserve the status quo, even though they require
amendments to the model law. There would therefore be no costs or benefits
associated with these changes.
Although option 3 requires no change to the model law, it would effectively require
NSW and Victoria to increase AFM outer limits from 15 to 16 hours. If there was
greater uptake of AFM, this could potentially have some costs and benefits.
The costs in terms of reduced road safety may not be significant, since AFM-
accredited operators would be required to take steps to reduce the risk of road
crash in order to access the outer limits.
In some specific circumstances, there are also likely to be significant productivity
benefits from increasing the outer limits to 16 hours. However, since few

60 BENEFIT–COST ANALYSIS: NATIONAL HEAVY VEHICLE REGULATOR (NHVR) MODEL LAW
www.TheCIE.com.au
operators are currently AFM accredited, it is not possible to tell how frequently
these circumstances would arise. Since operators are not allowed to schedule to
outer limits it may be relatively infrequently.
Option 4, however, represents a significant change to the status quo.
AFM has the potential to deliver benefits; but it is not currently doing so because
of impediments to entry.
Addressing these impediments could result in greater uptake and therefore have
a net benefit to the community.
A thorough overhaul of the AFM/BFM to enhance its workability and
effectiveness might be attractive enough for consideration by WA and the
Northern Territory thereby delivering a truly national system.
– The cost of such an overhaul is expected to be modest.
Since all indications are that the AFM system has failed to deliver the uptake rate and
therefore the benefits that were predicted, the evidence available at this stage tends
to support option 4.
BENEFIT–COST ANALYSIS: NATIONAL HEAVY VEHICLE REGULATOR (NHVR) MODEL LAW 61
www.TheCIE.com.au
8 Unpaid fines
Most jurisdictions currently impose registration sanctions for unpaid fines that may
be unrelated to heavy vehicle operation. When heavy vehicle registration
responsibilities transfer to the National Heavy Vehicle Regulator (NHVR), the NTC
has proposed two options:
under the first option, the NHVR would be directed to impose a sanction by the
relevant jurisdiction. The Regulator would then advise the customer of the
sanction but direct them to the relevant agency in order to resolve or contest the
sanction; and
under the second option all reference to registration sanctions — even if it relates
to the operation of the vehicle — is removed from the national law.
Impacts
We use the second option as the base line against which we assess the impacts of the
first. The first option is likely to result in higher administration costs, but it is also
likely to encourage heavy vehicle operators to settle outstanding fines compared to
the second option.
Potential costs
Once heavy vehicle registration responsibilities are transferred to the national
regulator, imposing sanctions for unpaid fines will become more administratively
difficult. The relevant jurisdictional agency would direct the national regulator to
impose a sanction on the operator. The national regulator would then advise the
customer of the sanction and direct them to the relevant agency to resolve or contest
the sanction.
An important issue to consider is whether involving a national body in state fines
enforcement, unrelated to the operation of heavy vehicles, would undermine its
authority, integrity and independence. The potentially large benefits of a national
regulator could be significantly eroded if the regulator is loaded up with roles and
functions that distract it from its objective.
There will also be occasions where the registration of a heavy vehicle is delayed, due
to an outstanding fine. The opportunity cost of a one day delay in the registration
process is potentially around $2000 for larger trucks. This delay not only imposes a

62 BENEFIT–COST ANALYSIS: NATIONAL HEAVY VEHICLE REGULATOR (NHVR) MODEL LAW
www.TheCIE.com.au
significant cost on the operator, it also has down-stream costs for the community.
Delays in registering a vehicle temporarily reduce the nation’s freight moving
capacity. This could delay the movement of freight. The cost of delay could be
significant for customers.
Potential benefits
Although registration sanctions are likely to encourage heavy vehicle operators to
settle outstanding fines, this is not necessarily a benefit to the community. Rather, it
is simply a transfer from the operator to the government.
Fines are normally imposed as a deterrent for offences that impose a cost on the
community. Since the offence to which the fine relates has already been committed,
the potential benefit to the community lies in the extent to which the registration
sanction deters the operator from committing an offence in the future. The link
between heavy vehicle registration sanctions and a reduction in the number of
offences committed is unknown.
Conclusions
The practice of imposing registration sanction on operators with unpaid fines
appears to have costs and potentially some benefits.
The administration costs are likely to increase once heavy vehicle registration
responsibilities are transferred to the National Heavy Vehicle Regulator.
This will add an additional administration procedure to the registration process,
which will add to costs and potentially delay registration.
Where the operator has an unpaid fine, the registration sanction not only imposes
costs on the operator, but on the wider community by temporarily reducing the
nation’s freight moving capacity.
It is not clear whether registration sanctions deter operators from committing an
offence in the future.
Registration sanctions may act as a deterrent for heavy vehicle-related offences;
however, the link seems somewhat tenuous for unrelated offences.
It is therefore questionable that the benefits of linking registration sanctions to
unpaid fines for offences unrelated to the operation of the vehicle exceed the cost.
BENEFIT–COST ANALYSIS: NATIONAL HEAVY VEHICLE REGULATOR (NHVR) MODEL LAW 63
www.TheCIE.com.au
9 Summing up
Both top-down and bottom-up approaches have been used in this study to assess the
benefits and costs of 368 consolidations in national heavy vehicle model laws.
Both exercises point toward very large economic benefits being derived from
harmonising currently fragmented regulatory arrangements. Net gains range from
$6.9 billion to as high as $30 billion in net present value terms over the next 20 years.
These numbers align with benefit to cost ratios ranging from 6.3 to 1 to 24.0 to 1.
While large, these results are consistent with findings from other studies including
those of the Productivity Commission (2006).
Top-down results
The top-down approach involved an attribution exercise attempting to pull together
a consistent picture of economic gains by main areas of regulatory change and types
of economic benefits based on findings of previous studies. The findings indicate that
there is big potential for net economic benefits from harmonising currently
fragmented regulation. It also showed that most of the gains (70 per cent) are likely
to come from around 10 per cent of the regulatory changes. The other 90 per cent of
proposed changes are of a relatively minor technical nature. The benefits include:
achieving economies of scale and scope in compliance, administration and
enforcement; and
productivity gains in transport likely to arise from harmonising regulation and
moving to better and best practices.
The top-down exercise suggests that in aggregate nearly a third (30 per cent) of the
economic gains from establishing effective national laws could be attributed to the
relatively minor but many (334) changes (90 per cent).
The other 34 changes (34 of 368, 10 per cent) are required to open the way more
directly to achieving substantial productivity gains in the freight task. Based on the
attribution exercise about half of these (17) were thought to contribute most of the
remaining 70 per cent of the expected net benefit. Some of these changes were
examined more closely in a bottom-up exercise to help verify the top-down results.

64 BENEFIT–COST ANALYSIS: NATIONAL HEAVY VEHICLE REGULATOR (NHVR) MODEL LAW
www.TheCIE.com.au
Bottom-up results
The top-down exercise suggested that among the greatest areas of potential gain
involve more robust decision making frameworks that promote consistency in the
application of nationally agreed decisions, are transparent and based on technically
defensible information . The bottom-up detailed analysis of this confirms that, and it
suggests:
potential productivity gains of between 10 and 45 per cent are possible where
larger, more efficient vehicles are used in place of less efficient ones;
potential exists for these productivity gains to apply to 30 per cent of the freight
task;
effective average labour and capital productivity gains of up to 10 per cent and
productivity gains about half this level might be possible for fuel and other
inputs.
If achieved, such boosts in productivity could provide increases in national GDP (or
equivalent variation) of up to $2.0 billion a year and in net present value terms over
the next 20 years gains of between $7.8 billion and $30 billion. The extent to which
these potential benefits are realised will depend on the effectiveness of the decision
making frameworks.
At one extreme, closer consideration of all the economic factors affecting access
that also leads to greater access to evaluative expertise and infrastructure funding
could encourage road managers to take full account of the productivity benefits
for heavy vehicle operators.
At the other extreme, road managers could pay lip service to the internal review
process but may be reluctant to risk infrastructure degradation or reductions in
public amenity, which would result in no better road access.
Among the remaining 34 changes four others were examined. These have identifiable
and, in some cases, measurable impacts over and above the benefits associated with
greater harmonisation across jurisdictions. These relate to the following.
Spray suppression.
Regular annual inspections.
Advanced Fatigue Management ‘outer limits’.
Unpaid fines.
For the first three of these it was found that net benefits are expected from each
although these were small relative to those from improved decision making
frameworks. However, while small each was found to be important in underpinning
the integrity, authority and effectiveness of the laws. However, in the case of unpaid
fines that are unrelated to the operation of the vehicle, no case could be found for this
contributing to the effectiveness of the Regulator, the law or transport policy. Indeed,

BENEFIT–COST ANALYSIS: NATIONAL HEAVY VEHICLE REGULATOR (NHVR) MODEL LAW 65
www.TheCIE.com.au
having to deal with unpaid fines, unrelated to heavy vehicle regulation, would be a
major distraction to the efficient and effective functioning of the Regulator.
Key uncertainties and questions
Although the results here are consistent with the findings of many previous studies,
uncertainties surround particular parameters and data. For the purposes of the
consultation RIS, it would be appropriate to seek stakeholder feedback on the
following questions.
Are the productivity gains and uptake rates used in chapter 4 reasonable?
– If not, why not and is there better data available?
– Are they inconsistent with previous studies and, if so, how?
Are the scenarios used in chapter 4 reasonable?
– If not, why not?
– Do they cover the plausible range of effectiveness that might be achieved?
Are the benefits and costs presented in chapters 5 to 8 realistic and, if not, why
not?

66 BENEFIT–COST ANALYSIS: NATIONAL HEAVY VEHICLE REGULATOR (NHVR) MODEL LAW
www.TheCIE.com.au
References
Australian Bureau of Statistics 2009, Motor Vehicle Census, 9309.0, 31 March.
Australian Logistics Council 2009, The cost impact of regulation disparity in cross border regions,
(New South Wales, South Australia and Victoria).
ATA and Barkwood Consulting 2010, Australian Trucking Association Truck Impact, June.
Bureau of Infrastructure, Transport and Regional Economics 2009, Cost of road crashes in
Australia 2006, Research Report 118, Canberra, November.
Castalia Strategic Advisers 2009, Securing a National Approach to Heavy Vehicle Regulation,
Report to the National Road Transport Operators Association (NatRoad).
Department of Infrastructure, Transport, Regional Development and Local Government 2009,
A National Framework for Regulation, Registration and Licensing of Heavy Vehicles, Regulatory
Impact Statement, May.
Narayanan, G. Badri and Terrie L. Walmsley (Ed), 2008, Global Trade, Assistance, and
Production: The GTAP 7 Data Base, Centre for Global Trade Analysis, Purdue University.
National Transport Council 2010, Performance Based Standards, Draft Regulatory Impact
Statement, March.
——2006, Review of Heavy Vehicle Mass and Loading, Oversize and Overmass, and Restricted Access
Regulations, May.
——2006, Heavy Vehicle Driver Fatigue: Updated Draft Regulatory Impact Statement, August
2006
— 2002, Heavy Vehicle Driver Fatigue Review of Regulatory Approach, Draft Regulatory Impact
Statement, September.
——1998, Regulatory Impact Statement: Increased Mass Limits for Road-Friendly Heavy Vehicles,
April.
Productivity Commission 2006, Road and Rail Freight Infrastructure Pricing, Productivity
Commission Inquiry Report No. 41, 22 December, p. 307.
——Road and Rail Freight Infrastructure Pricing, Productivity Commission Inquiry Report No. 41,
22 December, p. G22.
——Road and Rail Freight Infrastructure Pricing, Productivity Commission Inquiry Report No. 41,
22 December, p. G26.

A p p e n d i x


BENEFIT–COST ANALYSIS: NATIONAL HEAVY VEHICLE REGULATOR (NHVR) MODEL LAW 69
www.TheCIE.com.au
A GTAP modelling
This appendix presents the simulation results of the Global Trade Analysis Project
(GTAP) model, a general equilibrium model of the global economy.
The GTAP model has two important components, a mathematic equation system
describing the economic linkage between countries, between sectors, and between
economic agents, and a database containing information of these relations and
linkages. The latest GTAP database is Version 7, which identifies 113 countries or
country groups and 57 sectors. This database represents the world economy in 2004.
The transport sector
For the purpose of this study we aggregated the countries into Australia and rest of
the world while keeping the full details of 57 sectors. The sector of interest to this
study is the other transport sector, which includes land transport, transport via
pipelines, supporting and auxiliary transport activities, and activities of travel
agencies (Narayanan and Walmsley 2008). Trucking is about 64 per cent of the sector
identified in the GTAP model. Heavy vehicle is about 80 per cent of the trucking. The
cost shares of labour, capital and other inputs of the sector are 28.8 per cent, 17 per
cent and 54.2 per cent, respectively.
Simulations
Three simulations were carried out to model one per cent productivity improvement
in labour, capital and other inputs in the other transport sector using the GTAP
model.
The standard closure was used in implementing the simulations. Namely, the total
endowments of labour, capital and natural resources in Australia and the rest of the
world are fixed. However, their use in specific sectors is not fixed, and is determined
by the model according to the profitability of these sectors.
Results
It is revealed that the one per cent productivity improvement in labour, capital and
other inputs in the other transport sector would lead to 0.021, 0.013 and 0.034 per
cent increase in Australia’s real GDP, respectively. Given the share of the trucking in
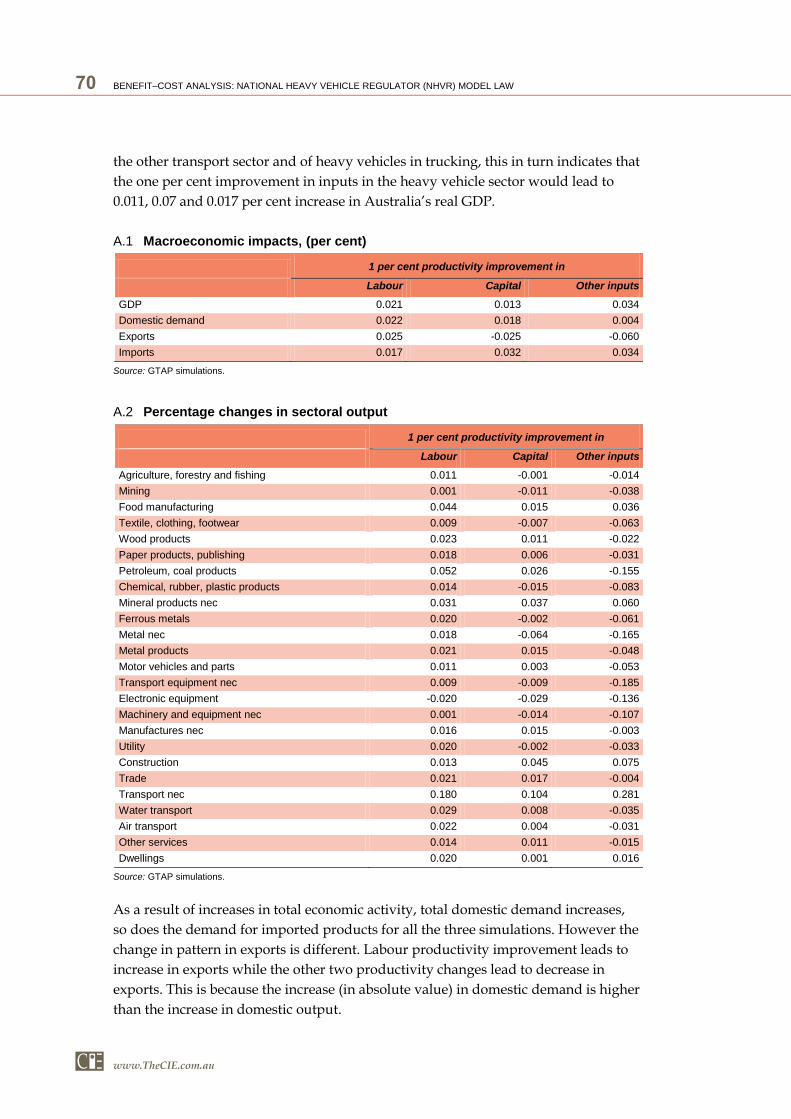
70 BENEFIT–COST ANALYSIS: NATIONAL HEAVY VEHICLE REGULATOR (NHVR) MODEL LAW
www.TheCIE.com.au
the other transport sector and of heavy vehicles in trucking, this in turn indicates that
the one per cent improvement in inputs in the heavy vehicle sector would lead to
0.011, 0.07 and 0.017 per cent increase in Australia’s real GDP.
A.1 Macroeconomic impacts, (per cent)
1 per cent productivity improvement in
Labour Capital Other inputs
GDP 0.021 0.013 0.034
Domestic demand 0.022 0.018 0.004
Exports 0.025 -0.025 -0.060
Imports 0.017 0.032 0.034
Source: GTAP simulations.
A.2 Percentage changes in sectoral output
1 per cent productivity improvement in
Labour Capital Other inputs
Agriculture, forestry and fishing 0.011 -0.001 -0.014
Mining 0.001 -0.011 -0.038
Food manufacturing 0.044 0.015 0.036
Textile, clothing, footwear 0.009 -0.007 -0.063
Wood products 0.023 0.011 -0.022
Paper products, publishing 0.018 0.006 -0.031
Petroleum, coal products 0.052 0.026 -0.155
Chemical, rubber, plastic products 0.014 -0.015 -0.083
Mineral products nec 0.031 0.037 0.060
Ferrous metals 0.020 -0.002 -0.061
Metal nec 0.018 -0.064 -0.165
Metal products 0.021 0.015 -0.048
Motor vehicles and parts 0.011 0.003 -0.053
Transport equipment nec 0.009 -0.009 -0.185
Electronic equipment -0.020 -0.029 -0.136
Machinery and equipment nec 0.001 -0.014 -0.107
Manufactures nec 0.016 0.015 -0.003
Utility 0.020 -0.002 -0.033
Construction 0.013 0.045 0.075
Trade 0.021 0.017 -0.004
Transport nec 0.180 0.104 0.281
Water transport 0.029 0.008 -0.035
Air transport 0.022 0.004 -0.031
Other services 0.014 0.011 -0.015
Dwellings 0.020 0.001 0.016
Source: GTAP simulations.
As a result of increases in total economic activity, total domestic demand increases,
so does the demand for imported products for all the three simulations. However the
change in pattern in exports is different. Labour productivity improvement leads to
increase in exports while the other two productivity changes lead to decrease in
exports. This is because the increase (in absolute value) in domestic demand is higher
than the increase in domestic output.
BENEFIT–COST ANALYSIS: NATIONAL HEAVY VEHICLE REGULATOR (NHVR) MODEL LAW 71
www.TheCIE.com.au
Table A.2 reports the percentage changes in sectoral outputs of the three simulations.
Some of the sectors are aggregated to save space. The increase in the other transport
activity is the most significant. Its output would increase by 0.18, 0.1 and 0.28 per
cent, respectively.
The impact on other sectors is determined by the relative importance of these sectors
to the other transport sector. For example, over 20 per cent of other inputs to the
other transport sector is petroleum products, as a result, the demand for the product
by the transport sector would dominate the impact. With higher labour and capital
productivity, the increase in petroleum products sector is the second largest among
sectors. On the other hand, with the input efficiency for other inputs to the transport
sector rising by 1 per cent, the demand for petroleum products would fall, and so
does its output.

72 BENEFIT–COST ANALYSIS: NATIONAL HEAVY VEHICLE REGULATOR (NHVR) MODEL LAW
www.TheCIE.com.au
B Assumptions
Chapters 2 and 3
The reasonable consistency in net gains among previous studies and the
apparently uncontroversial nature of findings provide a strong degree of
confidence about the nature and size of the problem being assessed in this RIS.
Estimates of benefits and costs in previous reports can be decomposed into main
types of economic impact by main area of regulatory control in a reasonably
consistent manner. This provides an indication of the distribution of net gains
across the 368 divergences from the model law under review in this RIS. The
estimates also provide an indication of the nature of the problem.
The matrix framework is assumed to provide reasonable discipline to attributing
net gains to areas of regulatory change given:
– its required row and column adding up and cross checks
– the ordinal and cardinal ranking routines followed to cross check NTC
judgements about relative gains;
– the relatively high number of unambiguously blank cells.
Estimates are not precise but indicative and a reasonable summary of the
evidence generated in previous studies.
Chapter 4
Incentives for decision makers allowing road access for heavy vehicles favours
‘protect and preserve’ outcomes over economically optimal ‘use, extend and
replace’ outcomes.
Better access decision making frameworks that promote greater transparency and
review are likely to lead to improved access that enhances road transport
productivity and provides other economic gains.
Access problems for PBS vehicles are a sub-set of the wider access problems
confronting RAVs.
The previous PBS RIS (NTC 2010) provides an indication of the types of economic
gains possible and the approach adopted provides a good template for measuring
the wider gains from a better road access decision framework.
BENEFIT–COST ANALYSIS: NATIONAL HEAVY VEHICLE REGULATOR (NHVR) MODEL LAW 73
www.TheCIE.com.au
The key parameters affecting the payoffs from better access relate to the greater
productivity of currently (generally larger) restricted access vehicles compared
with (generally smaller) general access vehicles, the share of the freight task that
would benefits and the likely uptake rate.
– The third parameter is likely to be positively related to the first two
parameters.
– Comparisons of the technical productivity of various types of heavy vehicles
provide reasonably accurate indications of the labour, capital and variable
input use productivity gains possible from substituting a high productivity
vehicle for a low productivity vehicle and these gains range from 25 to 45 per
cent.
– Applicability and uptake rates based on interviews with transport operators
for the previous PBS RIS are representative but have been conservatively
interpreted and applied.
– Applicability and uptake rates based on interviews with transport operators
for this RIS are representative but have been conservatively interpreted and
applied.
– Overall estimates of productivity gains for the Australian heavy vehicle freight
task of around 8 per cent for labour and capital and 4 per cent for variable
inputs (fuel) from a better access framework are conservative relative to similar
productivity gains discussed by the Productivity Commission (2006) of up to
16 per cent.
Road safety and reduced carbon emissions arising from fewer kilometres travelled
are assumed to be proportional to those estimated in the PBS RIS (NTC 2010).
Benefits are assumed to phase in slowly over time under three scenarios and are
estimated on an NPV basis over 20 years using a 7 per cent discount rate and a
growth in freight rate of 3 per cent a year to capture economic growth.
Administrative and additional infrastructure costs are estimated assuming a
‘worse case’ scenario over 20 years on an NPV basis using a discount rate of 7 per
cent. Assuming a ‘worse case’ scenario adds to the conservative nature of the
benefit cost analysis.
Chapter 5
A range of studies show that spray suppression devices built to the current
standard have no safety benefits.
The requirement to fit spray suppression devices to B-doubles, however, imposes
compliance costs on operators.
Based on consultation with operators the estimated compliance costs are as
follows:

74 BENEFIT–COST ANALYSIS: NATIONAL HEAVY VEHICLE REGULATOR (NHVR) MODEL LAW
www.TheCIE.com.au
– the initial upfront cost of the spray suppression devices are estimated at $1500
per vehicles;
– the ongoing direct maintenance cost is estimated at $250 per year;
– each vehicle is off the road for an additional quarter of a day per year as a
result of the spray suppression device; and
– the opportunity cost of having the vehicle off the road is estimated at $2000 per
day.
The B-double fleet is expected to grow by 3.1 per cent per year.
The average life of a B-double is five years.
Chapter 6
The opportunity cost for operators of annual inspections is estimated at around
$3000 per vehicle.
On average, each heavy vehicle is estimated to be involved in road crashes that
impose costs on the community of around $10 000.
Chapter 7
Give the low uptake, the impact of changes to AFM outer limits are likely to be
close to zero.
The previous RIS identified potential cost savings for operators from AFM uptake.
– The previous RIS estimated around 11 328 drivers would use AFM.
– This implies that operators would need to employ 839 fewer drivers to perform
the same freight task.
75 per cent of these drivers were assumed to be paid by the hour (or load).
The remaining 25 per cent of drivers were assumed to be salaried.
– The upfront cost of hiring a new driver was estimated at $10 000 to cover
training, induction, supervision etc.
– The recurrent annual cost of each additional rate-based driver is estimated at
$5000 for overheads
– The recurrent annual cost of each additional salaried driver is estimated at
$44 832, comprising a salary of $39 832 (based on the Transport Workers (Long
Distance) Award 2000) and $5000 to cover overheads.
The costs of overhauling the AFM system are only indicative, but are expected to
be modest.


![BIOLOGY 9648 / 02 - Papers · 5 . 9648 H2 Biology / Preliminary Exam / Paper 2 (iii) account for your answer in (a)(ii). [3] The movement of chromatids is dependent on spindle fibres,](https://img.pdfslide.us/doc/110x75/5e66f2655393b461541909fe/biology-9648-02-5-9648-h2-biology-preliminary-exam-paper-2-iii-account.jpg)