Embed Size (px)
Citation preview

ATI/RES
Beneficial Effects ofImplementing an AnnonncedRestanrant Inspection Program
Abstract Announced inspections are being incorporated into res-taurant inspection programs lo snpport active managerial
control; however, their effectiveness is unknown. The study reported here examined theresults of 1,314 inspections conducted from Jnne 2001 through August 2003 in Minne-apolis, Minnesota. Of these, 343 were routine inspections that preceded and 157 wereroutine inspections that followed an announced inspection, and 501 were routine inspec-tions of restaurants that did not undergo an announced inspection. Significant reductionsin frequenq' of citations for critical violations in two food safety categories—1) the per-son-in-charge demonstrates knowledge of foodhorne-disease prevention and 2) preventionof cross-contamination—were seen in establishments that had undergone an announcedinspection (relative risk |RR| of 07 , p = .007, and RR of 0.4, p = .001, respectively). Thefrequency of citation for these critical violations did not decline in establishments thatdid not undergo an announced inspection. Announced inspections appear to be effectivein supporting active managerial control and represent a promising approach to improvingfood safety in restaurants.
IntroductionRes tail ran I-acquired foodborne illness is amajor public health concern. In 1999, Meadand co-authors estimated that infections withknown foodborne pathogens caused 55,512hospitalizations and 1,809 deaths each year(Mead et al., 1999), National surveillancefrom 1993 to 1997 ideniified more outbreaksassociated with restaurants, delicatessens,and cafeterias than with any other sources(Oisen, MacKinnon. Goulding, Bean, &rSlutsker, 2000),
Routine restaurant inspections performedby local or state environmental health spe-
cialists have traditionally served as a primaryregulatory strategy to prevent restaurant-as-sociated foodborne illnesses. Research on theeffectiveness of traditional inspections is in-conclusive, however. Restaurant inspectionresults were found to predict the likelihoodof small foodborne-illness outbreaks in Se-attle-King County (lrwin. Ballard. Grendon,& Kobayyashi, 1989). In addition, lowerinspection scores were one of several fac-tors significantly associated with the occur-rence of foodborne incidents investigated inLos Angeles County (Buchholz, Run, Kool,Fielding, & Mascola, 2002).
Kimberly A. Reske, M.P.H.Timothy Jenkins, R.S.,M.P.H.
Curt FernandtvDavid VanAmber
Craig W.HedbcTg, Ph.D.
Otber studies, however, have not been ableto duplicate these results. Routine restaurantinspections did not predict the occurrence offoodbome-disease outbreaks in Miami-DadeCounty, Florida (Cruz, Katz, & Suarez, 2001),The inspeciion process could not distinguishtwo restaurants that had recently experiencedSalmonella cntaitidis outbreaks from similarrestaurants that had not experienced outbreaks(Mullen, Cowden, Cowden, & Wong, 2002),Of tbe 15 violations cited most frequently in167,574 restaurant inspections conducted inTennessee from 1993 through 2000, only onewas a critical violation (|ones, Pavlin, LaFleur,Tngram, & Schaffner, 2004), The authors ofthat study concluded that inspection scoresalone might not be a good indicator of restau-rant sanitation or a predictor of foodborne-disease outbreaks. The Alabama Departmentof Public Health investigated an outbreak offoodbome illness associated with a restaurantthat had passed four inspections; one of theseinspections bad been performed two days be-fore the outbreak occurred (Penman, Webb,Woemle, & Currier, 1996),
Concerns about the effectiveness of lhe tra-ditional inspection paradigtn have led to vari-ous changes in the process. Food handler ed-ucation, food safety certification, and increas-ing inspection Irequency are three strategiescommonly promoted to improve sanitationin restaurants (Bader, Blonder, Henriksen, &Strong, 1978; Campbell, et al , 1998; Cotter-chio, Gunn, CoffiU, Tormey, 6s Barry, 1998;Mathias, Sizto, Hazlewood, &r Cocksedge,1995; Raval-Nelson & Sniitli, 1999), The Los
May 2007 • Journal of Etivirontnental Health 27

Angeles County Department of Health Servic-es modified its inspection process to includea combination of owner-initialed inspections,unannounced inspections, food handler certi-fication, and the public posting of inspectionresults (Buchholz, Run, Kool, Fielding, &Mascola, 2002; Fielding, Aguirre, & Palaiolo-gos, 2001; Fielding, Aguirre, Spear, & Frias,1999). This approach is consistent with thegrowing trend for active managerial controlin restaurants. Active managerial control em-phasizes a preventive approach to food safety,encouraging restaurant operators to identifyand control potential hazards specific to Lheoperation of their establishment. The impor-tance of this approach is confirmed by recentfindings from the Environmental Health Spe-cialists Network (EHS-Net) that most restau-rants pro\ade food workers with on-the-jobfood safety training and that the presence ofa kitchen manager certified in food safety ap-peared to be protective against foodbo me-ill-ness outbreaks (Hedberg et al., 2006).
Minneapolis, Minnesota, has a population of382,000 in a metropolitan area with a popula-tion over 2,000,000. The food safety programof the Minneapolis Department of RegulatoryServices Division of Environmental Healthlicenses and inspects approximately 1,000restaurants with higb-risk food service op-erations. Minneapolis Environmental HealthFood Safety initiated an active managerial con-irol-based, announced inspection program inJune 2002 to better provide restaurant opera-tors witb the infonnation, tools, and support(bey need to manage food safety challenges andprevent foodborne illness. Under tbe progratn,each facility receives two inspections per year:an announced inspection followed by an unan-nounced inspection. Tbe announced inspec-tions begin with an in-deptb interview witb tbeperson-in-charge of the establishment. Dur-ing this interview, the environmental bcaltbspecialist seeks to better understand tbe foodsafet)' hazards specific to tbat establisbment,assess tbe person-in-charge's understanding offoodbome-illness risks, and move tbe person-in-charge toward active control of these riskfactors. A standard walk-tbrougb inspectionfollows tbe interview, and the person-in-chargereceives a copy of tbe inspection report detail-ing tbe Eolations cited. Eacb establisbment issubject to a second, unarmounced inspectionwitbin a year to ensure tbat tbe food safety is-sues identified during tbe announced inspec-tion bave been adequately addressed.
Despite tbe recent interest in active manage-rial control as an alternative to traditional regu-
latory practices, data are scarce on tbe food safe-t)' impact of announced inspections. To addresstbis lack of knowledge, tbe results of the Min-neapolis Announced Inspection Program were
analyzed retrospectively to test tbe hypothesistbat announced inspections could improve res-taurant inspection results and food safety
MethodsTbe results of all routine inspections conductedfrom June 2001 tbrougb early August 2003were included in a retrospective cobort study.Tbe data included one year's data from beforethe announced-inspection program was imple-mented and sligbtly more tban a year's data fromtbe period during whicb environmental beaitbspecialists conducted both announced and un-announced inspections. Tbe study was limitedto routine inspections conducted in full-ser-vice, general restaurants. A routine inspection,wbetber announced or unannounced, includesa full walk-tbrough of tbe establishmetits prem-ises, whereas nonroutine inspections do not al-ways reflect a comprehensive evaluation of allaspects of restaurant sanitation,
Eacb restaurant was scheduled to receivealternating announced and unannouncedinspections on an annual basis; however, en-vironmental healtb specialists had flexibilityin scheduling and prioritizing on the basis oftbe food safety needs of facilities. Also, a res-taurant with persistent food safety problemscould receive more tban two inspections peryear. Data were collected in similar waysduring unannounced inspections and tbewalk-tbrougb component of announced in-spections, but data from announced inspec-tions were supplemented with informationacquired during an interview tbat the envi-ronmental health specialist conducted withtbe restaurant's person-in-cbarge.
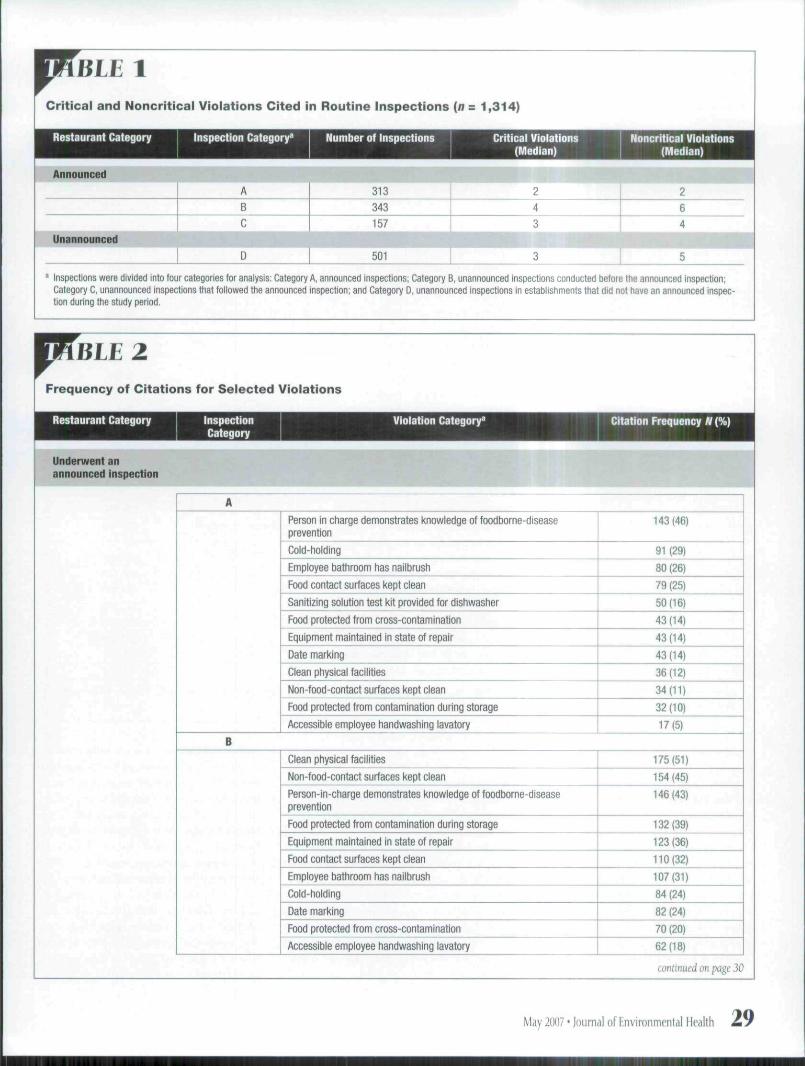
Inspections were divided into four categoriesfor analysis: Category A, announced inspec-tions; Category B, unannounced inspectionsconducted before the announced inspection;Categor)' C, unannounced inspections thatfollowed the announced inspection; and Cat-egory D, unannounced inspections in estab-lishments that did not undergo an announcedinspection during the study period. Mediannumbers of critical and noncritical violationscited during routine inspections were calcu-lated for eacb inspection category.
Violation citation rates v^ere analyzed acrossinspection categories. Violation citation fre-quencies for Category B inspections were com-pared witb frequencies for Category' D inspec-tions to determine the relationship between
tbe two study populations at baseline. To de-termine tbe impact of announced inspections,violation citation frequencies for Category Cinspections were compared witb those for Cat-egor\' B inspections. For xiolations for wbicbthe frequency of citations differed significantlybefore and after an announced inspection, acomparable analysis was performed lo iden-tify contemporaneous changes in CategoryD inspections. For tbis analysis. Category Dinspections were divided into two groups: in-spections performed before June 1, 2002 (ibestart of the announced inspection program)and inspections performed on or after June 1,2002. The period fromjune 2001 ibrougb May2002 was defined as the "early" phase. The pe-riod fromjune 2002 through August 2003 wasdefined as the "late" pbase. Tbese results wereanalyzed lo detennine if tbe cbanges tbat wereobserved foUoviing announced inspectionswere also obser\-ed in restattrants tbat did notreceive an announced iaspection.
Data were abstracted from tbe Minneapo-lis Environmental Healtb Food Safety restau-rant complaint database on ibe numbers andtypes of complaints filed about full-service,general restaurants during tbe study period.Each complaint was linked witb tbe inspec-tion status of the corresponding restaurant atthe time of the cotiiplaint. Rates of total com-plaints and foodborne-illness cotnplaints per1.000 establishment-months of observationwere calculated for each inspection categor\'.A sample of restaurants included in the studywas surveyed to determine the attitudes of theoperators toward tbe announced inspectionsand the size of the establisbments. Analysesof inspection category and complaints werestratified by restaurant size. An attempt wasmade to compare rates of foodborne-illnessoutbreaks among restaurants that had andhad not undergone announced inspections;however, too few confirmed foodborne-ill-ness outbreaks occurred during the studyperiod to allow for any meaningful analysis.
Chi-square analyses were performedtbrougbout. and p £. 05 was considered sig-nificant. Epi Info 6.04 and 2002 (Centersfor Disease Control and Prevention, Atlanta,Georgia) were used for all analyses. The Uni-versity of Minnesota Institutional ReviewBoard approved the study
ResultsThe results of 1,314 inspections were anal}'zed,Tbe cohort included 313 Category A (an-nounced) inspections and 1.001 unannouncedinspections, of whicb 343 were Category B
28 Volume 69 * Number 9
BLE 1Critical and NoncrJtical Violations Cited in Routine Inspections (n = 1,314)
Restaurant Category Inspection Category^ Number of Inspections Critical Violations(Median)
Noncritical Violations(Median)
Announced ^ ^ ^ B ^ HABC
5 1
313
343157
501
4
3
3
264
5
Inspections were divided into tour categories for analysis: Category A, announced inspections; Category B, unannounced inspections conducted before the announced inspection;Category C, unannounced inspections that followed the announced inspection; and Category D, unannounced inspections in establishments that did not have an announced inspec-tion during the study period.
Frequency of Citations for Selected Violations
Restaurant Category
Underwent anannounced inspectfQiL
InspectionCategory
Violation Category^ Citation Frequency N{%)
APerson in charge demonstrates knowledge of foodbome-diseaseprevention
Cold-holding
Employee bathroom has nailbrush
Food contact surfaces kept clean
Sanitizing solution test kit provided for dishwasher
Food protected from cross-contamination
Equipment maintained in state of repair
Date marking
Clean physical facilities
Non-food-contact surfaces kept clean
Food protected from contamination during storage
Araxssible employee handwashing lavatory
143(46)
91(29)
80 (26)
79 (25)
50(16)
43(14)
43(14)
43(14)
36(12)
34(11)
32(10)
17(5)
BClean physical facilities
Non-food-contact surfaces kept clean
Person-in-charge demonstrates knowledge of foodborne-diseaseprevention
Food protected from contamination during storage
Equipment maintained in state of repair
Food contact surfaces kept clean
Employee bathroom has nailbrush
Cold-holding
Date marking
Food protected from cross-contamination
Accessible employee handwashing lavatory
175(51)
154(45)
146(43)
132(39)
123(36)
110(32)
107(31)
84(24)
82 (24)
70 (20)
62(18)
continued on page 30
May 2007 • )oumal of Environmental Health 29

wniimed from page 29
Frequency of Citations for Selected Violations
Restaurant Category
Underwent anannounced inspection
InspectionCategory
Violation Category^ Citation Frequency N (%)
cFood contact surfaces itept clean
Clean piiysical facilities
Non-food-contact surfaces kept clean
Person-in-charge demonstrates knowledge of foodborne-diseaseprevention
Temperattire-measuring device in warmest/coolest part of storage unit
Date marking
Employee bathroom has nailbrush
Cold-holding
Food protected from contamination during storage
Accessible employee handwashing lavatory
Equipment maintained in state of repair
Food protected from cross-contamination
63 (40)
62 (40)
54(34)
47 (30)
45 (29)
41 (26)
40(25)
38(24)
32(20)
28(18)
26(17)
14(9)
Underwent an unan-nounced inspection
DClean physical facilities
Person-in-charge demonstrates knowledge of foodbome-disease prevention
Non-food-contact surfaces kept clean
Food protected from contamination during storage
Employee bathroom has nailbrush
Food contact surfaces kept clean
Equipment maintained in a state of repair
Cold-holding
Date marking
Food protected from cross-contamination
Accessible employee handwashing lavatory
224(45)
192(38)
177(35)
158(32)
136(27)
133(27)
123(25)
120(24)
102(20)
81 (16)
54(11)
Violations were selected for their relevance to food safety or high citation frequency. The top five violations listed under each inspection category were the five violations most frequerrtlycited in inspections in that category,
insjKctions (conducted before an announcedinspection), 157 were Category C inspections(conducted after an announced inspection), and501 were Categor}' D inspections (conducted inrestaurants that did not undergo an announcedInspection during the study period) (Table 1).The median number of violations cited was low-est for Category A inspections (two critical, twoQoncritical violations) and highest for Category'B inspections (four critical, six noncritical Wo-lations). Among the five most frequently citedviolations in each inspection category, the ratioof critical to noncritical violations was 4:1 inCategory A inspections and 2:3 in Category Cand Category D inspections (Table 2).
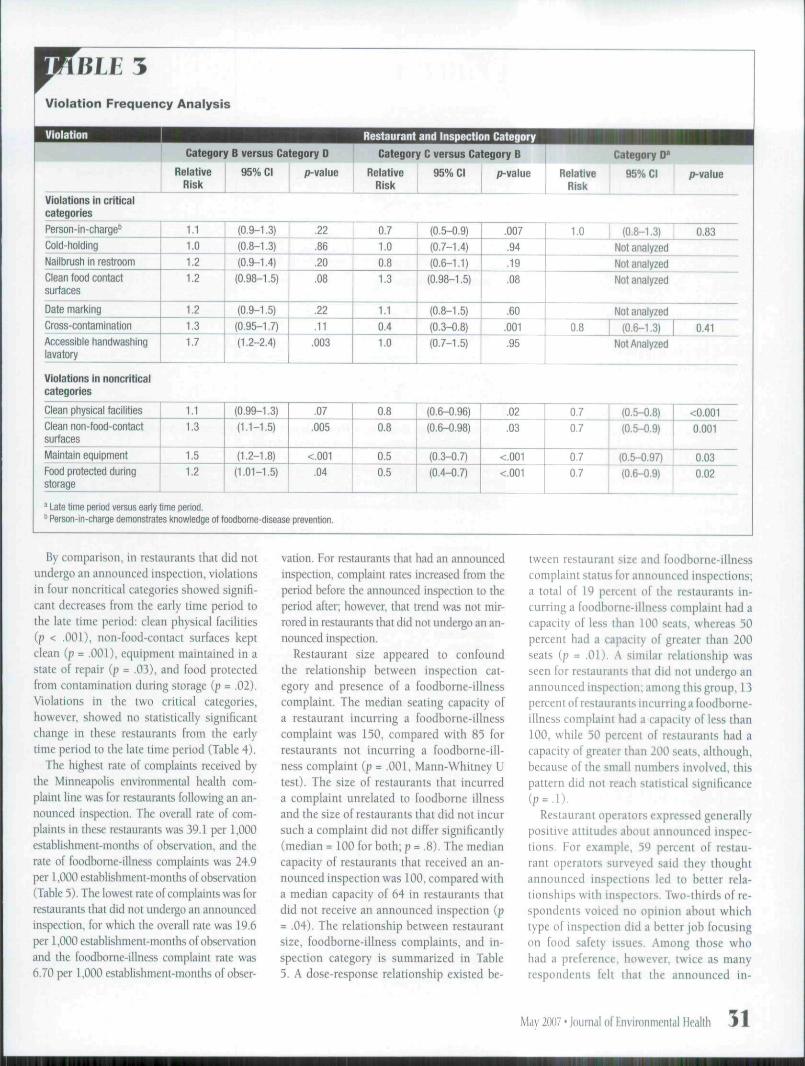
Violations that were more relevant tofood safety or that in general incurred cita-tions with high frequency throughout thestudy period were cited more often in un-announced inspections conducted before anannounced inspection than in unannouncedinspections conducted in restaurants thatdid not receive an announced inspectionduring the study period (Table 3). The dif-ferences were significant for four violations:accessible employee handwashing lavatory(p = .003), clean non-food-contact surfaces(p = .005), equipment maintained in state ofrepair (p < .001), and food protected duringstorage (p = .04).
Six violations were cited significantly lessfrequently in unannounced inspections thatfollowed an announced inspection than inunannounced inspections that were conduct-ed before an announced inspection. Theseincluded violations in two critical categories(person-in-charge demonstrates knowledgeof foodbome-disease prevention |p = .007]and prevention of cross-contamination |p =.001|); and violations in four noncritical ca-taegories (clean physical facilities Ip = .021.nonfood contact surfaces kept clean [p =.03], equipment maintained in state of repair[p< .0011, and food protected from contami-nation during storage |p < .001]).
50 \'olumt' 69 • Number 9
BLE 5Violation Frequency Analysis
Violation
Category B versus Category D
RelativeRisk
95% CI /^value
Restaurant and Inspection Category
Category C versus Category B
Relative 95% CI p-valueRisk
Violations in criticalcategories
RelativeRisk
Category
95% CI p-value
Person-in-charge''
Cold-holding
•Jailbrush in restraom
Clean food contactsurfaces
Date marking
Crass-CDntamination
Accessible handwashingavatory
1.11.01.21.2
1.21.31.7
(0.9-1.3)
(0.8-1.3)
(0.9-1.4)
(0.98-1.5)
(0.9-1.5)
(0.95-1.7)
(1.2-2.4)
.22
.86
.20
.08
.22
.11
.003
0.7
1.0
0.8
1.3
1.1
0.4
1.0
(0.5-0.9)
(0.7-1.4)
(0.6-1.1)
(0.98-1.5)
(0.8-1.5)
(0.3-0.8)
(0.7-1.5)
.007
.94
.19
.08
.60.001
.95
1.0 (0.8-1.3) 0.83
Not analyzed
Not analyzed
Not analyzed
Not analyzed
0.8 (0.6-1.3) 0.41
Not Analyzed
Violations in noncriticalcategories
Clean physical facilities
Clean non-food-contactsurfaces
Maintain equipment
-ood protected duringstorage
1.11.3
1.51.2
(0.99-1.3)
(1.1-1.5)
(1.2-1.8)
(1.01-1.5)
.07.005
<.OO1
.04
0.80.8
0.50.5
(0.6-0.96)
(0.6-0.98)
(0.3-0.7)
(0.4-0.7)
.02
.03
<.OO1
<.OO1
0.7
0.7
07
0.7
(0.5-0.8)
(0.5-0.9)
(0.5-0.97)
(0.6-0.9)
<0.001
0.001
0.03
0.02
' Late time period versus early time period.' Person-in-charge demonstrates knowledge of foodbome-disease prevention.
By comparison, in restaurants thai did notundergo an announced inspection, violationsin four noneritical categories showed signifi-cant decreases from the early time period tothe late time period: clean physical facilities(p < .001), non-food-conlaci surfaces keptelean (p = .001), equipment maintained in astate of repair (p = .03), and Food protectedfrom contamination during storage (p = .02).Violations in the two critical categories,however, showed no statistically significantchange in these restaurants from the earlytime period to the late lime period (Table 4).
The highest rate of complaints received bythe Minneapolis environmental health com-plaint line was for restaurants following an an-nounced inspection. The overall rate of com-plainls in these restaurants was 39.1 per 1,000cstablishmcni-months of observation, and therate of foodborne-illness complaints was 24.9per 1,000 establishment-nionlhs of observation(Table 5). The lowest rate of complaints was forrestaurants that did not undergo an announcedinspection, for which the overall rate was 19.6per 1,000 establishment-months of observationand the foodbornc-illncss complaint rale was6.70 per 1,000 establishment-months of obser-
vation. For restaurants that had an announcedinspection, complaint rates increased from theperiod before the announced inspection to theperiod after; however, that trend was not mir-rored in restaurants that did not undergo an an-nounced inspection.
Restaurant size appeared to confoundthe relationship between inspection eal-egory and presence of a foodhorne-ilinesscomplaint. The median seating capacity ofa restaurant incurring a foodborne-illnesscomplaint was 150, compared with 85 forrestaurants not incurring a foodborne-ill-ness complaint (p = ,001, Mann-Whitney Utest). The size of restaurants that incurreda complaint unrelated lo foodhorne illnessand the size of restaurants that did not incursuch a complaint did not differ significantly(median = 100 for both; p - .8). The mediancapacity of restaurants that received an an-nounced inspection was 100. compared witha median capacity of 64 in restaurants thatdid not receive an announced inspection (p= .04). The relationship between restaurantsize, foodhorne-illness complaints, and in-spection category is summarized in Table5. A dose-response relationship existed be-
tween restaurant size and foodborne-illnesscomplaint status for announced inspections;a total of 19 percent of the restaurants in-curring a foodborne-illness complaint had acapacity of less than 100 seats, whereas 50percent had a capacity of greater than 200seats (p = .01). A similar relationship wasseen for restaurants that did not undergo anannounced inspection; among this group, 13percent of restaurants incurring a foodborne-illness complaint had a capacity of less than100, wbile 50 percent of restaurants had acapacity of greater than 200 seats, although,because of the small numbers involved, ihispattern did not reach siaiistical significance(p = 1).
Restaurant operators expressed generallypositive attitudes about announced inspec-tions. For example, 59 percent of restau-rant operators surveyed said they thoughtannounced inspections led lo better rela-tionships with inspectors. Two-thirds of re-spondents voiced no opinion about whichtype of inspection did a better job focusingon food safety issues. Among those whobad a preference, however, twiee as manyrespondents felt that ihe announced in-
2007 • Joumdl of Environmenlal Hcdllh 31

spections gave them a better understandingof why food safety standards are importantand encouraged them to make valuablefood safety improvements.
DisrussionTlic quantitative evaluations comparing res-taurants that received announced inspeetionswith restaurants that received only routine un-announced inspections demonstrated severalimportant benefits from the implementation ofannounced inspections. First, the announcedinspections consistently focused on helpingthe restaurant operator identify and managecritical food safety issues. This observatioti wasconfirmed by ihe following circumslanees: 1)the number of food safety violations cited dur-ing announced inspecUoas was reduced byone-half for critical violations and two-thirdsfor noncritical violations. This result Is eonsis-tent with a greater emphasis being placed ondiscussion and education than on enforcement.
2) The ratio of critical to noncritical violationscited during and following the announcedinspections shifted to emphasize critical vio-lations. Critical violations directly related tofood safety comprised four out of the top fiveviolations cited during announced inspections.
3) Restaurant operators expressed favorable at-titudes. The announced inspections were quali-tatively different than the otber routine inspec-tions, and this difference was demonstrated bythe clear quantitative differences in citations forfood safety violations,
A second major finding of the study wasthat the performance of restaurants thai hadundergone an announced inspection improvedfollowing the announced inspections with re-spect to two critical food safety measures: 1)person-in-charge demonstrating knowledgeof foodbome-disease prevention and 2) pre-vention of cross-contamination. Citation fre-quencies for violations in these critical areasdeclined by 30 percent and 60 percent, respec-tively, during routine inspections that followedthe announced inspections. Tbe importance ofthese findings is highlighted by the results ofoutbreak and non-outbreak restaurant evalu-ations conducted hy EHS-Net (Hedberg, etal., 2006). The reduced risk of foodhome-ill-ness outbreaks associated with the presenceof certified kitchen managers was most likelydue to their possession and use of knowledgeof foodborne-disease prevention. Although 45percent of the outbreaks evaluated by EHS-Netwere caused by norovirus, cross-contamina-tion was the third most comtnon contributingfactor identified {Hedberg et al., 2006). Thus,
BLE4Complaint Rates
Restaurant Category
Underwent anunannounced inspection
Underwent anannounced inspection
Inspection Category
D—overall
D—eatly time period
D—late time period
BC
Complaints
Total
JV(rate^
120(19.6)
24(15.7)
96 (20.9)
97 (25.8)
121 (39.1)
Foodborne Illness
ff(rate")
41 (6.7)
11(7.2)
30 (6.5)
55(14.6)
77 (24.9)
= Per 1,000 establisfiment-montfis of observation.
BLE 5Relationship Between Restaurant Category and Restaurant Sizein Foodborne-lilness Complaint Rates
RestaurantCategory
Foodborne-lilness
Complaint
Restaurant Size° p.value''
Underwent anatitiotjticednspection
Underwent anunannouncedinspection
YesNo
<100(«[%])
11(19)
46(81)
100-199
mm)
11(25)
32(75)
>200(W[%])
14(50)
14 (50)
YesNo
2(13)
14(87)
1(20)
4(80)
2(50)
2(50)
0.01
0.1
Maximum seating capacity.Chi-square test for trend.
improved performance of restaurants in theseareas should reduce the risk of foodbome-dis-ease transmission.
With respect to apparent foodborne-dis-ease transmission, the increase in food-bome-illness complaints about restaurantsthat received announced inspections seemscounter-intuitive. A reduction in tbe risk offoodborne-illness transmission could be ex-pected to be accompanied by a reduction infoodborne-illness complaints. A Food-Netpopulation survey demonstrated, however,that most people who attributed tbeir ill-nesses to meals eaten outside the home in-
correctly believed that foodborne illnessestypically occur within a lew hours oi thetime wben tbe contaminated food was eaten(Green et al., 2005). The Minneapolis Envi-ronmental Health complaint database relieson self-report by restaurants and restaurantpatrons either directly or through the Min-nesota Department of Health Foodborne Ill-ness Hotline. Complaints are assigned witbin24 hours of receipt and investigated witb theassistance of Hennepin County and the Min-nesota Department of Health. The data col-lected on the patron's illness and food histor\'is provided to the Minnesota Depariment ol
52 Volume 69 • Number 9

Health and Hennepin County for analysis.Outbreaks are handled by a cross-functionalteam of experts among agencies.
The iticreased rate of complaints in restau-rants that received antiounced inspectionscouid reflect greater awaretiess on the part ofthe reslauratit operators atid the public thatpeople should report suspected foodborneillticss to public health authorities. Media al-tention to foodborne outbreaks could stimu-late increased reporting. Minneapolis envi-ronmental health specialists have stressed theimportance of illness reporting with restau-rant operators and have promoted the food-borne-iilness hotline al community healthfairs and events. Increased awareness shouldresult in more foodborne-illness complaints.The lack of ati increase in foodborne-illnesscomplaints about restaurants that did notreceive announced inspections suggests thatincreased public awareness, by itself, is anunlikely explanation for these findings. An-nounced inspections, however, provide morelime for the environmental health specialistand the person-in-charge to discuss in greaterdetail the requirements and benefits of illnessreporting. Given ihe attitudes that restaurantoperators expressed about improved relation-ships with environmental heatth specialists,the increased rate of foodborne-lllness com-plaints following announced inspectionscould be another heneficial effect of the an-nutmced inspections. Unfortunately, it is notpossible to determine whether restaurantoperators played any role in stimulating thereporting oi these complaints.
It seems most likely that restaurant sizeconlounded lhe relationship between inspec-tion categor)' and complaint rales. Severalprevious studies bave identified larger restau-rant size as a risk factor for foodborne-diseaseoutbreaks (Bucbbolz et al., 2002; Cruz et al.,2001; Olsen et al., 2000). The study reportedhere demonstrated thai larger restaurantswere significantly more likely both to incur afoodborne-illness complaint and to receive anannounced inspection. Similar dose-responserelationships between restaurant size andhistory of foodbome-illness complaint wereseen both among restaurants that received anannounced inspection and atnong those tbatdid not. Because the number of restaurantssurveyed tbat did not receive an announcedinspection was small, however, the statisti-cal significance of the difference was limited.Nevertheless, half of all restaurants in tbelargest size category incurred foodborne-ill-ness complaints. Thus, it appears that larger
restaurants were more likely to incur com-plainls because they served more patrons.
Tbis analysis is the first to systematicallyassess the impact of implementing a risk-based, active managerial control-drivenrestaurant inspection program. Tbe resultssuggest that tbe Minneapolis EnvironmentalHealth announced-inspection program basimproved restaurant sanitation in areas ibattraditional restaurant inspection programsbave not. In an analysis of reslaurani inspec-tions done inTennessee,Jones and co-autbursfound only one critical violation among tbe15 most frequently cited violations (2004).Wbile several critical violations appeared inibe top five in the Minneapolis data, manyof tbe violations most frequently cited dur-ing unannounced inspections were stillnoncriticai. The bigb frequency of citationsfor critical violations during tbe announcedinspections, together witb tbe subsequentsignificant improvement in tbe frequencyof iwo of tbese violations during unan-nounced inspections ibat followed, suggeststhat announced inspections are producingimprovements in restaurant sanitation tbatunannounced inspections are unable to ac-complish. Critical violations are more com-plex tban noncriticai violations. Reducingtbe citation frequency of the cross-contatni-nation and person-in-cbarge violations afterannounced inspections suggests tbai tberestaurants bave made long-term, procedur-al changes that can reduce tbe presence offoodborne-disease bazards in tbeir facilities.These improvements demonstrate ibat an-nounced, risk-based inspections could belprestaurants make sustained cbanges in tbeiroperations tbat reduce the risk of foodborneillness in tbeir establisbments.
Tbe results of [he study support tbe con-clusion tbat education of restaurant manag-ers and food workers is an effective way toimprove inspection outcomes, as suggestedby previous studies (Campbell et al.. 1998;Cottercbio et al., 1998; Matbias et al., 1995;Raval-Nelson & Smitb, 1999). Education isan integral part of the announced inspectionprocess; the environmental bealth specialisttakes lime to learn from ihe operator bowfood is handled and prepared, and to thor-oughly discuss food safety hazards unique toeach estabiisbment. Tbis empbasis on educa-tion and communication may be lhe primarycause of the significant improvements seen intbe frequency of violation cited for tbe criti-cal category of tbe person-in-cbarge demon-strating knowledge of foodborne-disease pre-
vention; tbose improvements should reduceibe risk of foodbome-illness transtnission.
Tbe study reported here opens several av-enues for further study. A major limitationof ibe study was tbe underlying assumptiontbat improvement in restaurant inspectionoutcomes entails decreased risk of food-borne illness. As mentioned previously, analtempl was made to identify foodborne-ilt-ness outbreaks in Minneapolis during thestudy time and relate ihem lo restaurantinspection status. Tbe number of confirmedfoodborne outbreaks during ibe study timeperiod was too small, however, to allow forany meaningful analysis. Because of tberelative rarity of foodborne-disease out-breaks and tbe newness of ibe Minneapoliscomplaint database, il would be worthwhileto re-evaluate this relationship after the an-nounced inspection program has been inplace for a few more years. Re-evalualion ofdata from subsequent years will also revealwhether the improvetnents seen after an-nounced inspections are sustained wben an-nounced inspectiotis are no longer new buthave become standard practice.
ConrlusionTbe results ot tbe Minneapolis En%ironmen-lal Healtb announced-inspeclion programindicate that risk-based restaurant inspec-tions may be an effective way to improverestaurant sanitation and decrease the riskof acquiring foodbome illness from eating inrestaurants. Wt
Acknowledgements: Tbe study was sup-ported by a Food Safety DemonstrationSite gram frotn the Naiional Associationof County and City Healtb Officials (NAA-CHO)(Wasbingion,D.C).Tbeautbors\visbto thank ibe environmental bealib special-ists and staff of Minneapolis EnvironmentalHealtb for tbeir work wnh tbe AnnouncedInspection Program and for tbeir supportof tbis research. The authors also tbank theMinnesota Department of Healtb for pro-viding assistance and Dr. Kirk Smith andApril Bogard for their editorial and analyti-cal suggestions.
Corresponding Author: Craig Hedberg, As-sociate Professor, Division of EnvironmentalHealtb Sciences, University of Minnesota,Scbool of Public Health, MMC 807, 420 Del-aware Streei S.E,, Minneapolis, MN 55440.E-mail; [email protected].
References on page 34
May 2007 • Journal of Etivironmental Heallti 33

FERENCES conlinucd jwm page 33
Bader, M., Blonder, E,, Henriksen, J., & 5trong, W. (1978), A studyof food service estahlishment sanitation inspection frequency.Amerkcmjoiirml ofPublk HmUh, b8, 408-410,
Buchholz. U., Run, G,, KoolJ.L, Fielding,J., & Mascola, L, (2002).A risk-based restaurant inspection system in Los Angeles County.Journal ojhwd Pwtation, 65(2), 367-372,
Campbell, M,E., Gardner, C.E., Dwyer, J.J., Isaacs, S.M., Krueger,P.D., & YingJ.Y. (19981. Effectiveness of public hcahh interven-tions in food safety: A systematic review. Canadian jomnal oJPub-lic Heahh, 89{3), 197-201.
Cotterchio, M,, GunnJ,, Coffill, T, Torniey, P, & Barry, M,A, (1998).Effect of a manager training program on sanitary conditions inrestaurants. Public Heahh Reports, 113(4), 353-358.
Cruz, M.A,, Katz, DJ., &r Suarez, J.A. (2001). An assessment of theability of routine restaurant inspections to predict food-borneoutbreaks in Miami-Dade Gounty, Florida, Amencan Jounutl ofPublic Hcdith, 91, 821-823.
FieldingJ.E., Aguirre, A,, & Palaiologos, E. (2001). Effectiveness ofultered incentives in a food safety inspeetion program. PreventiveMedicine, .32(3), 239-244.
FieldingJ.E,, Aguirre, A., Spear, M.C, & Frias, L.E. (1999), Making thegrade: changing the incentives in retail food establishment inspec-tion. AmeiicmJournal ojPreveniiw Medicine, 17(3), 243-247.
Green, L.R., Selman, C , Scallon, E., Jones, TF, Marcus R., & EHS-Net Population Survey Working Group. (2005). Beliefs aboutmeals eaten outside the home as sources of gastrointestinal \\]-ness. Journal oJ Food Pyoteclion, 68, 2184-2189,
Hedberg, C.W, Smith. S.J.. Kirkland, E.. Radkc, V.Jones, T.E, Sel-man. C,A., & the FHS-Net Working Group. (2006). Systematicenvironmental evaluations to identify food safety differences be-tween outbreak and non-outbreak restaurants, Joumal of FoodProtection, 69, 2697-2702,
Irwin, K., Ballard, J,, Grendon, J., & Kobayyashi, J, (1989). Resultsof routine restaurant inspections can predict outbreaks of food-borne illness: The Seattle-King County experience, American Jour-nal of Public Heahh, 79, 586-590.
Jones, T.F, Pavlin. B.I., LaFleur, B,J., Ingram, L.A., & ScbaflnerW, (2004). Restaurant inspection scores and foodborne disease.Emerging Infectious Diseases, 10,688-692.
Mathias, R,G,, Sizto, R.. Hazlewood, A,, & Gocksedge. W (1995).The etfects of inspection frequency and food handler educationon restaurant inspection violations. Canadian Journal of PublicHfdf/i. 86(1), 46-50.
Mead, P.S,, Slutsker. L,, Dietz, V,, McGaig. L.E, Bresee, J.S., Shap-iro, G., Griffin, PM., & Tauxe, R.V. (1999). Food-related illnessand death in the United States. Emerging )n/c("fi(nis Diseases, 5,607-625.
Mullen, L,A., Gowden,J.M,, Gowden D., &r Wong, R, (2002). .^nevaluation of the risk a.ssessnient method used by environmen-tal health officers when inspecting food businesses. JnicmalionatJournal of Environmental Health Research, 12(3), 255-260.
Olsen, S,J., MaeKinnon, L.G., Goulding, J.S., Bean, N.H.. & Slutsker.L. (2000). Surveillance for foodborne-disease outbreaks—UnitedStates, 1993-1997. Morbidity and Mortality Weekly Report, CDCSuneillance Summaries, 49(1), 1-62.
Penman, A.D,, Webb, R.M., Woernle, CH., & Gttrrier, M,M, (1996).Failure of routine restaurant inspections: Restaurant-related food-borne outbreaks in Alabama. 1992, and Mississippi, 1993, /(jwrnalo/Enviroiimenttii Heahh, 58(8), 23-25.
Raval-Nelson, P., & Smith, P.M. (1999). Food safety certification andits impacts. Journal o/Environmental Healfh, 61(7), 9-12.
Protecting human health
and the environment
since 1937
Why should your employeeshold a NEHA credential?
BECAUSE YOU WANTT H E BEST WORKING TO
PROTECT YOUR COMMUNITY!
Professional credentials such as the
Registered Environmental Health Spe-
cialist/Registered Sanitarian (REHS/RS)
and Certified Food Safety Professional
(CFSP) have been rigorously developed
to insure that those who successfully
pass the credentiaiing exams have the
knowledge, skills, and abilities to com-
petently practice environmental health.
information on NEHA
ilals. please visit our Web site at www.
'neha.org/credential/index.shtmf or con-
tact the credentiaiing department at (303)
756-9090, ext 339 or 309.
54 Voitime 69 • Number 9