Embed Size (px)
Citation preview

A Service Performance Insight White Paper
Service Compass: Charting the Course to Professional Service Excellence
Benchmarks and Best Practices
for Professional Services Success
May 2012
Service Performance Insight
6260 Winter Hazel Drive 25 Boroughwood Place Liberty Township, OH 45044 USA Hillsborough, CA 94010 USA
Telephone: 513.759.5443 Telephone: 650.342.4690
[email protected] [email protected]
www.SPIresearch.com
Se
rvic
e P
erf
orm
an
ce In
sig
ht,
LL
C
i
TABLE OF CONTENTS
Abstract .......................................................................................................................................... 2
The PS Market Dramatically Improved in 2011 ........................................................................... 2
Professional Services Maturity™ Model ..................................................................................... 6
Professional Services Maturity™ Model Benchmark Levels ...................................................... 7
Does Professional Service Maturity Matter? .............................................................................. 7
Service Execution Analysis .......................................................................................................... 9
PSA Is at the Heart of Service Execution .................................................................................. 11
Best Practices to Improve Service Execution .......................................................................... 12
Integrate Information Systems ................................................................................................. 12
Implement Standardized Service Delivery Processes ............................................................. 13
Improve Resource Management .............................................................................................. 14
Drive Utilization Higher ............................................................................................................. 14
Deliver Projects on Time .......................................................................................................... 15
Don’t Forget Knowledge Management ..................................................................................... 16
The Top Performers .................................................................................................................... 16
Recommendations & Conclusions ............................................................................................ 17
About Service Performance Insight .................................................................................... 18
FIGURES
Figure 1: Year-over-Year Change in PS Revenue (2007-2011) .................................................... 3
Figure 2: Percentage of Employees Billable or Chargeable (2007-2011) ...................................... 4
Figure 3: Consultant Billable Utilization (2007-2011) ..................................................................... 5
Figure 4: Project Overrun Rate (2007-2011) .................................................................................. 5
Figure 5: Service Performance Pillars™ ........................................................................................ 6
Figure 6: Services Maturity™ Model Levels ................................................................................... 7
Figure 7: Key Performance Indicators (KPIs) Are Correlated ........................................................ 8
Figure 8: Service Execution Maturity Matters ............................................................................... 10
TABLES
Table 1: Hourly Bill Rate Comparisons (2008-2011) ...................................................................... 4
Table 2: Maturity Matters! ............................................................................................................... 8
Table 3: Service Execution Pillar Mapped Against Service Maturity .............................................. 9
Table 4: Comparison of Companies with and without PSA .......................................................... 11
Table 5: Real-time Visibility Enhances Communication & Collaboration ..................................... 13
Table 6: Benefits of Effective Standardized Delivery Processes ................................................. 13

ii
Table 7: Benefits of Effective Resource Management ................................................................. 14
Table 8: Benefits of High Employee Utilization ............................................................................ 15
Table 9: Benefits of On-time Service Delivery .............................................................................. 15
Table 10: Benefits of Effective Knowledge Management ............................................................. 16
Table 11: Best-of-the-Best – Service Execution Pillar KPIs ......................................................... 17
Service Compass Benchmarks and Best Practices for Professional Services Success
Service Performance Insight Page 1
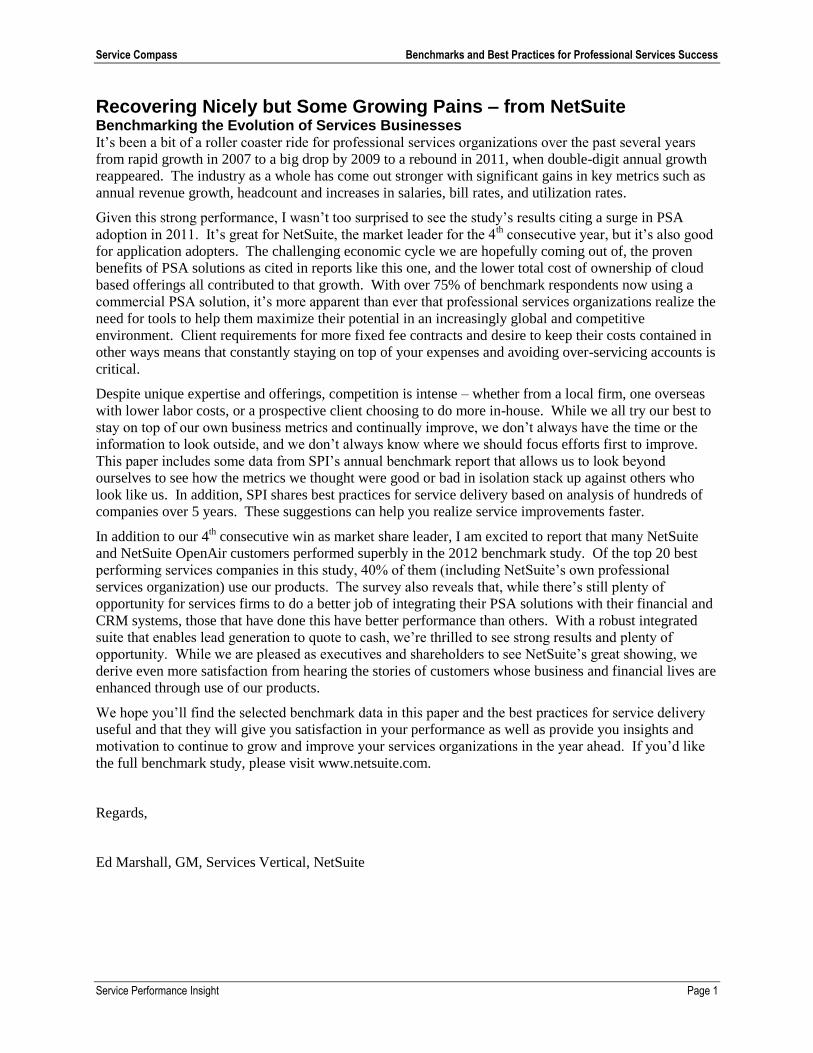
Recovering Nicely but Some Growing Pains – from NetSuite Benchmarking the Evolution of Services Businesses It’s been a bit of a roller coaster ride for professional services organizations over the past several years
from rapid growth in 2007 to a big drop by 2009 to a rebound in 2011, when double-digit annual growth
reappeared. The industry as a whole has come out stronger with significant gains in key metrics such as
annual revenue growth, headcount and increases in salaries, bill rates, and utilization rates.
Given this strong performance, I wasn’t too surprised to see the study’s results citing a surge in PSA
adoption in 2011. It’s great for NetSuite, the market leader for the 4th consecutive year, but it’s also good
for application adopters. The challenging economic cycle we are hopefully coming out of, the proven
benefits of PSA solutions as cited in reports like this one, and the lower total cost of ownership of cloud
based offerings all contributed to that growth. With over 75% of benchmark respondents now using a
commercial PSA solution, it’s more apparent than ever that professional services organizations realize the
need for tools to help them maximize their potential in an increasingly global and competitive
environment. Client requirements for more fixed fee contracts and desire to keep their costs contained in
other ways means that constantly staying on top of your expenses and avoiding over-servicing accounts is
critical.
Despite unique expertise and offerings, competition is intense – whether from a local firm, one overseas
with lower labor costs, or a prospective client choosing to do more in-house. While we all try our best to
stay on top of our own business metrics and continually improve, we don’t always have the time or the
information to look outside, and we don’t always know where we should focus efforts first to improve.
This paper includes some data from SPI’s annual benchmark report that allows us to look beyond
ourselves to see how the metrics we thought were good or bad in isolation stack up against others who
look like us. In addition, SPI shares best practices for service delivery based on analysis of hundreds of
companies over 5 years. These suggestions can help you realize service improvements faster.
In addition to our 4th consecutive win as market share leader, I am excited to report that many NetSuite
and NetSuite OpenAir customers performed superbly in the 2012 benchmark study. Of the top 20 best
performing services companies in this study, 40% of them (including NetSuite’s own professional
services organization) use our products. The survey also reveals that, while there’s still plenty of
opportunity for services firms to do a better job of integrating their PSA solutions with their financial and
CRM systems, those that have done this have better performance than others. With a robust integrated
suite that enables lead generation to quote to cash, we’re thrilled to see strong results and plenty of
opportunity. While we are pleased as executives and shareholders to see NetSuite’s great showing, we
derive even more satisfaction from hearing the stories of customers whose business and financial lives are
enhanced through use of our products.
We hope you’ll find the selected benchmark data in this paper and the best practices for service delivery
useful and that they will give you satisfaction in your performance as well as provide you insights and
motivation to continue to grow and improve your services organizations in the year ahead. If you’d like
the full benchmark study, please visit www.netsuite.com.
Regards,
Ed Marshall, GM, Services Vertical, NetSuite
Service Compass Benchmarks and Best Practices for Professional Services Success
Service Performance Insight Page 2
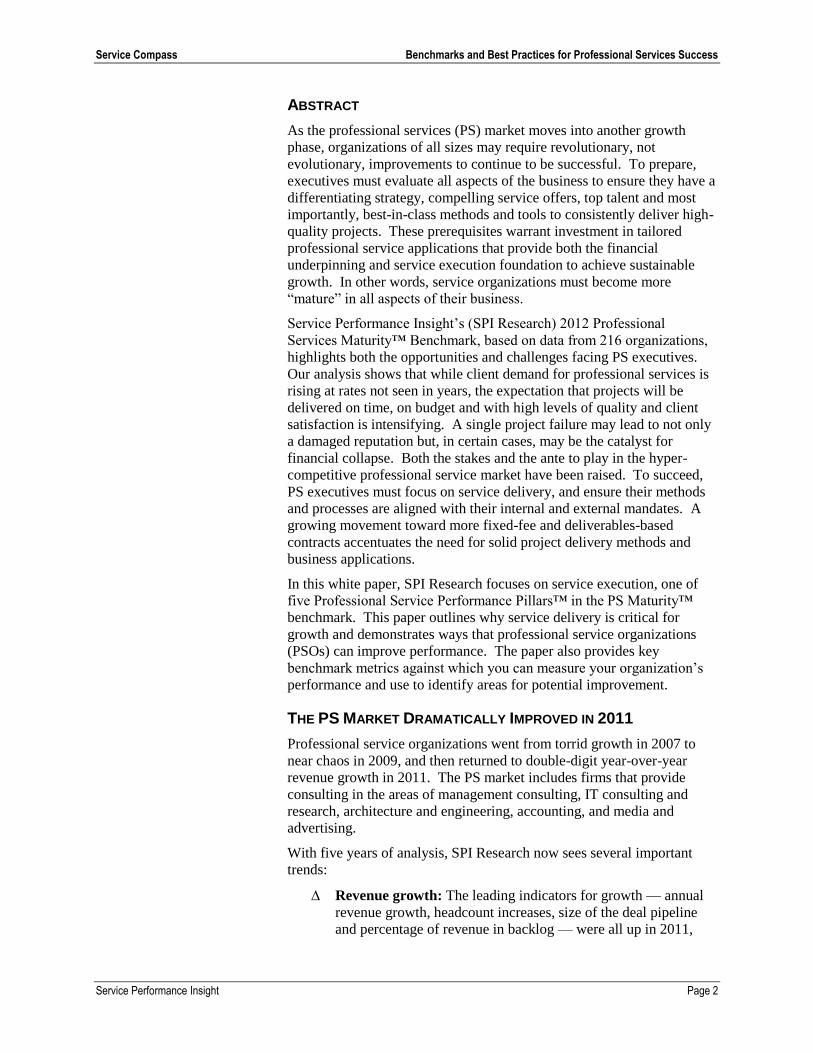
ABSTRACT
As the professional services (PS) market moves into another growth
phase, organizations of all sizes may require revolutionary, not
evolutionary, improvements to continue to be successful. To prepare,
executives must evaluate all aspects of the business to ensure they have a
differentiating strategy, compelling service offers, top talent and most
importantly, best-in-class methods and tools to consistently deliver high-
quality projects. These prerequisites warrant investment in tailored
professional service applications that provide both the financial
underpinning and service execution foundation to achieve sustainable
growth. In other words, service organizations must become more
“mature” in all aspects of their business.
Service Performance Insight’s (SPI Research) 2012 Professional
Services Maturity™ Benchmark, based on data from 216 organizations,
highlights both the opportunities and challenges facing PS executives.
Our analysis shows that while client demand for professional services is
rising at rates not seen in years, the expectation that projects will be
delivered on time, on budget and with high levels of quality and client
satisfaction is intensifying. A single project failure may lead to not only
a damaged reputation but, in certain cases, may be the catalyst for
financial collapse. Both the stakes and the ante to play in the hyper-
competitive professional service market have been raised. To succeed,
PS executives must focus on service delivery, and ensure their methods
and processes are aligned with their internal and external mandates. A
growing movement toward more fixed-fee and deliverables-based
contracts accentuates the need for solid project delivery methods and
business applications.
In this white paper, SPI Research focuses on service execution, one of
five Professional Service Performance Pillars™ in the PS Maturity™
benchmark. This paper outlines why service delivery is critical for
growth and demonstrates ways that professional service organizations
(PSOs) can improve performance. The paper also provides key
benchmark metrics against which you can measure your organization’s
performance and use to identify areas for potential improvement.
THE PS MARKET DRAMATICALLY IMPROVED IN 2011
Professional service organizations went from torrid growth in 2007 to
near chaos in 2009, and then returned to double-digit year-over-year
revenue growth in 2011. The PS market includes firms that provide
consulting in the areas of management consulting, IT consulting and
research, architecture and engineering, accounting, and media and
advertising.
With five years of analysis, SPI Research now sees several important
trends:
Revenue growth: The leading indicators for growth — annual
revenue growth, headcount increases, size of the deal pipeline
and percentage of revenue in backlog — were all up in 2011,
Service Compass Benchmarks and Best Practices for Professional Services Success
Service Performance Insight Page 3
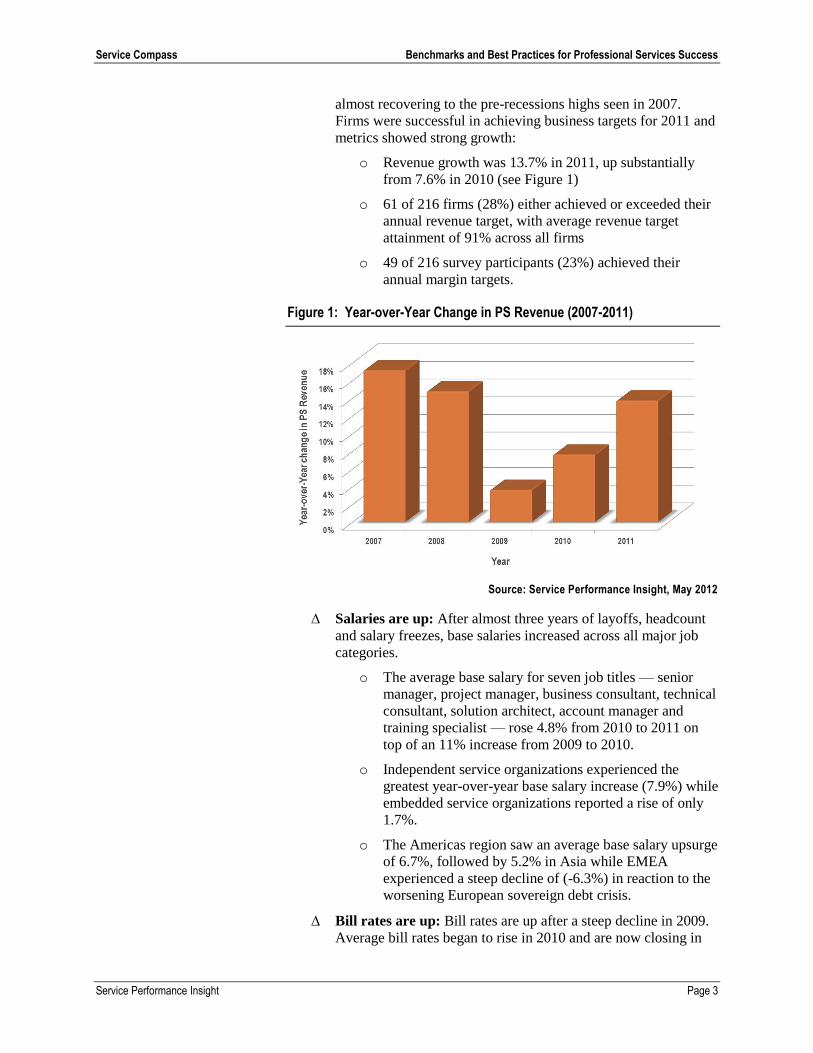
almost recovering to the pre-recessions highs seen in 2007.
Firms were successful in achieving business targets for 2011 and
metrics showed strong growth:
o Revenue growth was 13.7% in 2011, up substantially
from 7.6% in 2010 (see Figure 1)
o 61 of 216 firms (28%) either achieved or exceeded their
annual revenue target, with average revenue target
attainment of 91% across all firms
o 49 of 216 survey participants (23%) achieved their
annual margin targets.
Figure 1: Year-over-Year Change in PS Revenue (2007-2011)
Source: Service Performance Insight, May 2012
Salaries are up: After almost three years of layoffs, headcount
and salary freezes, base salaries increased across all major job
categories.
o The average base salary for seven job titles — senior
manager, project manager, business consultant, technical
consultant, solution architect, account manager and
training specialist — rose 4.8% from 2010 to 2011 on
top of an 11% increase from 2009 to 2010.
o Independent service organizations experienced the
greatest year-over-year base salary increase (7.9%) while
embedded service organizations reported a rise of only
1.7%.
o The Americas region saw an average base salary upsurge
of 6.7%, followed by 5.2% in Asia while EMEA
experienced a steep decline of (-6.3%) in reaction to the
worsening European sovereign debt crisis.
Bill rates are up: Bill rates are up after a steep decline in 2009.
Average bill rates began to rise in 2010 and are now closing in
Service Compass Benchmarks and Best Practices for Professional Services Success
Service Performance Insight Page 4
on their pre-recession highs, as shown in Table 1. Best-in-class
professional services organizations tightly control pricing by
carefully managing estimating, discounting, contract terms and
scope.
Table 1: Hourly Bill Rate Comparisons (2008-2011)
Level 2008 2009 2010 2011
Senior Manager $222 $232 $222 $211 - $239
Project/Program Manager 191 186 191 173 - 205
Business Consultant 176 171 179 174
Technical Consultant 170 158 166 168 - 185
Solution Architect 186 181 181 211
Account Management 147 142 152 N/A
Education/Training 169 154 156 N/A
Source: Service Performance Insight, May 2012
Productivity continues to improve: Year-over-year revenue
growth (13.7% in 2011, up from 7.6% in 2010) has consistently
outpaced year-over-year headcount growth (10.1% in 2011, up
from 6.9% in 2010), which means PSOs are continuing to ratchet
up productivity. PS executives have worked hard to improve
efficiency by eliminating overhead and waste.
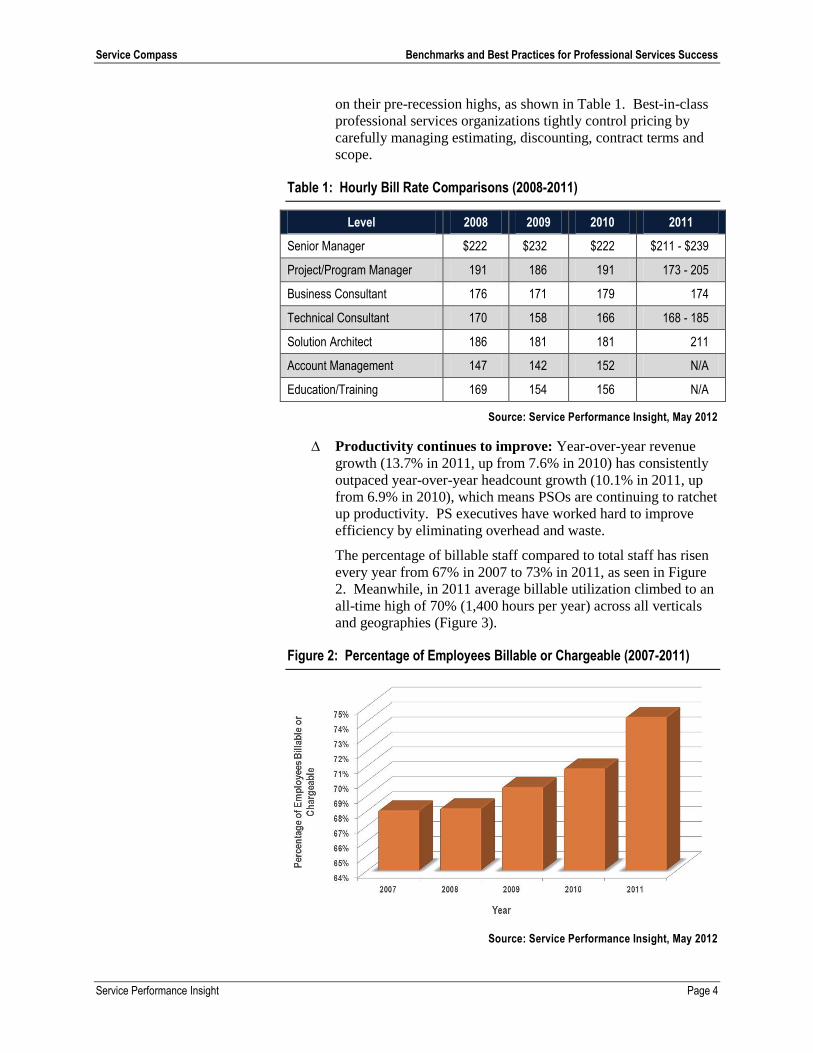
The percentage of billable staff compared to total staff has risen
every year from 67% in 2007 to 73% in 2011, as seen in Figure
2. Meanwhile, in 2011 average billable utilization climbed to an
all-time high of 70% (1,400 hours per year) across all verticals
and geographies (Figure 3).
Figure 2: Percentage of Employees Billable or Chargeable (2007-2011)
Source: Service Performance Insight, May 2012
Service Compass Benchmarks and Best Practices for Professional Services Success
Service Performance Insight Page 5
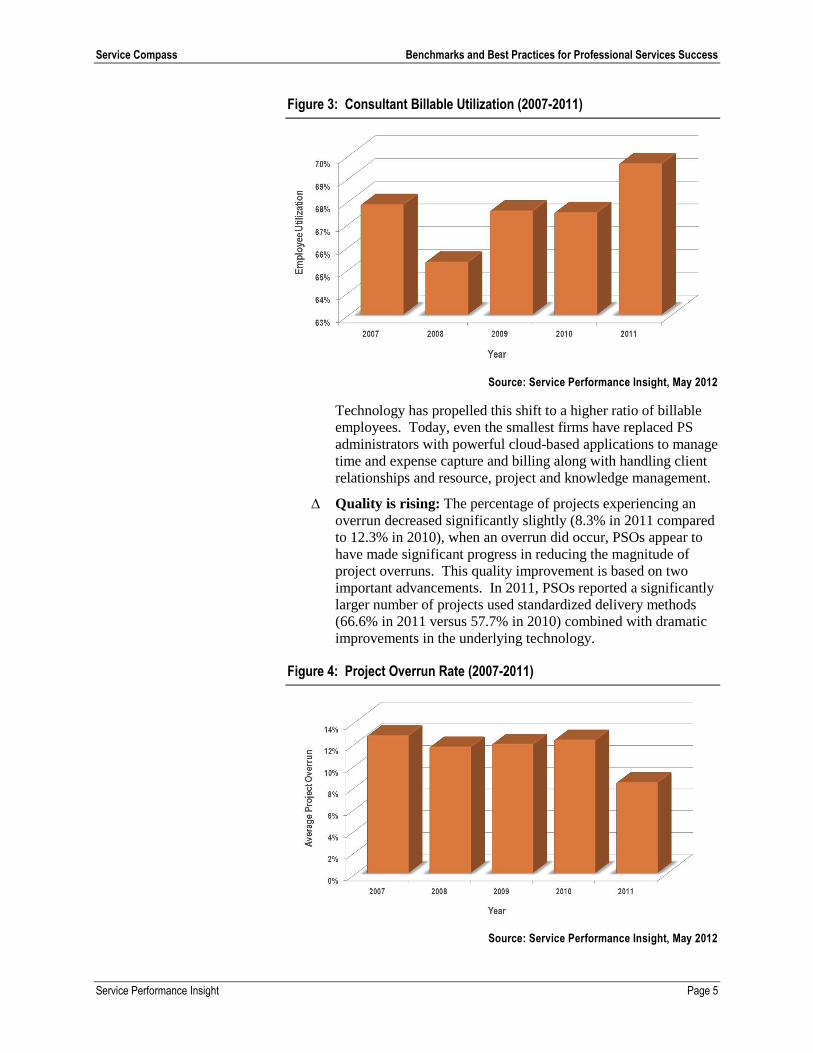
Figure 3: Consultant Billable Utilization (2007-2011)
Source: Service Performance Insight, May 2012
Technology has propelled this shift to a higher ratio of billable
employees. Today, even the smallest firms have replaced PS
administrators with powerful cloud-based applications to manage
time and expense capture and billing along with handling client
relationships and resource, project and knowledge management.
Quality is rising: The percentage of projects experiencing an
overrun decreased significantly slightly (8.3% in 2011 compared
to 12.3% in 2010), when an overrun did occur, PSOs appear to
have made significant progress in reducing the magnitude of
project overruns. This quality improvement is based on two
important advancements. In 2011, PSOs reported a significantly
larger number of projects used standardized delivery methods
(66.6% in 2011 versus 57.7% in 2010) combined with dramatic
improvements in the underlying technology.
Figure 4: Project Overrun Rate (2007-2011)
Source: Service Performance Insight, May 2012

Service Compass Benchmarks and Best Practices for Professional Services Success
Service Performance Insight Page 6
Technology enhancements including cloud-based software are
the primary catalyst for project quality improvements as
implementation is now primarily focused on configuration as
opposed to legacy code development and expensive, trouble-
prone custom integration.
Cloud computing, mobile and social are still in their infancy but
are quickly becoming the dominant sources of technology sector
growth. These technologies are having a positive impact on
PSOs and have been the catalyst for significantly higher levels of
productivity while reducing overhead and administration costs.
Large and small PSOs are increasingly abandoning homegrown
spreadsheet-based applications in favor of commercial off-the-
shelf applications expressly tailored to the professional services
market. These new technologies likewise are significantly
improving service delivery.
PROFESSIONAL SERVICES MATURITY™ MODEL
SPI Research uses the PS Maturity Model™ as a diagnostic tool to chart
the road to professional services excellence. The core tenet of the PS
Maturity Model™ is service, and project-oriented organizations achieve
success through the optimization of five Service Performance Pillars™
(Figure 5):
1. Leadership — Vision, Strategy and Culture: Executive-level
strategic alignment, communication and control.
2. Client Relationships: Marketing and sales effectiveness
3. Human Capital Alignment: Recruiting, hiring and engaging a
quality workforce.
4. Service Execution: Delivering valuable services and projects on
time and on budget.
5. Finance and Operations: Managing and controlling cash flow
to meet revenue and profit objectives.
Figure 5: Service Performance Pillars™
Source: Service Performance Insight, May 2012

Service Compass Benchmarks and Best Practices for Professional Services Success
Service Performance Insight Page 7
Within each of the Service Performance Pillars™, SPI Research has
developed guidelines and key performance measurements that
correspond to levels of maturity and provide a roadmap to service
performance excellence.
Professional Services Maturity™ Model Benchmark Levels
The model is built on the same foundation as the Capability Maturity
Model (CMM), which has been adopted for software development; but is
specifically targeted toward billable PSOs that either exclusively sell and
execute professional services or complement the sale of products with
services. Figure 6 depicts maturity level progression and outlines
primary characteristics for each maturity level.
Figure 6: Services Maturity™ Model Levels
Source: Service Performance Insight, May 2012
The bottom line is that as organizations improve performance through
better focus, alignment, communication and collaboration, the more
“mature” they become.
Does Professional Service Maturity Matter?
SPI Research has spent the past five years benchmarking varying levels
of operational performance or “maturity” to determine the characteristics
and appropriate behaviors for PSOs based on their organizational
lifecycle stage.
The 2012 PS Maturity™ Benchmark demonstrates that increasing levels
of standardization in operating processes and management controls do
indeed result in significant performance improvements. In fact, SPI
Research found that high levels of performance have far more to do with
leadership focus, organizational alignment, effective business processes
and disciplined execution than the age and size of the company.
Relatively young and fast-growing organizations can and do demonstrate
surprisingly high levels of maturity and performance excellence if their
charters are clear. Further improvements accrue when their goals and
Service Compass Benchmarks and Best Practices for Professional Services Success
Service Performance Insight Page 8
measurements are aligned with their mission, and they make the
investments they need in talent and systems to provide visibility and
appropriate levels of business control. Of course, it certainly helps if
they are also well-positioned within a fast-growing market.
Level 4 and 5 (highest performing) organizations significantly
outperformed their peers by generating significantly higher revenue per
billable consultant, contributing to higher project and operating margins.
Table 2: Maturity Matters!
Key Performance Measurement Maturity Level 1-2
Maturity Level 3
Maturity Level 4-5
PS EBITDA 8.4% 14.5% 21.5%
Revenue per Billable Consultant $161,000 $228,000 $243,000
Project Gross Margin 30.2% 33.5% 41.2%
Billable Utilization 67.6% 68.1% 76.6%
Source: Service Performance Insight, May 2012
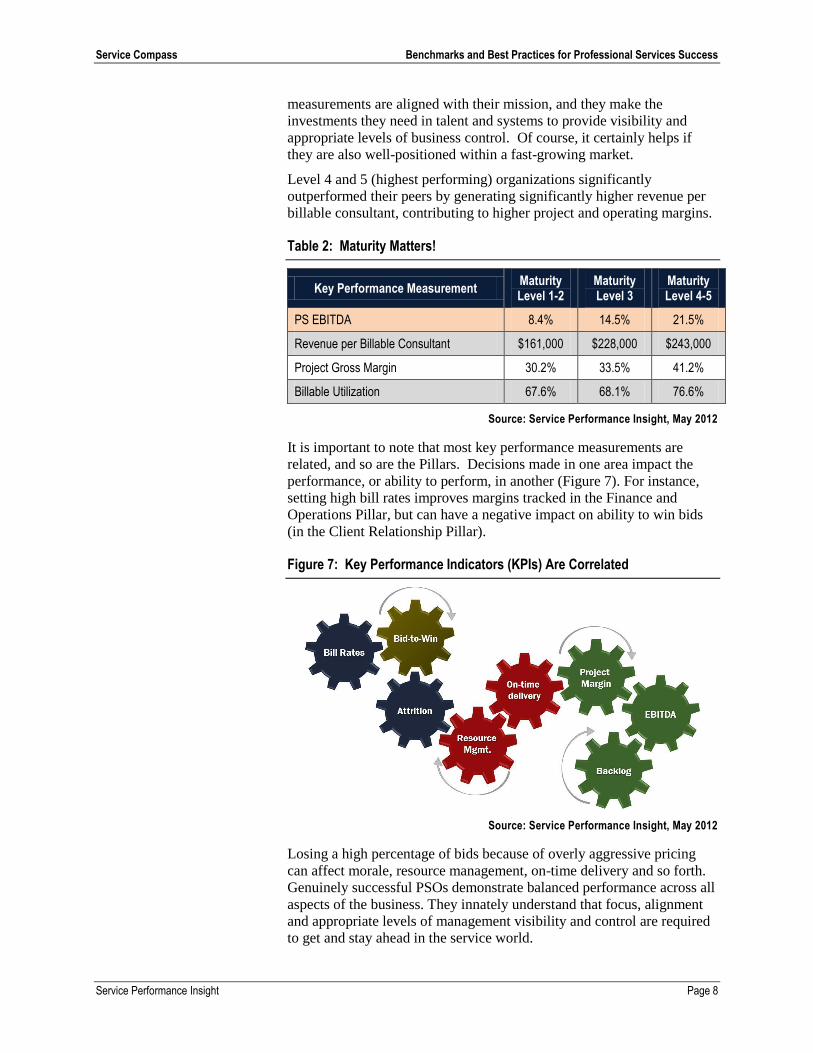
It is important to note that most key performance measurements are
related, and so are the Pillars. Decisions made in one area impact the
performance, or ability to perform, in another (Figure 7). For instance,
setting high bill rates improves margins tracked in the Finance and
Operations Pillar, but can have a negative impact on ability to win bids
(in the Client Relationship Pillar).
Figure 7: Key Performance Indicators (KPIs) Are Correlated
Source: Service Performance Insight, May 2012
Losing a high percentage of bids because of overly aggressive pricing
can affect morale, resource management, on-time delivery and so forth.
Genuinely successful PSOs demonstrate balanced performance across all
aspects of the business. They innately understand that focus, alignment
and appropriate levels of management visibility and control are required
to get and stay ahead in the service world.

Service Compass Benchmarks and Best Practices for Professional Services Success
Service Performance Insight Page 9
SERVICE EXECUTION ANALYSIS
Service execution — the success or failure or project delivery —
measures the quality, efficiency and repeatability of service delivery.
Planning, scheduling, estimating and delivering service engagements are
the primary drivers of successful service delivery. Regardless of the
maturity of every other area of the PSO, a firm will not succeed unless it
can effectively and profitably deliver quality services that provide
customer value.
PSOs with high levels of quality project execution share common traits,
which include:
Resource management: Visibility from prospect to project to
ensure the right resources with the right skills are available when
needed
Structured or standardized service delivery processes: All
employees understand their role and what is expected of them
Solid project management: Visibility into the schedule,
resources, deliverables and risks to ensure projects are delivered
on time and on budget
Accurate and timely project accounting: All financial
information, including time and expense capture and billing are
accurate and timely to ensure revenues and costs are kept in
balance.
Done right, gross project margins over 60% are possible. Done wrong,
project profits can drop to single digits or go negative. In addition to
profitability, service execution is the major determinant of client
satisfaction and references.
Table 3 highlights service execution pillar maturity, as the PSO moves
from basic reactive “all hands on deck” project delivery to greater
efficiency, repeatability and higher quality service execution.
Table 3: Service Execution Pillar Mapped Against Service Maturity
Level 1 Initiated
Level 2 Piloted
Level 3 Deployed
Level 4 Institutionalized
Level 5 Optimized
Se
rvic
e E
xec
uti
on
No scheduling. Reactive. Ad hoc. Heroic. Scheduling by spreadsheet. No consistent project delivery methods. No project quality controls or knowledge management.
Skeleton methodology in place. Centralized resource management. Initiating project management and technical skills. Starting to measure project satisfaction and harvest knowledge.
PSA deployed for resource and project management. Collaborative portal. Earned Value Analysis. Project dashboard. Global Project Management Office, project quality reviews and measurements. Effective change management.
Integrated project and resource management. Effective scheduling. Using portfolio management. Global PMO. Global project dashboard. Global knowledge management. Global resource management.
Integrated solutions. Continual checks and balances to assure superior utilization and bill rates. Complete visibility to global project quality. Multi-disciplinary resource management.
Source: Service Performance Insight, May 2012

Service Compass Benchmarks and Best Practices for Professional Services Success
Service Performance Insight Page 10
Leading PSOs have developed new talent strategies based on a
distributed global workforce, which reduces overhead costs in terms of
office space and travel, and allows them to hire the best, most cost
effective talent regardless of physical location. The work itself is
shifting towards a greater emphasis on vertical industry and business
process knowledge and less dependence on deep technical skills
As professional service organizations improve their service execution
maturity, overall productivity and profitability increase. Figure 8
highlights increases in service performance. PSOs are more effective in
their resource management processes, meaning they have greater success
in efficiently staffing individuals on projects with the right skills and the
right availability. As one might expect, these improvements increase the
number of annual billable hours, which ultimately impacts revenue and
profitability.
Figure 8: Service Execution Maturity Matters
Source: Service Performance Insight, May 2012
The figure also shows organizations reaching the highest level of service
execution maturity also deliver over 90% of their projects on time, which
leads to higher revenue growth rates and higher levels of client
satisfaction, which drive increased references and sales going forward.
Improvements in service execution also show up in higher profit levels.
Figure 8 shows this to be true as firms operating at the lowest service
execution levels yield an average of 8.6% profit (which would be great in
manufacturing but not in services), whereas those executing at the
highest levels show profitability in excess of 26%.
SPI Research has found a direct correlation between the use of a
Professional Services Automation (PSA) tool and better results across
many service KPIs. Although at Level 5 maturity there was a decrease in
the use of PSA, this decrease was due to a small sample size. Had the
sample size been larger, SPI Research believes this figure would have
been over 80%.
Service Compass Benchmarks and Best Practices for Professional Services Success
Service Performance Insight Page 11
PSA IS AT THE HEART OF SERVICE EXECUTION
Professional Services Automation (PSA) solutions facilitate initiation,
planning, execution, and control of projects and resource management.
PSA helps manage service delivery forecasting, resource management,
project management and collaboration, combined with accurate and
timely time and expense capture. PSA has become increasingly popular
as the need to improve the management and control of service execution
has become more important, and the applications have matured to
become easy to implement and use. SPI Research believes that PSOs
with over 10 employees should consider using PSA. Creating and
maintaining a complex set of spreadsheets is no longer a viable
alternative for even the smallest PSOs. Surprisingly, 37% of respondents
reported using none (14%), other (14%) or homegrown (9%) as their
PSA solution.
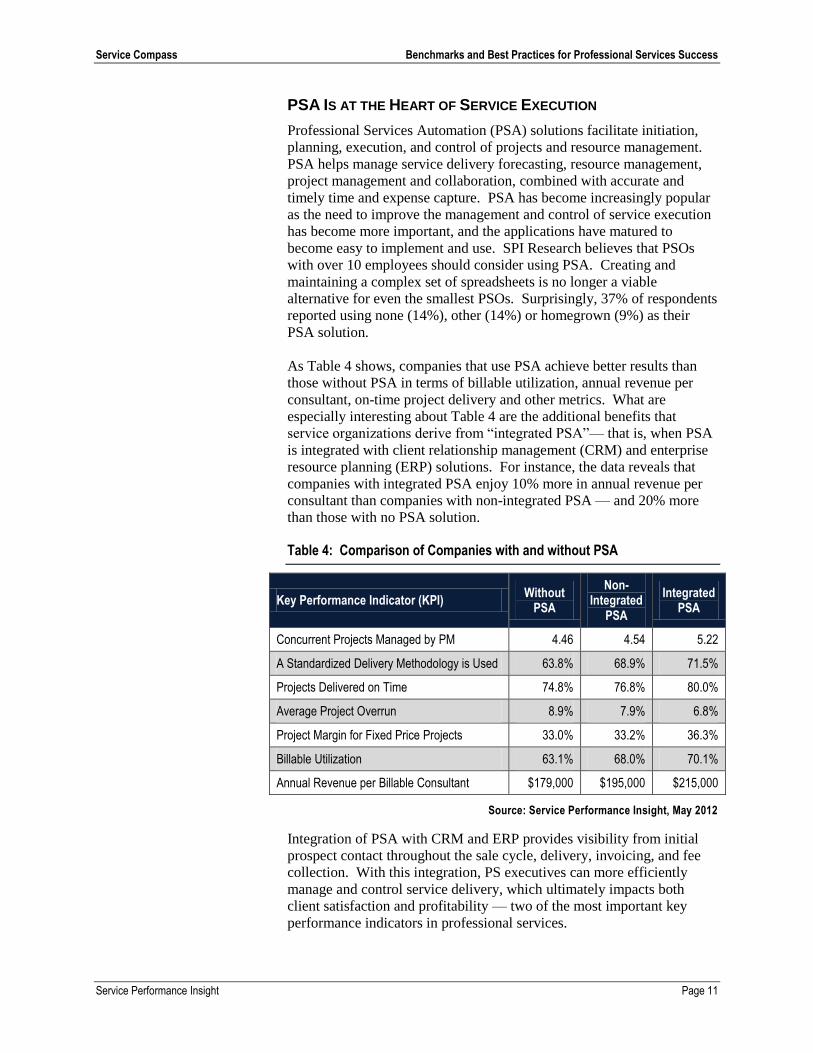
As Table 4 shows, companies that use PSA achieve better results than
those without PSA in terms of billable utilization, annual revenue per
consultant, on-time project delivery and other metrics. What are
especially interesting about Table 4 are the additional benefits that
service organizations derive from “integrated PSA”— that is, when PSA
is integrated with client relationship management (CRM) and enterprise
resource planning (ERP) solutions. For instance, the data reveals that
companies with integrated PSA enjoy 10% more in annual revenue per
consultant than companies with non-integrated PSA — and 20% more
than those with no PSA solution.
Table 4: Comparison of Companies with and without PSA
Key Performance Indicator (KPI) Without
PSA
Non- Integrated
PSA
Integrated PSA
Concurrent Projects Managed by PM 4.46 4.54 5.22
A Standardized Delivery Methodology is Used 63.8% 68.9% 71.5%
Projects Delivered on Time 74.8% 76.8% 80.0%
Average Project Overrun 8.9% 7.9% 6.8%
Project Margin for Fixed Price Projects 33.0% 33.2% 36.3%
Billable Utilization 63.1% 68.0% 70.1%
Annual Revenue per Billable Consultant $179,000 $195,000 $215,000
Source: Service Performance Insight, May 2012
Integration of PSA with CRM and ERP provides visibility from initial
prospect contact throughout the sale cycle, delivery, invoicing, and fee
collection. With this integration, PS executives can more efficiently
manage and control service delivery, which ultimately impacts both
client satisfaction and profitability — two of the most important key
performance indicators in professional services.

Service Compass Benchmarks and Best Practices for Professional Services Success
Service Performance Insight Page 12
BEST PRACTICES TO IMPROVE SERVICE EXECUTION
The following sections highlight some of the best practices PSOs should
consider when looking to improve service execution and ultimately
organizational performance and profitability.
Integrate Information Systems
The 2012 Benchmark showed that a majority of PSOs have implemented
ERP, CRM and PSA solutions. Each provides enhanced visibility and
management control for the department implementing it. Unfortunately,
many PSOs have not integrated these solutions, meaning visibility is
limited to the department using the solution. For example, if CRM data
is not integrated with the PSA solution, the service delivery organization
lacks visibility into the sales pipeline and the number, type, and scope of
requests likely to reach their organization soon.
Without integration, email and word-of-mouth are the ways information
is shared, but this communication does not typically reach all critical
personnel. With integrated solutions across the PSO, all relevant
personnel are alerted and can undertake their responsibilities in ensuring
success. With pipeline visibility, in particular, services management can
estimate and plan ahead for resource needs by type.
Financial integration, gained by integrating PSA and ERP information,
also has many benefits including:
Greater accuracy and less time invoicing and billing due to more
comprehensive capturing of time and expenses and a single point
of data entry.
Improved revenue forecasting.
Faster revenue collection due to an easier ability to generate bills
as project milestones, % project completion or month end is
reached and an easier ability to substantiate charges to
customers.
Integrated solutions add up to increased real-time information. Real-time
information visibility is also one of the most important KPIs in our
research. SPI Research asked PS executives whether their executives
have real-time visibility into all business activities (sales, service,
marketing, finance, etc.). The results show less than 50% of executives
believe they have real-time visibility into their organizations’ operations.
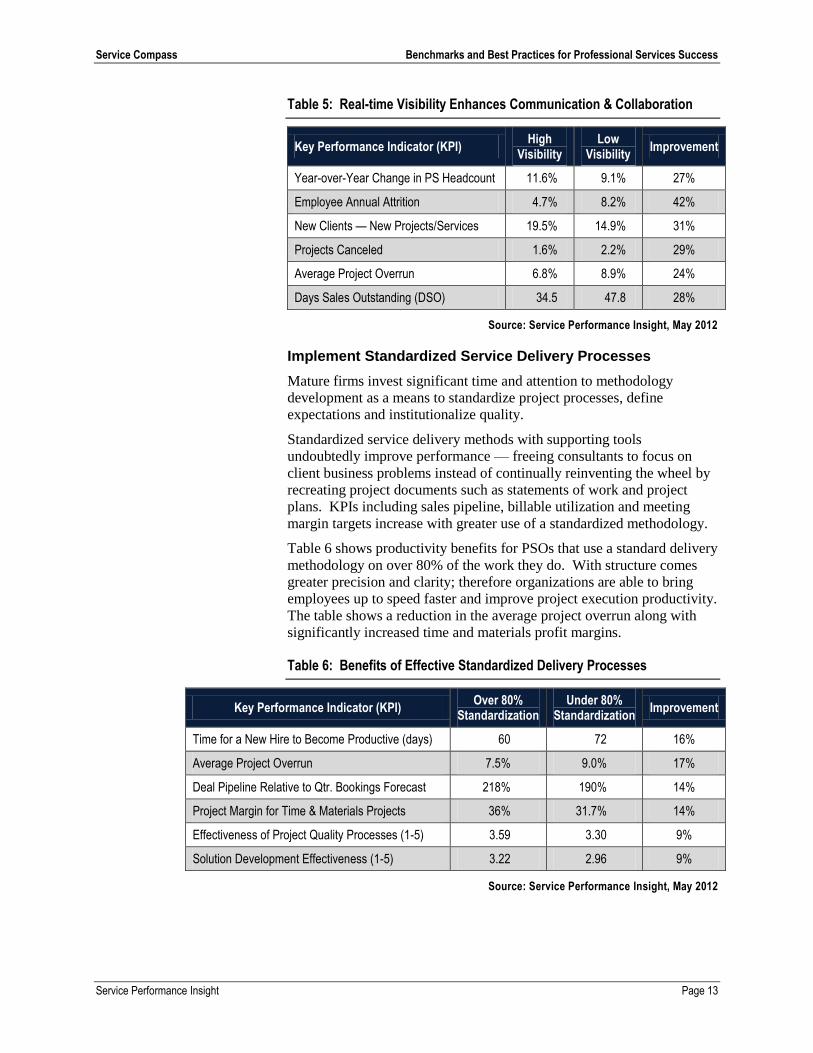
Table 5 shows that executives who believe they have real-time visibility
run companies that are much more effective than those that are not.
However, only about 10% of the organizations surveyed said they had
high levels of real-time visibility.
These results are particularly important during the project delivery phase,
as more work is completed on time with higher billable utilization rates
and much higher margins. It also doesn’t hurt that these companies are
growing much faster. Real-time visibility is one of the most important
criteria to justify expenditures in IT. Without real-time visibility,
organizations cannot monitor, measure and control the business.
Service Compass Benchmarks and Best Practices for Professional Services Success
Service Performance Insight Page 13
Table 5: Real-time Visibility Enhances Communication & Collaboration
Key Performance Indicator (KPI) High
Visibility Low
Visibility Improvement
Year-over-Year Change in PS Headcount 11.6% 9.1% 27%
Employee Annual Attrition 4.7% 8.2% 42%
New Clients — New Projects/Services 19.5% 14.9% 31%
Projects Canceled 1.6% 2.2% 29%
Average Project Overrun 6.8% 8.9% 24%
Days Sales Outstanding (DSO) 34.5 47.8 28%
Source: Service Performance Insight, May 2012
Implement Standardized Service Delivery Processes
Mature firms invest significant time and attention to methodology
development as a means to standardize project processes, define
expectations and institutionalize quality.
Standardized service delivery methods with supporting tools
undoubtedly improve performance — freeing consultants to focus on
client business problems instead of continually reinventing the wheel by
recreating project documents such as statements of work and project
plans. KPIs including sales pipeline, billable utilization and meeting
margin targets increase with greater use of a standardized methodology.
Table 6 shows productivity benefits for PSOs that use a standard delivery
methodology on over 80% of the work they do. With structure comes
greater precision and clarity; therefore organizations are able to bring
employees up to speed faster and improve project execution productivity.
The table shows a reduction in the average project overrun along with
significantly increased time and materials profit margins.
Table 6: Benefits of Effective Standardized Delivery Processes
Key Performance Indicator (KPI) Over 80%
Standardization Under 80%
Standardization Improvement
Time for a New Hire to Become Productive (days) 60 72 16%
Average Project Overrun 7.5% 9.0% 17%
Deal Pipeline Relative to Qtr. Bookings Forecast 218% 190% 14%
Project Margin for Time & Materials Projects 36% 31.7% 14%
Effectiveness of Project Quality Processes (1-5) 3.59 3.30 9%
Solution Development Effectiveness (1-5) 3.22 2.96 9%
Source: Service Performance Insight, May 2012

Service Compass Benchmarks and Best Practices for Professional Services Success
Service Performance Insight Page 14
Improve Resource Management
Survey respondents rated the effectiveness of their resource management
process on a 1-5 scale, where 5 represented extremely effective resource
management processes. Although subjective, this key performance
indicator is an important measurement of how the organization views its
resource management processes. Table 7 shows the effect of resource
management on other key performance metrics.
Table 7: Benefits of Effective Resource Management
Key Performance Indicator (KPI) Highly
Effective
Not Highly
Effective Improvement
Year-over-Year Change in PS Revenue 20.7% 12.8% 62%
Revenue per Employee $250,000 $184,000 36%
Project Margin for Fixed Price Projects 43.2% 32.2% 34%
Average Project Overrun 5.9% 8.6% 31%
Employee Utilization 72.8% 69.0% 6%
EBITDA 18.7% 12.9% 45%
Source: Service Performance Insight, May 2012
Effective resource management translates to greater year over year
revenue growth; higher revenue per employee; better project margins;
fewer project overruns; higher billable utilization and significantly better
overall net margin or EBITDA. Highly effective resource management
permeates throughout the entire project lifecycle and leads to satisfied
clients and happier employees. Having the right person with the right
skills on the right job at the right time is the essence of effective resource
management.
Drive Utilization Higher
In many professional service organizations, (employee) billable
utilization is one of the most closely monitored key performance
indicators. Although every organization measures this metric differently,
at the end of the day this is a classic workforce productivity
measurement. For simplicity, SPI Research uses annual billable hours
divided by 2,000 annual work hours.
Approximately 20% of PSOs surveyed had utilization levels above 80%
annually (1,600 hours). Table 8 highlights several important KPIs as
utilization rises above 80% (or 1,600 billable hours annually). In almost
every one of these critical metrics there is more than a 20% improvement
in productivity, cost reduction, growth and profitability as organizations
manage their resources effectively.

Service Compass Benchmarks and Best Practices for Professional Services Success
Service Performance Insight Page 15
Table 8: Benefits of High Employee Utilization
Key Performance Indicator (KPI) Over 80% Utilization
Under 80%
Utilization Improvement
Year-over-Year Change in PS Revenue 17.2% 13.0% 32%
Projects Delivered on Time 84.7% 74.6% 14%
Average Project Overrun 5.6% 9.2% 39%
Project Margin for Fixed Price Projects 38.6% 31.6% 22%
Annual Revenue per Billable Consultant $227,000 $190,000 20%
EBITDA % 18.1% 12.6% 44%
Source: Service Performance Insight, May 2012
Deliver Projects on Time
The percentage of projects delivered on time is a measurement that
divides the number of projects completed on-time by the total number of
projects. This KPI is critical for billable service organizations, because
when it decreases, both profitability and client satisfaction suffer.
Unfortunately, on-time project delivery rates tend to be less than 80% on
average for PSOs. In the 2012 benchmark, SPI Research found only
20% of the firms surveyed delivered projects on time over 90% of the
time. However, on-time project completion rates have vastly improved
from 10 years ago when less than 20% of projects were delivered on-
time.
In many instances projects are late due to client changes or lack of scope
control. Regardless of the reason, when projects are delivered late,
subsequent projects cannot be initiated on-time and therefore the
organization loses out on additional revenue, and must go back to other
clients to disclose the bad news that their work cannot be started on time
or may hire external supplemental resources, frequently at a higher cost.
Table 9 provides insight into some of the more notable KPIs, and how
important on-time delivery is to organizational performance. While
profitability is always an important metric, the table highlights client
references directly increase with on-time delivery. Referenceable clients
are the fuel for growth, as reputation is a critical business development
factor.
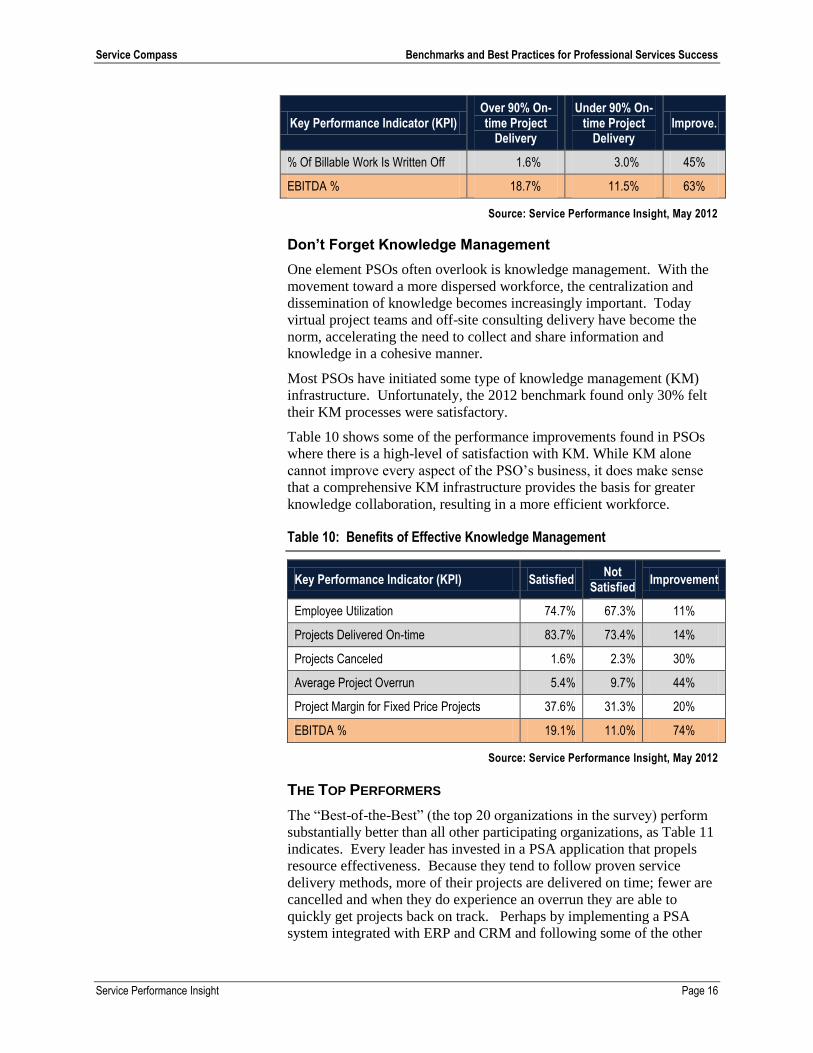
Table 9: Benefits of On-time Service Delivery
Key Performance Indicator (KPI) Over 90% On-time Project
Delivery
Under 90% On-time Project
Delivery Improve.
Projects Canceled 1.7% 2.2% 20%
% of "Referenceable" Clients 80.5% 68.1% 18%
Annual Revenue per Employee $188,000 $161,000 17%
Service Compass Benchmarks and Best Practices for Professional Services Success
Service Performance Insight Page 16
Key Performance Indicator (KPI) Over 90% On-time Project
Delivery
Under 90% On-time Project
Delivery Improve.
% Of Billable Work Is Written Off 1.6% 3.0% 45%
EBITDA % 18.7% 11.5% 63%
Source: Service Performance Insight, May 2012
Don’t Forget Knowledge Management
One element PSOs often overlook is knowledge management. With the
movement toward a more dispersed workforce, the centralization and
dissemination of knowledge becomes increasingly important. Today
virtual project teams and off-site consulting delivery have become the
norm, accelerating the need to collect and share information and
knowledge in a cohesive manner.
Most PSOs have initiated some type of knowledge management (KM)
infrastructure. Unfortunately, the 2012 benchmark found only 30% felt
their KM processes were satisfactory.
Table 10 shows some of the performance improvements found in PSOs
where there is a high-level of satisfaction with KM. While KM alone
cannot improve every aspect of the PSO’s business, it does make sense
that a comprehensive KM infrastructure provides the basis for greater
knowledge collaboration, resulting in a more efficient workforce.
Table 10: Benefits of Effective Knowledge Management
Key Performance Indicator (KPI) Satisfied Not
Satisfied Improvement
Employee Utilization 74.7% 67.3% 11%
Projects Delivered On-time 83.7% 73.4% 14%
Projects Canceled 1.6% 2.3% 30%
Average Project Overrun 5.4% 9.7% 44%
Project Margin for Fixed Price Projects 37.6% 31.3% 20%
EBITDA % 19.1% 11.0% 74%
Source: Service Performance Insight, May 2012
THE TOP PERFORMERS
The “Best-of-the-Best” (the top 20 organizations in the survey) perform
substantially better than all other participating organizations, as Table 11
indicates. Every leader has invested in a PSA application that propels
resource effectiveness. Because they tend to follow proven service
delivery methods, more of their projects are delivered on time; fewer are
cancelled and when they do experience an overrun they are able to
quickly get projects back on track. Perhaps by implementing a PSA
system integrated with ERP and CRM and following some of the other

Service Compass Benchmarks and Best Practices for Professional Services Success
Service Performance Insight Page 17
best practice tips, you can improve your organization’s performance
before the 2013 benchmark.
Table 11: Best-of-the-Best – Service Execution Pillar KPIs
Key Performance Indicator (KPI) Leaders Rest ▲
Effectiveness of Resource Mgmt. Process 4.3 3.38 27%
Average Project Duration (Months) 6.08 5.07 20%
Projects Delivered On-time 90% 75% 20%
A Standardized Delivery Methodology is used 77% 65.5% 18%
Concurrent Projects Managed by PM 4.63 4.13 12%
Average Project Staff (People) 3.68 3.99 -8%
Average Project Staffing Time (In Days) 11.3 12.8 -11%
Projects Canceled 1.5% 2.1% -30%
Average Project Overrun 5.9% 8.6% -32%
Source: Service Performance Insight, May 2012
RECOMMENDATIONS & CONCLUSIONS
The economy is changing and the professional services market must
change with it. Increased global demands, new technologies and a more
demanding workforce are just the tip of the iceberg. Professional
services executives must evaluate, improve and optimize performance
across all five service performance pillars, in other words, across their
entire organization.
With an expansion of the service portfolio and more demanding clients,
PSOs must execute services more efficiently than ever before. Increased
global competition mandates the need for better performance. With the
rapid growth in the demand for professional services over the past two
years it is imperative PS executives focus on the delivery of services, or
as SPI Research would term it, the Service Execution Pillar.
The top performers in SPI Research’s most recent benchmark all utilize
PSA solutions to achieve better results. PSA solutions provide the
necessary visibility, tools and intelligence to enable PSOs to operate
more efficiently, and integration of PSA with both CRM and ERP
solutions results in even greater overall performance as multiple
functions work better together, employees are better able to plan ahead,
and workflow efficiencies are possible.
Service Compass Benchmarks and Best Practices for Professional Services Success
Service Performance Insight (SPI Research) is a global research, consulting and training organization dedicated to helping professional service organizations (PSOs) make quantum improvements in productivity and profit. In 2007, SPI developed the PS Maturity Model™ as a strategic planning and management framework. It is now the industry-leading performance improvement tool used by over 5,000 service and project-oriented organizations to chart their course to service excellence.
SPI provides a unique depth of operating experience combined with unsurpassed analytic capability. We not only diagnose areas for improvement but also provide the business value of change. We then work collaboratively with our clients to create new management processes to transform and ignite performance. Visit www.SPIresearch.com for more information on Service Performance Insight, LLC.
© 2012 Service Performance Insight Page 18
About Service Performance Insight
Jeanne Urich, Service Performance Insight Managing Director, is a renowned author, speaker and thought leader focused on the global service economy. She is a trusted advisor and transformative and operational change consultant to senior executives of leading services organizations, helping them navigate the journey from business-as-usual to business-as-exceptional.
Prior to co-founding Service Performance Insight she was a corporate officer and leader of the worldwide service organizations of Vignette, Blue Martini and Clarify, responsible for leading the growth of their professional services, education, account management and alliances organizations.
She is the co-author of the ground breaking Professional Service Maturity Model™ benchmark used by over 5,000 project-oriented organizations to diagnose and improve their performance. She is a featured speaker and author for major software solution providers and industry associations.
She has a Bachelor’s Degree (Magna Cum Laude and Phi Beta Kappa) in Math and Computer Science from Vanderbilt University. She is a contributing author of Tips from the Trenches: the Collective Wisdom of over 100 Professional Service Leaders. Contact Jeanne at [email protected] Phone (650) 342-4690.
R. David Hofferberth, PE, Service Performance Insight Managing Director, has over 25 years’ experience in information technology (IT) serving as an industry analyst, product director and consultant. Hofferberth’s research is focused on the services economy, and in particular, on white-collar productivity issues and the technologies that help people perform at their highest capacity.
Hofferberth’s background is extensive in services performance beginning in the early 1980s, where he conducted studies on white-collar productivity in the banking, technology, energy and construction sectors. In 1999 he introduced to the market the solution area now known as Professional Services Automation (PSA), when he published the seminal report: Professional Services Automation: Increasing Efficiencies and Profitability in Professional Services Organizations.
Prior to founding Service Performance Insight he was a Senior Director at Oracle and Aberdeen Group. Hofferberth earned an MBA from Duke University and a BS in Industrial Engineering from the University of Tennessee. He is also a licensed Professional Engineer (PE). Contact Dave at [email protected] Phone: (513) 759-5443.